Conductive Carbon Materials from the Hydrothermal Carbonization of Vineyard Residues for the Application in Electrochemical Double-Layer Capacitors (EDLCs) and Direct Carbon Fuel Cells (DCFCs)

 , , ,
, , ,  and
and 
Abstract
1. Introduction
- submicron size carbon particles
- crystallographic structure of the carbon lattice
- electric conductivity (EC)
- high specific surface area (SSA)
- no or low content of impurities (e.g., inorganic matter)/high C content
2. Materials and Methods
2.1. Materials
2.2. Methods
2.2.1. Thermochemical conversion
2.2.2. Analysis
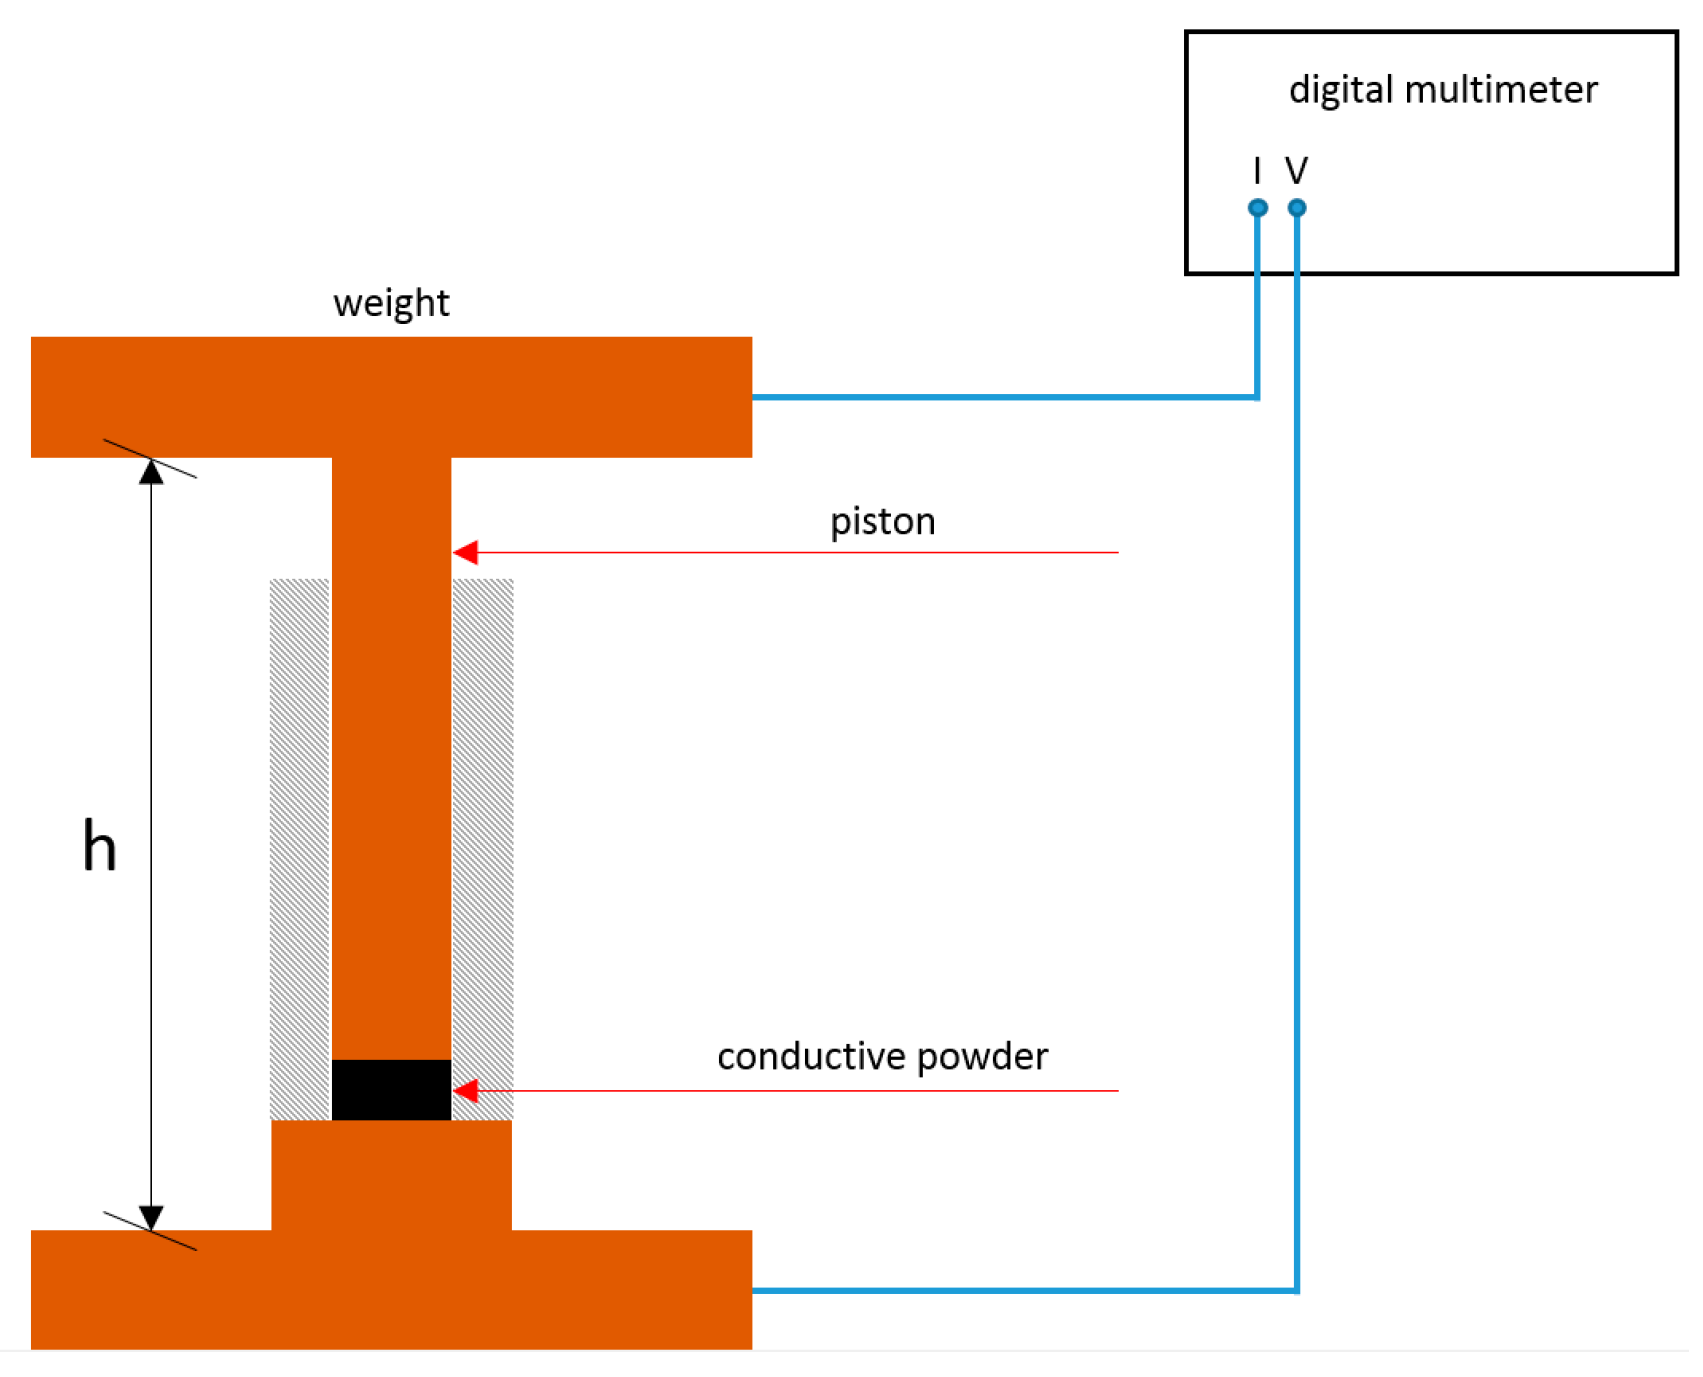
- Pressure in Pa.
- Weight load in N.
- Mass of added weight in kg.
- Local earth acceleration of 9.81 m s−2.
- Piston ground area of 7.9 × 10⁻⁵ m2.
- Bulk density in kg m−2.
- Mass of sample in kg.
- Piston ground area of 7.9 × 10⁻⁵ m2.
- Height of sample in the cylinder.
- Conductivity in S.
- Height of sample in the cylinder in m.
- Piston ground area of 7.9 × 10⁻⁵ m2.
- Ohmic resistance in Ω.
- Compression ratio.
- Volume at applied pressure 1 (blank weight) in m3.
- Volume at applied pressure 2 (weight 2) in m3.
3. Results
3.1. Thermochemical Conversion
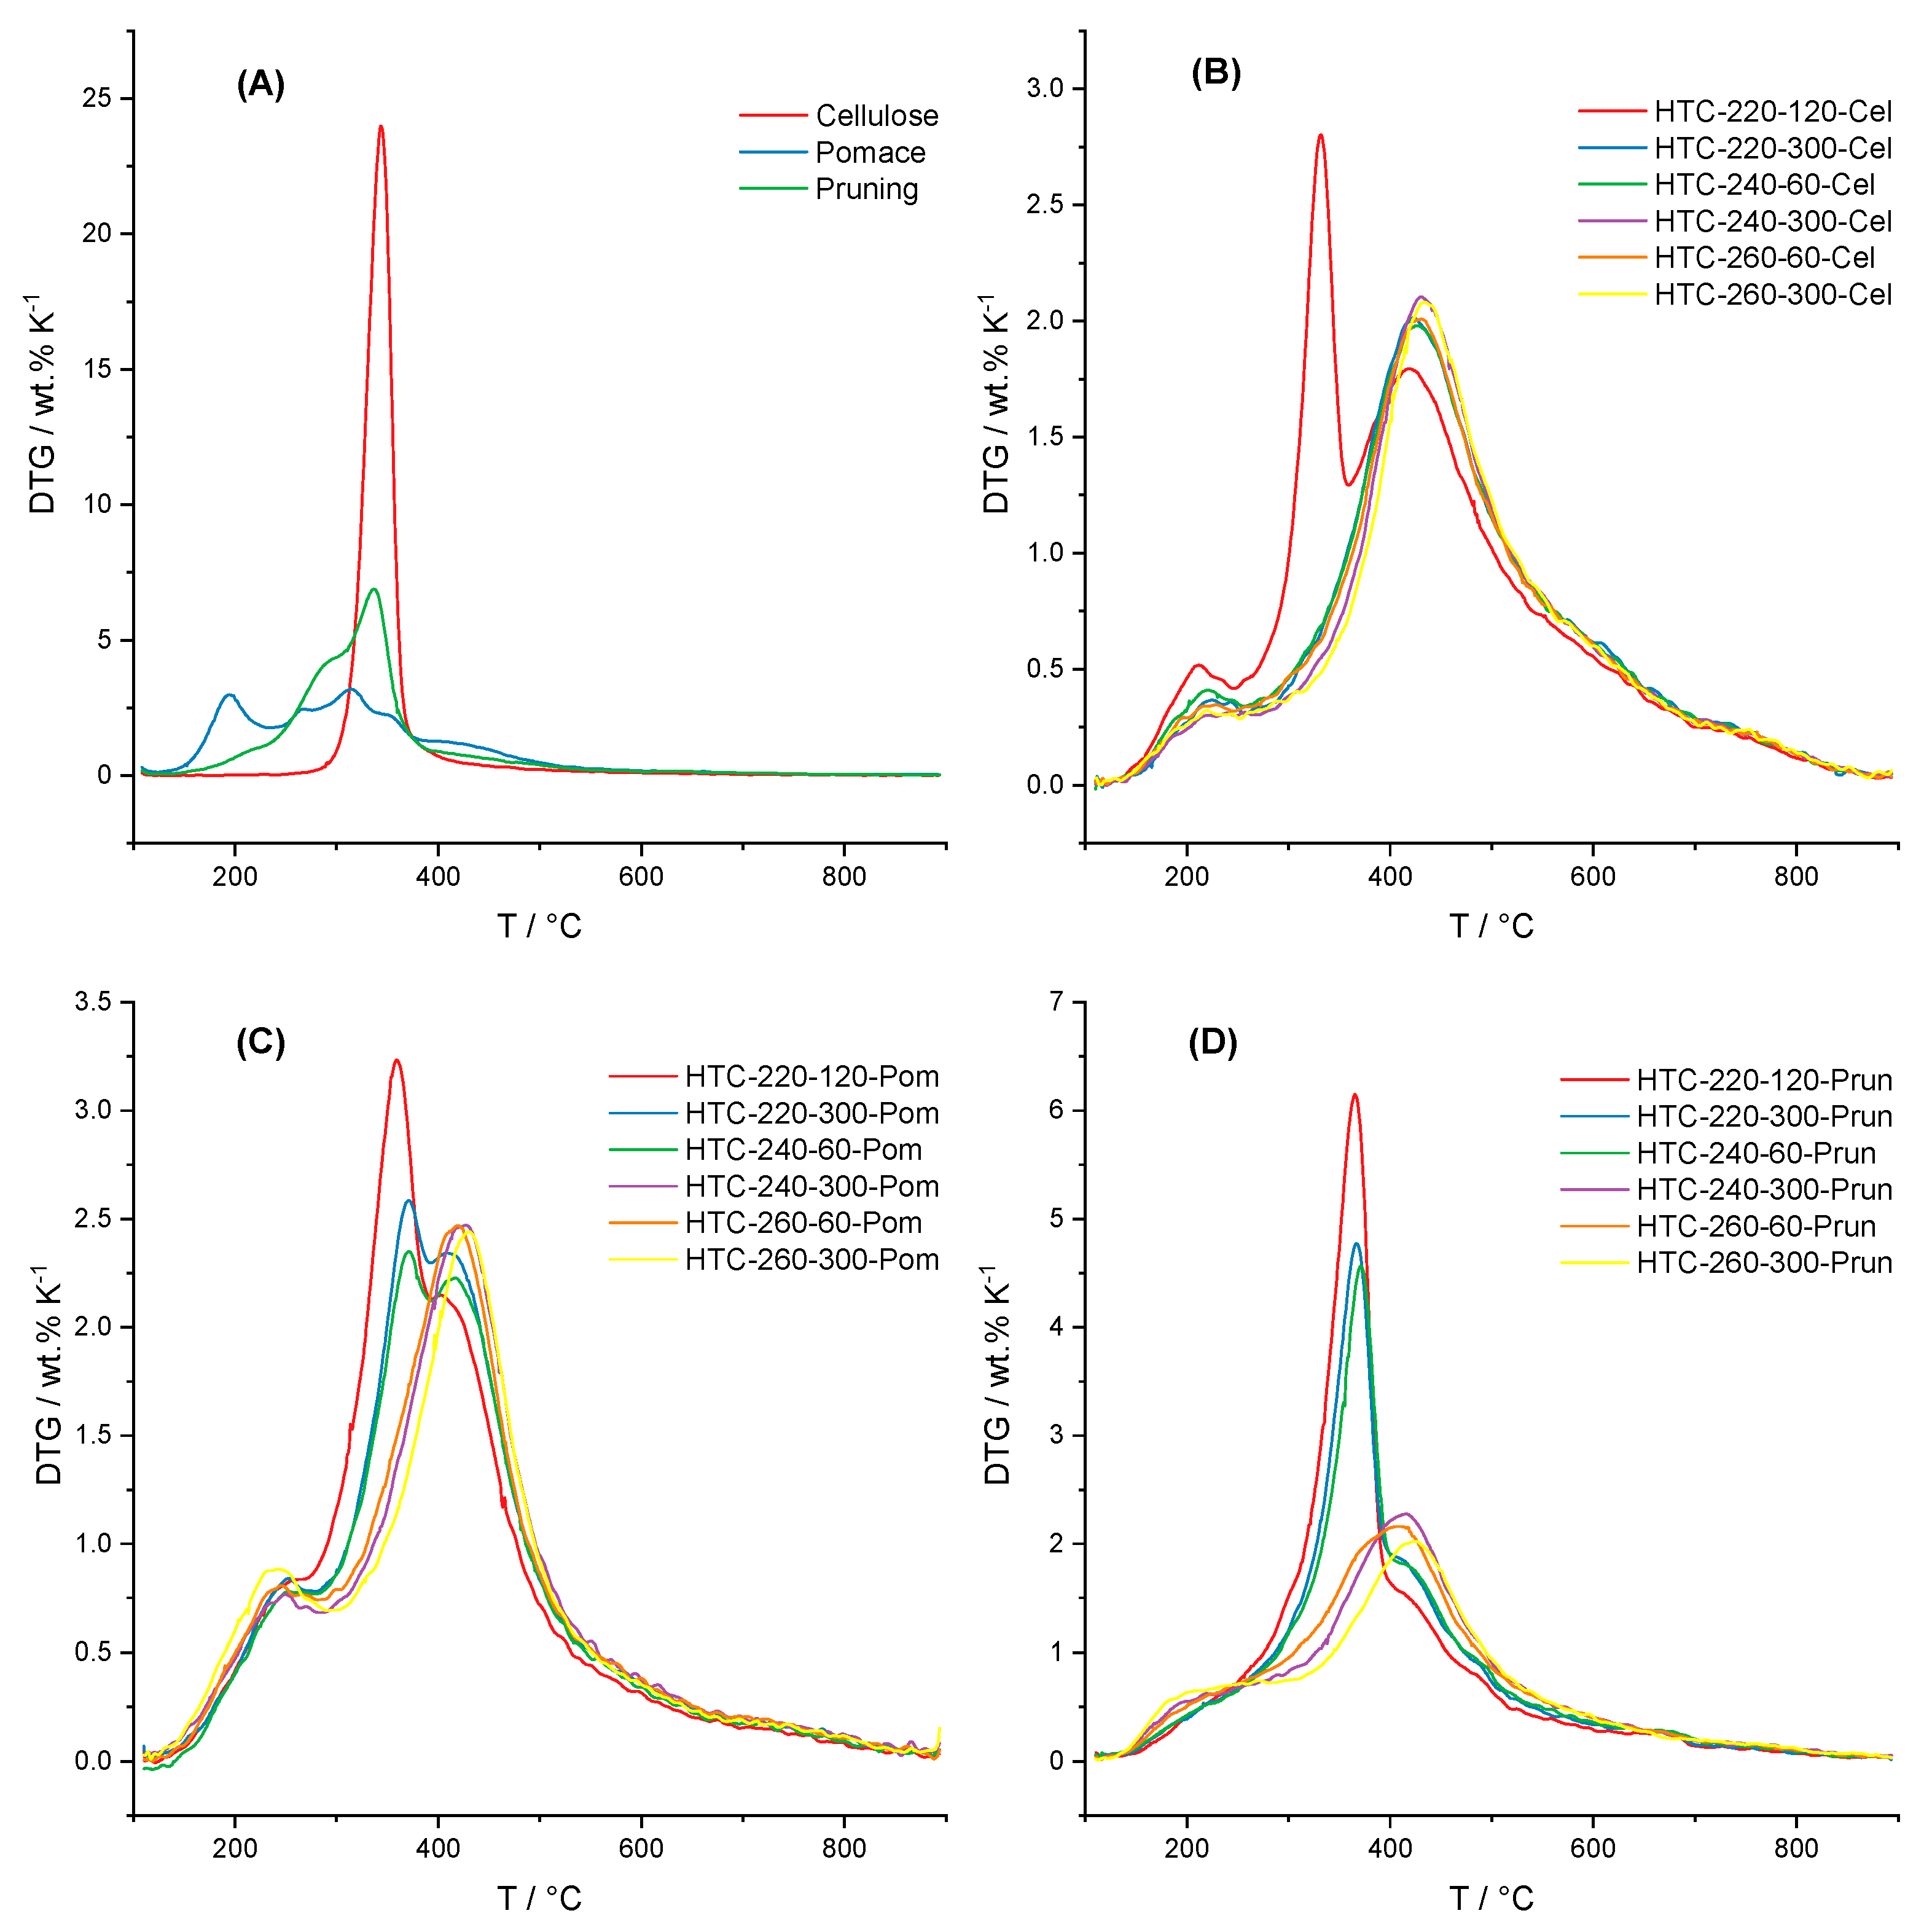
3.2. Thermal Decomposition Behavior
3.3. Physico-Chemical Properties
3.3.1. Bulk Density (ρ)
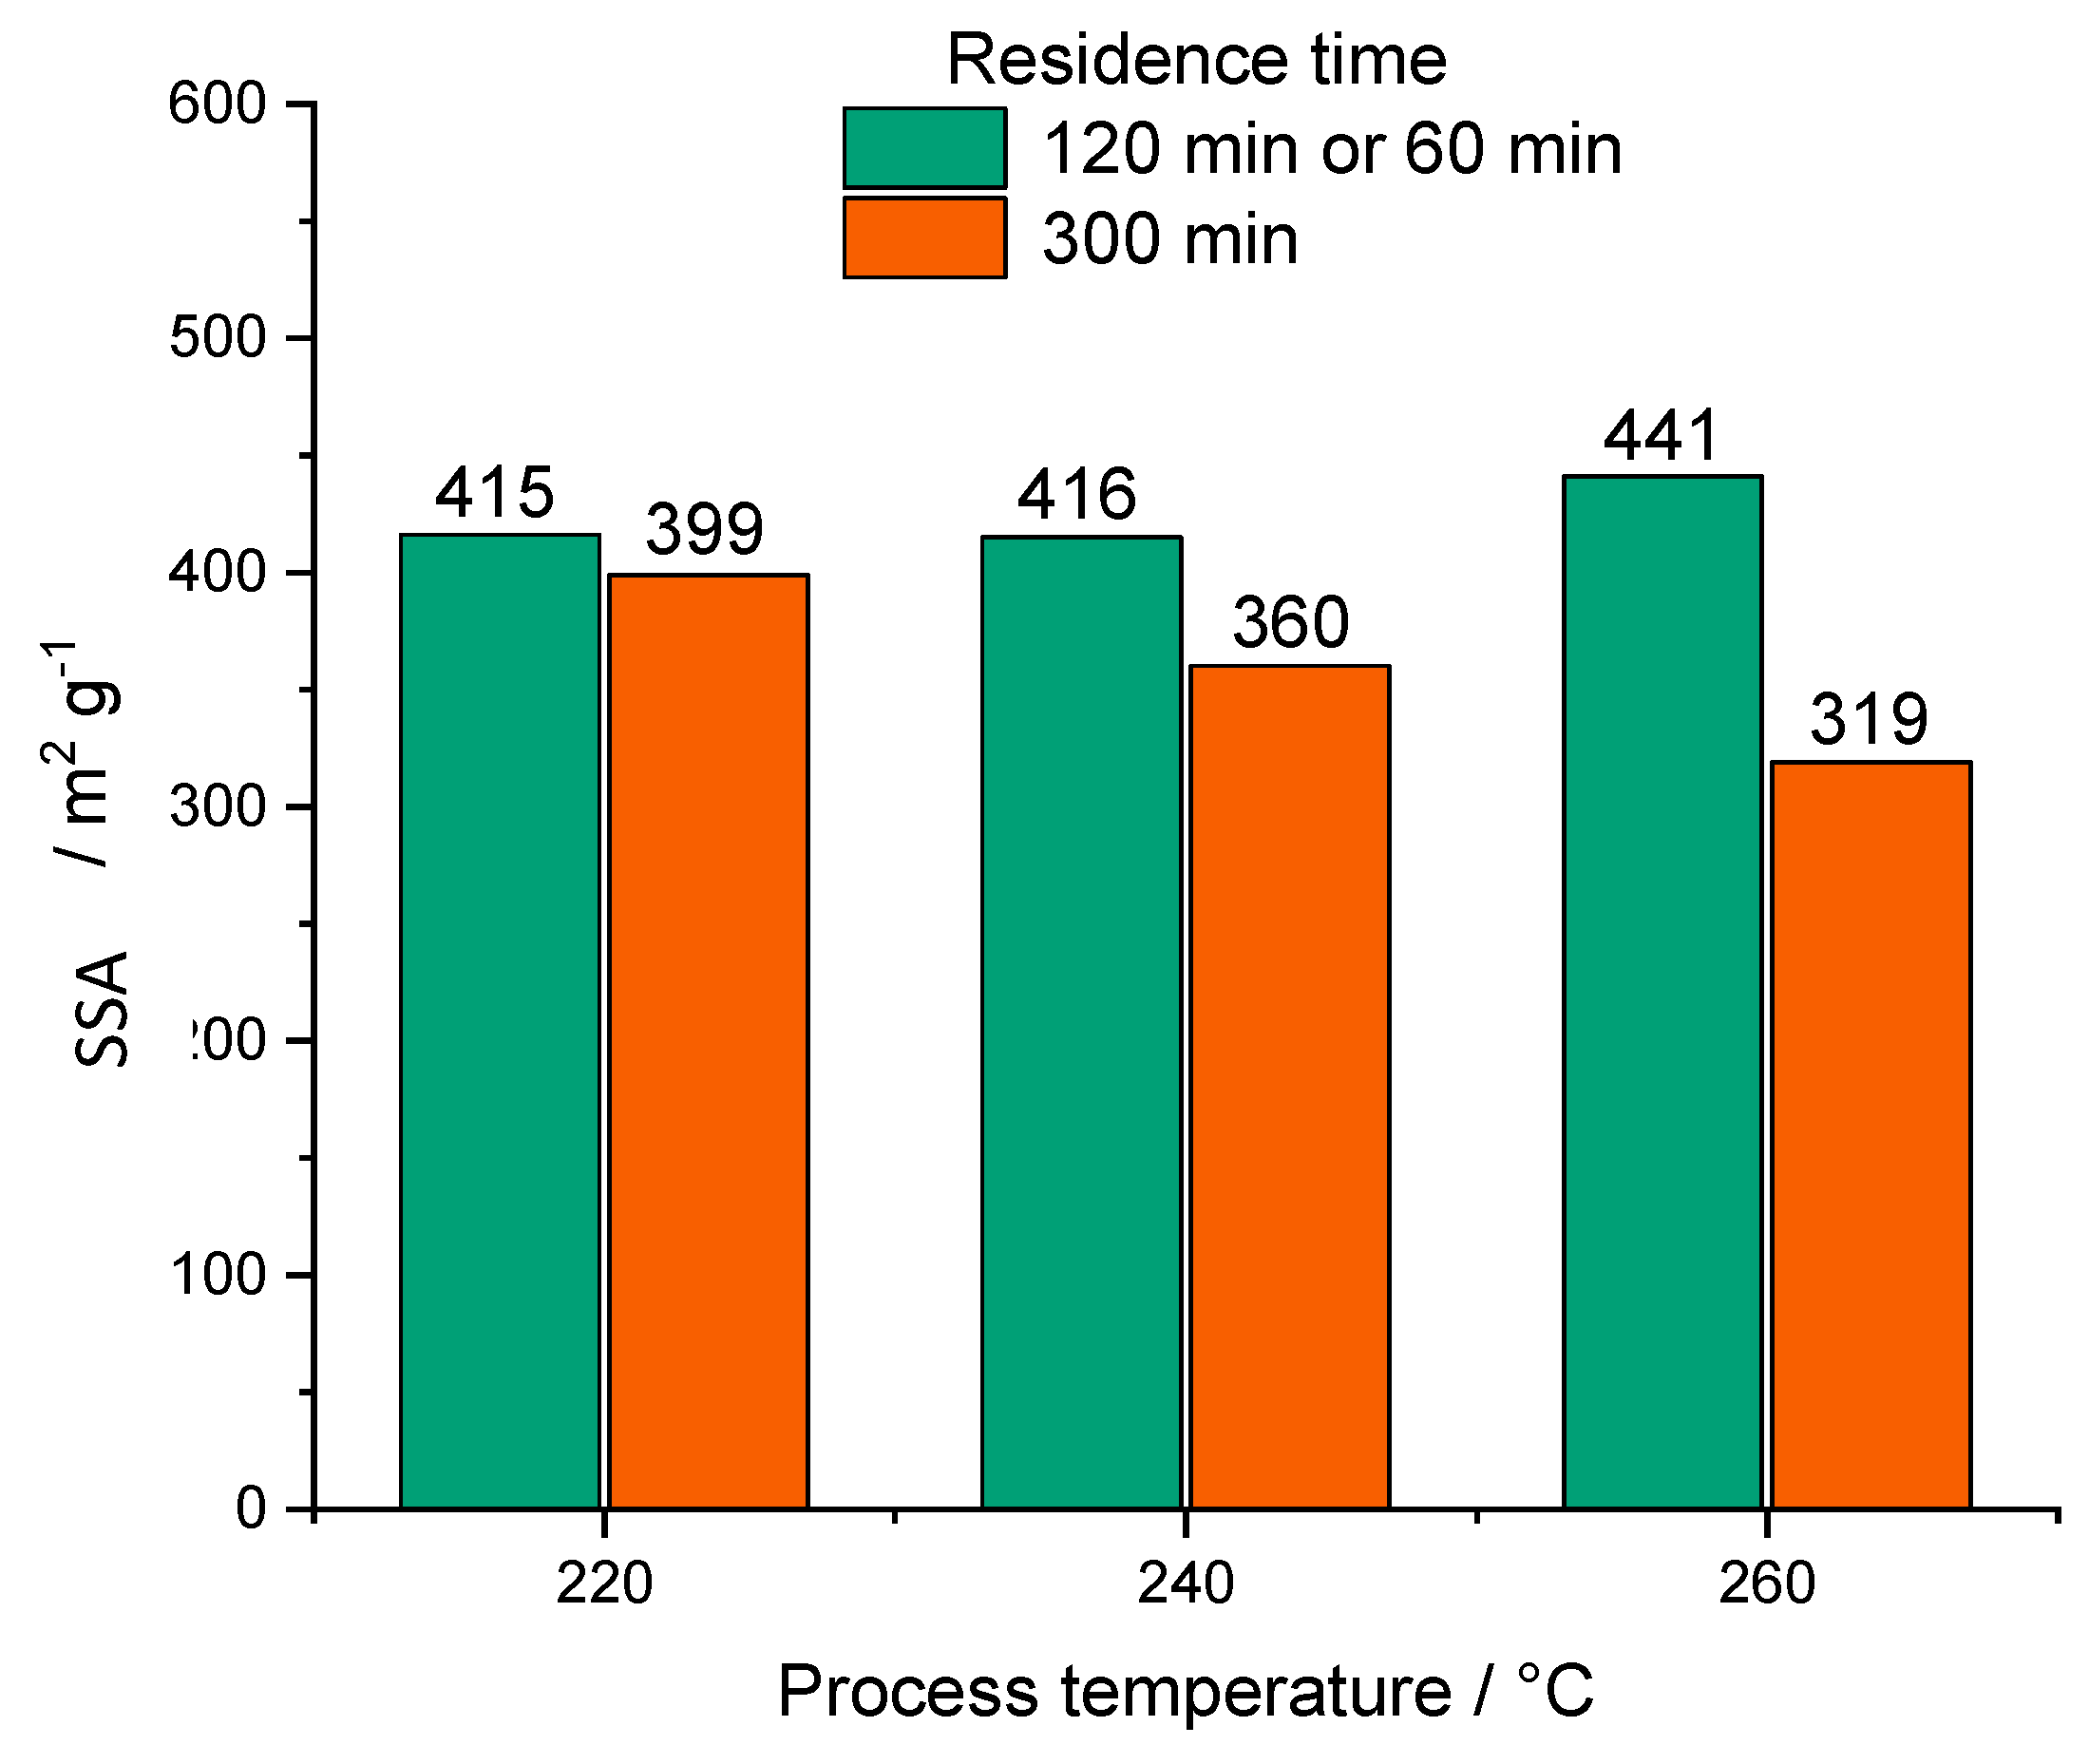
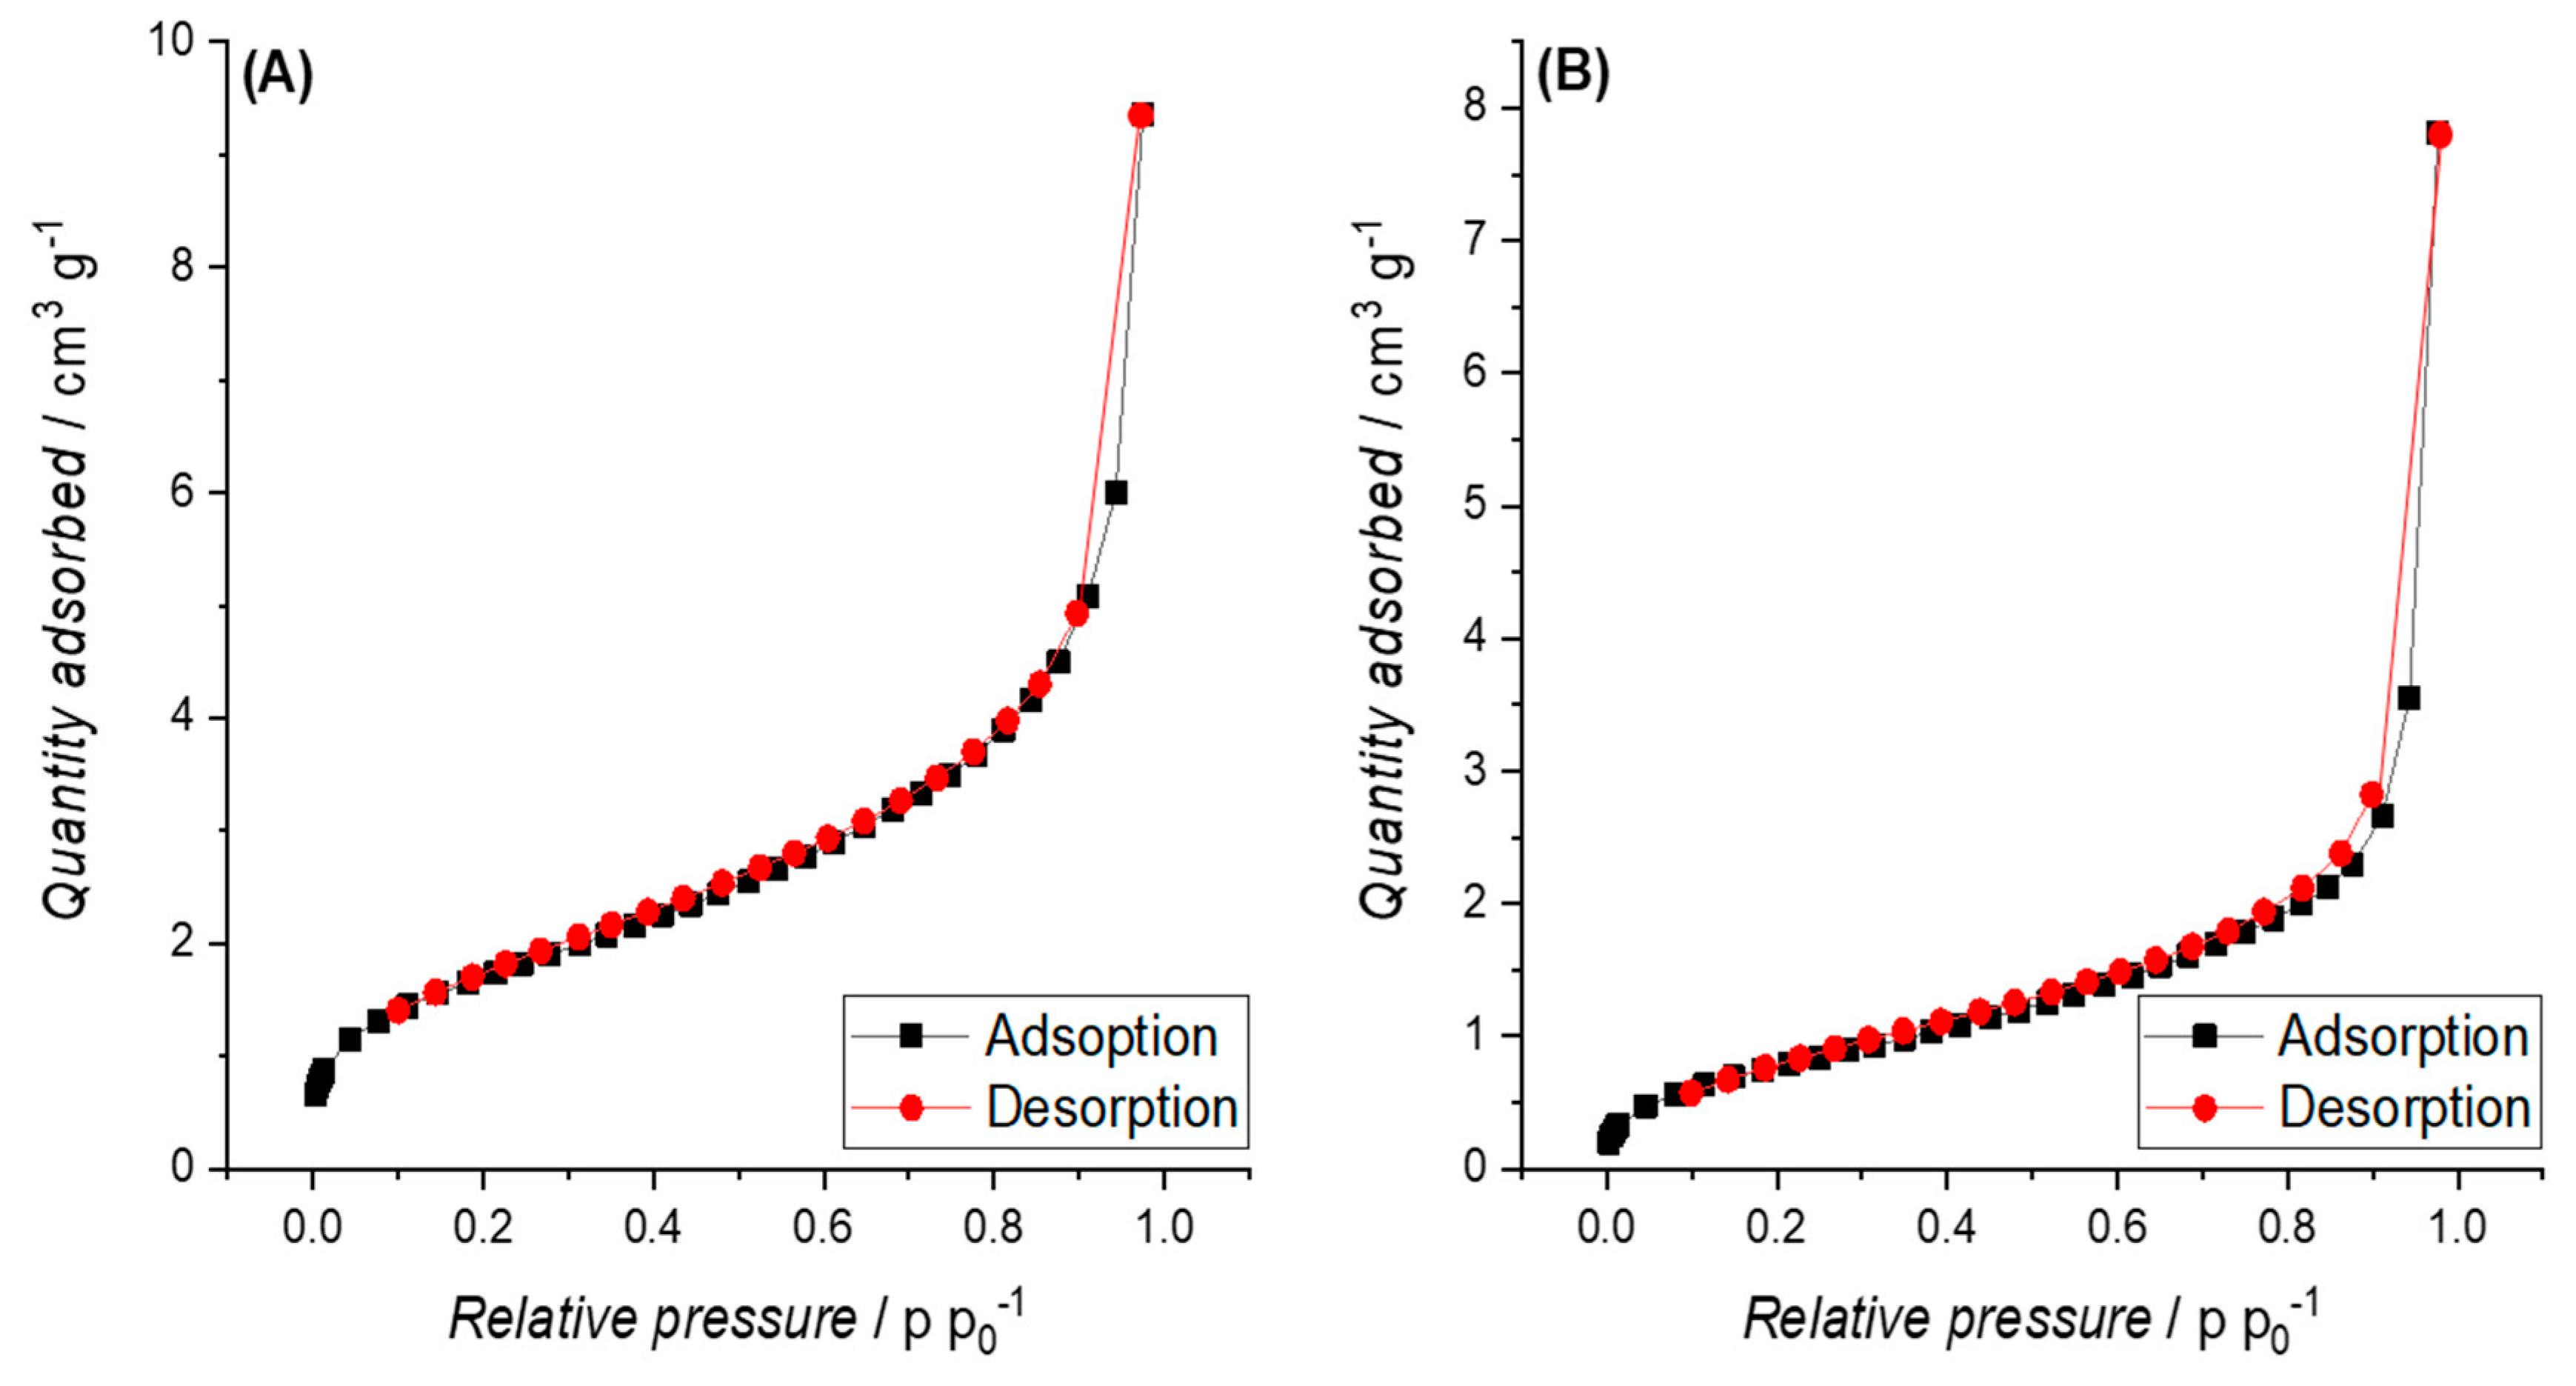
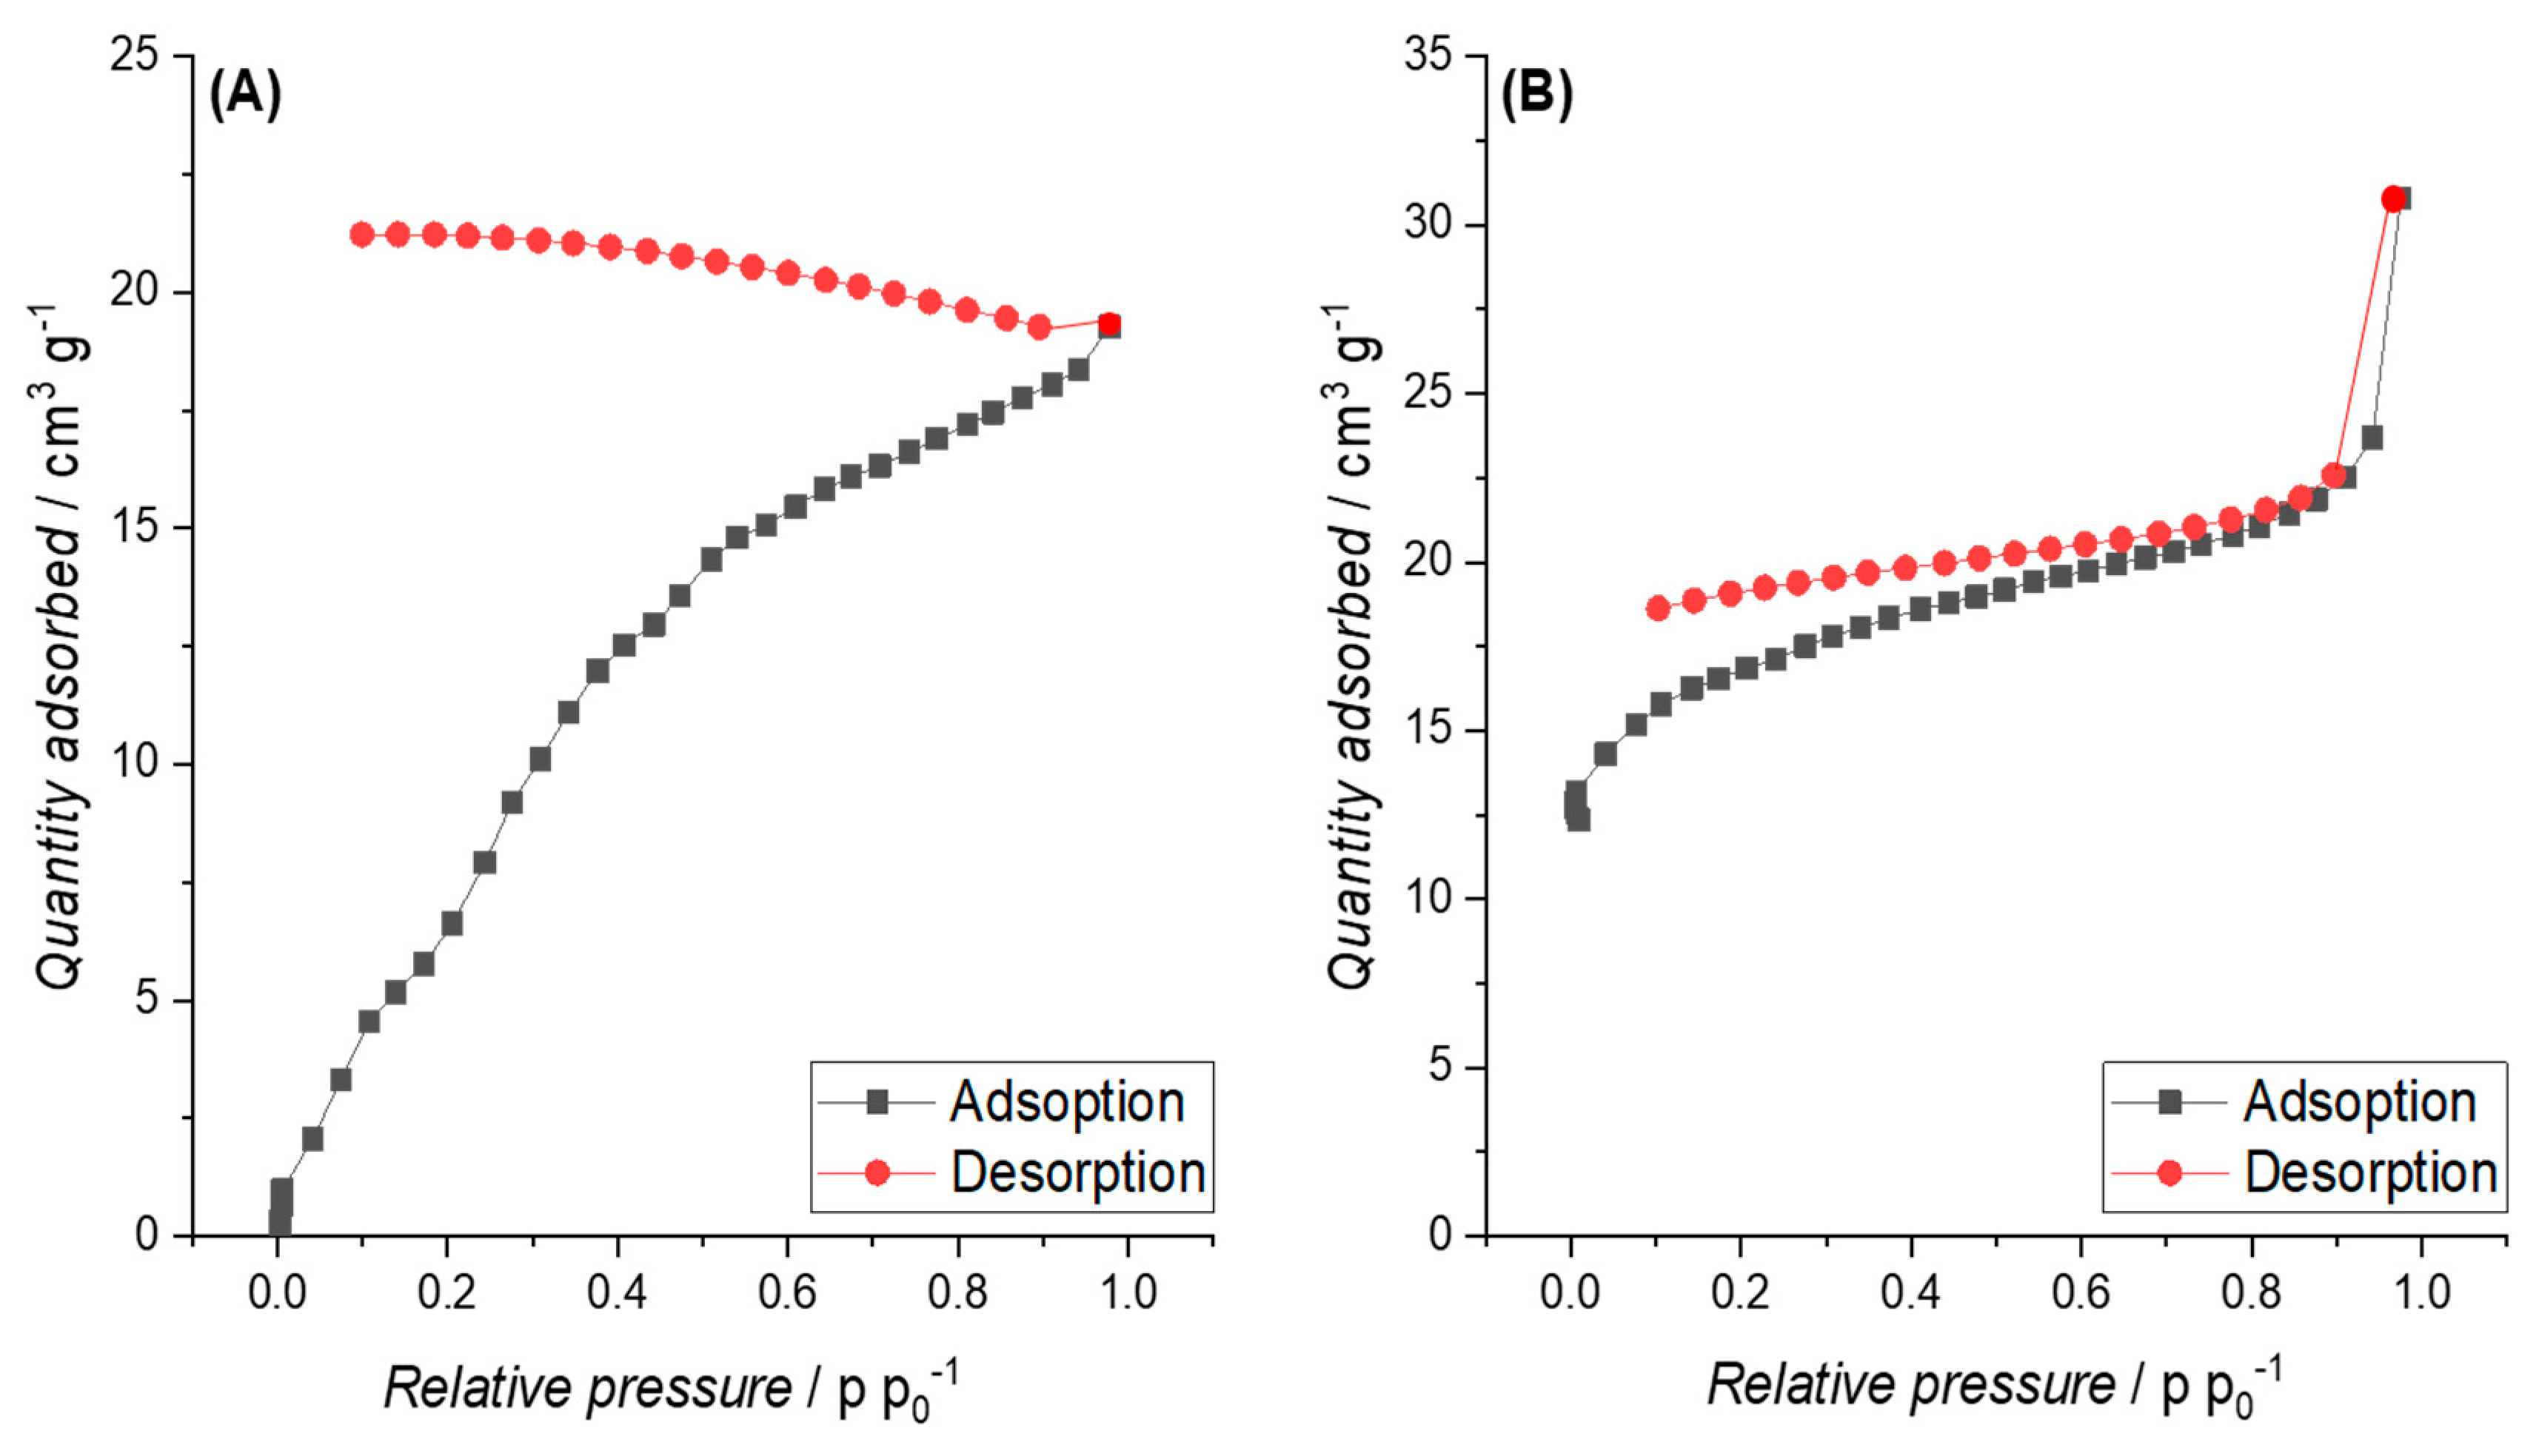
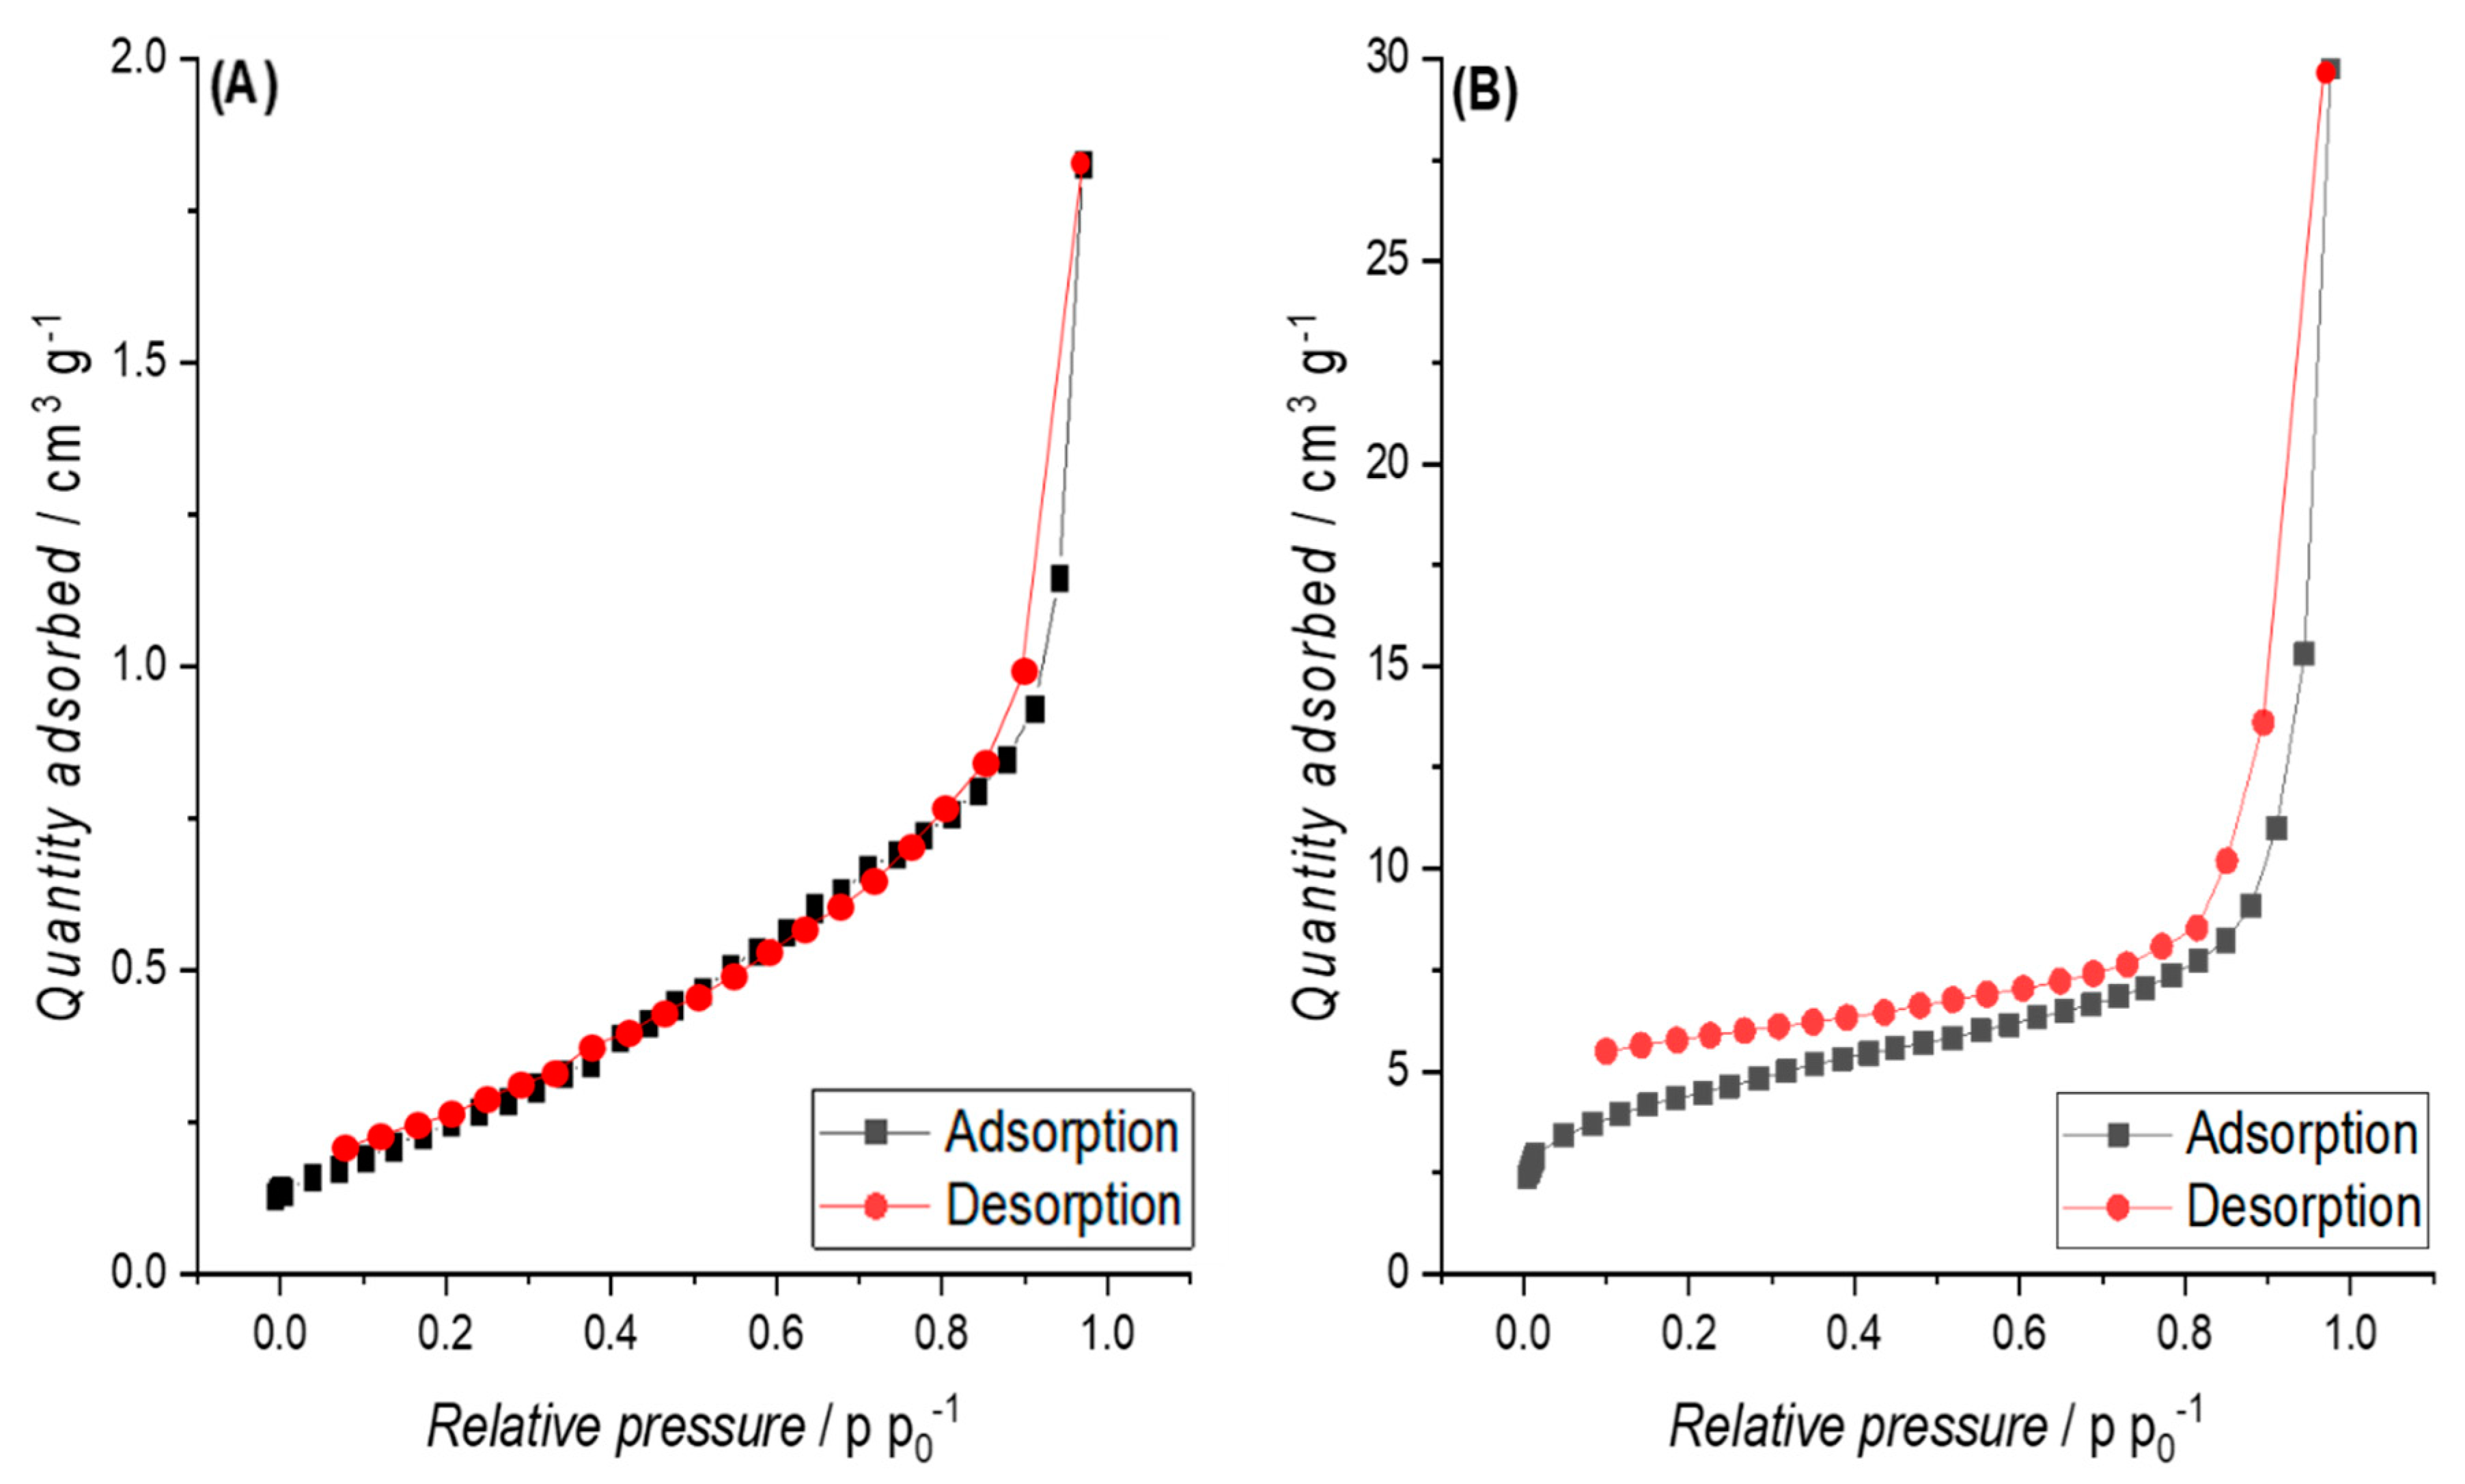
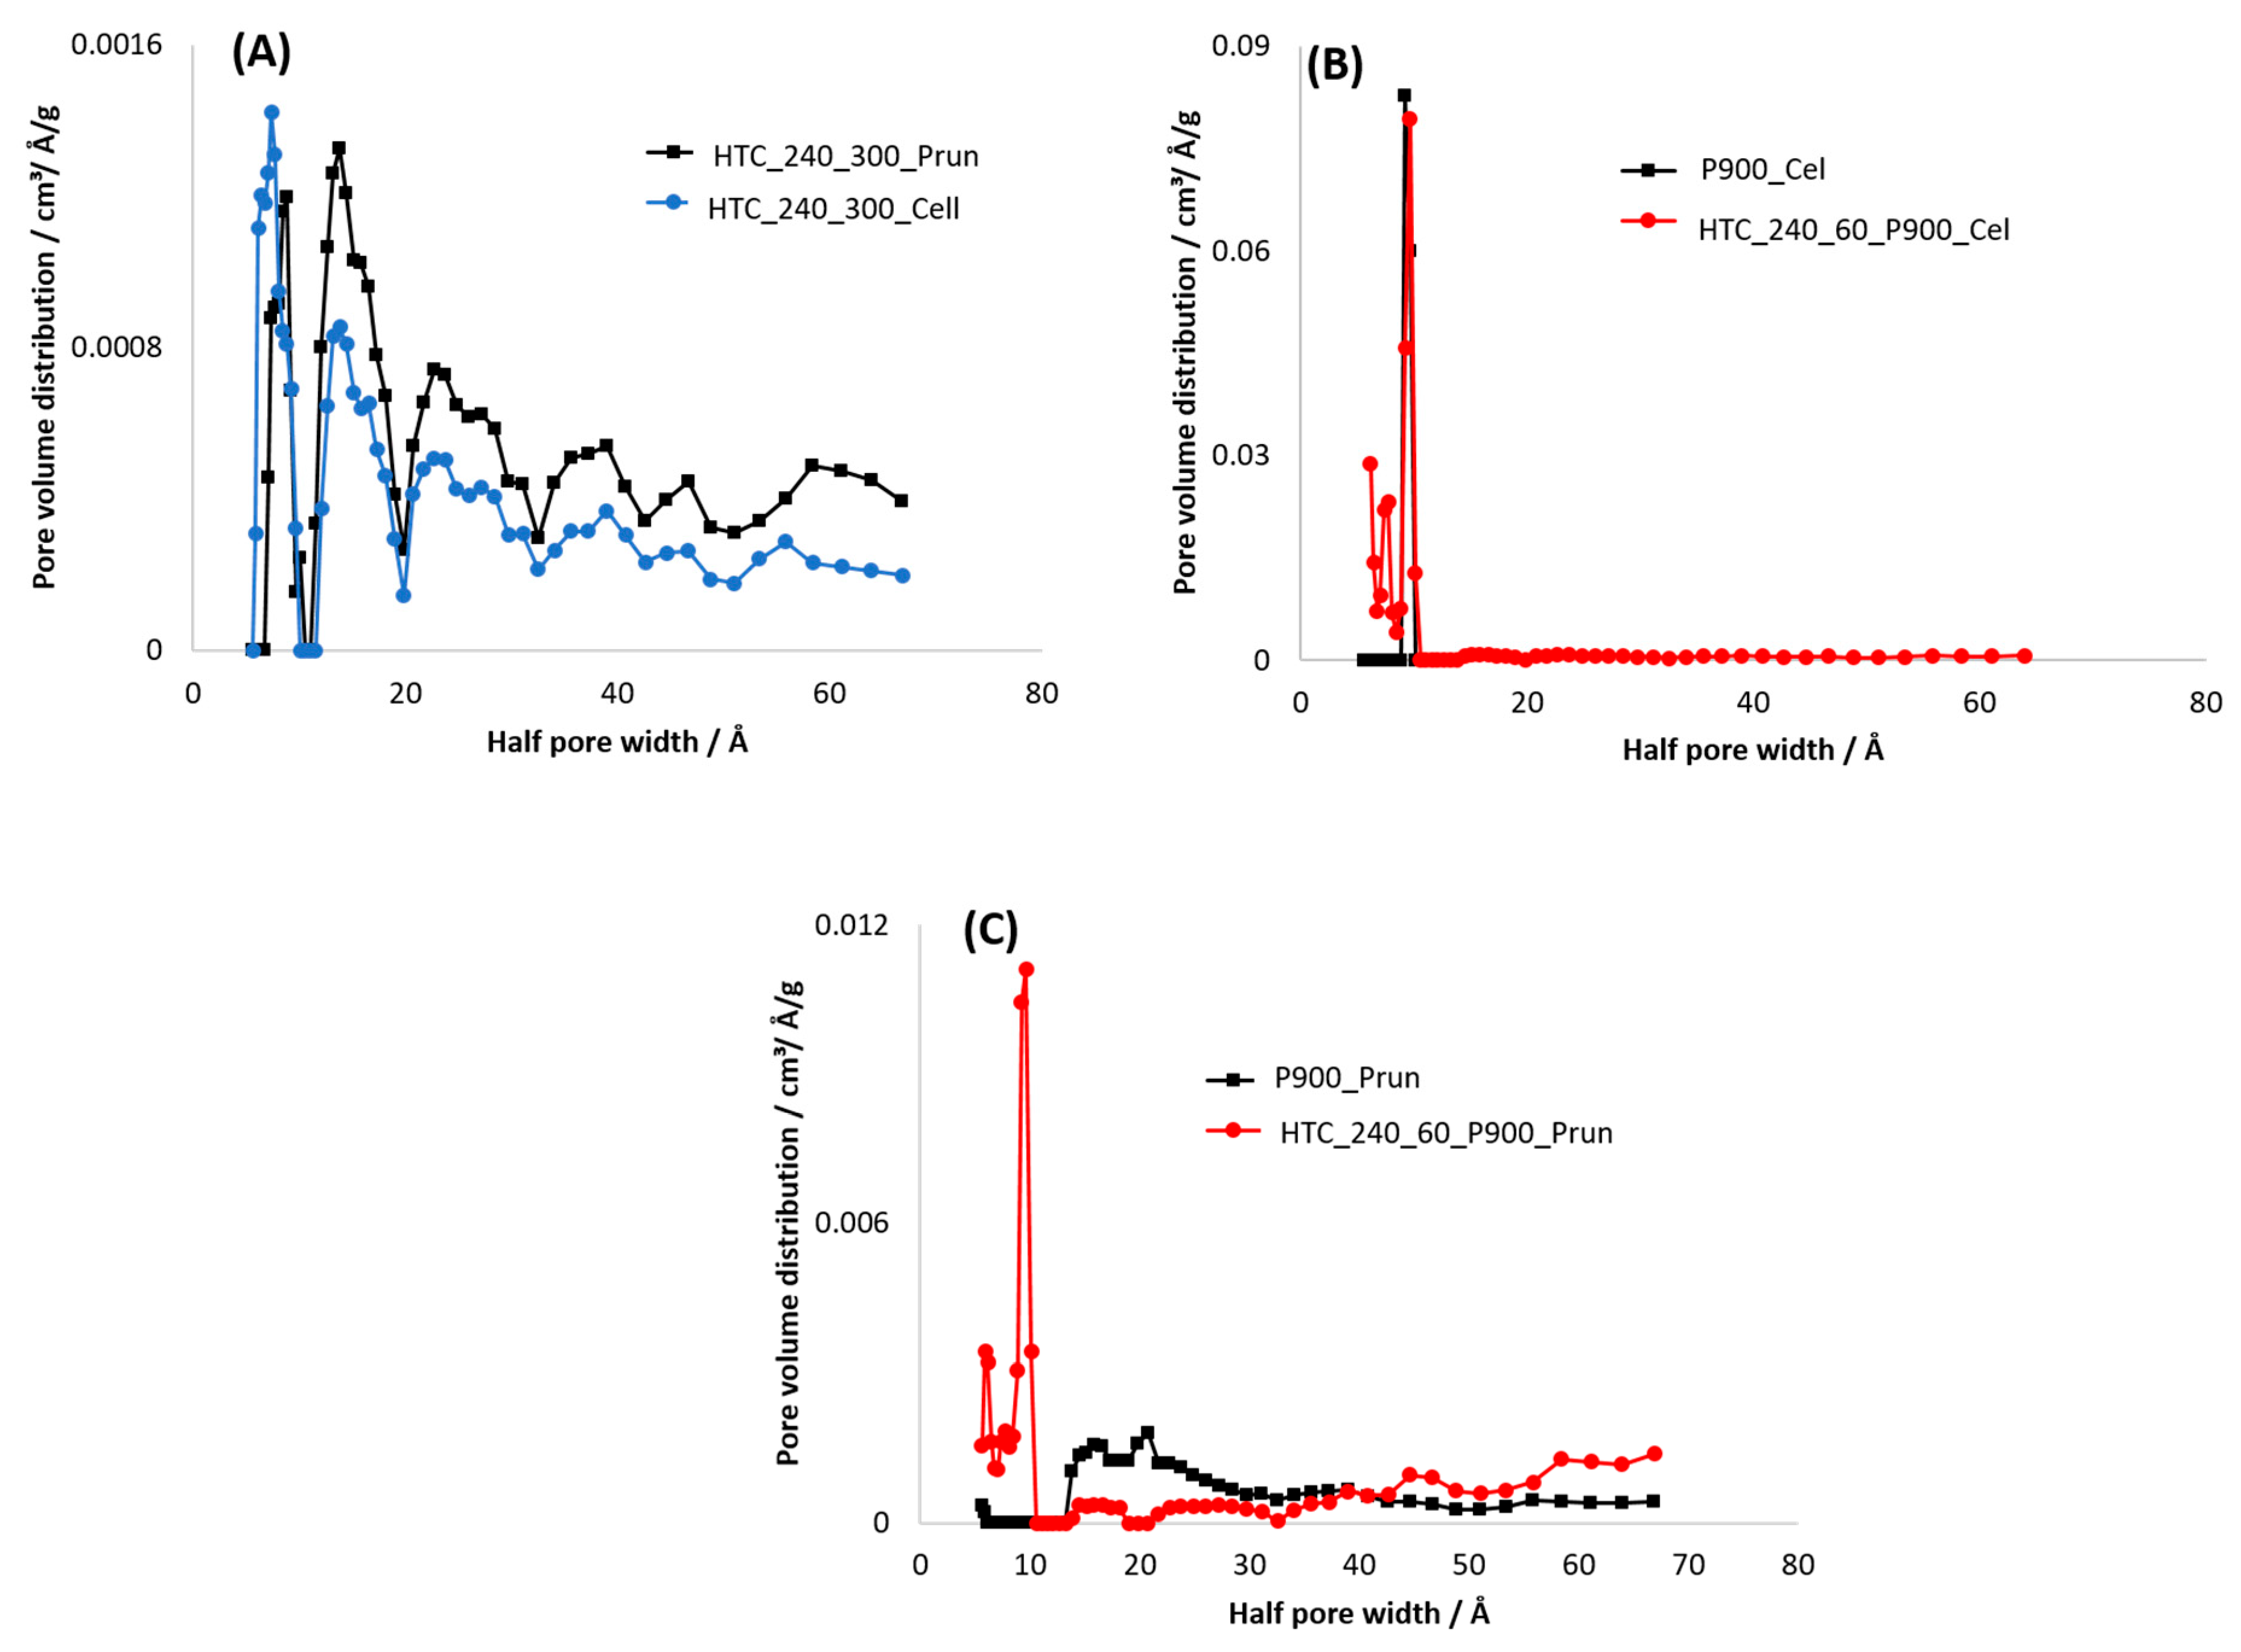
3.3.2. Specific Surface Area (SSA)
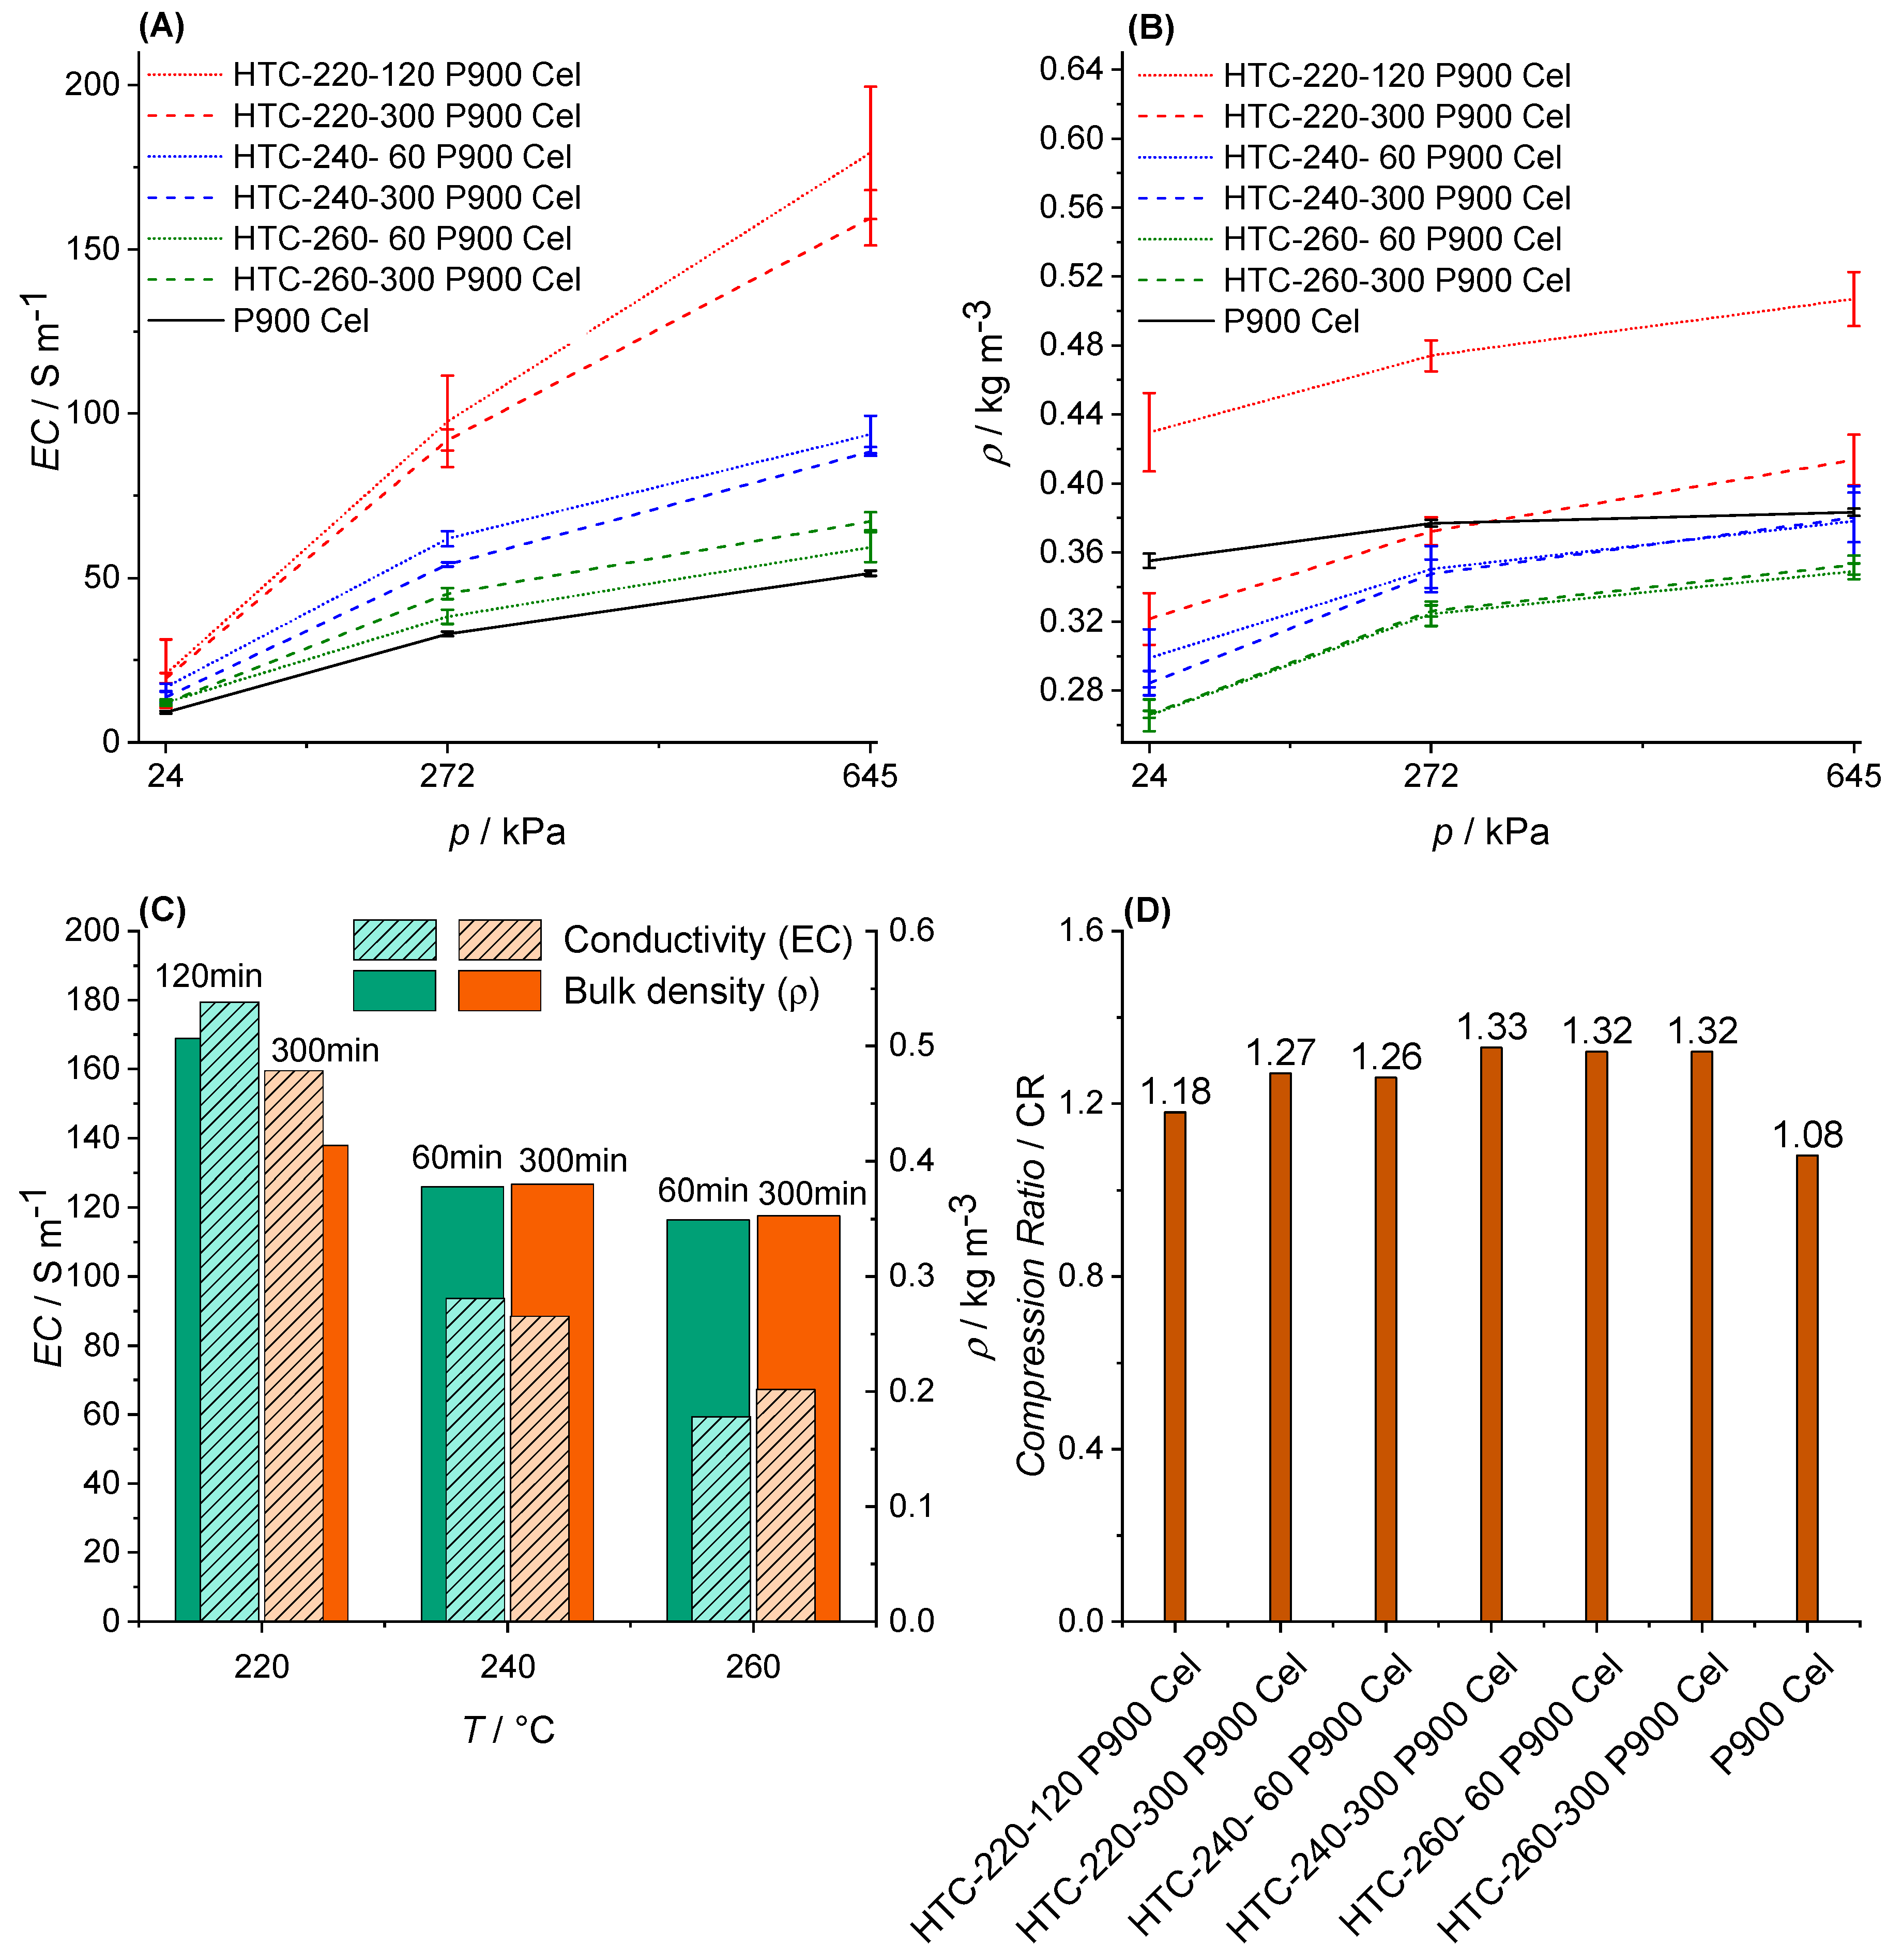
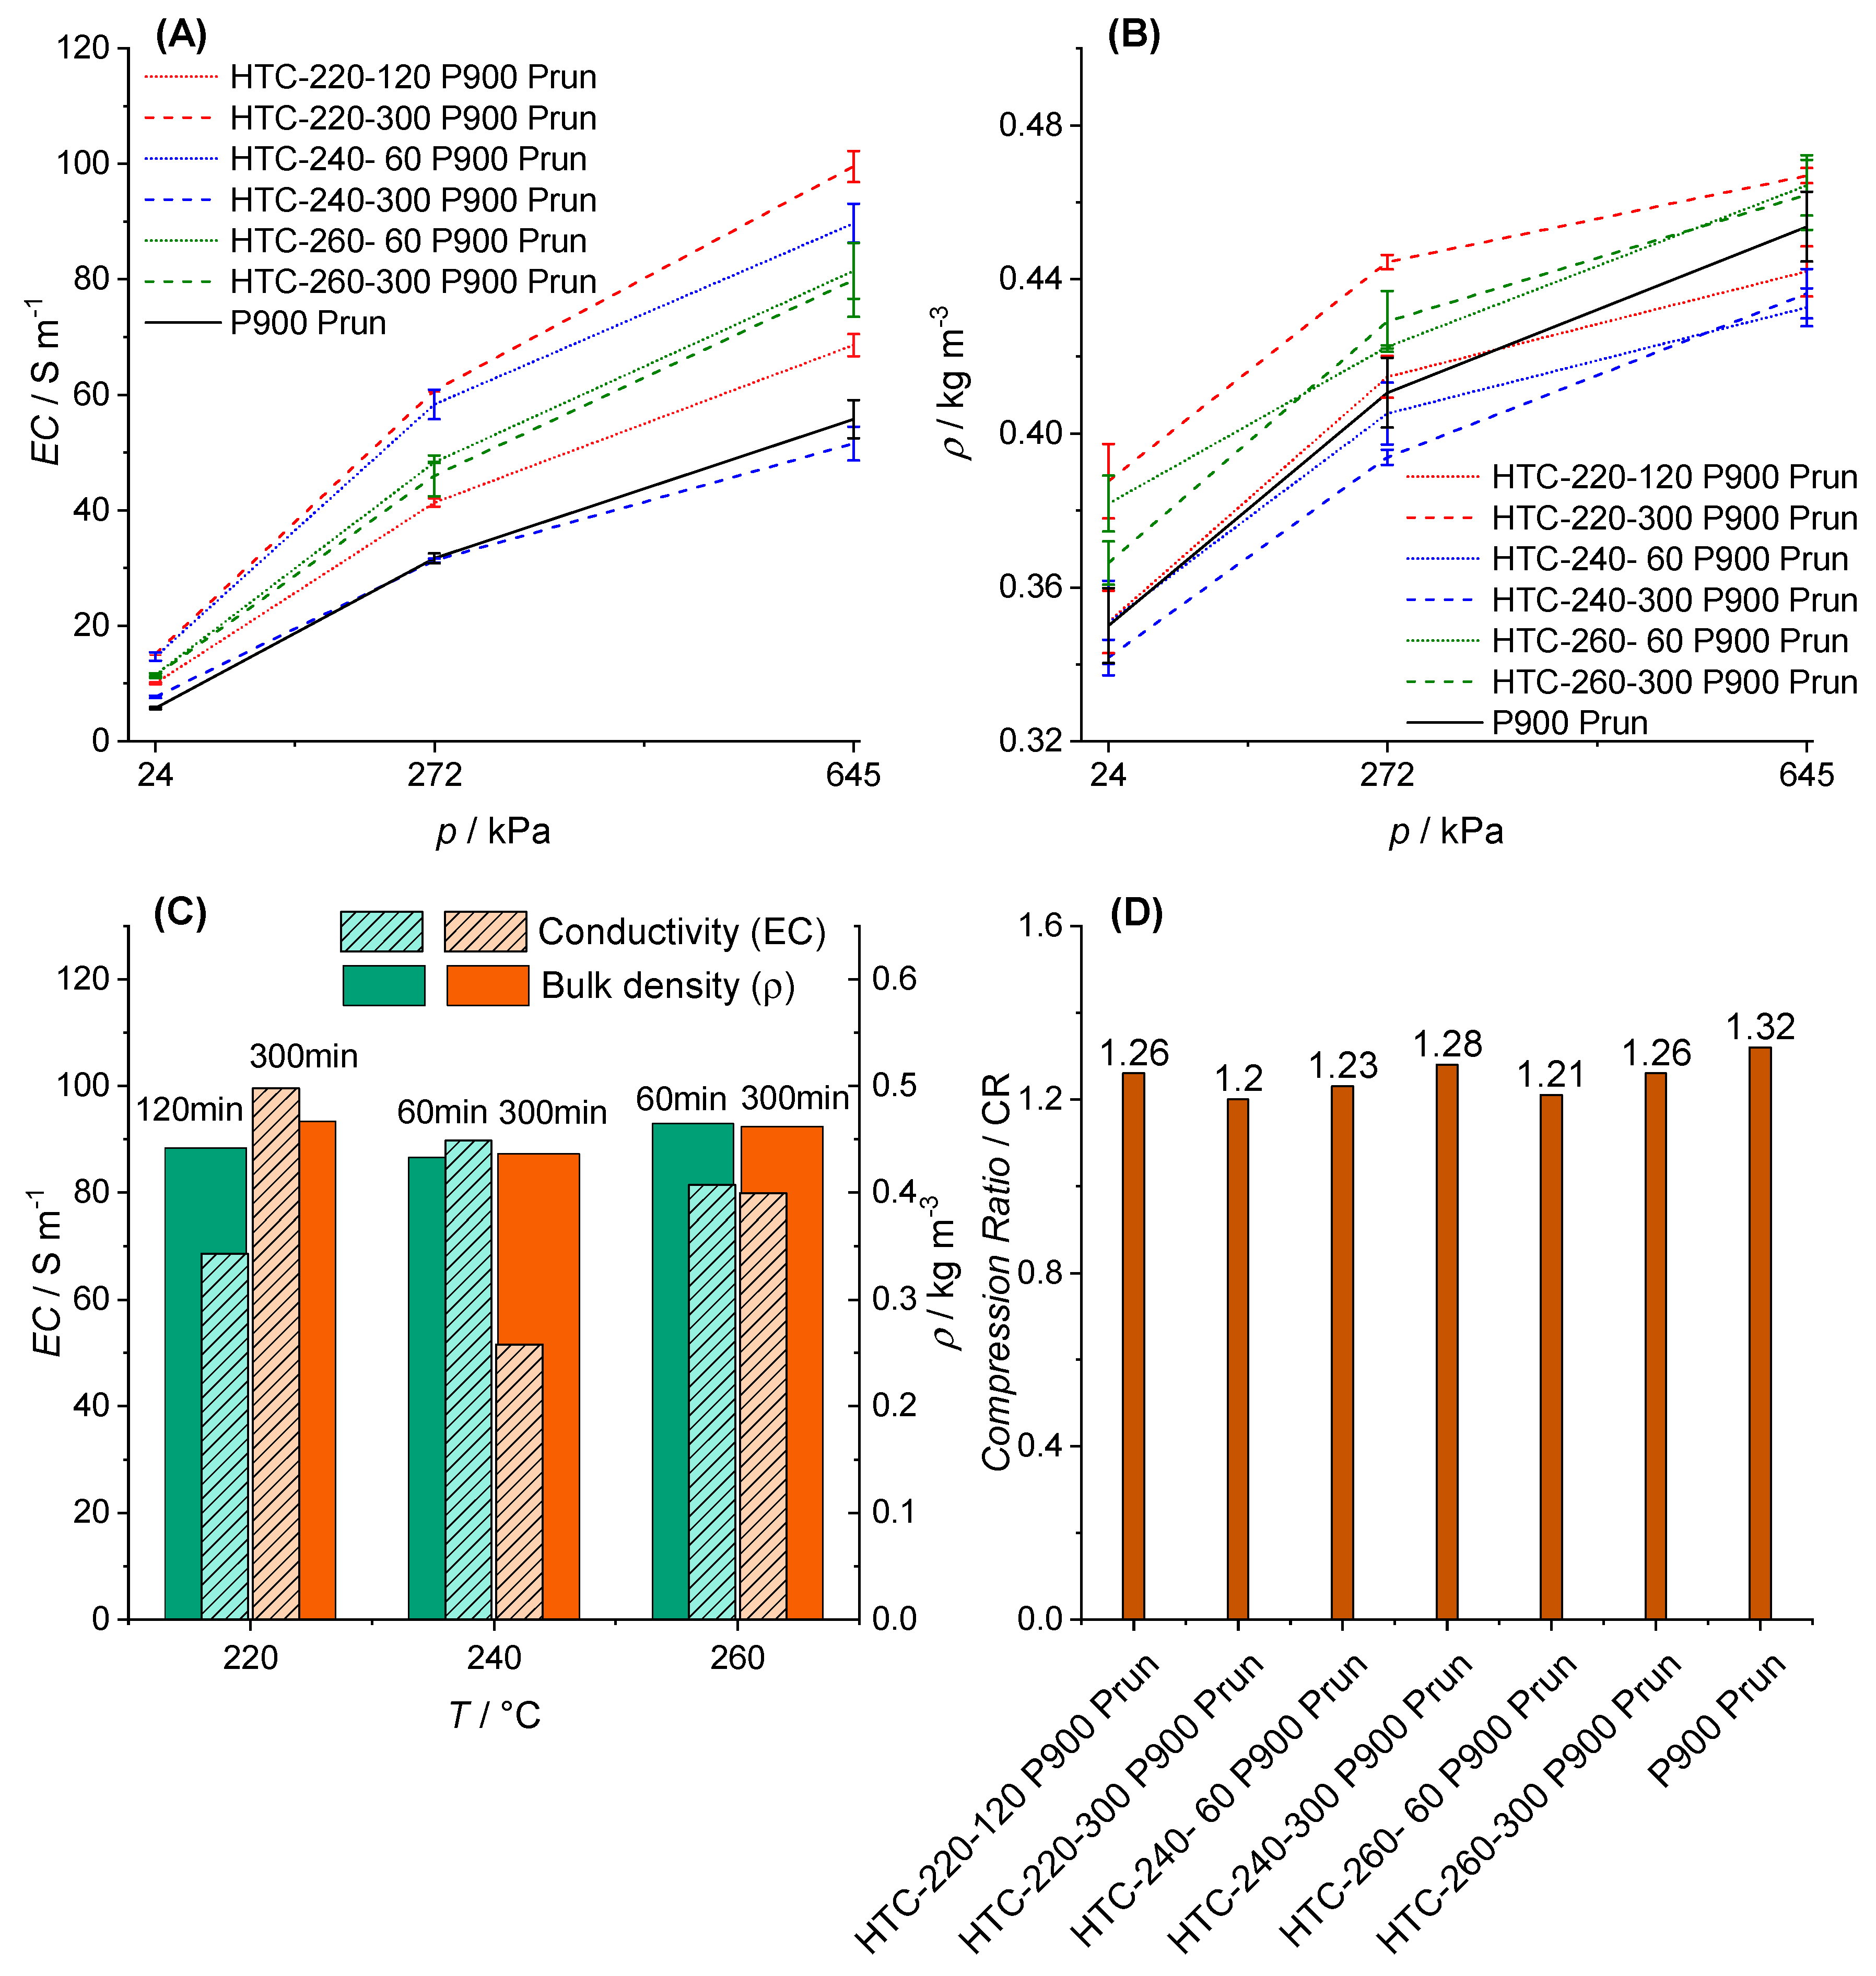
3.4. Electric Conductivity (EC) and Physisco-Chemical Properties
4. Discussion
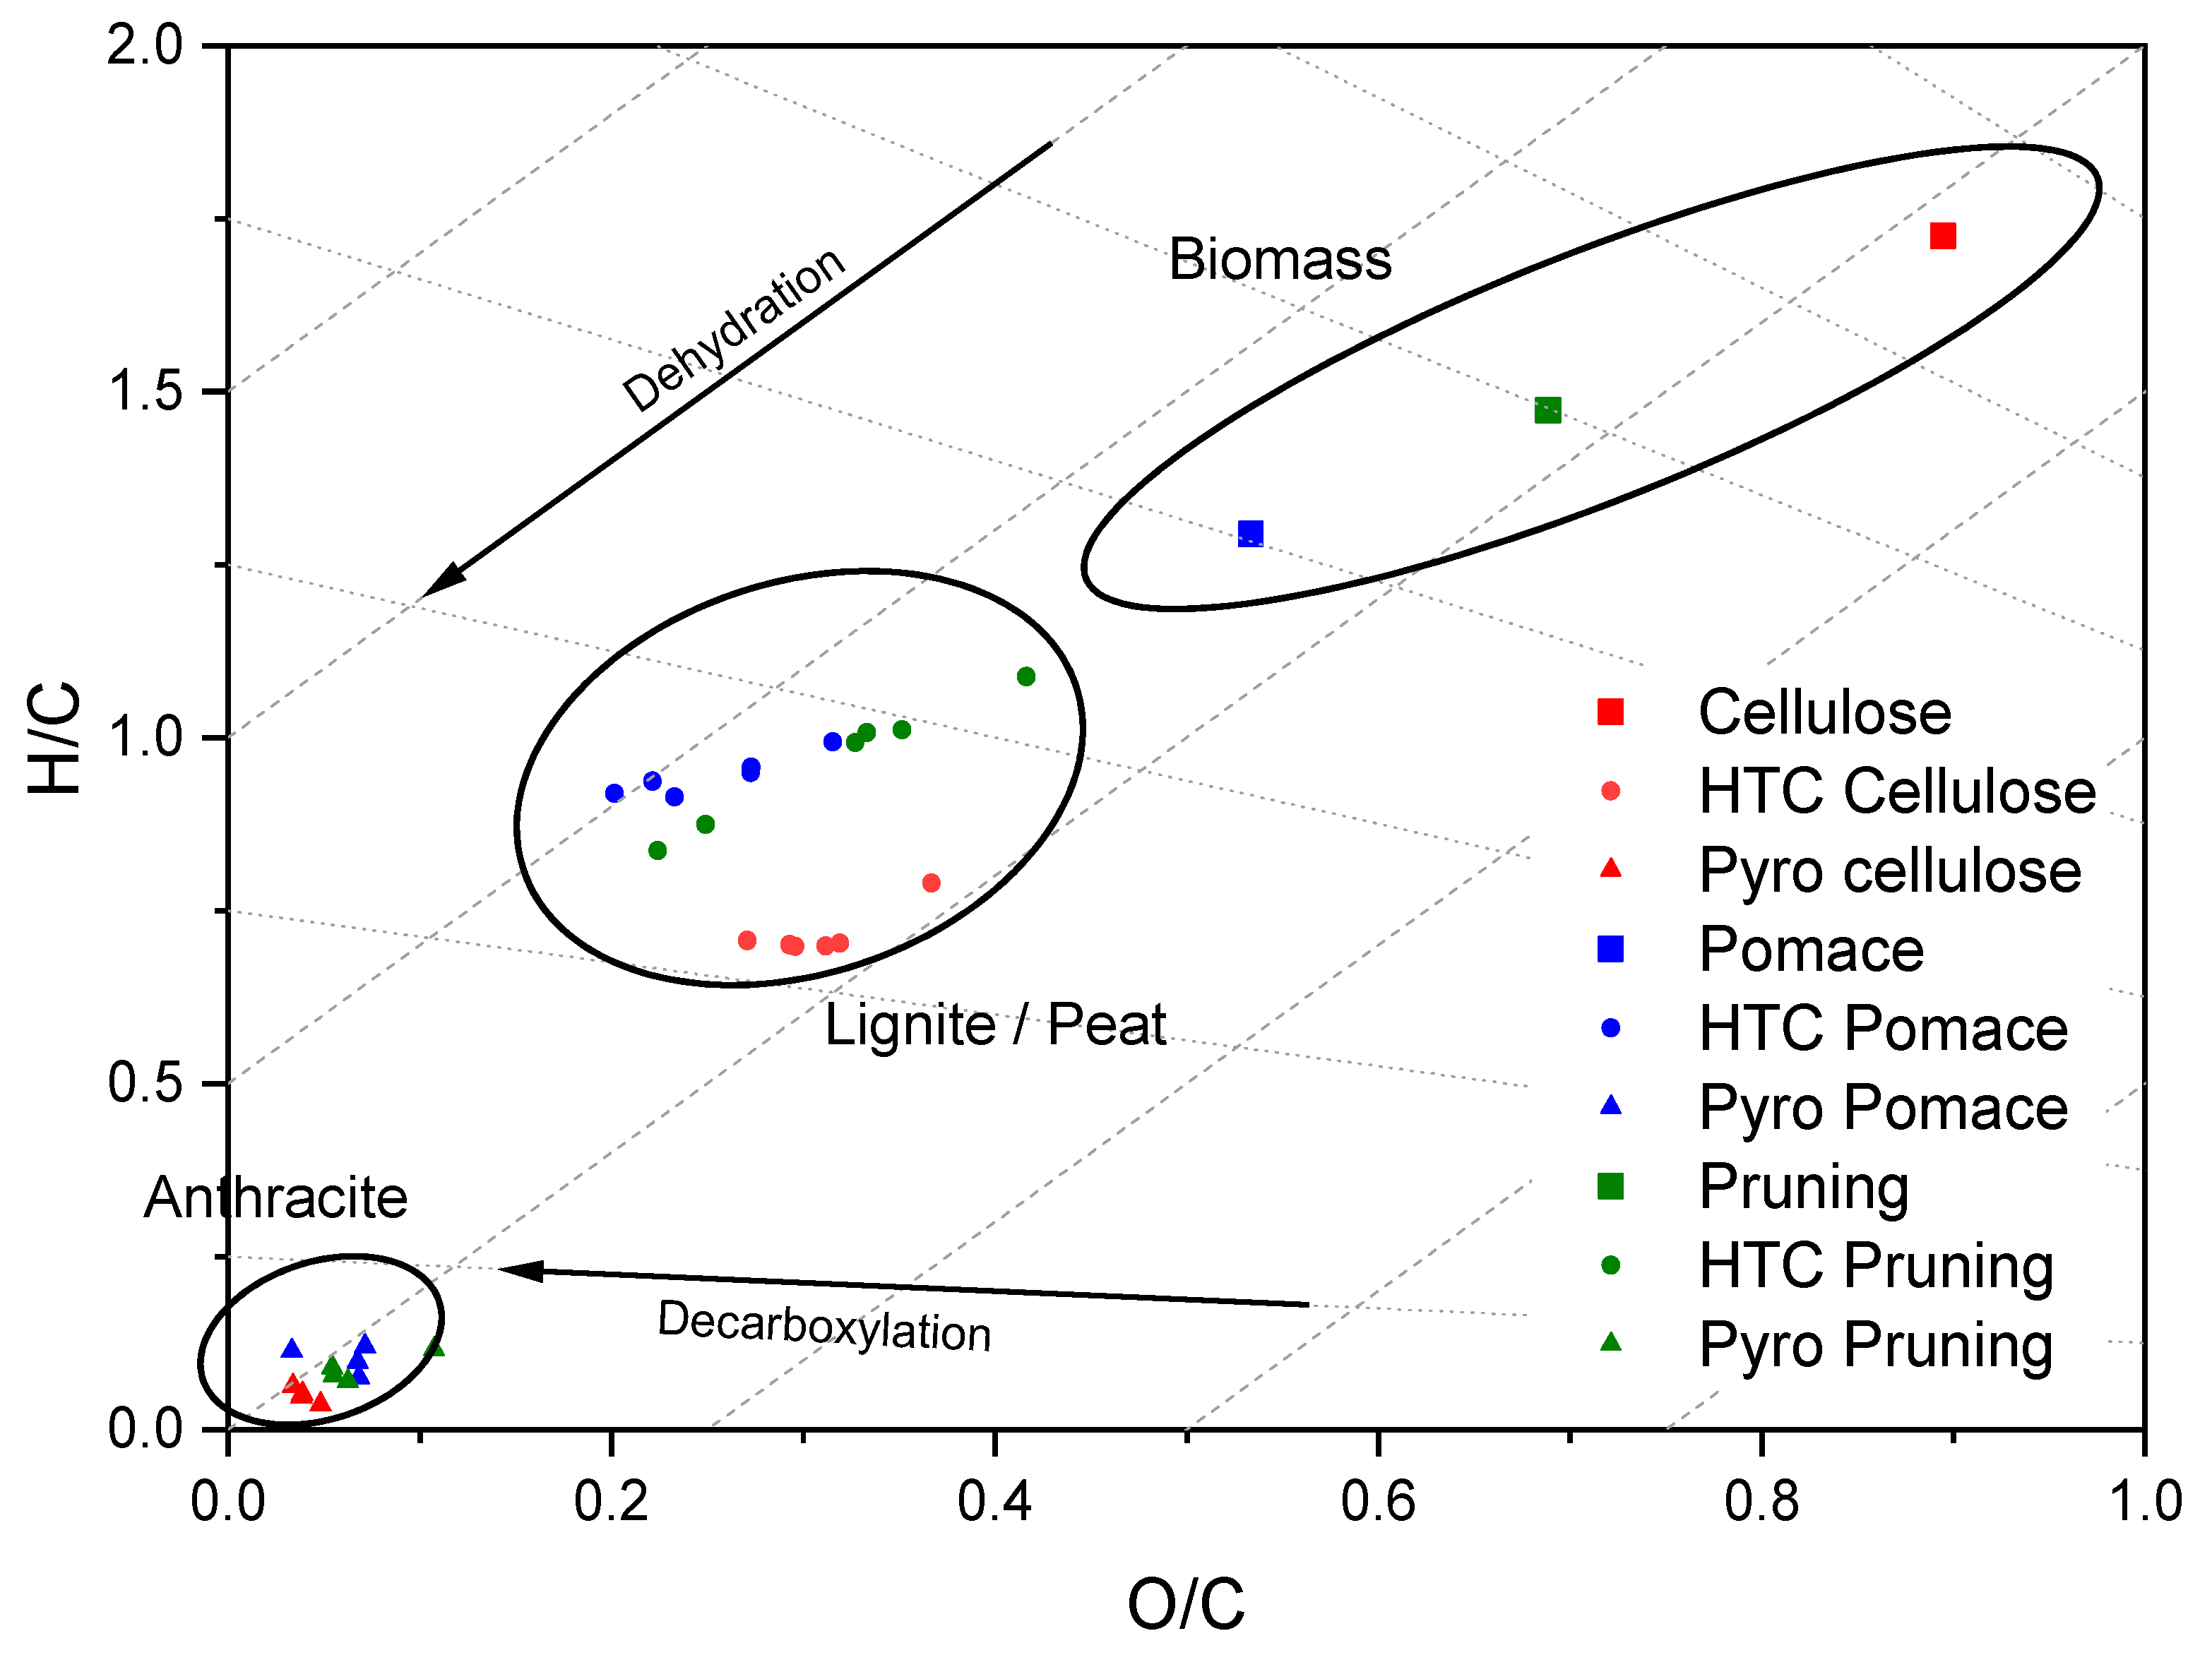
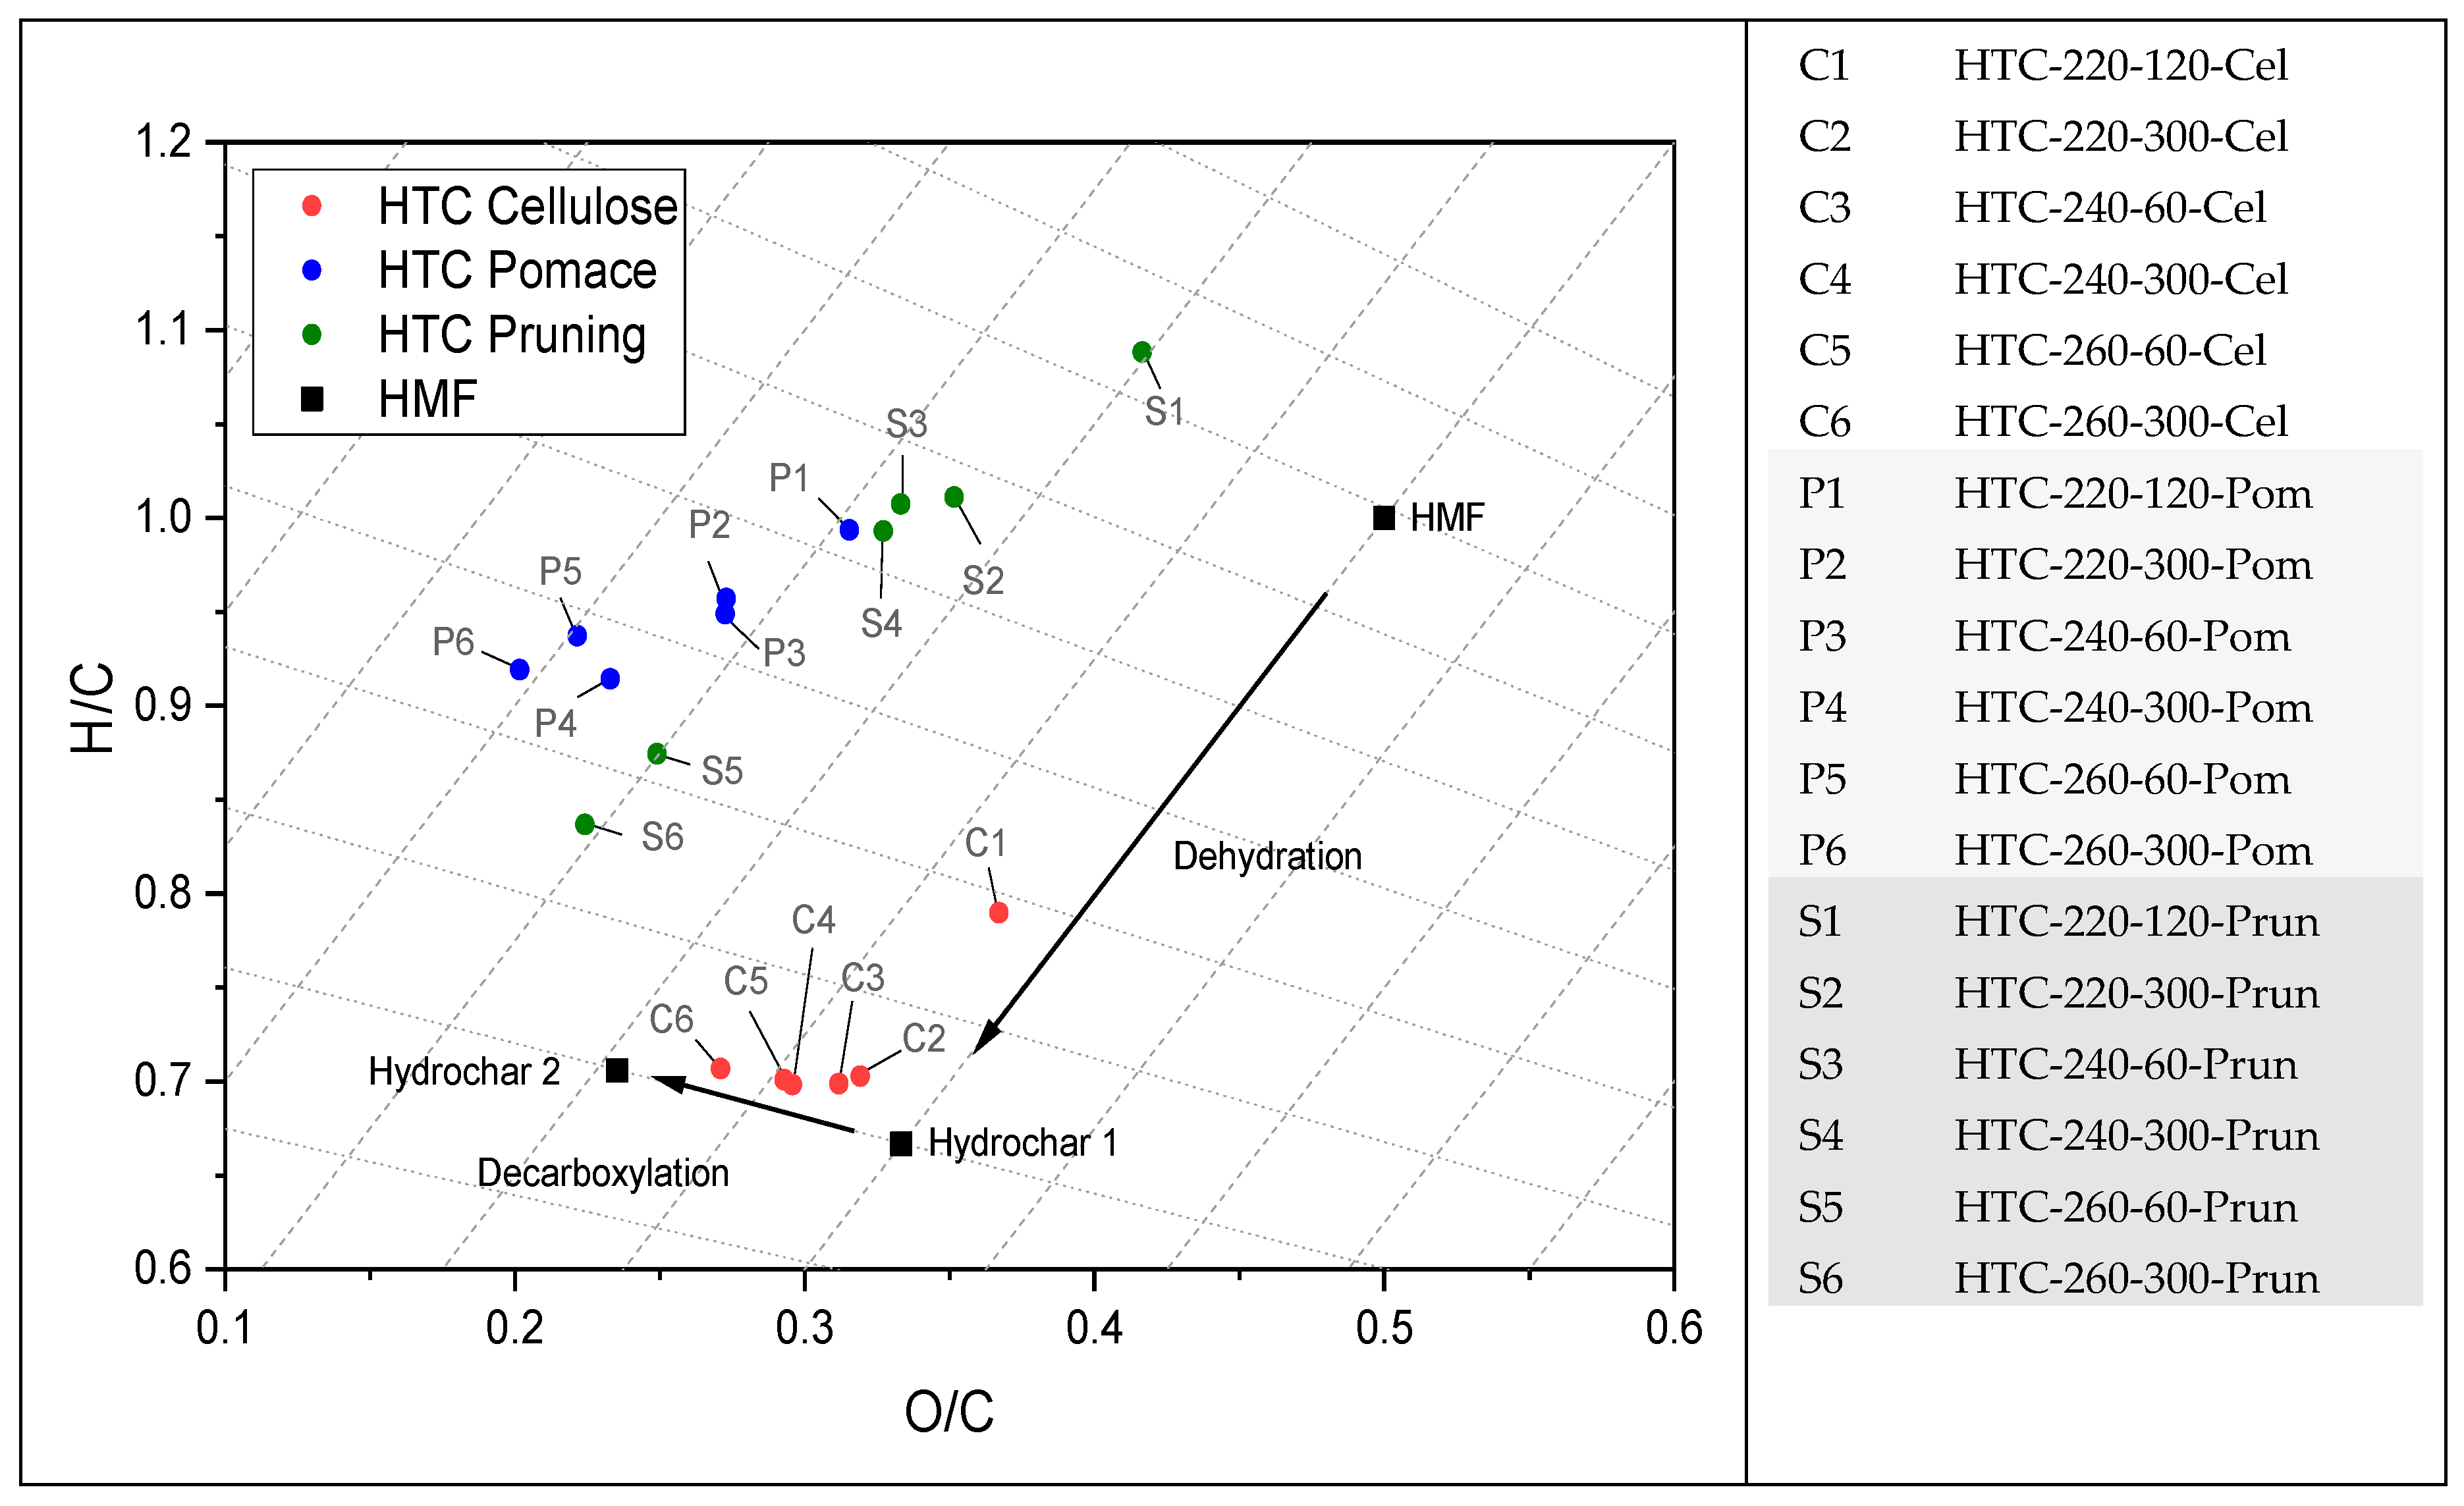
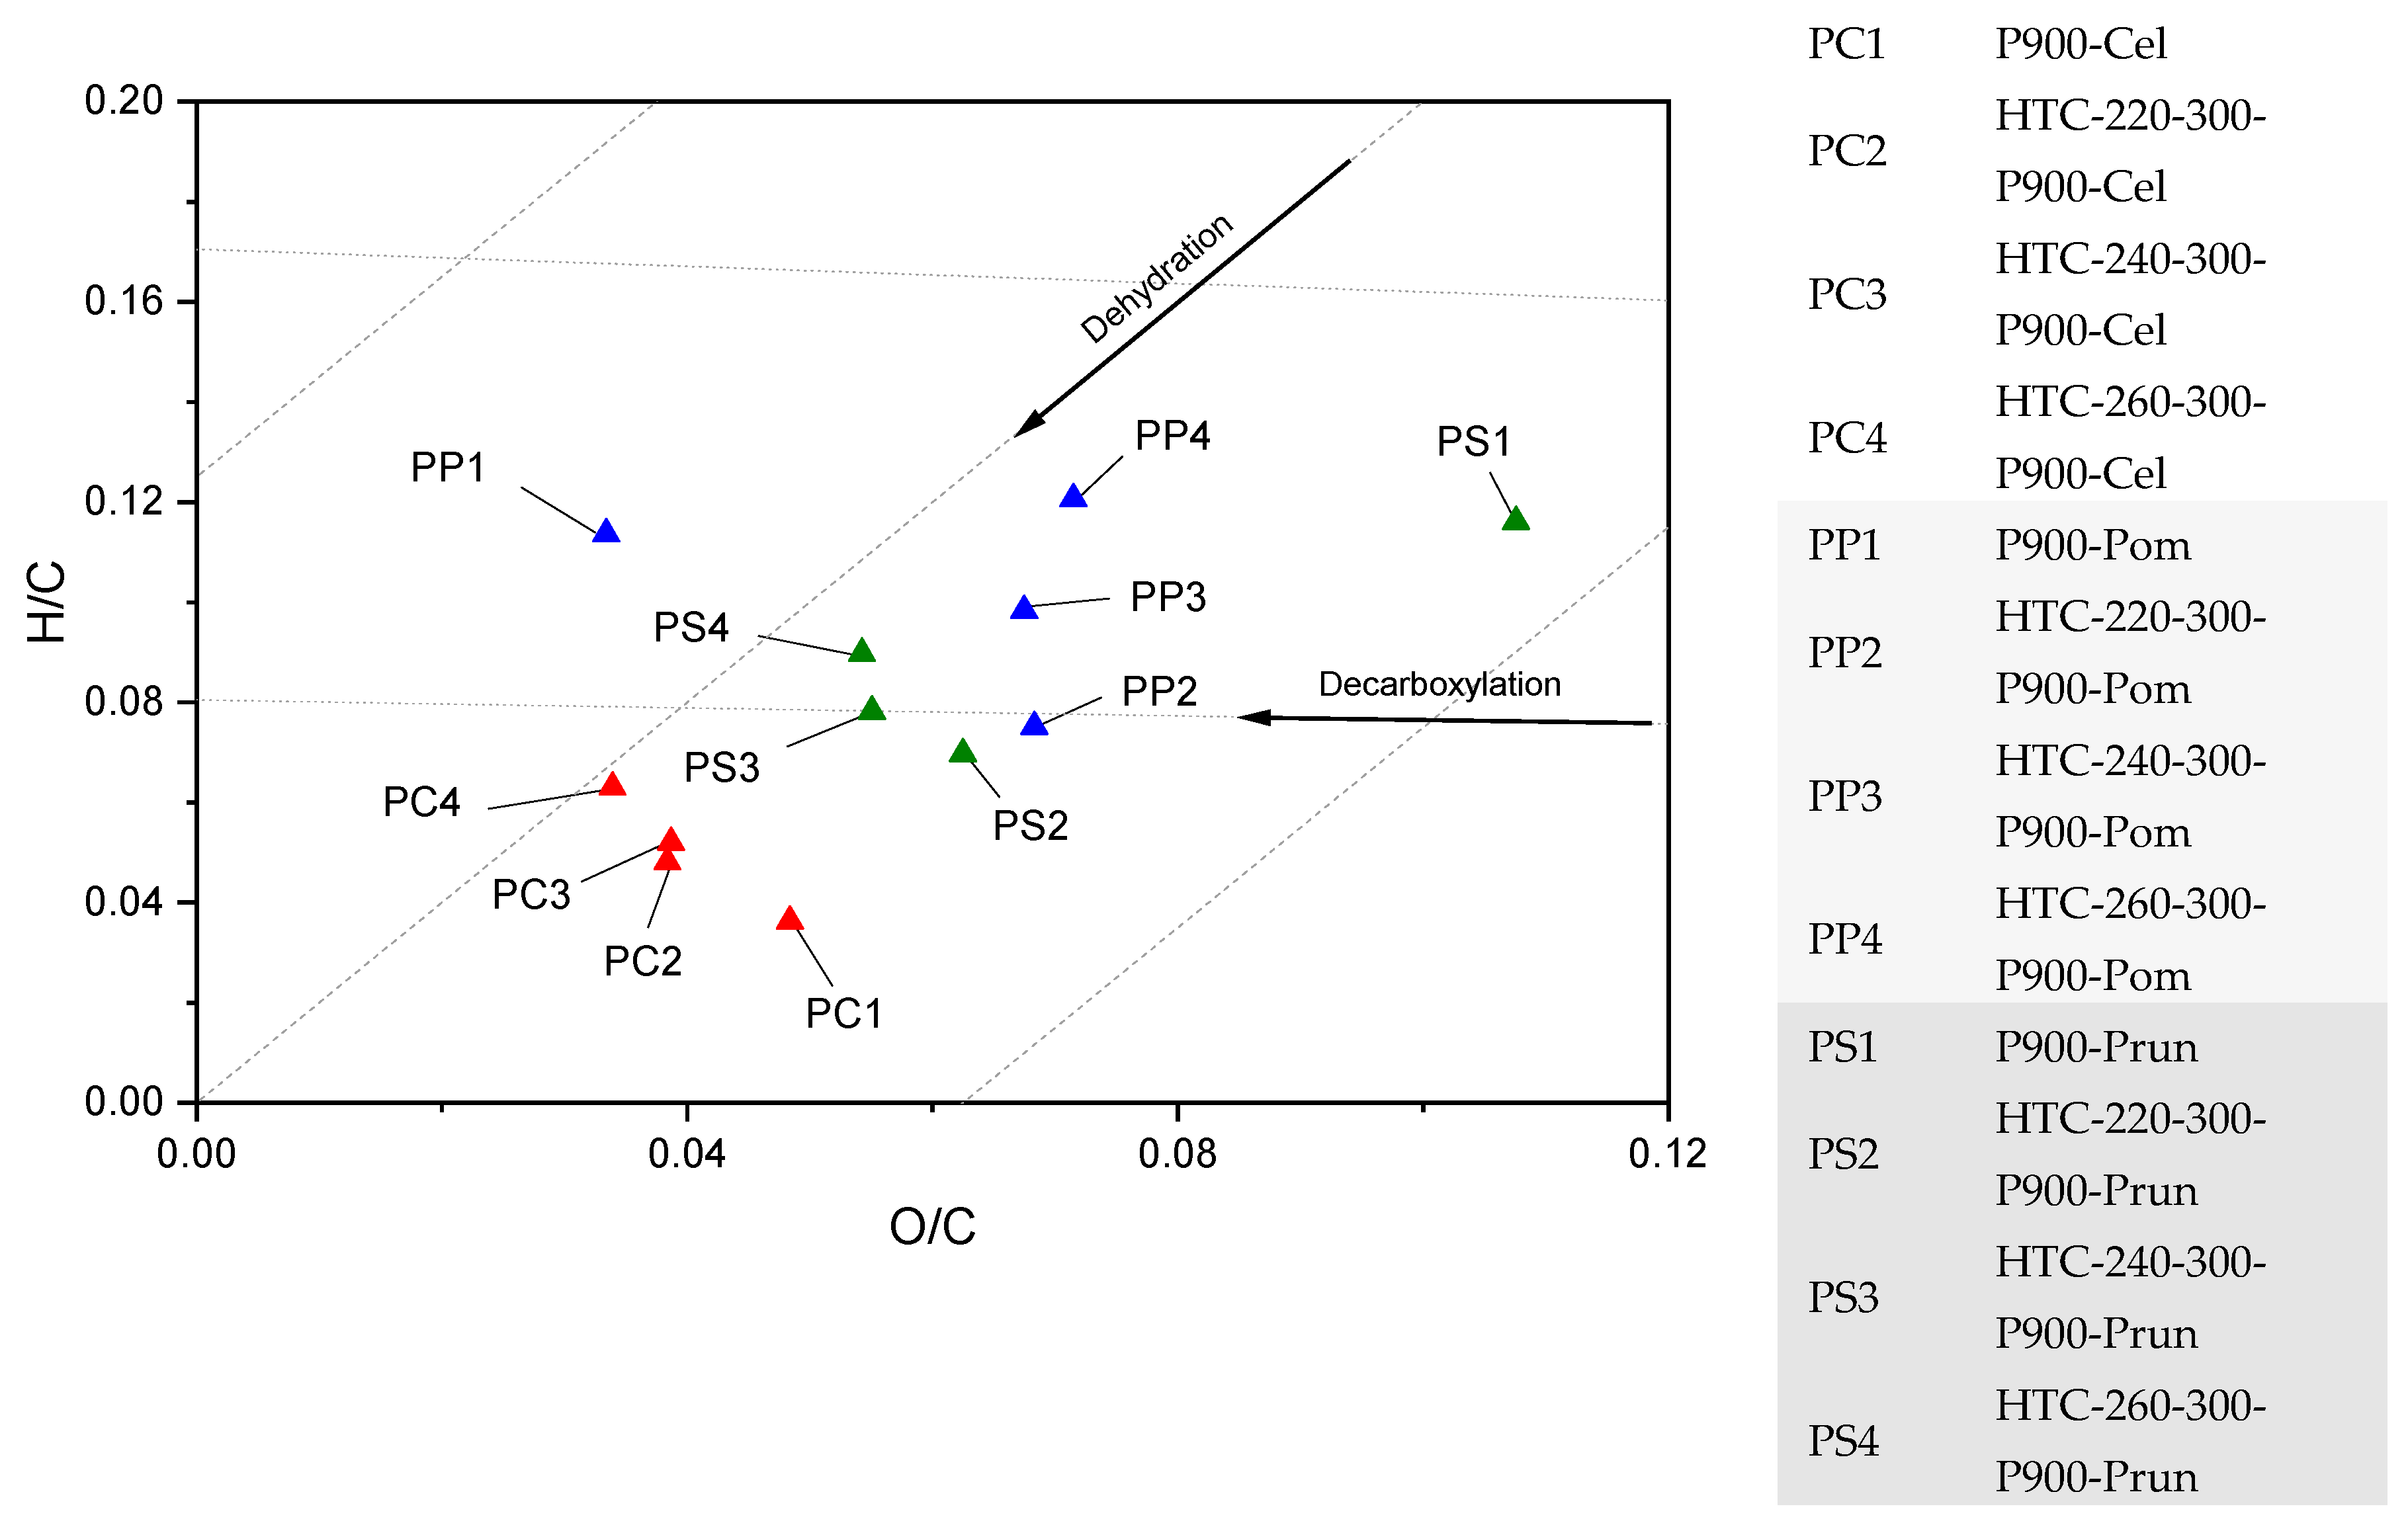
4.1. Thermochemical Conversion
4.2. Thermal Decomposition
4.3. EC and Physico-Chemical Properties
4.4. Application in Energy Storage and Conversion Devices (EDLC and DCFC)
5. Conclusions
Author Contributions
Funding
Acknowledgments
Conflicts of Interest
References
- Anaghan, N.; Vaghasiya, H. Modification and Analysis in design of series hybrid vehicle. Int. J. Eng. Res. Appl. 2017, 7, 60–64. [Google Scholar]
- Maxwell Technologies, Ultracapacitor Overview, Maxwell Technologies. 2019. Available online: https://www.maxwell.com/products/ultracapacitors (accessed on 20 May 2019).
- Giddey, S.; Badwal, S.P.S.; Kulkarni, A.; Munnings, C. A comprehensive review of direct carbon fuel cell technology. Prog. Energy Combust. Sci. 2012, 38, 360–399. [Google Scholar] [CrossRef]
- Jiang, C.; Ma, J.; Corre, G.; Jain, S.L.; Irvine, J.T.S. Challenges in developing direct carbon fuel cells. Chem. Soc. Rev. 2017, 46, 2889–2912. [Google Scholar] [CrossRef] [PubMed]
- Cao, D.; Sun, Y.; Wang, G. Direct carbon fuel cell : Fundamentals and recent developments. J. Power Sources 2007, 167, 250–257. [Google Scholar] [CrossRef]
- Dudek, M.; Tomczyk, P.; Socha, R.; Skrzypkiewicz, M.; Jewulski, J. Biomass Fuels for Direct Carbon Fuel Cell with Solid Oxide Electrolyte. Int. J. Electrochem. Sci. 2013, 8, 3229–3253. [Google Scholar]
- Ahn, S.Y.; Eom, S.Y.; Rhie, Y.H.; Sung, Y.M.; Moon, C.E.; Choi, G.M.; Kim, D.J. Utilization of wood biomass char in a direct carbon fuel cell (DCFC) system. Appl. Energy 2013, 105, 207–216. [Google Scholar] [CrossRef]
- Jang, H.; Ocon, J.D.; Lee, S.; Lee, J.K.; Lee, J. Direct power generation from waste coffee grounds in a biomass fuel cell. J. Power Sources 2015, 296, 433–439. [Google Scholar] [CrossRef]
- Elleuch, A.; Halouani, K.; Li, Y. Investigation of chemical and electrochemical reactions mechanisms in a direct carbon fuel cell using olive wood charcoal as sustainable fuel. J. Power Sources 2015, 281, 350–361. [Google Scholar] [CrossRef]
- Badwal, S.P.S.; Giddey, S. The holy grail of carbon combustion—The direct carbon fuel cell technology. Mater. Forum 2010, 34, 181–185. [Google Scholar]
- Frackowiak, E.; Béguin, F. Carbon materials for the electrochemical storage of energy in capacitors. Carbon 2001, 39, 937–950. [Google Scholar] [CrossRef]
- Wang, G.; Zhang, L.; Zhang, J. A review of electrode materials for electrochemical supercapacitors. Chem. Soc. Rev. 2012, 41, 797–828. [Google Scholar] [CrossRef] [PubMed]
- Frackowiak, E.; Béguin, F. Supercapacitors Materials, Systems and Application; WILEY-VCH Verlag GmbH & Co.: Weinheim, Germany, 2013. [Google Scholar]
- Pandolfo, A.G.; Hollenkamp, A.F. Carbon properties and their role in supercapacitors. J. Power Sources 2006, 157, 11–27. [Google Scholar] [CrossRef]
- Shukla, A.K.; Sampath, S.; Vijayamohanan, K. Electrochemical supercapacitors : Energy storage beyond batteries. Curr. Sci. 2000, 79, 1656–1661. [Google Scholar]
- Lozano-Castelló, D.; Marco-Lozar, J.P.; Bleda-Martínez, M.J.; Montilla, F.; Morallón, E.; Linares-Solano, A.; Cazorla-Amoros, D. Relevance of porosity and surface chemistry of superactivated carbons in capacitors. Tanso 2013, 2013, 41–47. [Google Scholar] [CrossRef][Green Version]
- Hulicova-Jurcakova, D.; Kodama, M.; Shiraishi, S.; Hatori, H.; Zhu, Z.H.; Lu, G.Q. Nitrogen-enriched nonporous carbon electrodes with extraordinary supercapacitance. Adv. Funct. Mater. 2009, 19, 1800–1809. [Google Scholar] [CrossRef]
- Antolini, E. Nitrogen-doped carbons by sustainable N- and C-containing natural resources as nonprecious catalysts and catalyst supports for low temperature fuel cells. Renew. Sustain. Energy Rev. 2016, 58, 34–51. [Google Scholar] [CrossRef]
- Yan, L.; Yu, J.; Houston, J.; Flores, N.; Luo, H. Biomass derived porous nitrogen doped carbon for electrochemical devices. Green Energy Environ. 2017, 2, 84–99. [Google Scholar] [CrossRef]
- Sánchez-González, J.; Stoeckli, F.; Centeno, T.A. The role of the electric conductivity of carbons in the electrochemical capacitor performance. J. Electroanal. Chem. 2011, 657, 176–180. [Google Scholar] [CrossRef]
- Hoffmann, V.; Correa, C.R.; Sautter, D.; Maringolo, E.; Kruse, A. Study of the electrical conductivity of biobased carbonaceous powder materials under moderate pressure for the application as electrode materials in energy storage technologies. GCB Bioenergy 2018, 11, 230–248. [Google Scholar] [CrossRef]
- FAO-OIV, Fao-Oiv Focus 2016, FAO. 2016. Available online: http://www.oiv.int/en/oiv-life/table-and-dried-grapes-world-data-available (accessed on 20 May 2019).
- Rondeau, P.; Gambier, F.; Jolibert, F.; Brosse, N. Compositions and chemical variability of grape pomaces from French vineyard. Ind. Crop. Prod. 2013, 43, 251–254. [Google Scholar] [CrossRef]
- Rady, A.C.; Giddey, S.; Badwal, S.P.S.; Ladewig, B.P.; Bhattacharya, S. Review of Fuels for Direct Carbon Fuel Cells. Energy Fuels 2012, 26, 1471–1488. [Google Scholar] [CrossRef]
- Gür, T.M. Critical review of carbon conversion in carbon fuel cells. Chem. Rev. 2013, 113, 6179–6206. [Google Scholar] [CrossRef]
- Intani, K.; Latif, S.; Kabir, A.K.M.R.; Müller, J. Effect of self-purging pyrolysis on yield of biochar from maize cobs, husks and leaves. Bioresour. Technol. 2016, 218, 541–551. [Google Scholar] [CrossRef] [PubMed]
- Brunauer, S.; Emmett, P.H.; Teller, E. Adsorption of gases in multimolecular layers 300 Adsorption of Gases in Multimolecular Layers. J. Am. Chem. Soc. 1938, 60, 309–319. [Google Scholar] [CrossRef]
- Hiemenz, P.C.; Rajagopalan, R. Principles of Colloid and Surface Chemistry; Taylor & Francis Ltd.: Abingdon, UK, 1997. [Google Scholar]
- Celzard, A.; Marêché, J.F.; Payot, F.; Furdin, G. Electrical conductivity of carbonaceous powders. Carbon 2002, 40, 2801–2815. [Google Scholar] [CrossRef]
- Soltex, Acetylene Black-01. 2018. Available online: http://soltexinc.com/wp-content/uploads/2016/10/TDS_AB-01-FINAL.pdf.0 (accessed on 20 May 2019).
- Lv, D.; Xu, M.; Liu, X.; Zhan, Z.; Li, Z.; Ya, H. Effect of cellulose, lignin, alkali and alkaline earth metallic species on biomass pyrolysis and gasification. Fuel Process. Technol. 2010, 91, 903–909. [Google Scholar] [CrossRef]
- Pala, M.; Kantarli, I.C.; Buyukisik, H.B.; Yanik, J. Hydrothermal carbonization and torrefaction of grape pomace: A comparative evaluation. Bioresour. Technol. 2014, 161, 255–262. [Google Scholar] [CrossRef] [PubMed]
- Gañan, J.; Abdulla, A.Al.; Miranda, A.B.; Turegano, J.; Correia, S.; Cuerda, E.M. Energy production by means of gasification process of residuals sourced in Extremadura (Spain). Renew. Energy 2005, 30, 1759–1769. [Google Scholar] [CrossRef]
- Kraiem, N.; Lajili, M.; Limousy, L.; Said, R.; Jeguirim, M. Energy recovery from Tunisian agri-food wastes: Evaluation of combustion performance and emissions characteristics of green pellets prepared from tomato residues and grape marc. Energy 2016, 107, 409–418. [Google Scholar] [CrossRef]
- Sevilla, M.; Fuertes, A.B. Chemical and Structural Properties of Carbonaceous Products Obtained by Hydrothermal Carbonization of Saccharides. Chem. A Eur. J. 2009, 15, 4195–4203. [Google Scholar] [CrossRef]
- Jung, D.; Zimmermann, M.; Kruse, A. Hydrothermal carbonization of fructose: Growth mechanism and kinetic model. ACS Sustain. Chem. Eng. 2018, 6, 13877–13887. [Google Scholar] [CrossRef]
- Mayer, Z.A.; Apfelbacher, A.; Hornung, A. A comparative study on the pyrolysis of metal- and ash-enriched wood and the combustion properties of the gained char. J. Anal. Appl. Pyrolysis 2012, 96, 196–202. [Google Scholar] [CrossRef]
- Shafizadeh, F. Pyrolytic Reactions and Products of Biomass. In Fundamentals of Thermochemical Biomass Conversion; Springer: Dordrecht, The Netherlands, 1985; pp. 183–217. [Google Scholar]
- Kuhlbusch, T.A.J.; Crutzen, P.J. Toward a global estimate of black carbon in residues of vegetation fires representing a sink of atmospheric CO2 and a source of O2. Glob. Biogeochem. Cycles 1995, 9, 491–501. [Google Scholar] [CrossRef]
- Yang, H.; Yan, R.; Chen, H.; Lee, D.H.; Zheng, C. Characteristics of hemicellulose, cellulose and lignin pyrolysis. Fuel 2007, 86, 1781–1788. [Google Scholar] [CrossRef]
- Bisanda, E.T.; Ogola, W.; Tesha, J. Characterisation of tannin resin blends for particle board applications. Cem. Concr. Compos. 2003, 25, 593–598. [Google Scholar] [CrossRef]
- örsi, F. Kinetic studies on the thermal decomposition of glucose and fructose. J. Therm. Anal. 1973, 5, 329–335. [Google Scholar] [CrossRef]
- Lei, Y.; Su, H.; Tian, R. Morphology evolution, formation mechanism and adsorption properties of hydrochars prepared by hydrothermal carbonization of corn stalk. RSC Adv. 2016, 6, 107829–107835. [Google Scholar] [CrossRef]
- Sing, K.S.W. Reporting physisorption data for gas/solid systems with special reference to the determination of surface area and porosity (Recommendations 1984). Pure Appl. Chem. 1985, 57, 603–619. [Google Scholar] [CrossRef]
- Stiny, L. Aktive elektronische Bauelemente Aufbau, Struktur, Wirkungsweise, Eigenschaften und praktischer Einsatz diskreter und integrierter Halbleiter-Bauteile; Springer: Heidelberg, Germany, 2016. [Google Scholar]
- ABarroso-Bogeat; Alexandre-Franco, M.; Lez, C.F.N.; As-Garcí, A.M.; Mez-Serrano, V.G. Electrical conductivity of activated carbon-metal oxide nanocomposites under compression: A comparison study. Phys. Chem. Chem. Phys. 2014, 16, 25161. [Google Scholar] [CrossRef]
- Patil, K.S.; Lund, R.C. Formation and Growth of Humins via Aldol Addition and Condensation during Acid-Catalyzed Conversion of 5-Hydroxymethylfurfural. Energy Fuels 2011, 25, 4745–4755. [Google Scholar] [CrossRef]
- Lu, X.; Pellechia, P.J.; Flora, J.R.V.; Berge, N.D. Influence of reaction time and temperature on product formation and characteristics associated with the hydrothermal carbonization of cellulose. Bioresour. Technol. 2013, 138, 180–190. [Google Scholar] [CrossRef] [PubMed]
- Kim, D.; Lee, K.; Park, K.Y. Upgrading the characteristics of biochar from cellulose, lignin, and xylan for solid biofuel production from biomass by hydrothermal carbonization. J. Ind. Eng. Chem. 2016, 42, 95–100. [Google Scholar] [CrossRef]
- Liu, Z.; Quek, A.; Parshetti, G.; Jain, A.; Srinivasan, M.P.; Hoekman, S.K.; Balasubramanian, R. A study of nitrogen conversion and polycyclic aromatic hydrocarbon (PAH) emissions during hydrochar-lignite co-pyrolysis. Appl. Energy 2013, 108, 74–81. [Google Scholar] [CrossRef]
- Chen, W.H.; Ye, S.C.; Sheen, H.K. Hydrothermal carbonization of sugarcane bagasse via wet torrefaction in association with microwave heating. Bioresour. Technol. 2012, 118, 195–203. [Google Scholar] [CrossRef] [PubMed]
- Fuertes, A.B.; Arbestain, M.C.; Sevilla, M.; MacIá-Agulló, J.A.; Fiol, S.; López, R.; Smernik, R.J.; Aitkenhead, W.P.; Arce, F.; MacIas, F. Chemical and structural properties of carbonaceous products obtained by pyrolysis and hydrothermal carbonisation of corn stover. Aust. J. Soil Res. 2010, 48, 618–626. [Google Scholar] [CrossRef]
- Bridgwater, A.V. Review of fast pyrolysis of biomass and product upgrading. Biomass Bioenergy 2012, 38, 68–94. [Google Scholar] [CrossRef]
- Hoekman, S.K.; Broch, A.; Robbins, C.; Zielinska, B.; Felix, L. Hydrothermal carbonization (HTC) of selected woody and herbaceous biomass feedstocks. Biomass Convers. Biorefinery 2013, 3, 113–126. [Google Scholar] [CrossRef]
- Antal, M.J.; Mok, W.S.L.; Richards, G.N. Mechanism of formation of 5-(hydroxymethyl)-2-furaldehyde from d-fructose and sucrose. Carbohydr. Res. 1990, 199, 91–109. [Google Scholar] [CrossRef]
- Zhang, F.S.; Itoh, H. Extraction of metals from municipal solid waste incinerator fly ash by hydrothermal process. J. Hazard. Mater. 2006, 136, 663–670. [Google Scholar] [CrossRef] [PubMed]
- Hoekman, S.K.; Broch, A.; Robbins, C. Hydrothermal carbonization (HTC) of lignocellulosic biomass. Energy Fuels 2011, 25, 1802–1810. [Google Scholar] [CrossRef]
- Jin, F.; Zhou, Z.; Moriya, T.; Kishida, H.; Higashijima, H.; Enomoto, H. Controlling hydrothermal reaction pathways to improve acetic acid production from carbohydrate biomass. Environ. Sci. Technol. 2005, 39, 1893–1902. [Google Scholar] [CrossRef] [PubMed]
- Asghari, F.S.; Yoshida, H. Kinetics of the decomposition of fructose catalyzed by hydrochloric acid in subcritical water: Formation of 5-hydroxymethylfurfural, levulinic, and formic acids. Ind. Eng. Chem. Res. 2007, 46, 7703–7710. [Google Scholar] [CrossRef]
- Ghimbeu, C.M.; Gadiou, R.; Dentzer, J.; Schwartz, D.; Vix-Guterl, C. Influence of Surface Chemistry on the Adsorption of Oxygenated Hydrocarbons on Activated Carbons. Langmuir 2010, 26, 18824–18833. [Google Scholar] [CrossRef]
- Yu, Q.Z.; Brage, C.; Chen, G.X.; Sjöström, K. The fate of fuel-nitrogen during gasification of biomass in a pressurised fluidised bed gasifier. Fuel 2007, 86, 611–618. [Google Scholar] [CrossRef]
- Simsir, H.; Eltugral, N.; Karagoz, S. Hydrothermal carbonization for the preparation of hydrochars from glucose, cellulose, chitin, chitosan and wood chips via low-temperature and their characterization. Bioresour. Technol. 2017, 246, 82–87. [Google Scholar] [CrossRef] [PubMed]
- Rao, A.R.; Gur, I.S.; Bhatnagar, H.L. Thermal studies on cellobiose and cellobiose halobenzoates. Thermochim. Acta 1987, 117, 139–155. [Google Scholar] [CrossRef]
- Shafizadeh, F.; Lai, Y.Z. Thermal rearrangements of cellobiose and trehalose. Carbohydr. Res. 1973, 31, 57–67. [Google Scholar] [CrossRef]
- Spigno, G.; Pizzorno, T.; de Faveri, D.M. Cellulose and hemicelluloses recovery from grape stalks. Bioresour. Technol. 2008, 99, 4329–4337. [Google Scholar] [CrossRef]
- Kruse, A.; Zevaco, T. Properties of Hydrochar as Function of Feedstock, Reaction Conditions and Post-Treatment. Energies 2018, 11, 674. [Google Scholar] [CrossRef]
- Sevilla, M.; Fuertes, A.B. Graphitic carbon nanostructures from cellulose. Chem. Phys. Lett. 2010, 490, 63–68. [Google Scholar] [CrossRef]
- Liu, W.; Jiang, H.; Yu, H. Development of Biochar-Based Functional Materials : Toward a Sustainable Platform Carbon Material. Chem. Rev. 2015, 115, 12251–12285. [Google Scholar] [CrossRef]
- Biniak, S.; Pakula, M.; Radovic, L.R.; Swiatkowski, A. Chemistry and Physics of Carbon; Marcel Dekker, Inc.: New York, NY, USA, 2001. [Google Scholar]
- Radeke, K.H.; Backhaus, K.O.; Swiatkowski, A. Electrical conductivity of activated carbons. Carbon 1991, 29, 122–123. [Google Scholar] [CrossRef]
- Holm, R. Electric Contacts; Springer: Berlin/Heidelberg, Gearmany, 1967. [Google Scholar]
- Pantea, D.; Darmstadt, H.; Kaliaguine, S.; Sümmchen, L.; Roy, C. Electrical conductivity of thermal carbon blacks: Influence of surface chemistry. Carbon 2001, 39, 1147–1158. [Google Scholar] [CrossRef]
- Sánchez-González, J.; MacÍas-García, A.; Alexandre-Franco, M.F.; Gómez-Serrano, V. Electrical conductivity of carbon blacks under compression. Carbon 2005, 43, 741–747. [Google Scholar] [CrossRef]
- Marinho, B.; Ghislandi, M.; Tkalya, E.; Koning, C.E.; de With, G. Electrical conductivity of compacts of graphene, multi-wall carbon nanotubes, carbon black, and graphite powder. Powder Technol. 2012, 221, 351–358. [Google Scholar] [CrossRef]
- Riley, H.L. The chemistry of solid carbon. J. Soc. Chem. Ind. 1939, 58, 391–398. [Google Scholar] [CrossRef]
- Adinaveen, T.; Vijaya, J.J.; Kennedy, L.J. Comparative Study of Electrical Conductivity on Activated Carbons Prepared from Various Cellulose Materials. Arab. J. Sci. Eng. 2016, 41, 55–65. [Google Scholar] [CrossRef]
- Rutherford, D.W.; Wershaw, R.L.; Rostad, C.E.; Kelly, C.N. Effect of formation conditions on biochars: Compositional and structural properties of cellulose, lignin, and pine biochars. Biomass Bioenergy 2012, 46, 693–701. [Google Scholar] [CrossRef]
- Sevilla, M.; Fuertes, A.B. The production of carbon materials by hydrothermal carbonization of cellulose. Carbon 2009, 47, 2281–2289. [Google Scholar] [CrossRef]
- Holm, R. Electric Contacts: Theory and Applications, 4th ed.; Springer: Berlin/Heidelberg, Germany; New York, NY, USA, 2000. [Google Scholar]
- Garlapalli, R.K.; Wirth, B.; Reza, M.T. Pyrolysis of hydrochar from digestate: Effect of hydrothermal carbonization and pyrolysis temperatures on pyrochar formation. Bioresour. Technol. 2016, 220, 168–174. [Google Scholar] [CrossRef]
- Kang, S.; Pan, J.; Gu, G.; Wang, C.; Wang, Z.; Tan, J.; Liu, G.; Kang, S.; Pan, J.; Gu, G.; et al. Sequential Production of Levulinic Acid and Porous Carbon Material from Cellulose. Materials 2018, 11, 1408. [Google Scholar] [CrossRef] [PubMed]
- Qi, L.; Tang, X.; Wang, Z.; Peng, X. Pore characterization of different types of coal from coal and gas outburst disaster sites using low temperature nitrogen adsorption approach. Int. J. Min. Sci. Technol. 2017, 27, 371–377. [Google Scholar]
- Rouquerol, F.; Rouquerol, J.; Sing, K.S.W. Adsorption by Powders and Porous Solids, 2nd ed.; Elsevier: Oxford, UK, 2014. [Google Scholar]
- Dieguez-Alonso, A.; Funke, A.; Anca-Couce, A.; Rombolà, A.; Ojeda, G.; Bachmann, J.; Behrendt, F. Towards Biochar and Hydrochar Engineering—Influence of Process Conditions on Surface Physical and Chemical Properties, Thermal Stability, Nutrient Availability, Toxicity and Wettability. Energies 2018, 11, 496. [Google Scholar] [CrossRef]
- Raymundo-Piñero, E.; Cadek, M.; Béguin, F. Tuning carbon materials for supercapacitors by direct pyrolysis of seaweeds. Adv. Funct. Mater. 2009, 19, 1032–1039. [Google Scholar] [CrossRef]
- Gale, T.K.; Fletcher, T.H.; Bartholomew, C.H. Effects of Pyrolysis Conditions on Internal Surface Areas and Densities of Coal Chars Prepared at High Heating Rates in Reactive and Nonreactive Atmospheres. Energ. Fuels 1995, 9, 513–524. [Google Scholar] [CrossRef]
- Lee, J.W.; Kidder, M.; Evans, B.R.; Paik, S.; Buchanan, A.C.; Garten, C.T.; Brown, R.C. Characterization of biochars produced from cornstovers for soil amendment. Environ. Sci. Technol. 2010, 44, 7970–7974. [Google Scholar] [CrossRef]
- Ronsse, F.; van Hecke, S.; Dickinson, D.; Prins, W. Production and characterization of slow pyrolysis biochar : Influence of feedstock type and pyrolysis conditions. GC Bioenergy 2013, 5, 104–115. [Google Scholar] [CrossRef]
- Tang, X.; Ripepi, N.; Engineering, M. Isothermal adsorption kinetics properties of carbon dioxide in crushed coals. Greenh. Gases Sci. Technol. 2016, 274, 260–274. [Google Scholar] [CrossRef]
- Evans, R.; Marconi, U.M.B.; Tarazona, P. Capillary condensation and adsorption in cylindrical and slit-like pores. J. Chem. Soc. Faraday Trans. 1986, 82, 1763. [Google Scholar] [CrossRef]
- Sevilla, M.; Fuertes, A.B. Easy synthesis of graphitic carbon nanocoils from saccharides. Mater. Chem. Phys 2009, 113, 208–214. [Google Scholar] [CrossRef]
- Kaklidis, N.; Kyriakou, V.; Garagounis, I.; Arenillas, A.; Menéndez, J.A.; Marnellos, G.E.; Konsolakis, M. Effect of carbon type on the performance of a direct or hybrid carbon solid oxide fuel cell. RSC Adv. 2014, 4, 18792–18800. [Google Scholar] [CrossRef]
- Kotz, R.; Carlen, M.; Kötz, R.; Kötz, R.; Carlen, M.; Carlen, M. Principles and applications of electrochemical capacitors. Electrochim. Acta 2000, 45, 2483–2498. [Google Scholar] [CrossRef]
- Elleuch, A.; Boussetta, A.; Halouani, K.; Li, Y. Experimental investigation of Direct Carbon Fuel Cell fueled by almond shell biochar: Part II. Improvement of cell stability and performance by a three-layer planar configuration. Int. J. Hydrog. Energy 2013, 38, 16605–16614. [Google Scholar] [CrossRef]
- Yu, J.; Zhao, Y.; Li, Y. Utilization of corn cob biochar in a direct carbon fuel cell. J. Power Sources 2014, 270, 312–317. [Google Scholar] [CrossRef]
- Eom, S.; Ahn, S.; Rhie, Y.; Kang, K.; Sung, Y.; Moon, C.; Choi, G.; Kim, D. Influence of devolatilized gases composition from raw coal fuel in the lab scale DCFC (direct carbon fuel cell) system. Energy 2014, 74, 734–740. [Google Scholar] [CrossRef]
- Cao, D.; Wang, G.; Wang, C.; Wang, J.; Lu, T. Enhancement of electrooxidation activity of activated carbon for direct carbon fuel cell. Int. J. Hydrog. Energy 2010, 35, 1778–1782. [Google Scholar] [CrossRef]
- Pantea, D.; Darmstadt, H.; Kaliaguine, S.; Roy, C. Electrical conductivity of conductive carbon blacks: Influence of surface chemistry and topology. Appl. Surf. Sci. 2003, 217, 181–193. [Google Scholar] [CrossRef]
- Su, F.; Tian, Z.; Poh, C.K.; Wang, Z.; Lim, S.H.; Liu, Z.; Lin, J. Pt Nanoparticles Supported on Nitrogen-Doped Porous Carbon Nanospheres as an Electrocatalyst for Fuel Cells. Chem. Mater. 2010, 22, 832–839. [Google Scholar] [CrossRef]
- Lota, G.; Grzyb, B.; Machnikowska, H.; Machnikowski, J.; Frackowiak, E. Effect of nitrogen in carbon electrode on the supercapacitor performance. Chem. Phys. Lett. 2005, 404, 53–58. [Google Scholar] [CrossRef]
- Liu, J.; Deng, Y.; Li, X.; Wang, L. Promising Nitrogen-Rich Porous Carbons Derived from One-Step Calcium Chloride Activation of Biomass-Based Waste for High Performance Supercapacitors. ACS Sustain. Chem. Eng. 2016, 4, 177–187. [Google Scholar] [CrossRef]
- Chien, A.C.; Arenillas, A.; Jiang, C.; Irvine, J.T.S. Performance of Direct Carbon Fuel Cells Operated on Coal and Effect of Operation Mode. J. Electrochem. Soc. 2014, 161, F588–F593. [Google Scholar] [CrossRef]
- Mizusaki, J.; Tagawa, H.; Tsuneyoshi, K.; Sawata, A. Reaction Kinetics and Microstructure of the Solid Oxide Fuel Cells Air Electrode La0.6Ca0.4MnO3/YSZ. J. Electrochem. Soc. 1991, 138, 1867–1873. [Google Scholar] [CrossRef]
- Rhie, Y.; Eom, S.; Ahn, S.; Choi, G.; Kim, D. Effect of thermal decomposition products of coal on anodic reactions in direct carbon fuel cells. J. Mech. Sci. Technol. 2014, 28, 3807–3812. [Google Scholar] [CrossRef]
- Konsolakis, M.; Kaklidis, N.; Marnellos, G.E.; Zaharaki, D.; Komnitsas, K. Assessment of biochar as feedstock in a direct carbon solid oxide fuel cell. RSC Adv. 2015, 5, 73399–73409. [Google Scholar] [CrossRef]
- Ju, H.; Eom, J.; Lee, J.K.; Choi, H.; Lim, T.H.; Song, R.H.; Lee, J. Durable power performance of a direct ash-free coal fuel cell. Electrochim. Acta 2014, 115, 511–517. [Google Scholar] [CrossRef]
- Su, Y.; Wu, F.; Bao, L.; Yang, Z. RuO2/activated carbon composites as a positive electrode in an alkaline electrochemical capacitor. New Carbon Mater. 2007, 22, 4–9. [Google Scholar] [CrossRef]
- He, P.; Yang, K.; Wang, W.; Dong, F.; Du, L.; Liu, H. Nanosized Fe3O4-modified activated carbon for supercapacitor electrodes. Russ. J. Electrochem. 2013, 49, 354–358. [Google Scholar] [CrossRef]
- Du, X.; Wang, C.; Chen, M.; Jiao, Y.; Wang, J. Electrochemical Performances of Nanoparticle Fe3O4/Activated Carbon Supercapacitor Using KOH Electrolyte Solution. J. Phys. Chem. C 2009, 113, 2643–2646. [Google Scholar] [CrossRef]
- Wang, J.W.; Chen, Y.; Chen, B.Z. A Synthesis Method of MnO2/Activated Carbon Composite for Electrochemical Supercapacitors. J. Electrochem. Soc. 2015, 162, A1654–A1661. [Google Scholar] [CrossRef]
- Hu, C.C.; Tsou, T.W. Capacitive and textural characteristics of hydrous manganese oxide prepared by anodic deposition. Electrochim. Acta 2002, 47, 3523–3532. [Google Scholar] [CrossRef]
- Wu, Y.; Su, C.; Zhang, C.; Ran, R.; Shao, Z. A new carbon fuel cell with high power output by integrating with in situ catalytic reverse Boudouard reaction. Electrochem. Commun. 2009, 11, 1265–1268. [Google Scholar] [CrossRef]
- Chen, M.; Wang, C.; Niu, X.; Zhao, S.; Tang, J.; Zhu, B. Carbon anode in direct carbon fuel cell. Int. J. Hydrog. Energy 2010, 35, 2732–2736. [Google Scholar] [CrossRef]
- Mrozowski, S. Studies of Carbon Powders Under Compression. In Proceedings of the 3rd Carbon Conference, Buffalo, NY, USA, 17–21 June 1957. [Google Scholar]
- Imasogie, B.I.; Wendt, U. Characterization Of Graphite Particle Shape In Spheroidal Graphite Iron Using A Computer-Based Image Analyzer. J. Miner. Mater. Charact. Eng. 2015, 3. [Google Scholar] [CrossRef]
- Kinoshita, K. Carbon: Electrochemical and physicochemical properties. J. Am. Chem. Soc. 1988, 110, 541. [Google Scholar]
- Qian, K.; Kumar, A.; Zhang, H.; Bellmer, D.; Huhnke, R. Recent advances in utilization of biochar. Renew. Sustain. Energy Rev. 2015, 42, 1055–1064. [Google Scholar] [CrossRef]


| Process Temperature | Reaction Time |
|---|---|
| 220 °C | 120 min |
| 300 min | |
| 240 °C | 60 min |
| 300 min | |
| 260 °C | 60 min |
| 300 min |
| Sample Type | HTC | Pyrolysis (°C) | Elemental Analysis (Dry Basis, Ash Free) (wt.%) | Char Yield (wt.%) | C-YieldTotal ** (%) | pH Process Water | ||||
|---|---|---|---|---|---|---|---|---|---|---|
| Temperature (°C) | Time (min) | N | C | H | O | |||||
| BM | Cellulose | 0 | 42.8 | 6.2 | 51.1 | - | ||||
| HC | 220 | 120 | 0 | 64.3 | 4.2 | 31.5 | 45 | 67.8 | 1.8 | |
| HC | 220 | 300 | 0 | 67.4 | 4.0 | 28.7 | 45 | 70.9 | 1.9 | |
| HC | 240 | 60 | 0 | 67.9 | 4.0 | 28.2 | 45 | 71.4 | 1.8 | |
| HC | 240 | 300 | 0 | 68.8 | 4.0 | 27.2 | 46 | 73.3 | 2.2 | |
| HC | 260 | 60 | 0 | 69.0 | 4.0 | 27.0 | 46 | 73.7 | 2.0 | |
| HC | 260 | 300 | 0 | 70.4 | 4.2 | 25.4 | 45 | 74.5 | 2.2 | |
| BC | Cellulose * | 900 | 0 | 94.9 | 0.5 | 4.6 | 24 | 52.1 | ||
| PHC | 220 | 300 | 900 | 0 | 94.8 | 0.4 | 4.9 | 25 | 55.2 | |
| PHC | 240 | 300 | 900 | 0 | 94.7 | 0.4 | 4.9 | 26 | 57.5 | |
| PHC | 260 | 300 | 900 | 0 | 95.2 | 0.5 | 4.3 | 27 | 59.4 | |
| BM | Pomace | 1.8 | 54.0 | 5.8 | 38.4 | - | ||||
| HC | 220 | 120 | 1.7 | 65.4 | 5.4 | 27.5 | 56 | 68.0 | 4.1 | |
| HC | 220 | 300 | 2.1 | 67.8 | 5.4 | 24.7 | 52 | 65.9 | 4.4 | |
| HC | 240 | 60 | 2.0 | 67.9 | 5.4 | 24.7 | 52 | 65.3 | 4.4 | |
| HC | 240 | 300 | 2.2 | 70.6 | 5.4 | 21.9 | 49 | 64.6 | 4.9 | |
| HC | 260 | 60 | 2.2 | 71.2 | 5.6 | 21.1 | 49 | 64.0 | 4.9 | |
| HC | 260 | 300 | 2.3 | 72.6 | 5.6 | 19.6 | 47 | 62.7 | 5.1 | |
| BC | Pomace * | 900 | 2.3 | 92.6 | 0.8 | 4.2 | 33 | 56.2 | ||
| PHC | 220 | 300 | 900 | 2.5 | 88.8 | 0.7 | 7.9 | 26 | 42.4 | |
| PHC | 240 | 300 | 900 | 2.7 | 88.7 | 0.5 | 8.1 | 26 | 42.6 | |
| PHC | 260 | 300 | 900 | 2.7 | 88.0 | 0.9 | 8.4 | 26 | 41.8 | |
| BM | Pruning | 0.8 | 48.6 | 6.0 | 44.6 | - | ||||
| HC | 220 | 120 | 1.0 | 60.2 | 5.5 | 33.4 | 61 | 75.8 | 3.7 | |
| HC | 220 | 300 | 1.0 | 63.7 | 5.4 | 29.9 | 55 | 71.9 | 3.7 | |
| HC | 240 | 60 | 1.2 | 64.7 | 5.4 | 28.8 | 52 | 69.0 | 3.7 | |
| HC | 240 | 300 | 1.1 | 65.1 | 5.4 | 28.4 | 47 | 62.3 | 3.8 | |
| HC | 260 | 60 | 1.1 | 70.3 | 5.1 | 23.3 | 44 | 64.2 | 3.7 | |
| HC | 260 | 300 | 1.4 | 72.1 | 5.0 | 21.5 | 43 | 64.2 | 3.9 | |
| BC | Pruning * | 900 | 1.4 | 85.5 | 0.9 | 12.3 | 28 | 49.3 | ||
| PHC | 220 | 300 | 900 | 1.4 | 90.6 | 0.5 | 7.6 | 25 | 47.4 | |
| PHC | 240 | 300 | 900 | 1.5 | 91.3 | 0.7 | 6.6 | 25 | 47.5 | |
| PHC | 260 | 300 | 900 | 1.4 | 91.2 | 0.6 | 6.7 | 25 | 46.3 | |
| Sample Type | HTC | Pyrolysis | Cellulose | Pomace | Pruning | ||||||
|---|---|---|---|---|---|---|---|---|---|---|---|
| Temperature (°C) | Time (min) | Temperature (°C) | FC | VM | FC | VM | AC | FC | VM | AC | |
| BM * | Feedstock | 24 | 77 | 33 | 67 | 5.1 | 28 | 72 | 2.7 | ||
| HC | 220 | 120 | - | 51 | 49 | 47 | 53 | 1.5 | 42 | 58 | 1.7 |
| HC | 220 | 300 | - | 55 | 45 | 49 | 51 | 1.5 | 46 | 54 | 1.8 |
| HC | 240 | 60 | - | 55 | 45 | 50 | 50 | 1.7 | 47 | 53 | 1.9 |
| HC | 240 | 300 | - | 57 | 43 | 52 | 48 | 1.8 | 54 | 46 | 1.9 |
| HC | 260 | 60 | - | 57 | 43 | 53 | 47 | 1.8 | 54 | 46 | 1.9 |
| HC | 260 | 300 | - | 59 | 41 | 55 | 45 | 1.8 | 57 | 43 | 2.0 |
| BC | Feedstock | 900 | 100 | 0 | 84 | 0 | 15.7 | 90 | 0 | 9.6 | |
| PHC | 220 | 300 | 900 | 100 | 0 | 97 | 0 | 3.1 | 96 | 0 | 3.8 |
| PHC | 240 | 300 | 900 | 100 | 0 | 97 | 0 | 3.4 | 97 | 0 | 3.5 |
| PHC | 260 | 300 | 900 | 100 | 0 | 97 | 0 | 3.3 | 97 | 0 | 3.4 |
| Sample | EC (S m−1) | (kg m−3) |
|---|---|---|
| Cellulose | 0 | n.d. |
| HTC-220-120-Cel | 0 | 0.54 |
| HTC-220-300-Cel | 0 | 0.43 |
| HTC-240-60-Cel | 0 | 0.43 |
| HTC-240-300-Cel | 0 | 0.42 |
| HTC-260-60-Cel | 0 | 0.41 |
| HTC-260-300-Cel | 0 | 0.42 |
| P900-Cel | 51 | 0.38 |
| HTC-220-120-P900-Cel | 179 | 0.51 |
| HTC-220-300-P900-Cel | 160 | 0.41 |
| HTC-240-60-P900-Cel | 94 | 0.38 |
| HTC-240-300-P900-Cel | 88 | 0.38 |
| HTC-260-60-P900-Cel | 59 | 0.35 |
| HTC-260-300-P900-Cel | 67 | 0.35 |
| Pruning | 0 | n.d. |
| HTC-220-120-Prun | 0 | 0.48 |
| HTC-220-300-Prun | 0 | 0.48 |
| HTC-240-60-Prun | 0 | 0.49 |
| HTC-240-300-Prun | 0 | 0.48 |
| HTC-260-60-Prun | 0 | 0.50 |
| HTC-260-300-Prun | 0 | 0.49 |
| P900-Prun | 56 | 0.45 |
| HTC-220-120-P900-Prun | 69 | 0.44 |
| HTC-220-300-P900-Prun | 100 | 0.47 |
| HTC-240-60-P900-Prun | 90 | 0.43 |
| HTC-240-300-P900-Prun | 52 | 0.44 |
| HTC-260-60-P900-Prun | 81 | 0.46 |
| HTC-260-300-P900-Prun | 80 | 0.46 |
| Sample Type | Adsorbate | CO2 | N2 |
|---|---|---|---|
| BET SSA | (m2 g−1) | (m2 g−1) | |
| BM | Cellulose | n.d. | ~1.1 [43] |
| HC | HTC-240-60-Cel | n.d. | 19 |
| HC | HTC-240-300-Cel | 171 | 23 |
| BC | P900-Cel | 711 | 111 |
| PHC | HTC-220-120-P900-Cel | n.d. | 416 |
| PHC | HTC-220-300-P900-Cel | n.d. | 399 |
| PHC | HTC-240-60-P900-Cel | 393 | 415 |
| PHC | HTC-240-300-P900-Cel | n.d. | 360 |
| PHC | HTC-260-60-P900-Cel | n.d. | 441 |
| PHC | HTC-260-300-P900-Cel | n.d. | 319 |
| BM | Pruning | n.d. | ~1 |
| HC | HTC-240-60-Prun | n.d. | 22 |
| HC | HTC-240-300-Prun | 295 | 23 |
| BC | P900-Prun | 414 | 25 |
| PHC | HTC-240-60-P900-Prun | 398 | 43 |
| PHC | HTC-240-300-P900-Prun | n.d. | 73 |
© 2019 by the authors. Licensee MDPI, Basel, Switzerland. This article is an open access article distributed under the terms and conditions of the Creative Commons Attribution (CC BY) license (http://creativecommons.org/licenses/by/4.0/).
Share and Cite
Hoffmann, V.; Jung, D.; Zimmermann, J.; Rodriguez Correa, C.; Elleuch, A.; Halouani, K.; Kruse, A. Conductive Carbon Materials from the Hydrothermal Carbonization of Vineyard Residues for the Application in Electrochemical Double-Layer Capacitors (EDLCs) and Direct Carbon Fuel Cells (DCFCs). Materials 2019, 12, 1703. https://doi.org/10.3390/ma12101703
Hoffmann V, Jung D, Zimmermann J, Rodriguez Correa C, Elleuch A, Halouani K, Kruse A. Conductive Carbon Materials from the Hydrothermal Carbonization of Vineyard Residues for the Application in Electrochemical Double-Layer Capacitors (EDLCs) and Direct Carbon Fuel Cells (DCFCs). Materials. 2019; 12(10):1703. https://doi.org/10.3390/ma12101703
Chicago/Turabian StyleHoffmann, Viola, Dennis Jung, Joscha Zimmermann, Catalina Rodriguez Correa, Amal Elleuch, Kamel Halouani, and Andrea Kruse. 2019. "Conductive Carbon Materials from the Hydrothermal Carbonization of Vineyard Residues for the Application in Electrochemical Double-Layer Capacitors (EDLCs) and Direct Carbon Fuel Cells (DCFCs)" Materials 12, no. 10: 1703. https://doi.org/10.3390/ma12101703
APA StyleHoffmann, V., Jung, D., Zimmermann, J., Rodriguez Correa, C., Elleuch, A., Halouani, K., & Kruse, A. (2019). Conductive Carbon Materials from the Hydrothermal Carbonization of Vineyard Residues for the Application in Electrochemical Double-Layer Capacitors (EDLCs) and Direct Carbon Fuel Cells (DCFCs). Materials, 12(10), 1703. https://doi.org/10.3390/ma12101703