1. Introduction
Metallic glasses (MGs), discovered in 1960 [
1], are metallic bonded amorphous solids with no long-range translation/orientation order, formed by quenching from melt. Short-range topological and chemical orders on a length scale of 0.5–1 nm are often detected in MGs. More than two decades ago, multicomponent bulk metallic glass-forming alloys were synthesized [
2,
3,
4,
5,
6,
7,
8,
9]. Zirconium (Zr)-based MGs exhibit good glass-forming ability [
2,
7,
8] and many outstanding properties such as high elastic limits, strength, and corrosion resistance [
10,
11,
12,
13,
14,
15,
16]. Lacking a crystalline structure with dislocations, the mechanical deformation of MGs in tension is concentrated in a single or a few shear bands (SBs). Even though quite large ductility can be observed under constrained loading, such as in compression, tensile strain leads to catastrophic failure without plasticity, which restricts the potential application of MGs as structural materials [
17,
18].
Considerable efforts were devoted to improving the ductility of MGs. Creating more free volume and limiting the propagation of SBs are two key issues to improve tensile plasticity of MGs [
19,
20]. Recently, nano-structured glasses (nanoglasses), which are amorphous solids consisting of nanometer-sized glassy regions connected by a glass/glass interface, were reported [
21,
22,
23]. Such glasses could have the following features: (1) denser glassy particles could hinder the propagation of SBs, acting as a second-phase strengthening mechanism; (2) an enhanced free volume, due to the misfit between the atoms at the boundaries between glassy particles, could offer more sites for a deformation-induced shear transformation zone (STZ), leading to the formation of more small SBs [
21]. Computation simulations suggest that the heterogeneous free volume presented in the “glass-in-glass” structure could toughen the material and increase its ductility [
24,
25,
26]. Nanoglasses exhibit unique atomic structure [
21], electronic structure, thermal stability [
27], and mechanical behavior [
28]. Several methods were developed to produce the nanoscale heterogeneous MGs, including inert-gas condensation [
21], severe plastic deformation [
21], and magnetron sputtering [
23]. In our previous investigation of the effect of the Co concentration on the structural and mechanical properties of a series of Zr-based MGs, a concentration was found, Zr
55.7Ni
10Al
7Cu
19Co
8.3, which exhibited a high elastic strain limit and ductility in compression. The alloy exhibited nanoscale structural inhomogeneity resembling a phase separation, which could originate from the positive enthalpy of mixing of Cu and Co (∆H(Cu-Co) = +6 kJ/mol) [
28]. However, its tensile plasticity is still poor, which needs to be improved if the material is to be used for industrial applications.
Compared with the matrix, SBs have dilated structure and less density. Previous studies [
11,
29] demonstrated that SBs induced by mechanical work in MGs lead to a free volume increase and interaction of SBs in the following compression/tension tests, resulting in the enhancement of ductility. High-pressure torsion (HPT) is a severe plastic deformation technique. It can achieve large plastic strain on MGs without material failing due to the geometric confinement [
30,
31]. A high density of SBs with excess free volume can be introduced. While all the HPT investigations with MGs were concerned with homogeneous materials [
32,
33,
34,
35,
36,
37,
38,
39,
40,
41,
42,
43,
44,
45], rare work of HPT testing of heterogeneous MGs is reported. Given the potential contribution of an inhomogeneous structure to the ductility of MGs in tension, we performed a comparative investigation of the HPT effect on the tensile ductility of two Zr-based MGs, Zr
55.7Ni
10Al
7Cu
19Co
8.3 and Zr
64Ni
10Al
7Cu
19. The former exhibits a nanoscale structure and the latter does not. Hereafter, we designate Zr
55.7Ni
10Al
7Cu
19Co
8.3 and Zr
64Ni
10Al
7Cu
19 as Zr-8Co and Zr-0Co, respectively.
2. Materials and Methods
Ingots with compositions of Zr64Ni10Al7Cu19 and Zr55.7Ni10Al7Cu19Co8.3 were prepared by alloying the pure elements in an arc melter in a high-purity Ar atmosphere. Large-scale homogeneity of the ingots was facilitated by remelting them five times and was verified by energy-dispersive X-ray spectroscopy analysis (Leo-1550, ZEISS, Oberkochen, Germany). Glassy materials were obtained by suction casting in a water-cooled copper mold with a circular shape 10 mm in diameter and 0.8 mm thick. Both sides of the samples were ground using 400, 800, 1200, and 2000 grit SiC papers to 0.5 mm thickness to remove the surface layer. Severe plastic deformation treatments by high-pressure torsion were performed on a custom-built HPT machine (A. Klement, Lang, Austria) under a quasi-hydrostatic pressure of 6 GPa, at room temperature using a rotation speed of 0.2 rpm. The rotation numbers, N, used here were 2, 5, 10, and 20 (N = 2, 5, 10, and 20). The introduced shear strain γ of different positions on the discs can be calculated through γ = 2πNR/h, where h is the thickness of the sample, and R is the distance from the sample center. In order to ensure the same strain history, the materials used for further studies were all cut from the same position on the HPT-treated discs at about 1–2 mm distance from the center.
A differential scanning calorimeter (DSC) (Perkin Elmer Pyris 1, Waltham, MA, USA) was used to analyze the thermal properties of all studied MGs. The heating range was 353–853 K with a heating rate of 20 K/min under argon flow of high purity. Two runs back to back were performed with each sample. Assuming that, after the first run, the sample was in a stable thermal state, the bias heat flow-corrected heat flow signal was obtained by subtracting the heat flow of the second run from that of the first.
Transmission electron microscopy (TEM) (aberration corrected FEI Titan 80/300 operating at 300 kV, Hillsboro, OR, USA) was applied for selected samples to monitor nanometer-scale structural changes in the studied MGs. Electron-transparent TEM specimens were produced by mechanical grinding and polishing followed by low-angle Ar-ion milling. The dark-field images were captured using some part of the first diffraction halo. The structure of all samples before and after HPT was also examined by Cu-Kα radiation X-ray diffraction (XRD) (Siemens D 5005 operating at 40 kV, Munich, Germany). To characterize atomic structures, synchrotron radiation-based XRD measurements using a wavelength of 0.2906 Å at HASYLAB/DESY in Hamburg were carried out for selected samples. After background subtraction and corrections for sample absorption, fluorescence, and Compton scattering, the structure factors S(Q) were obtained from the integrated intensity data.
Nanoindentation measurements (MTS NANO Indenter XP testing system, Oak Ridge, TN, USA) with a Berkovich indenter were performed on the well-polished BMG samples from their center to edge to analyze the hardness change. The maximum displacement was 2000 nm. Each sample was measured at least three times. Tensile testing was performed with a MicroDAC (Kammrath and Weiss) tensile test stage built in a high-resolution field-emission scanning electron microscope (SEM) (Leo-1550, ZEISS, Oberkochen, Germany) allowing in situ observation of the development of SBs and fracture. The as-cast samples and HPT samples (0.4 mm thickness) were polished to a thickness of 0.3 mm and to a mirror finish using SiC papers and diamond paste. In order to obtain reliable results, dog-bone shapes with a standard gauge size of 2 mm × 1 mm were cut from discs at the same position as other measured samples, 1–2 mm from the center, for tensile measurements. The strain rate used was 5 × 10⁻⁵ s−1 until fracture. The load–displacement curves and sample surface images were recorded during the test. It should be noted that, on the load-displacement curve, the initial deformation part is unreliable because of the deformation of the steel sample holder. The accurate elastic strain of MGs should be estimated by directly measuring the sample length change in SEM images during tension. All plastic deformation is localized on the thin dog-bone-shaped samples. Each measurement was performed twice with a different sample of the same preparation.
3. Results
3.1. Thermal Analysis
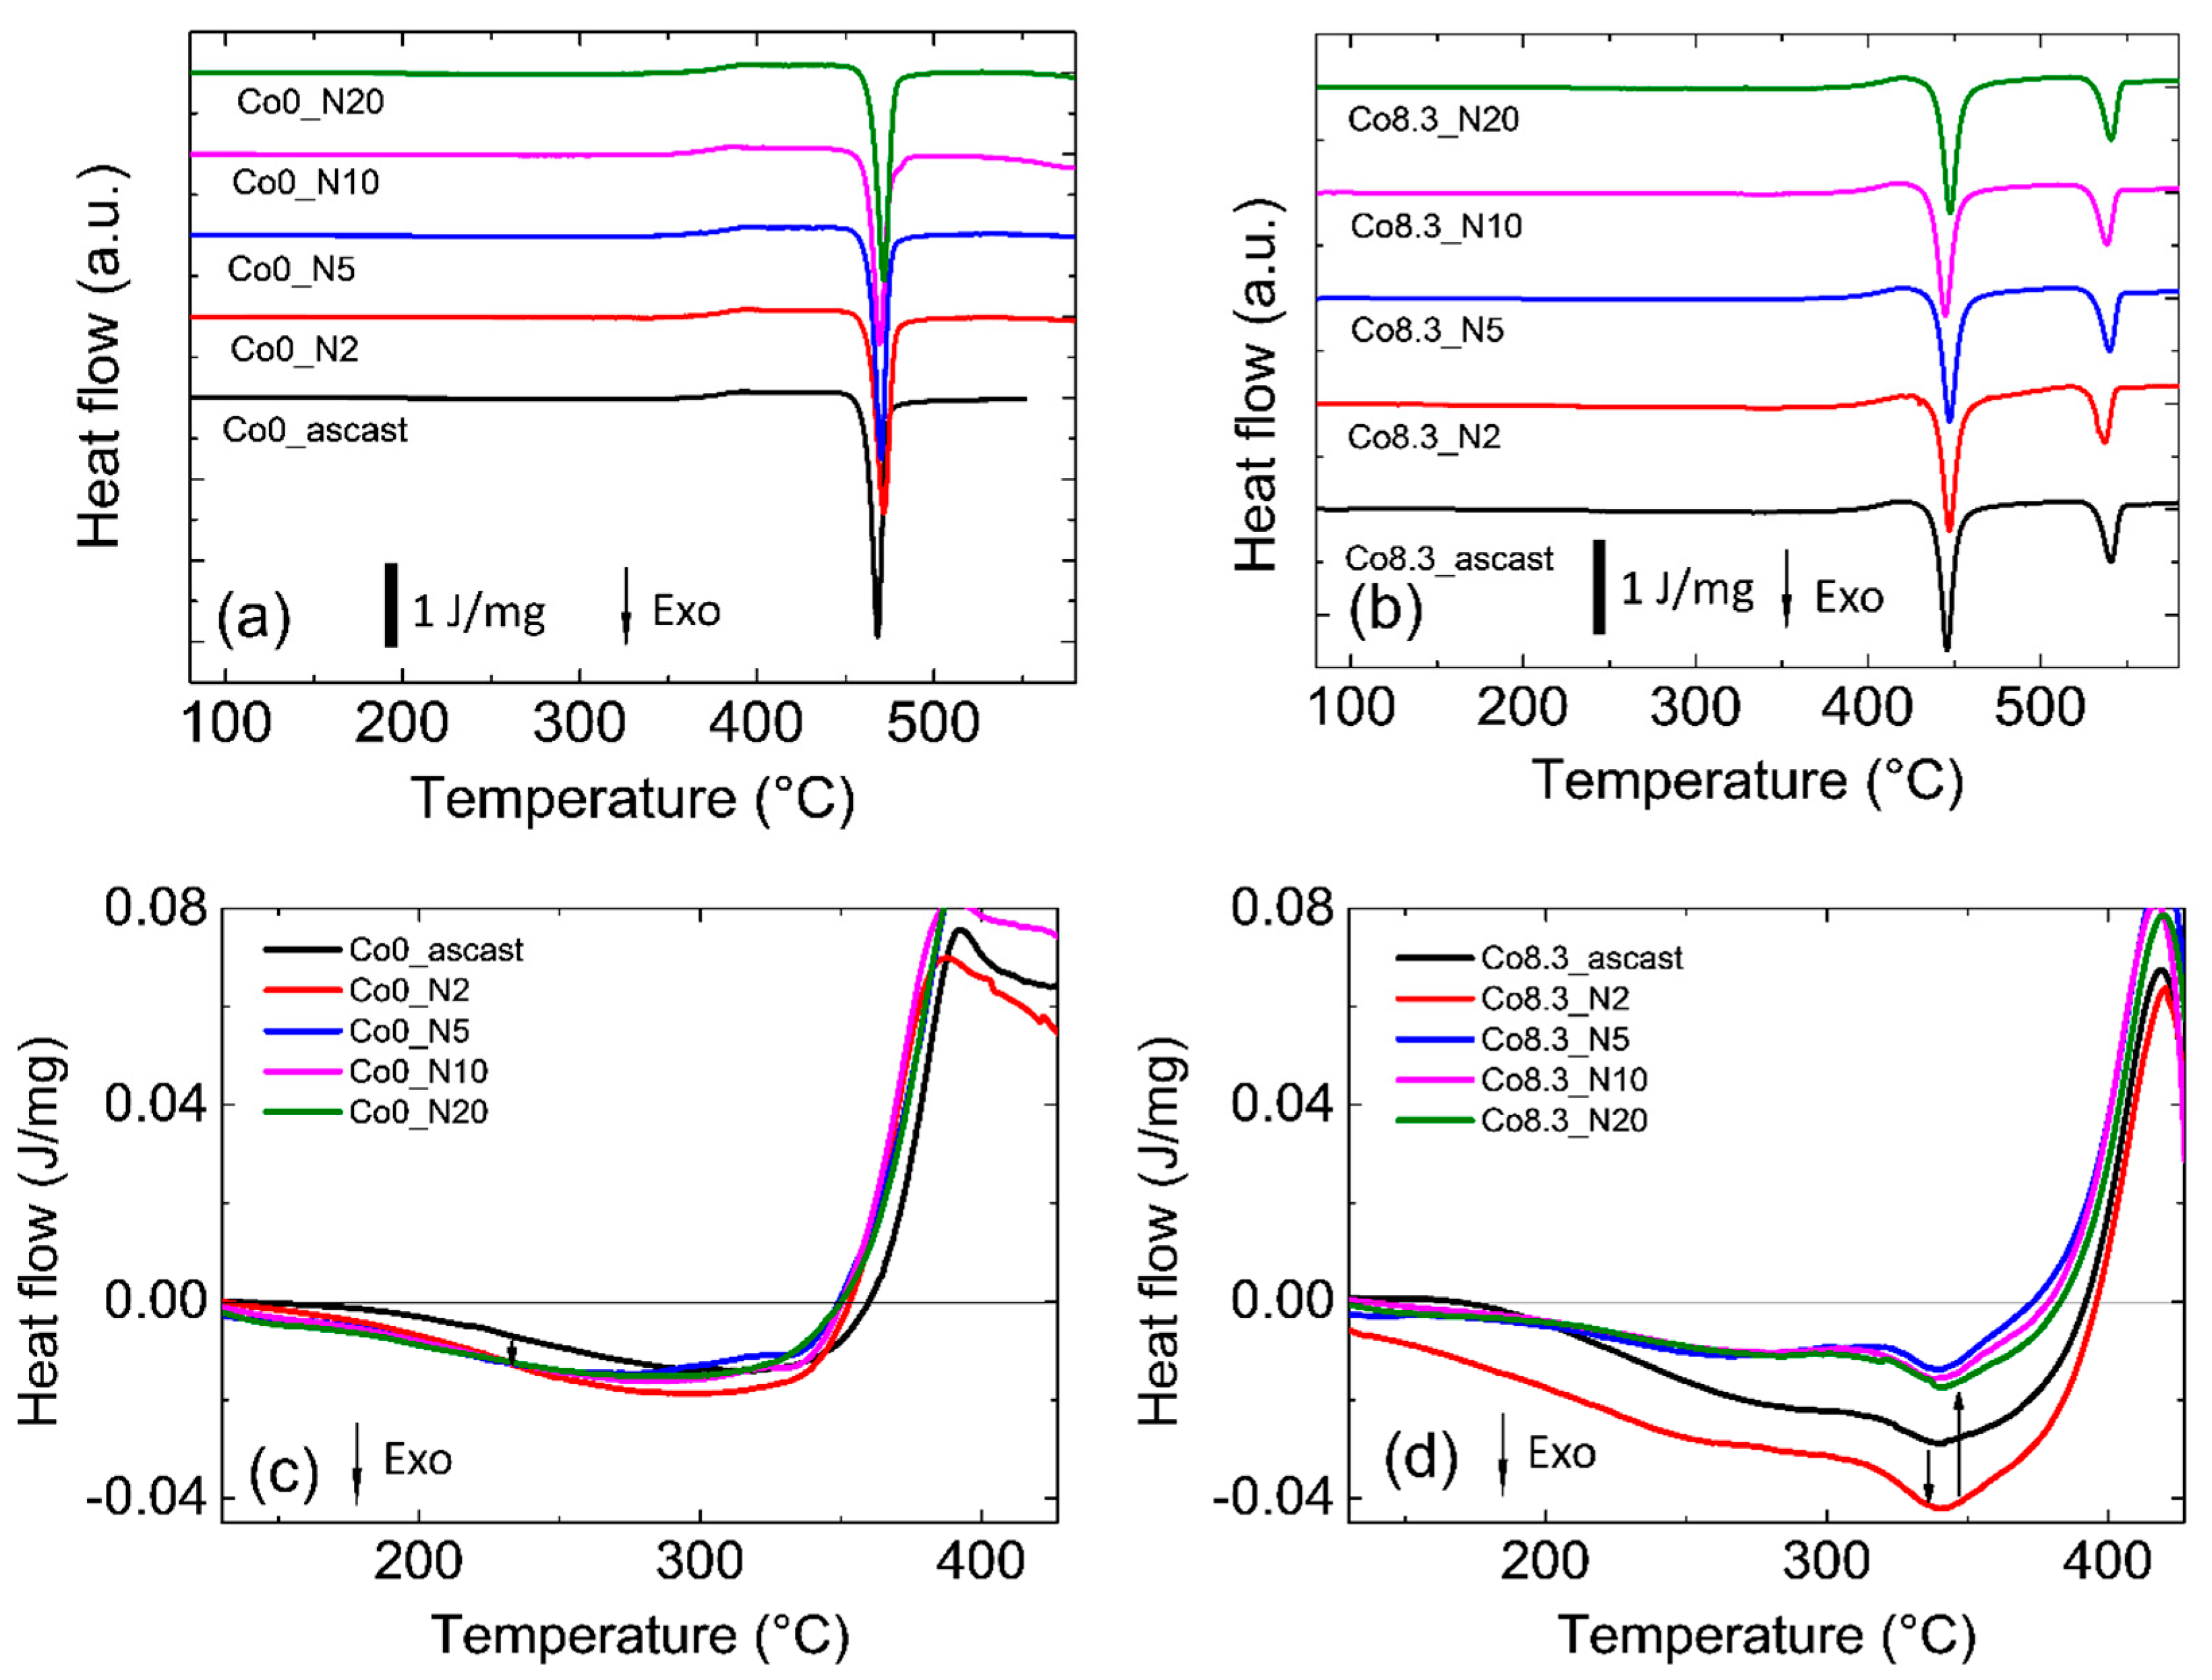
All samples investigated exhibited the typical DSC heat flow curves for amorphous samples with exothermal relaxation followed by glass transition and crystallization (
Figure 1a,b). Zr-0Co MGs have one-step crystallization at temperature T
x1 = 723 K and Zr-8Co MGs have two-step crystallization at lower (701 K) and higher (794 K) temperatures. The main qualitative features were similar for the as-cast and HPT-treated samples. In particular HPT treatment with N = 2, 5, 10, and 20 had no influence on the glass transition and crystallization temperatures within error limits. Principal numbers are shown in
Table 1. Closer inspection of the thermal relaxation behavior before glass transition, shown in
Figure 1c,d, revealed differences between the Zr-0Co and Zr-8Co. Details are listed in
Table 2. It is apparent that, in both glasses, HPT (N = 2) introduced the highest exothermal enthalpy of relaxation. In addition, the enthalpy stored in the Zr-8Co glass was more than twice that introduced in the Zr-0Co glass.
3.2. Microstructure
3.2.1. TEM
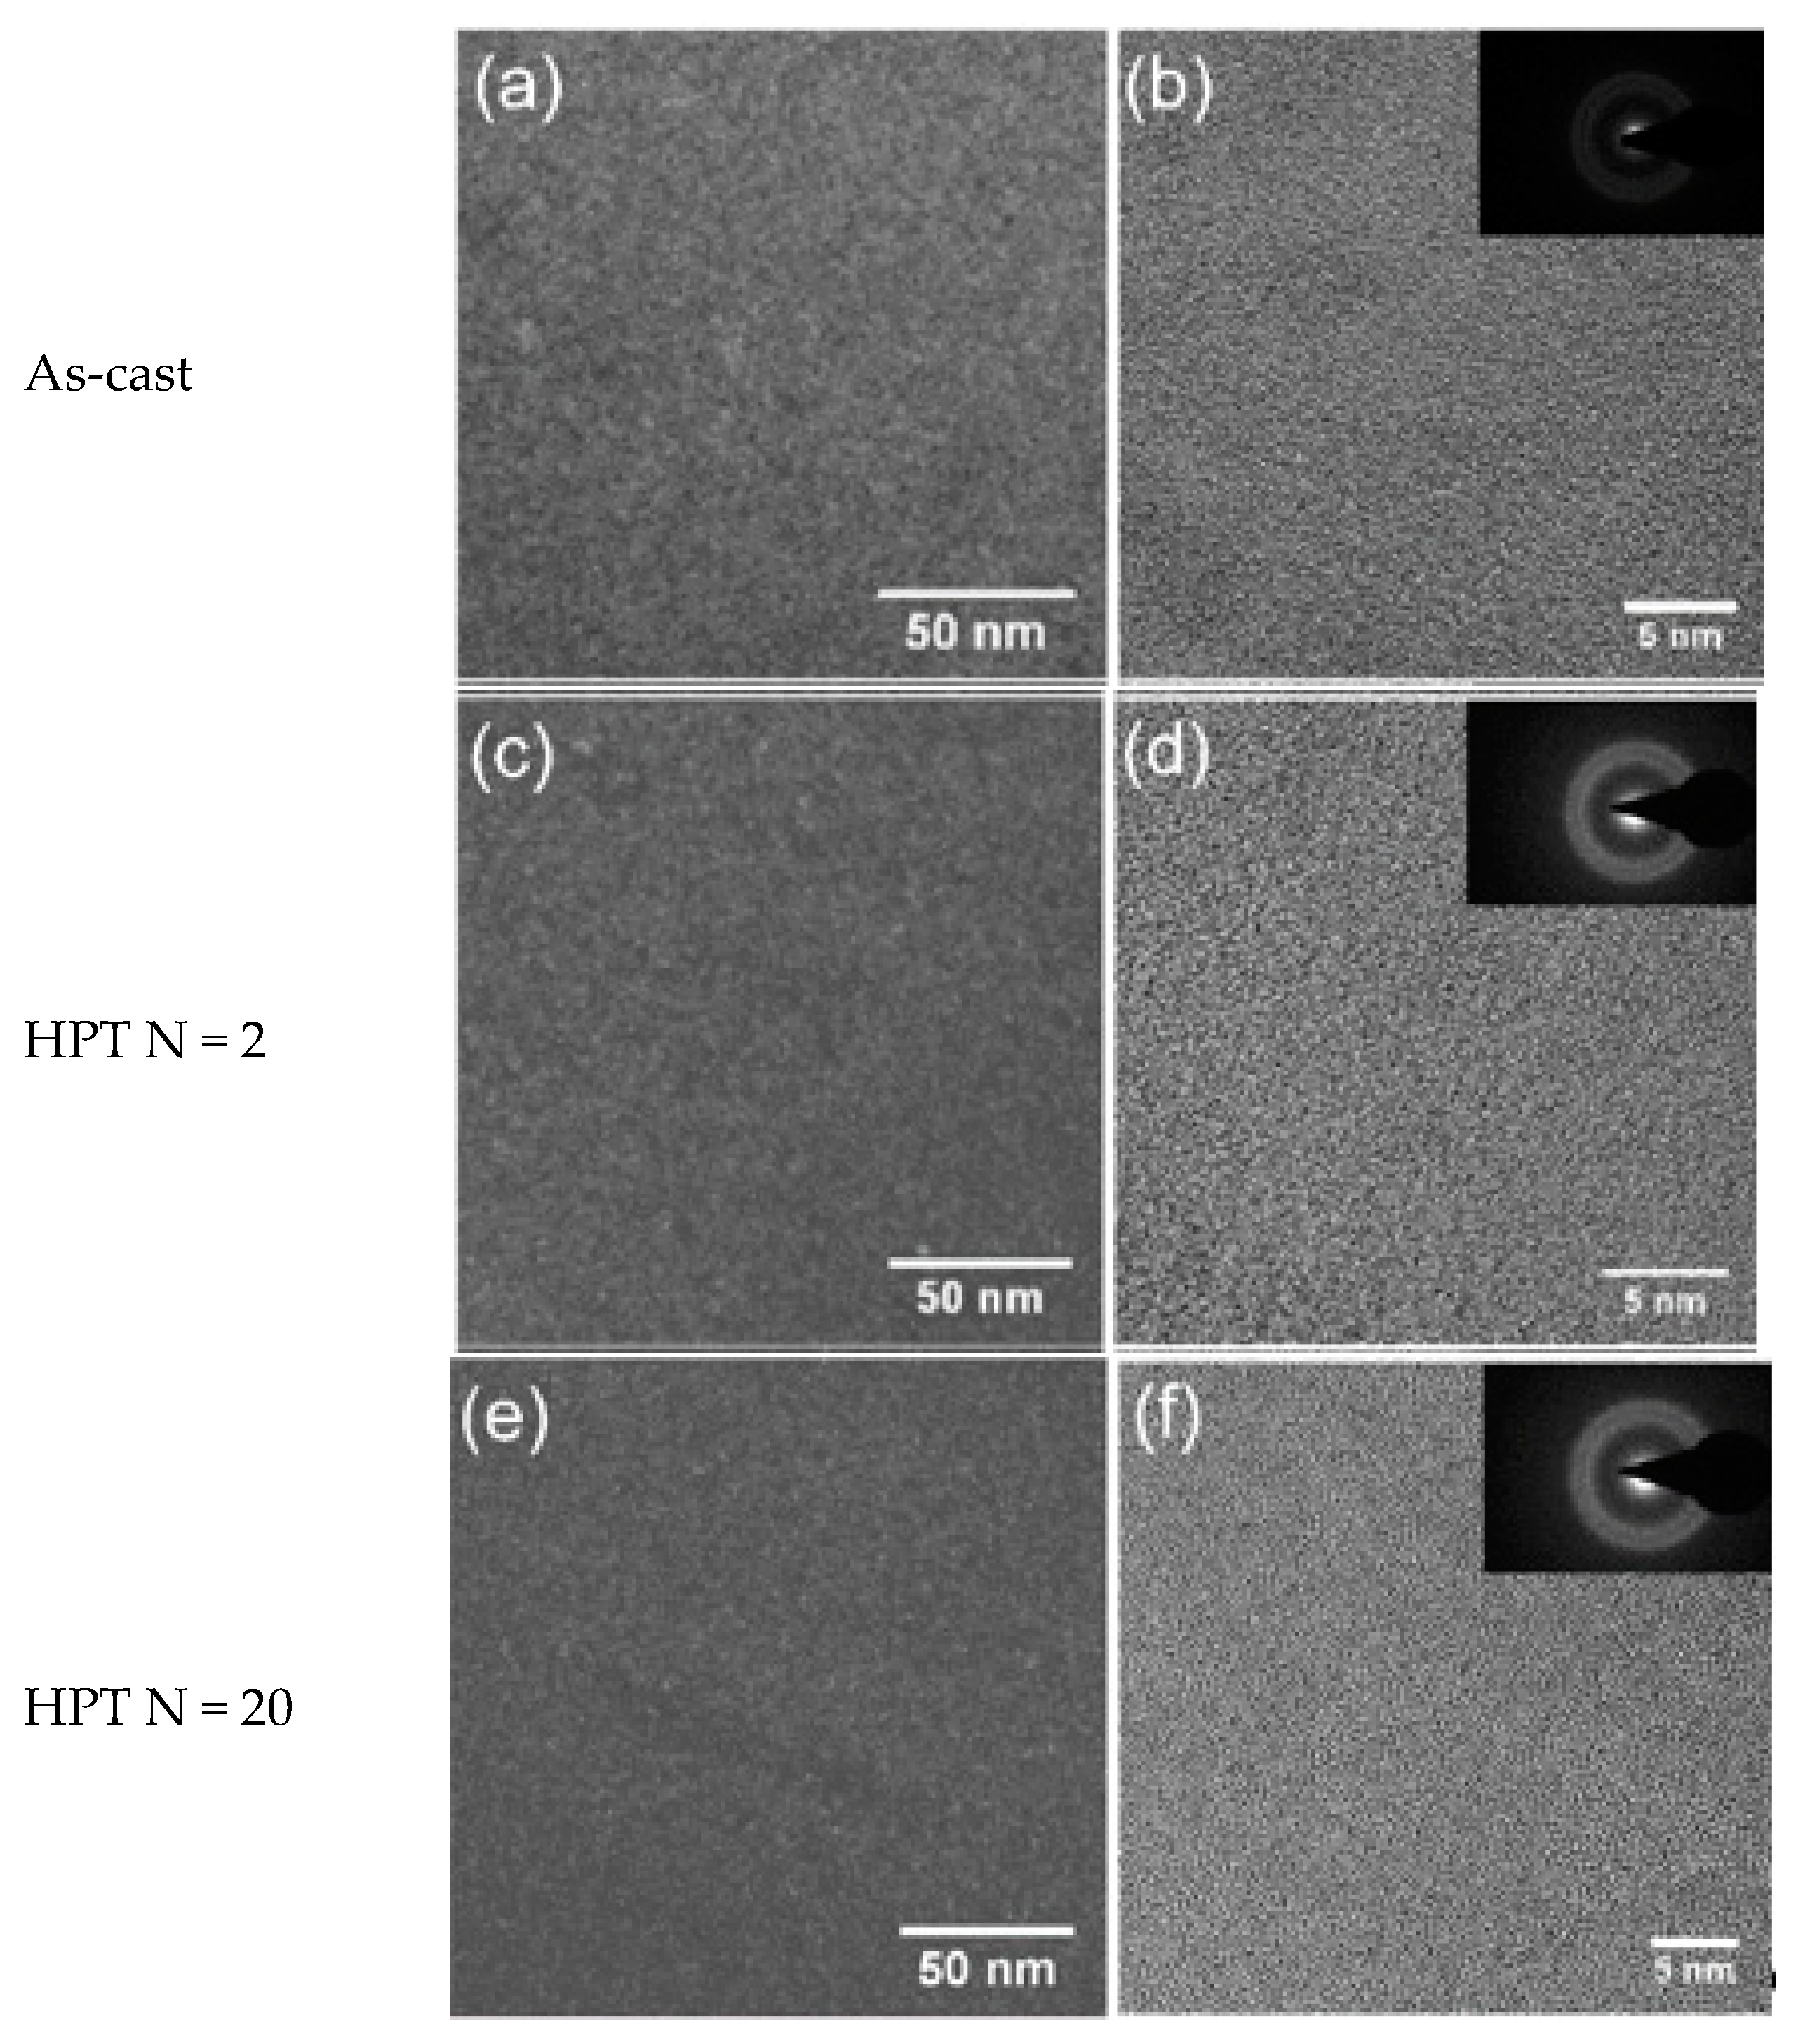
Figure 2a,b and
Figure 3a,b show the dark-field TEM and bright-field high-resolution TEM (HRTEM) images of the as-cast Zr-0Co and Zr-8Co glassy alloys. The inserts show the electron diffraction patterns. Zr-0Co exhibited a relatively homogeneous structure on a length scale >2 nm, while Zr-8Co showed a clear contrast variation on a length scale of 5–10 nm indicative of a phase separation.
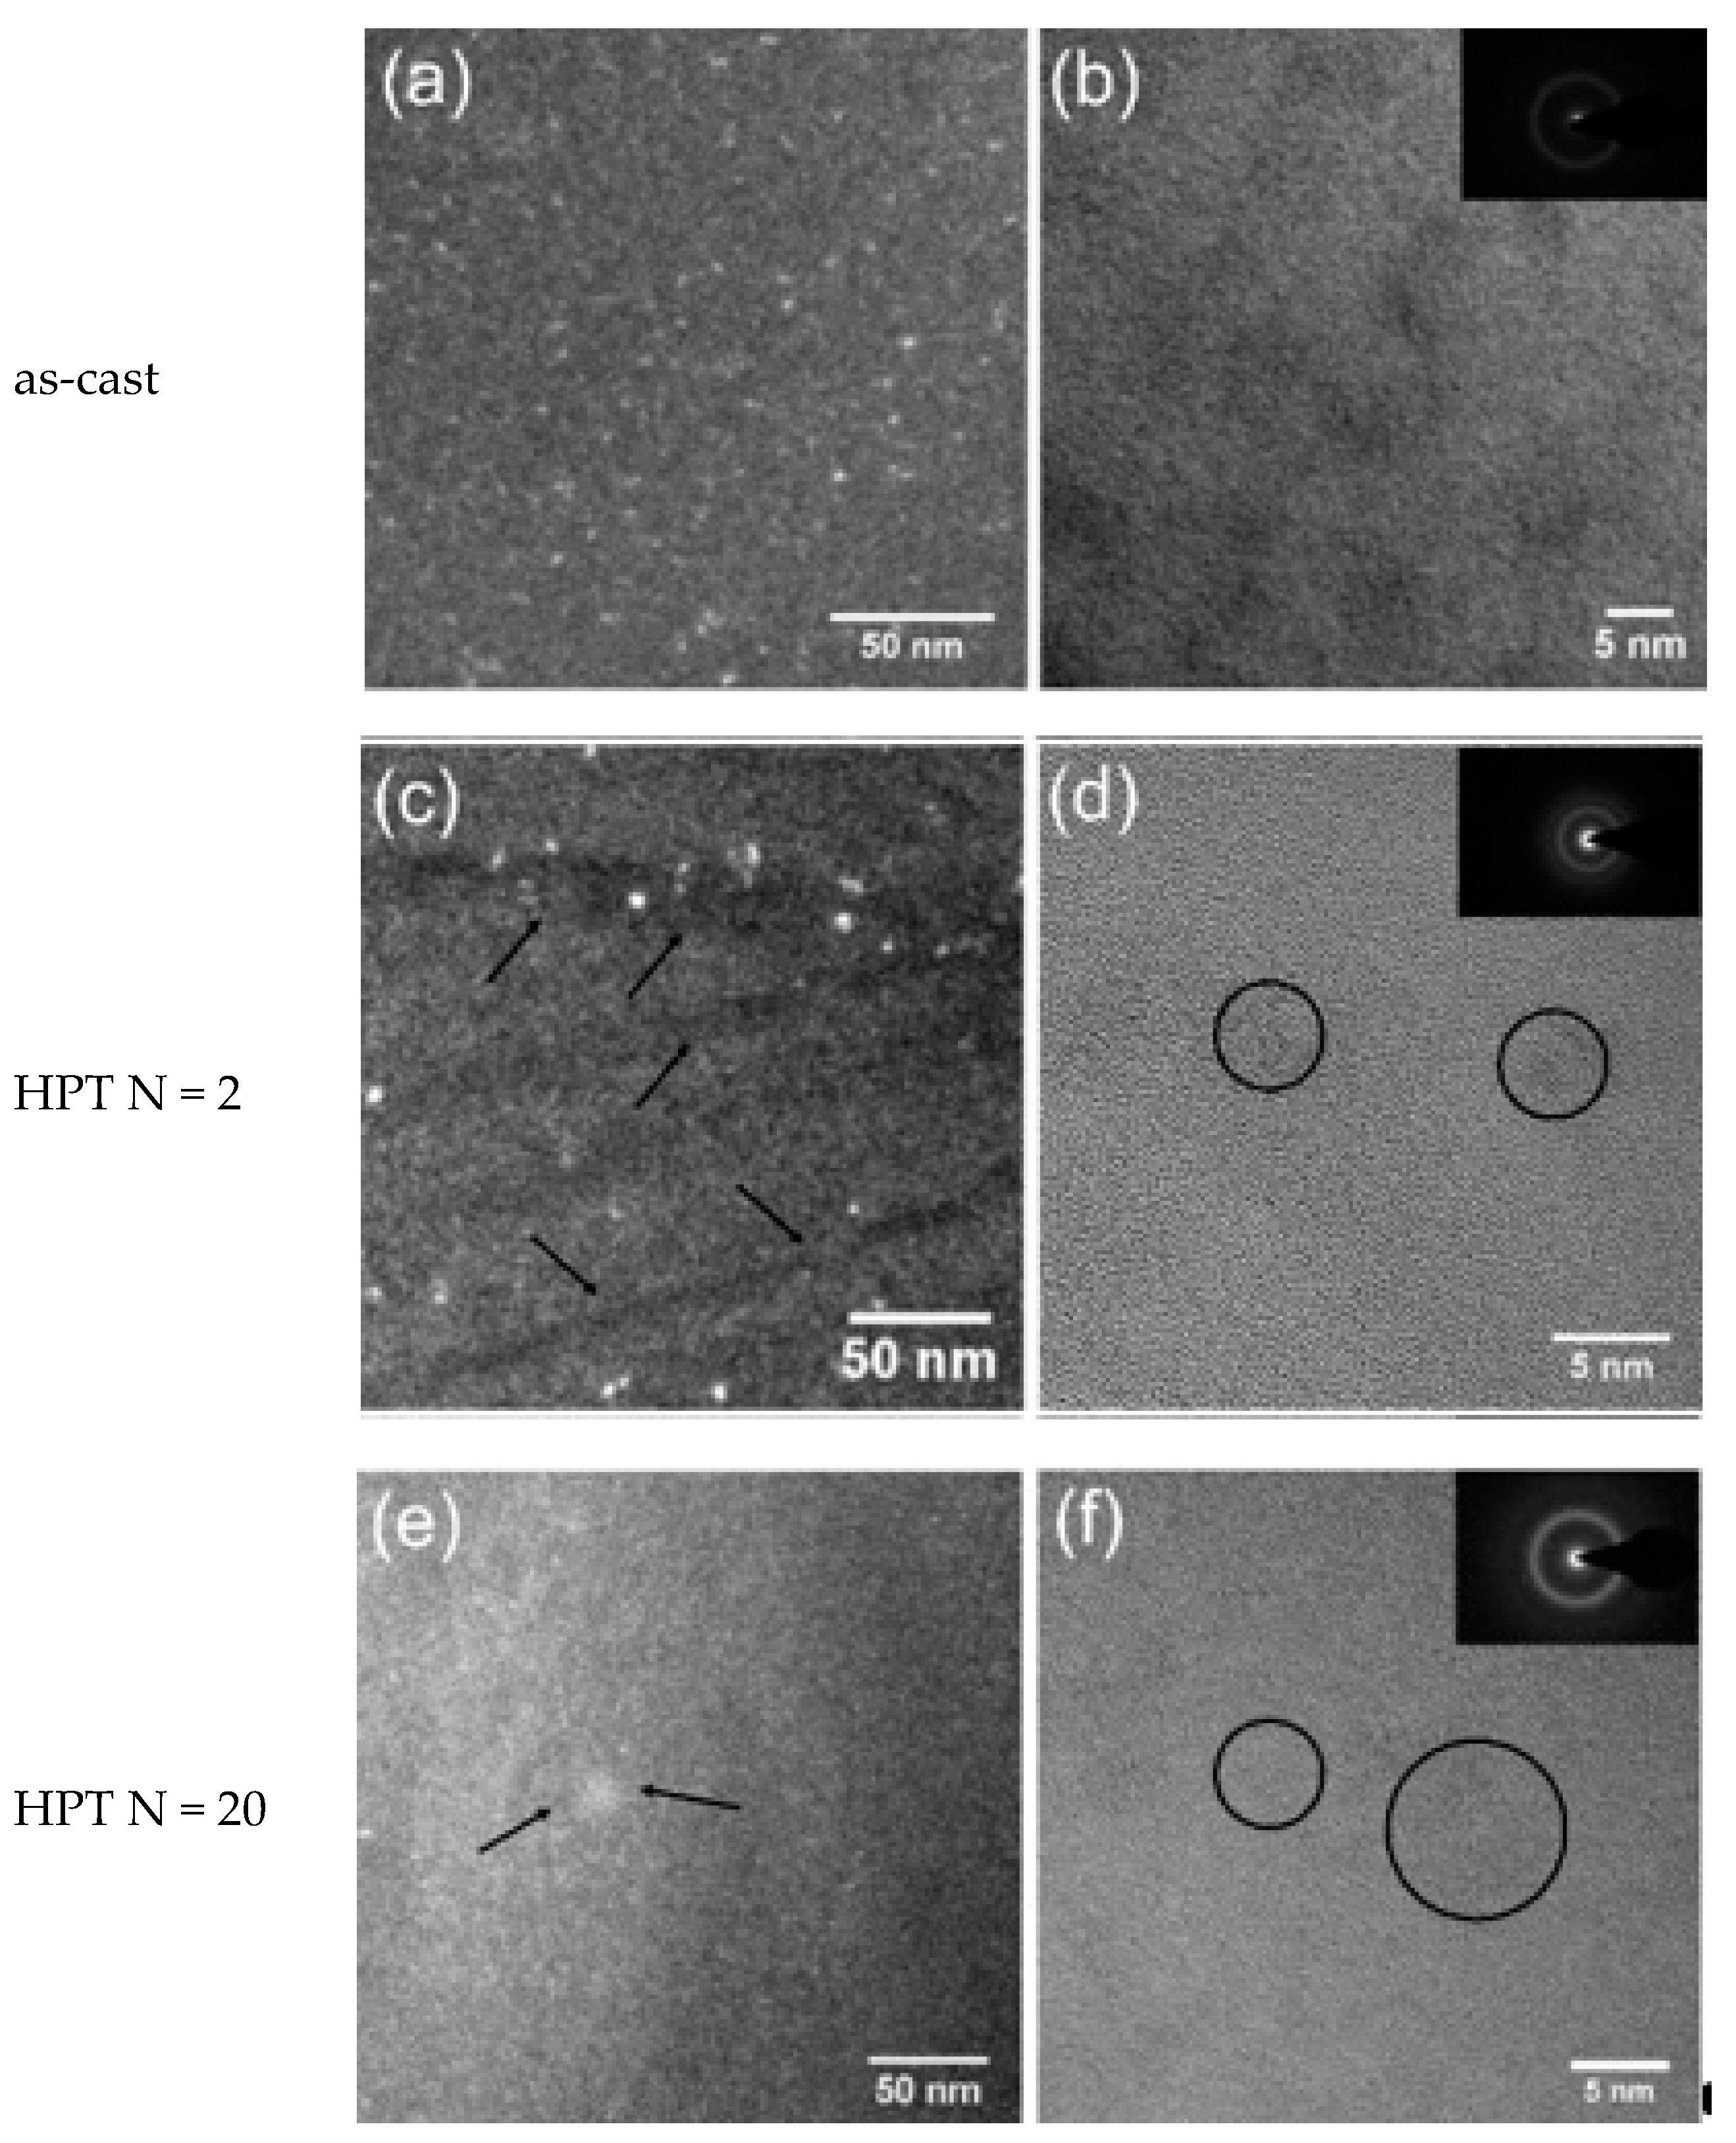
Figure 2c–f and
Figure 3c–f show TEM images of the HPT-treated (N = 2 and 20) samples of the alloys Zr-0Co and Zr-8Co, respectively. For Zr-0Co, no significant difference of the microstructures of the as-cast and HPT-treated (N = 2 and 20) samples was observed. In contrast, in the Zr-8Co HPT-treated (N = 2) sample, some nanocrystallites were consistently observed, as shown in
Figure 3c. The dark lines indicated in
Figure 3c were interpreted as SBs. Apparently, more SBs were introduced in Zr-8Co as compared to the Zr-0Co alloy. More nanocrystalline particles were found along SBs as compared to the matrix, which could be explained by high-degree plastic deformation in SBs during HPT. Moreover, growth in the size of nanocrystalline particles was also observed on the Zr-8Co sample (diameter 5–10 nm, marked by arrows and circles in
Figure 3e,f).
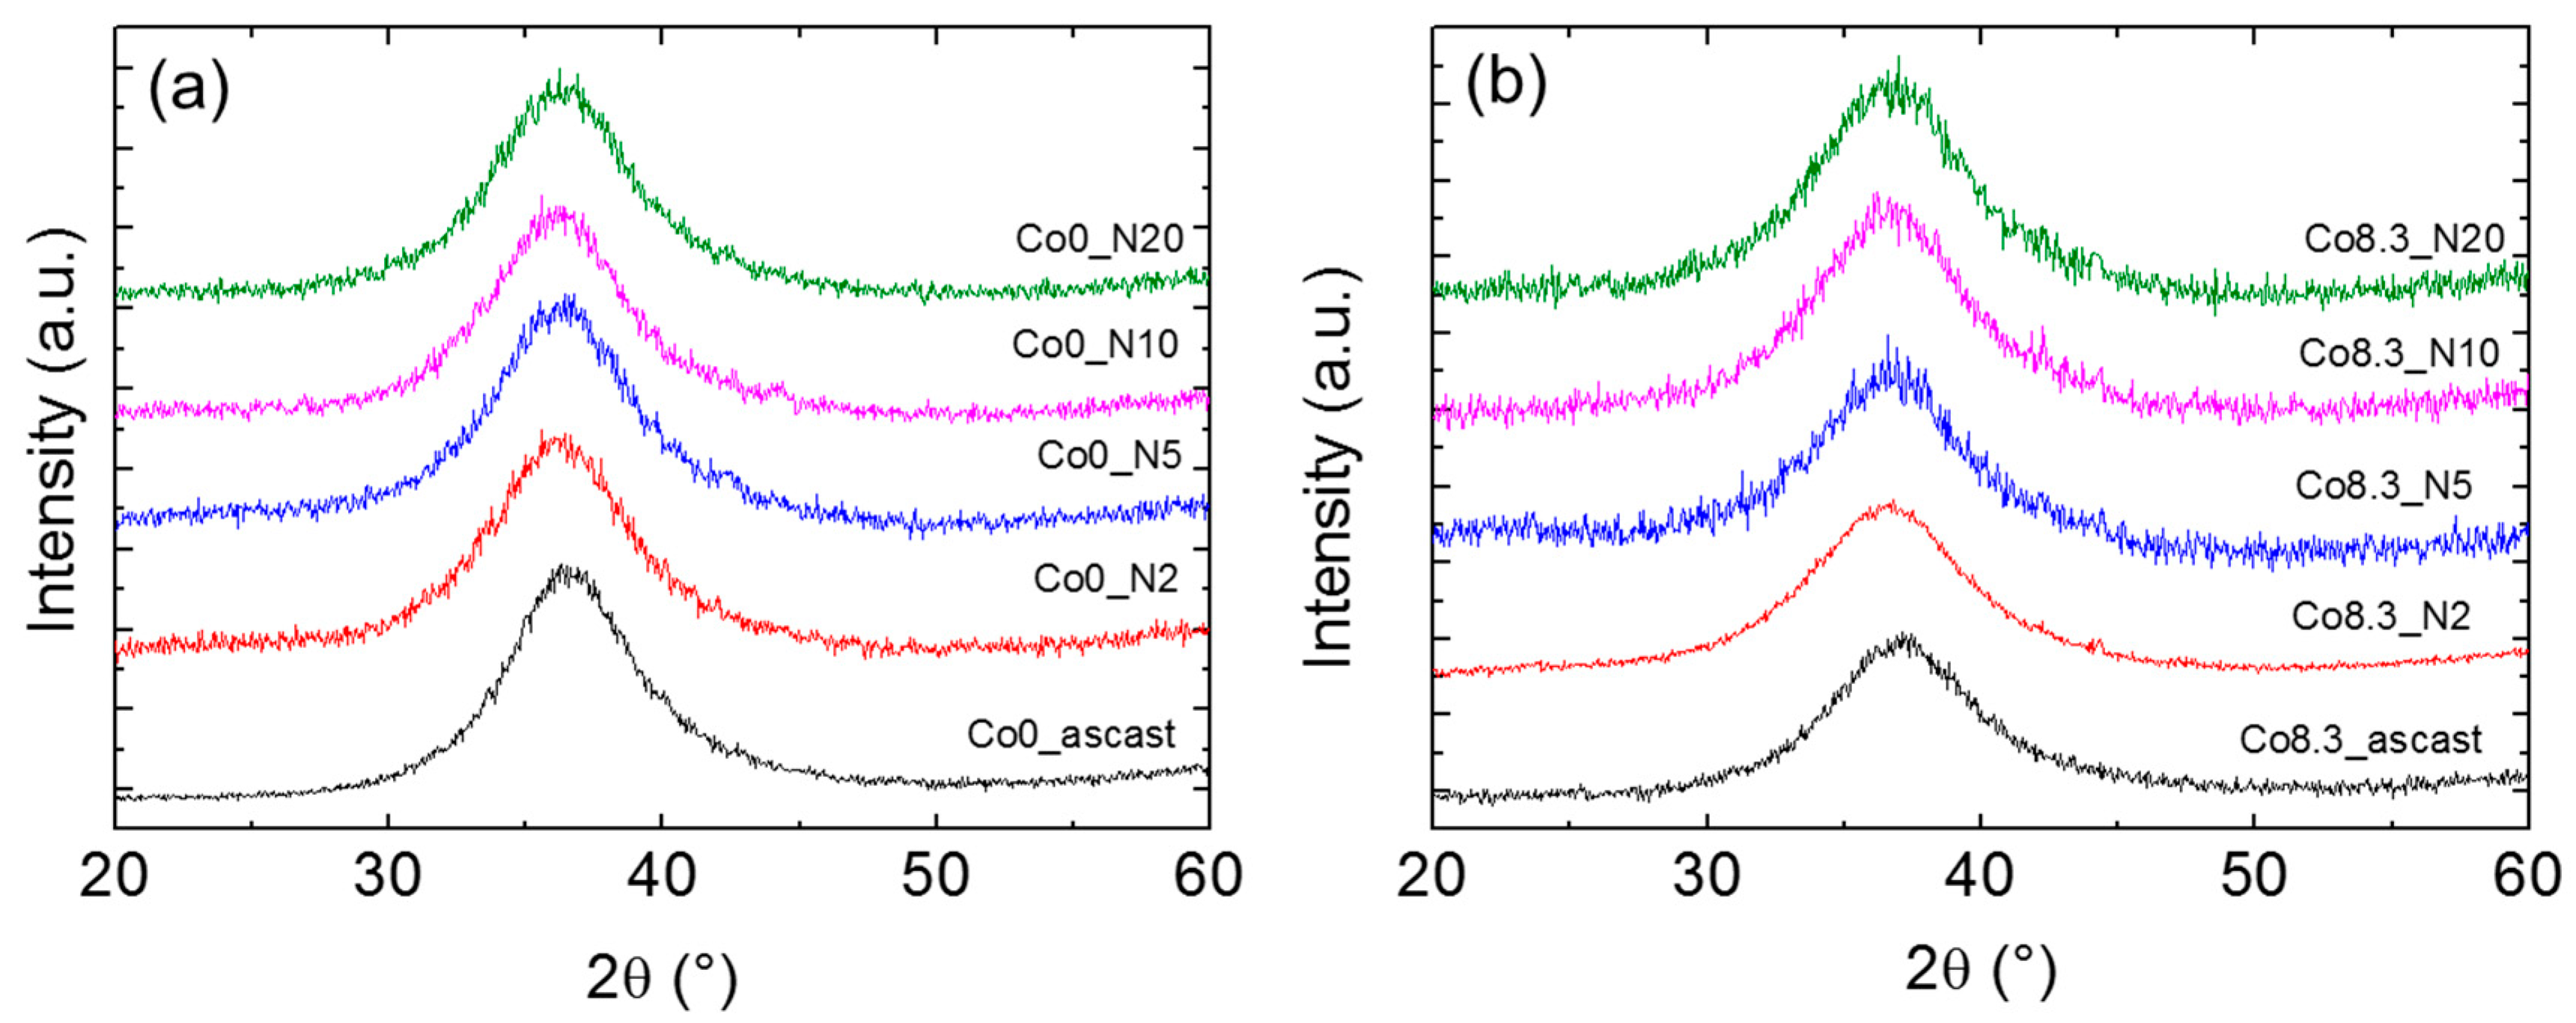
3.2.2. XRD
Cu-Kα radiation and synchrotron radiation-based XRD patterns of the as-cast and HPT-treated alloys are shown in
Figure 4 and
Figure 5, respectively. For the as-cast and HPT-treated (N = 2, 5, 10, and 20) states, the XRD patterns of both compositions showed the typical amorphous diffraction patterns with a broad peak and no indication of crystallization. The width of the amorphous diffraction peaks (at half height) of both types of alloys increased after HPT. The corresponding numbers are shown in
Table 2. The number density of the nanocrystallites in the HPT-treated Zr-8Co alloy samples was too low to show up as distinct diffraction peaks in the XRD patterns of the predominantly amorphous alloy.
3.3. Mechanical Properties
Since HPT can modify the structure in both homogeneous and nanometer-scale heterogeneous MGs, their mechanical behavior should be different. Hardness of the as-cast and HPT-treated samples was measured first. Zr-0Co samples had a nanoindentation hardness of 5.6 ± 0.2 GPa. For Zr-8Co MG, the value was higher (6.1 ± 0.2 GPa) due to the stronger Zr–Co atomic bonds. The HPT effect on hardness was analyzed in a previous publication [
43]. In this work, we focus on the SB behavior in MGs during nanoindentation measurements.
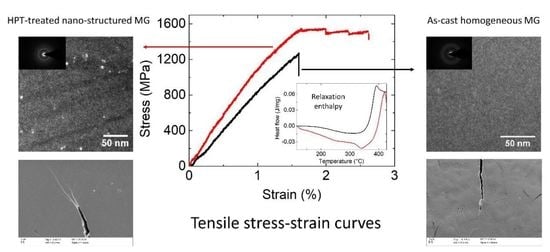
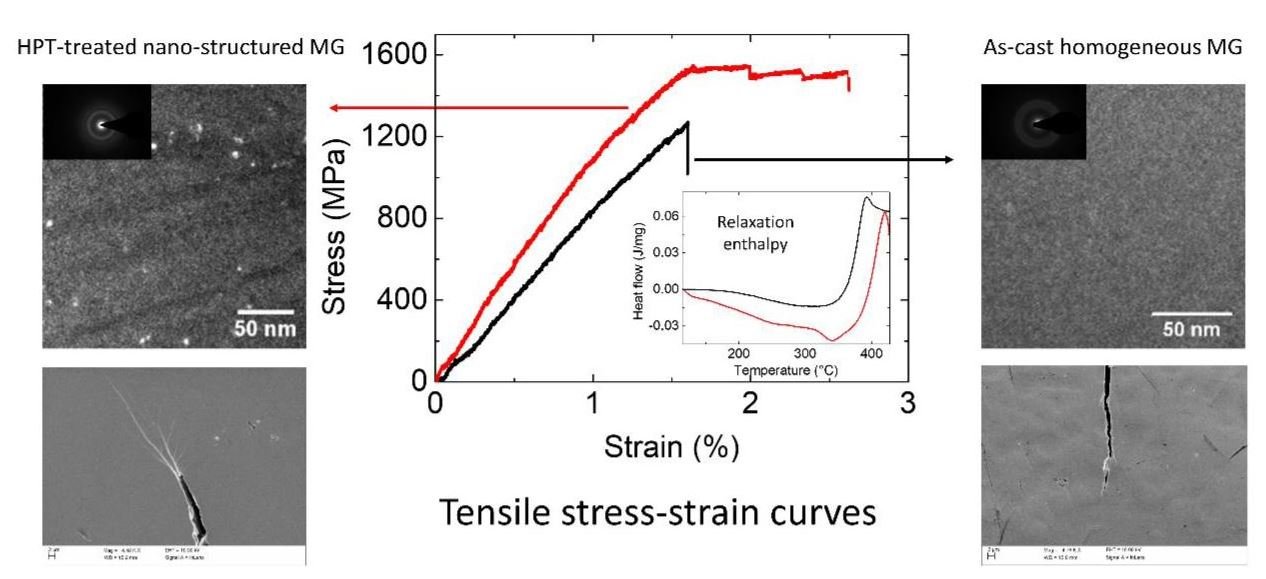
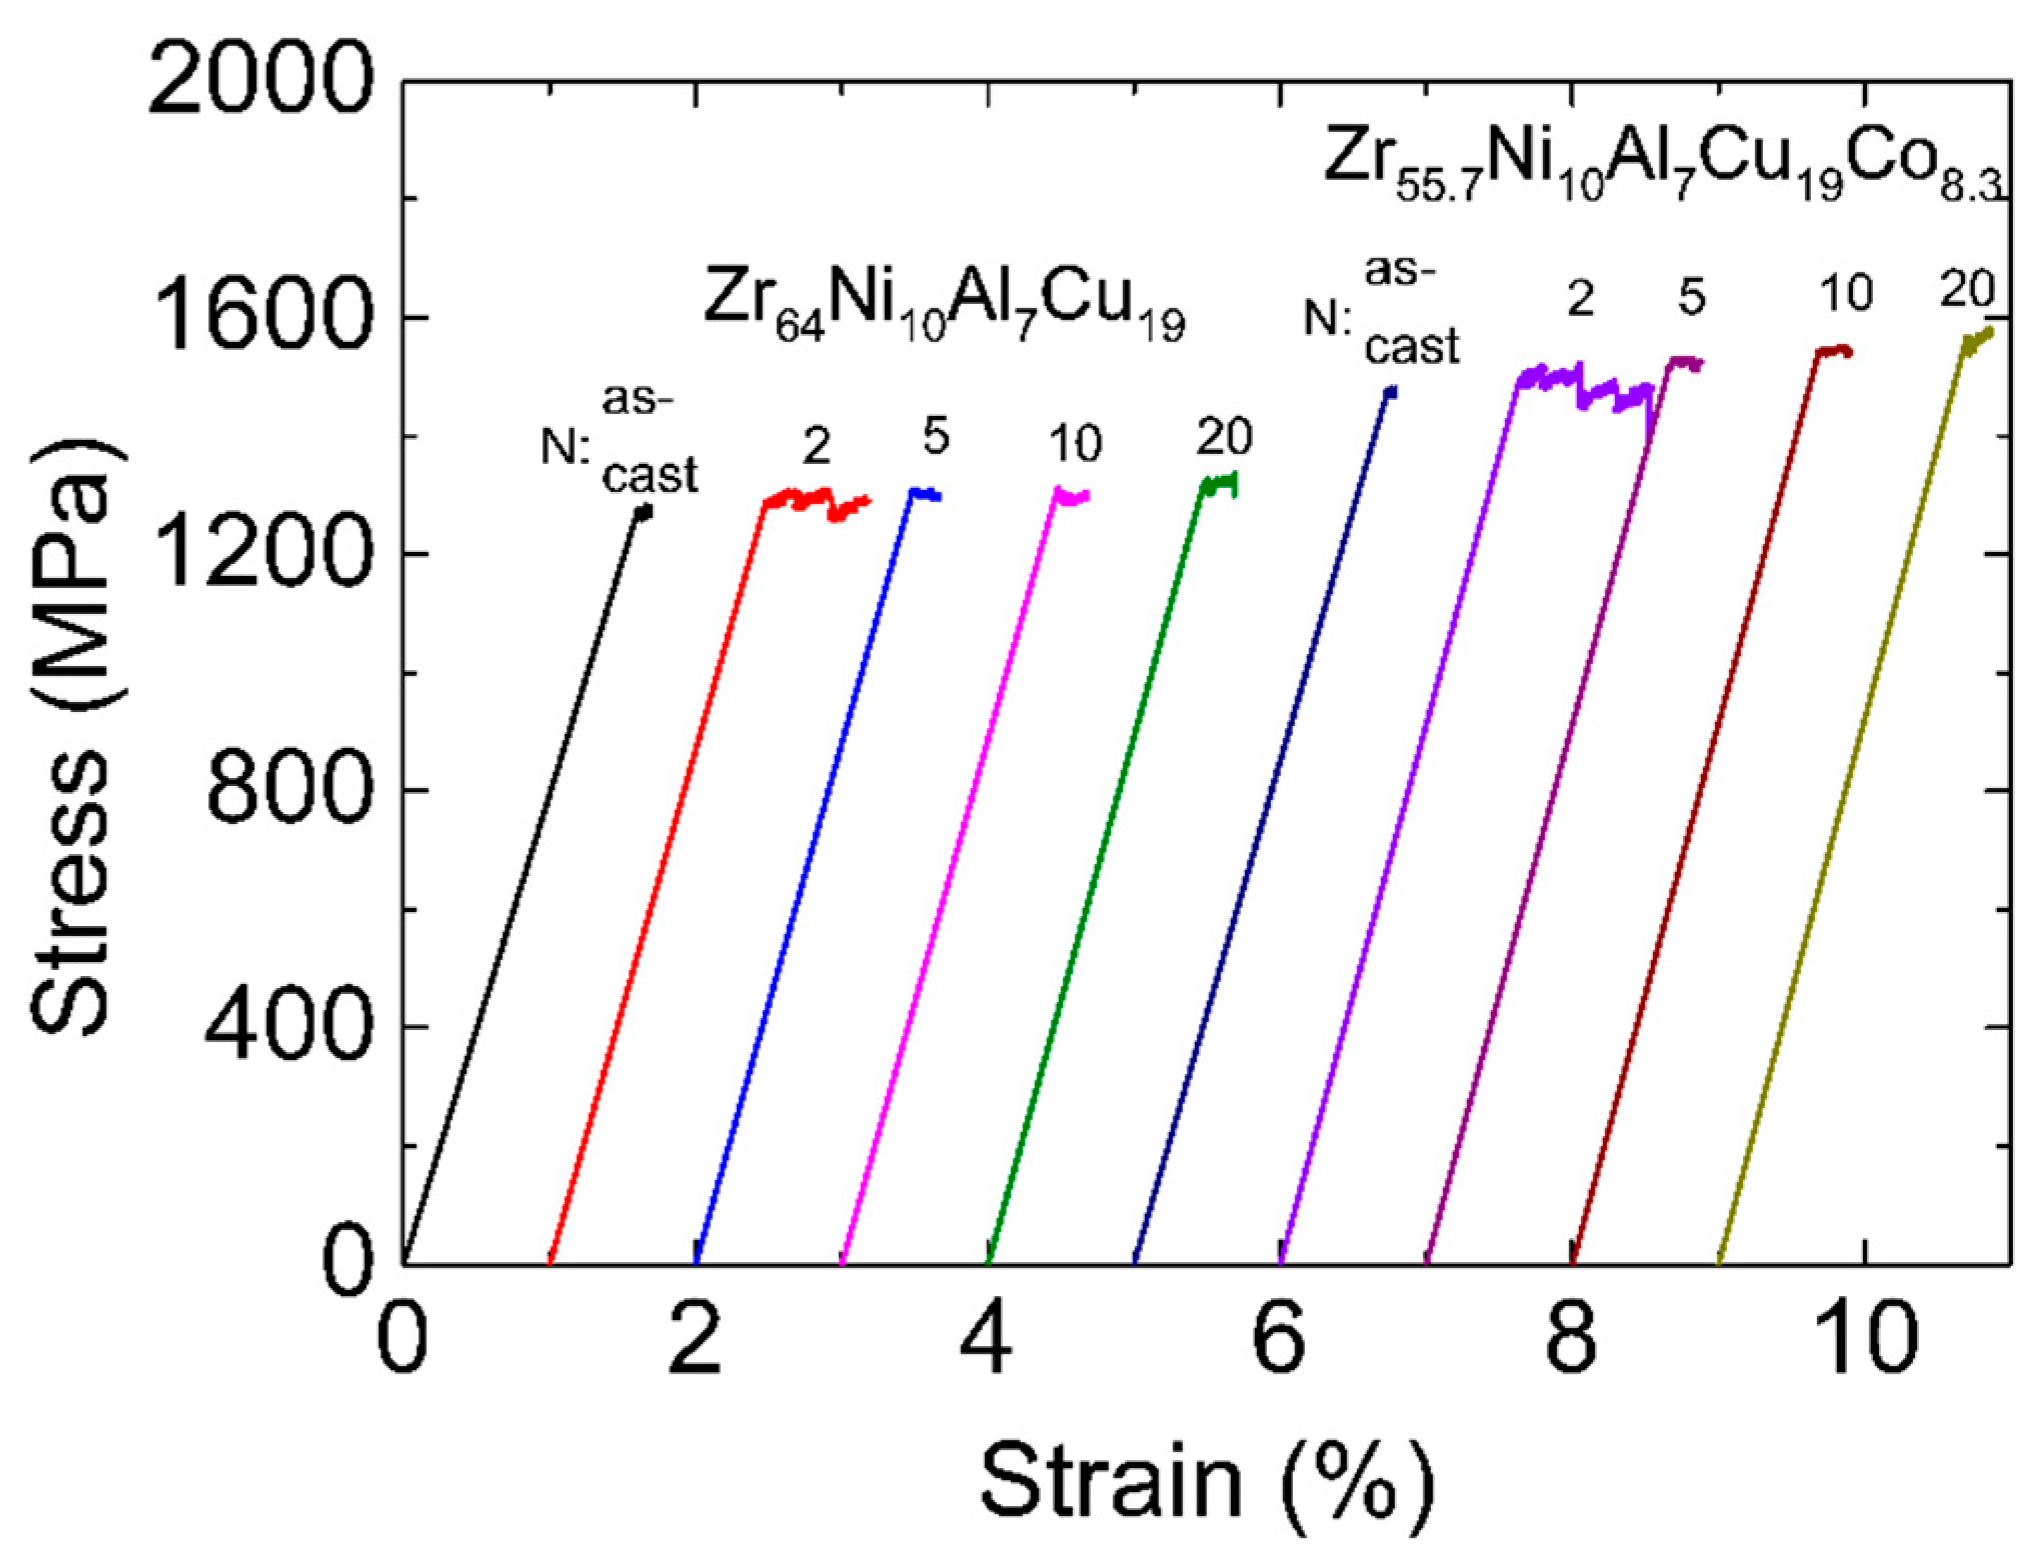
The tension stress–strain curves of the as-cast and HPT-treated samples are shown in
Figure 6. Similar to the results reported in many other publications [
46,
47], both as-cast MGs showed almost no plastic strain in tension (~0.1%). Unlike the compression process, under tensile load, SBs easily extend to cracks, which leads to catastrophic fracture very fast after yielding. After HPT (N = 2), the tensile ductility of both samples was improved. The plastic strain of the Zr-0Co MG increased to 0.5%. The improvement for the Zr-8Co MG was more significant, reaching 0.9%. This is a high value for MGs under tension with a slow strain rate at room temperature. For HPT treatment (N = 5, 10, and 20), the plastic strain of both types of MGs decreased to 0.1–0.3%.
4. Discussion
4.1. Evolution of Free Volume
The free volume model is one of the most commonly used for the description of properties of MGs [
16,
41,
48,
49,
50]. As discussed above, MGs with more free volume often have more homogeneous deformation and better plasticity, which is caused by the formation of more STZs at sites with high free volume during deformation.
For Zr-based MGs [
49], a correlation between free volume Δv
fv and structure relaxation enthalpy (ΔH)
fv before the glass transition during DSC measurements was proposed as (ΔH)
fv=β ∙ Δv
fv, where β is a constant.
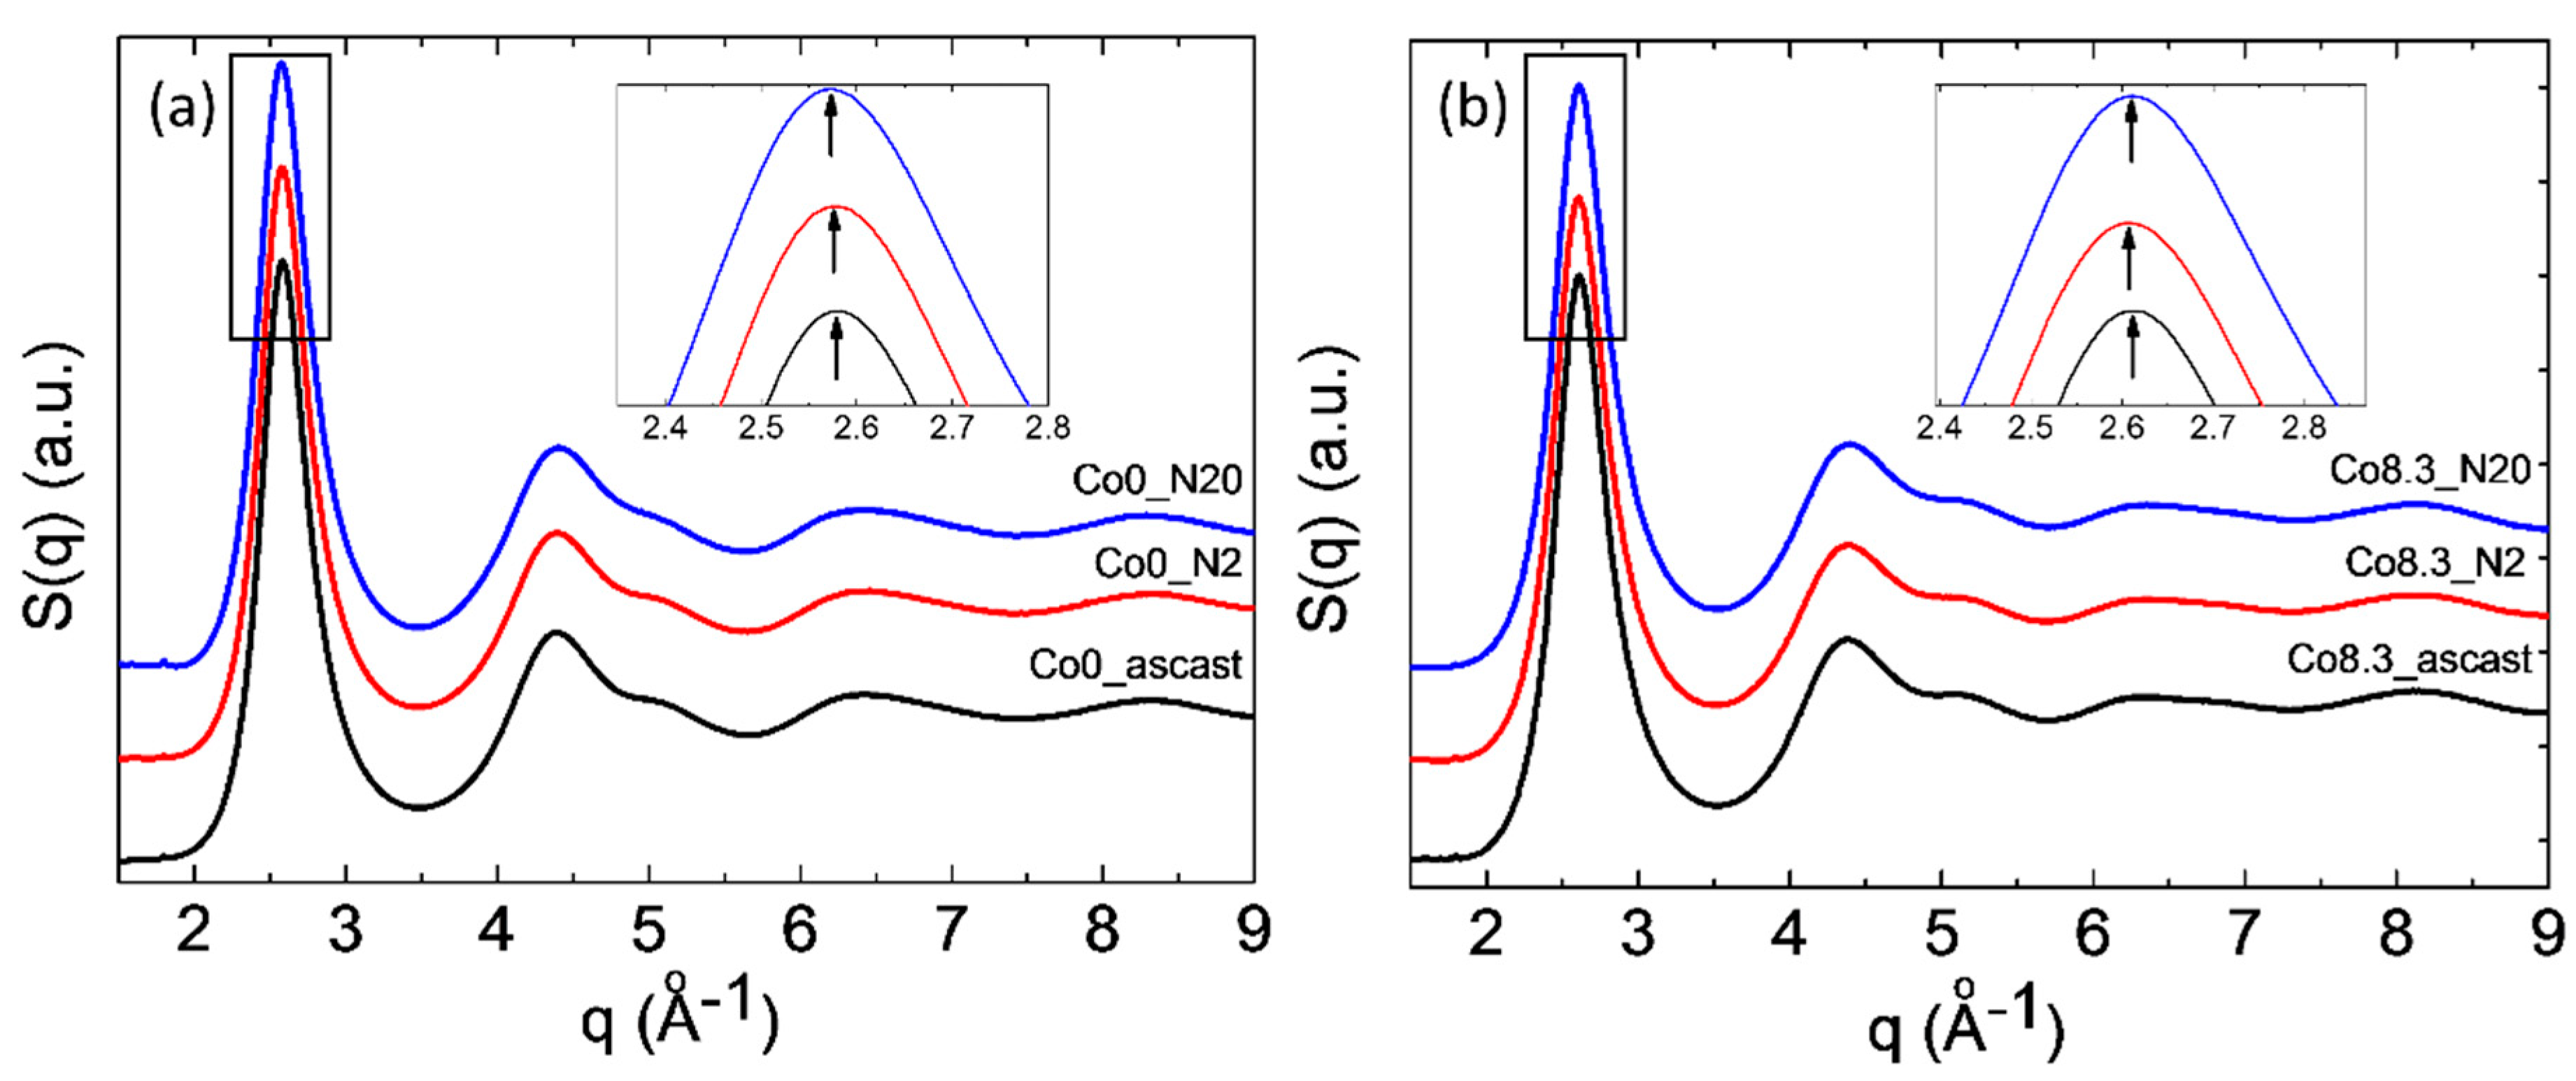
Table 2 lists the enthalpy of relaxation in all studied MGs as a function of rotation number. It is clear that, after two rotations of HPT, both types MGs had a higher enthalpy of relaxation as compared to the as-cast state. This increase was more significant for the HPT-treated (N = 2) Zr-8Co MG than the HPT-treated (N = 2) Zr-0Co MG, i.e., 6.4 J/g as compared to 3.5 J/g, respectively [
49,
50,
51]. The observed first maximum shift on structure factor S(q) to lower q values (shown in the inserts in
Figure 5) was equivalent to an increase in the average atomic distance. The relative increase of the mean atomic volume V can be estimated as {q
0/q
N}
3 ≈ {V
N/V
0}, where q
0 and q
N are the positions of the first maximum on S(q) of the as-cast and of the N-rotation HPT-treated samples, respectively [
22,
52]. From these numbers, an increase in mean volume per atom of ~0.3% and ~0.7% was obtained for HPT-treated (N = 2) Zr-0Co and Zr-8Co, respectively, indicating the creation of excess free volume. Furthermore, the diffraction peak halfwidth can also reflect the structure change of MGs [
53]. One of the main reasons of peak broadening is the formation of an inhomogeneous amorphous structure. As shown in
Table 2, the halfwidth of the XRD diffraction peak of the as-cast Zr-8Co MG (6.1°) was larger than that of the Zr-0Co MG (5.4°), due to the nano-heterogeneous glassy structure in Zr-8Co as compared with Zr-0Co. Following two rotations of HPT treatment, the peak width of both types of alloys increased, which varied from 6.1° to 6.8° and 5.4° to 5.9° for the abovementioned compositions, respectively. As for the reason for the XRD peak broadening, due to the small content of the nanocrystalline particles (0–5%, as detected by TEM and DSC) induced by HPT treatment, this peak broadening mainly resulted from the inhomogeneity caused by shear band formation. The increase in atomic disorder is associated with an increase in the mean volume per atom and localized free volume. As such, the different measures of disorder were investigated on a similar scale for both types of alloys. From these results, it can be concluded that the free volume of both types of MGs increased following two rotations of HPT. Furthermore, the free volume increase of the treated nano-heterogeneous Zr-8Co sample is higher than that of the homogeneous Zr-0Co sample after HPT (N = 2). The reason is that atomic misfit at the boundaries between different glassy phases could offer more sites for deformation-induced STZ [
21]. Thus, more SBs with excess free volume can be formed in nanostructured MGs during plastic deformation, which was observed and discussed in our previous publication [
28].
By further increasing the rotation number (N = 5, 10, and 20), the enthalpy of relaxation in both types of MGs decreased compared with the HPT treatment (N = 2) as shown in
Table 2, which could be caused by deformation-accelerated diffusion and structure relaxation during HPT (N = 5, 10, and 20) [
54]. This process is similar to the defect content evolution in alloys with time during ball milling [
55,
56]. The deformation-induced defect (defect creation) and deformation-accelerated diffusion (defect annihilation) during ball milling are both present, and they compete with each other during ball milling. Usually, at the initial stage, the deformation-induced defect is dominant, while, at the later stage, deformation-accelerated diffusion becomes important; finally, a balance is often reached. Although the HPT treatment is not exactly the same as ball milling, a similar deformation-induced defect and deformation-accelerated diffusion should also occur. After HPT (N = 2), more SBs (could be treated as defects) were formed, i.e., the deformation-induced defect process was dominant. Thus, the enthalpy of relaxation increased in both types of MGs after HPT (N = 2). With further rotation, deformation-accelerated diffusion became important and structure relaxation occurred, resulting in the reduction of the enthalpy of relaxation and the free volume. In fact, the sample temperature enhancement during severe plastic deformation further supports our view. As previously calculated [
32,
33], the temperature in the Zr-based MG samples will reach their T
g after 2–5 rotations of HPT. Thus, for more rotations, structural relaxation during the treatment becomes non-negligible, resulting in the reduction of structure relaxation enthalpy in the DSC results. Furthermore, the growth of nanometer-sized crystalline particles and the homogenization of the amorphous matrix in the Zr-8Co sample (
Figure 3e,f) led to this reduction being more significant than in HPT-treated Zr-0Co samples (N = 5, 10 and 20).
4.2. Behavior of Shear Bands
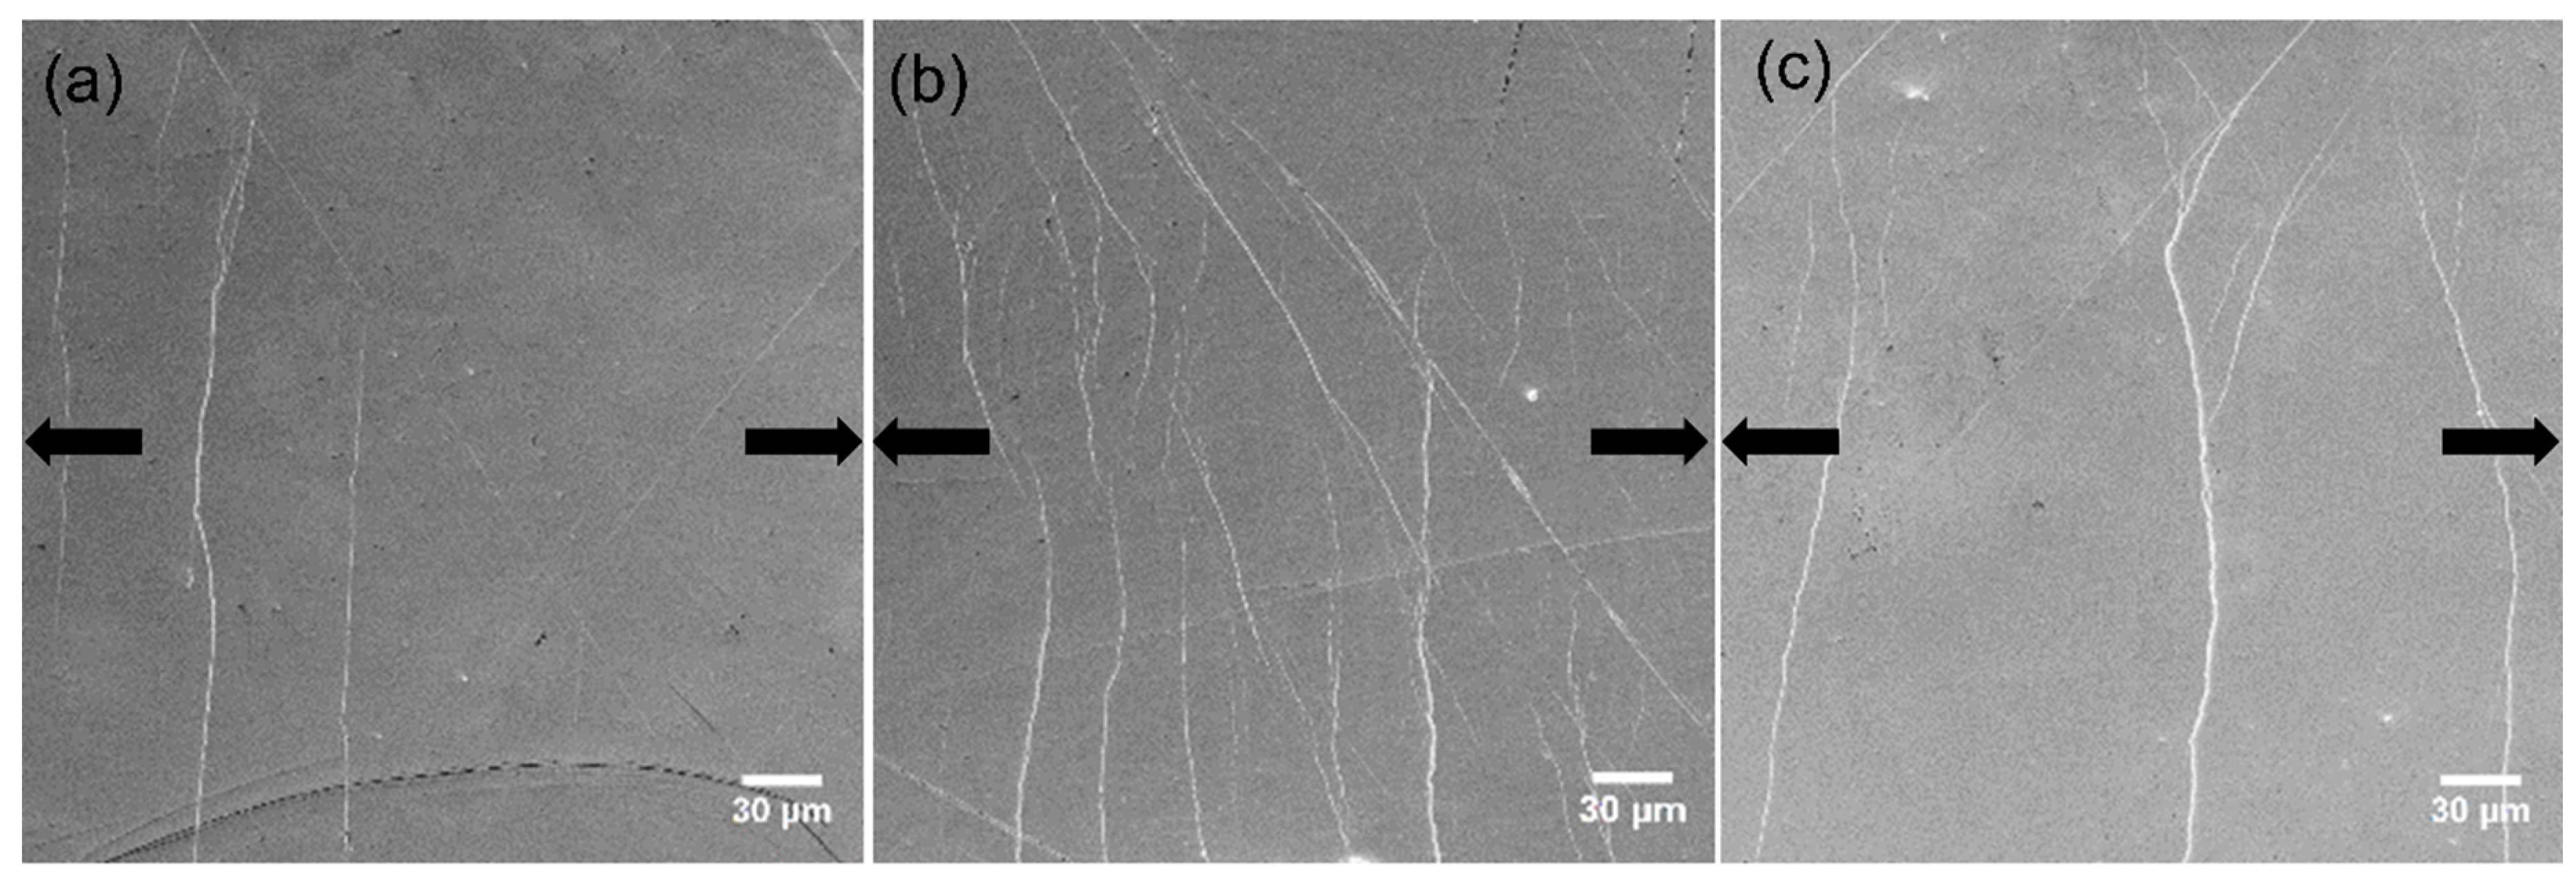
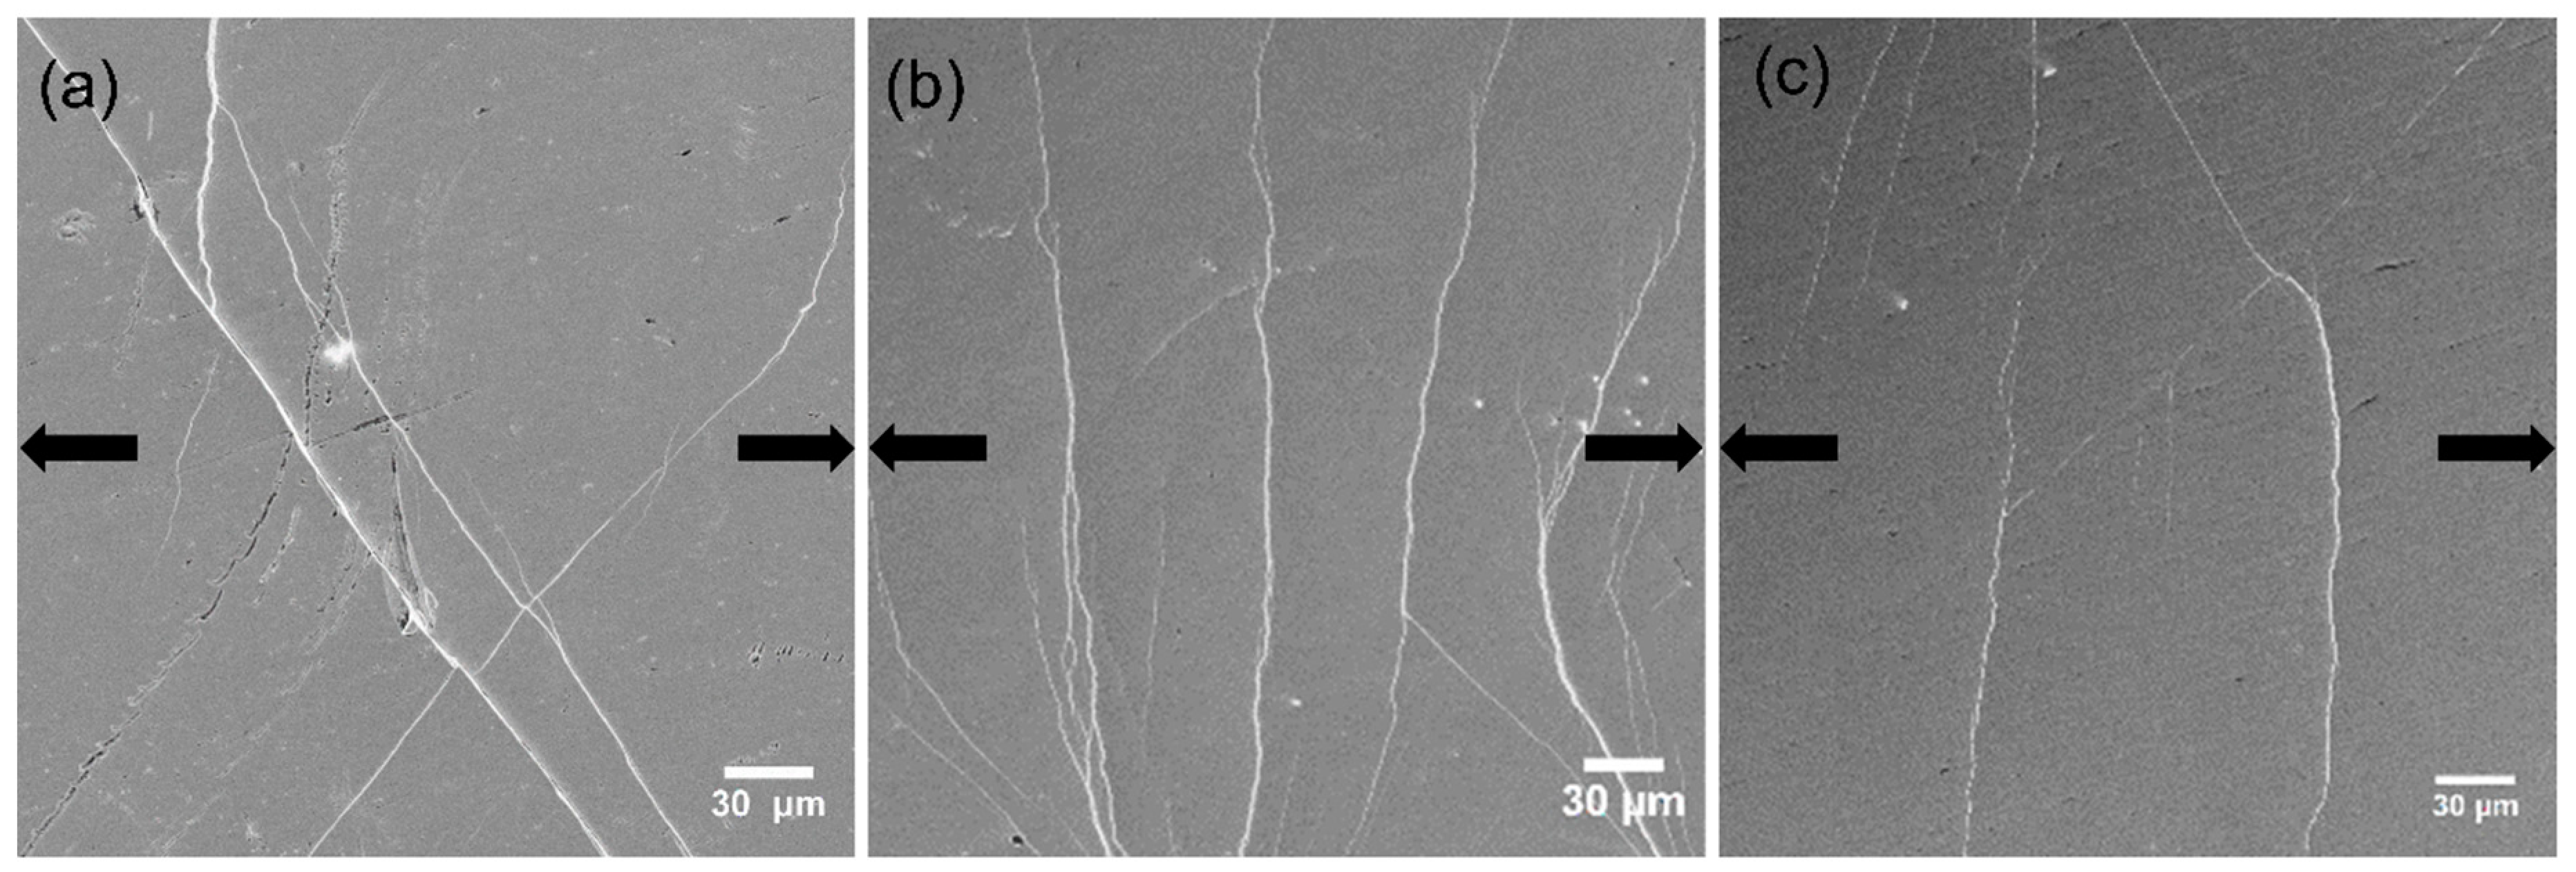
HPT introduced some change of the free volume content in both MGs. In order to investigate its effect on SB formation in tension, in situ SEM was used to observe the SB initiation and evolution on the as-cast and HPT-treated Zr-0Co and Zr-8Co MGs samples. The polished surfaces were smooth except for a few scratches.
Figure 7 and
Figure 8 show the SEM micrographs of Zr-0Co and Zr-8Co samples just before the yielding point.
Figure 7a shows that one major SB was formed, cutting through the sample, and several smaller SBs beside it were observed for the as-cast Zr-0Co MG. On the surface of the HPT-treated (N = 2) Zr-0Co sample (
Figure 7b), multiple SBs appeared under yield stress perpendicular to the tension orientation because of the increased free volume. This phenomenon is similar to the tensile test on rolled MG samples [
11]. The SBs introduced by suitable plastic deformation might not only lead to the increased free volume, but also tolerance of the applied strain more homogeneously across the deformed region, thereby avoiding catastrophic failure. Upon further increasing the HPT deformation degree (up to N = 20), the number of tension-induced SBs was reduced (
Figure 7c) due to the free volume annihilation as discussed above. For the as-cast Zr-8Co sample, more than one major SBs were detected, most likely due to the inhibition effect of the nanometer-scale glassy second phase during SBs propagation. On the surface of the HPT-treated (N = 2) Zr-8Co sample, multiple SBs were easily observed (
Figure 8b) due to the high number of initiation sites in this glassy structure with the highest free volume content. Similar to Zr-0Co MGs, only two to three SBs could be observed on the surface of the HPT-treated (N = 20) Zr-8Co sample under yield stress due to the reduction of free volume, as shown in
Figure 8c.
During tensile tests, a large number of SBs formed on both N = 2 HPT-treated MGs, although the SB morphology on both types of samples was different (
Figure 7b and
Figure 8b). Finite element analysis of the tensile tests was done by Mo Li et al. [
26]. They used Gaussian and bimodal distribution of free volume to simulate the spatial heterogeneity in MGs. The calculation results showed that bimodal-like free volume dispersion can effectively improve the sample plasticity. In the HPT-treated (N = 2) Zr-8Co MG, free volume content was high in the introduced SBs and the formed nanocrystalline particles had little free volume. In this heterogeneous structure, initial deformation started at the soft mesh regions and continued to exist around their original location. As the deformation continued, the deformation regions were still restricted to their original location, although more new deformed regions were created elsewhere. When localized regions finally developed, the deformation bands did not look smooth and straight, but rather appeared rugged and zigzag with many side bands (as shown in
Figure 8b and
Video S1 (
Supplementary Materials). Moreover, the localized deformation zones were spread more widely and no through shear band across the sample formed at larger deformation [
26]. Upon further increasing the number of HPT rotations (N = 5, 10, 20), the free volume dispersion in the samples was homogenized.
Nanometer-sized crystalline particles (3–10 nm) formed and grew in the nanoscale heterogeneous MGs during HPT, which could not be observed in the homogeneous MG (
Figure 3). The reason is that nanostructured Zr-8Co MG has less thermal stability (T
x1 − T
g). As shown in
Table 1, (T
x − T
g) of the Zr-8Co sample is only 26 K, while it is 72 K for the Zr-0Co sample. For crystalline composite materials, the nanometer scale reinforcements can hinder the sliding of dislocations. To study their effect on the mechanical properties of MGs, nanoindentaion measurement results of the HPT-treated (N = 2) Zr-0Co and Zr-8Co MGs were analyzed. The two smooth curves shown in
Figure 9a illustrate that both types of MGs had relatively homogeneous deformation. If we focus on the beginning of plastic deformation (
Figure 9b), some small “serrations” with a sudden load increase could be observed for the Zr-8Co sample. The reason is that the initiated SB was arrested by the nanocrystalline particles. With the increase of load, new SBs formed and the deformation continued. This phenomenon could not be found on the treated Zr-0Co sample. Instead, some flat “steps” appeared on its nanoindentaion curve, indicating no obstacle for SBs propagation. This can be further confirmed by the velocity profiles of the indenter, as shown in
Figure 9c,d. Abruptly deceleration and acceleration of the indenter could be seen on the velocity–displacement curve of the HPT-treated (N = 2) Zr-8Co MG at the corresponding displacements of the “serrations” on
Figure 9b, indicating the displacement burst due to new SB activity followed by an increase in load. On the curve of the HPT-treated (N = 2) Zr-0Co MG, the indenter velocity change was relatively uniform. On the SEM images (
Figure 9e,f), more SBs could be observed around the indentation on the HPT-treated (N = 2) Zr-8Co MG.
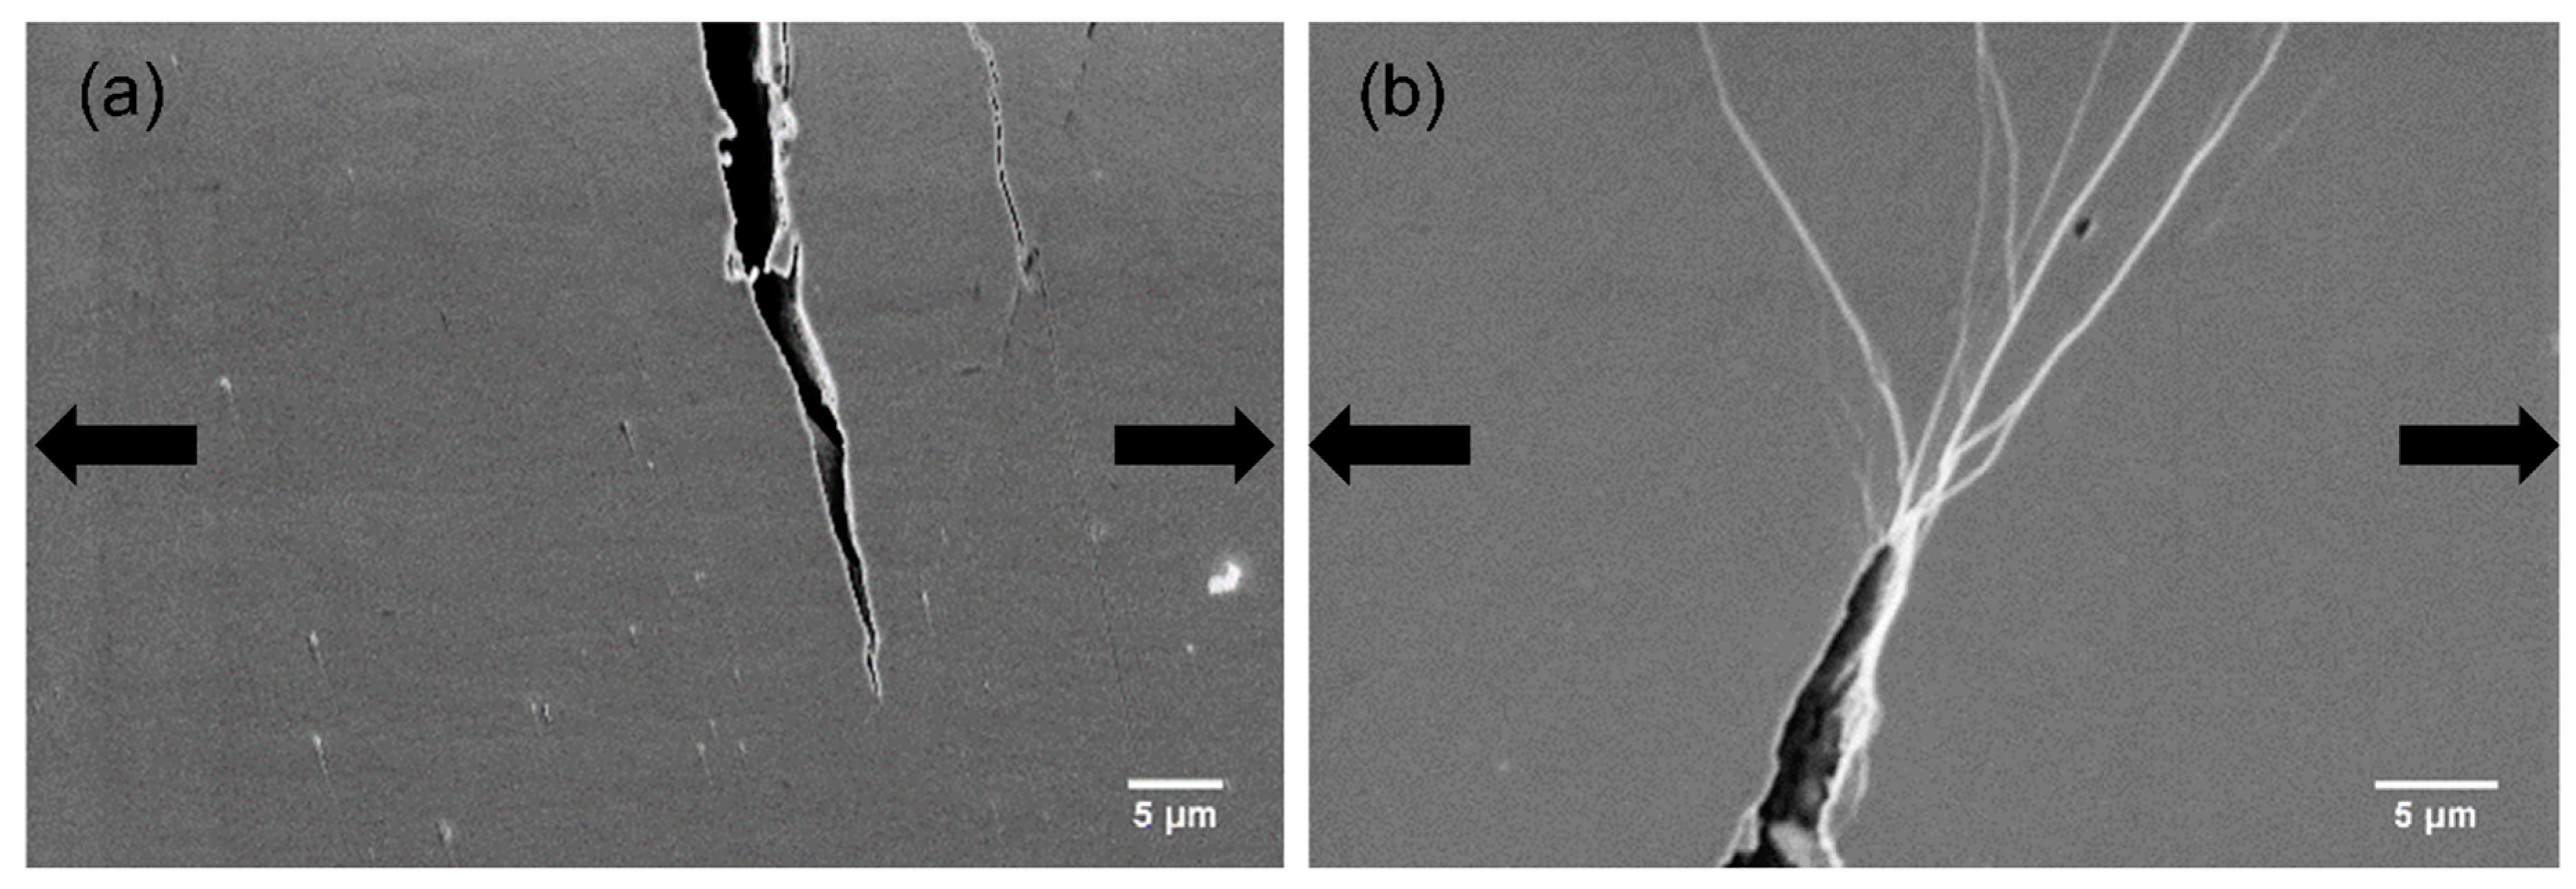
4.3. Propagation of Cracks
In alloys, the second-phase reinforcements with suitable size can blunt cracks, resulting in better mechanical performance.
Figure 10 illustrates the SEM images for crack tips on the HPT-treated (N = 2) Zr-0Co and Zr-8Co samples just before fracture. It is clear that, for the HPT-treated (N = 2) Zr-8Co sample, many SBs branching and interacting with each other at the tip could be observed, which were not detected for the HPT-treated (N = 2) Zr-0Co sample. In the HPT-treated (N = 2) Zr-8Co sample, the nanometer-scale crystalline second phase blocked and/or blunted the propagation of the crack. The stress was released by the formation of new SBs. The propagation of the newly formed SBs was inhibited again by branching and intersection [
12,
57].
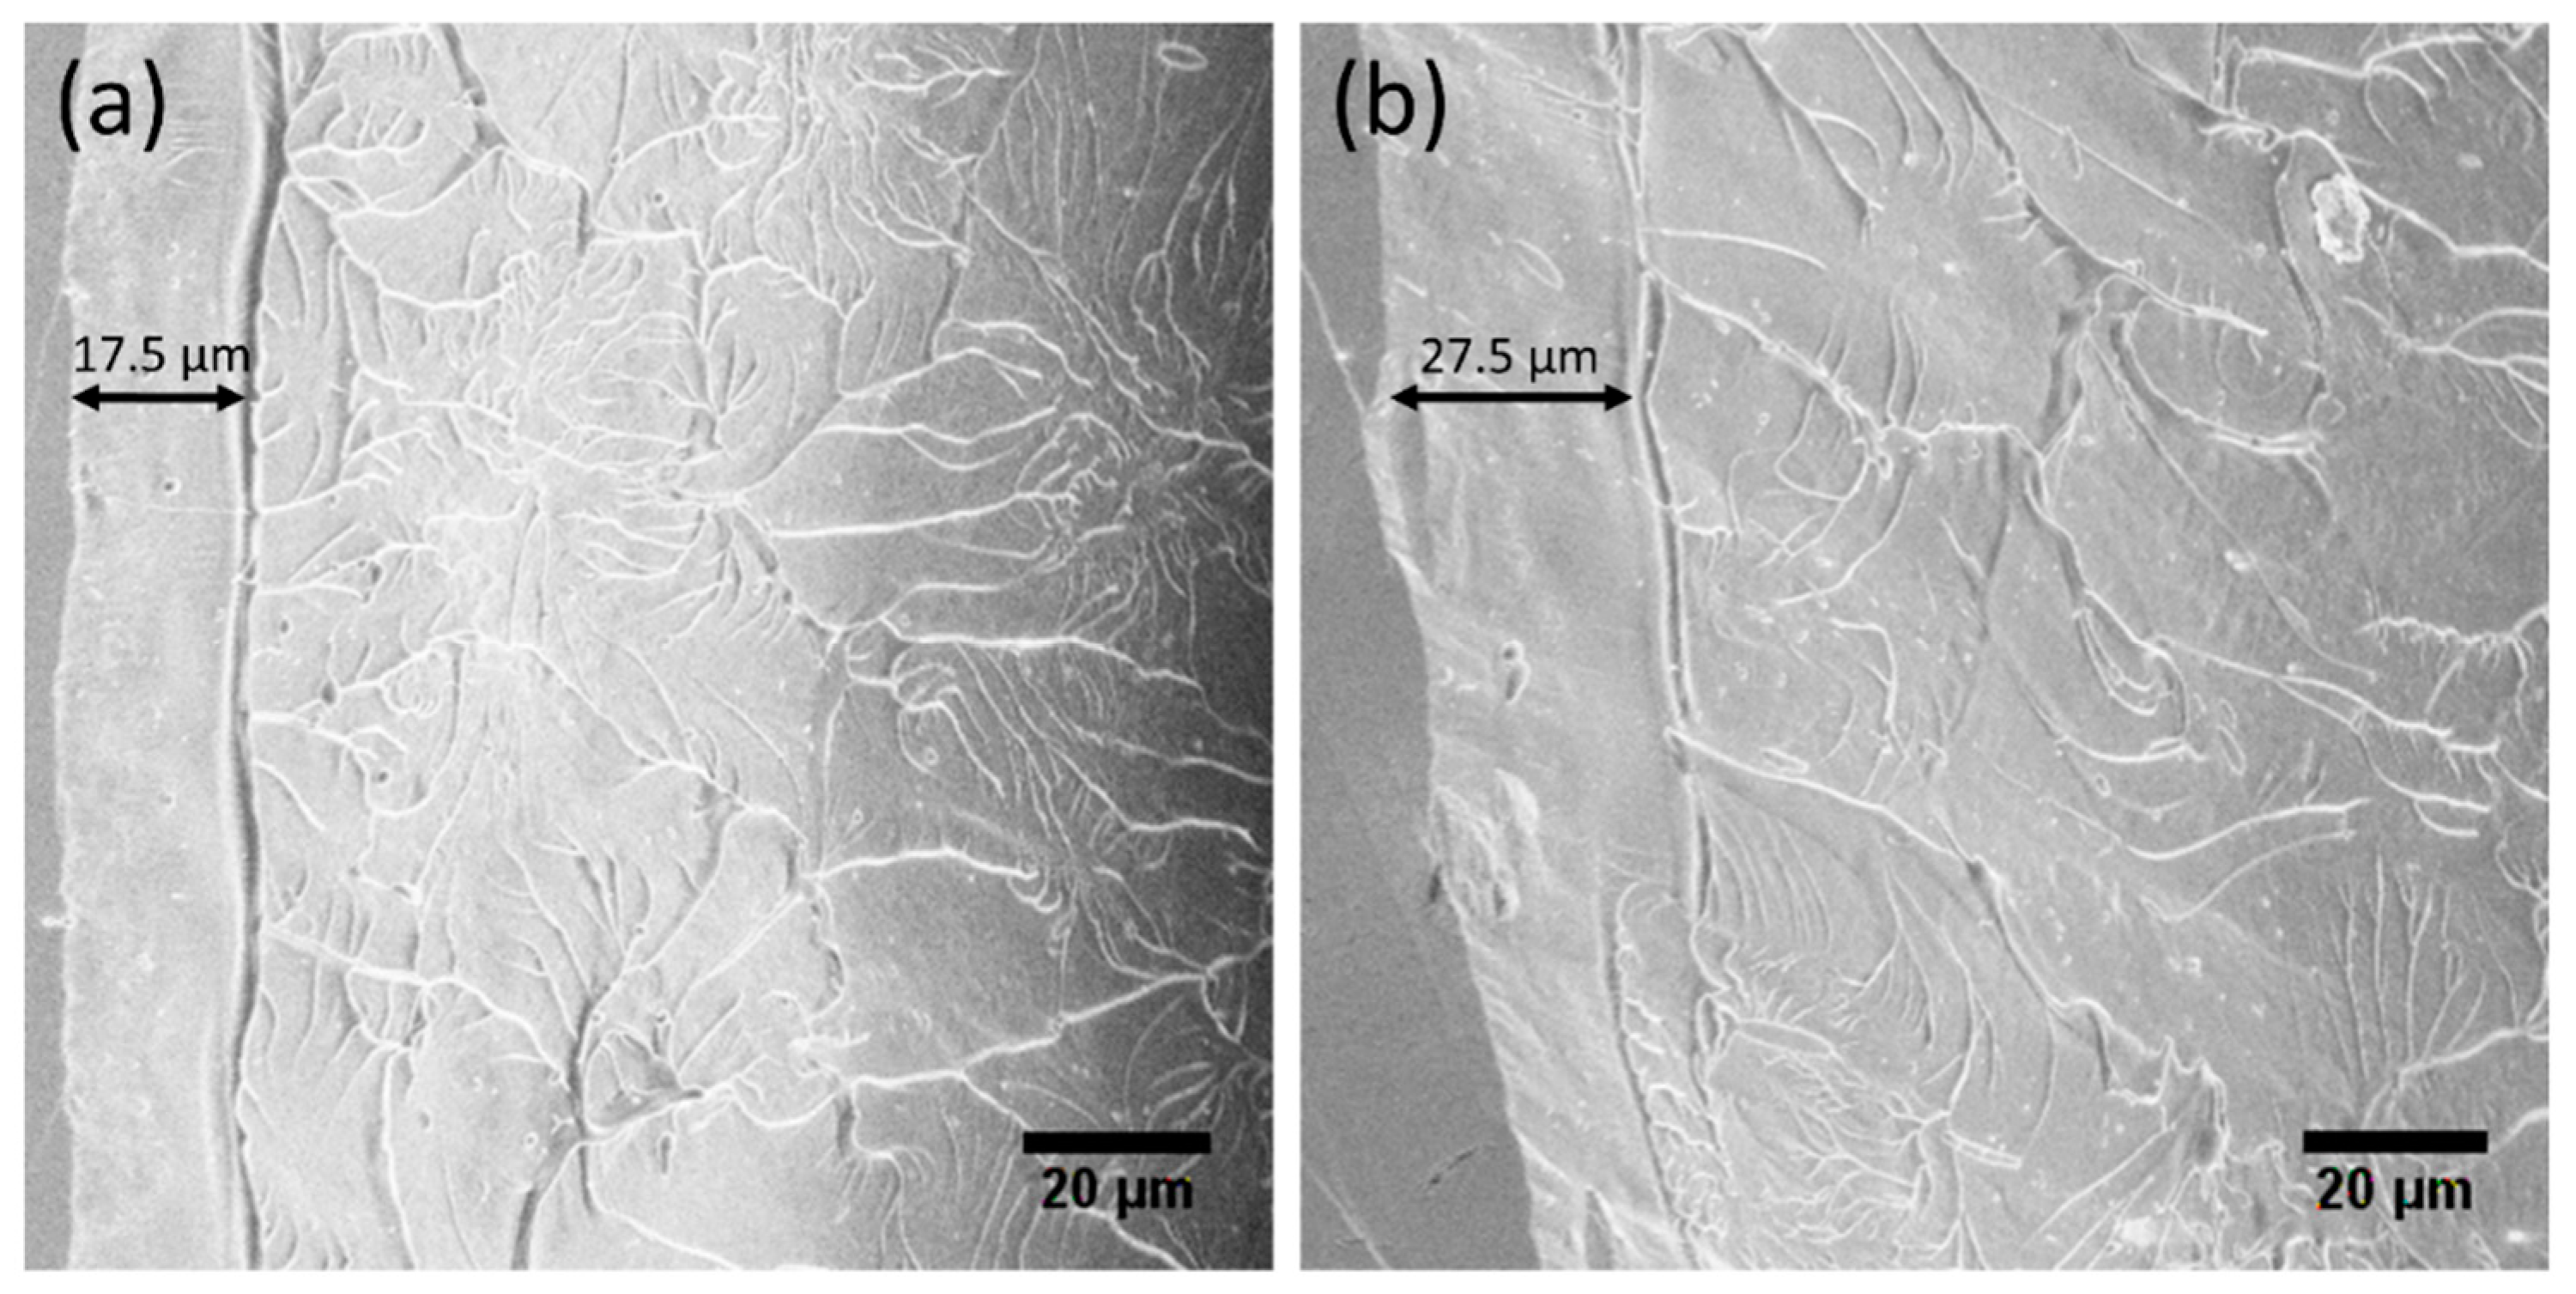
The fracture surface morphologies of the HPT-treated (N = 2) Zr-0Co and Zr-8Co MGs are shown in
Figure 11. The typical river-like features can be observed on both samples. It is worth noting that a flat and feature-less region runs parallel to the fractured edge. This corresponds to the shear offset caused by the SB propagation. The width of the shear offset was larger in the Zr-8Co sample than that in the Zr-0Co sample. This means that SBs in the HPT-treated (N = 2) Zr-8Co MG had less susceptibility to becoming a shear crack and each of them could carry a larger plastic strain. In combination with the increased number of SBs as analyzed above, the good tensile ductility of the HPT-treated (N = 2) Zr-8Co MG can be explained [
11,
58].
4.4. HPT Effects on Tensile Ductility of Both Types of MGs
Two rotations of HPT treatment showed the best enhancement effect on tensile ductility for both types of MGs, as shown on the stress–strain curves (
Figure 6). The correlation of the tensile plastic strain with the structure relaxation enthalpy on heating below the glass transition and the position of the first maximum in the S(q) indicated that the free volume played an important role in the increased plasticity. After HPT for two rotations, multiple SBs with excess free volume were formed in both types of MGs, in which more STZs and even more SBs could be further induced following tension, resulting in more homogeneous plastic deformation. In addition, these SBs could also interact with each other, which could further retard their propagation, improving tensile ductility [
59]. Further increasing the rotation number (N = 5, 10, and 20) led to the reduction of free volume (as discussed in
Section 4.1) and the decrease of SBs formed in following tension (as discussed in
Section 4.2), deteriorating the tensile ductility of samples.
After two rotations of HPT treatment, the nano-heterogeneous Zr-8Co sample had a more significant tensile plastic strain increase (0.1% to 0.9%) than the homogeneous Zr-0Co MG (0.1% to 0.5%). The first reason is that more SBs with excess free volume formed in the nano-heterogeneous structure during two rotations of HPT, illustrated by the change in structure relaxation enthalpy and mean atomic volume (
Table 2). Thus, the increased SB initiation regions resulted in more homogeneous plastic deformation in the following tensile test. The second reason is the formation of nanocrystalline particles, which could effectively inhibit the propagation of SBs and cracks. By further increasing the HPT rotation number (N = 5, 10, and 20), plastic strain reduction was also more significant for the nanostructured Zr-8Co MG (0.9% to 0.2%), because of the larger free volume annihilation (
Table 2) and growth of crystalline particles (
Figure 3e,f). The crystalline particles have little pinning effect when their size is larger than the SB thickness (~10 nm) [
16], whereby no displacement burst could be observed on the velocity profile of the nano-indenter on the Zr-Co8 (N = 20) sample. Their inhibition effect on crack propagation was also weakened. On the tip of the cracks, only very small SBs formed to release the stress concentration. Furthermore, their brittleness was harmful to the sample ductility.
5. Conclusions
In this work, the changes of microstructure and mechanical properties of the homogeneous Zr64Ni10Al7Cu19 MG (Zr-0Co) and nanometer-scale heterogeneous Zr55.7Ni10Al7Cu19Co8.3 MG (Zr-8Co) as a function of severe plastic deformation (HPT) were investigated.
It was found that the homogeneous structure of Zr-0Co MG remained fully amorphous during HPT up to 20 rotations. Nanocrystalline particles appeared in the Zr-8Co MG because of the lower thermal stability. Both samples had increased free volume after HPT for two rotations, which was more significant for Zr-8Co MG. Plasticity of both MG samples was improved by two rotations of HPT. A value of 0.9% plastic tensile strain was achieved on the HPT-treated (N = 2) Zr-8Co sample, which resulted from the higher number of formed SBs during tension and blunting of cracks by the nanocrystalline second phase. Further increasing the HPT rotation number (N = 5, 10, and 20) reduced sample plasticity.
Author Contributions
Conceptualization, Y.D., J.-Z.J., and H.-J.F.; methodology, Y.D., S.L., J.B., Q.C., and X.W.; software, Y.D.; validation, Y.D., Q.C., and J.-Z.J.; formal analysis, Y.D.; investigation, Y.D., J.-Z.J., and H.-J.F.; resources, Y.D., J.-Z.J., and H.-J.F.; data curation, Y.D., J.-Z.J., and H.-J.F.; writing—original draft preparation, Y.D.; writing—review and editing, Y.D., J.-Z.J., R.W., and H.-J.F.; visualization, Y.D.; supervision, H.-J.F.; project administration, H.-J.F.; funding acquisition, J.-Z.J. and H.-J.F.
Funding
Financial supports from the National Key Research and Development Program of China (2016YFB0700201, 2016YFB0701203, and 2017YFA0403400), the National Natural Science Foundation of China (U1832203, U1532115, 51671170 and 51671169), the China Scholarship Council (Grant No. 201306120026), the Natural Science Foundation of Zhejiang Province (grants Z1110196, Y4110192 and LY15E010003), KNMF project (2016-015-010609), German Academic Exchange Service DAAD (STIBET Doktoranden), Deutsches Zentrum für Luft- und Raumfahrt e.V. (DLR ThermoLab VI 50 WM 1759) and the Fundamental Research Funds for the Central Universities are gratefully acknowledged.
Acknowledgments
We are also grateful to Sabine Grözinger for TEM sample preparation, Yulia Ivanisenko for the HPT treatment and Shanoob Balachandran Nair for the 3DAPT measurements and analyses.
Conflicts of Interest
The authors declare no conflicts of interest.
References
- Klement, K.; Willens, R.H.; Duwez, P. Non-crystalline structure in solidified gold–silicon alloys. Nature 1960, 187, 869. [Google Scholar] [CrossRef]
- Peker, A.; Johnson, W.L. A highly processable metallic glass: Zr41.2Ti13.8Cu12.5Ni10.0Be22.5. Appl. Phys. Lett. 1993, 63, 2342–2344. [Google Scholar] [CrossRef]
- Nishiyama, N.; Inoue, A. Flux treated Pd–Cu–Ni–P amorphous alloy having low critical cooling rate. Mater. Trans. JIM 1997, 38, 464–472. [Google Scholar] [CrossRef]
- Guo, F.; Poon, S.J.; Shiflet, J.G. Metallic glass ingots based on yttrium. Appl. Phys. Lett. 2003, 83, 2575–2577. [Google Scholar] [CrossRef]
- Ma, H.; Shi, L.L.; Xu, J.; Li, Y.; Ma, E. Discovering inch-diameter metallic glasses in three-dimensional composition space. Appl. Phys. Lett. 2005, 87, 181915. [Google Scholar] [CrossRef]
- Jiang, Q.K.; Zhang, G.Q.; Yang, L.; Wang, X.D.; Saksl, K.; Franz, H.; Wunderlich, R.; Fecht, H.-J.; Jiang, J.Z. La-based bulk metallic glasses with critical diameter up to 30 mm. Acta Mater. 2007, 55, 4409–4418. [Google Scholar] [CrossRef]
- Jiang, Q.K.; Wang, X.D.; Nie, X.P.; Zhang, G.Q.; Ma, H.; Fecht, H.-J.; Bednarcik, J.; Franz, H.; Liu, Y.G.; Cao, Q.P.; et al. Zr–(Cu, Ag)–Al bulk metallic glasses. Acta Mater. 2008, 56, 1785–1796. [Google Scholar] [CrossRef]
- Lou, H.B.; Wang, X.D.; Xu, F.; Ding, S.Q.; Cao, Q.P.; Hono, K.; Jiang, J.Z. 73 mm-diameter bulk metallic glass rod by copper mould casting. Appl. Phys. Lett. 2011, 99, 051910. [Google Scholar] [CrossRef]
- Wang, M.Q.; Zhang, H.F.; Zhu, Z.W.; Fu, H.M.; Wang, A.M.; Li, H.; Hu, Z.Q. TiZr-base Bulk Metallic Glass with over 50 mm in diameter. J. Mater. Sci. Technol. 2010, 26, 481–486. [Google Scholar]
- Liu, Y.H.; Wang, G.; Wang, R.J.; Zhao, D.Q.; Pan, M.X.; Wang, W.H. Super plastic bulk metallic glasses at room temperature. Science 2007, 315, 1385–1388. [Google Scholar] [CrossRef] [PubMed]
- Cao, Q.P.; Liu, J.W.; Yang, K.J.; Xu, F.; Minkow, A.; Fecht, H.-J.; Ivanisenko, J.; Chen, L.Y.; Wang, X.D.; Qu, S.X.; et al. Effect of pre-existing shear bands on the tensile mechanical properties of a bulk metallic glass. Acta Mater. 2010, 58, 1276–1296. [Google Scholar] [CrossRef]
- Liu, J.W.; Cao, Q.P.; Chen, L.Y.; Wang, X.D.; Jiang, J.Z. Shear band evolution and hardness change in cold-rolled bulk metallic glasses. Acta Mater. 2010, 58, 4827–4840. [Google Scholar] [CrossRef]
- Nie, X.P.; Yang, X.H.; Ma, Y.; Chen, L.Y.; Yeap, K.B.; Zeng, K.Y.; Li, D.; Pan, J.S.; Wang, X.D.; Cao, Q.P.; et al. The effect of oxidation on the corrosion resistance and mechanical properties of a Zr-based metallic glass. Corros. Sci. 2011, 53, 3557–3565. [Google Scholar] [CrossRef]
- Wang, W.H.; Dong, C.; Shek, C.H. Bulk metallic glasses. Mater. Sci. Eng. R 2004, 44, 45–89. [Google Scholar] [CrossRef]
- Szuecs, F.; Kim, C.P.; Johnson, W.L. Mechanical properties of Zr56.2Ti13.8Nb5.0Cu6.9Ni5.6Be12.5 ductile phase reinforced bulk metallic glass composite. Acta Mater. 2001, 49, 1507–1513. [Google Scholar] [CrossRef]
- Greer, A.L.; Cheng, Y.Q.; Ma, E. Shear bands in metallic glasses. Mater. Sci. Eng. R 2013, 74, 71–132. [Google Scholar] [CrossRef]
- Pampillo, C.A. Flow and fracture in amorphous alloys. J. Mater. Sci. 1975, 10, 1194–1227. [Google Scholar] [CrossRef]
- Schuh, C.A.; Hufnagel, T.C.; Ramamurty, U. Mechanical behavior of amorphous alloys. Acta Mater. 2007, 55, 4067–4109. [Google Scholar] [CrossRef]
- Chen, L.Y.; Fu, Z.D.; Zhang, G.Q.; Hao, X.P.; Jiang, Q.K.; Wang, X.D.; Cao, Q.P.; Franz, H.; Liu, Y.G.; Xie, H.S.; et al. New class of plastic bulk metallic glass. Phys. Rev. Lett. 2008, 100, 075501. [Google Scholar] [CrossRef] [PubMed]
- Du, X.H.; Huang, J.C.; Hsieh, K.C.; Jang, J.S.C.; Liaw, P.K.; Chen, H.M.; Chou, H.S.; Lai, Y.H. Designing ductile Zr-based bulk metallic glasses with phase separated microstructure. Adv. Eng. Mater. 2009, 11, 387–391. [Google Scholar] [CrossRef]
- Gleiter, H. Our thoughts are ours, their ends none of our own: Are there ways to synthesize materials beyond the limitations of today? Acta Mater. 2008, 56, 5875–5893. [Google Scholar] [CrossRef]
- Wang, X.D.; Cao, Q.P.; Jiang, J.Z.; Franz, H.; Schroers, J.; Valiev, R.Z.; Ivanisenko, Y.; Gleiter, H.; Fecht, H.-J. Atomic-level structural modifications induced by severe plastic shear deformation in bulk metallic glasses. Scr. Mater. 2011, 64, 81–84. [Google Scholar] [CrossRef]
- Wang, X.L.; Jiang, F.; Hahn, H.; Li, J.; Gleiter, H.; Sun, J.; Fang, J.X. Sample size effects on strength and deformation mechanism of Sc75Fe25 nanoglass and metallic glass. Scr. Mater. 2016, 116, 95–99. [Google Scholar] [CrossRef]
- Zhou, H.F.; Zhong, C.; Cao, Q.P.; Qu, S.X.; Wang, X.D.; Yang, W.; Jiang, J.Z. Non-localized deformation in metallic alloys with amorphous structure. Acta Mater. 2014, 68, 32–41. [Google Scholar] [CrossRef]
- Zhong, C.; Zhang, H.; Cao, Q.P.; Wang, X.D.; Zhang, D.X.; Hu, J.W.; Liaw, P.K.; Jiang, J.Z. Non-localized deformation in Cu Zr multi-layer amorphous films under tension. J. Alloys Compd. 2016, 678, 410–420. [Google Scholar] [CrossRef]
- Wang, Y.; Li, M.; Xu, J. Toughen and harden metallic glass through designing statistical heterogeneity. Scr. Mater. 2016, 113, 10–13. [Google Scholar] [CrossRef]
- Gleiter, H. Nanoglasses: A new kind of noncrystalline materials. Beilstein J. Nanotechnol. 2013, 4, 517–533. [Google Scholar] [CrossRef]
- Dong, Y.; Wunderlich, R.; Biskupek, J.; Cao, Q.P.; Wang, X.D.; Zhang, D.X.; Jiang, J.Z.; Fecht, H.-J. Co content effect on elastic strain limit in ZrCuNiAlCo bulk metallic glasses. Scr. Mater. 2017, 137, 94–99. [Google Scholar] [CrossRef]
- Zhang, Y.; Wang, W.H.; Greer, A.L. Making metallic glasses plastic by control of residual stress. Nat. Mater. 2006, 5, 857–860. [Google Scholar] [CrossRef] [PubMed]
- Zhu, Y.T.; Lowe, T.C.; Langdon, T.G. Performance and applications of nanostructured materials produced by severe plastic deformation. Scr. Mater. 2004, 51, 825–830. [Google Scholar] [CrossRef]
- Azushima, A.; Kopp, R.; Korhonen, A.; Yang, D.; Micari, F.; Lahoti, G.; Groche, P.; Yanagimoto, J.; Tsuji, N.; Rosochowski, A.; et al. Severe plastic deformation (SPD) processes for metals. CIRP Ann. Manuf. Technol. 2008, 57, 716–735. [Google Scholar] [CrossRef]
- Hóbor, S.; Kovács, Z.; Révész, Á. Effect of accumulated shear on the microstructure and morphology of severely deformed Cu60Zr30Ti10 metallic glass. J. Alloys Compd. 2011, 509, 8641–8648. [Google Scholar] [CrossRef]
- Van Steenberge, N.; Hóbor, S.; Suriñach, S.; Zhilyaev, A.; Houdellier, F.; Mompiou, F.; Baró, M.D.; Révész, Á.; Sort, J. Effects of severe plastic deformation on the structure and thermo-mechanical properties of Zr55Cu30Al10Ni5 bulk metallic glass. J. Alloys Compd. 2010, 500, 61–67. [Google Scholar] [CrossRef]
- Hóbor, S.; Révész, Á.; Szabó, P.J.; Zhilyaev, A.P.; Kis, V.K.; Lábár, J.L.; Kovács, Z. High pressure torsion of amorphous Cu60Zr30Ti10 alloy. J. Appl. Phys. 2008, 104, 033525. [Google Scholar] [CrossRef]
- Li, W.; Li, L.; Nan, Y.; Xu, Z.; Zhang, X.; Popov, A.G.; Gunderov, D.V.; Stolyarov, V.V. Nanocrystallization and magnetic properties of amorphous Nd9Fe85B6 subjected to high-pressure torsion deformation upon annealing. J. Appl. Phys. 2008, 104, 023912. [Google Scholar] [CrossRef]
- Valiev, R.Z.; Gunderov, D.V.; Zhilyaev, A.P.; Popov, A.G.; Pushin, V.G. Nanocrystallization induced by severe plastic deformation of amorphous alloys. J. Metast. Nanocrystalline Mater. 2004, 22, 21–26. [Google Scholar] [CrossRef]
- Dmowski, W.; Yokoyama, Y.; Chuang, A.; Ren, Y.; Umemoto, M.; Tsuchiya, K.; Inoue, A.; Egami, T. Structural rejuvenation in a bulk metallic glass induced by severe plastic deformation. Acta Mater. 2010, 58, 429–438. [Google Scholar] [CrossRef]
- Révész, Á.; Schafler, E.; Kovács, Z. Structural anisotropy in a Zr57Ti5Cu20Al10Ni8 bulk metallic glass deformed by high pressure torsion at room temperature. Appl. Phys. Lett. 2008, 92, 011910. [Google Scholar] [CrossRef]
- Sun, Y.F.; Nakamura, T.; Todaka, Y.; Umemoto, M.; Tsuji, N. Fabrication of CuZr (Al) bulk metallic glasses by high pressure torsion. Intermetallics 2009, 17, 256–261. [Google Scholar] [CrossRef]
- Sun, Y.F.; Fujii, H.; Tsuji, N.; Todaka, Y.; Umemoto, M. Fabrication of ZrAlNiCu bulk metallic glass composites containing pure copper particles by high-pressure torsion. J. Alloys Compd. 2010, 492, 149–152. [Google Scholar] [CrossRef]
- Denis, P.; Meylan, C.M.; Ebner, C.; Greer, A.L.; Zehetbauer, M.; Fecht, H.-J. Rejuvenation decreases shear band sliding velocity in Pt-based metallic glasses. Mater. Sci. Eng. A 2017, 684, 517–523. [Google Scholar] [CrossRef]
- Joo, S.H.; Pi, D.H.; Setyawan, A.D.H.; Kato, H.; Janecek, M.; Kim, Y.C.; Lee, S.; Kim, H.S. Work-hardening induced tensile ductility of bulk metallic glasses via high-pressure torsion. Sci. Rep. 2015, 5, 9660. [Google Scholar] [CrossRef] [PubMed]
- Adachi, N.; Todaka, Y.; Yokoyama, Y.; Umemoto, M. Cause of hardening and softening in the bulk glassy alloy Zr50Cu40Al10 after high-pressure torsion. Mater. Sci. Eng. A 2015, 627, 171–181. [Google Scholar] [CrossRef]
- Denis, P.; Ababei, G.; Meylan, C.M.; Greer, A.L.; Fecht, H.-J. Indenter size effect in high-pressure torsion deformed Pd-based metallic glass. Int. J. Mater. Res. 2018, 109, 381–385. [Google Scholar] [CrossRef]
- Boltynjuk, E.V.; Gunderov, D.V.; Ubyivovk, E.V.; Monclus, M.A.; Yang, L.W.; Molina-Aldareguia, J.M.; Tyurin, A.I.; Kilmametov, A.R.; Churakova, A.A.; Churyumov, A.Y.; et al. Enhanced strain rate sensitivity of Zr-based bulk metallic glasses subjected to high pressure torsion. J. Alloys Compd. 2018, 747, 595–602. [Google Scholar] [CrossRef]
- Zhang, Z.F.; Eckert, J.; Schultz, L. Difference in compressive and tensile fracture mechanisms of Zr59Cu20Al10Ni8Ti3 bulk metallic glass. Acta Mater. 2003, 51, 1167–1179. [Google Scholar] [CrossRef]
- Mukai, T.; Nieh, T.G.; Kawamura, Y.; Inoue, A.; Higashi, K. Dynamic response of a Pd40Ni40P20 bulk metallic glass in tension. Scr. Mater. 2002, 46, 43–47. [Google Scholar] [CrossRef]
- Turnbull, D. On the Free-Volume Model of the Liquid-Glass Transition. J. Chem. Phys. 1970, 52, 3038–3341. [Google Scholar] [CrossRef]
- Slipenyuk, A.; Eckert, J. Correlation between enthalpy change and free volume reduction during structural relaxation of Zr55Cu30Al10Ni5 metallic glass. Scr. Mater. 2004, 50, 39–44. [Google Scholar] [CrossRef]
- Liu, Z.; Chan, K.C.; Liu, L. Effect of alloying elements with positive heat of mixing on the free volume and compressive plasticity in ZrCoCuAl bulk metallic glasses. Mater. Trans. 2013, 54, 2209–2214. [Google Scholar] [CrossRef]
- Ketov, S.V.; Sun, Y.H.; Nachum, S.; Lu, Z.; Checchi, A.; Beraldin, A.R.; Bai, H.Y.; Wang, W.H.; Louzguine-Luzgin, D.V.; Carpenter, M.A.; et al. Rejuvenation of metallic glasses by non-affine thermal strain. Nature 2015, 524, 200. [Google Scholar] [CrossRef] [PubMed]
- Jiang, J.Z.; Roseker, W.; Sikorski, M.; Cao, Q.P.; Xu, F. Pressure effect of glass transition temperature in Zr46.8Ti8.2Cu7.5Ni10Be27.5 bulk metallic glass. Appl. Phys. Lett. 2004, 84, 1871–1873. [Google Scholar] [CrossRef]
- Aronin, A.; Matveev, D.; Pershina, E.; Tkatch, V.; Abrosimova, G. The effect of changes in Al-based amorphous phase structure on structure forming upon crystallization. J. Alloys Compd. 2017, 715, 176–183. [Google Scholar] [CrossRef]
- Zhang, Z.F.; Eckert, J.; Schultz, L. Fatigue and fracture behavior of bulk metallic glass. Metall. Mater. Trans. A 2004, 35A, 3489–3498. [Google Scholar] [CrossRef]
- Son, J.H.; Oh, M.W.; Kim, B.S.; Park, S.D.; Min, B.K.; Kim, M.W.; Lee, H.W. Effect of ball milling time on the thermoelectric properties of p-type (Bi, Sb) 2Te3. J. Alloys Compd. 2013, 566, 168–174. [Google Scholar] [CrossRef]
- Zhou, F.; Liao, X.Z.; Zhu, Y.T.; Dallek, S.; Lavernia, E.J. Microstructural evolution during recovery and recrystallization of a nanocrystalline Al-Mg alloy prepared by cryogenic ball milling. Acta Mater. 2003, 51, 2777–2791. [Google Scholar] [CrossRef]
- Xie, S.; George, E.P. Hardness and shear band evolution in bulk metallic glasses after plastic deformation and annealing. Acta Mater. 2008, 56, 5202–5213. [Google Scholar] [CrossRef]
- Demetriou, M.D.; Launey, M.E.; Garrett, G.; Schramm, J.P.; Hofmann, D.C.; Johnson, W.L.; Ritchie, R.O. A damage-tolerant glass. Nat. Mater. 2011, 10, 123–128. [Google Scholar] [CrossRef]
- Hays, C.C.; Kim, C.P.; Johnson, W.L. Microstructure controlled shear band pattern formation and enhanced plasticity of bulk metallic glasses containing in situ formed ductile phase dendrite dispersions. Phys. Rev. Lett. 2000, 84, 2901. [Google Scholar] [CrossRef]
Figure 1.
Differential scanning calorimeter curves of (a) Zr64Ni10Al7Cu19 (Zr-0Co) and (b) Zr55.7Ni10Al7Cu19Co8.3 (Zr-8Co) metallic glasses (MGs) as a function of the number of high-pressure torsion (HPT) rotations. Relaxation energy release below Tg of (c) Zr-0Co and (d) Zr-8Co MGs as a function of the number of HPT rotations.
Figure 2.
Transmission electron microscope (TEM) images of Zr-0Co. (a) Dark-field image of as-cast sample. (b) High-resolution TEM (HRTEM) image of as-cast sample. (c) Dark-field image of the HPT-treated (N = 2) sample. (d) HRTEM image of the HPT-treated (N = 2) sample. (e) Dark-field image of the HPT-treated (N = 20) sample. (f) HRTEM image of the HPT-treated (N = 20) sample. The inserts show the electron diffraction patterns.
Figure 3.
Transmission electron microscope images of Zr-8Co. (a) Dark-field image of as-cast sample. (b) HRTEM image of as-cast sample. (c) Dark-field image of the HPT-treated (N = 2) sample. The arrows indicate the shear bands. (d) HRTEM image of the HPT-treated (N = 2) sample. The circles indicate the nanocrystalline particles. (e) Dark-field image of the HPT-treated (N = 20) sample. The arrows indicate the nanocrystalline particles. (f) HRTEM image of the HPT-treated (N = 20) sample. The circles indicate the nanocrystalline particles. The inserts show the electron diffraction patterns.
Figure 4.
X-ray diffraction (XRD) patterns of as-cast MGs and MG samples after HPT treatments: (a) Zr-0Co and (b) Zr-8Co.
Figure 4.
X-ray diffraction (XRD) patterns of as-cast MGs and MG samples after HPT treatments: (a) Zr-0Co and (b) Zr-8Co.
Figure 5.
Structure factor S(q) of as-cast MGs and MG samples after HPT treatments: (a) Zr-0Co and (b) Zr-8Co.
Figure 5.
Structure factor S(q) of as-cast MGs and MG samples after HPT treatments: (a) Zr-0Co and (b) Zr-8Co.
Figure 6.
Tensile stress–strain curves of Zr-0Co and Zr-8Co samples before and after HPT processes. The curves are shifted relative to each other for clarity.
Figure 6.
Tensile stress–strain curves of Zr-0Co and Zr-8Co samples before and after HPT processes. The curves are shifted relative to each other for clarity.
Figure 7.
Densest areas of shear bands on the surface of the Zr-0Co samples (a) as-cast, (b) N = 2, and (c) N = 20, when the load almost reached the yield point. The arrows indicate the tensile orientation.
Figure 7.
Densest areas of shear bands on the surface of the Zr-0Co samples (a) as-cast, (b) N = 2, and (c) N = 20, when the load almost reached the yield point. The arrows indicate the tensile orientation.
Figure 8.
Densest areas of shear bands on the surface of Zr-8Co samples (a) as-cast, (b) N = 2, and (c) N = 20, when the load almost reached the yield point. The arrows indicate the tensile orientation.
Figure 8.
Densest areas of shear bands on the surface of Zr-8Co samples (a) as-cast, (b) N = 2, and (c) N = 20, when the load almost reached the yield point. The arrows indicate the tensile orientation.
Figure 9.
(a) Nanoindentation measurement curves of the HPT-treated (N = 2) Zr-0Co MG and HPT-treated (N = 2) Zr-8Co MG. (b) Beginning of plastic deformation on nanoindentation measurement curves of both types of MGs. (c) Velocity profile of the indenter on the HPT-treated (N = 2) Zr-0Co MG. (d) Velocity profile of the indenter on the HPT-treated (N = 2) Zr-8Co MG. (e) SEM image of indentation on the HPT-treated (N = 2) Zr-0Co MG. (f) SEM image of indentation on the HPT-treated (N = 2) Zr-8Co MG.
Figure 10.
SEM images of cracks tips during tensile tests of the deformed HPT-treated (N = 2) samples of (a) Zr-0Co and (b) Zr-8Co. The arrows indicate the loading orientation.
Figure 10.
SEM images of cracks tips during tensile tests of the deformed HPT-treated (N = 2) samples of (a) Zr-0Co and (b) Zr-8Co. The arrows indicate the loading orientation.
Figure 11.
SEM fractographic images of (a) the HPT-treated (N = 2) Zr-0Co MG, and (b) the HPT-treated (N = 2) Zr-8Co MG.
Figure 11.
SEM fractographic images of (a) the HPT-treated (N = 2) Zr-0Co MG, and (b) the HPT-treated (N = 2) Zr-8Co MG.
Table 1.
Thermal parameters of glass transition temperature Tg, first crystallization temperature Tx1, second crystallization temperature Tx2, melting temperature Tl, first crystallization enthalpy ∆Hx1, and second crystallization enthalpy ∆Hx2 of Zr64Ni10Al7Cu19 (Zr-0Co) and Zr55.7Ni10Al7Cu19Co8.3 (Zr-8Co) metallic glass (MG) samples before and after high-pressure torsion (HPT) processes (N = 2, 5, 10, and 20).
| | Zr64Ni10Al7Cu19 | Zr55.7Ni10Al7Cu19Co8.3 |
|---|
| As Cast | N = 2 | N = 5 | N = 10 | N = 20 | As Cast | N = 2 | N = 5 | N = 10 | N = 20 |
|---|
| Tg (K) | 648 ± 3 | 649 ± 3 | 647 ± 3 | 650 ± 3 | 648 ± 3 | 674 ± 3 | 676 ± 3 | 673 ± 3 | 675 ± 3 | 675 ± 3 |
| Tx1 (K) | 720 ± 3 | 723 ± 3 | 724 ± 3 | 721 ± 3 | 723 ± 3 | 700 ± 3 | 699 ± 3 | 703 ± 3 | 701 ± 3 | 702 ± 3 |
| Tx2 (K) | - | - | - | - | - | 794 ± 3 | 792 ± 3 | 795 ± 3 | 796 ± 3 | 794 ± 3 |
| Tl (K) | 1182 ± 3 | 1185 ± 3 | 1184 ± 3 | 1186 ± 3 | 1187 ± 3 | 1268 ± 3 | 1265 ± 3 | 1267 ± 3 | 1270 ± 3 | 1268 ± 3 |
| ∆Hx1 (J/g) | −60 ± 2 | −60 ± 2 | −57 ± 2 | −57 ± 2 | −58 ± 2 | −28 ± 2 | −29 ± 2 | −26 ± 2 | −27 ± 2 | −26 ± 2 |
| ∆Hx2 (J/g) | - | - | - | - | - | −13 ± 1 | −13 ± 1 | −13 ± 1 | −12 ± 1 | −13 ± 1 |
Table 2.
Tensile plastic strain, enthalpy of relaxation, position of the first maximum on structure factor curves, and the width of X-ray diffraction (XRD) peak at half height of Zr-0Co and Zr-8Co MG samples before and after HPT processes (N = 2, 5, 10 and 20).
Table 2.
Tensile plastic strain, enthalpy of relaxation, position of the first maximum on structure factor curves, and the width of X-ray diffraction (XRD) peak at half height of Zr-0Co and Zr-8Co MG samples before and after HPT processes (N = 2, 5, 10 and 20).
| | Zr64Ni10Al7Cu19 | Zr55.7Ni10Al7Cu19Co8.3 |
|---|
| As Cast | N = 2 | N = 5 | N = 10 | N = 20 | As Cast | N = 2 | N = 5 | N = 10 | N = 20 |
|---|
| Tensile plastic strain (%) | 0.1 ± 0.1 | 0.5 ± 0.1 | 0.2 ± 0.1 | 0.2 ± 0.1 | 0.2 ± 0.1 | 0.1 ± 0.1 | 0.9 ± 0.1 | 0.2 ± 0.1 | 0.1 ± 0.1 | 0.2 ± 0.1 |
| Enthalpy of relaxation (J/g) | −4.9 ± 0.5 | −8.4 ± 0.5 | −7.1 ± 0.5 | −7.5 ± 0.5 | −7.3 ± 0.5 | −10.9 ± 0.5 | −17.3 ± 0.5 | −6.0 ± 0.5 | −6.2 ± 0.5 | −6.3 ± 0.5 |
| Position of first maximum (Å−1) | 2.587 ± 0.001 | 2.584 ± 0.001 | - | - | 2.583 ± 0.001 | 2.620 ± 0.001 | 2.614 ± 0.001 | - | - | 2.617 ± 0.001 |
| Width of XRD peak (°) | 5.4 ± 0.1 | 5.9 ± 0.1 | 5.8 ± 0.1 | 5.7 ± 0.1 | 5.8 ± 0.1 | 6.1 ± 0.1 | 6.8 ± 0.1 | 6.8 ± 0.1 | 6.7 ± 0.1 | 6.7 ± 0.1 |
© 2019 by the authors. Licensee MDPI, Basel, Switzerland. This article is an open access article distributed under the terms and conditions of the Creative Commons Attribution (CC BY) license (http://creativecommons.org/licenses/by/4.0/).

 ,
, 


