Abstract
Due to the complex composition and high proportion of alloys in traditional ultra-high-strength steel, the dilemma caused by ultra-high strength and low toughness in casting and forging forming processes requiring subsequent heat treatment can be mitigated with an efficient and economical rolling process. In this work, a thermodynamic model is proposed to calculate the change in the mechanical response due to the thermal contribution based on alloy phase diagrams. The influence of alloy content on precision laws was analyzed, and the chemical component was optimized. A verification simulation without real experiment was conducted to study the potential and limitations of the alloy content on mechanical properties. The results showed that the main equilibrium phases and the phases’ chemical compounds were clarified. The influences of Ni, Mo, Cr, and W on transformation laws were elucidated in detail, and the main optimized composition was determined to be 0.23C, 1.96Si, 1.93Mn, 0.07Ni, 1.96Cr, and 0.35Mo. At a cooling rate of 10 °C/s, the content of optimized alloying element fully performed its role in steel, verifying that the chemical component system was in the optimal range. The thermodynamic models and our conclusions have the potential to be generalized for many other materials and process configurations without requiring extensive material testing.
1. Introduction
The traditional ultra-high strength steel (UHSS) alloy composition system is complex and high in alloy content [1,2]. The system is usually used to precipitate alloy carbide particles on a fine high carbon flake martensitic matrix to enhance the dispersion precipitation strengthening effect and to achieve ultra-high mechanical strength. However, due to the large proportion of alloy content, the toughness is lowered and does not match the ultra-high strength, so subsequent heat treatment, such as quenching and tempering or quenching and partitioning, is required [3,4,5,6]. Therefore, the UHSS traditional process challenge caused by the high cost and high consumption of alloy need to be solved. The rolling process is efficient and reduces alloy, and could be an effective method to solve the current problem [7]. Moreover, In order to optimize and design the reduction chemical component system and apply to rolling process, thermodynamic model calculation and analysis are important research methods for minimizing chemical component design and prediction of mechanical properties of UHSS.
The crystal structure of the precipitation phase of alloying elements varies with different rolling temperatures, and can include the body-centered cubic phase (bcc), face-centered-cubic phase (fcc), alloy carbide (MC), alloy carbonitride (M(C,N)), and other forms. In order to calculate the mixed entropy of each chemical component phase, Hillert et al. [8] constructed a double sublattice model of (A, B)a(C, D)c type, where A and B are substitute elements or atoms, which together occupy a sublattice position, whereas C and D are gap chemical components or atoms occupy another sublattice position, and the letters a and c represent the number of positions in various sublattices. Based on Hiller’s research, Sundman et al. [9] extended the (A, B)a(C, D)c model into a multi-lattice model that can accommodate an infinite number of chemical components. The model expression is:
where is the free energy of the compound I, as is site fraction of chemical component a on sublattice s, PIZ is the product of the positional scores of each chemical component, LIZ is the interaction parameter, IZ is the order of the array of chemical components, and I in is chemical component is the lattice location score.
The above thermodynamic model has received substantial attention. Many prior studies [10,11,12,13,14,15,16,17,18] proposed mathematical models for microstructure calculation, mechanical properties, and continuous cooling transformation based on parameters such as phase composition and compound. Moreover, Egea et al. [19,20] proposed thermodynamic models and described the change in the mechanical properties of wires. Allen, Liu, and Wang et al. [21,22,23] analyzed the crystal plasticity model, the plasticity model of DP600, and the prediction model of Inconel 625. However, most of the research in this field aimed at solving and verifying the accuracy of the model based on experimental results and correcting the correlation coefficient of the model.
The overall goal of this work was to optimize the chemical components in the rolling process. Unlike the aforementioned studies, the thermodynamic mathematical model here was used to investigate the influences of alloy content on the phase diagram and precision laws. The chemical component system was optimized by reducing Ni, reducing Mo, removing W, increasing Cr, and obtaining the same phase diagram compared with the origin content. Finally, using common process parameters of cooling rate at 10 °C/s after direct hot rolling, the result showed that the content of optimized alloying element fully performed its role in steel, verifying that the chemical component system was in the optimal range. This paper offers a novel research method for ultra-high strength steel and provides theoretical and practical guidance for rolling production.
2. Thermodynamic Calculation Model
2.1. Microstructure and Phase Calculation Model
Due to the different chemical components composed of different alloying elements and the different volume fractions of the chemical components, the performance values of the specific phases of the chemical components will also be different. The relationship between the chemical components and the properties can be expressed by Equation (2) [24]. According to the compositional phase properties and volume fraction of the material, the general properties of the material can be calculated by using the mixing in Equation (3) [9].
where P is the strength value of the phase; is the strength value of the pure phase; is the coefficient of the v phase; xi and xj are the mole fractions of the i and j chemical components, respectively; the correlation of the mixed phase of the experimental material is obtained by Pt performance; xα and xγ are the molar fractions of the α phase and γ phase, respectively; Pα is the strength of the α phase; Pγ is strength of the γ phase; and PIII is the strength of phase III.
2.2. Yield Strength Calculation Model
Based on the Hall–Petch grain strengthening in Equation (4) [11,25,26] and the Ashby–Orowan second phase precipitation strengthening in Equation (5) [12,27], the grain size and corresponding precipitation enhancement can be calculated. Considering the influence of process parameters such as temperature, stress and strain rate on mechanical properties, the yield strength of processing enhancement is calculated using the Equation (6) [28,29,30].
Grain strengthening:
Second phase enhancement:
Processing enhancement:
where σy is the yield strength of the material, σ0 is the grain boundary stress of the corresponding pure metal, k is the material correlation coefficient, d is the grain size, σppt is the second phase strength enhancement, m is the material correlation coefficient, G is the shear modulus of material, b is the Burgers vector, L is the distance of the precipitation phase, r is the size of precipitation phase, is the strength of the material after processing, is the strength of material at strain rate of , and m is the temperature state parameter.
2.3. Tensile Strength Calculation Model
According to the microstructure and phase calculation Equation (3), the mechanical properties of each phase can be obtained. For the γ phase, α phase and alloy precipitation phase with the topological relationship, the tensile Equation (7) [9,31,32] is used to calculate the tensile strength according to the property and volume fraction of each phase.
where σb is the tensile strength of the mixed phase, xα, xγ, xIII are the molar fractions of α, γ and precipitated phase, respectively, and σα, σγ, and σIII are the strength of α, γ and precipitated phase, respectively.
2.4. Phase Volume and Performance Calculation Model
The phase volume fraction at a certain cooling rate can be obtained by calculating the phase composition under continuous cooling conditions according to Equation (8) [33]. According to the chemical component and its volume fraction, the performance of the corresponding phase is calculated using Equation (1). Finally, according to the phase performance and volume fraction of the material, the overall performance of the material is calculated by the mixing law.
where x is the phase volume fraction, T is the temperature, V is the volume fraction at temperature T, Veq is the volume under equilibrium transition, Nr is the nucleation rate, Gr is the grain growth rate, and t is the transition time.
3. Experimental Materials and Method
Based on a bainitic steel chemical component of 0.23C-1.96Si-1.93Mn-0.14Ni-1.84Cr-0.43Mo-0.01W-bal.Fe (S, P ≤ 0.009, Nb + V + Ti + Al + Cu + B ≤ 0.15. wt%), using Thermo-Calc (V5.0, Royal Swedish Institute of Technology, Stockholm, Sweden) and JMatPro (V6.0, Sente Software Ltd., Guildford, UK) calculation software, the chemical composition was optimized and the performance was predicted and analyzed.
3.1. Chemical Composition Design and Optimization
Using the above calculation model and thermodynamic calculation software of Thermo-Calc (TCFE6 database), under the premise of not changing the basic phase in the equilibrium phase diagram and the other alloy contents were unchanged, the gradient value of the target alloy content is changed to calculate equilibrium phase properties of each alloy content. Then the precipitation variation of carbides in steel were studied. Finally, the alloy composition was finally optimized. The detailed process was as follows: (1) Calculate the temperature-equilibrium phase diagram of the original steel and analyze the phase composition and precipitation. (2) Study effects of the content of Ni, Mo, W and Cr on precipitation of corresponding carbides while the other alloy contents remain unchanged. (3) Compare the original and optimized equilibrium phase diagram of experimental steel, and analyze the influences of the alloy content on the phases.
3.2. Mechanical Properties Analysis
According to the above chemical composition optimized, the carbide composition and alloying carbide morphology were analyzed by JMatPro, and the influence of the main alloy contents in experimental steel on mechanical properties under equilibrium state was analyzed. Setting the other alloy contents to fixed values (the average value of the impossible value range) and the target alloy content as a variable, the influences of the chemical composition on phase composition content and mechanical properties were analyzed at common cooling rate of 10 °C/s in the Thermo Mechanical Control Process (TMCP) process of medium plate production.
4. Results and Discuss
4.1. Phase and Chemical Composition Optimization
4.1.1. Equilibrium Phase Diagram of Original Bainitic Steel
To determine the temperature-equilibrium phase of the original bainitic steel, we set the chemical composition of the experimental steel, set the temperature in the solid phase transition temperature between 20 and 1250 °C, and calculated the precipitation laws of alloy elements in the cooling process of γ→α. A partial enlargement of the temperature-number of moles of a phase per mole (T-NPM) is shown in Figure 1. Using the multi-lattice model, the crystal structure expression for each phase in the steel [34] was: (Fe, M1...Mi, V, Nb)a (C, N, Va)c. where M1...Mi is an alloying element in steel, and Va is a vacancy. a = 1 and c = 1 are fcc phases, and a = 1 and c = 3 are bcc phases. In the (Fe, M1...Mi, V, Nb)a (C, N, Va)c lattice, the first sublattice is the regular lattice position and the second sublattice is the octahedral gap [9]. Alloying elements, such as Fe, Mi, V, and Nb, can be substituted for each other in the sublattice, and alloying elements, such as C and N, can be substituted for each other in the vacancy gap. According to the (Fe, M1...Mi, V, Nb)a(C, N, Va)c lattice model, B2M is mainly composed of Ti and B (Figure 1); FCC_A1#2 is mainly composed of Ti, C, Cr, and Nb compound (fcc crystal structure); and M6C is mainly a compound composed of Mo, Fe, Si, C, and Cr.
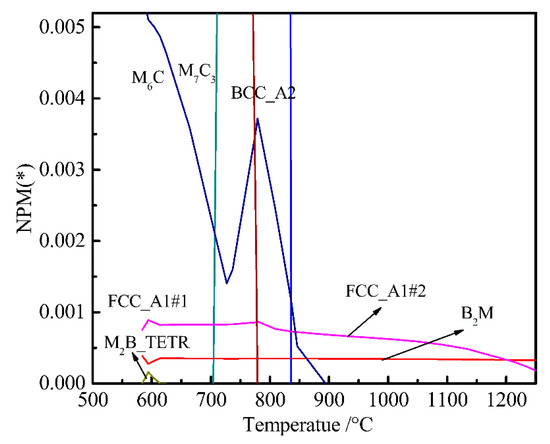
Figure 1.
Temperature-chemical component equilibrium phase diagram of bainitic steel.
4.1.2. Effect of Ni and Mo Contents on Equilibrium Phase
In order to determine the influence of Ni content on the equilibrium phase, the variations in Ni and Mo contents were calculated to determine the variation in the composition-temperature equilibrium phase diagram of the experimental steel. As shown in Figure 2a, the effect of Ni content on M6C was minimal. When the Ni content changed from 0 to 0.3%, the solid solution temperature of M6C increased from 555 to 575 °C, but had little effect on. The alloying elements Mo and C have a strong affinity to form M6C and M7C3 alloys in steel. The effects of the change in Mo content on M6C and M7C3 and the solution temperature are shown in Figure 2b. With the increase in Mo content, the solid solution temperature of M6C type carbide increased, and the solution temperature of M7C3 type carbide increased. The dissolution of M6C type carbide at high temperatures caused the inhibition of γ grain growth to decrease. Comparing Figure 1 with Figure 2b, it can be seen that as the temperature decreased, a large amount of Mo-rich M6C-type carbide precipitated at temperatures below 900 °C. The precipitation of M6C type carbide during the controlled cooling process enhanced the precipitation strengthening effect. In the heating process, the appropriate amount of undissolved M6C will be able to prevent the growth of γ grains, thereby increasing the hardness and tensile strength of UHSS.
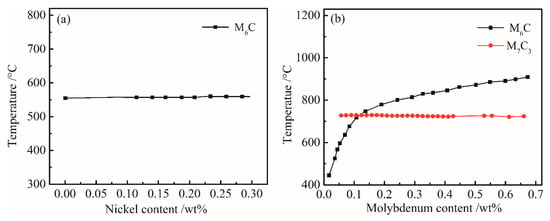
Figure 2.
Influences of (a) Ni and (b) Mo content on the equilibrium phases of the bainitic steel.
4.1.3. Effect of Cr and W Content on Equilibrium Precipitation Phase
The effect of the content of Cr on M7C3 carbide in the steel is shown in Figure 3a. The solid solution temperature of FCC_A1#1 carbide increased with Cr content, and the M7C3 carbide with Cr is gradually dissolved into the matrix below 800 °C. In the controlled cooling process of the γ→α phase change, the M7C3 phase act absolutely as precipitation strengthening carbide, increasing the strength of UHSS.
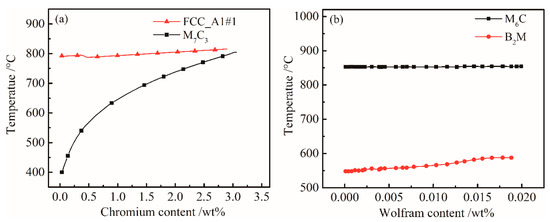
Figure 3.
Influences of (a) Cr and (b) W content on the equilibrium phase diagram of the bainitic steel.
In order to determine the influence of W content on the main equilibrium precipitate phases, the temperature-chemical component equilibrium phase diagram was analyzed. Figure 3b shows that the W content has slightly effect on M6C and B2M. Since the content of W was relatively low, and the mass fraction of M6C was small. From Figure 1, the B2M phase began to dissolve into the γ phase at temperatures above 1250 °C during the heating process. The mass of B2M gradually decreased with temperature during the cooling process. The overall content of B2M remained stable; significant changes only occurred around 580 °C. Figure 3b shows that B2M precipitates increased with W content at 500–600 °C.
In order to more clearly analyze the effect of W on B2M, the temperature-chemical component equilibrium phase diagram of the W-free chemical component system was calculated and partially amplified as shown in Figure 4. Comparing Figure 1 with Figure 4, we can see the effect of W on FCC_A1#2, B2M, and M2B_TERT. It can be seen from Figure 1 that the mass of FCC_A1#2 and M2B_TETR alloy phases increased with decreasing B2M content at around 580 °C. The mass fraction of FCC_A1#2 and M2B_TETR decreased to a minimum with the increase in B2M. As can be seen from Figure 4, the content of FCC_A1#2 decreased and the content of B2M increased at about 580 °C; when the content of FCC_A1#2 decreased to a minimum, the content of B2M increased to the maximum.
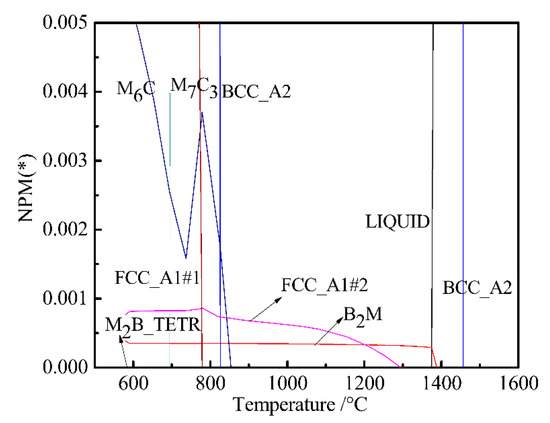
Figure 4.
Partial magnification phase diagram of W-free bainite steel.
Figure 5 shows the change laws of the mass percent of B2M, FCC_A1#2 and M2B_TETR in the original steel and W-free steel at 580–695 °C. Through comparative analysis, we found that W determines the changes in B2M, FCC_A1#2 and M2B_TETR between 580 and 614 °C. W mainly forms M2B_TETR boride in steel, but this boride is unstable, only appearing from 580 to 614 °C, and then transforming into other types of carbides. Through the above calculation, the Ni and W contents can be minimized. However, since there was 0.13% (wt %) of Cu in the steel, in order to prevent the adverse effects of Cu, the Ni content was adjusted to a mass percent of 0.07%.
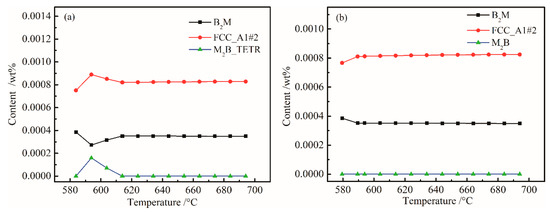
Figure 5.
Plots of B2M, FCC_A1#2, and M2B_TETR content versus temperature: (a) 0.01 wt % W and (b) W-free.
4.1.4. Effect of the Optimized Chemical Component System on Balanced Phase Diagram
The reduction in Mo content promoted the formation of M23C6 phase in steel, while the increase in Cr content inhibited the production of M23C6 phase in steel [35]. After reducing Ni, Mo, and W, the chemical composition was adjusted to C 0.23, Si 1.96, Mn 1.93, Ni 0.07, Cr 1.84, Mo 0.35, Nb + V + Ti + Al + Cu + B ≤ 0.15, Fe bal. wt %), and the M23C6 precision is shown in Figure 6. When the Mo content was adjusted to 0.35%, M23C6 carbides appeared. M23C6 caused the hardenability of B to disappear [36], and the increase in Cr content produced the effect of avoiding M23C6. By calculation and comparison, we found that when the Cr content increased to 1.94%, the generation of M23C6 carbides was prevented.
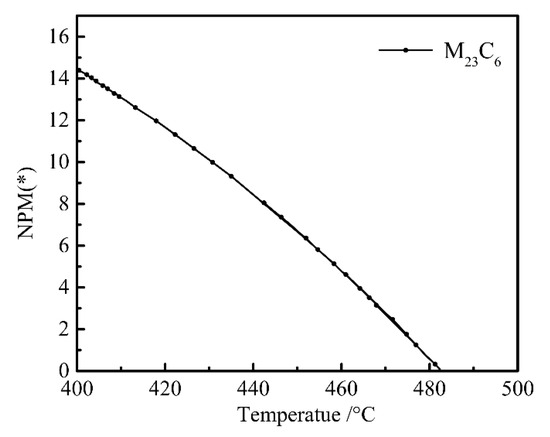
Figure 6.
Plot of M23C6 content (wt%) versus temperature.
The content of other alloys remained unchanged, and when the Cr content was further adjusted to 1.96 (wt %), a similar equilibrium phase diagram was obtained. To more accurately analyze the influence of Cr and Mo content changes on M6C and M7C3, the equilibrium phase diagrams before and after optimization are depicted in Figure 7. When the chemical composition was adjusted to C 0.23, Si 1.96, Mn 1.93, Ni 0.07, Cr 1.96, Mo 0.35, Nb + V + Ti + Al + Cu + B ≤ 0.15, Fe bal. wt %), an equilibrium phase diagram was obtained.
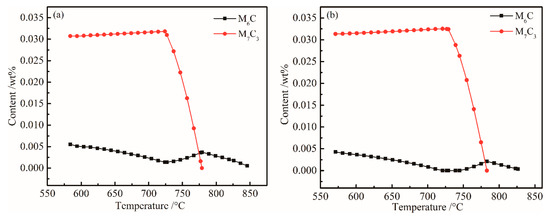
Figure 7.
Plots of M6C and M7C3 content (wt%) of versus temperature. (a) Original; (b) Optimized.
Comparing Figure 7a,b, the main phase composition and temperature precipitation characteristics did not change much, but the alloy content significantly decreased. The precision of the new chemical component system is consistent with the temperature window of the rolling process, and the new chemical component system meets the design goal of reducing the hot rolling process.
4.2. Effect of Alloy Content on Mechanical Properties
In order to control the smelting process and estimate TMCP parameters and mechanical properties, the calculation cooling rate was set to 10 °C/s because the common hot rolled products—hot rolled medium plate (h = 10–20 mm) and hot rolled bar (D = 15–25 mm)—are air cooled (CR) with a cooling rate of 5–15 °C/s after the direct hot rolling process. We varied the main alloying elements within the composition range (C 0.1–0.3, Cr 1.7–2.1, Mo 0.25–0.45, and Ni 0.05–0.3 wt %) to study the effect of alloy content on mechanical properties. The results can be drawn from Figure 8. With increasing carbon content, the change in ferrite and bainite was more obvious, as determined from Equations (4)–(6), As can be seen from Figure 8a, when the carbon content increased from 0.1% to 0.3%, the yield strength, tensile strength, and HRC increased from 617 to 1279 MPa, 860 to 1524 MPa, and 25 to 48, respectively. For each 0.05% increase in carbon, tensile strength, yield strength, and hardness linearly increased 168 MPa, 167 MPa, and 5.5, respectively. Comparing Figure 8b–d when the content of other alloying elements changed within the range of designed optimization values, the change in carbon content considerably influenced the strength performance. Because the change in carbon content directly affects the type of precipitates, as well as the amount of carbide precipitation of other alloys, which affects the precipitation strengthening, the strengthening effect on other alloys was ultimately affected. Considering strengthening effects on other alloys, a 0.23% carbon content was found to be the most appropriate.
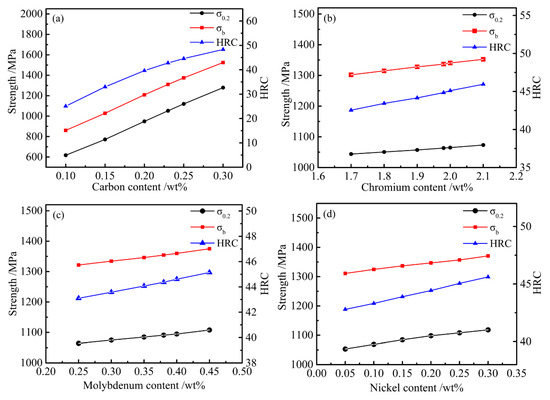
Figure 8.
Influences of alloy content on the mechanical properties. (a) C; (b) Cr; (c) Mo; (d) Ni.
According our analytical methods, the effects of the alloy strengthening on the mechanical properties due to Cr, Mo, and Ni were studied. It can be seen from Figure 8b–d that as the alloy content increased, their corresponding tensile strength, yield strength, and hardness increased, but the increase was small and insignificant. The analysis results show that the above optimized alloying elements fully strengthened the steel. If the alloy content continued to increase, its strengthening was not obvious. The chemical component system was in the optimal range (C 0.23, Si 1.96, Mn 1.93, Ni 0.07, Cr 1.96, Mo 0.35, Nb + V + Ti + Al + Cu + B ≤ 0.15, Fe bal.; wt %). The result proves that the above designed composition is feasible.
5. Conclusions
In order to optimize the reduction chemical component for UHSS during the rolling process, we used the thermodynamic mathematical model to study the effects of alloy, precipitation phase, and hot rolling temperature. The influence of the alloy content on precision laws was analyzed, and the chemical component system was optimized. The primary contributions and conclusions of this work are summarized as follows:
- (1).
- The equilibrium phases in steel are B2M, BCC_A2, FCC_A1#1, FCCA1#2, M6C, M7C3, and M2B_TETR. B2M is a compound mainly composed of Ti and B. FCC_A1#2 is a compound mainly composed of Ti, C, Cr, and Nb. M6C is a compound mainly composed of Mo, Fe, Si, C, and Cr.
- (2).
- When Ni content increased from 0 to 0.3%, M6C precision temperature increased from 555 and 575 °C, and the Ni content had little effect on FCC_A1#2 and M6C. Mo is a strong carbide element and forms M6C and M7C3 type carbides in UHSS. Mo content should not be too low, otherwise the strength of UHSS will decrease. M6C carbide with Cr increased with increasing Cr content. Below 800 °C, M7C3 carbide with Cr-rich gradually dissolved into the matrix. W mainly formed M2B_TETR borides. M2B_TETR can be converted with FCC_A1#2 and B2M in the temperature zone around 580 °C.
- (3).
- The chemical component system was optimized by reducing Ni, reducing Mo, removing W, and increasing Cr, then we obtained the same phase diagram as obtained with the origin content. The optimized composition is C 0.23, Si 1.96, Mn 1.93, Ni 0.07, Cr 1.96, Mo 0.35, Nb + V + Ti + Al + Cu + B ≤ 0.15, Fe bal. (wt %). With a cooling rate of 10 °C/s, the optimized alloying system fully performed its strengthening role in the steel, and the chemical components were in the optimal range. The thermodynamic models and our conclusions have the potential to be generalized for many other materials and process configurations without requiring extensive material testing. However, a lack of a real experiment is unfortunate, and the limitations and practicality of this methodology will be verified in future experiments.
Author Contributions
Y.C. and X.Z. conceived and designed the experiments, J.H. performed calculation and some plots, Y.C. analyzed the data, and Y.C. and X.J. wrote the paper.
Funding
This work was supported by National Natural Science Foundation of China (Grant No. 51704055), Science and Technology Research Program of Chongqing Municipal Education Commission (Grant No. KJQN201801501), and Chongqing Research Program of Basic Research and Frontier Technology (Grant No. cstc2015jcyjA90005, cstc2016jcyjA0087).
Conflicts of Interest
The authors declare no conflict of interest.
References
- Chang, L.C.; Bhadeshia, H.K.D.H. Carbon content of austenite in isothermally transformed 300 M steel. Mater. Sci. Eng. A 1994, 184, 17–19. [Google Scholar] [CrossRef]
- Sule, Y.; Sirin, K.; Kaluc, E. Effect of the ion nitriding surface hardening process on fatigue behavior of AISI 4340 steel. Mater. Charact. 2007, 59, 351–358. [Google Scholar]
- Wen, Z.H.; Kuang-Nian, H.E.; Hua, L.I.; Liao, W.T. Development Progress and Process Analysis of Ultra High-strength Plate. Steel Rolling 2012, 29, 43–45. [Google Scholar]
- Matsuda, H.; Mizuno, R.; Funakawa, Y.; Seto, K.; Matsuoka, S.; Tanaka, Y. Effects of auto-tempering behaviour of martensite on mechanical properties of ultra high strength steel sheets. J. Alloys Compd. 2013, 577, 661–667. [Google Scholar] [CrossRef]
- Abe, Y.; Kato, T.; Mori, K.I.; Nishino, S. Mechanical clinching of ultra-high strength steel sheets and strength of joints. J. Mater. Process. Technol. 2014, 214, 2112–2118. [Google Scholar] [CrossRef]
- Little, C.D.; Machmeier, P.M. High Strength Fracture Resistant Weldable Steels. U.S. Patent 4,076,525, 28 February 1978. [Google Scholar]
- Jahazi, M.; Egbali, B. The influence of hot rolling parameters on the microstructure and mechanical properties of an ultra-high strength steel. J. Mater. Process. Technol. 2000, 103, 276–279. [Google Scholar] [CrossRef]
- Hillert, M.; Staffansson, L.I.; Hillert, M.; Staffansson, L.I. The Regular Solution Model for Stoichiometric Phases and Ionic Melts. Acta Chem. Scand. 1970, 24, 3618–3626. [Google Scholar] [CrossRef]
- Sundman, B.; Ågren, J. A regular solution model for phases with several components and sublattices, suitable for computer applications. J. Phys. Chem. Solids 1981, 42, 297–301. [Google Scholar] [CrossRef]
- Porter, D.A.; Easterling, K.E. Phase Transformations In Metals and Alloys. Ann. Rev. Mater. Res. 1992, 1, 213–218. [Google Scholar]
- Nieh, T.G.; Wadsworth, J. Hall-Petch Relation in Nanocrystalline Solids. Scr. Metall. Mater. 1991, 25, 955–958. [Google Scholar] [CrossRef]
- Kirkaldy, J.S. Prediction of alloy hardenability from thermodynamic and kinetic data. Metall. Mater. Trans. B 1973, 4, 2327–2333. [Google Scholar] [CrossRef]
- Doane, D.V.; Kirkaldy, J.S. Hardenability Concepts with Applications to Steel. In Proceedings of the Symposium Held at the Sheraton-Chicago Hotel, Chicago, IL, USA, 24–26 October 1977. [Google Scholar]
- International, A.; Davis, J.R.; Committee, A.I.H. Properties and Selection: Irons, Steels and High-Performance Alloys; ASM International: Materials Park, OH, USA, 2001. [Google Scholar]
- Predel, E.H.C.B.; Hoch, E.M.; Pool, E.M. Effect of Diffusion on Phase Transformations; Springer: Berlin, Germany, 2004. [Google Scholar]
- Burke, J. The Kinetics of Phase Transformations in Metals; Pergamon Press: Long Island City, NY, USA, 1965. [Google Scholar]
- Porter, D.A.; Easterling, K.E.; Sherif, M.Y. Phase Transformations In Metals and Alloys; Chapman & Hall: London, UK, 1992. [Google Scholar]
- Committee, A.I.H.; Davis, J.R.; Abel, L.A. Properties and Selection: Irons, Steels, and High-Performance Alloys; ASM International: Materials Park, OH, USA, 1995. [Google Scholar]
- Egea, A.J.S.; Rojas, H.A.G.; Celentano, D.J.; Perio, J.J.; Cao, J. Thermomechanical Analysis of an Electrically Assisted Wire Drawing Process. J. Manuf. Sci. Eng.-Trans. ASME 2017, 139, 7. [Google Scholar] [CrossRef]
- Egea, A.J.S.; Rojas, H.A.G.; Celentano, D.J.; Peiro, J.J. Mechanical and metallurgical changes on 308L wires drawn by electropulses. Mater. Des. 2016, 90, 1159–1169. [Google Scholar] [CrossRef]
- Allen, R.M.; Toth, L.S.; Oppedal, A.L.; El Kadiri, H. Crystal Plasticity Modeling of Anisotropic Hardening and Texture Due to Dislocation Transmutation in Twinning. Materials 2018, 11, 1855. [Google Scholar] [CrossRef] [PubMed]
- Liu, S.; Kouadri-Henni, A.; Gavrus, A. Numerical simulation and experimental investigation on the residual stresses in a laser beam welded dual phase DP600 steel plate: Thermo-mechanical material plasticity model. Int. J. Mech. Sci. 2017, 122, 235–243. [Google Scholar] [CrossRef]
- Wang, Z.Q.; Denlinger, E.; Michaleris, P.; Stoica, A.D.; Ma, D.; Beese, A.M. Residual stress mapping in Inconel 625 fabricated through additive manufacturing: Method for neutron diffraction measurements to validate thermomechanical model predictions. Mater. Des. 2017, 113, 169–177. [Google Scholar] [CrossRef]
- Porter, D.A.; Easterling, K.E.; Sherif, M. Phase Transformations in Metals and Alloys; Revised Reprint; CRC Press: Boca Raton, FL, USA, 2009. [Google Scholar]
- Hall, E.O. The Deformation and Ageing of Mild Steel: III Discussion of Results. Proc. Phys. Soc. Sect. B 1951, 64, 747–751. [Google Scholar] [CrossRef]
- Petch, N.J. The Cleavage Strength of Polycrystals. J. Iron Steel Inst. 1953, 174, 25–28. [Google Scholar]
- Gladman, T. On the Theory of the Effect of Precipitate Particles on Grain Growth in Metals. Proc. R. Soc. Lond. Ser. A Math. Phys. Sci. 1966, 294, 298–309. [Google Scholar]
- Doane, D.V. Hardenability Concepts with Applications to Steel; American Institute of Mining: Centennial, CO, USA, 1978. [Google Scholar]
- Kattner, U.R.; Boettinger, W.J.; Coriell, S.R. Application of Lukas’ phase diagram programs to solidification calculations of multicomponent alloys. Z. Metallk. 1996, 87, 522–528. [Google Scholar]
- Predel, B.; Hoch, M.; Pool, M. Effect of diffusion on Phase Transformations. In Phase Diagrams and Heterogeneous Equilibria; Predel, B., Hoch, M., Pool, M., Eds.; Springer: Berlin, Germany, 2004. [Google Scholar]
- Christian, J.W. The Theory of Transformations in Metals and Alloys; Elsevier Science Ltd.: Kidlington, Oxford, UK, 2002. [Google Scholar]
- Caballero, F.G.; Santofimia, M.J.; Garcia-Mateo, C.; Chao, J.; de Andres, C.G. Theoretical design and advanced microstructure in super high strength steels. Mater. Des. 2009, 30, 2077–2083. [Google Scholar] [CrossRef]
- Aggen, G.; Allen, M. ASM Handbook Volume I Properties and Selection: Irons, Steels, and High-Performance Alloys; ASM International: Materials Park, OH, USA, 2018. [Google Scholar]
- Li, L. Precipitation of Carbonitrides Containing V and Nb in Steel and their Stability. Shanghai Met. 2005, 27, 1–3. [Google Scholar]
- Thomson, R.C.; Miller, M.K. Carbide precipitation in martensite during the early stages of tempering Cr- andMo-containing low alloy steels. Acta Mater. 1998, 46, 2203–2213. [Google Scholar] [CrossRef]
- Yang, S.; He, X.; Chen, M.; Dang, Z.; Jun, K. Strain Induced Precipitation at High Temperature in (Nb, B.) Microalloyed Steel. Mater. Sci. Eng. 1994, 12, 49–65. [Google Scholar]
© 2018 by the authors. Licensee MDPI, Basel, Switzerland. This article is an open access article distributed under the terms and conditions of the Creative Commons Attribution (CC BY) license (http://creativecommons.org/licenses/by/4.0/).