Evolution of the Material Microstructures and Mechanical Properties of AA1100 Aluminum Alloy within a Complex Porthole Die during Extrusion


 ,
,
Abstract
:1. Introduction
2. Experiments
2.1. Material
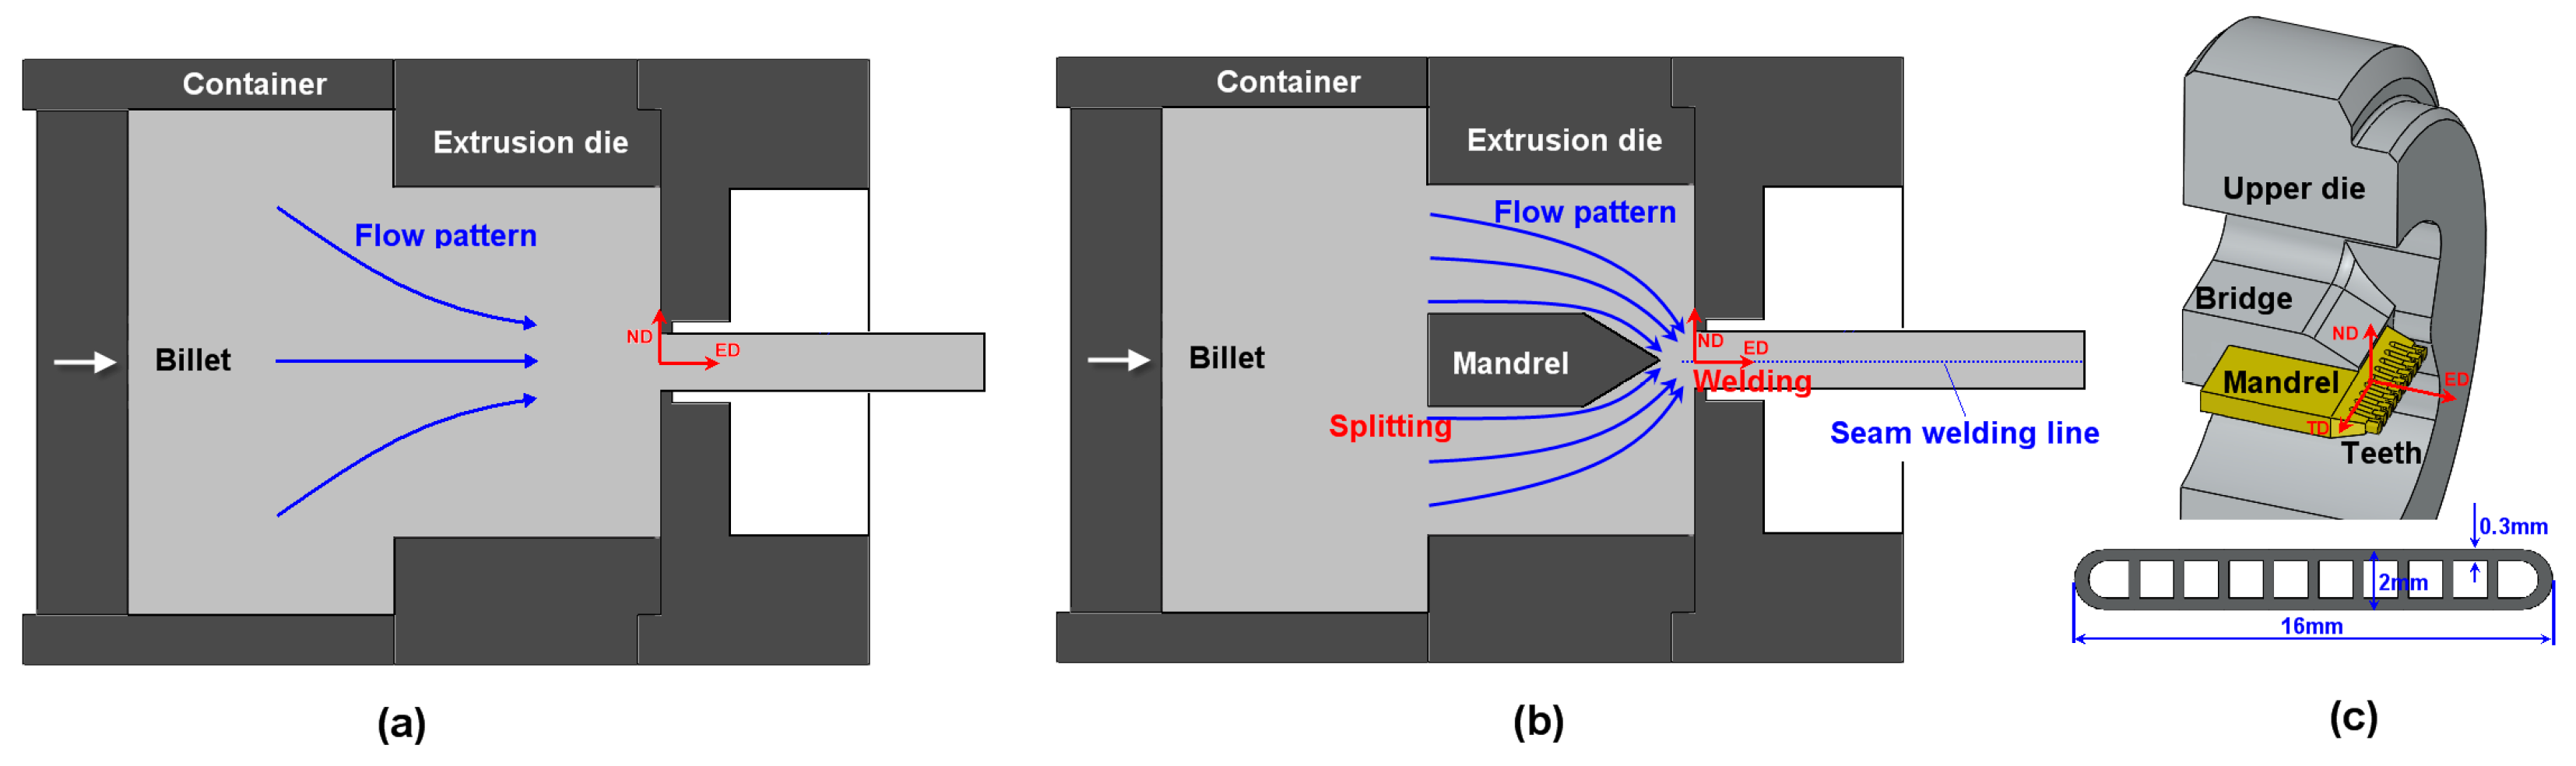
2.2. Extrusion
2.3. Microstructure Observation
2.4. Mechanical Tests
3. Numerical Procedures
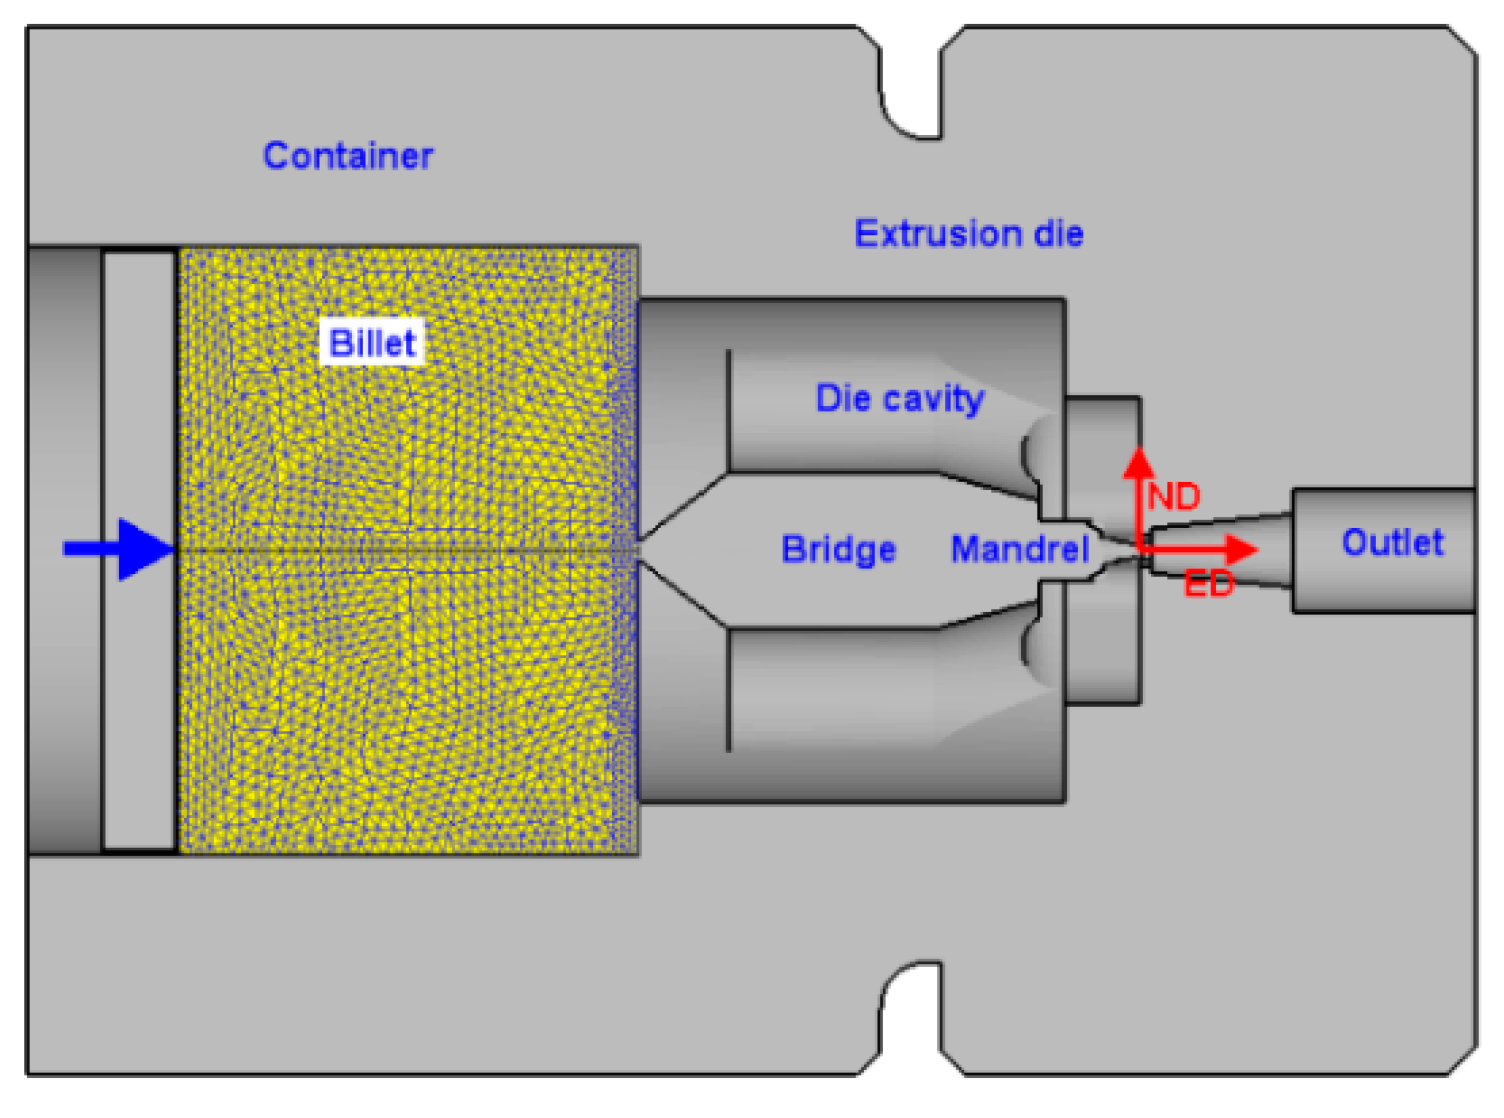
3.1. Finite Element Analysis
3.2. Flow Line Model
3.3. VPSC Model
4. Results and Discussion
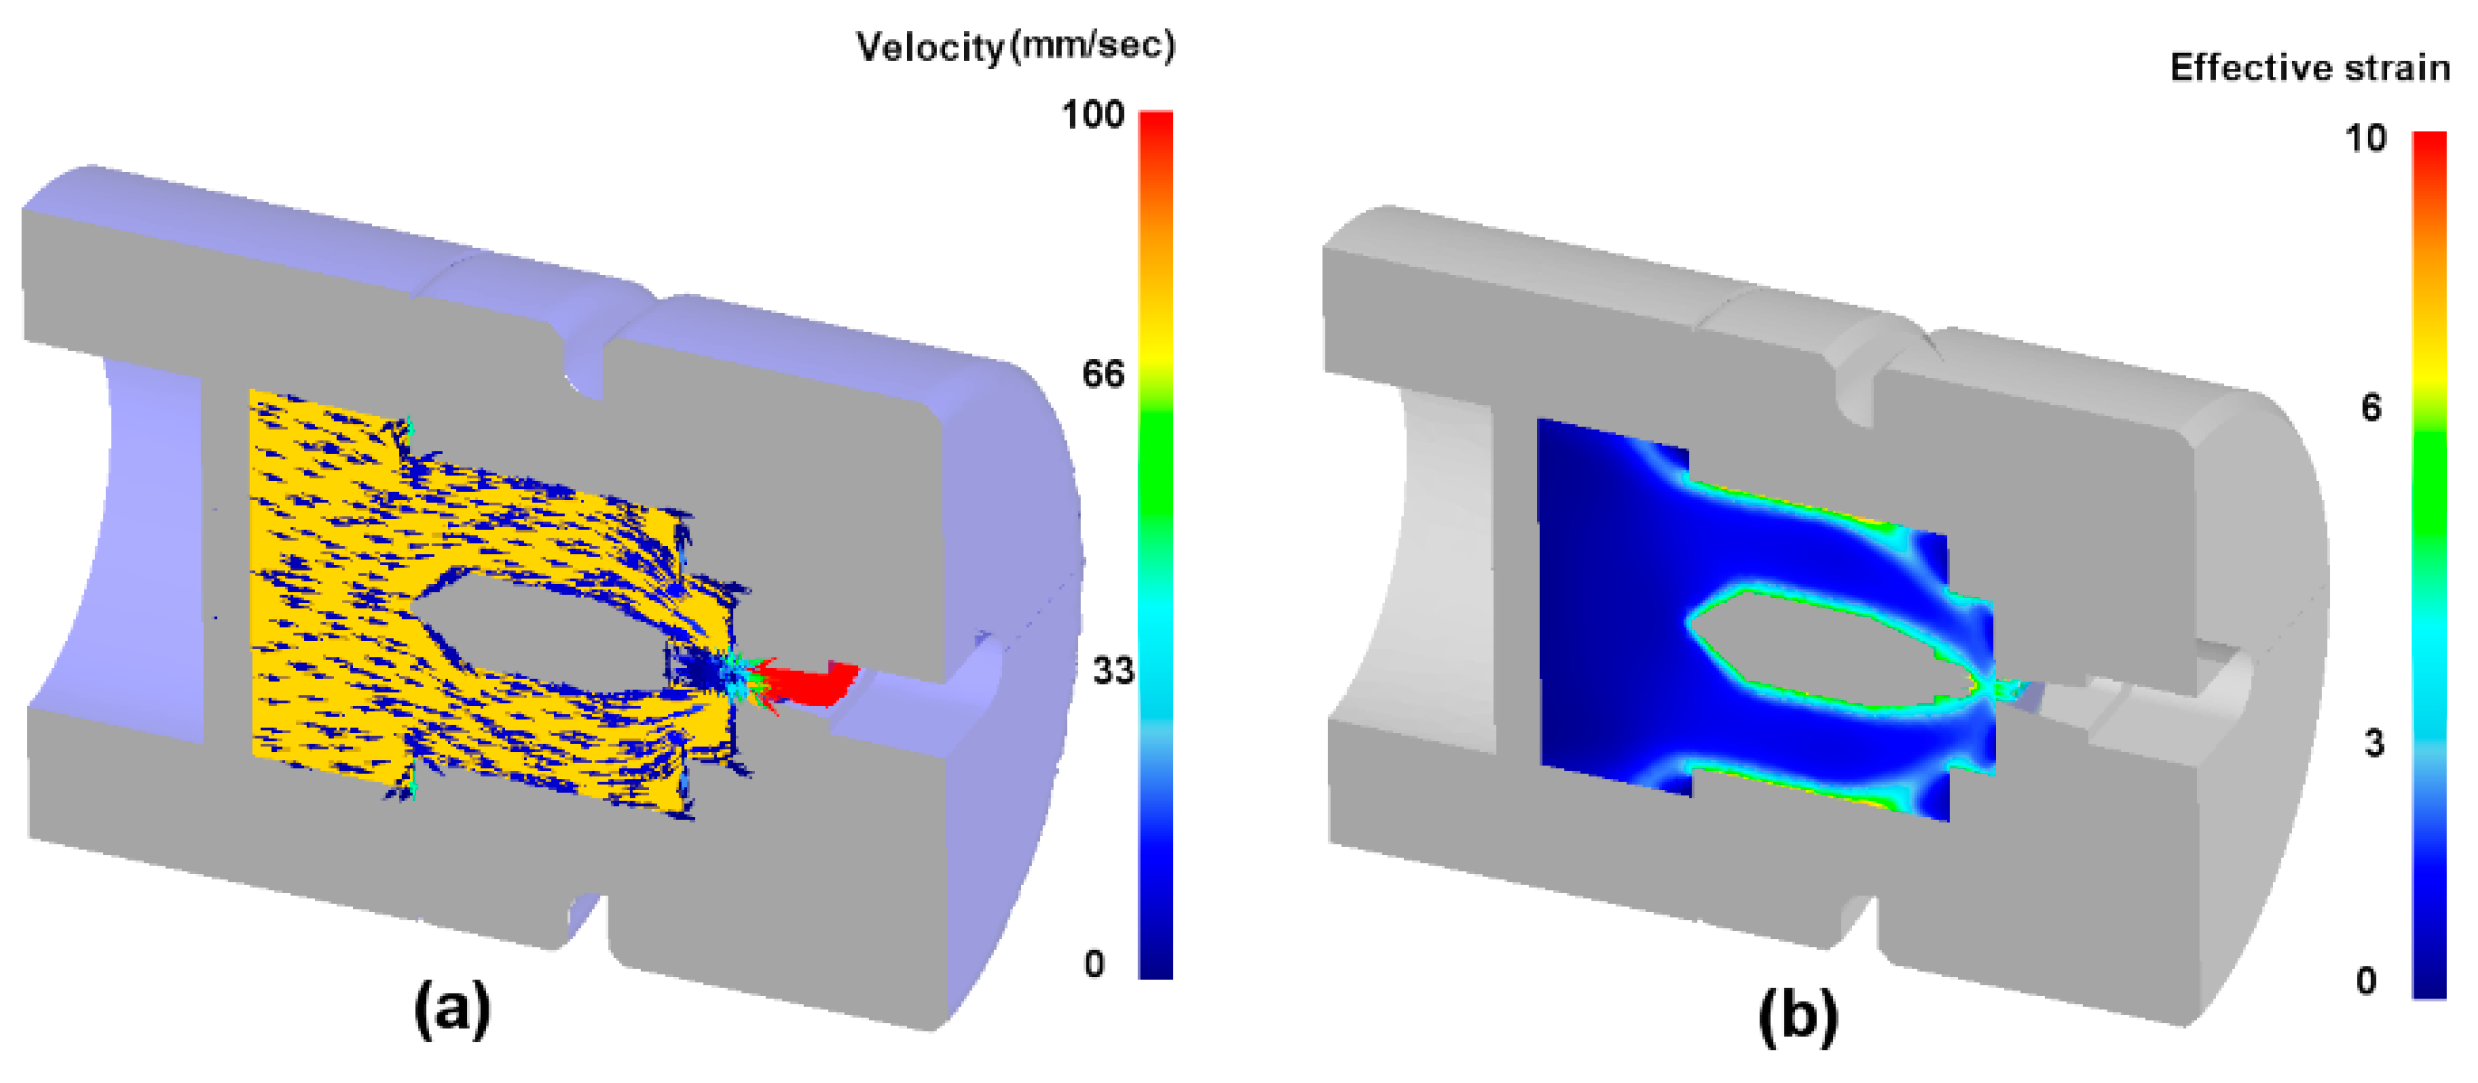
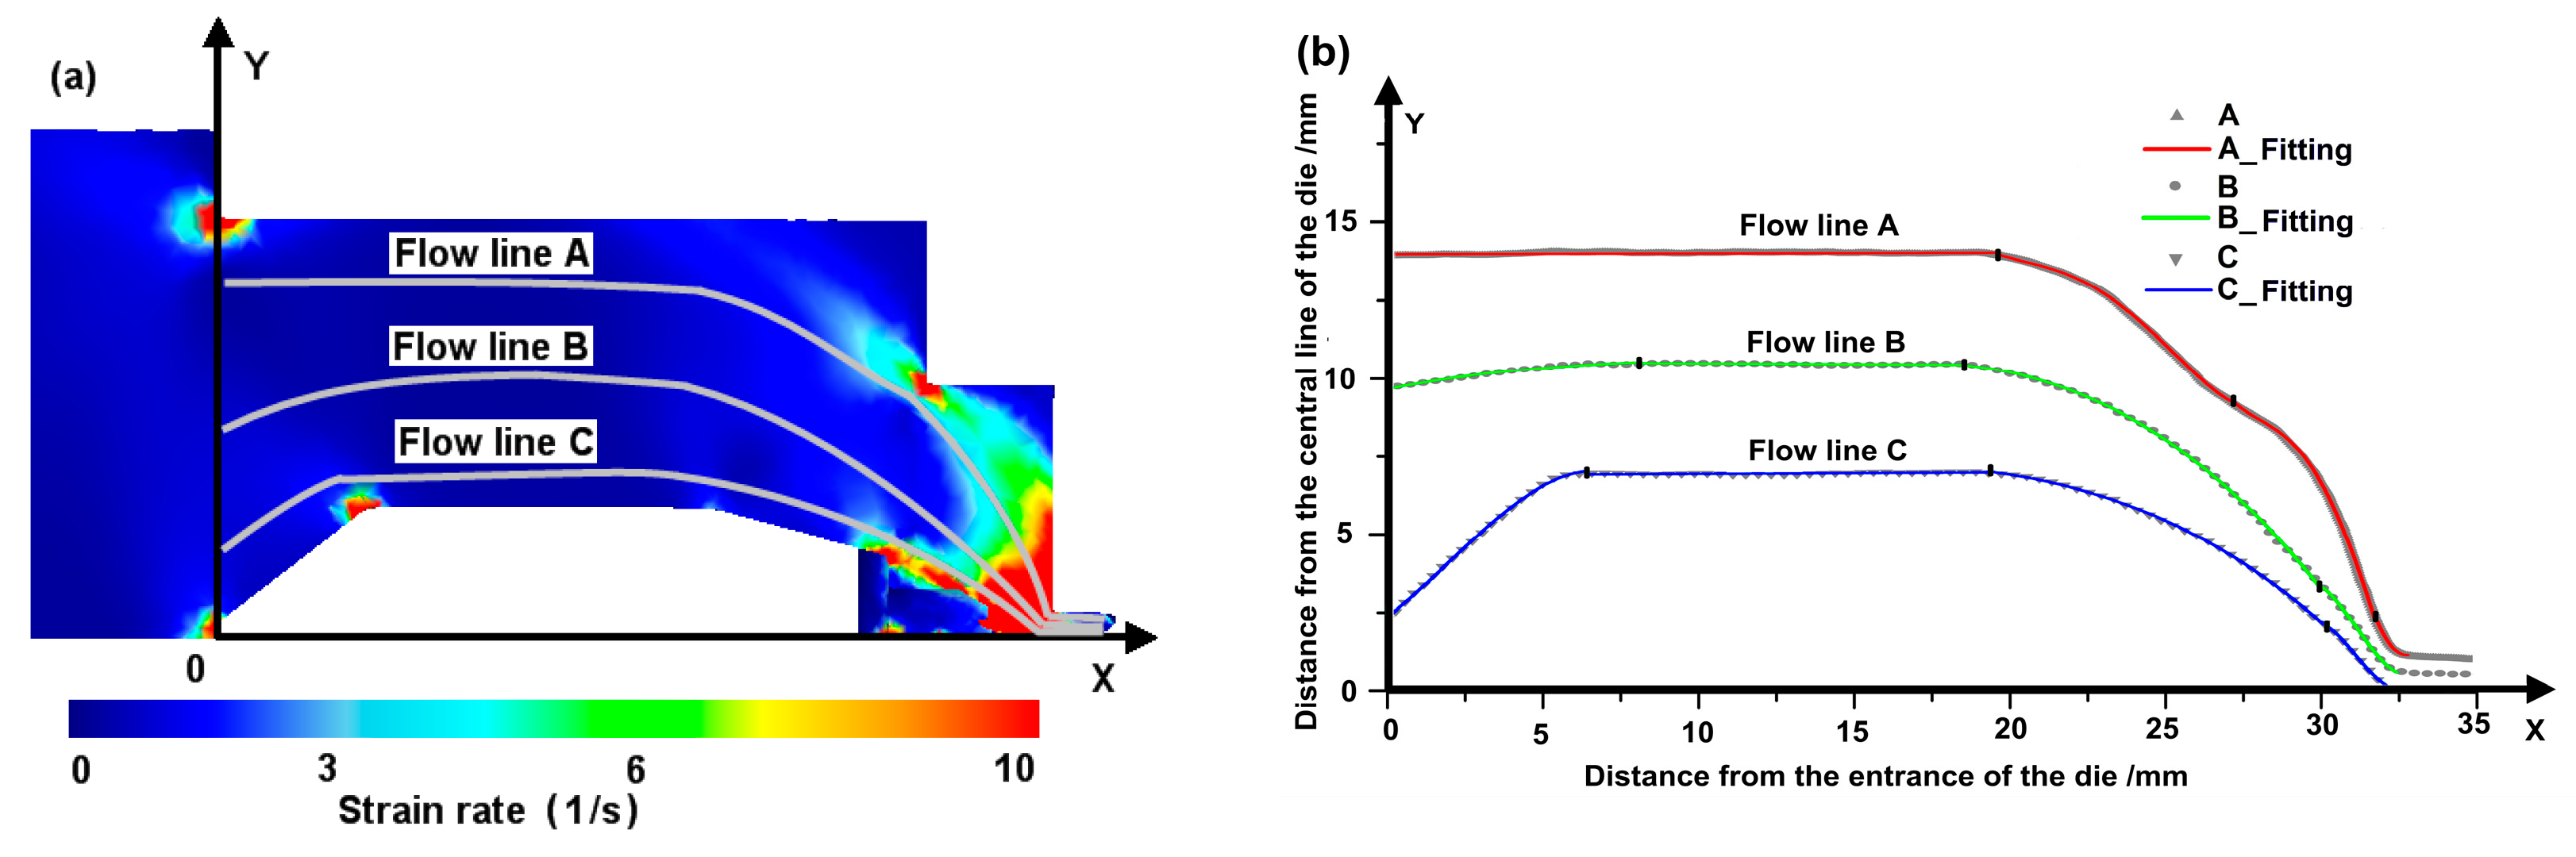
4.1. Velocity Gradient Determination
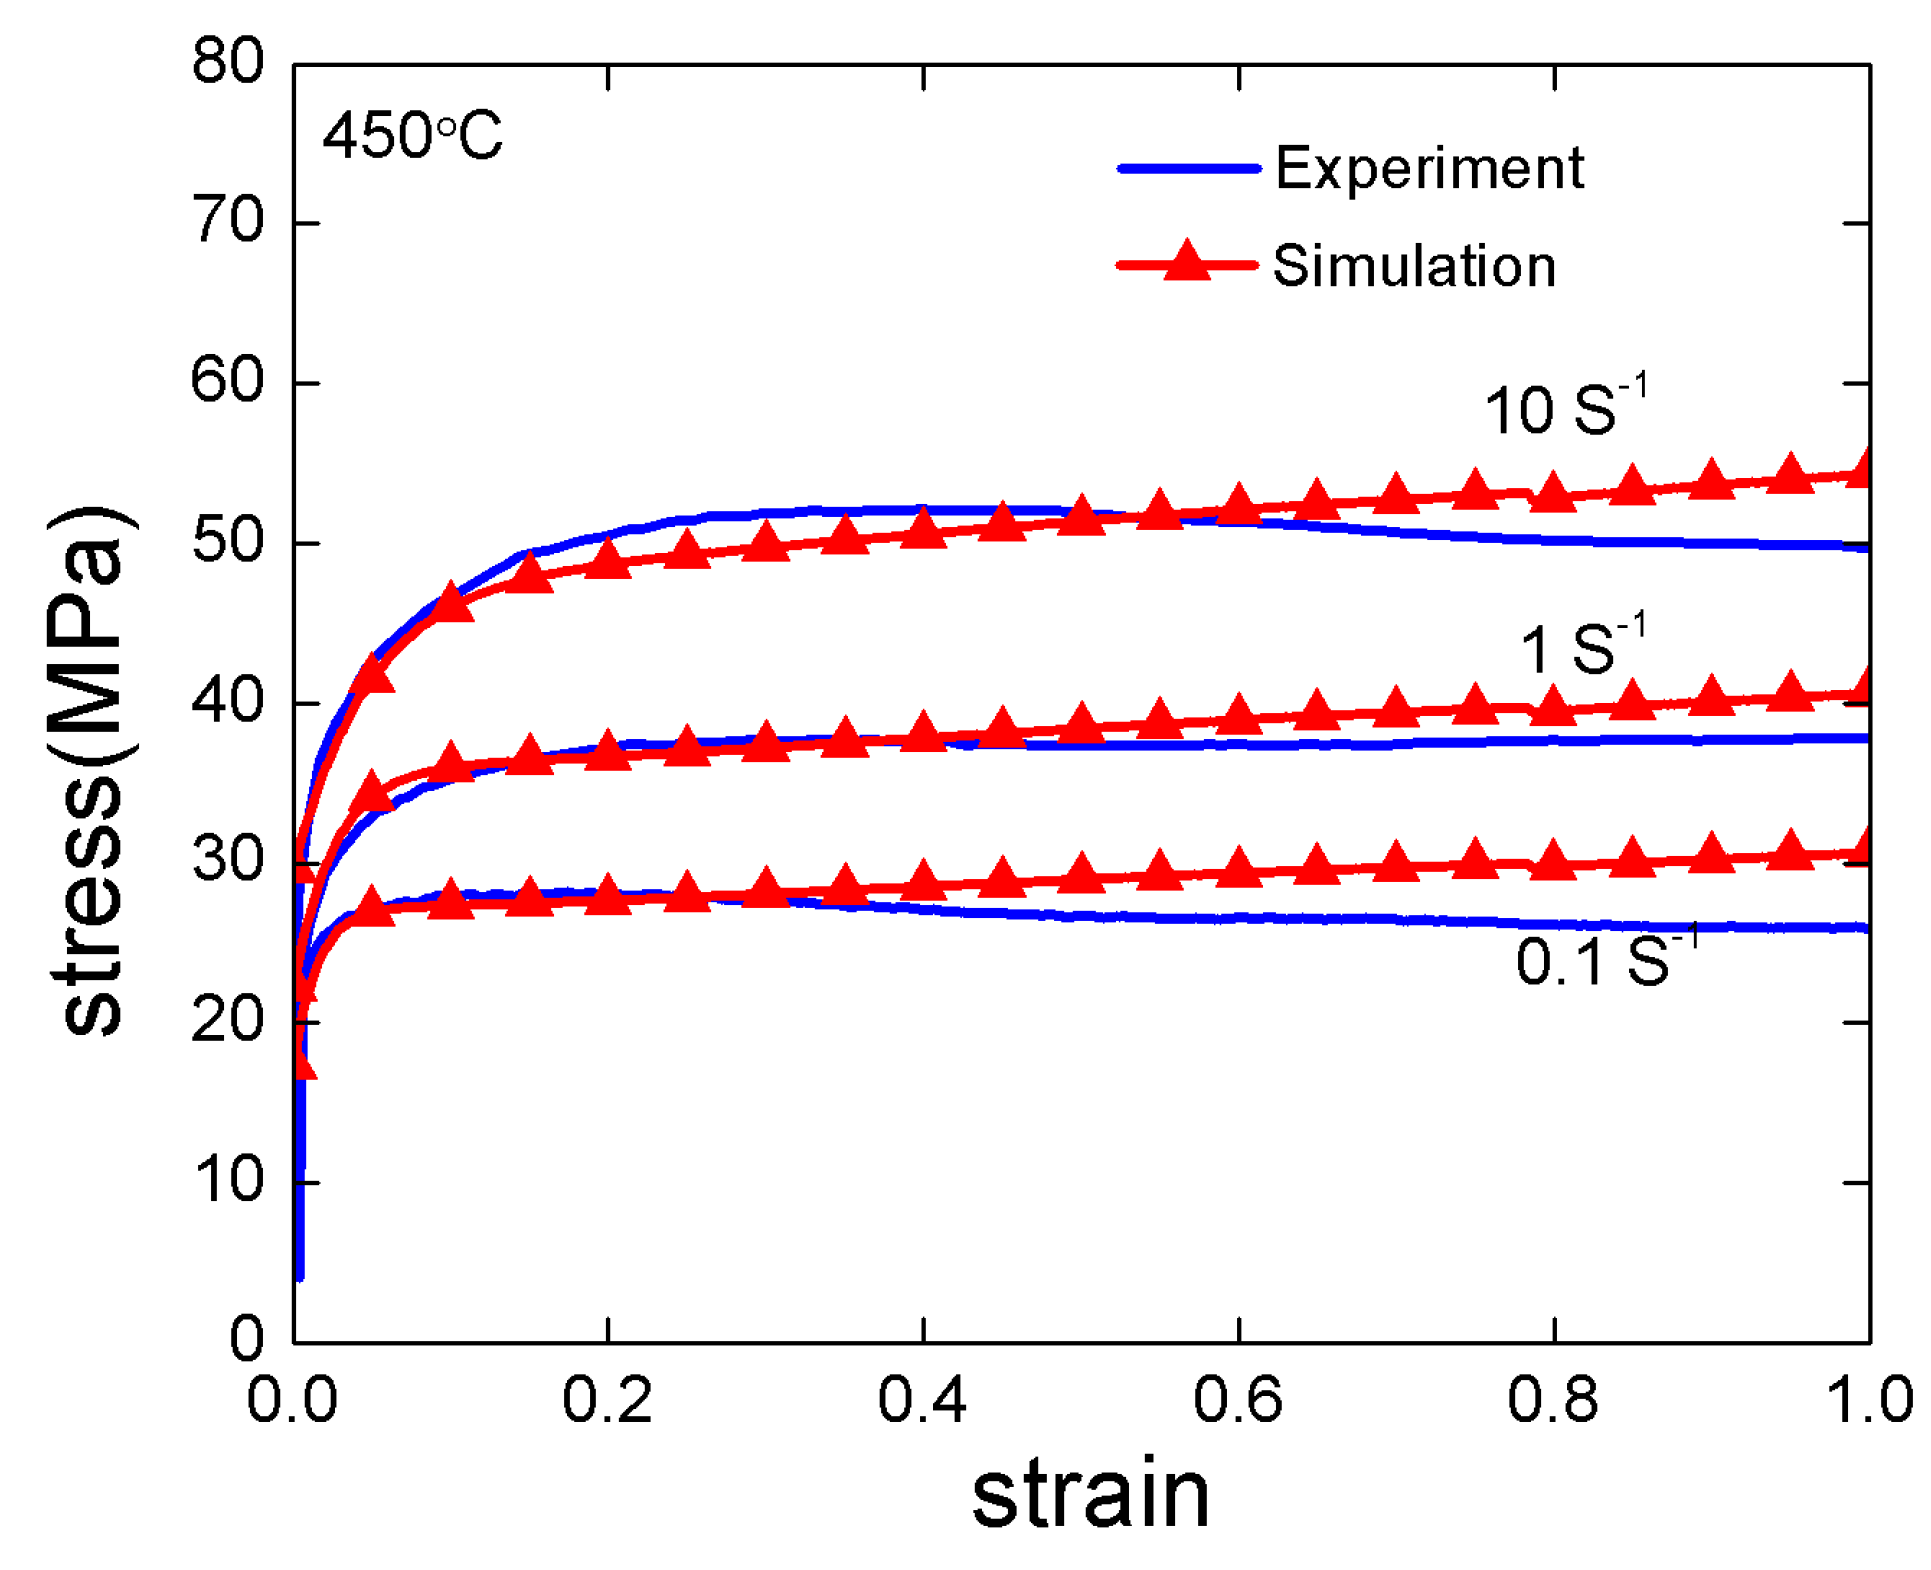
4.2. Parameters Calibration
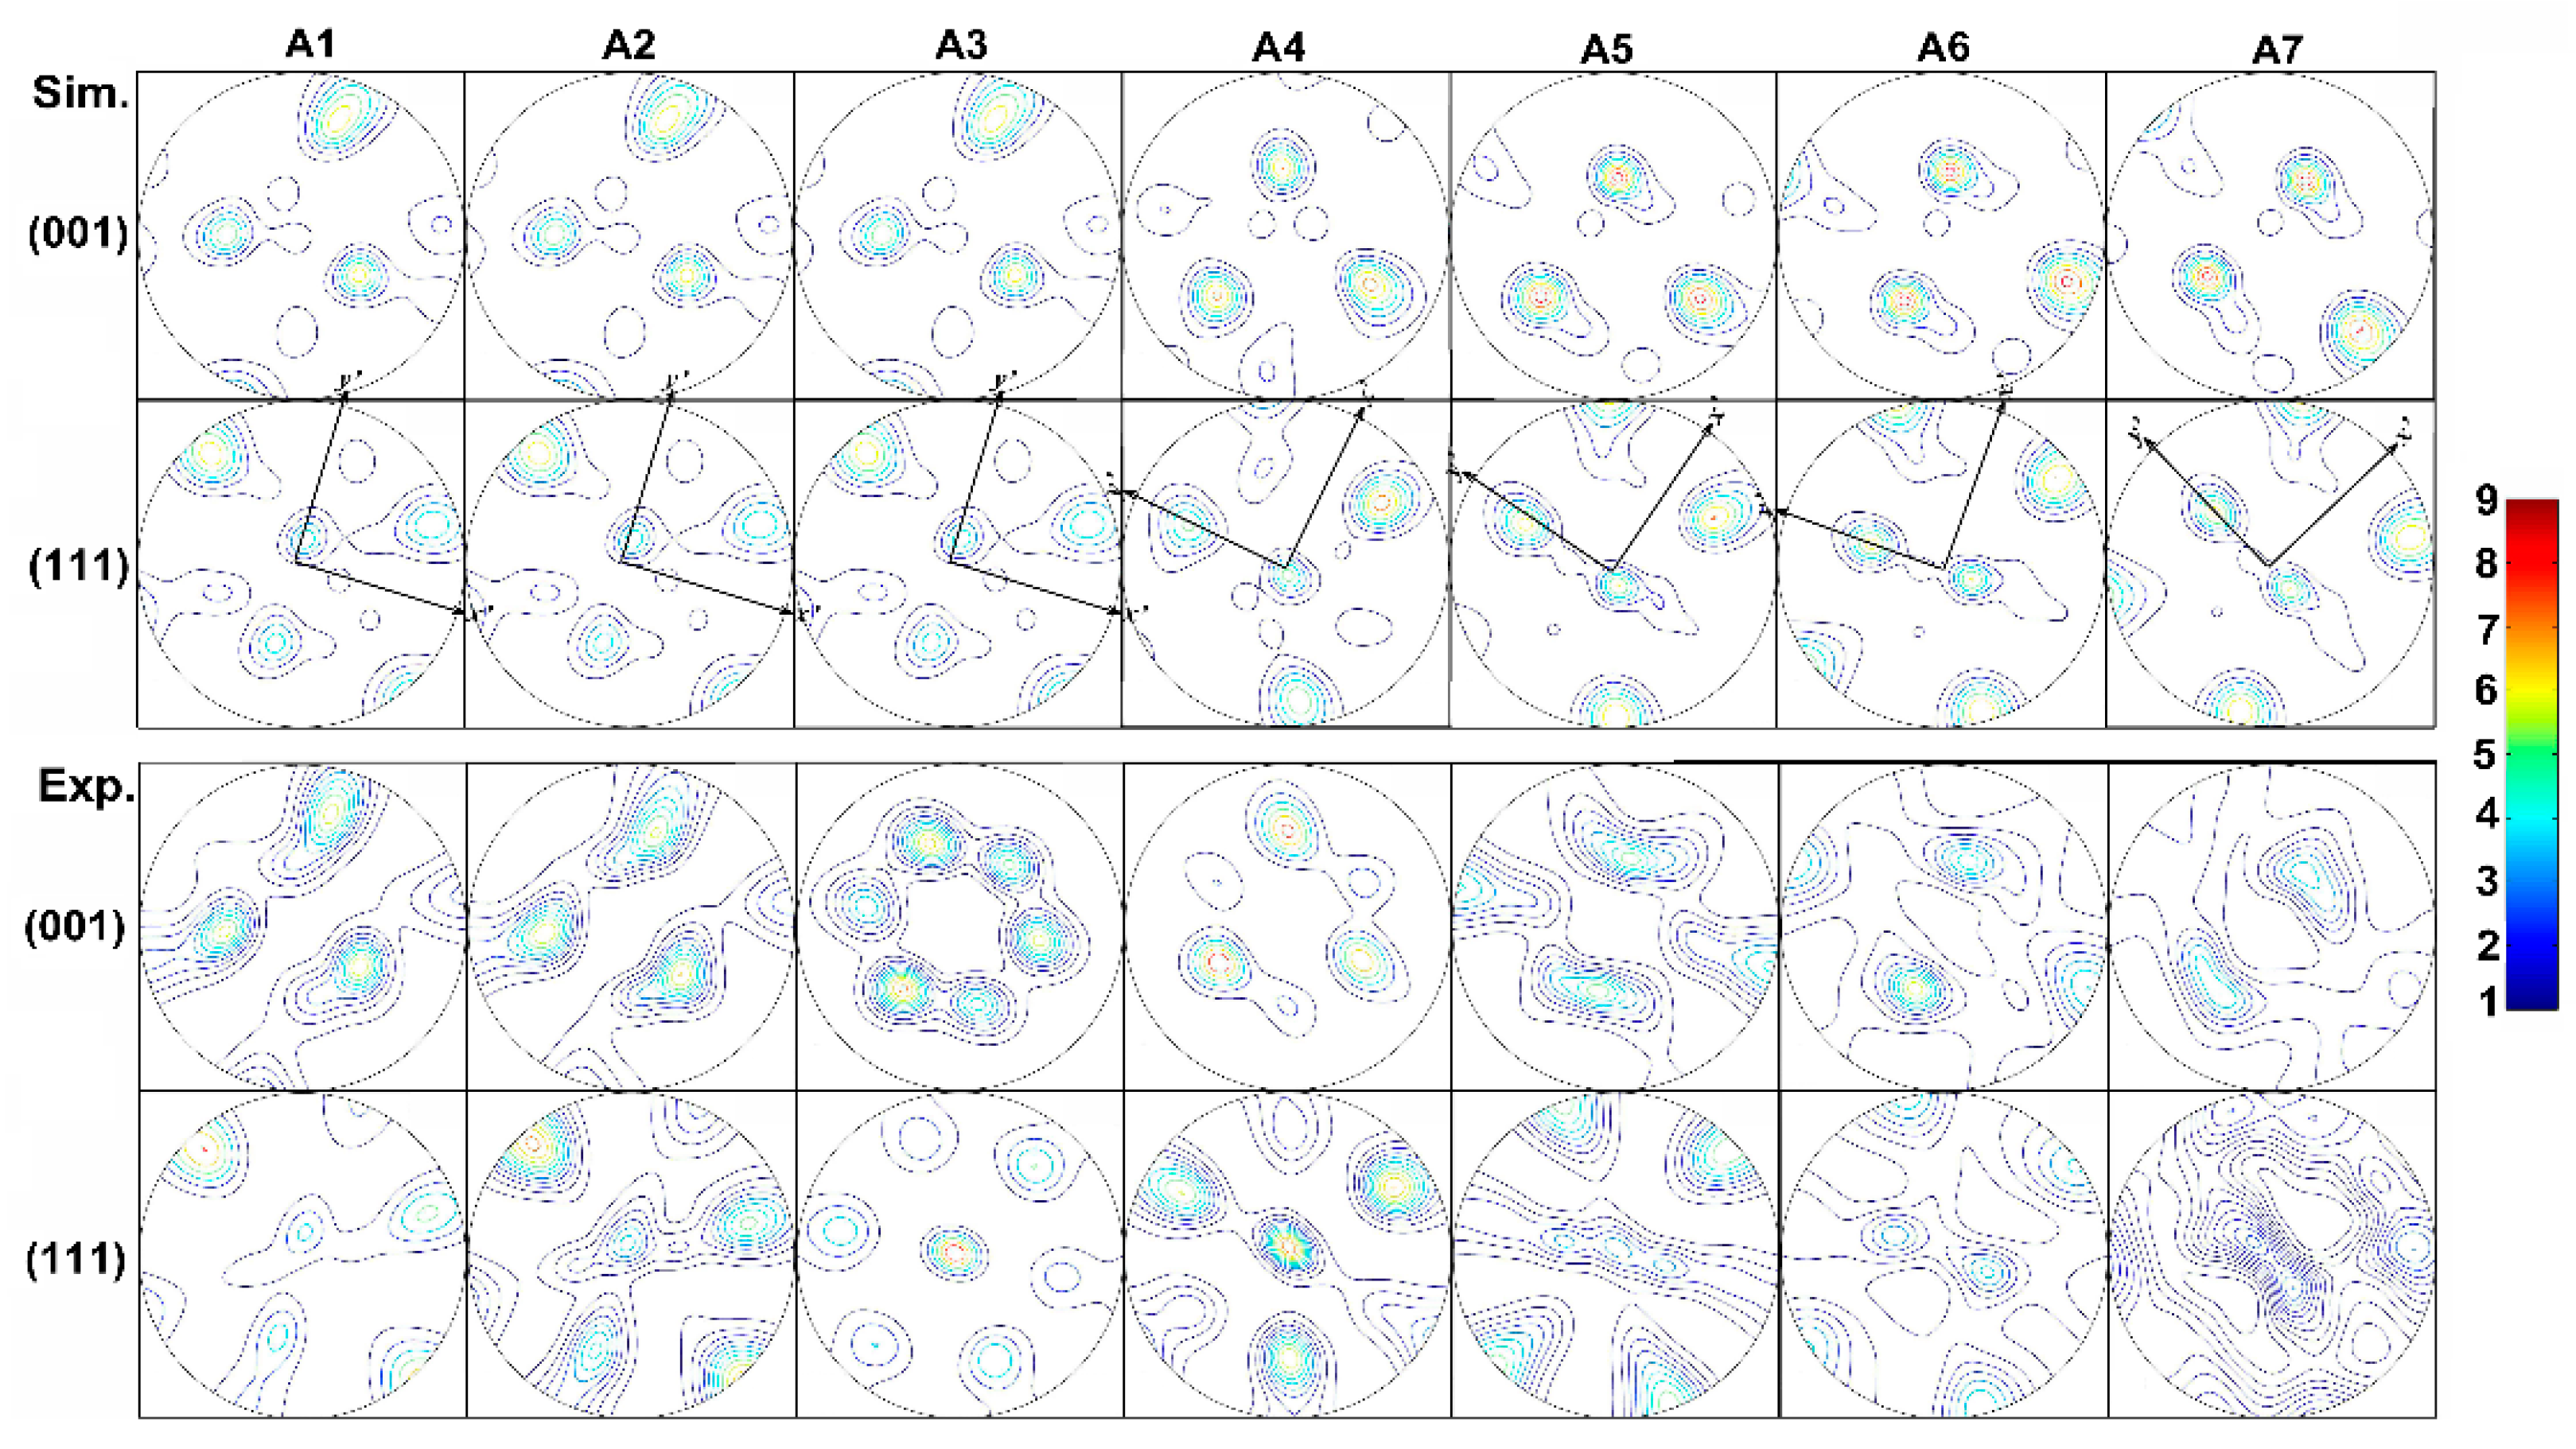
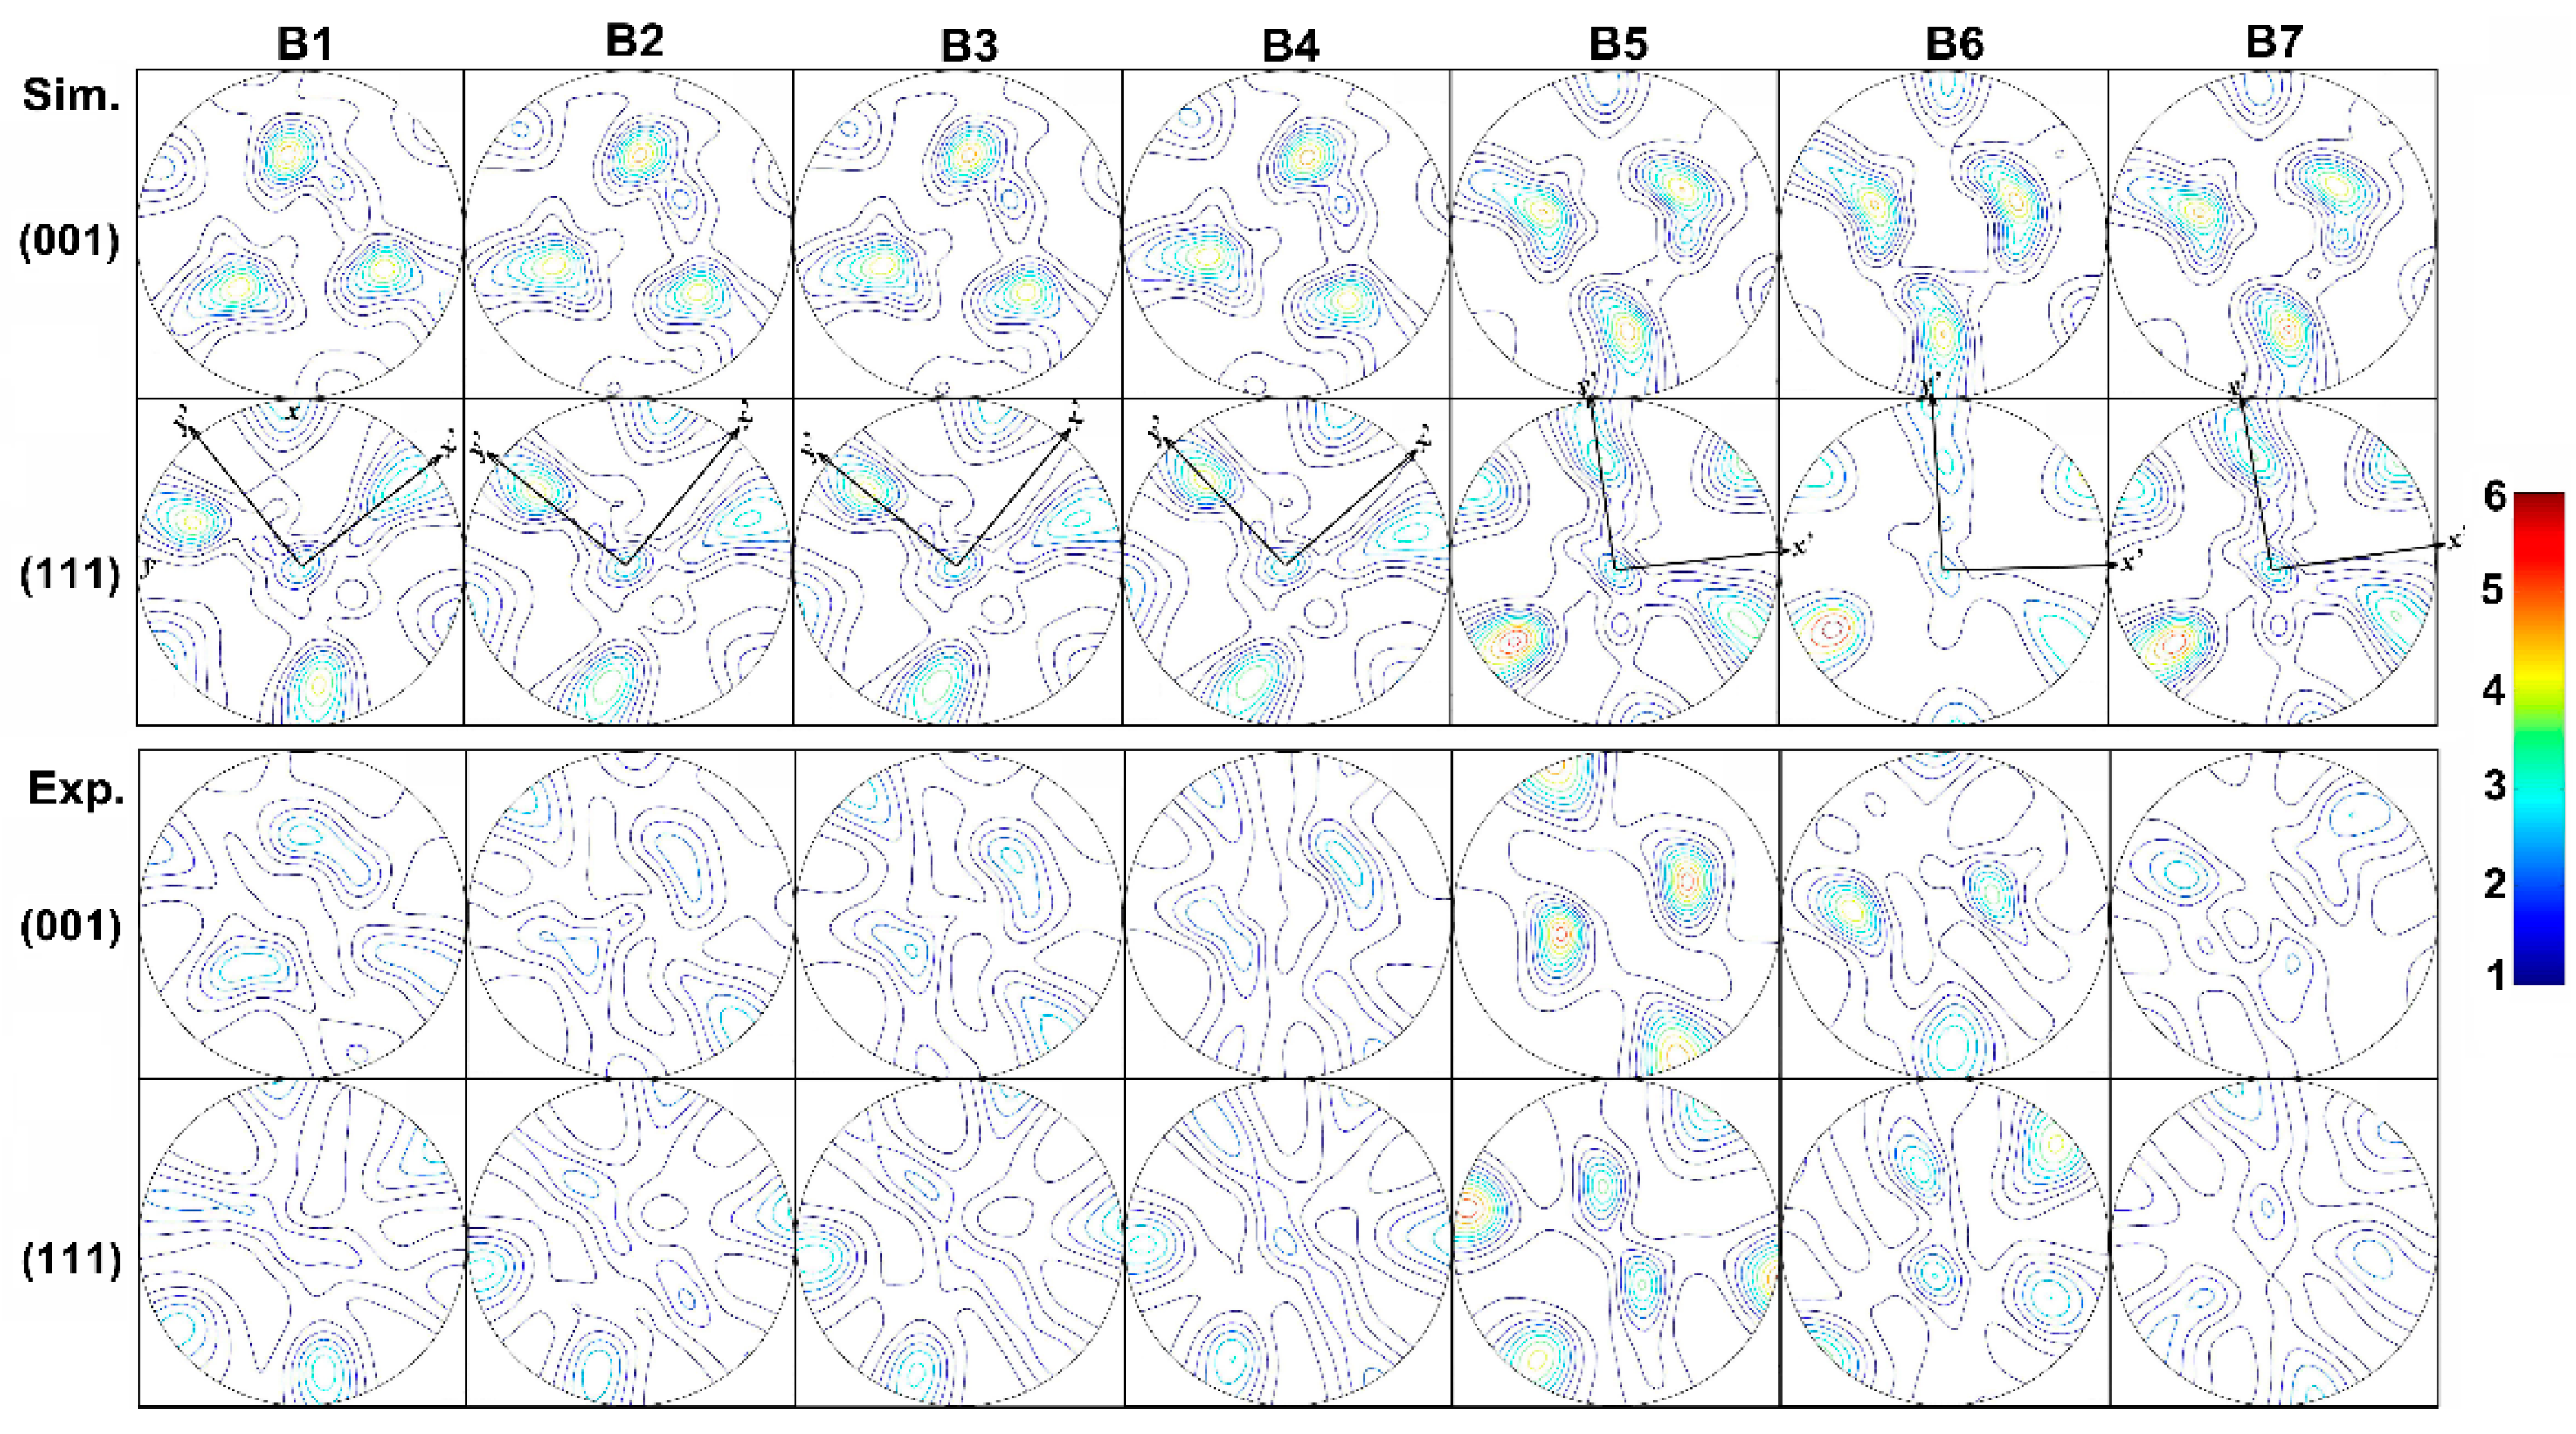
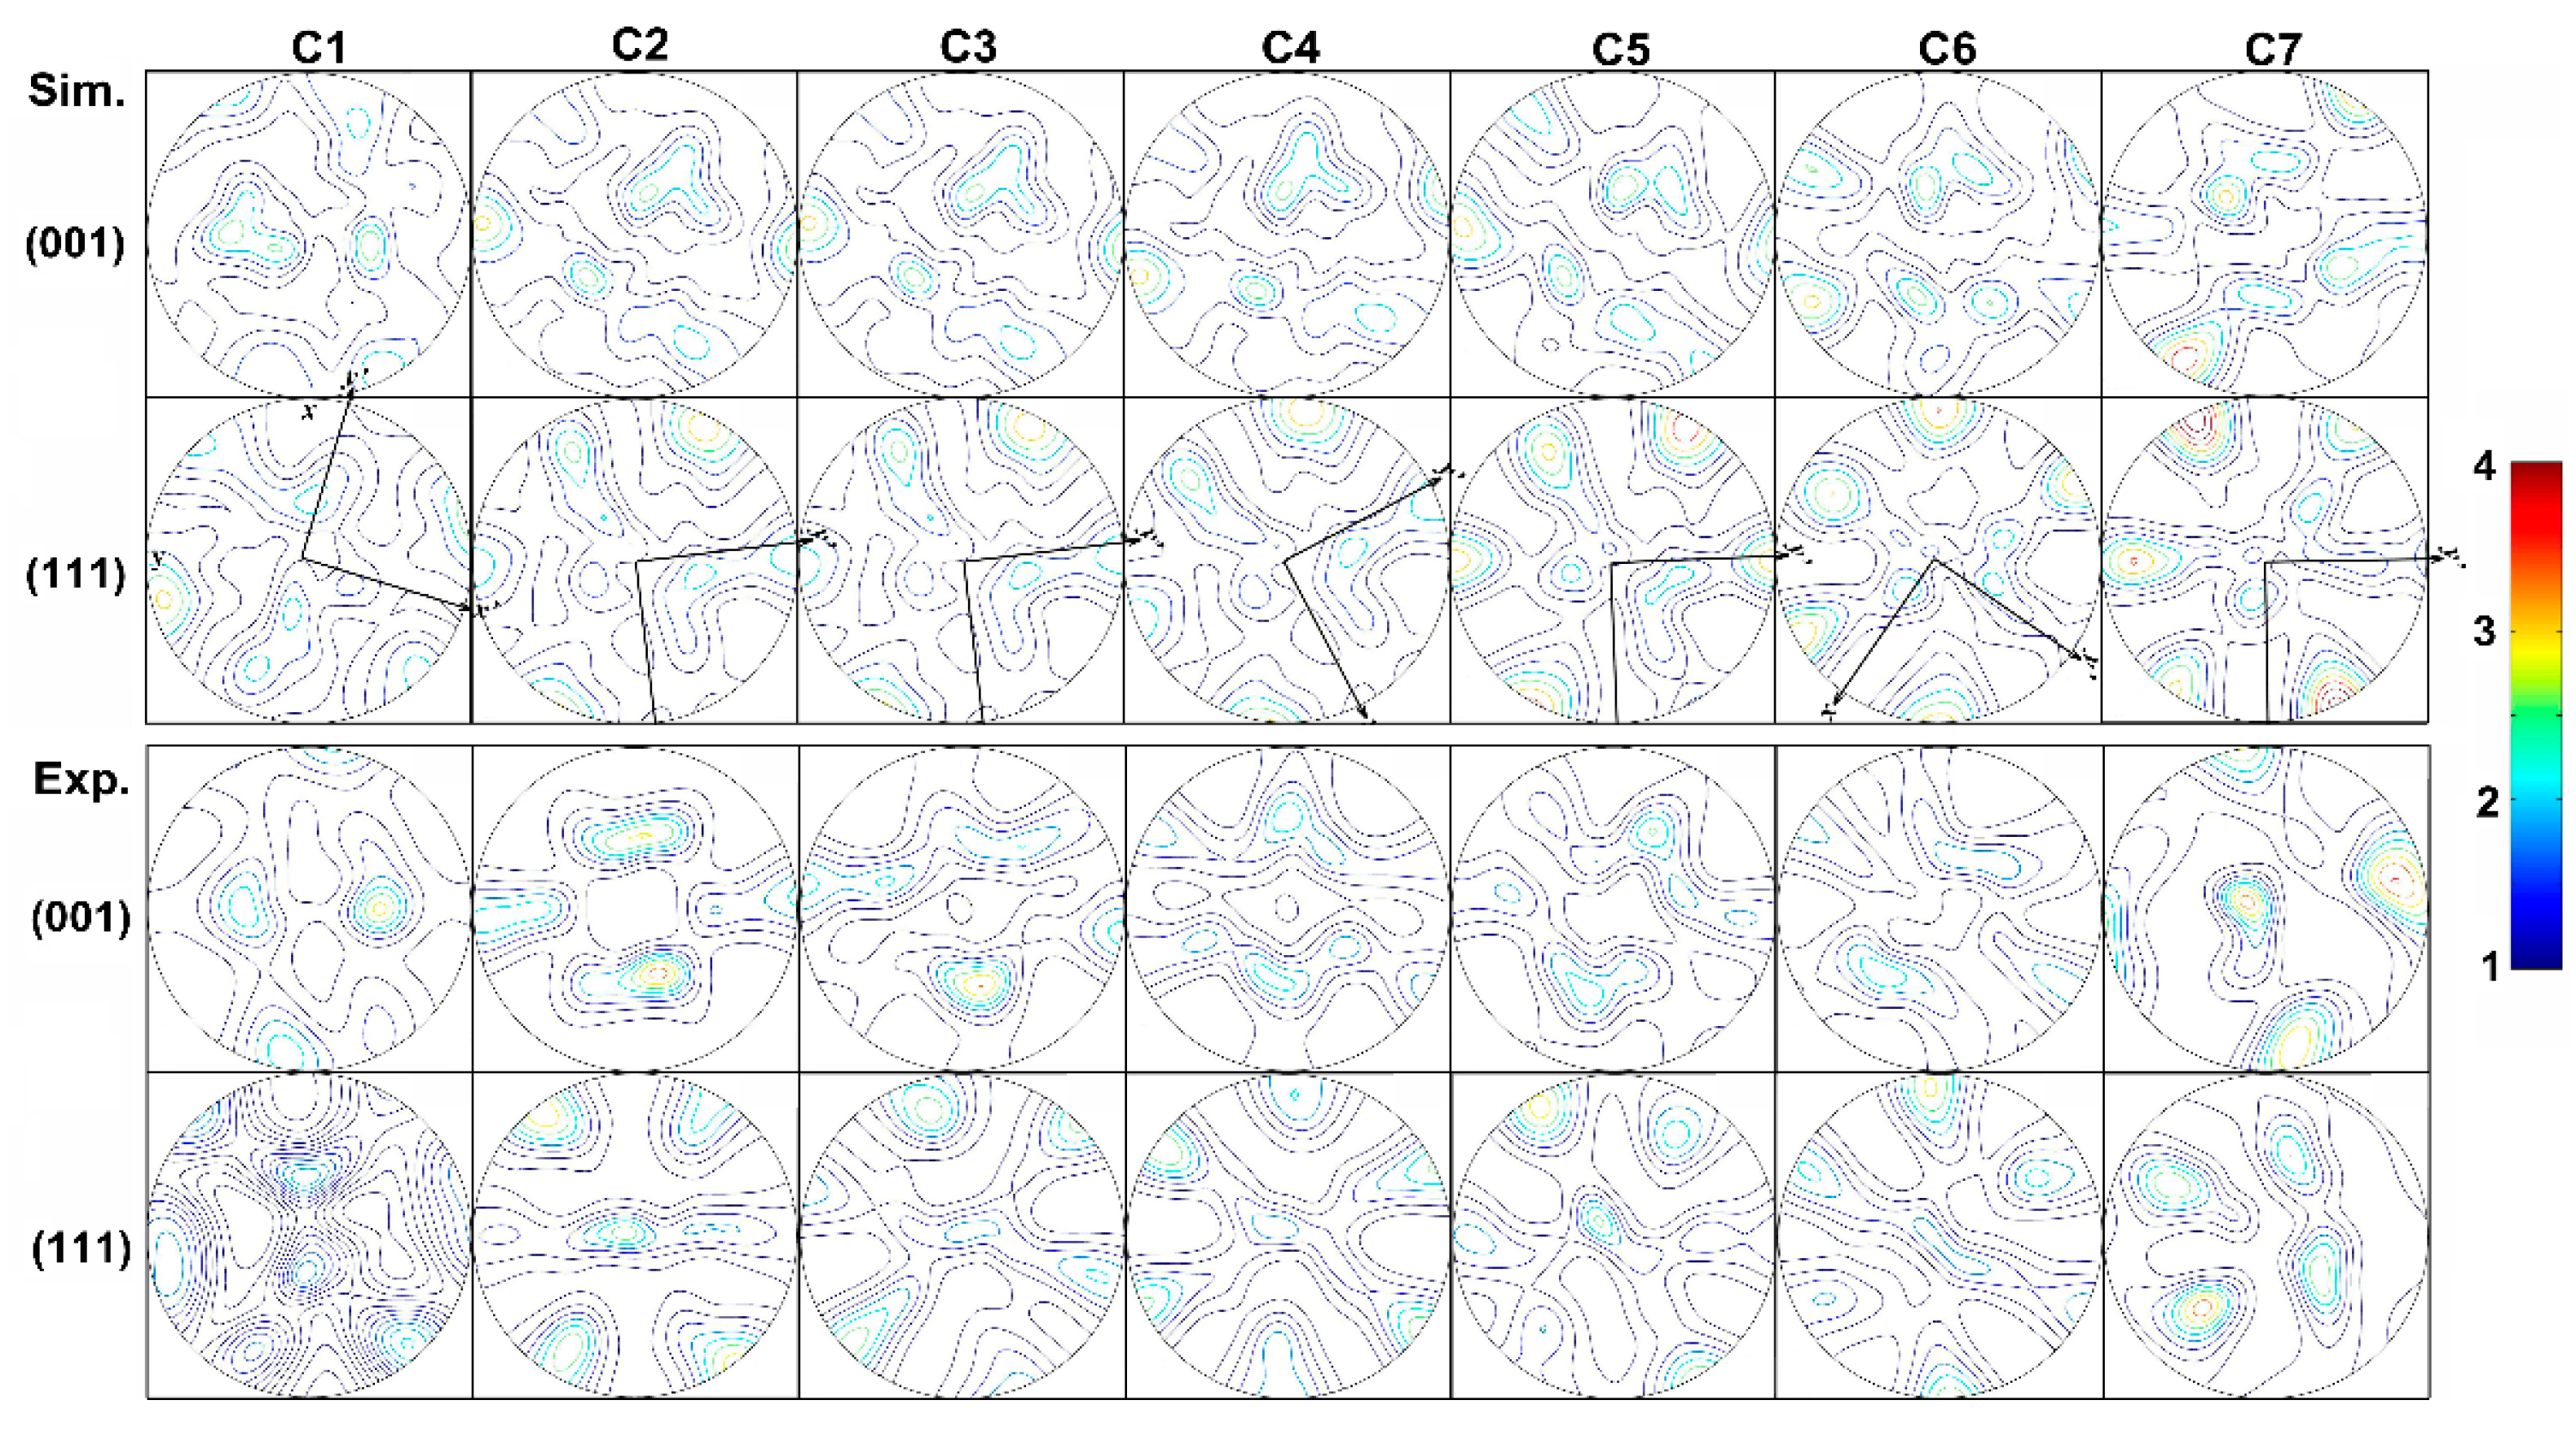
4.3. Texture Evolution
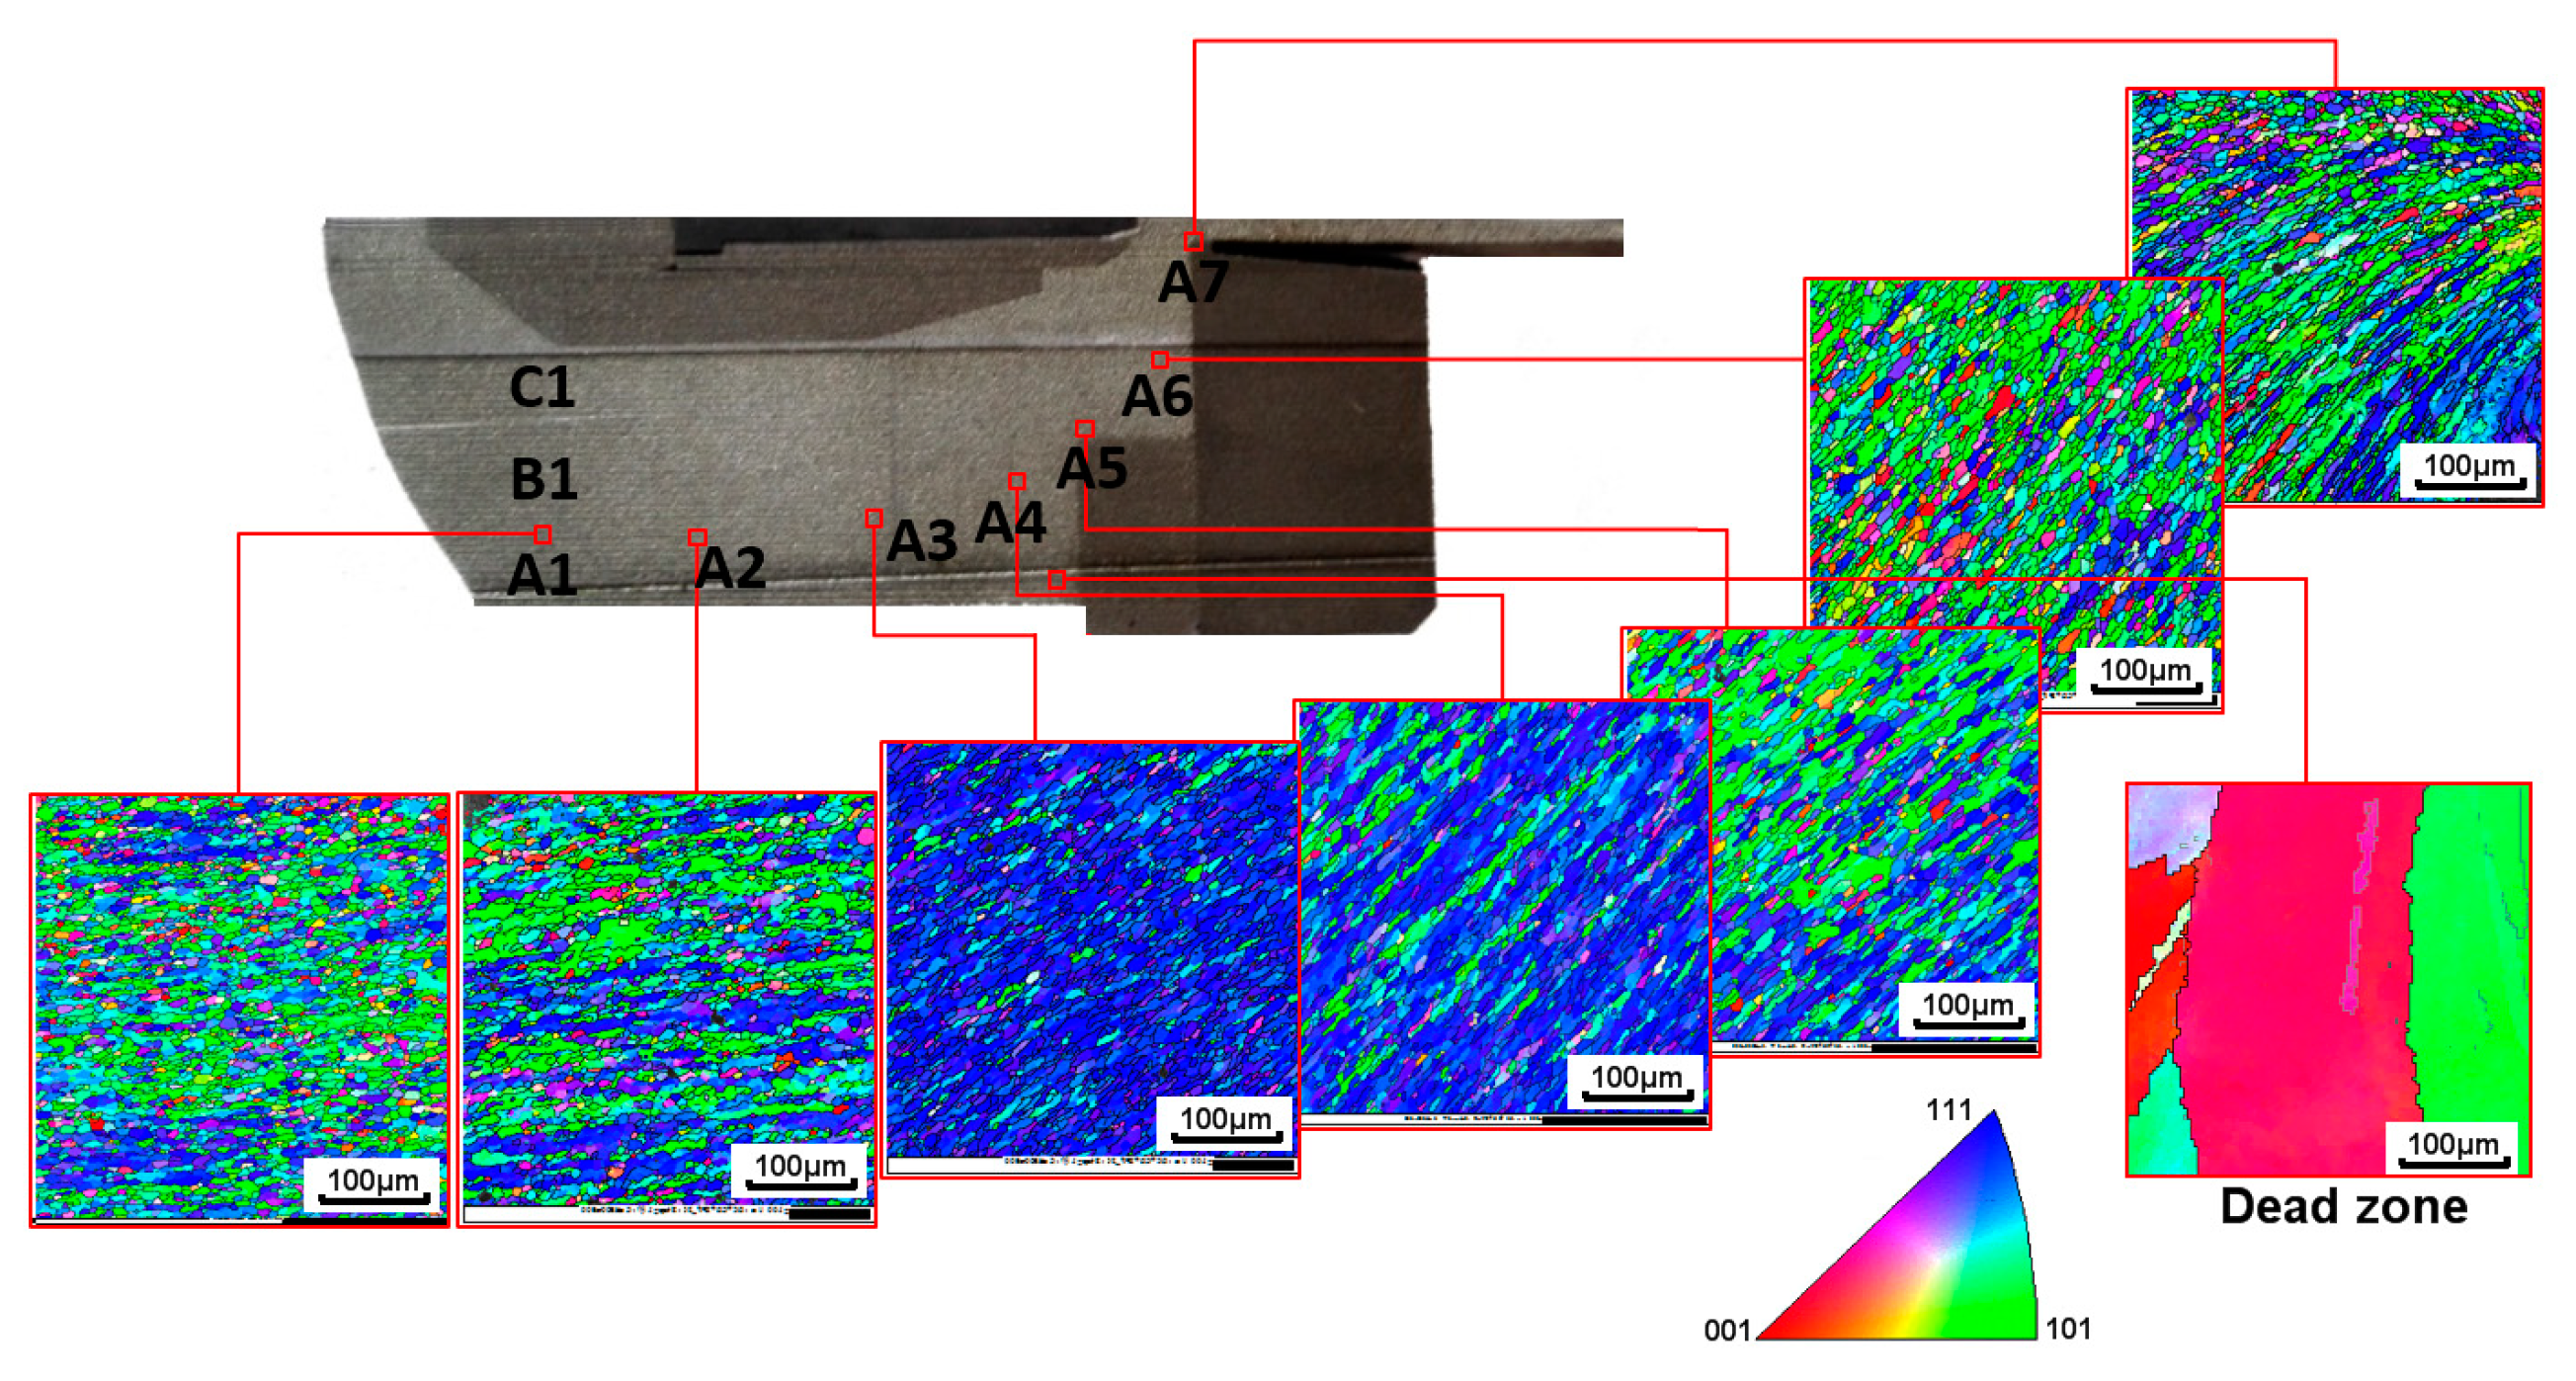
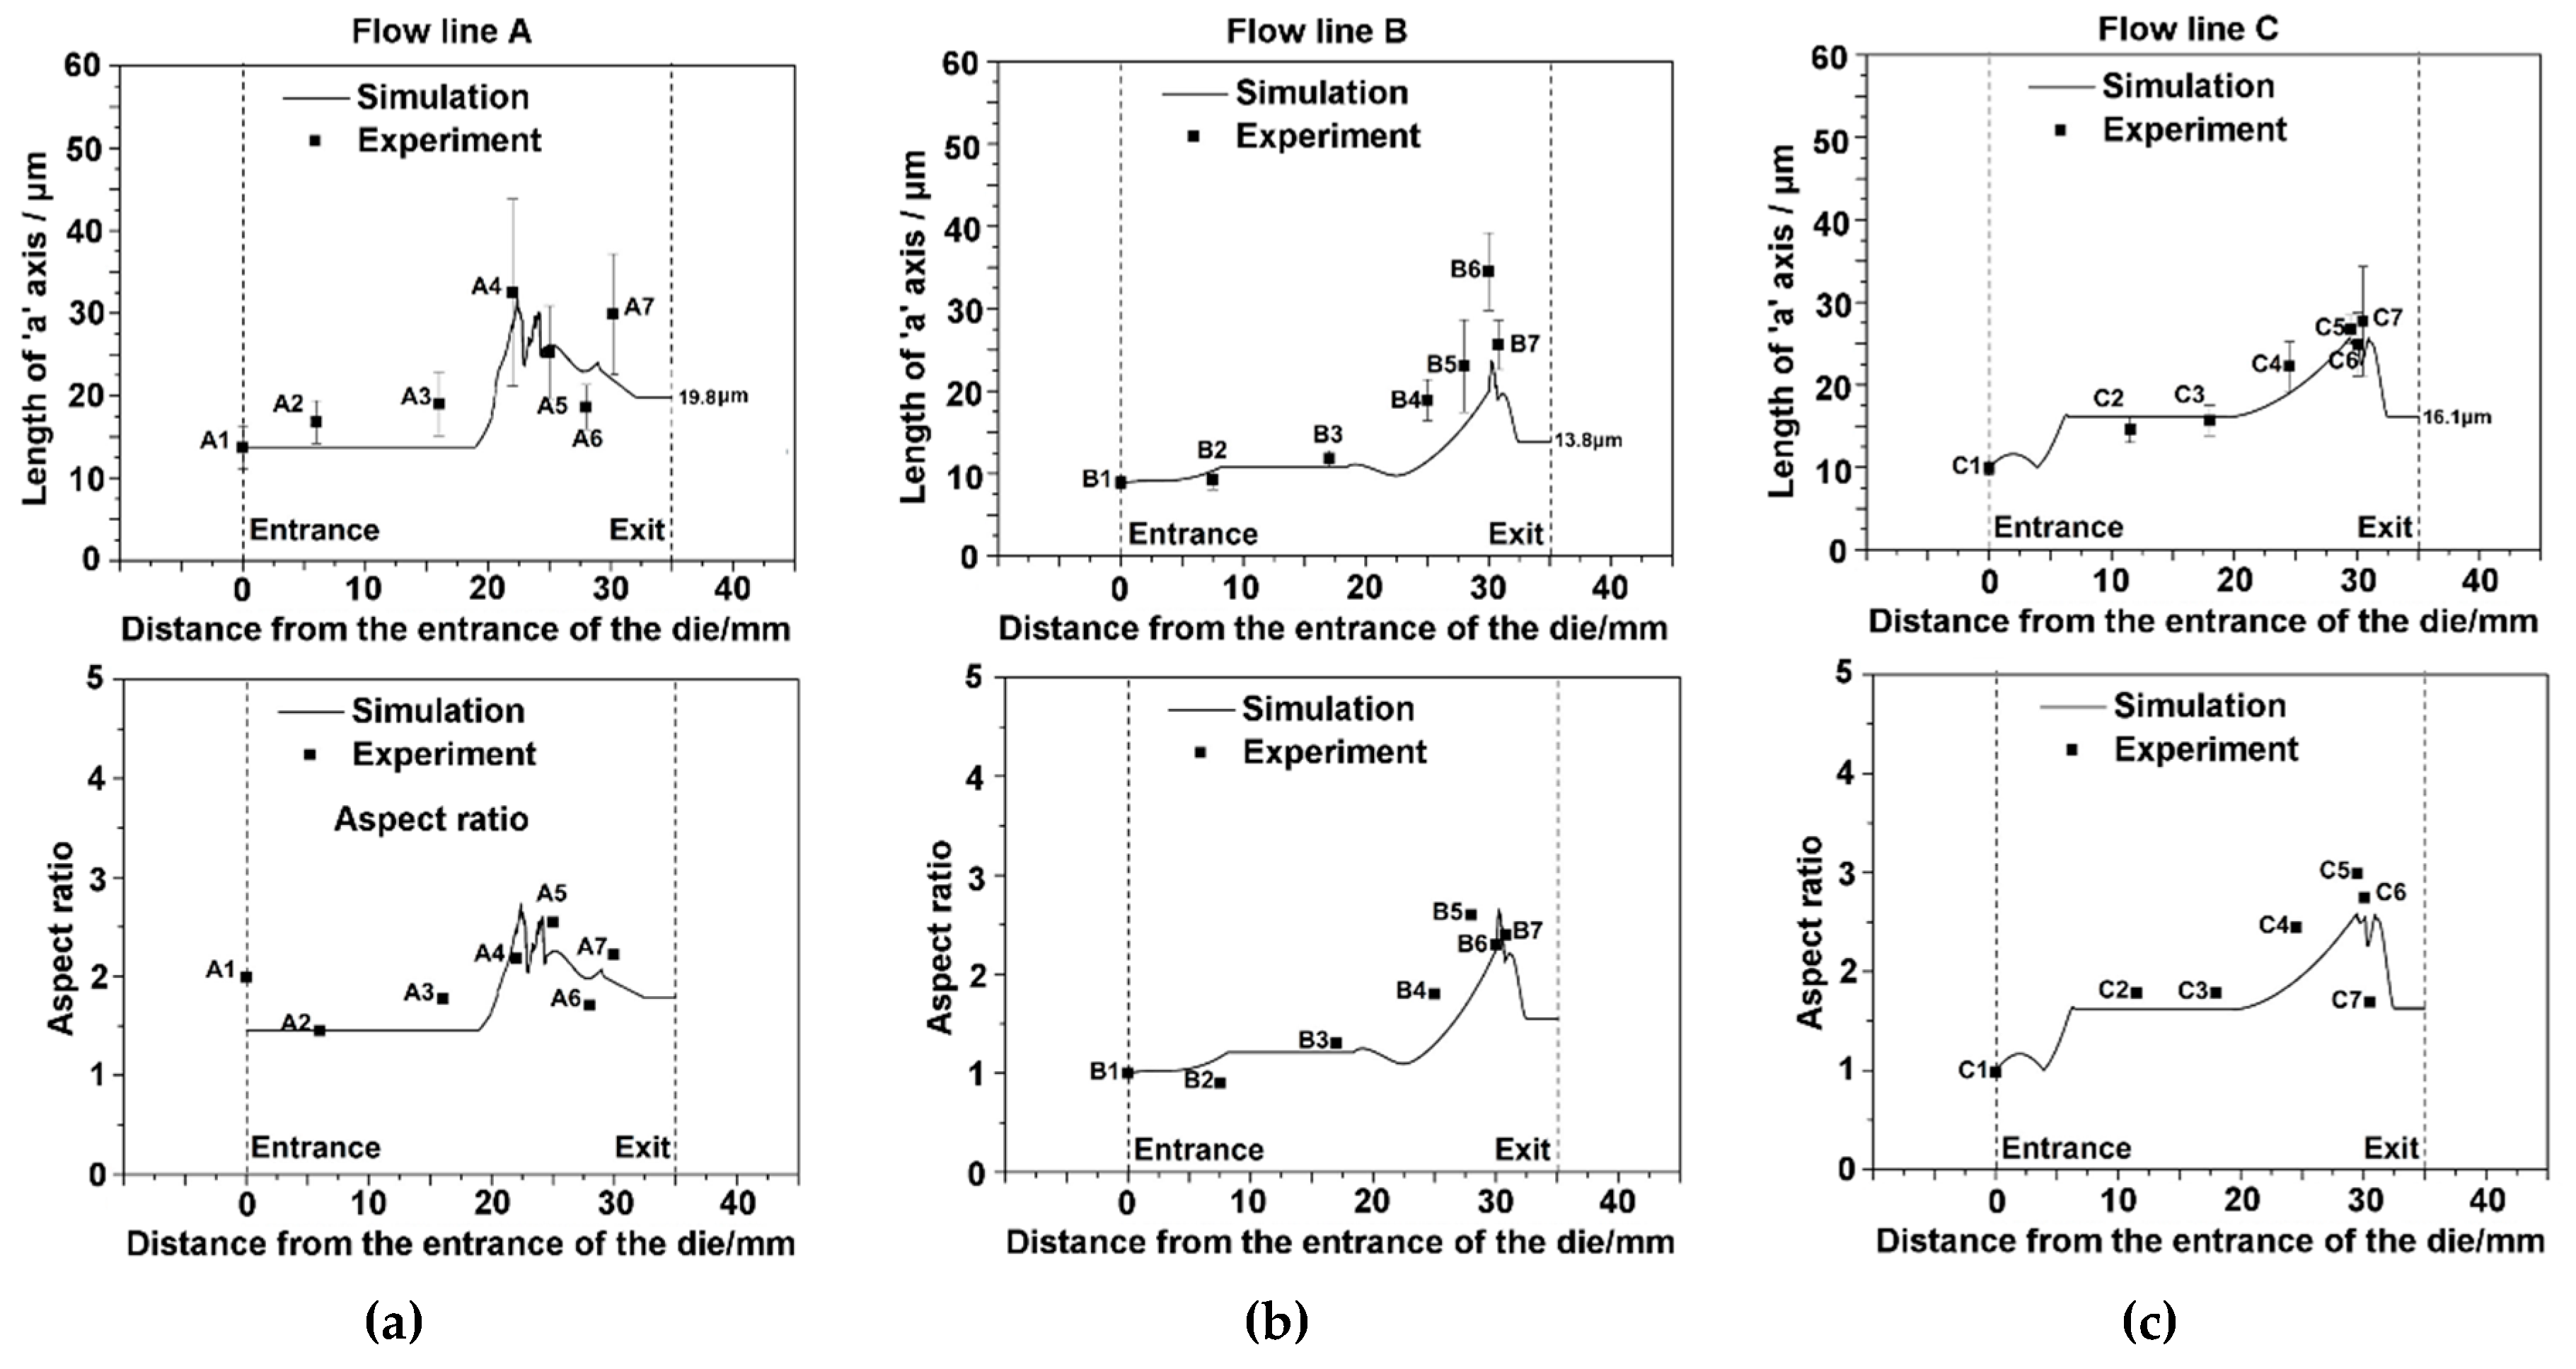
4.4. Grain Shape and Size Development
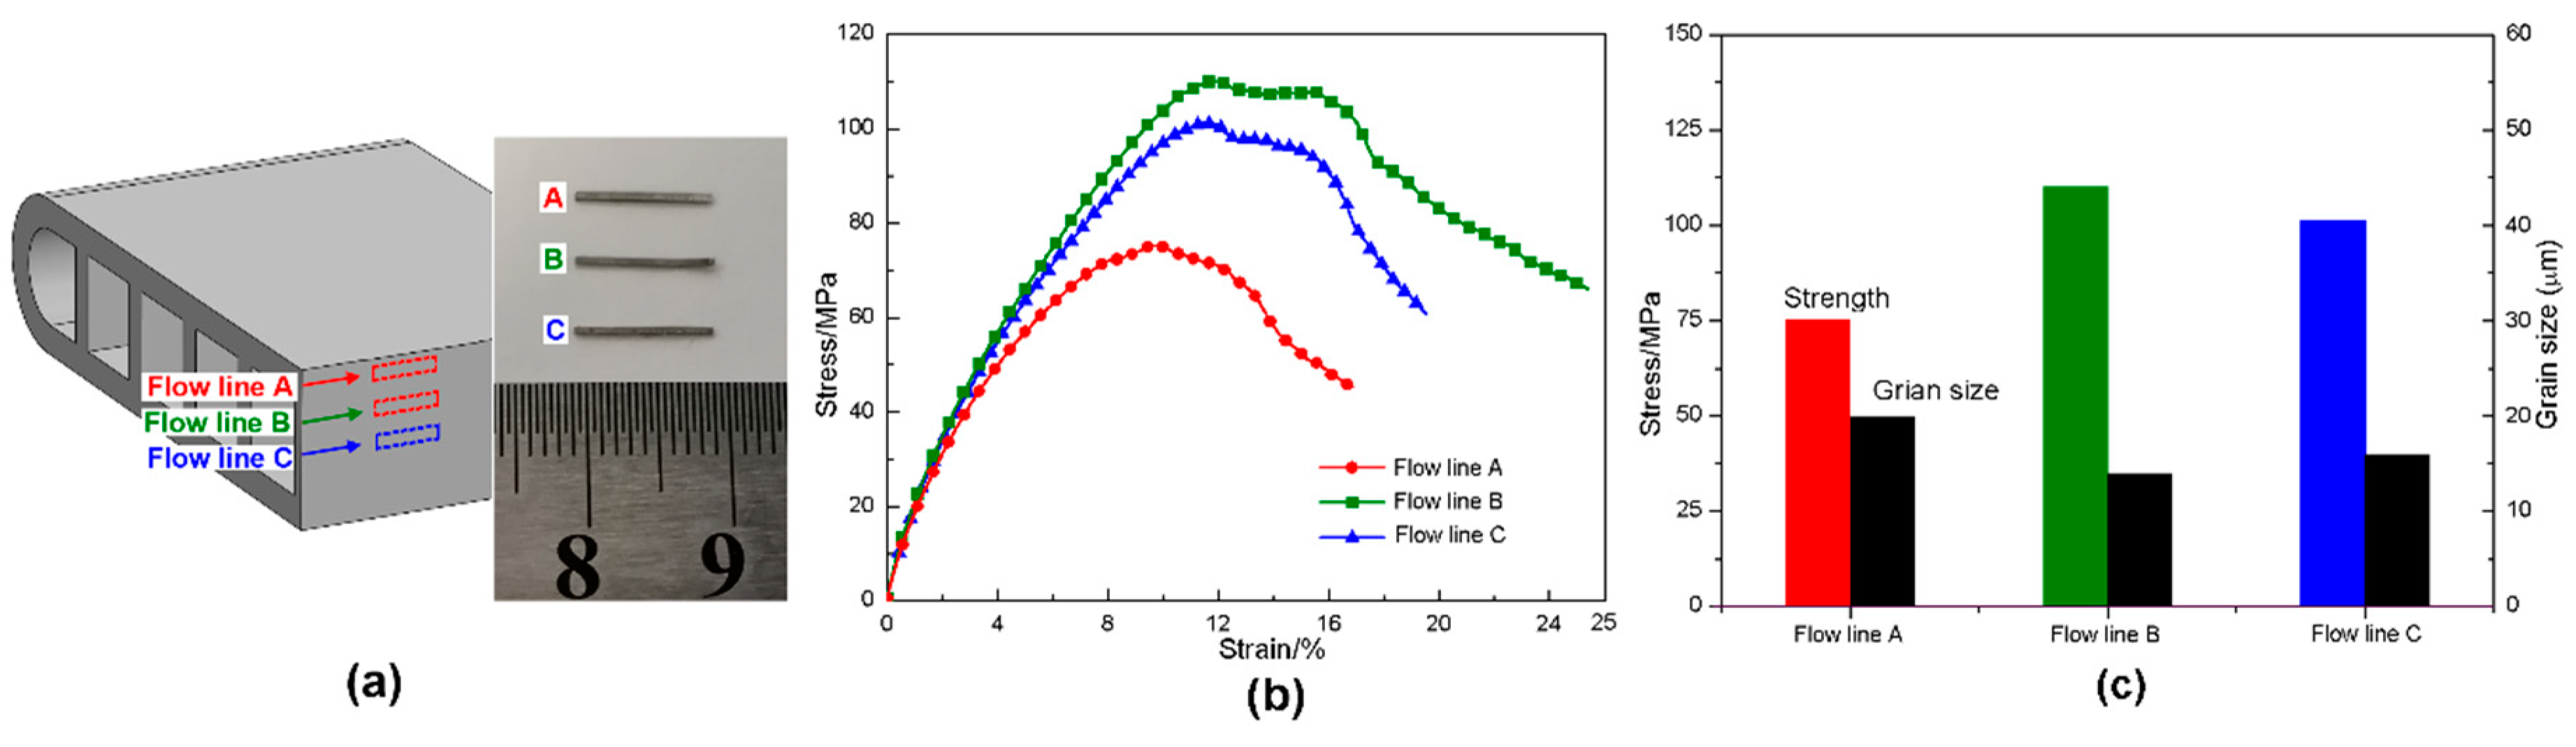
4.5. Mechanical Property across the Thickness of MCT
5. Conclusions
- (1)
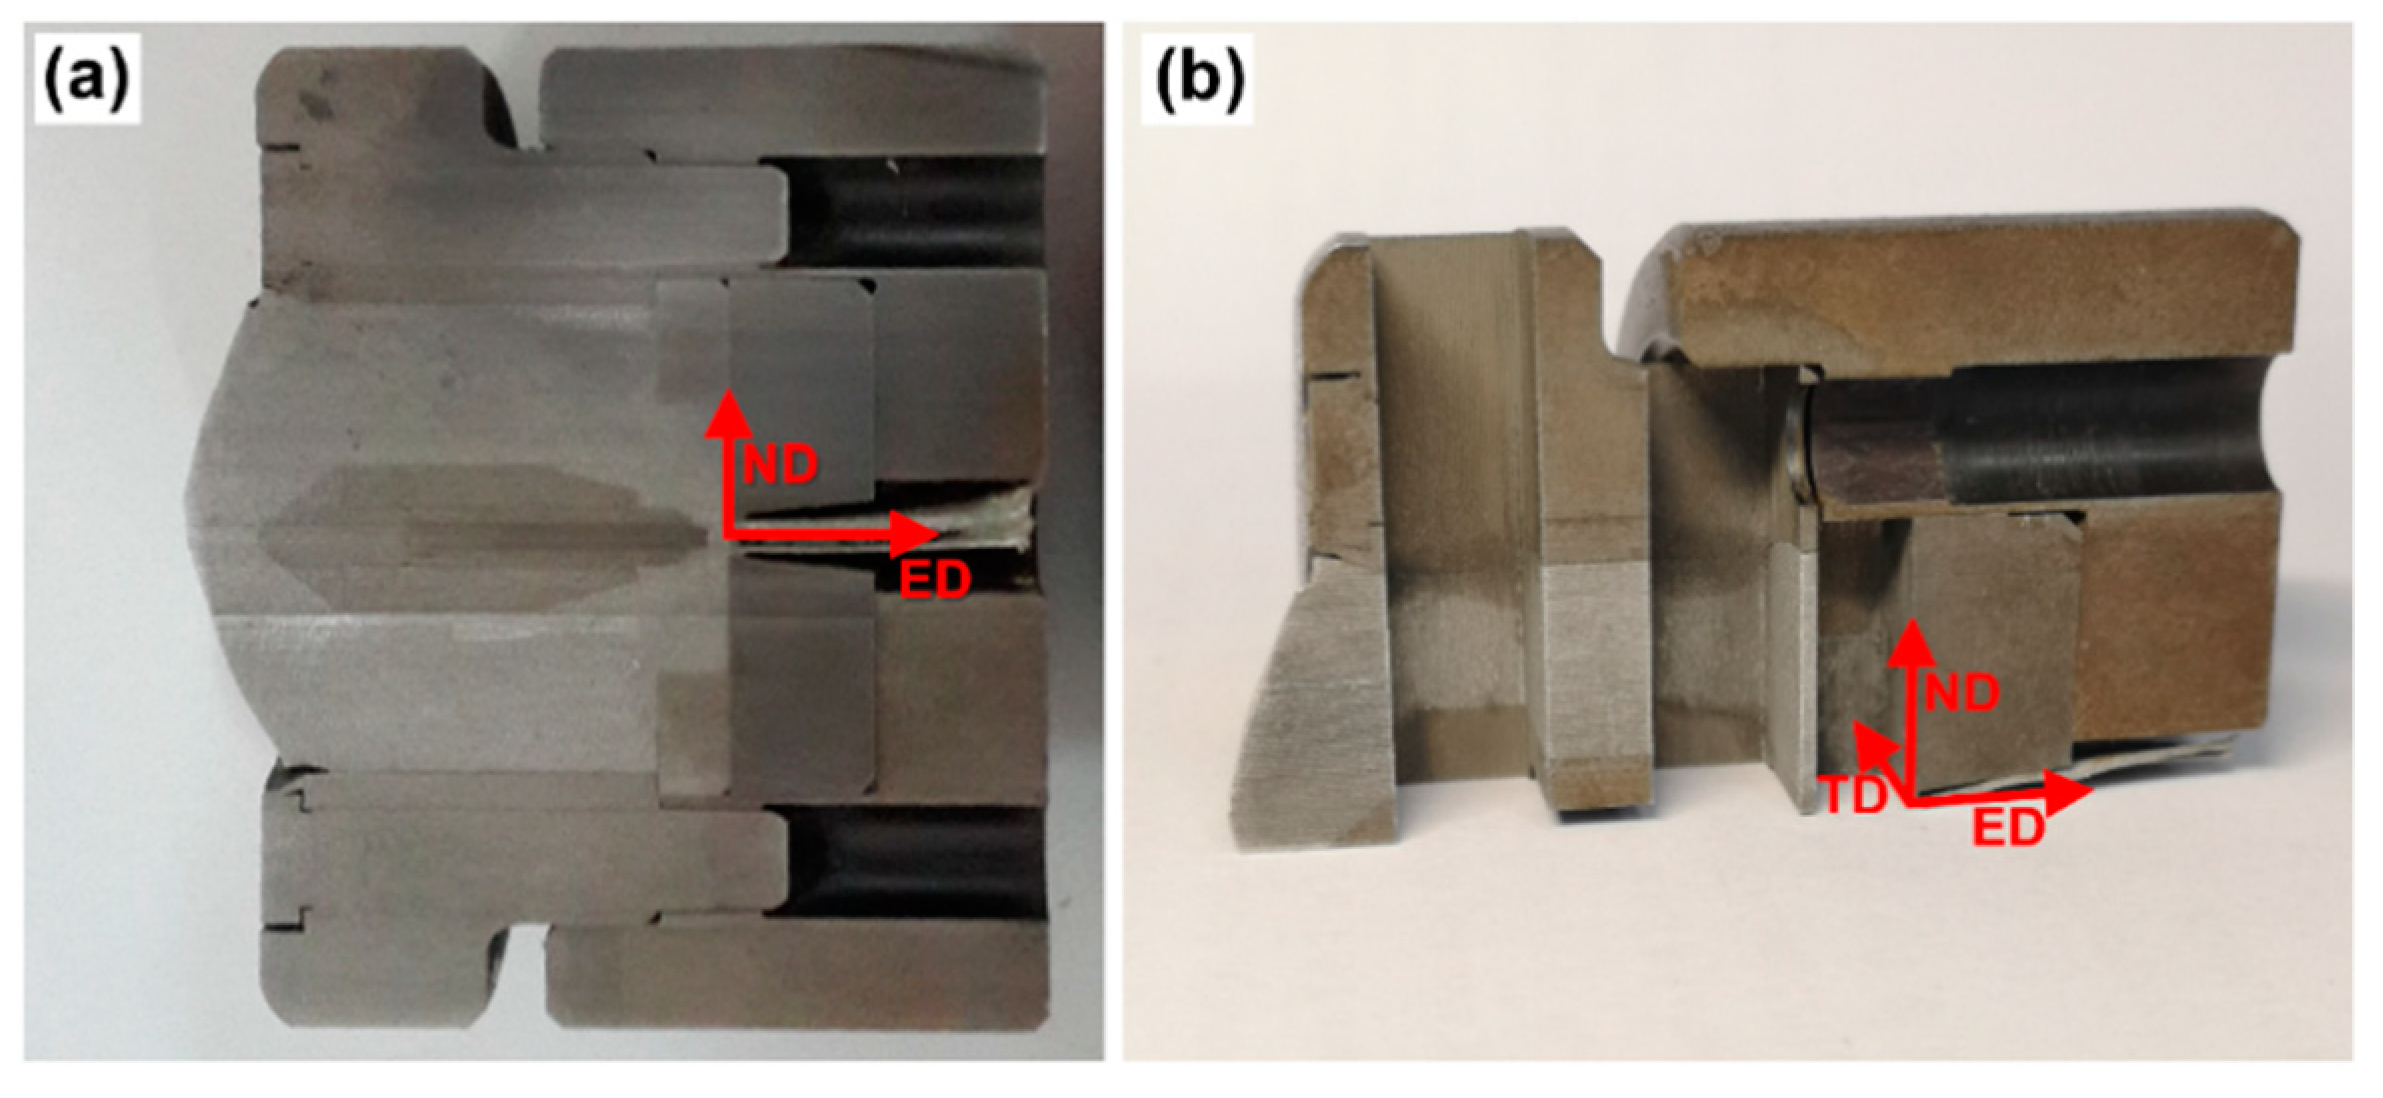
- Large deformation is occurred under extrusion with a porthole die. Both the velocity and effective strain fields reveal that the base material undergoes very heterogenous and severe deformation.
- (2)
- The FE simulation can accurately reproduce the flow line of the material within the porthole die. The velocity gradient within the die can be obtained by the flow line model. In conjunction with the crystal plasticity model of VPSC, the evolution of the microstructure can be well reproduced.
- (3)
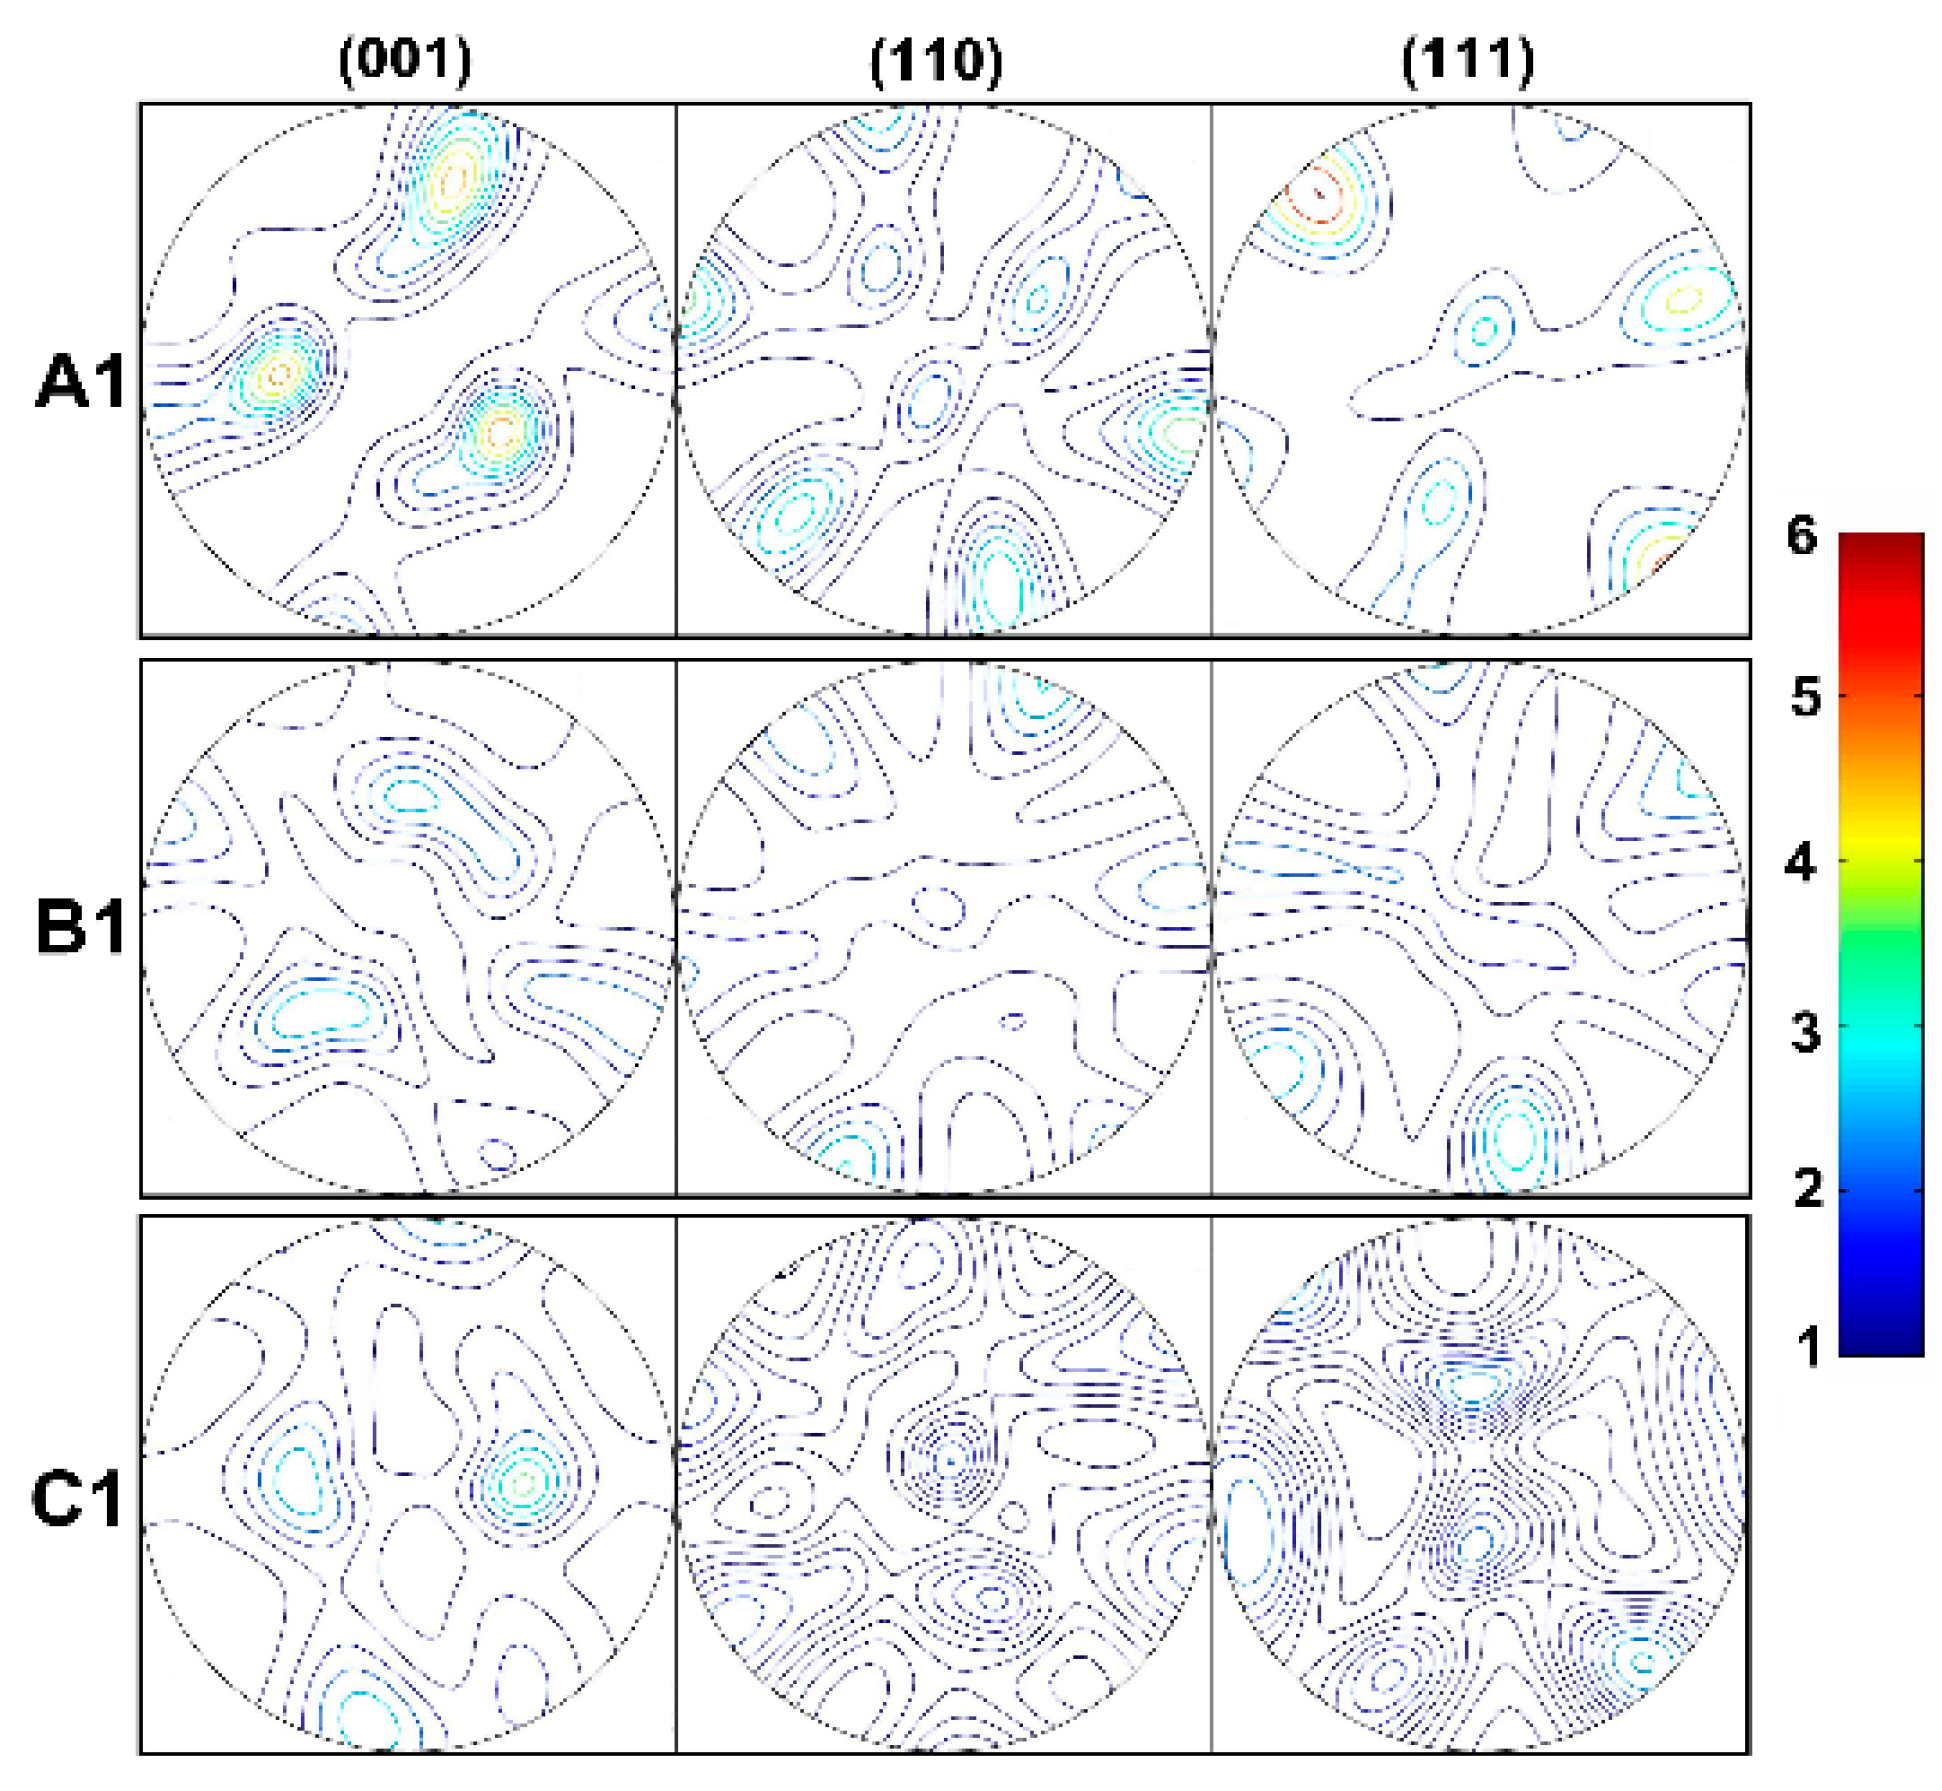
- The rotation of shear plane causes the texture change during material flow. The different rotation of shear plane attributes to the difference of texture evolution law on three flow lines. Because of mold structure and change of friction condition, the rotation of shear plane in deformation process performs alternation of clockwise and counterclockwise on flow line A and C. For flow line B, in dramatic plastic deformation zone, the shear plane keeps clockwise rotation, except counterclockwise rotation at the exit of mold.
- (4)
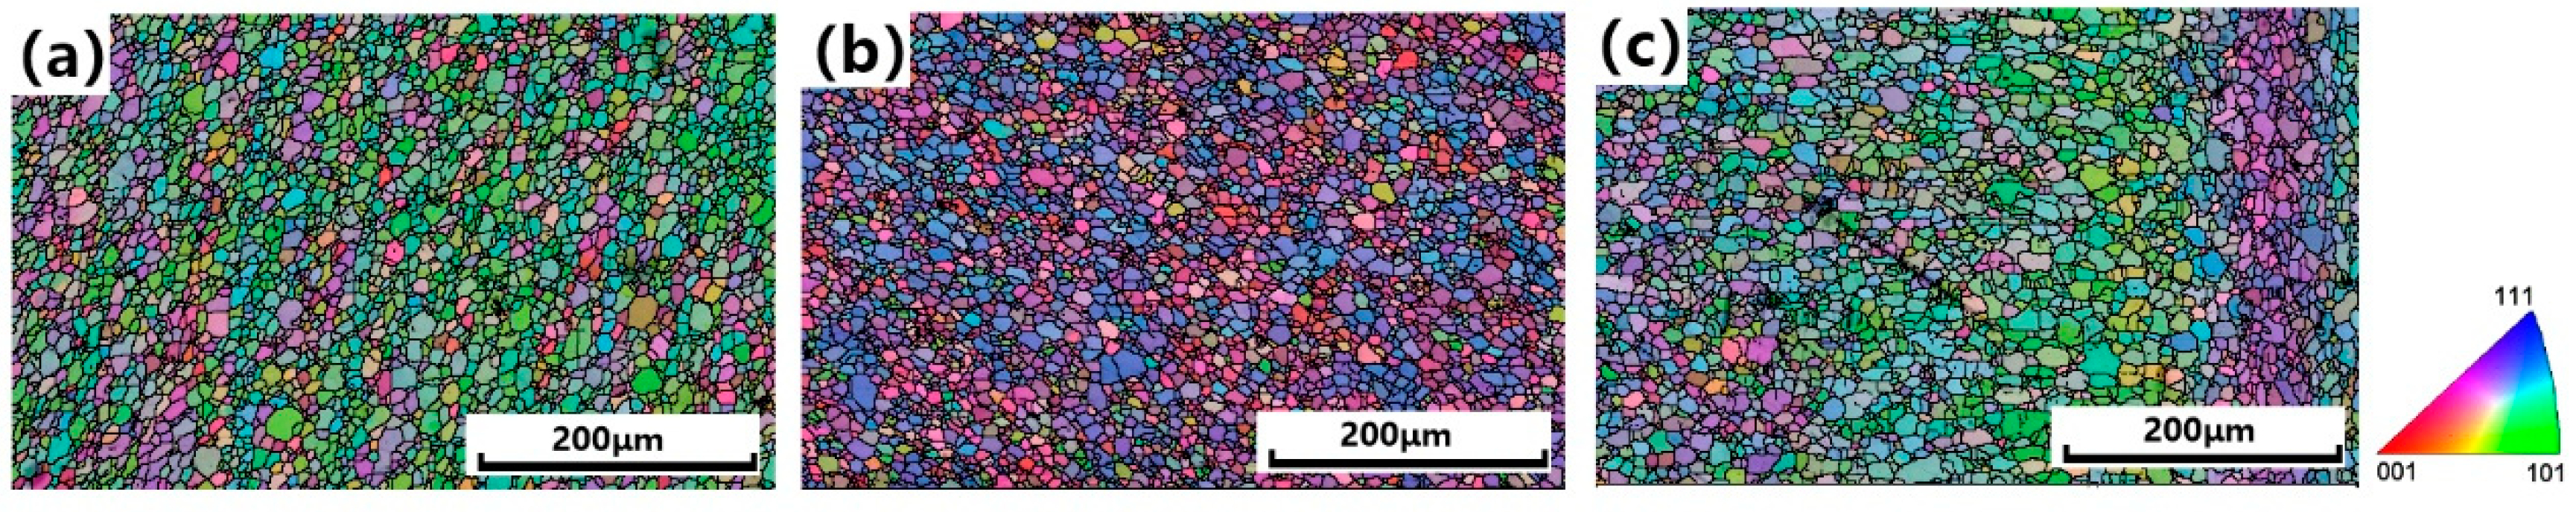
- There is a close relationship between grain refinement and shear effect. The grain refinement characteristics vary with different shear effect of aluminum on different flow line. Polycrystalline plasticity model predicts the trend of grain size and morphology development on different flow line, especially the process that grain is stretched and, to a certain extent, refined under severe deformation.
- (5)
- Because of the different microstructure developed, aluminum alloys in the produced tube exhibit different mechanical behaviors across the thickness from location to location. Good correlation to the Hall-Petch effect is obtained, where aluminum alloy with finer grains generally shows higher strength.
Author Contributions
Funding
Conflicts of Interest
References
- Tang, D.; Fan, X.; Fang, W.; Li, D.; Peng, Y.; Wang, H. Microstructure and mechanical properties development of micro channel tubes in extrusion, rolling and brazing. Mater. Charact. 2018, 142, 449–457. [Google Scholar] [CrossRef]
- Doherty, R.D.; Hughes, D.A.; Humphreys, F.J.; Jonas, J.J.; Jensen, D.J.; Kassner, M.E.; Kingg, W.E.; McNelleyh, T.R.; McQueeni, H.J.; Rollettj, A.D. Current issues in recrystallization: A review. Mater. Sci. Eng. A 1997, 238, 219–274. [Google Scholar] [CrossRef]
- Gourdet, S.; Montheillet, F. An experimental study of the recrystallization mechanism during hot deformation of aluminium. Mater. Sci. Eng. A 2000, 283, 274–288. [Google Scholar] [CrossRef]
- Barnett, M.R.; Montheillet, F. The gerneration of new high-angle boundaries in aluminum during hot torsion. Acta Mater. 2002, 50, 2285–2296. [Google Scholar] [CrossRef]
- McQueeni, H.J. Development of dynamic recrystallization theory. Mater. Sci. Eng. A 2004, 387–389, 203–208. [Google Scholar] [CrossRef]
- Gourdet, S.; Montheillet, F. A model of continuous dynamic recrystallization. Acta Mater. 2003, 51, 2685–2699. [Google Scholar] [CrossRef]
- Gagliardi, F.; Citrea, T.; Ambrogio, G.; Filice, L. Influence of the process setup on the microstructure and mechanical properties evolution in porthole die extrusion. Mater. Des. 2014, 60, 274–281. [Google Scholar] [CrossRef]
- Fan, X.; Tang, D.; Fang, W.; Li, D.; Peng, Y. Microstructure development and texture evolution of aluminum multi-port extrusion tube during the porthole die extrusion. Mater. Charact. 2016, 118, 468–480. [Google Scholar] [CrossRef]
- Molinari, A.; Canova, G.R.; Ahzi, S. A self-consistent approach of the large deformation polycrystal viscoplasticity. Acta Met. 1987, 35, 2983–2994. [Google Scholar] [CrossRef]
- Lebensohn, R.A.; Tomé, C.N. A self-consistent anisotropic approach for the simulation of plastic deformation and texture development of polycrystals: Application to zirconium alloys. Acta Met. Mater. 1993, 41, 2611–2624. [Google Scholar] [CrossRef]
- Wang, H.; Wu, P.D.; Tomé, C.N.; Huang, Y. A finite strain elastic–viscoplastic self-consistent model for polycrystalline materials. J. Mech. Phys. Solids 2010, 58, 594–612. [Google Scholar] [CrossRef]
- Wang, H.; Wu, P.D.; Tomé, C.N.; Wang, J. A constitutive model of twinning and detwinning for hexagonal close packed polycrystals. Mater. Sci. Eng. A 2012, 555, 93–98. [Google Scholar] [CrossRef]
- Wang, H.; Wu, P.D.; Wang, J.; Tomé, C.N. A crystal plasticity model for hexagonal close packed (HCP) crystals including twinning and de-twinning mechanisms. Int. J. Plast. 2013, 49, 36–52. [Google Scholar] [CrossRef]
- Wang, H.; Capolungo, L.; Clausen, B.; Tomé, C.N. A crystal plasticity model based on transition state theory. Int. J. Plast. 2017, 93, 251–268. [Google Scholar] [CrossRef]
- Wang, H.; Wu, P.D.; Kurukuri, S.; Worswick, M.J.; Peng, Y.H.; Tang, D.; Li, D.Y. Strain rate sensitivities of deformation mechanisms in magnesium alloys. Int. J. Plast. 2018, 107, 207–222. [Google Scholar] [CrossRef]
- Mayama, T.; Noda, M.; Chiba, R.; Kuroda, M. Crystal plasticity analysis of texture development in magnesium alloy during extrusion. Int. J. Plast. 2011, 27, 1916–1935. [Google Scholar] [CrossRef]
- Gall, S.; Müller, S.; Reimers, W. Microstructure and mechanical properties of magnesium AZ31 sheets produced by extrusion. Int. J. Mater. Form. 2013, 6, 187–197. [Google Scholar] [CrossRef]
- Arruffat-Massion, R.; Tóth, L.S.; Mathieu, J.P. Modeling of deformation and texture development of copper in a 120° ECAE die. Scr. Mater. 2012, 54, 1667–1672. [Google Scholar] [CrossRef]
- Flitta, I.; Sheppard, T. Nature of friction in extrusion process and its effect on material flow. Mater. Sci. Technol. 2003, 19, 837–846. [Google Scholar] [CrossRef]
- Zhou, J.; Li, L.; Duszczyk, J. 3D FEM simulation of the whole cycle of aluminium extrusion throughout the transient state and the steady state using the updated Lagrangian approach. J. Mater. Process. Technol. 2003, 134, 383–397. [Google Scholar] [CrossRef]
- Knezevic, M.; McCabe, R.J.; Lebensohn, R.A.; Tomé, C.N.; Liu, C.; Lovato, M.L.; Mihaila, B. Integration of self-consistent polycrystal plasticity with dislocation density based hardening laws within an implicit finite element framework: Application to low-symmetry metals. J. Mech. Phys. Solids 2013, 61, 2034–2046. [Google Scholar] [CrossRef]
- Tang, D.; Zhang QLi, D.; Peng, Y. A physical simulation of longitudinal seam welding in microchannel tube extrusion. J. Mater. Process. Technol. 2014, 214, 2777–2783. [Google Scholar] [CrossRef]
- Tóth, L.S. Modelling of strain hardening and microstructural evolution in equal channel angular extrusion. Comput. Mater. Sci. 2005, 32, 568–576. [Google Scholar] [CrossRef]
- Eshelby, J.D. The determination of the elastic field of an ellipsoidal inclusion, and related problems. Proc. R. Soc. Lond. Ser. A Math. Phys. Sci. 1957, 241, 376–396. [Google Scholar] [CrossRef]


| AA1100 | Al | Si | Fe | Cu | Mn | Zn | Others |
|---|---|---|---|---|---|---|---|
| wt. % | 99.39 | 0.09 | 0.23 | 0.18 | 0.0005 | 0.0035 | 0.106 |
| Parameters | Values |
|---|---|
| Container inner diameter (mm) | 40 |
| Extrusion ratio | 150 |
| Ram speed (mm/s) | 5 |
| Billet temperature (°C) | 480 |
| Die temperature (°C) | 450 |
| Force on dummy block (kN) | 460 |
| Flow Line | Zone | |||||
|---|---|---|---|---|---|---|
| upper line | [0, 19.7] | 13.6 | 2.4 × 10⁻³ | 0 | 0 | 0 |
| [19.7, 27.3] | 804.1 | −141.9 | 9.5 | −2.8 × 10⁻¹ | 3.1 × 10⁻³ | |
| [27.3, 31.7] | 13,405 | 1799 | 90.3 | −2 | 1.7 × 10⁻² | |
| [31.7, 32.8] | 1264.8 | −77 | 1.2 | 0 | 0 | |
| middle line | [0, 8.1] | 9.3002 | 0.207 | −0.019 | 0.001 | −3 × 10⁻⁵ |
| [8.1, 18.4] | 10.2 | −5 × 10⁻³ | 0 | 0 | 0 | |
| [18.4, 30.0] | 3.9 | 0.5 | 5 × 10⁻³ | −7.4 × 10⁻⁴ | 0 | |
| [30.0, 32.4] | −5388.8 | 521.7 | −16.8 | 1.8 × 10⁻¹ | 0 | |
| lower line | [0, 6.4] | 2.2 | 0.76 | 8 × 10⁻² | −1.4 × 10⁻² | 0 |
| [6.4, 19.3] | 6.7 | −4.8 × 10⁻³ | 0 | 0 | 0 | |
| [19.3, 30.1] | 8.3 | −0.36 | 3.1 × 10⁻² | −8.82214 × 10⁻⁴ | 0 | |
| [30.1, 32.6] | −6006.2 | 581.5 | −18.7 | 0.2 | 0 |
| n | R | ||||
|---|---|---|---|---|---|
| 10 | 5.9 | 39 | 0 | 8.5 | 5 |
© 2018 by the authors. Licensee MDPI, Basel, Switzerland. This article is an open access article distributed under the terms and conditions of the Creative Commons Attribution (CC BY) license (http://creativecommons.org/licenses/by/4.0/).
Share and Cite
Tang, D.; Fang, W.; Fan, X.; Zou, T.; Li, Z.; Wang, H.; Li, D.; Peng, Y.; Wu, P. Evolution of the Material Microstructures and Mechanical Properties of AA1100 Aluminum Alloy within a Complex Porthole Die during Extrusion. Materials 2019, 12, 16. https://doi.org/10.3390/ma12010016
Tang D, Fang W, Fan X, Zou T, Li Z, Wang H, Li D, Peng Y, Wu P. Evolution of the Material Microstructures and Mechanical Properties of AA1100 Aluminum Alloy within a Complex Porthole Die during Extrusion. Materials. 2019; 12(1):16. https://doi.org/10.3390/ma12010016
Chicago/Turabian StyleTang, Ding, Wenli Fang, Xiaohui Fan, Tianxia Zou, Zihan Li, Huamiao Wang, Dayong Li, Yinghong Peng, and Peidong Wu. 2019. "Evolution of the Material Microstructures and Mechanical Properties of AA1100 Aluminum Alloy within a Complex Porthole Die during Extrusion" Materials 12, no. 1: 16. https://doi.org/10.3390/ma12010016
APA StyleTang, D., Fang, W., Fan, X., Zou, T., Li, Z., Wang, H., Li, D., Peng, Y., & Wu, P. (2019). Evolution of the Material Microstructures and Mechanical Properties of AA1100 Aluminum Alloy within a Complex Porthole Die during Extrusion. Materials, 12(1), 16. https://doi.org/10.3390/ma12010016