1. Introduction
In a global competitive market, service-oriented manufacturing systems follow a path where gaining and retaining the customer becomes fundamental for sustainability. From product service systems (PSS) [
1] to classical flexible manufacturing systems [
2], passing through service-oriented flexible manufacturing systems to a different extent [
3], all of these taxonomies refer to system configurations where classical or new manufacturing competitive factors trade off system performance for service through operational decision-making. Maintenance, repair and overhaul (MRO) highly qualified manufacturing activities are offered with strong competition in the current global economy. MRO systems include the industrial activities of assembly and disassembly, components repair, inspection, as well as replacement or fault correction of an aircraft or its components, in order to preserve the airworthiness conditions and to guarantee aircraft safety operations [
4]. MRO companies follow the technical requirements that aeronautical authorities establish [
5]. The MRO sector includes the original manufacturer of the equipment (OEM), airlines or aircraft operators, and MRO independent companies [
6]. In this market, OEMs are the biggest players through their after-sale services, with 56% share achieved by 2014 and still growing [
7].
Fleet maintenance cost of aircraft operators reached USD 61,100 MM in 2014 [
8], and it represented from 10% to 15% of the total operational cost of the aircraft operations [
9]. A trend of 3.8% annual growth is expected, reaching about USD 90,000 MM by 2024 [
8]. Engine MRO represents about 40% of the total. The MRO activities expansion evolves with heavy competence [
10], so MRO companies must focus on excelling their operational effectiveness by reducing costs, stocks and job shop times [
9], while holding high quality and reliability, at the level of the aeronautical regulations and standards. In a competitive market, operational flexibility and resources utilization is important in accordance with the business goals in MRO [
11]. At the MRO facility level, these requirements are highly qualified experienced personnel together with a proper integration of scheduling and provisioning in the supply chain, both upstream (suppliers) and downstream (customer) [
5,
12]. In this path, different operational techniques and strategies formerly used only in conventional manufacturing organizations are becoming important in MRO production activities. For instance, conventional repair shop layouts have been transformed into cellular systems in order to improve MRO performance [
13].
In this context, both the operations practice and its research can benefit from discrete-event simulation of manufacturing system models. The real complexity of the system can hardly be represented through analytical models and it is only partially tackled by the simulation model [
14], but it provides an off-the-line test bench to foresee potential trends of performance and to help in decision making or to validate analytical models [
15]. Manufacturing system simulation bears the additional advantage of low cost experimentation close to the configuration of real systems [
16], and it can help to improve decision making on new manufacturing systems design. Discrete-event simulation techniques have a broad scope [
17]. Four different fields of work can be considered: simulation model development, model use, field application, or discrete-event simulation with other simulation techniques. In the manufacturing research area [
18], initially three main different areas of work are the design of the manufacturing system, manufacturing operations study, and software development. In addition, the following can be included [
19], the programming of maintenance activities, job shop task scheduling, and the research on simulation of meta-models and optimization.
The increasing importance of manufacturing service activities requires a proper combination of production internal operations with customer service goals. Operations quality improvement in a broad sense enables the increase of sales and the reduction of production costs [
20]. Beyond the conformism of an adequate performance, current paradigms of improvement look for waste elimination (lean manufacturing). The Taguchi approach to quality combines the classic meaning of conformity with the aim of optimizing system performance [
21] by considering that the gap with the optimum is a waste. Moving from the conceptual approach to the real operations in a MRO facility, customer satisfaction can be influenced by repair quality in a highly regulated activity, but also by the lead-time of maintenance and due date compliance. The concurrent analysis of programming, scheduling, system capacity management, and their metrics follow-up is a complex task [
22]. Operations management becomes an integrated effort of customer care and of internal process and resources management [
23,
24]. In consequence, dispatching rules are important decision-making criteria in the daily operation management, with impact on the overall system results and its logistic operating curves [
25].
Dispatching rules define job shop scheduling by priority rules based on performance metrics. There are many different designed and studied dispatching rules. A first classification [
25] includes four groups: rules based on the processing time, rules based on the due date, combined rules from the former groups and a group including all the rest. Other classifications have been proposed [
26], based on the input data to the rules and the priority rule itself, sorting more than 300 existing rules into nine groups. It can be inferred that choosing the proper rule is neither immediate nor easy. It would depend on the operational context, the own production system, and the more valuable performance metric. A multi criteria approach of processing time, work order tardiness, and utilization of resources [
27,
28,
29,
30] seems to be suitable for production systems focused on service.
Sequencing can be considered a decentralized process in the decision problem. Specific research in scheduling service-oriented job shops [
31] not only considers the mean time to completion of work orders, but also the overdue orders tardiness accumulation. This last study is based on discrete-event simulation on a schematic facility. Even without detailed description of the processes, it shows that when using finite resources at different degrees of utilization, the ordinary need of tracing the serial number of specific parts adds extra complexity to the repair process. This increases the effort of coordination in final assembly, adding extra time and inventories involved in operations. The priority rule “shortest processing time first” was identified as the best option towards reducing mean flow time. Focused on the service metric of overdue work orders, scheduling by “earliest due date first” was more effective. Also, rules based on the complexity of the bill of materials (BOM) to speed assembly, reparation, and disassembly activities seem to be only effective for simple product structures, with difficulties arising of the serial part number matching. A significant simulation based on field data inputs from a capital goods industry [
32] can be considered that partially approaches the scheduling constraints of MRO, in particular for spare parts production. It concludes with a better behavior of the “most remaining operation first” rule for spare parts at product level, but the “shortest operation first” rule is better at component level. In the particular field of aircraft engine MRO, this last result suggests that the system could require for schedule optimization different priority rules in the cases of complete engines overhaul maintenance or only modules maintenance.
MRO is a multi-project scheduling problem due to the diversity of tasks that cannot be fully determined a priori at the work order entrance. Studies that revisited the overall problem of multi-project scheduling [
33] show the convenience of different priority rules for different local or global objectives.
A more specific recent study of aircraft engine maintenance [
34] includes the relevance of the unsteady flow of work orders content in MRO and the main barrier in reaching due dates with origin in parts procurement and part repair. This study is limited to only one process flow for priority rules analysis, based on simulation and design of experiments. The main result suggests the application of the “slack” rule (higher priority in work orders with the lowest difference between the remaining time to completion date and the remaining processing time), in a decentralized application. Real field tests of the rule gave positive results, maintaining system performance while facing a significant load increase.
A recent research contribution seeks an integrated approach combining the study of dispatching rules with parts pooling sourcing for service [
35]. In addition, recent research prospects look for an overall optimization of service-oriented production and business management [
36]. This study uses a simple example of theoretical sequencing to illustrate the integration of cost penalties of tardiness in the operation decisions. Work planning is shown in two levels: project and scheduling. Better results are reached in project performance giving priority to jobs with small resource workload. The “minimum worst case slack” rule gives the better results at scheduling level. Former research trends in the integration of planning and logistic factors converge with the recent outlooks of a main aircraft manufacturer [
37]. It outlines the increasing importance of inventory pooling and the increasing use of maintenance planning tools by the aircraft owner, together with a need of MROs improvement in speed turnaround time, reducing the time in the job shop.
Improving and extending former studies, this paper presents a combined optimization of alternative process flows with a selection of significant priority rules. Different from the former studies on priority rules that are based on fictitious generic processes or a single process as a bench case, this paper approaches the design of the MRO system to real options configuration, facing the problem of mix work orders (overhaul and modules maintenance) in aircraft engine MRO. In addition, the study includes the analysis of overall costing results of service penalties, a real situation only conceptually treated in former studies.
This paper is organized as follows: in
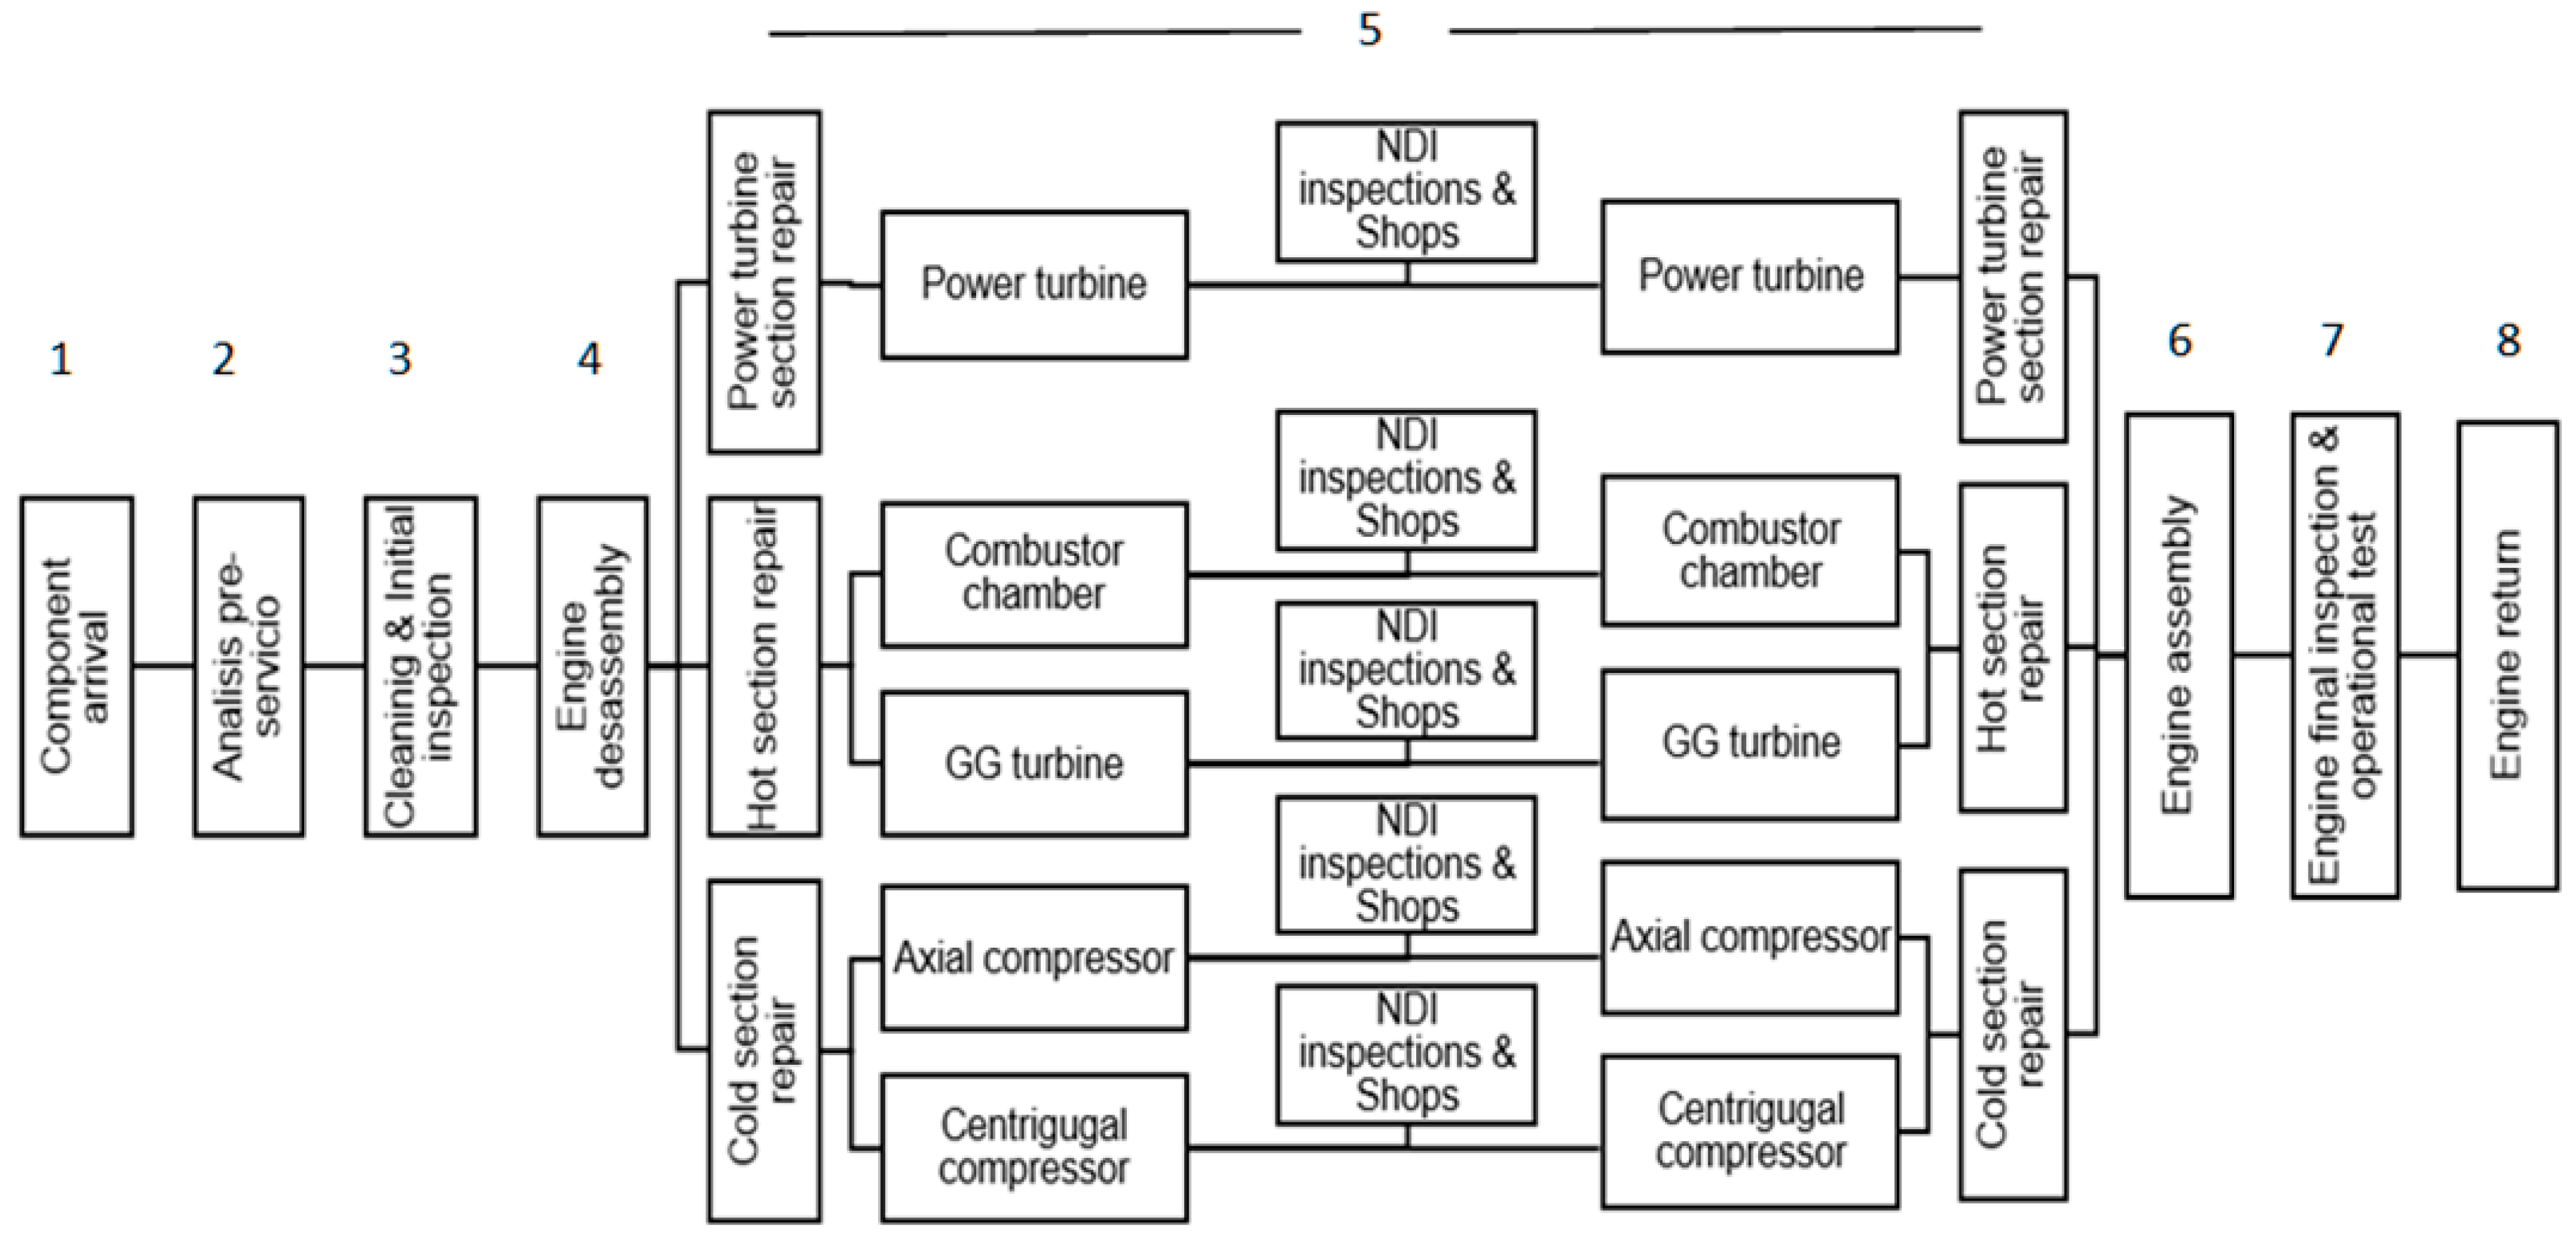
Section 2, the process flow of the MRO is analyzed.
Section 3 presents the MRO system models development for discrete-event simulation. Next,
Section 4 includes the selection of a set of dispatching rules by testing them through simulation, and a scoring process. System behavior and its implications in operational curves are analyzed.
Section 5 covers the analysis looking for the best combination of process flow and dispatching rules in relationship with system metrics, with the Taguchi techniques, and cost analysis including charges for overdue work orders, and presents a synthesis of discussion and analysis of the former results with concluding remarks.
3. Results
3.1. Integrated Analysis of Process Flow and Dispatching Rule
Operations management in an MRO facility holds two main global objectives: customer service and internal performance. Customer service is defined as the proper quality level, including the technical proficiency that complies with regulations and achieves the agreed short lead times at a competitive cost. The internal objective requires operations with a proper resource assignation, so that the full capacity of the facility should be used effectively under variable demand. The implications of the operations under uncertainty involves trade-offs of service ratios and manufacturing flexibility [
45], including the external position (market share) and internal performance (maximum capacity compatible with the intended service ratios and proper resources utilization at partial load).
Dispatching rules are tools for operations management and decision-making. In the customer service field, this includes reaching the due dates to avoid extra costs for delay, but taking into account the complex relationship of multiple work orders in processes of different customers, with different task times, number of operations or engine delivery due date.
In the MRO operational context, choosing the more convenient priority rule is not at all evident. In a first screening process, eight noteworthy dispatching rules from the literature are studied,
Table 3. They are selected based on the objective, but also on the practical applicability. The simulation model of the MRO facility is run under these different rules and for different demand profiles.
The first five rules have the main objective of reducing the delay time and the number of delayed deliveries, which is to say, coping with customer service. They include operation parameters like due date, processing times, as well as the total process time or remaining operations at each step. The rules largest processing time (LPT) and shortest processing time (SPT) take global consideration of the work order content. The rule LPT prioritizes work orders of engines under overhaul, instead of engine modules, taking care of the higher costs to the customer due to the engine out-of-service cost (including leasing or insurance charges). Meanwhile SPT gives precedence to work orders of engine modules before the overhaul of engines. Engine modules require less repair time and the delivery times are shorter. Finally, the FIFO (first in, first out) rule is an initial reference baseline for comparison purposes.
Considering the setup of the simulation model of
Section 3, the results are included in
Table 4. The average values allow a comparison of synchronous (S) versus asynchronous (A) models. It can evaluate the general limitations of the facility model in a pair wise comparison across priority rules. The model A behaves slightly better in the metrics associated with work orders and time. Model A performs better than model S for work orders accomplishment, about 8% in wait time, reduces 11% due work orders and 3.6% in work in process (WIP). In relationship with time metrics, Model A improves 4.8% value added and a 4.5% in total lead-time, while utilization is similar for both A and S flow processes.
This result brings a first consideration that in a broad approach across priority rules and with the portfolio of engine modules and overhauled engines, the asynchronous model A performs better than S. It improves service ratios in work orders completion and time metrics. The A flow process is more appropriate in terms of service, speeding up work orders better across the system, and in an exchange with the reduction of inventories (work in process), with similar dedicated resources. That is, the service is improved by reducing intermediate stocks with the same resources over the period. The overall capacity remains practically the same (see the number of complete work orders and utilization).
The relative performance of every priority rule is different for every different metric. The selection of the most appropriate priority rule is a multi-criteria decision-making problem. In order to compare the relative performance between them, the simple well-known FIFO rule can be a reference level, frequently used in queues studies and stock management. Note that the rules LPT and SPT do not reach a simulation solution under the limiting condition of a maximum number of work orders in process, so they are left aside initially from any further investigation. Counting the number of performance criteria that are over those obtained by the FIFO rule allows a simple initial ranking of priority rules that outperforms FIFO. The score weights equally the work orders (WO) throughput, average cycle time, and the performance across customer WO. As a result, the rules CR+SPT, EDD, and SPT (this one only for the synchronous flow S) obtain total positive scores, outstanding over the FIFO reference. In addition, the CR rule performs better for overhauled engines than FIFO. Therefore, the rules CR+SPT, EDD, and CR (for full engine overhaul) are selected for further study by a design of experiments.
3.2. Logistic Operating Curves
Even when in the case of MRO its service metrics play the main role in decision making, conventional internal manufacturing trade-offs can be surveyed by the logistic operational curves [
25]. They are put into relationship output with the product level inventory (work orders in process). Note that the spare parts inventory and its availability is another face of the whole MRO operational scenario, not tackled directly in this study. For given resources, a priori operation with high output and low level of inventory contributes to internal efficiency and service.
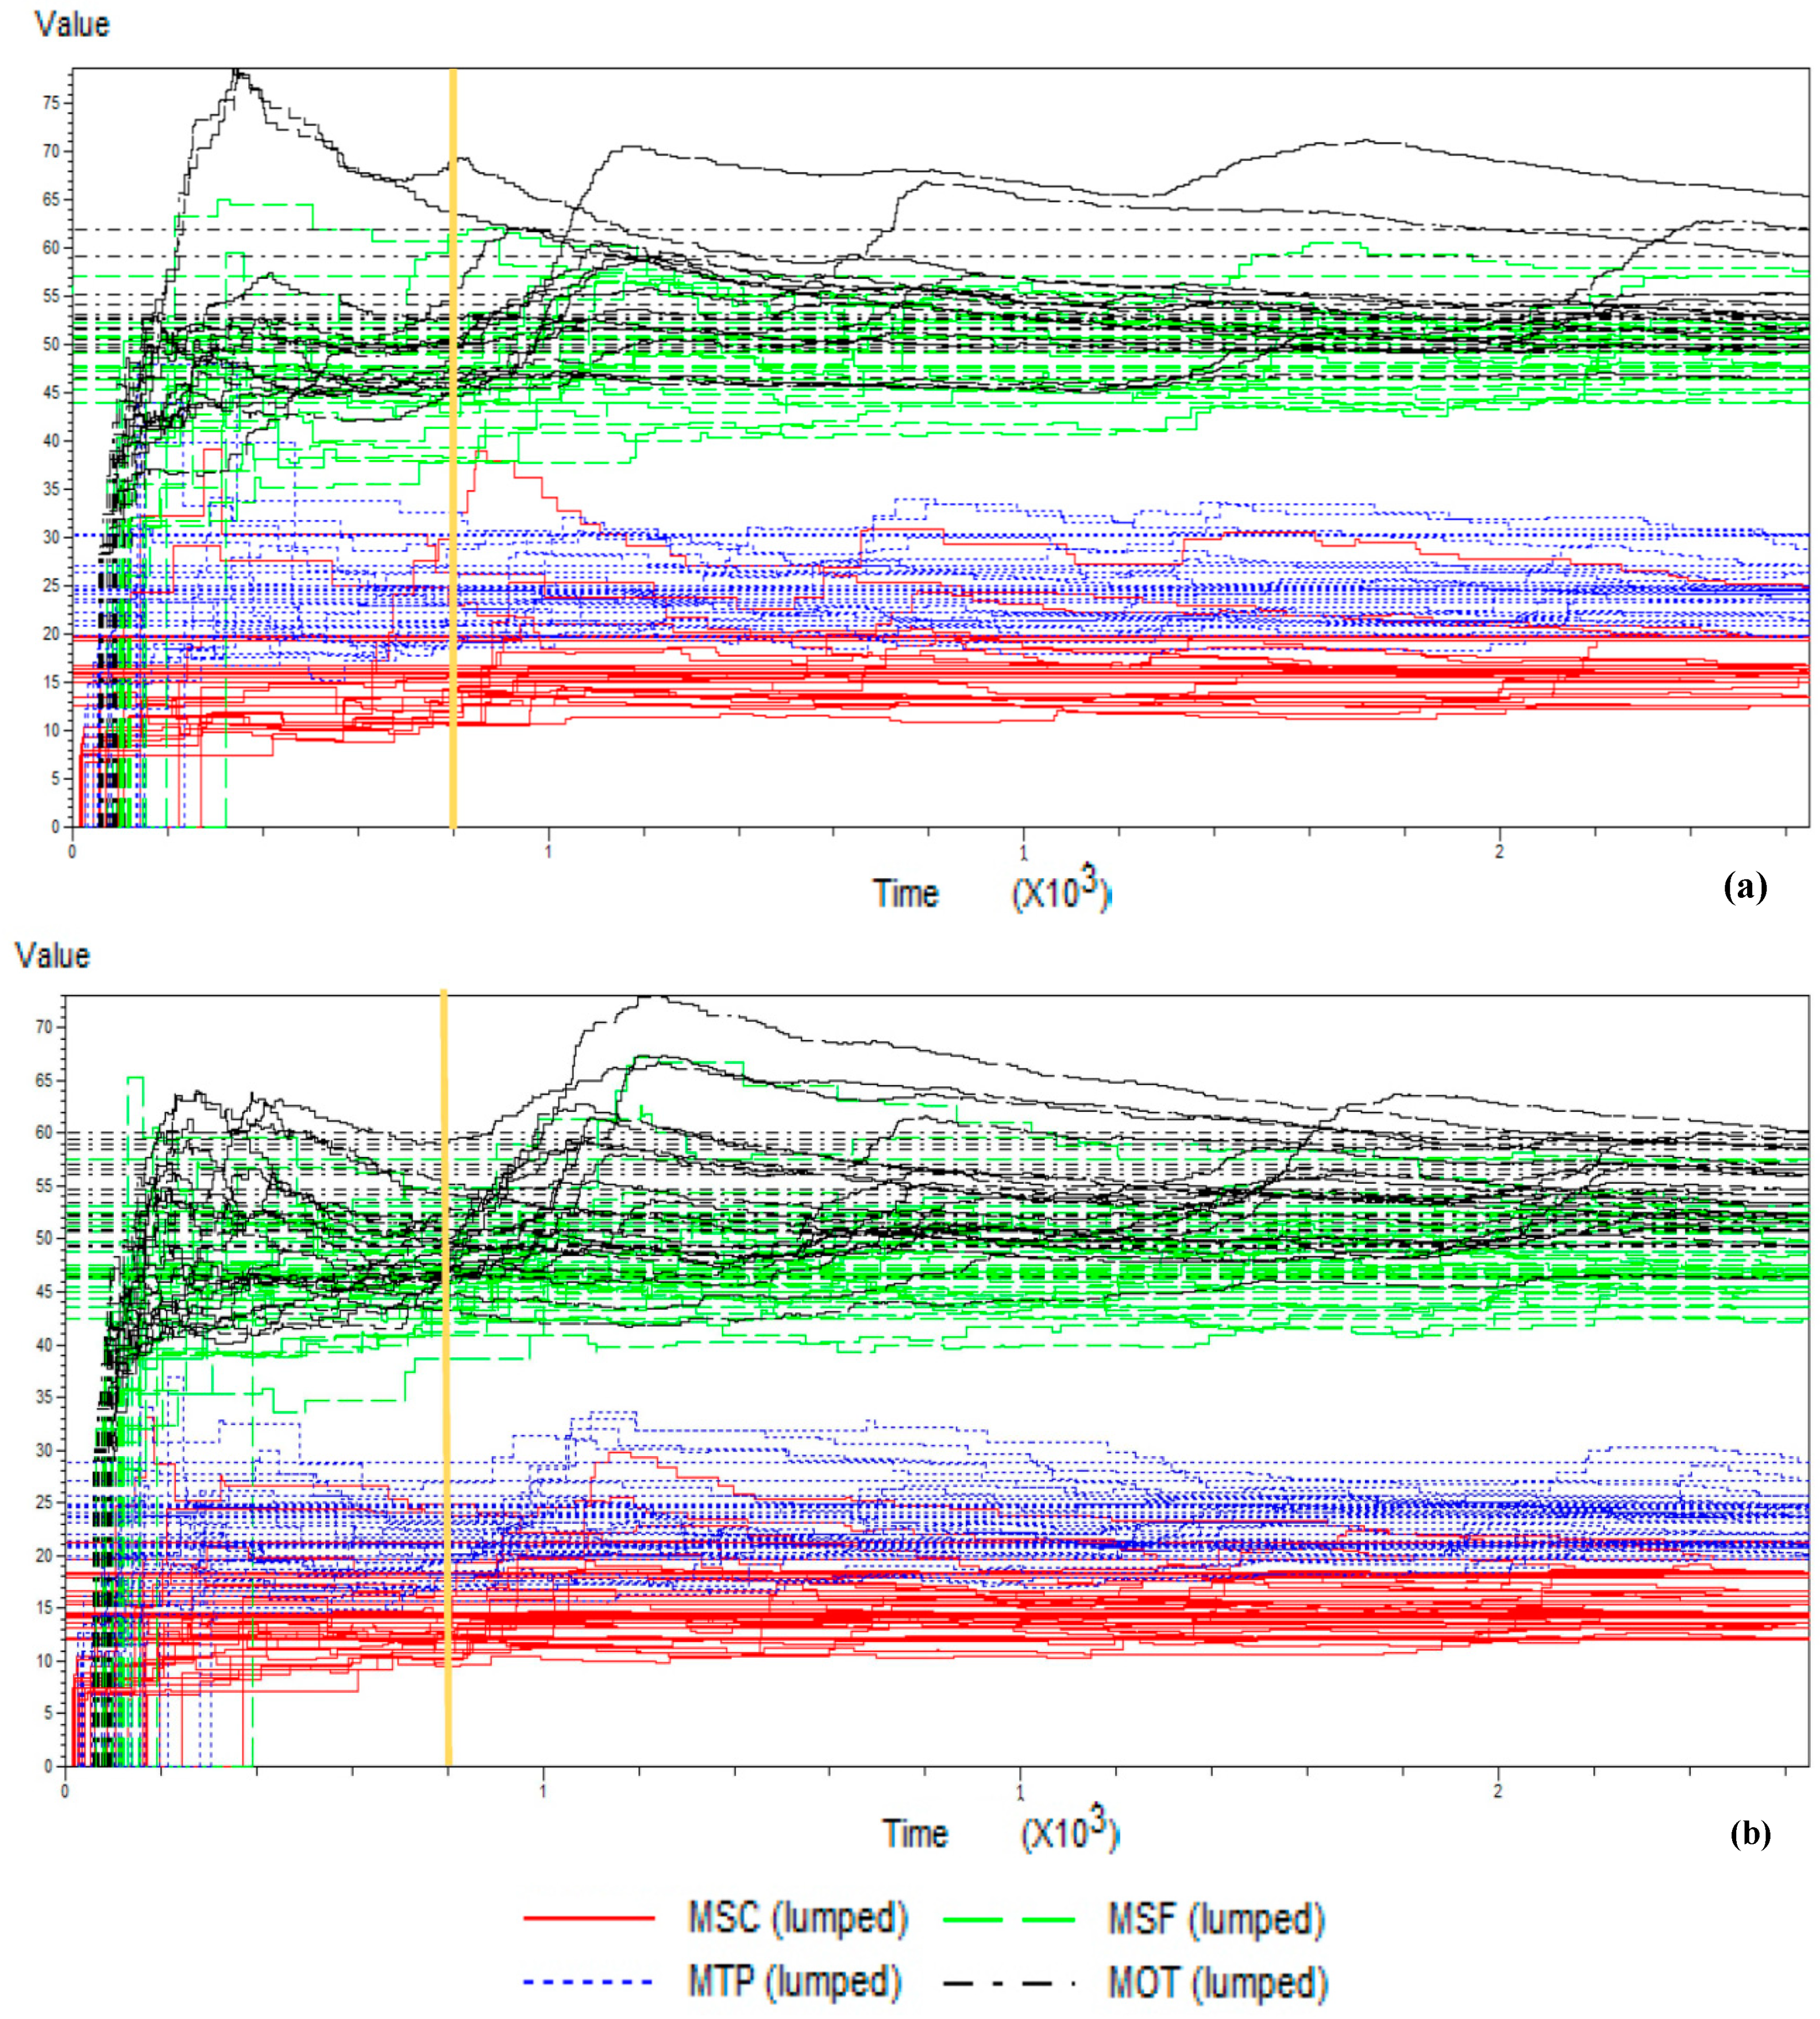
We can consider the slope value of the operating curves as a sign of performance per unit of inventory (WIP) for the completed work orders (QC). Conversely, the quantity of late work orders (QR) and the lead-time in the system (TTS) are sought to be reduced, so the lower the slope of the curve, the better performance with respect to inventories. These operating curves,
Figure 3, show the system performance for a demand mix with 70% engines for overhaul.
The results show that the synchronous flow S performs slightly better under the rule CR+SPT for the maximum total output (QC). In terms of lead time (TTS) and late work orders (QR), the rule CR+SPT works also better over 10 units of WIP, and all three rules have a similar behavior under that level.
Under the asynchronous flow A, the system reaches the higher output (QC) managed by the CR rule, but at the cost of worse (TTS) and (QR) metrics, while the best is EDD.
Comparing the results between models, the output the asynchronous model A reaches higher output ruled by CR, followed by CR+SPT. In general, the operating curves show higher slopes under 10 units of inventory than over the 10 units. That level of work-in-process can be considered an operative reference level convenient for the size of the system under study. Under that level, the growth of inventory serves to increase output, but after that level only marginal increases of output are obtained, and always at the cost of increasing lead-time in the system (TTS) and late work orders (QR).
4. Analysis and Discussion
4.1. Operations Variability and Evaluation through the Taguchi Approach
Even when the simulation model includes variability in the internal conditions of operations of processing times, the variability of controlled and not controlled factors can be studied in a more systematic manner through the design of experiments (DOE) and the Taguchi approach. The goal of this analysis is to find the more robust internal control factors opposed to the external uncontrolled factors that cause variability. Operational metrics are the numbers of late work orders, average total time of work orders in the system, inventories (work-in-process), and the relative cost evaluated through the utilization of resources. In particular, for the experiments, the work order mix (percentage of overhauled engines versus engines modules) and the priority rule are controllable factors,
Table 5. Meanwhile, the demand level, the learning or progress curve and the percentage of rework in the shops are variability factors included as noise factors bounded in each simulation.
The response variables correspond to the operational metrics that are sought to be robust,
Table 6. This represents the optimization of its value (maximum or minimum objective) versus its variability (noise); that is, the Taguchi approach of maximizing the signal-to-noise ratio. This DOE considers the analysis of four different response variables: Total time in the system (TT), late or delayed works (DW), relative cost from the utilization of resources (BRC), and in process inventories (work-in-process, WIP).
The criteria of the smaller-the-better minimizes the mean and the standard deviation of the response when maximizing the signal-to-noise ratio [
46]. The case of larger-the-better criteria, maximizes the mean and minimizes the standard deviation. Finally, the criteria nominal-the-best minimizes the standard deviation or variation. The experimental setup and array are also detailed in
Table 6. It includes internal and external orthogonal arrays for the controlled and noise factors, and the number of levels that allow discrimination of the influences.
The results of the experiments through simulation are summarized in
Table 7. The column signal-to-noise ratio shows the results of the best level of the controllable factors (LEV) together with the contribution to the variability (VAR) of the mix and the priority rule. The contribution result is included only when the variability contribution of the priority rule is significant. In the column signal-to-noise the optimum levels show the results through the criteria of smaller-is-better or larger-is-better, as per
Table 6. As labelled, in the column signal-to-noise ratio nominal the best, the optimization criterion minimizes only the response variability. Finally, the column mean response gives the results for the sensitivity of the response parameters.
The synchronous (S) process flow model exhibits a better general behavior for the mix of 60, because is the best level for TT, DW, and WIP. Note that the criteria of larger-the-better for the relative utilization in the synchronous model require a facility working with 80% work orders for overhaul engines; an exigent situation from the point of view of customer’s service management. Simultaneously the criteria nominal-the-better presents the best response (minimum variability) for the 60% mix in combination with the CR+SPT priority rule for three of the criteria, but DW is always better for EDD. In overall terms, the synchronous flow process (S) presents the best response for a middle mix (60% overhaul engines and 40% engine modules) in service metrics (TT, DW), and also WIP. In addition, this mix is favorable for internal facility management because it corresponds to the better level for internal inventories (WIP) and minimizes the variation of relative cost of utilization BCR of internal resources (nominal-the-best) that is a convenient departing point for ulterior internal improvement actions. Focused exclusively on customer service response and in particular on the potential customer extra costs for late work orders, the rule EDD seems to be more convenient in the synchronous flow process together with the mix level 60. The rule has a remarkable influence (up to 40%) in the variability of the mean response of due or delayed work-orders (DW).
The asynchronous flow process A behaves in a similar qualitative overall way, presenting better customer-focused response in service by working at level of 60. The mix level 60 is better for the response metrics TT, DW, and WIP. In addition, onlyt focusing on the costs of facility operations, the higher the level of overhaul engines resulting, the better the performance. Although, the dominating rule for DW optimization is in this case CR+SPT instead of EDD.
The results of the DOE are compatible and complementary with those obtained in the logistic operating curves. In these curves, the mix under consideration was at the intermediate level of the experiments, 70% engines for overhaul, in between 60% and 80%. The operational curves show the mean results of simulations, but with a fixed setup. Conversely, the experiments evaluate mainly the variability behavior with alternative setups, more interesting for the design of the system than for its operations. Both approaches complement each other for system design and operation.
The results of the DOE show little influence of the priority rule when the percentage of full engines for overhaul increases in the mix. In accordance with the analysis of variance, the optimum results at the level of mix 80% (utilization ratio, BCR) are practically determined by the mix itself and with very little influence from the priority rule.
Both models’ results, S and A, show reasonable trade-off trends: the optimization of cost in the system can be associated with a higher utilization of available resources through full service (overhaul engines versus modules repair, in an MRO facility). Nevertheless, service to the customer is associated with the service ratios DW and TT. Therefore, flexibility for a better response requires the non-full utilization of internal resources, coping with a mix that contains not only engines, but also modules. That is, for a good customer response, flexibility maintains a trade-off with the internal resources utilization. The energetic behavior of internal efficiency—the greater the amount of full service work orders, the better the utilization that results—seems to be out of the path of service metrics (DW and TT) and even of the general principles of current facilities management for inventories minimization (WIP).
These results are consistent with previous studies, and they expand former research. Focused only on service, the dominance of the rule EDD (earliest due date) first for the synchronous model S is also in the findings of Guide et al., 2000, even when their research is based on a generic non-detailed process. In the same sense, a recent contribution based on just one process flow [
34] gives the better result in terms of service using the slack rule. This is the case for the asynchronous model A in the present study. Note that the combined rule CR+SPT is a hybrid rule of two factors that included the slack rule rated by the remaining processing time (see
Table 3). Since both former studies used different process designs, the difference between them has not been previously discussed nor their differences interpreted, so the importance of the coupling of process flow with a priority rule remained hidden, conversely to the findings of the present study.
4.2. Cost Sensitivity Analysis
The general results show a better behavior of the system in terms of service when a significant participation of modules in the work orders exists. Conversely, the optimization in terms of cost for proper resources utilization, BCR, asks for more work orders of engine overhaul. In general, scheduling a service-oriented manufacturing system must pursue customer satisfaction [
47]. Due to the high value of the availability of aircraft engines, the costs of the operation of an MRO cannot disregard the contractual charges due to delays or overdue work orders. Airlines exploit aircraft engines through flight operations, so each day the aircraft is on the ground due to maintenance impacts with revenues losses [
48]. The MRO activity shares these impacts, so charges are agreed for overdue work orders. The MRO manufacturing service facility must consider them in the operative analysis for risk management and decision-making.
A cost of 20% contribution of direct overheads in the total cost breakdown is considered. Its quantification is taken directly from the simulation results. Other direct costs are the materials and subcontracted repairs that can be up to 70% and 10% of the direct cost, respectively [
6]. Indirect costs associated with the MRO facility include power, consumables, general service maintenance or real state expenses. Those costs can be up to 40% of the total cost of MRO operations [
2].
The charges of delayed work orders should be a function of the value of the hardware and the amount of the delay. Rates of 20,000 EUR per day for full engines and 15,000 EUR per day of delivery delay in the case of modules are considered [
49]. In fact, those penalty charges are only a small portion of the real operational cost impact to the customer. The repercussion on customer loyalty and business reputation might go beyond those figures for the MRO facility.
The cost study is setup with a range of demand from 4 to 10 work orders per month. Profiting from the best results from the DOE, the model S is run under the rule EDD with a 60% of overhaul. In the case of model A, the dispatching rule is CR+SPT, and with a 60% of engine overhaul.
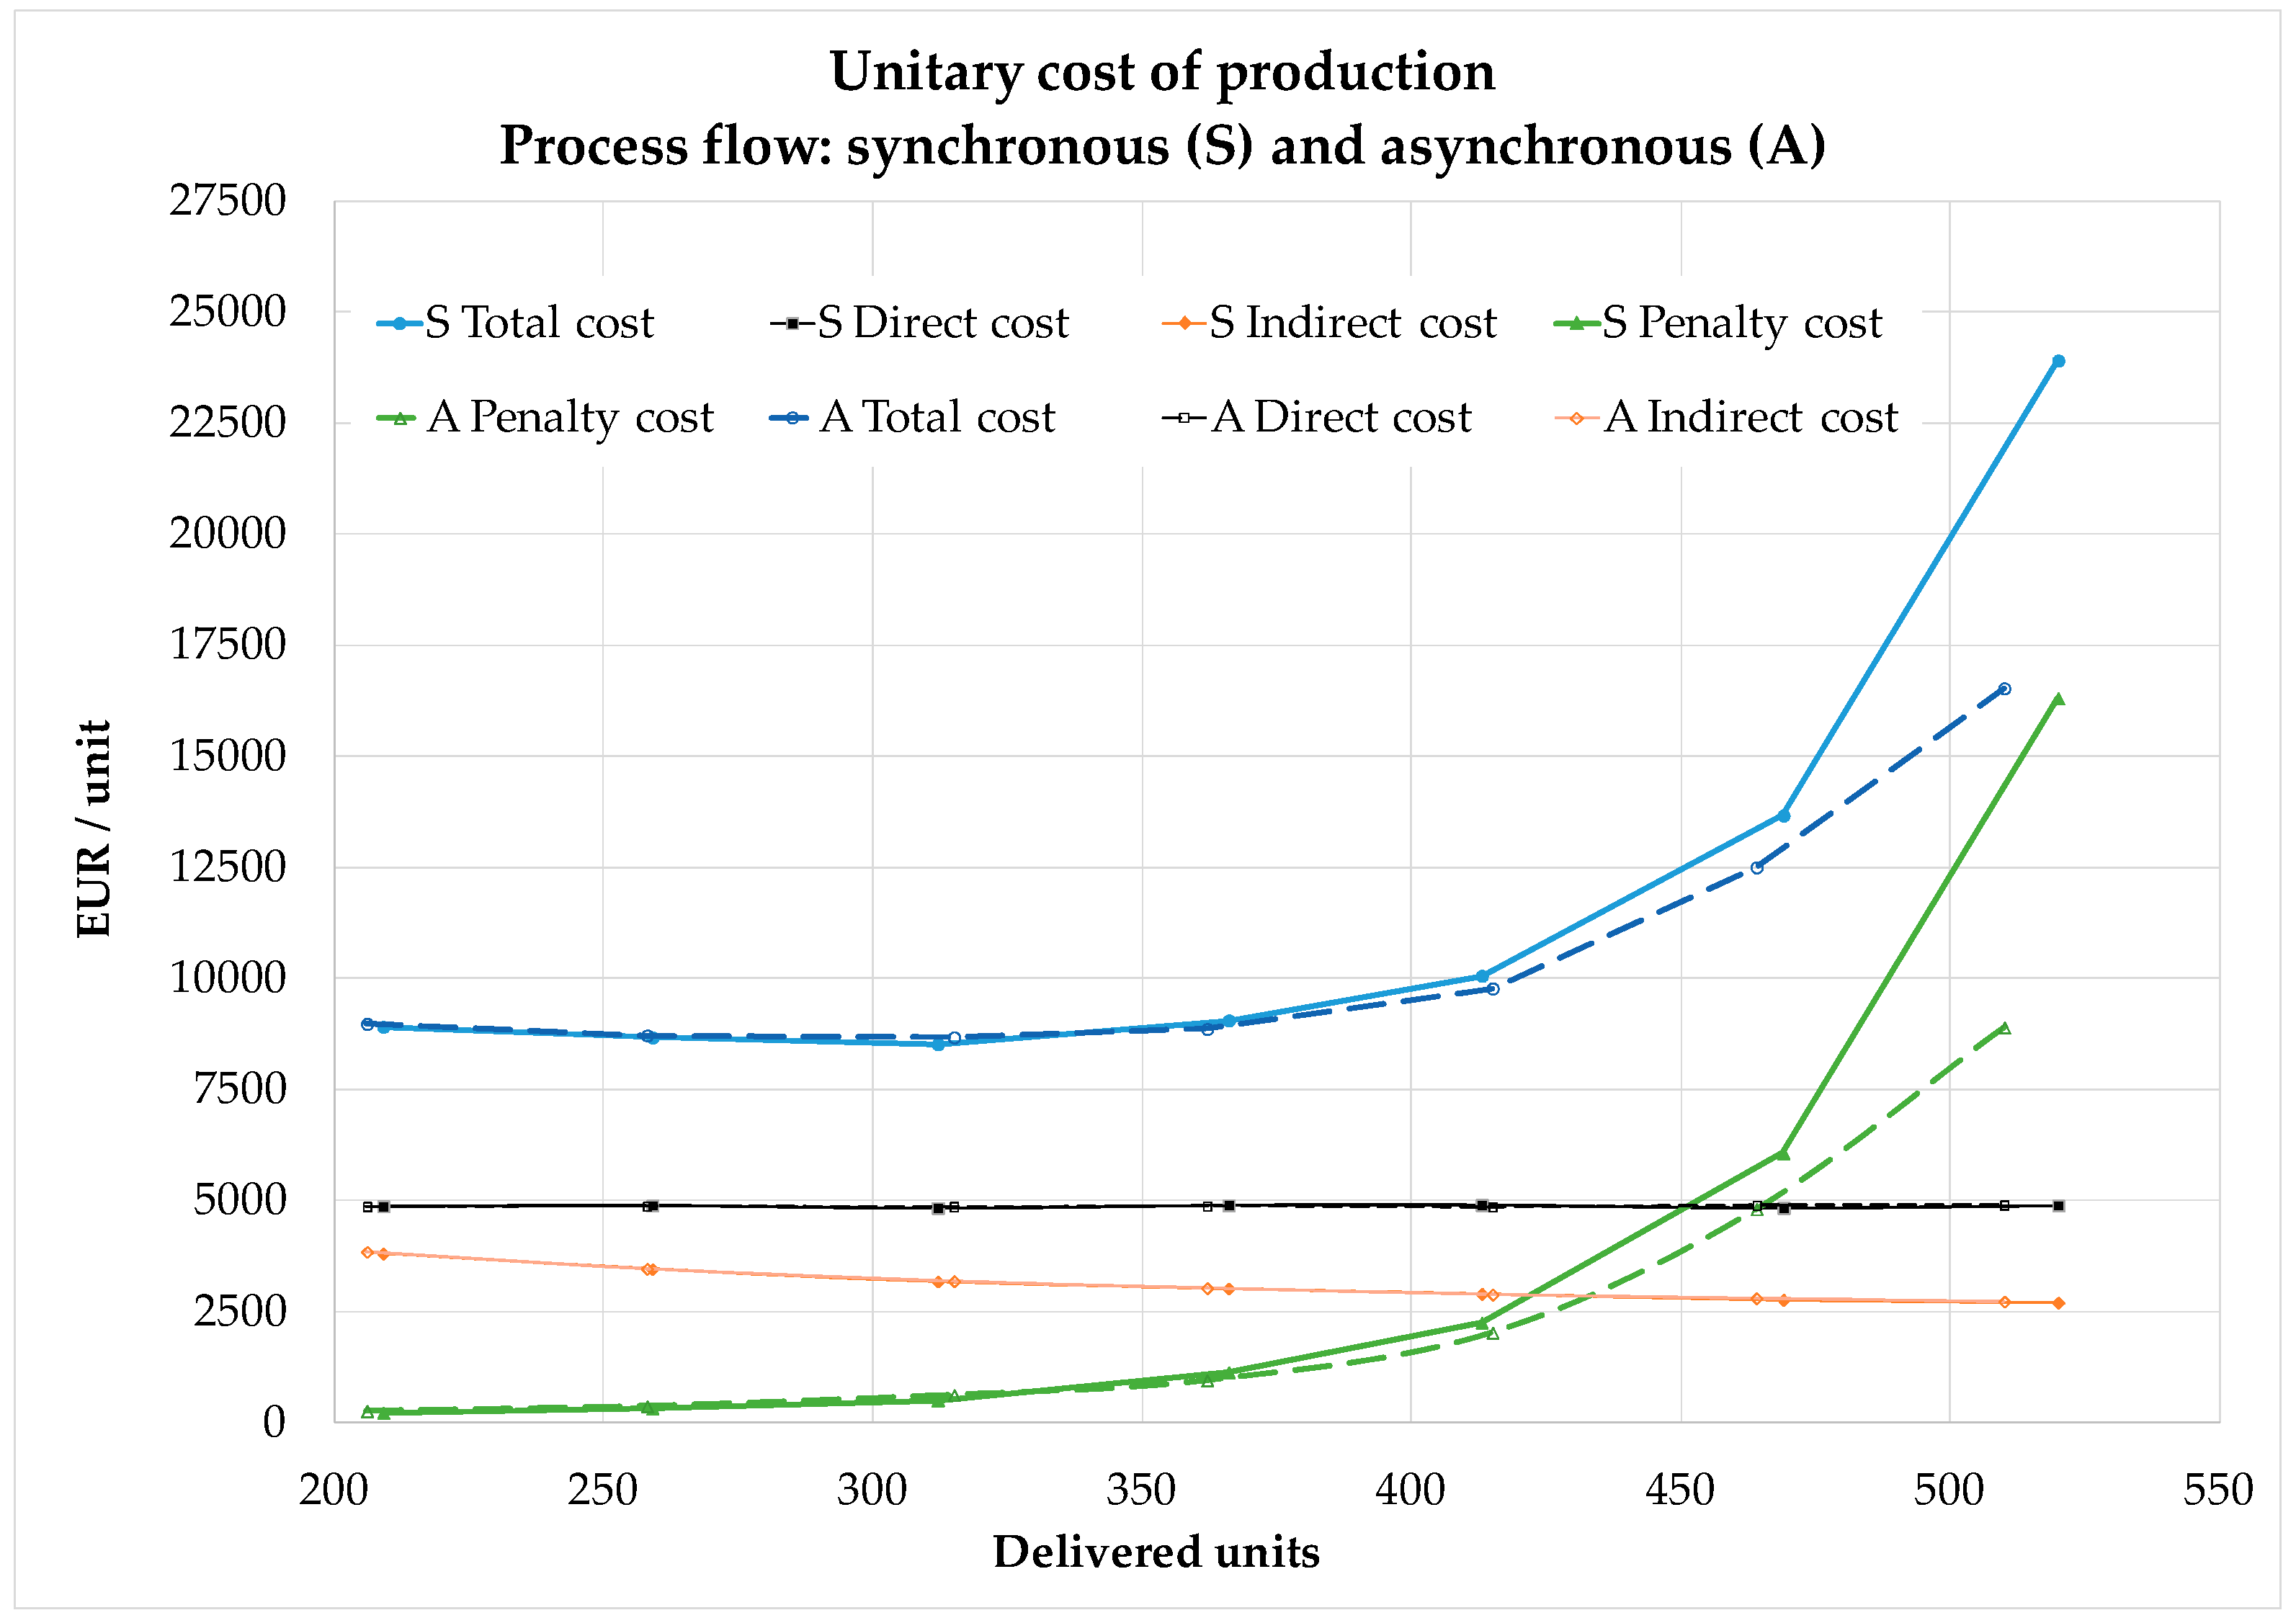
The results of the simulations are represented in
Figure 4. In the
x-axis the total work orders or units processed are presented. The
y-axis shows the different components of unitary cost. The total cost is composed of direct and indirect components plus the variable cost with origin in the overdue work orders charges. This extra cost impacts at high load level and establishes an optimal minimum cost in the range between 300 to 350 work orders in a simulation horizon of 5 years, or an equivalent average annual demand from 60 to 70 work orders for the system under analysis. In the comparison the behavior of both process flow models, the asynchronous flow A responds slightly better to high load, in terms of the expected extra charges for delays. The better behavior of the process flow A together with the compound slack rule (CR+SPT) is consistent with the better results found in recent research [
36] where the penalty in MRO operations is explored based on a simple generic process.
The situation of overload might not be an ordinary state and it can be considered to establish facility design boundaries or expansion flexibility [
45]. Focusing on the ordinary range of operations, the total unitary cost is similar for both process flows. The convenient range of lower cost per delivered unit is from 60 to 70 annual work orders. In this range, the extra costs per overdue work orders could be around 8% to 12% of the total cost, but operating at around 80 work orders per year can bear about 25% of extra cost. In addition, note that working at middle load with 40 work orders per year, with charges only representing 3% of total cost, is a range where the underutilization of resources dominates the unitary cost, due to the low load of the system.
5. Conclusions
System simulation and the design of experiments allow the quantitative evaluation of the significant effects in operations and the convenient dispatching rules for each process flow. System operating curves can be estimated, so the throughput and inventory trade-offs can be assessed. The influence of work in process inventories in service ratio and in system flexibility are important reasons for paying attention to the adequate level of inventories in the overall performance in service-oriented systems. In addition, simulation allows the evaluation of the convenient range of work load into the system.
The work order mix of the demand (engines and modules) is demonstrated to be an important influence factor to obtain good operational results. The optimization of the resource utilization leads to full capacity use through work orders of engine overhaul, but this situation does not represent the better scenario for service metrics. Being conscious that demand mix cannot be fully controlled, customer service managers might conduct customer portfolio for the more convenient mix combination of engine overhaul and modules through demand management. For the detailed model of the MRO facility under study, the dispatching rules analysis results show a better performance for Earliest Due Date (EDD) rule and Critical Ratio and Shortest Processing Time (CR+SPT) rule in a system with a mix of engine overhaul (60% in the system under study). When each flow is managed with the proper dispatching rule, there is no conclusive advantage in performance based on synchronous and asynchronous flow. Synchronous flows appears to be better run through the EDD rule, while the asynchronous flow better by the the CR+SPT rule. Considering the current maintenance trend to improve life cycle management and pooling of components, the asynchronous flow with the (CR+SPT) rule can be an advantage, approaching better the pooling operation of components.
In service oriented manufacturing systems, supplier’s metrics include quality levels and service ratios, and overdue work orders can generate charges to the supplier. Including the charges of overdue work orders can become significant for MRO centers operational assessment. The quantitative results show that with an increase of overdue work orders extra costs would balance the benefits of increasing load by the reduction of internal cost of the better resource utilization. Other additional effects of overdue orders are also possible, such as the position in the market or customer loyalty. The methodology has allowed the assessment of the convenient range of load that minimizes the unitary cost. In the system under study, when surpassing that range the extra costs of charges increase rapidly. Below that range, operations can benefit from operational flexibility with a stable unitary cost over a wide interval of load. Considering the two process flow type alternatives, slightly better behavior has been shown with high load by the asynchronous flow process in the operating curves and the unitary cost. When considering mainly the service performance and its variability, the synchronous model has shown general more robust behavior in the simulation experiments. Beyond the absolute quantitative differences, it is important that the selection of the proper priority dispatching rule associated with the flow process, be in accordance with the relative management importance given to each metric, in a complex multi criteria decision-making process.
The combined methodology of discrete-event simulation and design of experiments (DOE) through the Taguchi approach allows the detailed consideration of the main influential factors in system operations in relationship to a particular process flow. The operational decision-making improves under the complex relationships between system design and operations management (priority or dispatching rules), looking for the optimal priority rules for a particular manufacturing system. With the same decision-making metrics, the optimal dispatching rule appears to be associated with a particular process flow. In the particular case of the engine MRO center under analysis, many processes and tasks are established by the airworthiness standards, so the system process flow options can be designed by taking into account an integrated analysis of the internal and service ratios. Discrete-event simulation combined with the design of experiments is a convenient technique to evaluate scalable models of manufacturing systems focused on service, including their design alternatives. In general, the trade-off between productive factors and service ratios recommends to look for a process flow design and dispatching rules with favorable results in cost, but in tight relationship with the operational competitive advantages of flexibility and a proper service.
Former results suggest that future research works can benefit from discrete-event simulation, in addition to other method use (constraint programming, meta-heuristics, agents, etc.). They should combine the analysis of process flow and priority rules with the flexibility under partial resource utilization, in order to cope with load fluctuations while reaching the desired service. In direct connection with the results, the current trend in life cycle management of capital goods (e.g., aircraft engines) encourages pooling systems of equipment or components. Therefore, the study of external coupling of MRO scheduling with hardware management might be probably better studied through asynchronous process flow.


