Author Contributions
Conceptualization, J.W., P.B.; Investigation, J.W., C.M.; Methodology, J.W., C.M., V.F., and P.B.; Supervision, R.R., P.B.; Validation, J.W., C.M., and P.B.; Visualization, J.W., C.M. and P.B.; Formal analysis, J.W., C.M., R.R., V.F., H.C., S.B., and P.B; Writing—original draft, J.W.; Writing—review & editing, J.W., C.M., R.R., V.F., H.C., S.B., and P.B; Funding acquisition, R.R.;
Figure 1.
(a) Molecular structure of brilliant yellow. (b) When exposed to polarized light, brilliant yellow molecules undergo in-plane re-orientation to a direction of 90 degrees with respect to the light polarization direction. (c) When exposed to un-polarized light, brilliant yellow molecules undergo out-of-plane re-orientation to a direction along to the light propagation direction.
Figure 2.
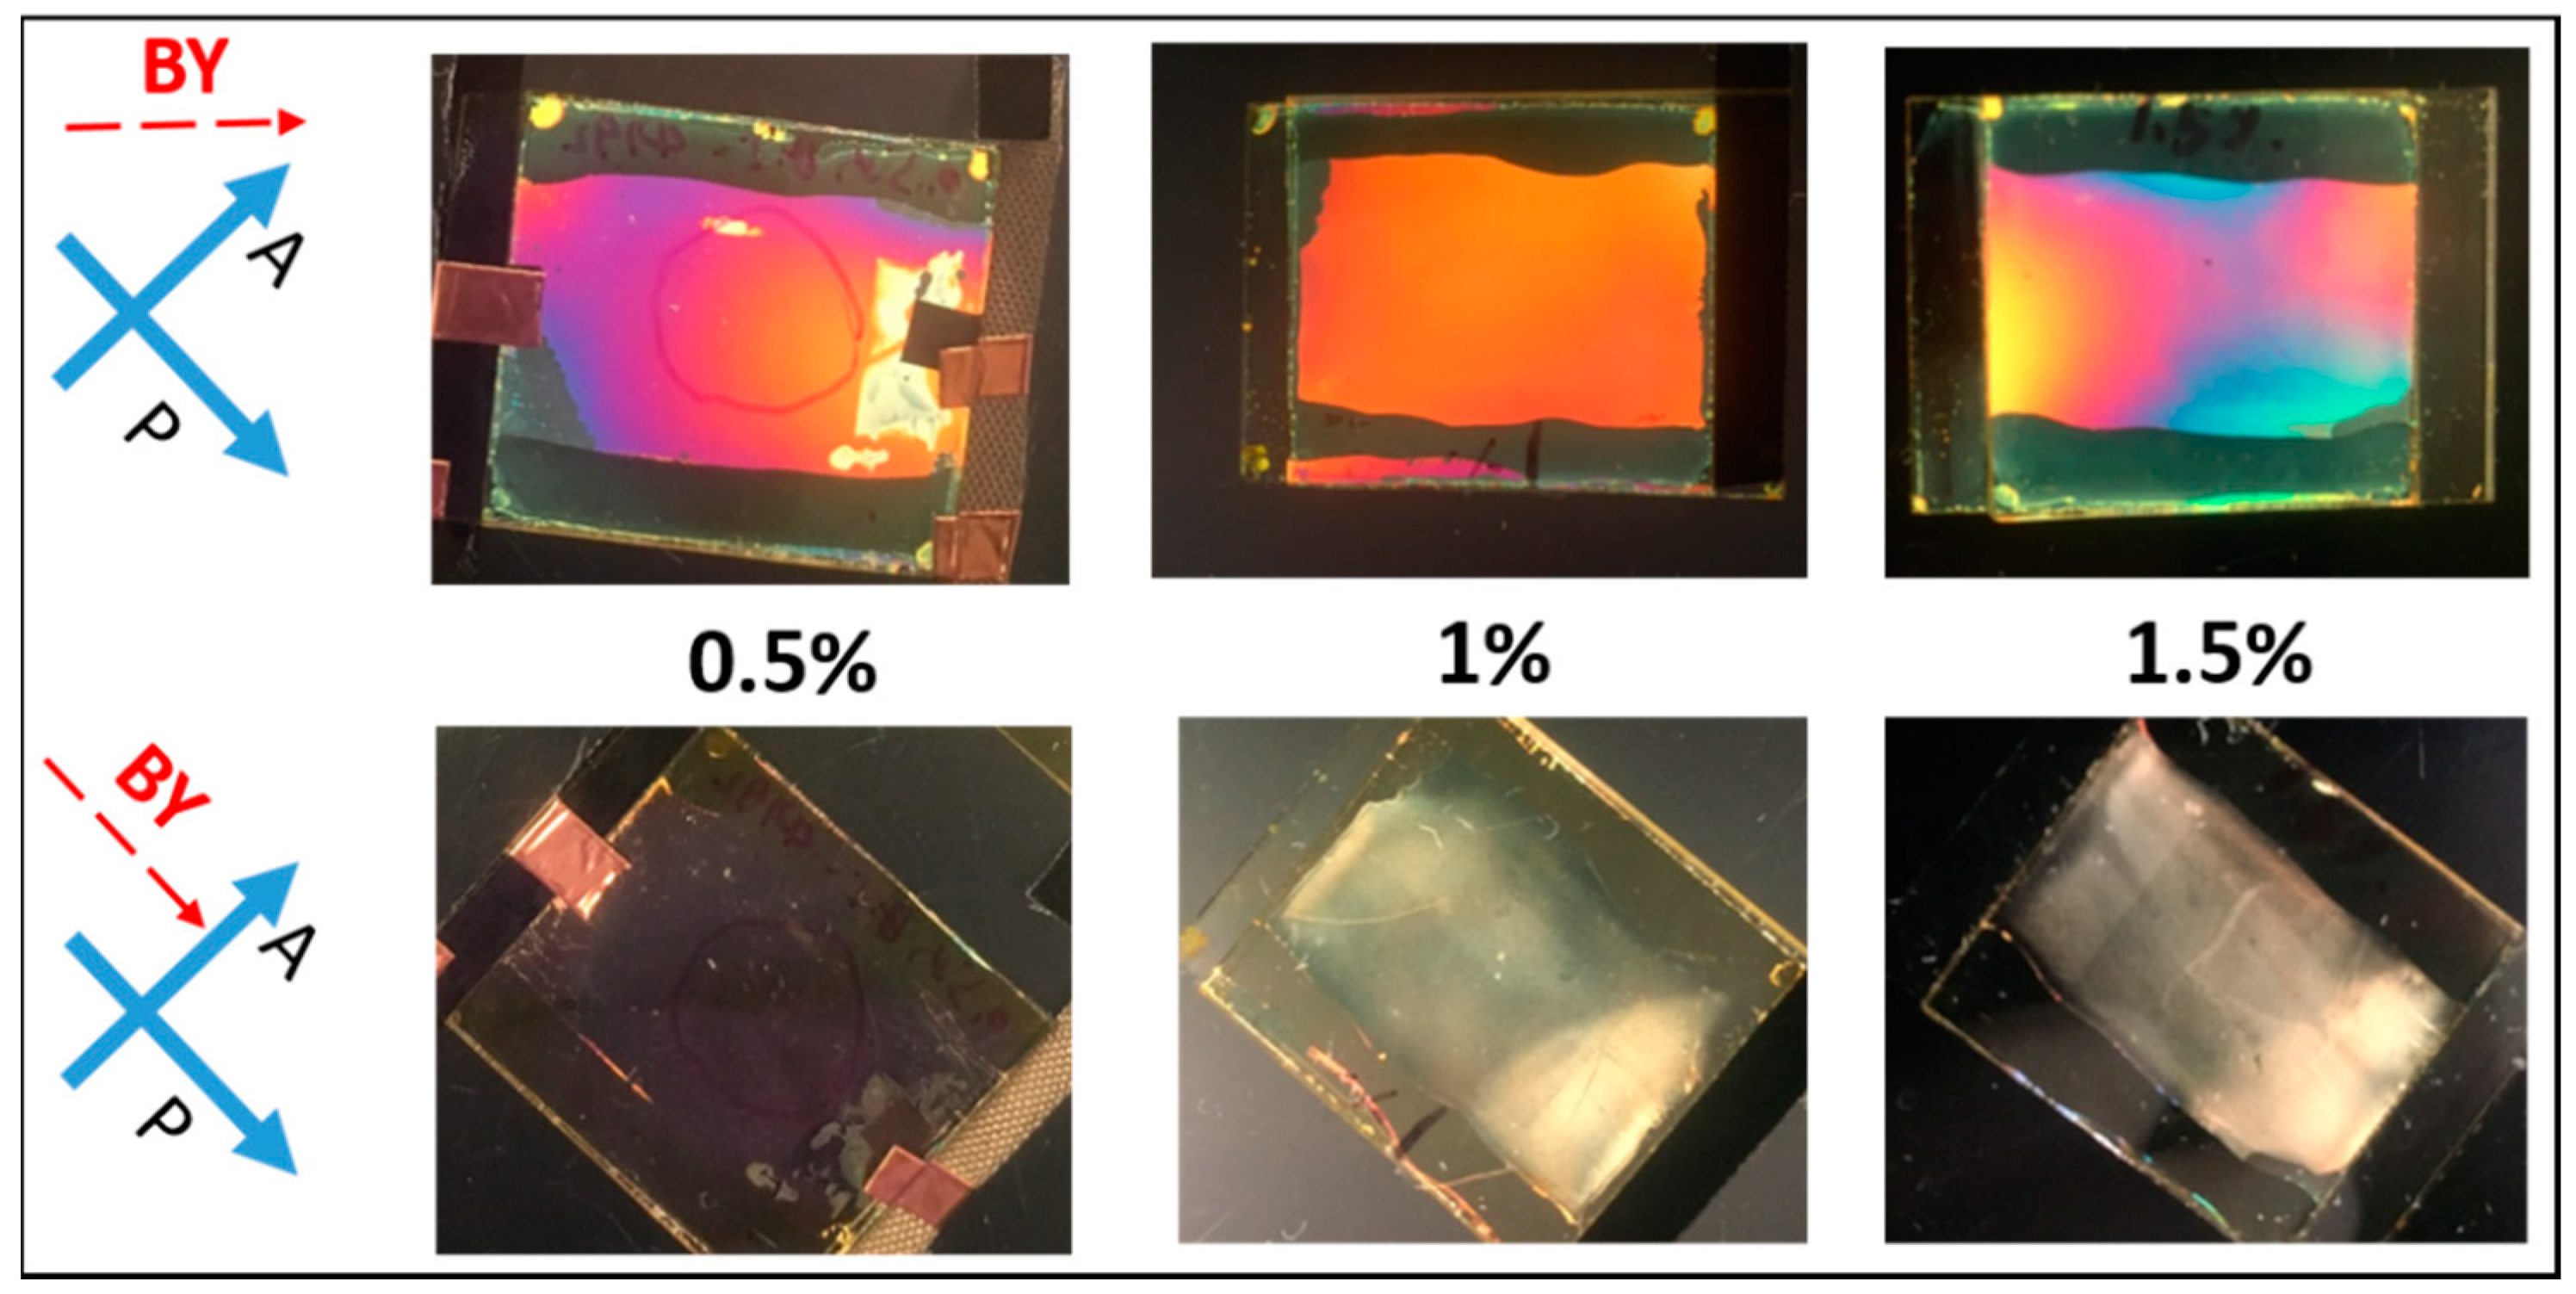
Observation of cells between crossed polarizers after UV polymerization. Cells were filled with mixtures of different RM (Bis-MA) concentration (0.5%, 1%, or 1.5%) in LC (ZLI-4792).
Figure 2.
Observation of cells between crossed polarizers after UV polymerization. Cells were filled with mixtures of different RM (Bis-MA) concentration (0.5%, 1%, or 1.5%) in LC (ZLI-4792).
Figure 3.
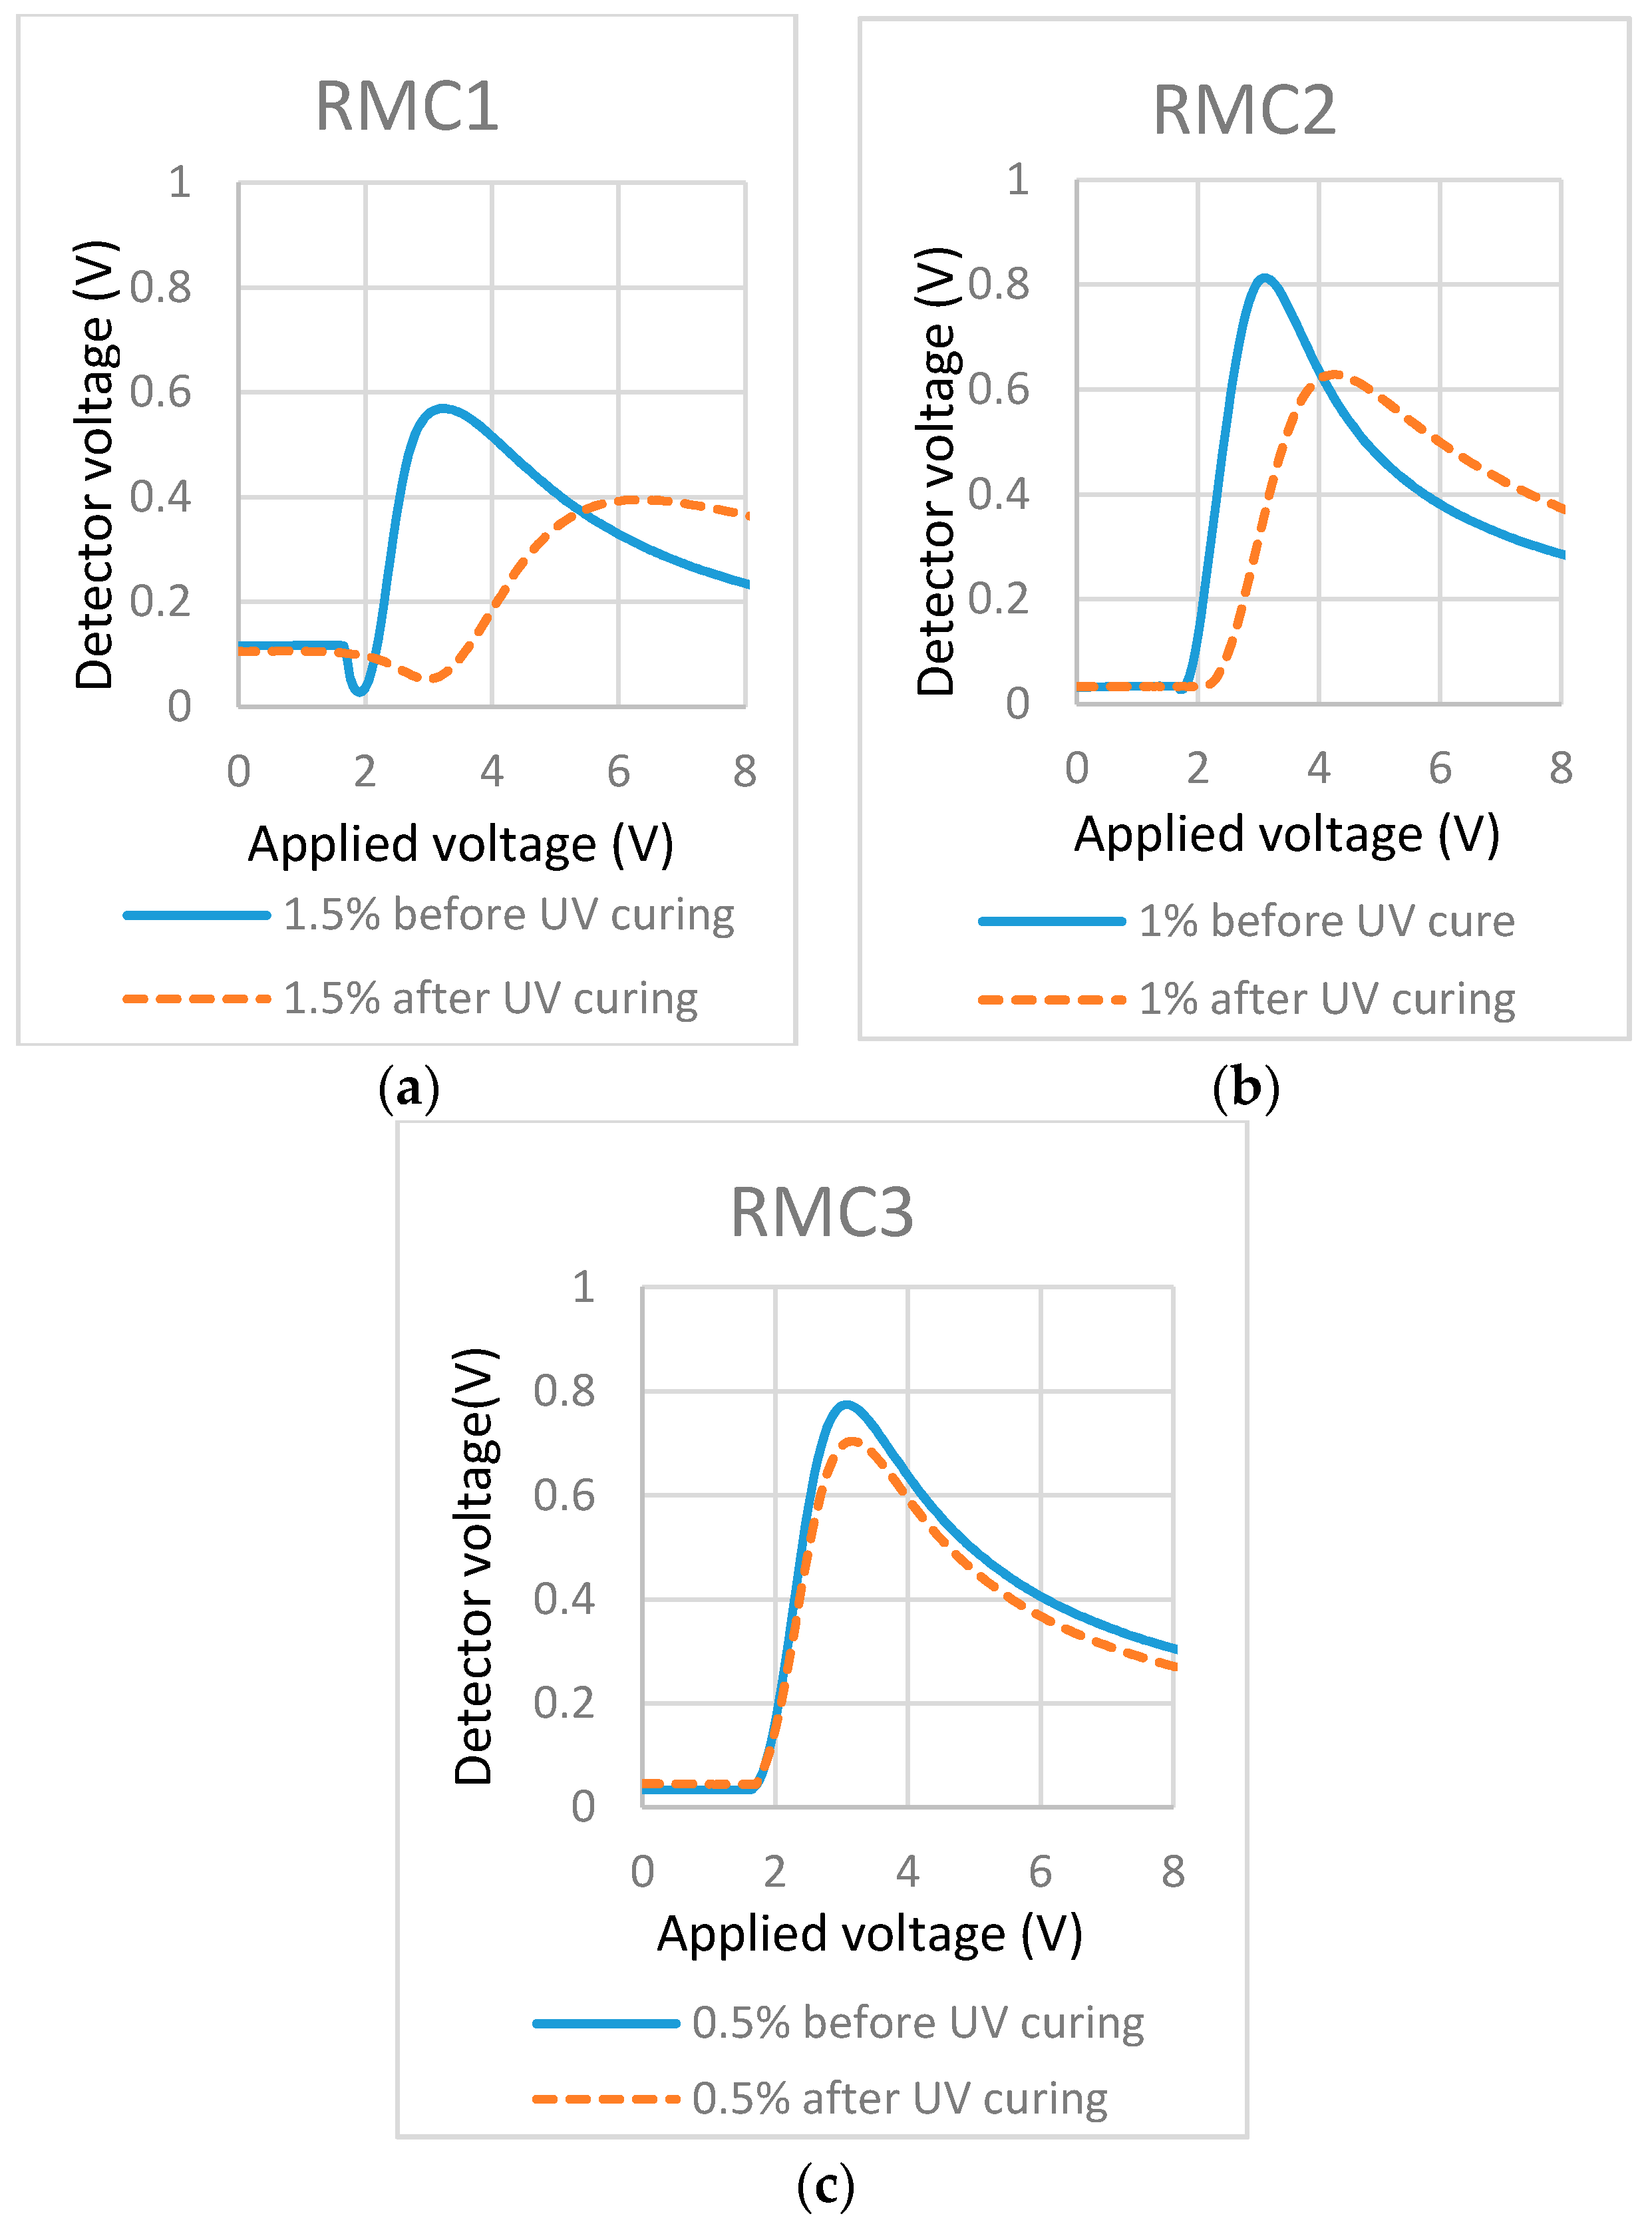
Transmission-applied voltage curves of cells filled with mixtures of different concentrations of RM in LC. (a) 1.5% Bis-MA in LC; (b) 1% Bis-MA in LC; and (c) 0.5% Bis-MA in LC.
Figure 3.
Transmission-applied voltage curves of cells filled with mixtures of different concentrations of RM in LC. (a) 1.5% Bis-MA in LC; (b) 1% Bis-MA in LC; and (c) 0.5% Bis-MA in LC.
Figure 4.
Polarized microscope images of the cell (0.5% cell in
Figure 2): (
a) before life-test; (
b) after life test; and (
c) after photo-bleaching. The BY alignment was represented by a red dash arrow with a dynamic re-orientation direction after the life-test and photo-bleaching with respect to the polarizer and/or analyzer direction. Macroscopic observation of cells after photo-bleaching when the original LC alignment was 45° to polarizer (
d) or parallel to one polarizer (
e).
Figure 5.
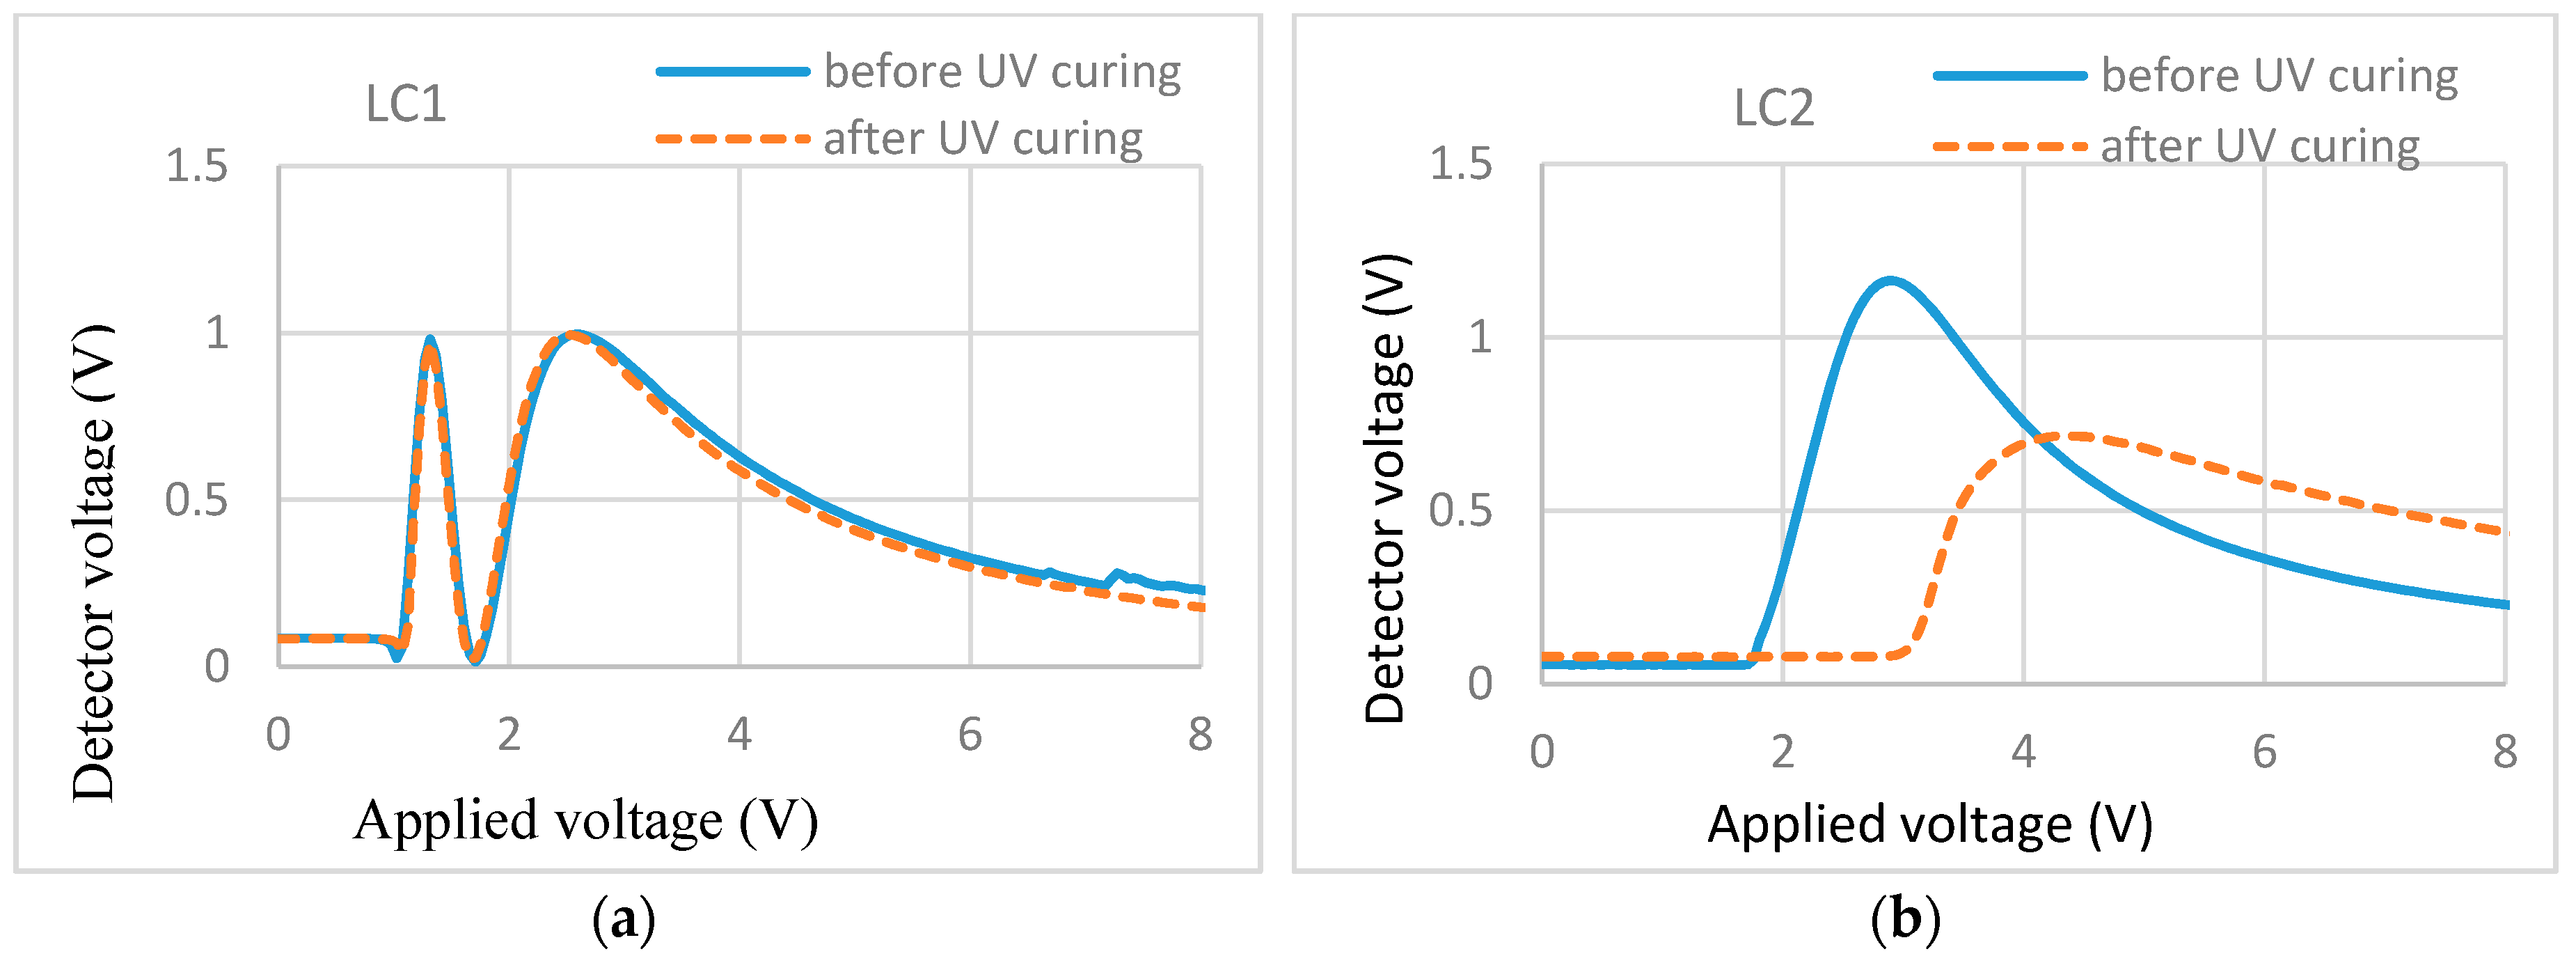
T/V curves of (a) 1.5% RM257 in E7 and (b) 1.5% RM257 in ZLI-4792.
Figure 5.
T/V curves of (a) 1.5% RM257 in E7 and (b) 1.5% RM257 in ZLI-4792.
Figure 6.
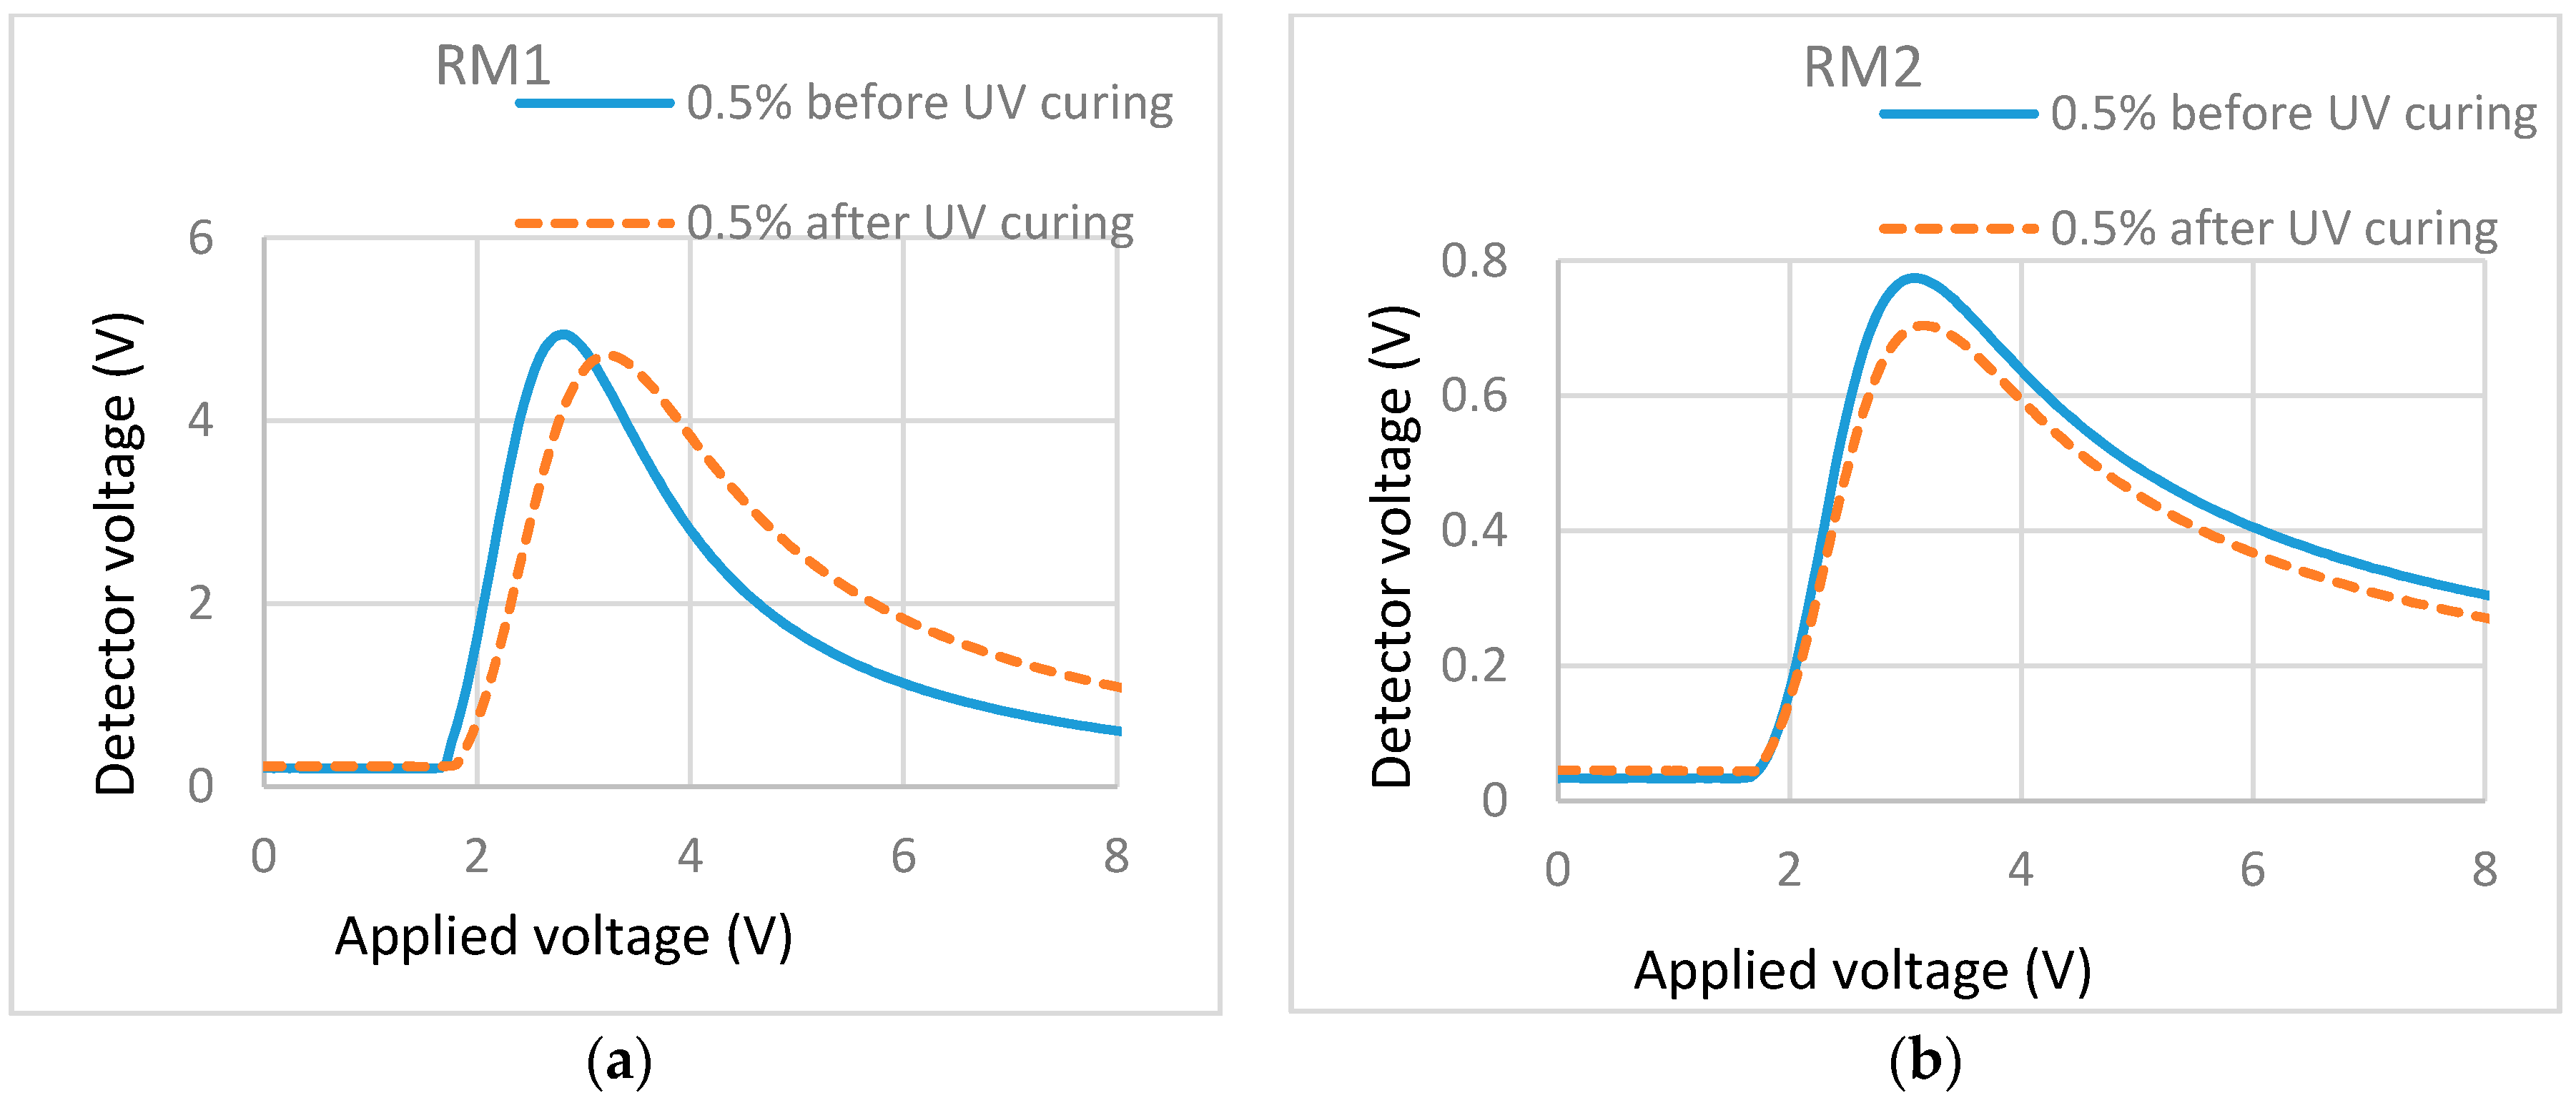
T/V curves of cells containing different monomers in the same LC. (a) 0.5% RM257 in ZLI-4792; (b) 0.5% Bis-MA in ZLI-4792.
Figure 6.
T/V curves of cells containing different monomers in the same LC. (a) 0.5% RM257 in ZLI-4792; (b) 0.5% Bis-MA in ZLI-4792.
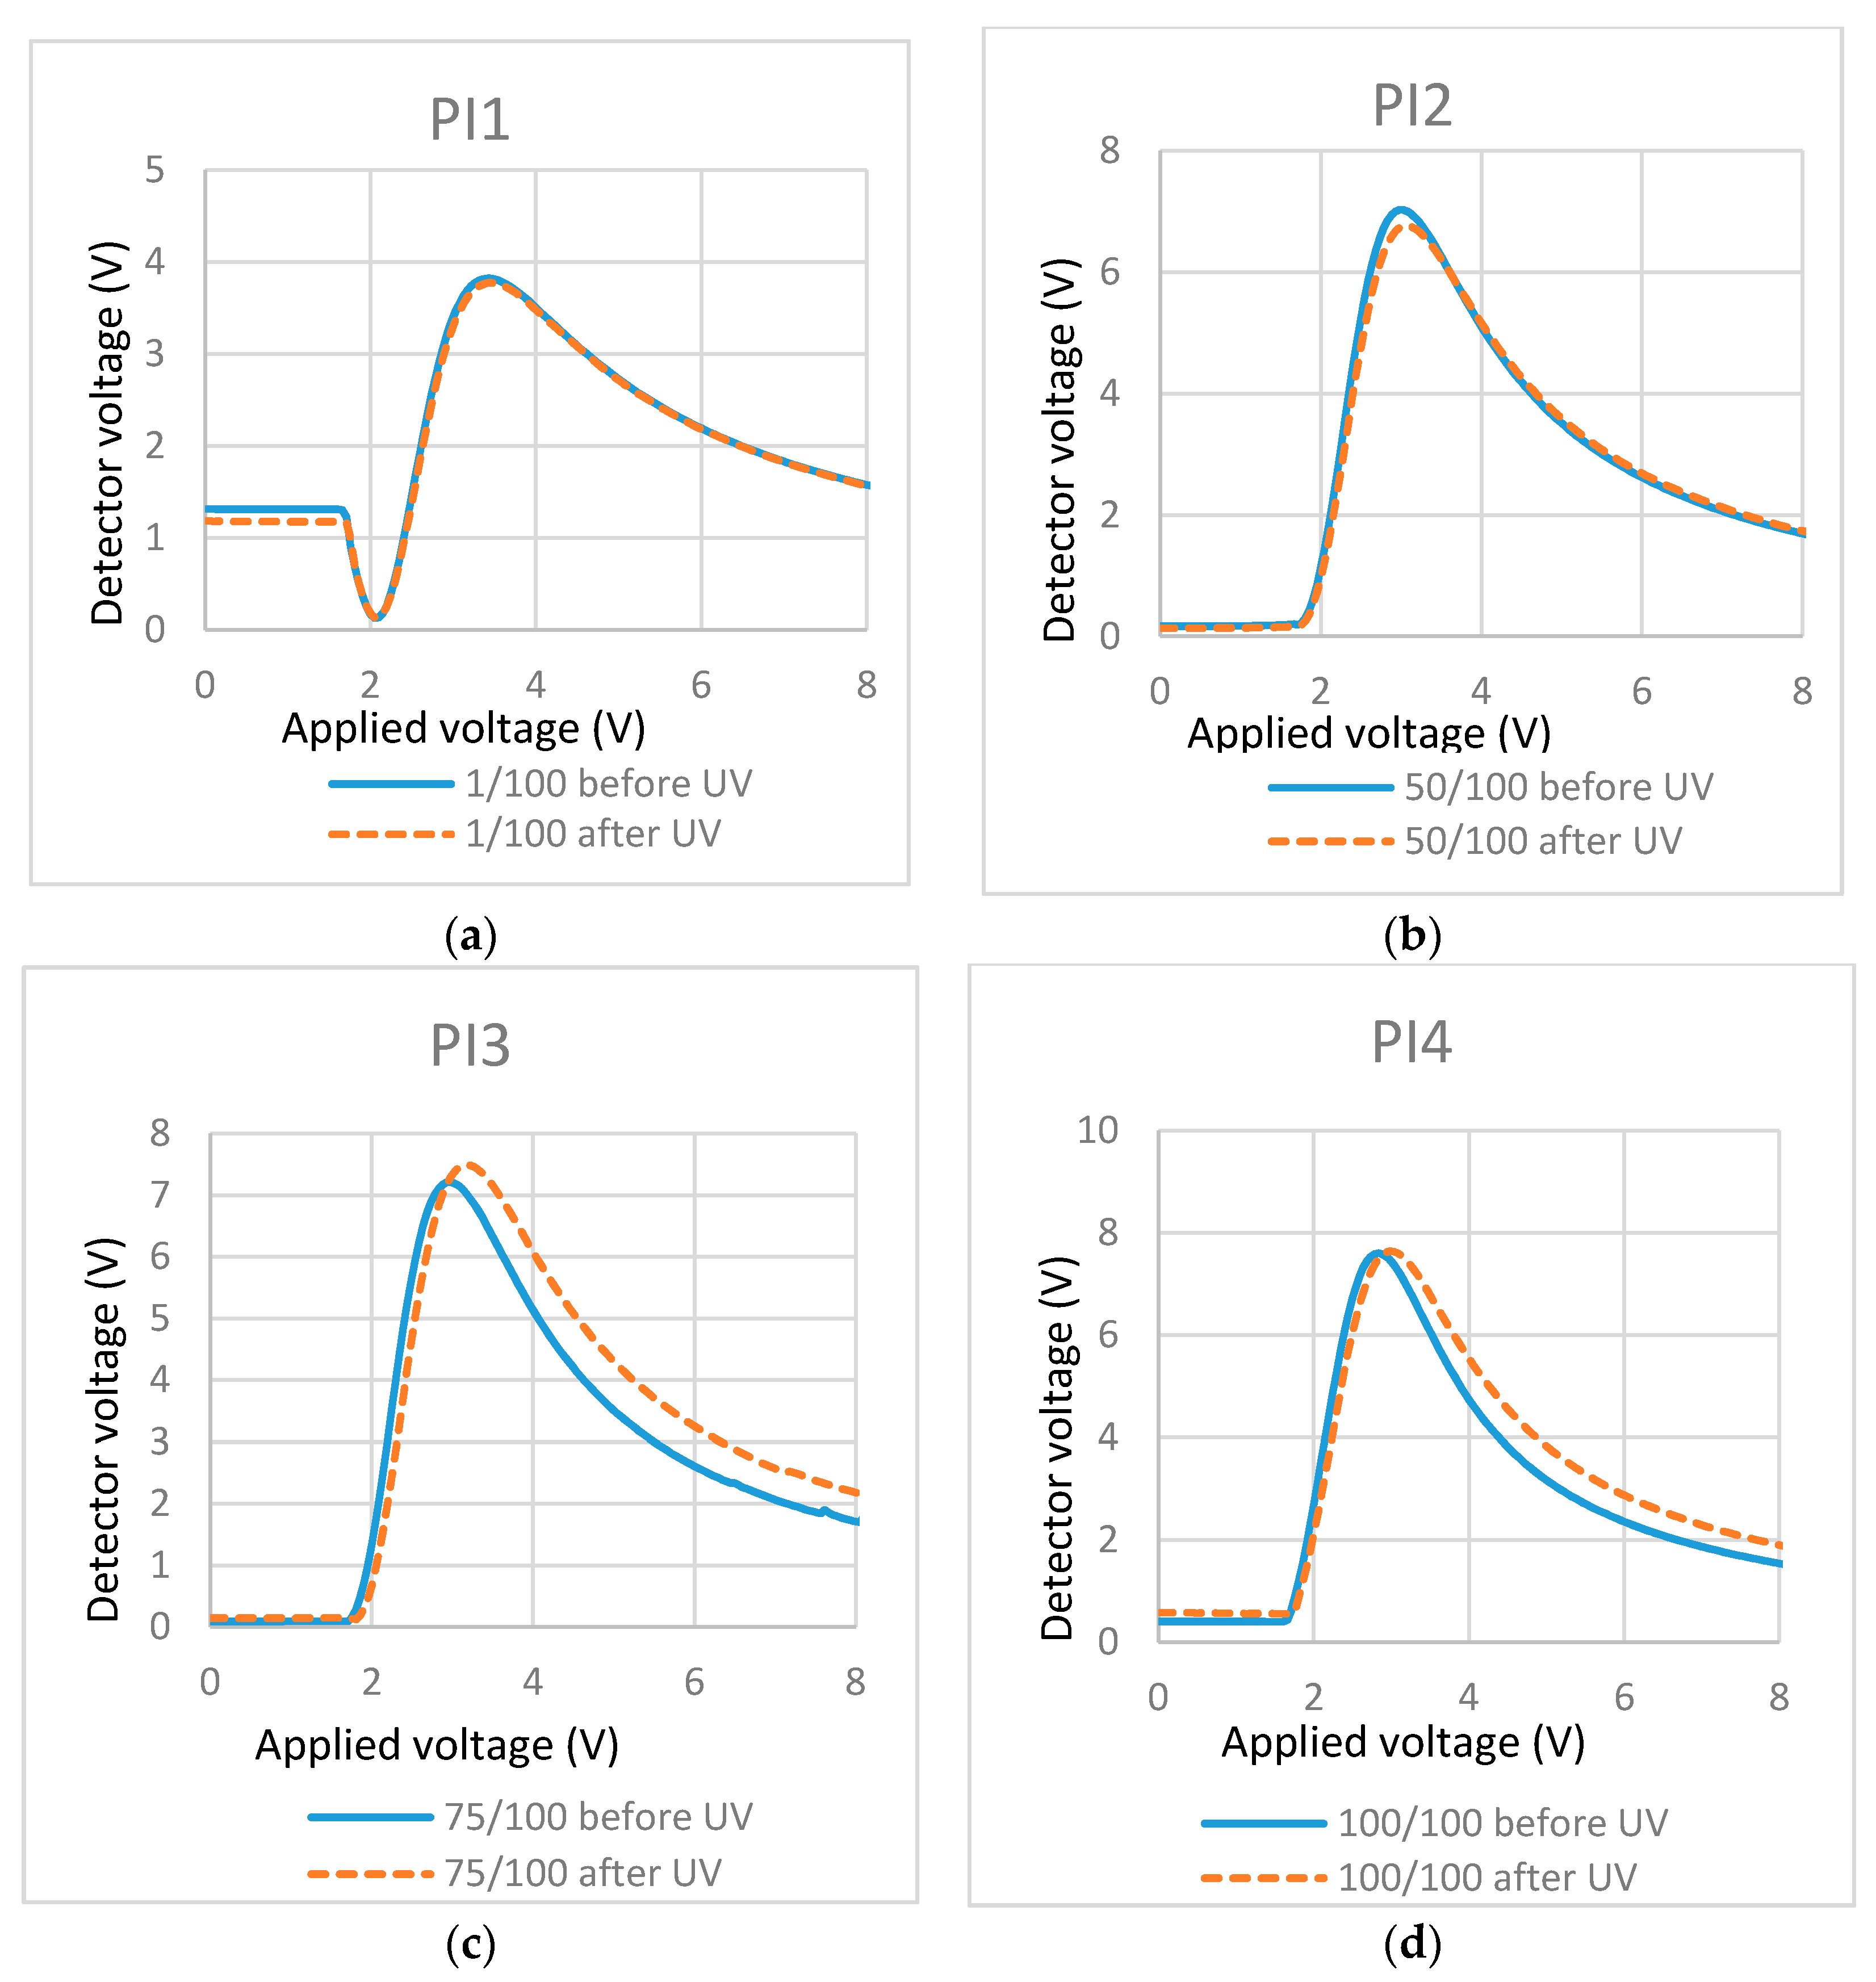
Figure 7.
T/V curves of cells containing mixtures with different concentrations of photo-initiator (PI): (a) PI/RM = 1/100; (b) PI/RM = 50/100; (c) PI/RM = 75/100; and (d) PI/RM = 100/100.
Figure 7.
T/V curves of cells containing mixtures with different concentrations of photo-initiator (PI): (a) PI/RM = 1/100; (b) PI/RM = 50/100; (c) PI/RM = 75/100; and (d) PI/RM = 100/100.
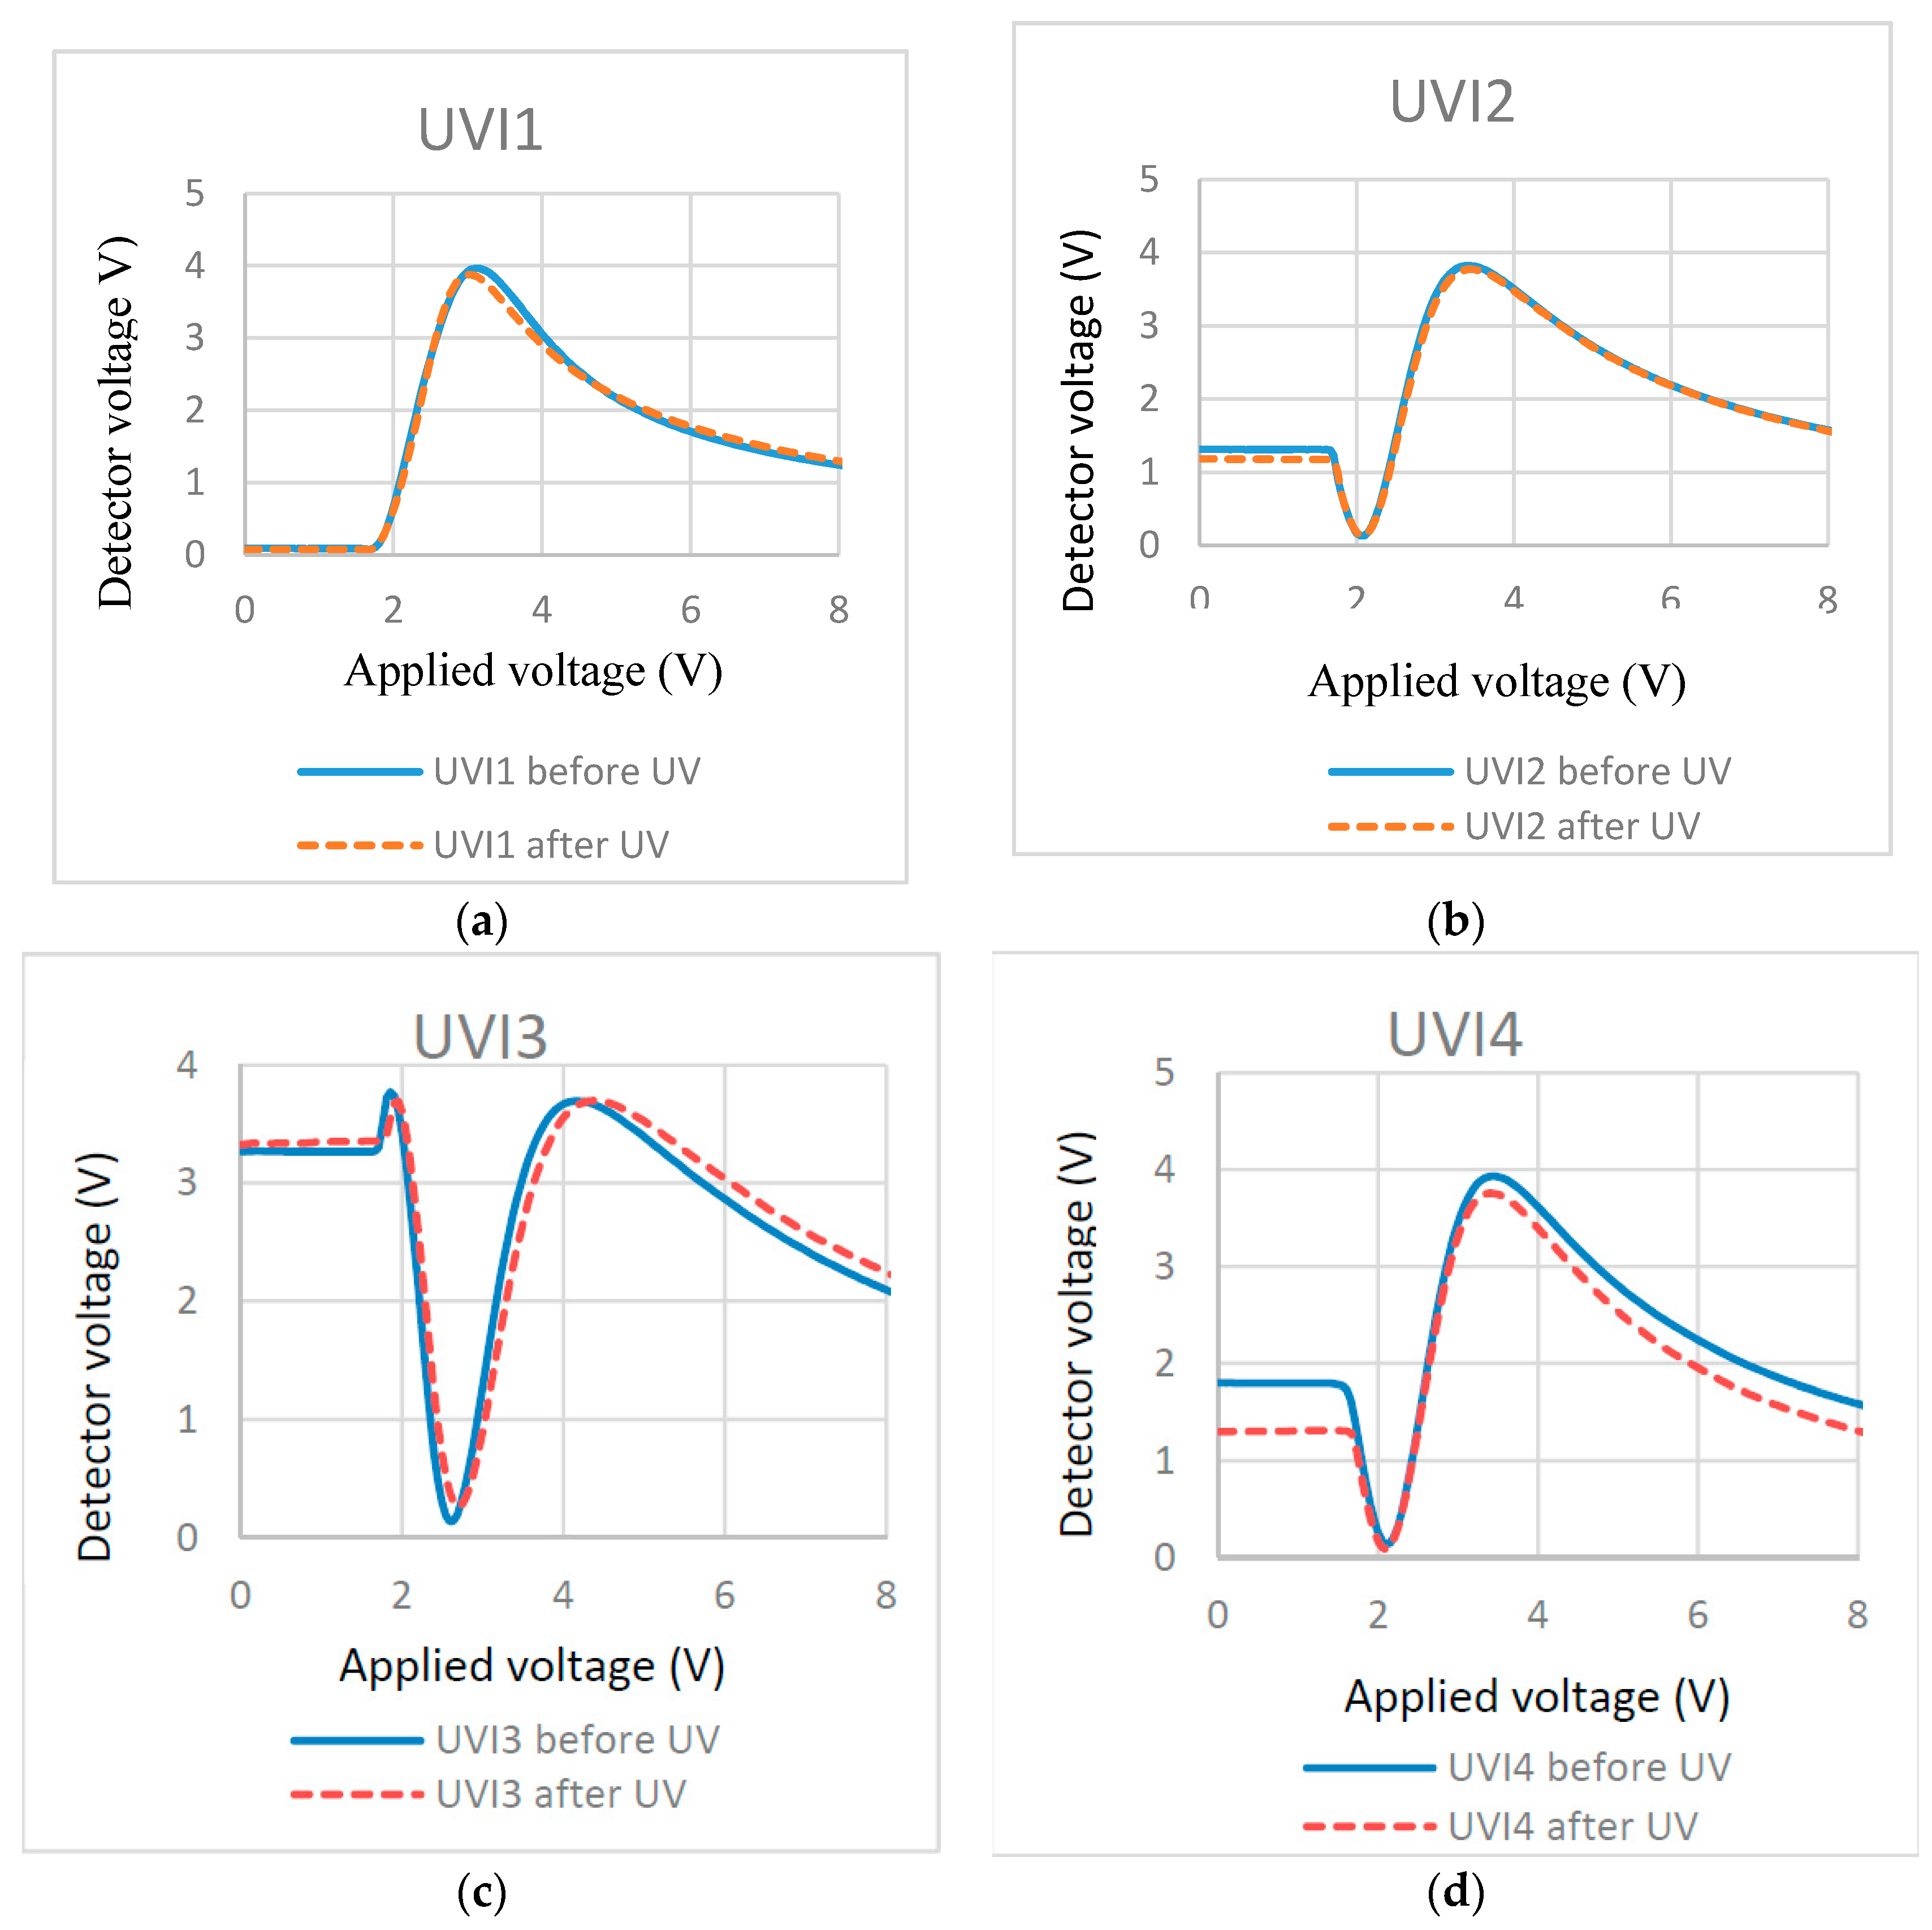
Figure 8.
T/V curves of cells cured at different UV exposure intensity and time: (a) 0.75 mW/cm2 for 70 min; (b) 3.5 mW/cm2 for 10 min; (c) 21 mW/cm2 for 2.5 min; and (d) 21 mW/cm2 for 10 min.
Figure 8.
T/V curves of cells cured at different UV exposure intensity and time: (a) 0.75 mW/cm2 for 70 min; (b) 3.5 mW/cm2 for 10 min; (c) 21 mW/cm2 for 2.5 min; and (d) 21 mW/cm2 for 10 min.
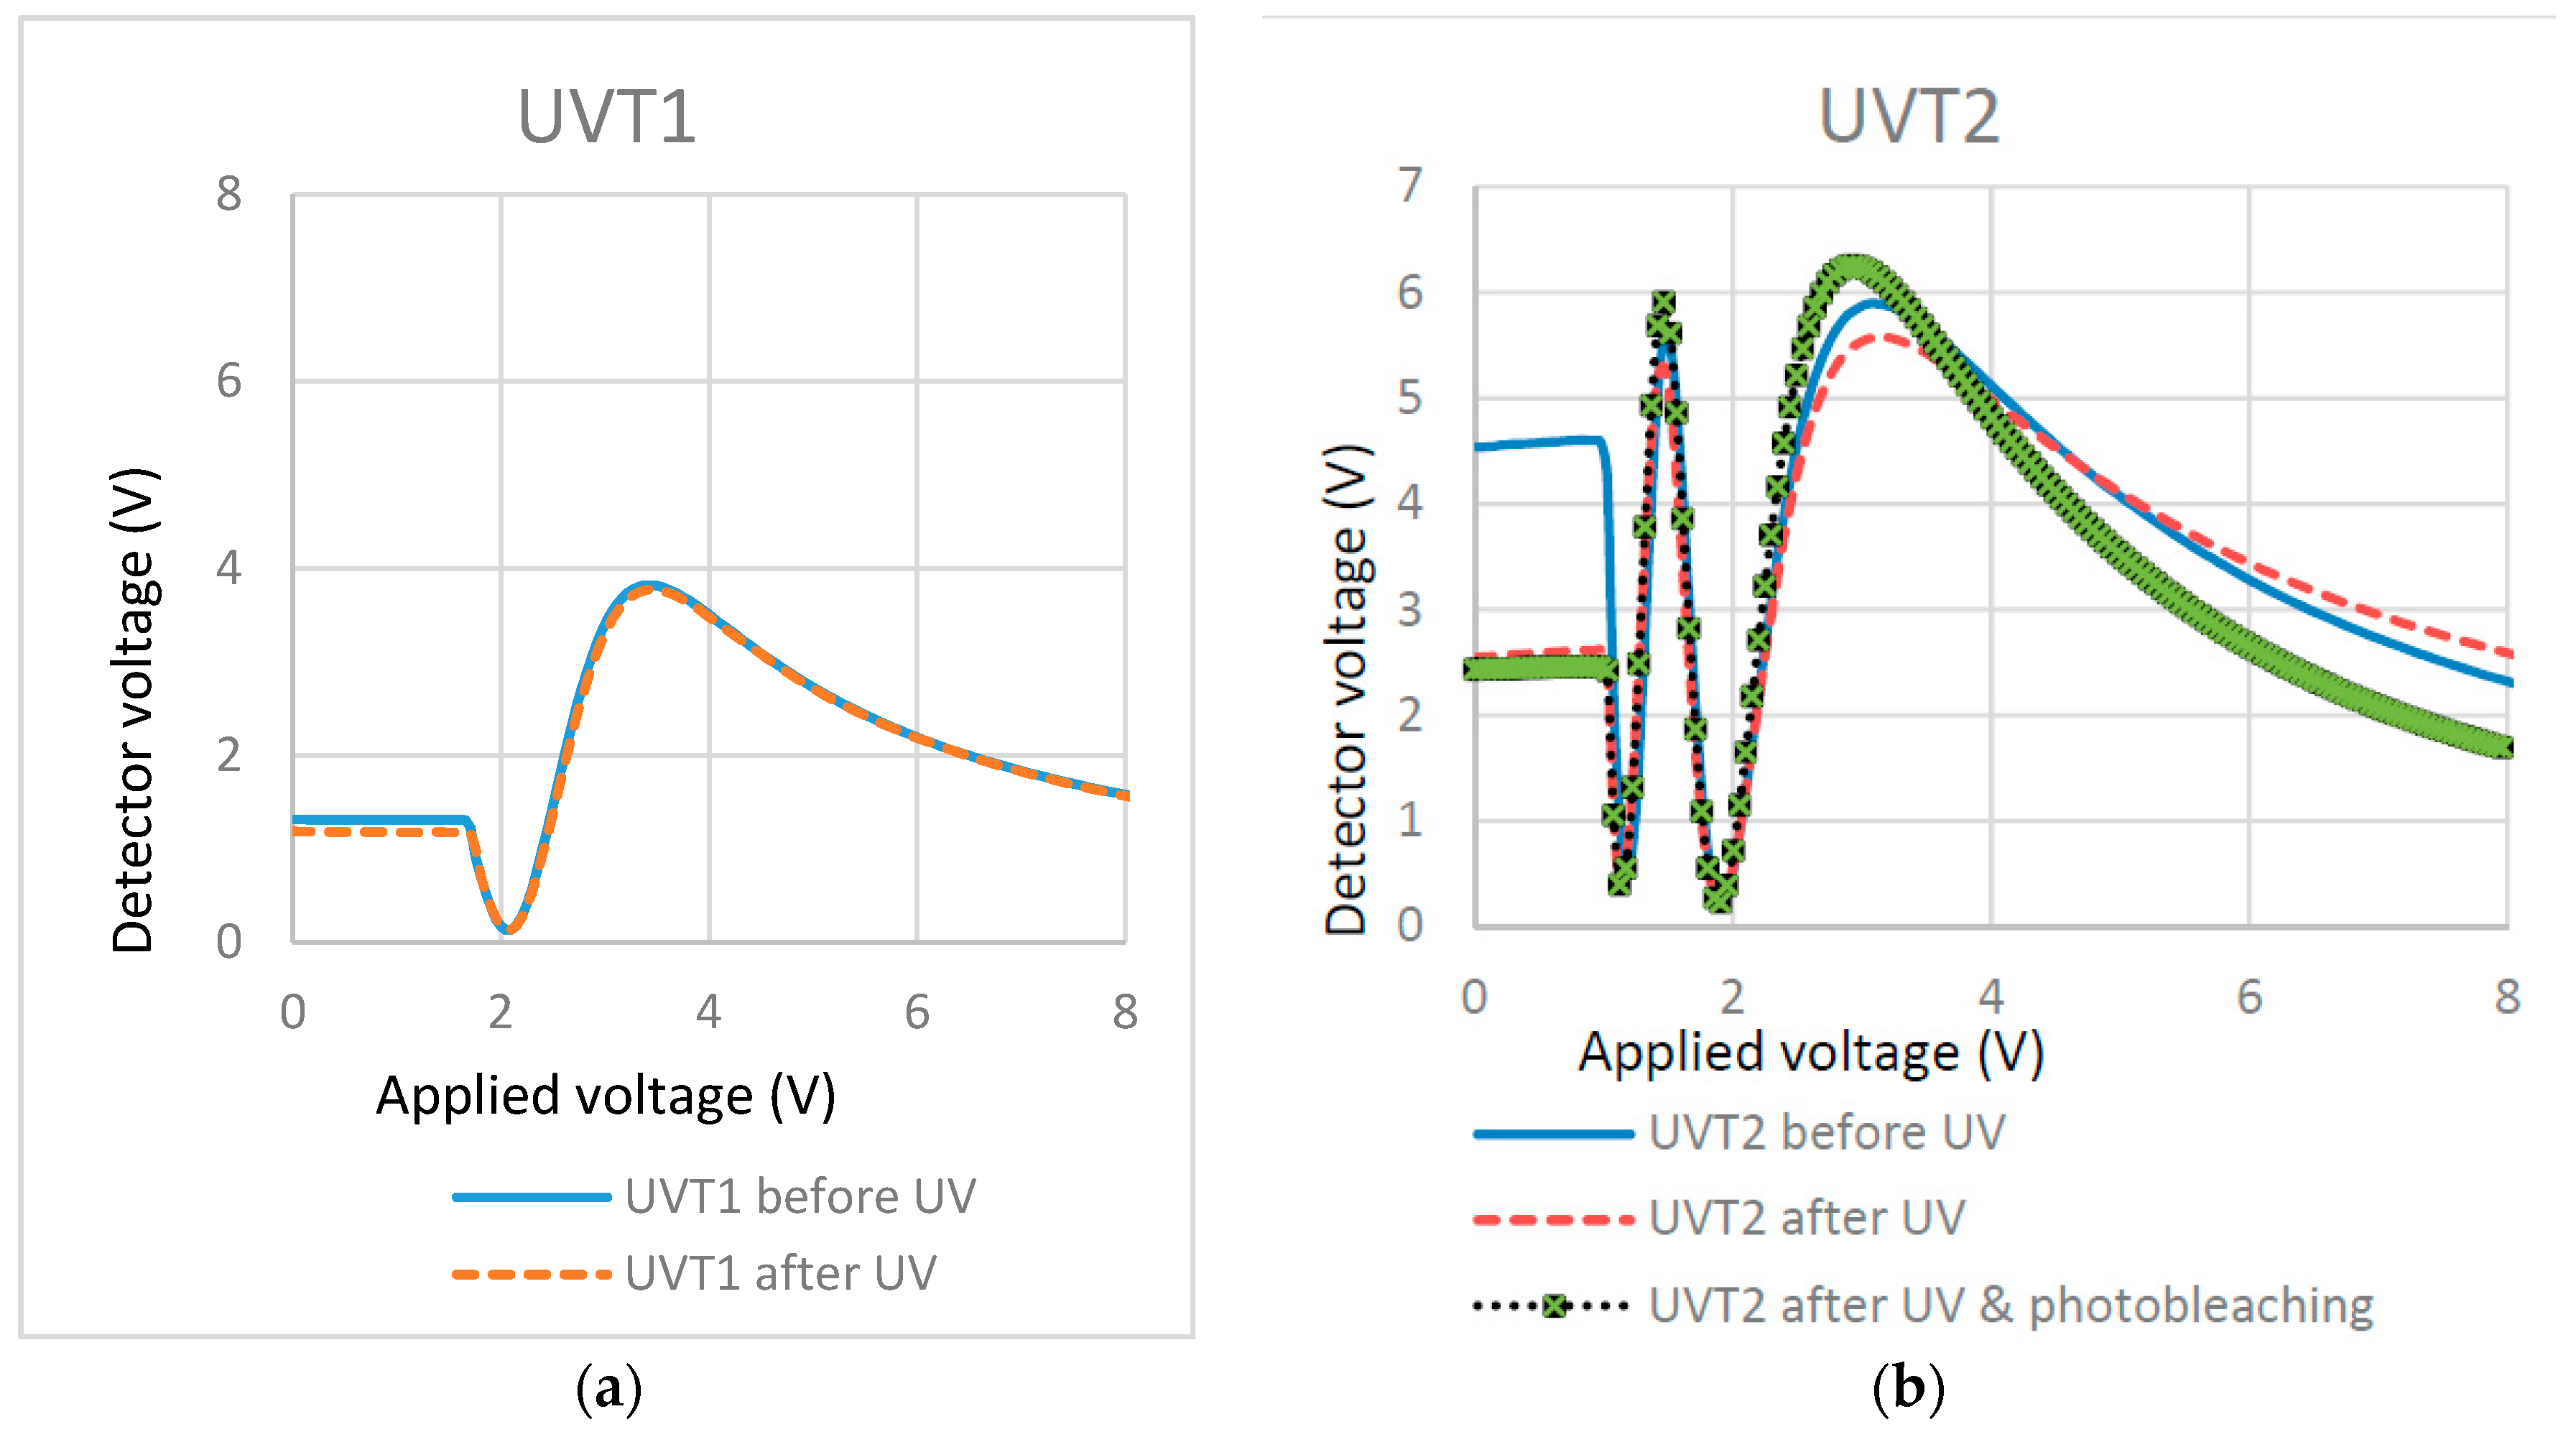
Figure 9.
T/V curves of cells cured at different temperatures: (a) 22 °C and (b) 80 °C.
Figure 9.
T/V curves of cells cured at different temperatures: (a) 22 °C and (b) 80 °C.
Figure 10.
Macroscopic observation of the cell before photo-bleaching (a) and after photo-bleaching (b,c). The original LC alignment was parallel to one polarizer (b) or 45° to one polarizer (c). Half of the cell (highlighted in the dashed line box of b, c) was masked during the exposure. Therefore, a uniform dark state across the cell indicates stable alignment.
Figure 11.
Molecular structures of two fluorinated liquid crystals (FLC) chosen to estimate the solubility parameters for ZLI-4792.
Figure 11.
Molecular structures of two fluorinated liquid crystals (FLC) chosen to estimate the solubility parameters for ZLI-4792.
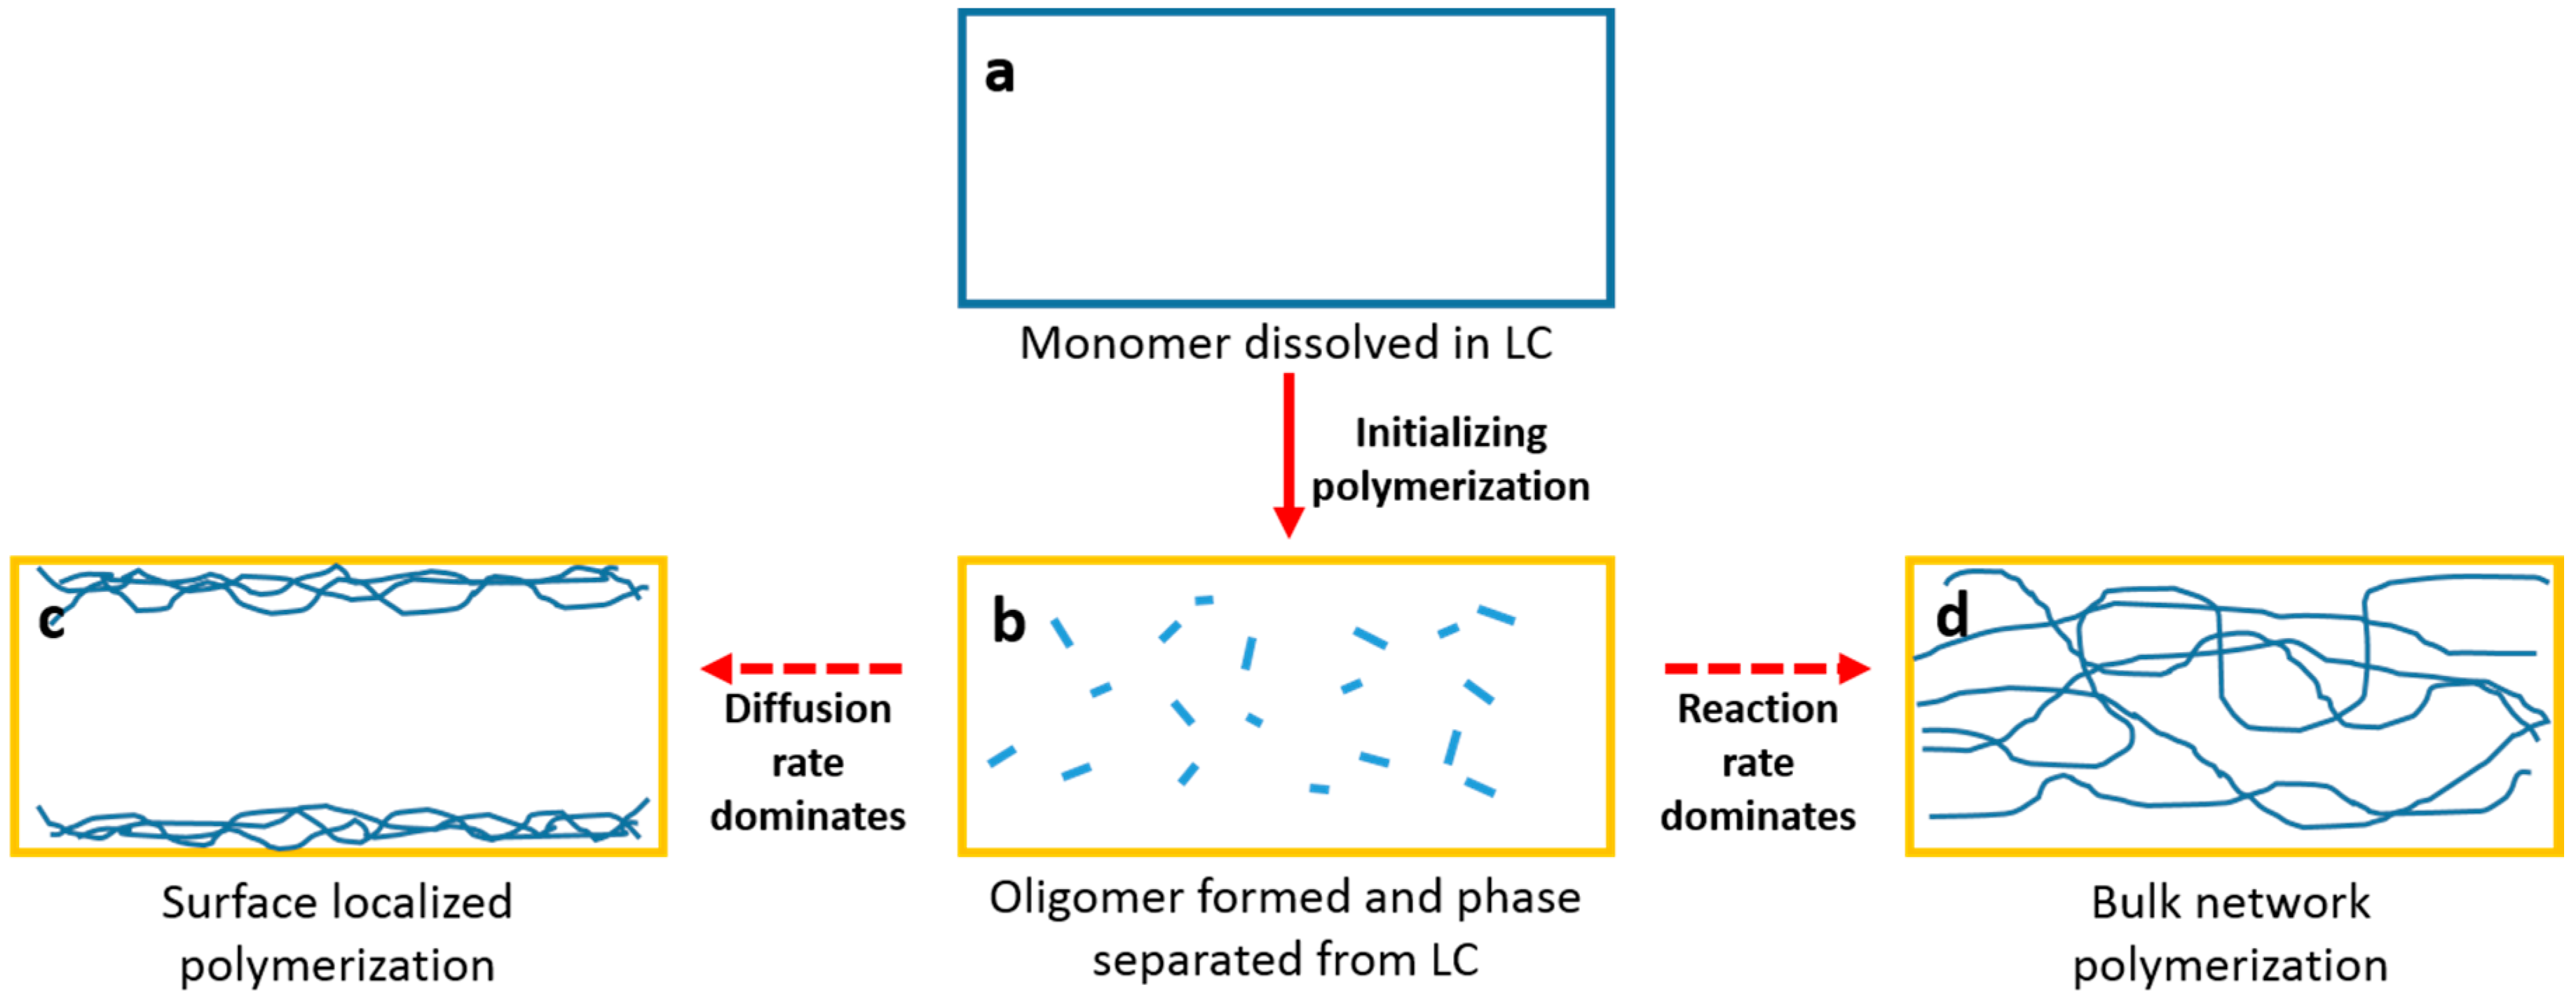
Figure 12.
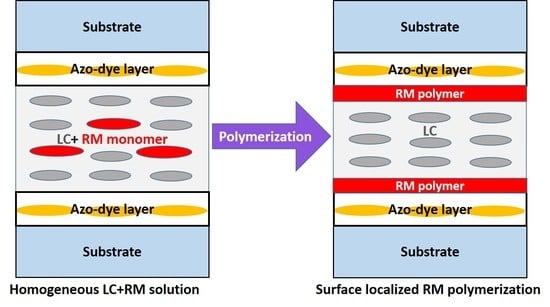
Sketched mechanism for the polymerization of RM from LC solvent: (a) RM dissolved in LC before UV exposure; (b) Oligomer formed and phase separated from LC after initial UV polymerization; (c) Surface localized polymerization and (d) bulk network polymerization.
Figure 12.
Sketched mechanism for the polymerization of RM from LC solvent: (a) RM dissolved in LC before UV exposure; (b) Oligomer formed and phase separated from LC after initial UV polymerization; (c) Surface localized polymerization and (d) bulk network polymerization.
Table 1.
When studying the RM concentration, mixtures of RM (Bis-MA) /LC (ZLI-4792) were prepared as below. In each mixture, the added amount of PI was 1% with respect to the RM.
Table 1.
When studying the RM concentration, mixtures of RM (Bis-MA) /LC (ZLI-4792) were prepared as below. In each mixture, the added amount of PI was 1% with respect to the RM.
| Sample | RM/LC (Weight Ratio) | UV Intensity (mW/cm2) | UV Curing Time (min) | UV Curing Temperature (°C) |
|---|
| RMC1 | 1.5:98.5 | 3.5 | 10 | 22 |
| RMC2 | 1:99 | 3.5 | 10 | 22 |
| RMC3 | 0.5:99.5 | 3.5 | 10 | 22 |
Table 2.
For study on the types of liquid crystals, 1.5% RM257 was added to 2 different LC (either E7 or ZLI-4792). In each mixture, the added amount of PI was 1% with respect to the RM.
Table 2.
For study on the types of liquid crystals, 1.5% RM257 was added to 2 different LC (either E7 or ZLI-4792). In each mixture, the added amount of PI was 1% with respect to the RM.
| Sample | LC | UV Intensity (mW/cm2) | UV Curing Time (min) | UV Curing Temperature (°C) |
|---|
| LC1 | E7 | 3.5 | 10 | 22 |
| LC2 | ZLI-4792 | 3.5 | 10 | 22 |
Table 3.
With regard to the types of the reactive monomer, two different reactive monomers—either RM257 or Bis-MA were added to ZLI-4792 at 0.5%. In each mixture, the added amount of PI was 1% with respect to the RM.
Table 3.
With regard to the types of the reactive monomer, two different reactive monomers—either RM257 or Bis-MA were added to ZLI-4792 at 0.5%. In each mixture, the added amount of PI was 1% with respect to the RM.
| Sample | RM | UV Intensity (mW/cm2) | UV Curing Time (min) | UV Curing Temperature (°C) |
|---|
| RM1 | RM257 | 3.5 | 10 | 22 |
| RM2 | Bis-MA | 3.5 | 10 | 22 |
Table 4.
With regard to the PI concentration, different concentrations of PI (with respect to the RM) were prepared. In each cell, the weight ratio of RM to LC was kept constant (RM257/ZLI-4792 = 0.3/99.7).
Table 4.
With regard to the PI concentration, different concentrations of PI (with respect to the RM) were prepared. In each cell, the weight ratio of RM to LC was kept constant (RM257/ZLI-4792 = 0.3/99.7).
| Sample | PI/RM (Weight Ratio) | UV Intensity (mW/cm2) | UV Curing Time (min) | UV Curing Temperature (°C) |
|---|
| PI1 | 1:100 | 3.5 | 10 | 22 |
| PI2 | 50:100 | 3.5 | 10 | 22 |
| PI3 | 75:100 | 3.5 | 10 | 22 |
| PI4 | 100:100 | 3.5 | 10 | 22 |
Table 5.
A previous study presented one UV intensity (3.5 mW/cm
2 at 365 nm for 10 min) for RM polymerization [
34]. To see whether UV intensity will affect the surface localized polymerization, we cured the cells at different UV intensities and different times, which is shown in
Table 5. In each mixture, the added amount of PI was 1% with respect to the RM.
| Sample | RM/LC (Weight Ratio) | UV Intensity (mW/cm2) | UV Curing Time (min) | UV Curing Temperature (°C) |
|---|
| UVI1 | 0.3:99.7 | 0.75 | 70 | 22 |
| UVI2 | 0.3:99.7 | 3.5 | 10 | 22 |
| UVI3 | 0.3:99.7 | 21 | 2.5 | 22 |
| UVI4 | 0.3:99.7 | 21 | 10 | 22 |
Table 6.
With regard to the UV curing temperature, cells filled with 1.5% RM257 dissolved in E7 were UV cured at two temperatures (below and above the clearing point of E7), which is shown below. In each mixture, the added amount of PI was 1% with respect to the RM.
Table 6.
With regard to the UV curing temperature, cells filled with 1.5% RM257 dissolved in E7 were UV cured at two temperatures (below and above the clearing point of E7), which is shown below. In each mixture, the added amount of PI was 1% with respect to the RM.
| Sample | RM/LC (Weight Ratio) | UV Intensity (mW/cm2) | UV Curing Time (min) | UV Curing Temperature (°C) |
|---|
| UVT1 | 1.5:98.5 | 3.5 | 10 | 22 |
| UVT2 | 1.5:98.5 | 3.5 | 10 | 80 |
Table 7.
Calculation process of the solubility parameter based on the molecular structure of FLC#1.
Table 7.
Calculation process of the solubility parameter based on the molecular structure of FLC#1.
| Components for FLC #1 | Cohesive Energy = Ej (J/mol) | Molar Volume = Vj (cm3/mol) | # of Group = Nj | Cohesive Energy Density Ec,j = Ej/Vj (J/cm3) | Volume = Vj × Nj (cm3/mol) | Volume Fraction = Vf = Vj × Nj/(Volume Sum) | Component Solubility Parameter = Ec,j0.5 × Vf (J/cm3)0.5 |
|---|
| -CH2- | 4940 | 16.1 | 4 | 306.8 | 64.4 | 0.27 | 4.7 |
| 6 atom ring | 1050 | 16 | 2 | 65.6 | 32 | 0.13 | 1.1 |
| Phenylene | 31,940 | 52.4 | 1 | 609.5 | 52.4 | 0.22 | 5.4 |
| C-F3 | 4270 | 57.5 | 1 | 74.3 | 57.5 | 0.24 | 2.1 |
| CH3- | 4710 | 33.5 | 1 | 140.6 | 33.5 | 0.14 | 4.2 |
| | | | | | Volume sum = 239.8 | | Solubility parameter sum δ = 17.5 |
Table 8.
Calculation process of the solubility parameter based on the molecular structure of FLC#2.
Table 8.
Calculation process of the solubility parameter based on the molecular structure of FLC#2.
| Components for FLC #2 | Cohesive Energy = Ej (J/mol) | Molar Volume = Vj (cm3/mol) | # of Group = Nj | Cohesive Energy Density = Ec,j = Ej/Vj (J/cm3) | Volume = Vj × Nj (cm3/mol) | Volume Fraction = Vf = Vj × Nj/(Volume Sum) | Component Solubility Parameter = Ec,j0.5 × Vf (J/cm3)0.5 |
|---|
| -CH2- | 4940 | 16.1 | 2 | 306.8 | 32.2 | 0.11 | 2.0 |
| -O- | 3350 | 3.8 | 1 | 881.6 | 3.8 | 0.01 | 0.4 |
| phenylene (tetrasubstituted) | 31,940 | 14.4 | 2 | 2218.1 | 28.8 | 0.10 | 4.8 |
| phenylene | 31,940 | 52.4 | 1 | 609.5 | 52.4 | 0.18 | 4.6 |
| -CF2- | 4270 | 23 | 1 | 185.6 | 23 | 0.08 | 1.1 |
| F- (trisubstituted) | 2300 | 22 | 3 | 104.5 | 66 | 0.24 | 2.4 |
| F- (disubstituted) | 3560 | 20 | 2 | 178 | 40 | 0.14 | 1.9 |
| CH3- | 4710 | 33.5 | 1 | 140.6 | 33.5 | 0.12 | 1.4 |
| | | | | | Volume sum = 279.7 | | Solubility parameter sum δ = 18.6 |
Table 9.
Solubility parameters of RM and LC materials used in the experiments.
Table 9.
Solubility parameters of RM and LC materials used in the experiments.
| Materials | RM257 | Bis-MA | E7 | ZLI-4792 |
|---|
| Solubility parameters (J/cm3)0.5 | 22.81 [37] | 18.35 [37] | 22.19 [38] | 17.5–18.6 |

