Molecular Dynamics Study of an Amorphous Polyethylene/Silica Interface with Shear Tests


Abstract
1. Introduction
2. Simulation Details
2.1. Model Construction
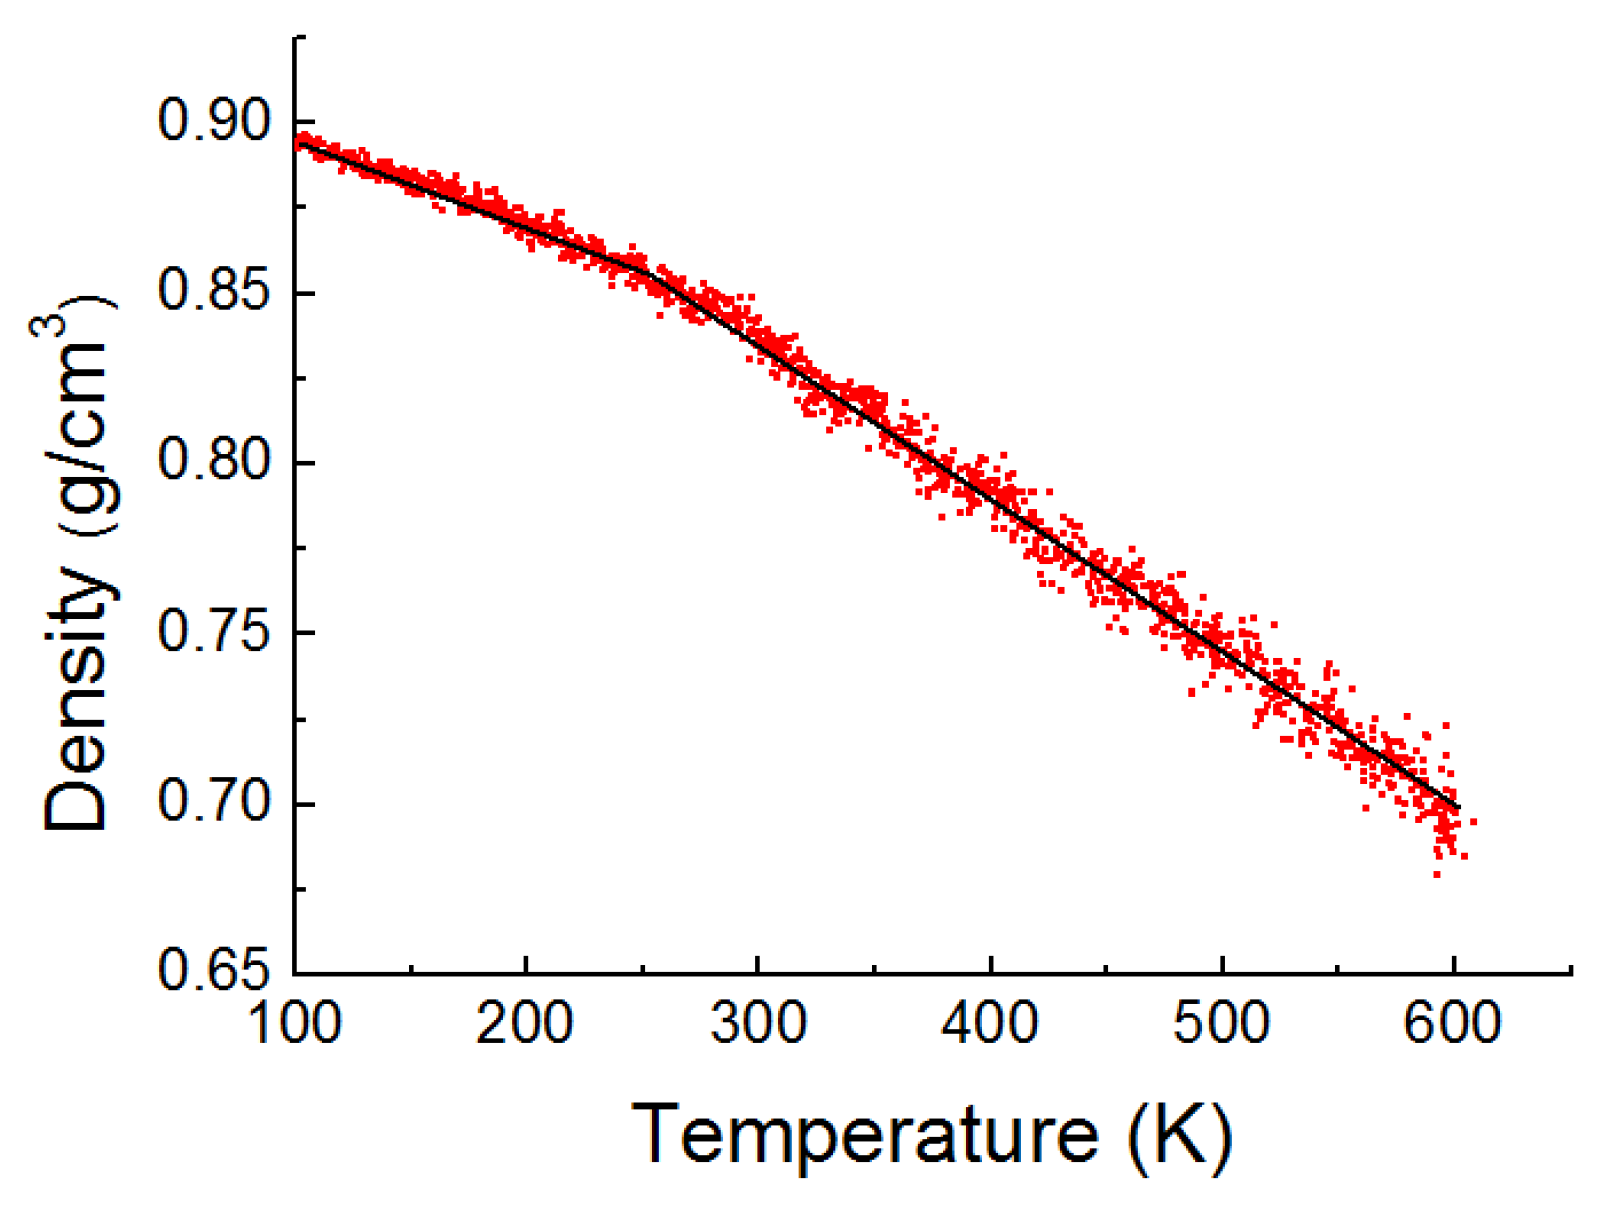
2.1.1. PE Model
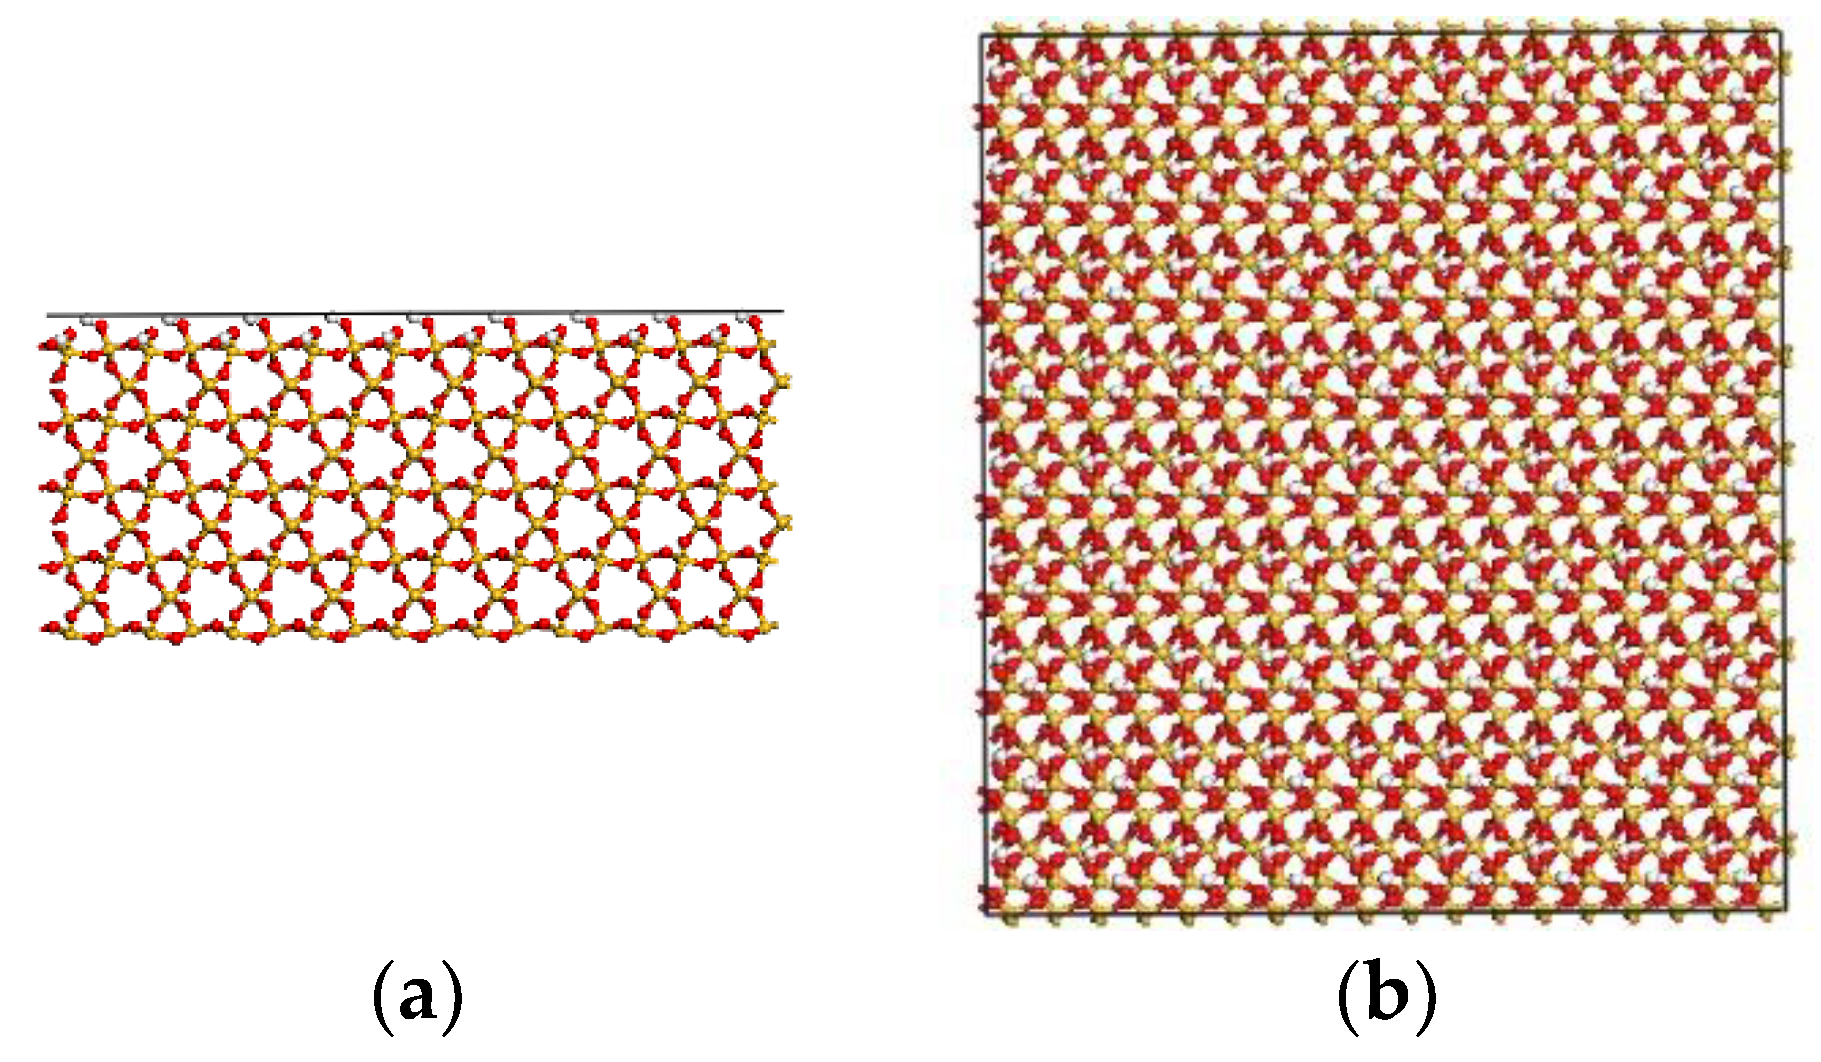
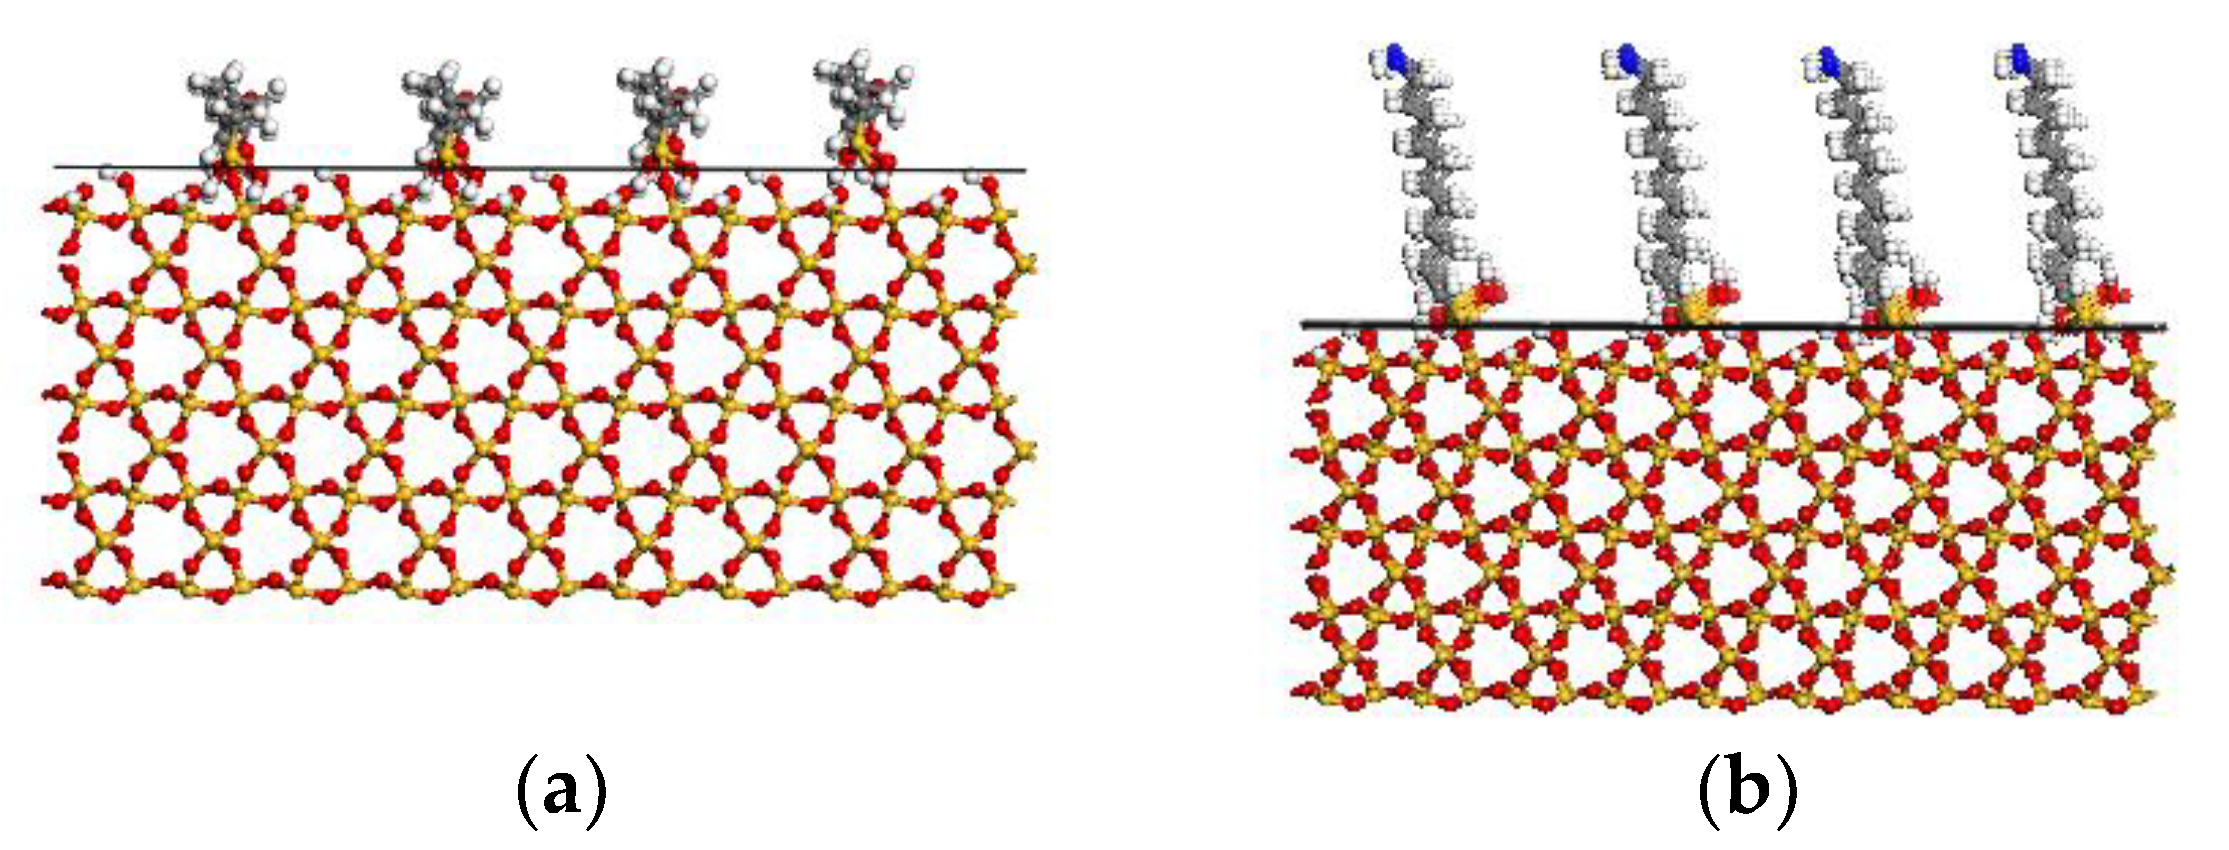
2.1.2. S Model
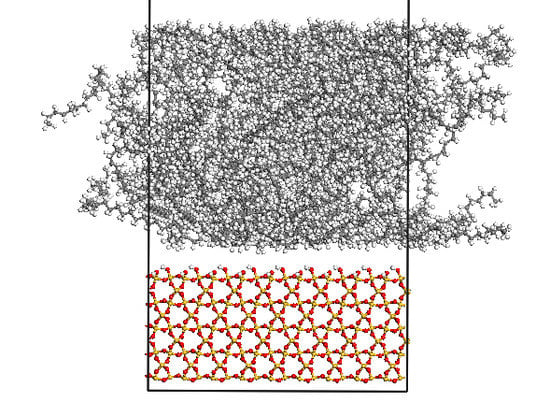
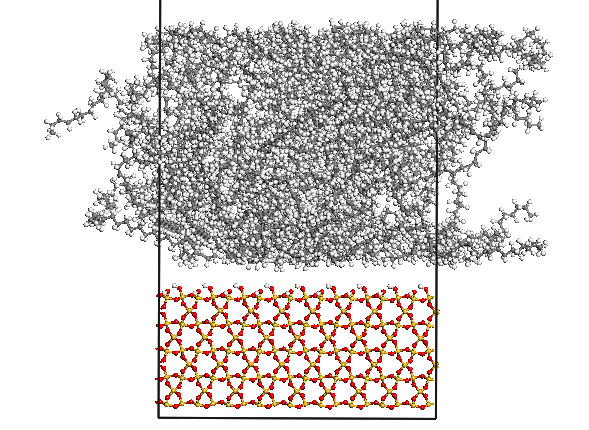
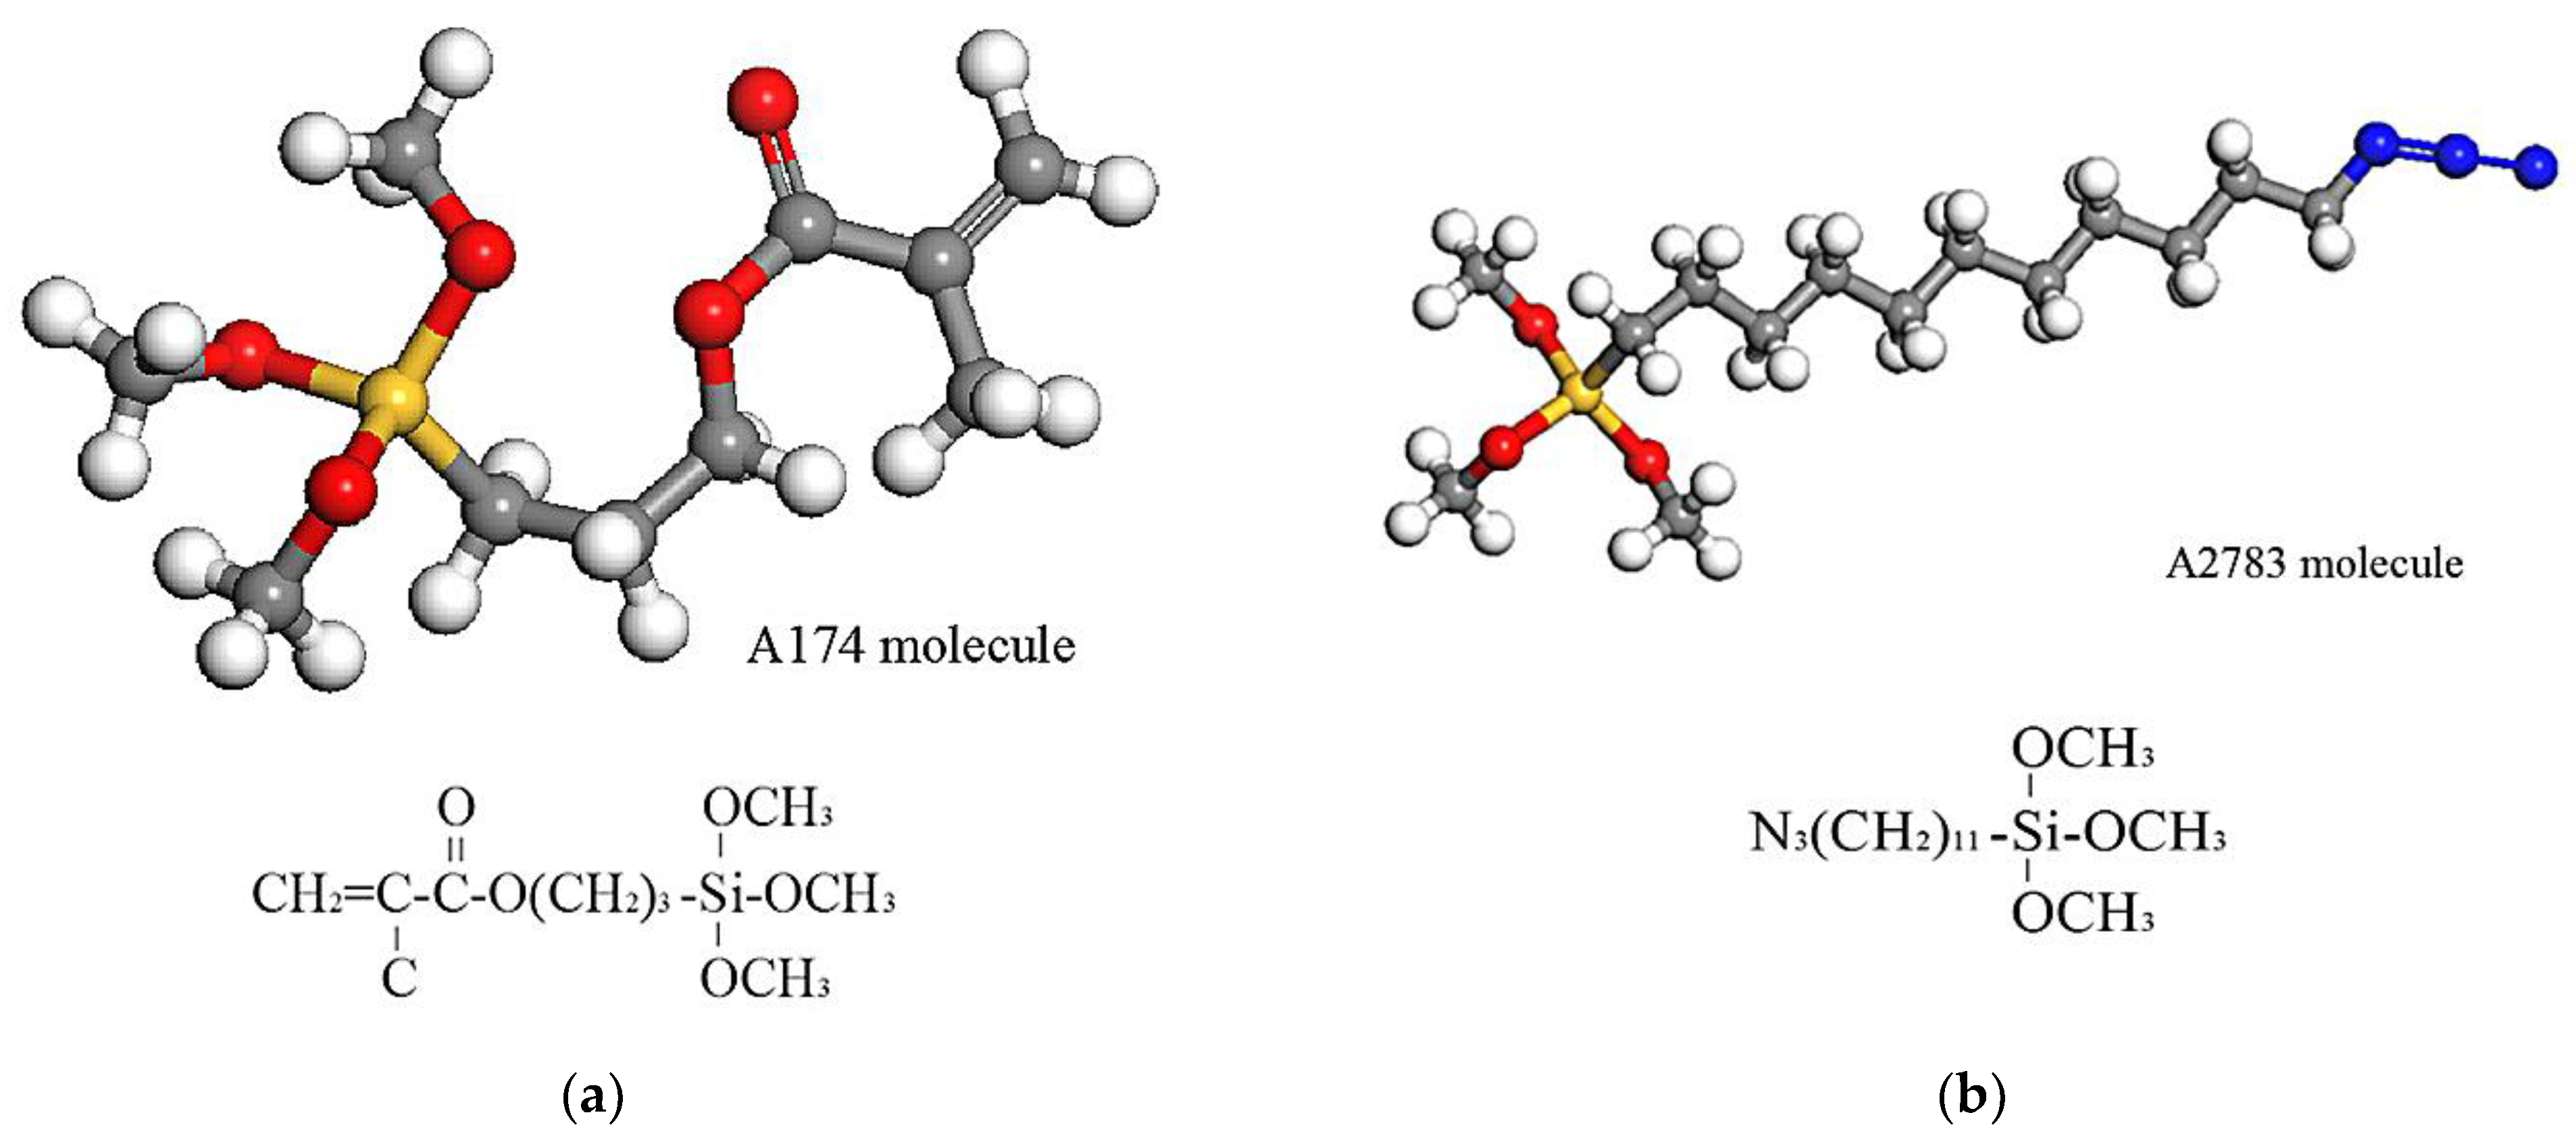
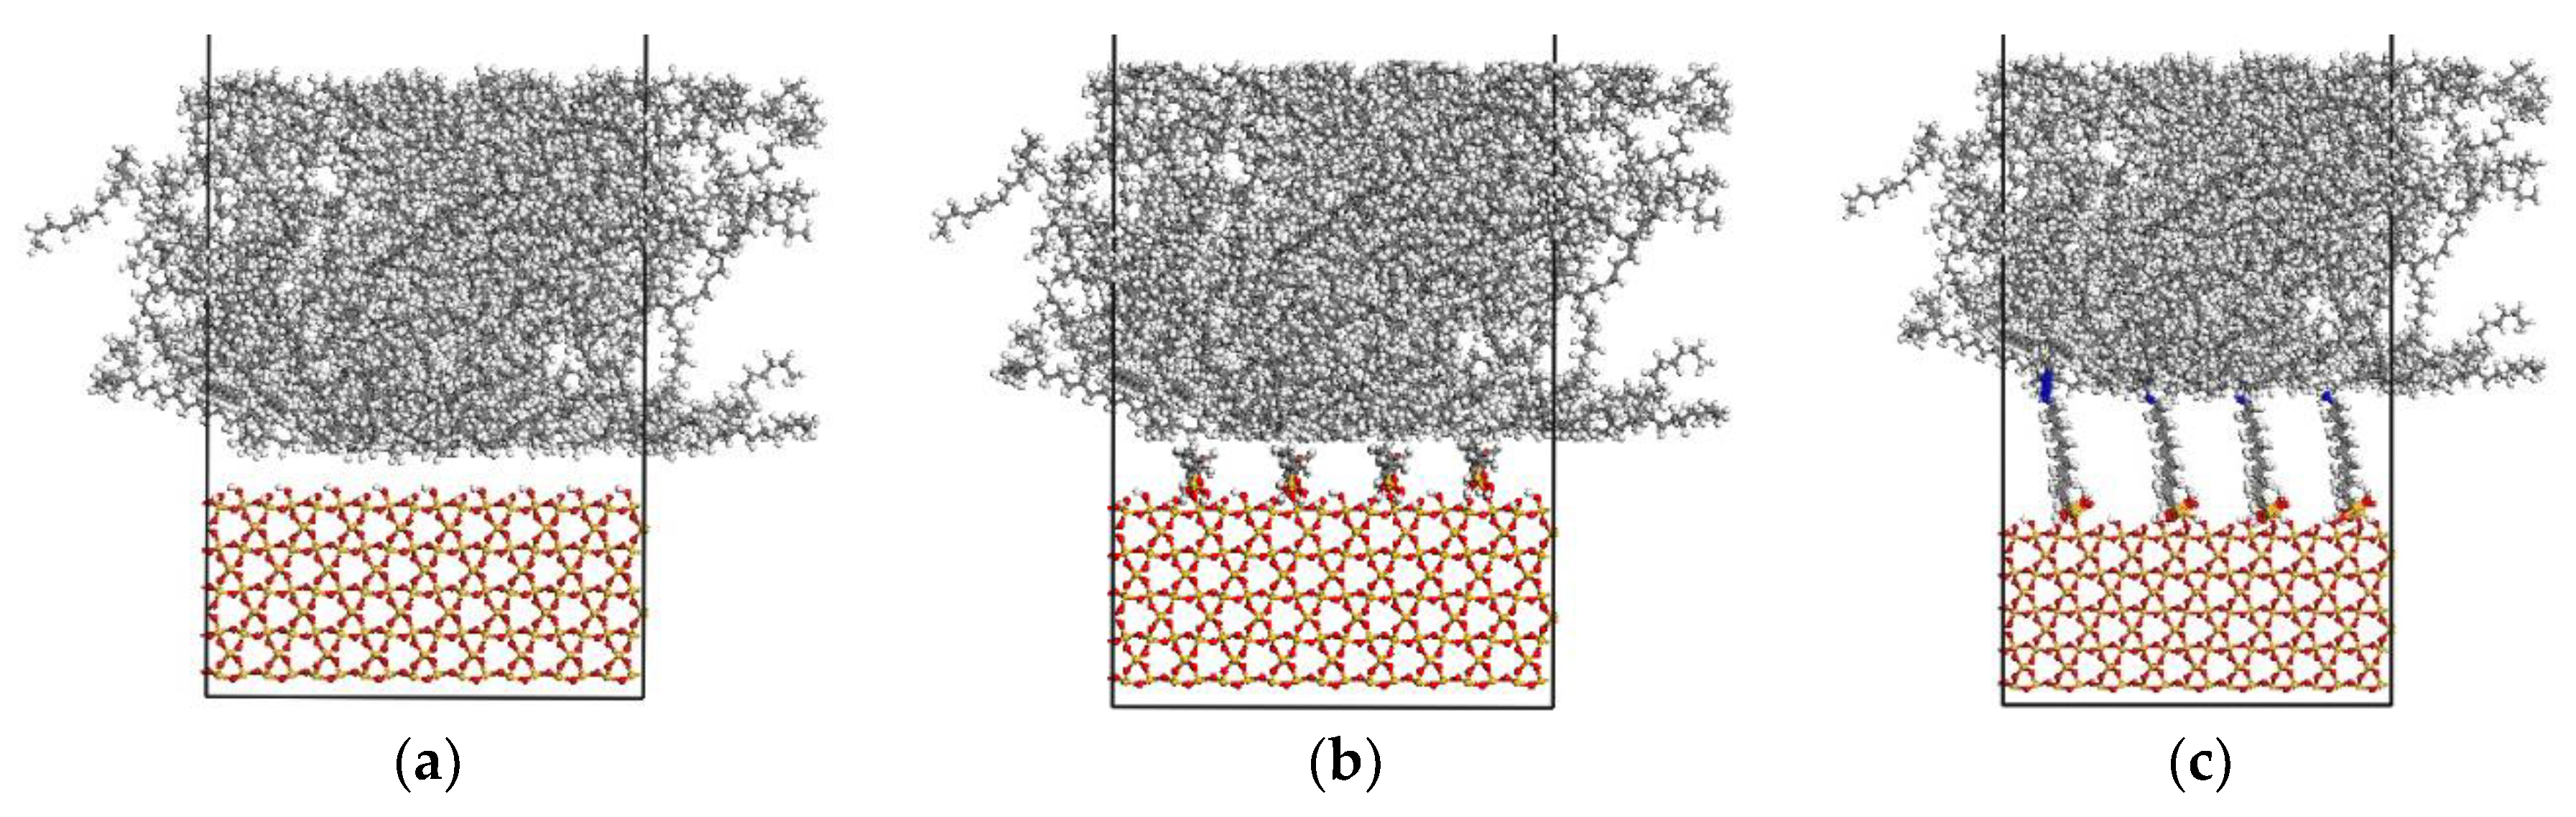
2.1.3. Interface Model
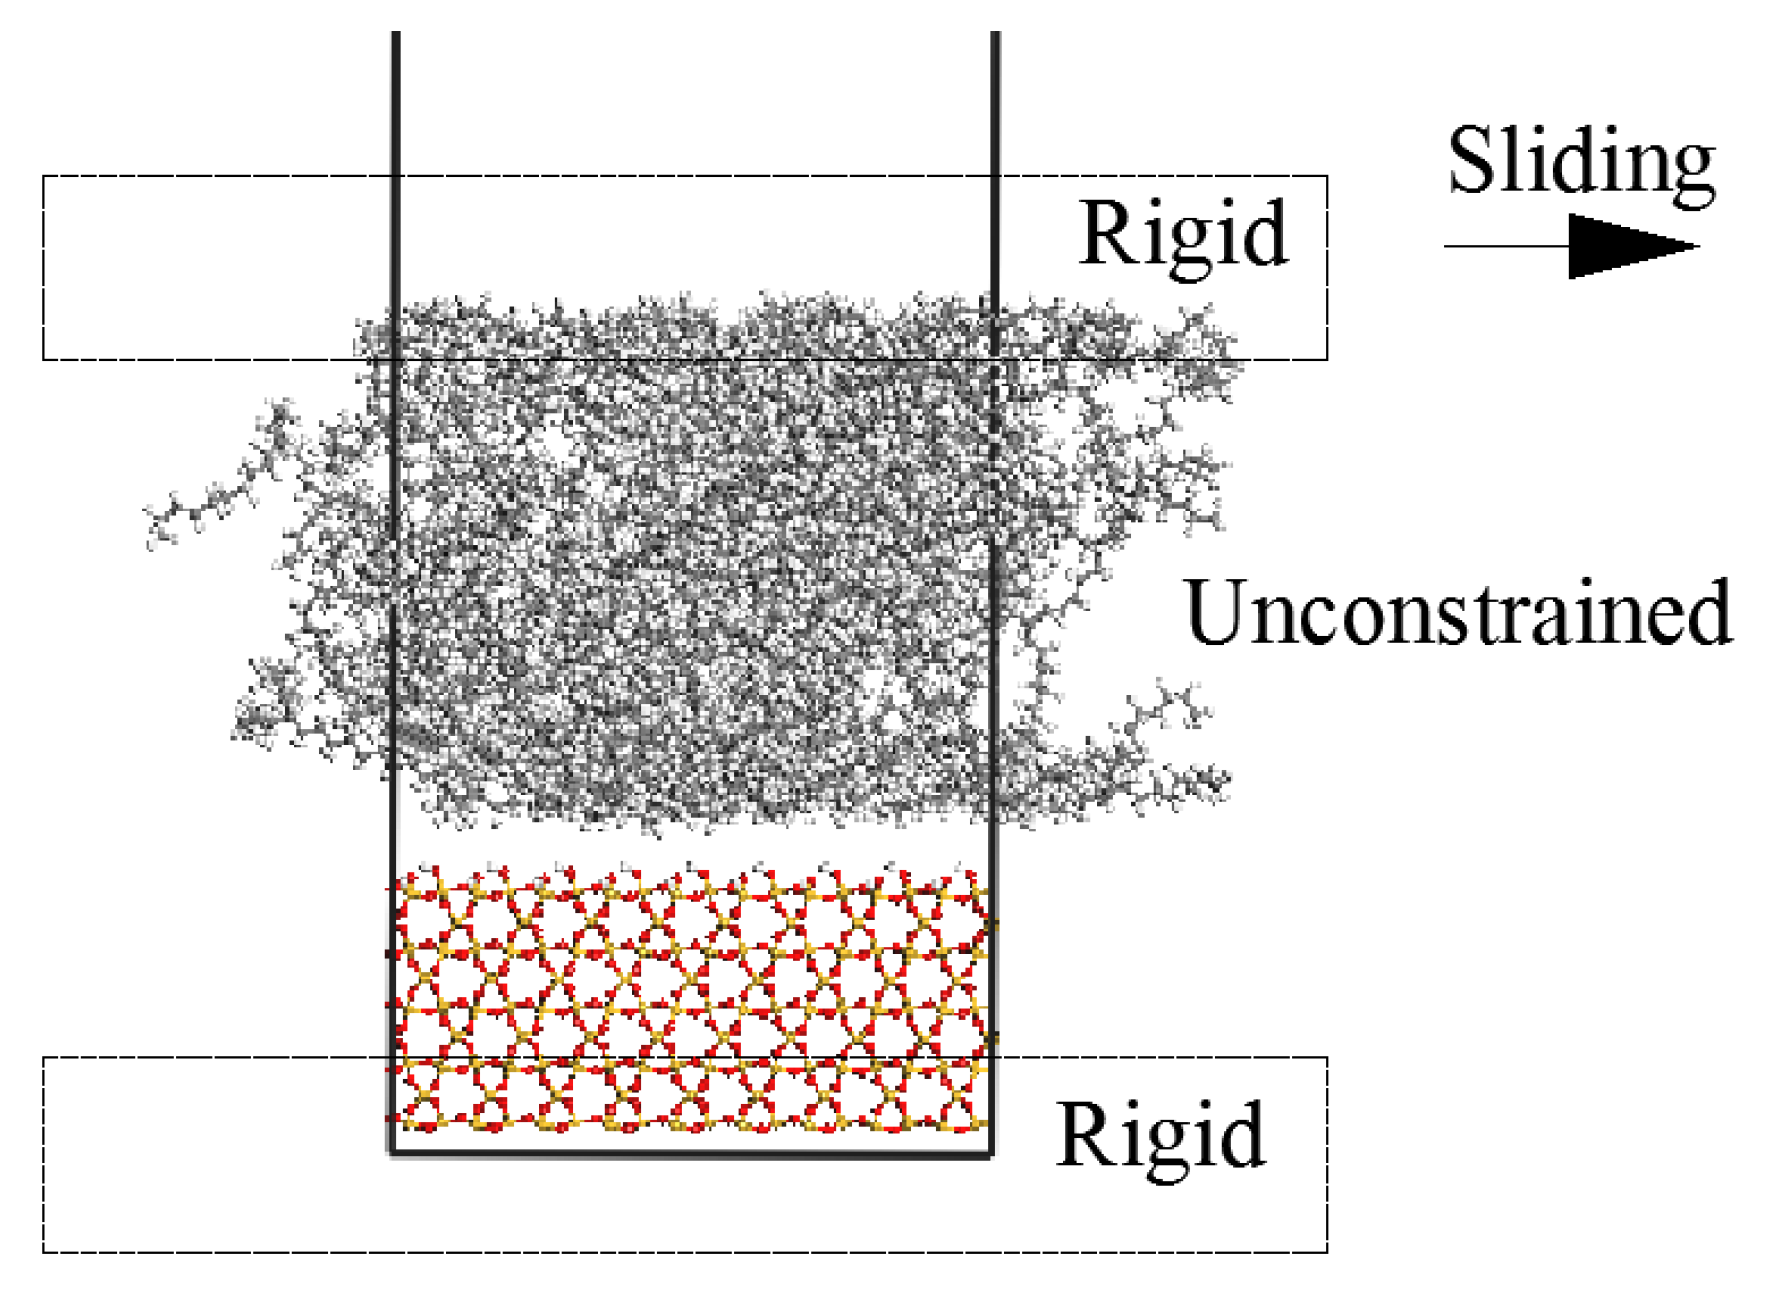
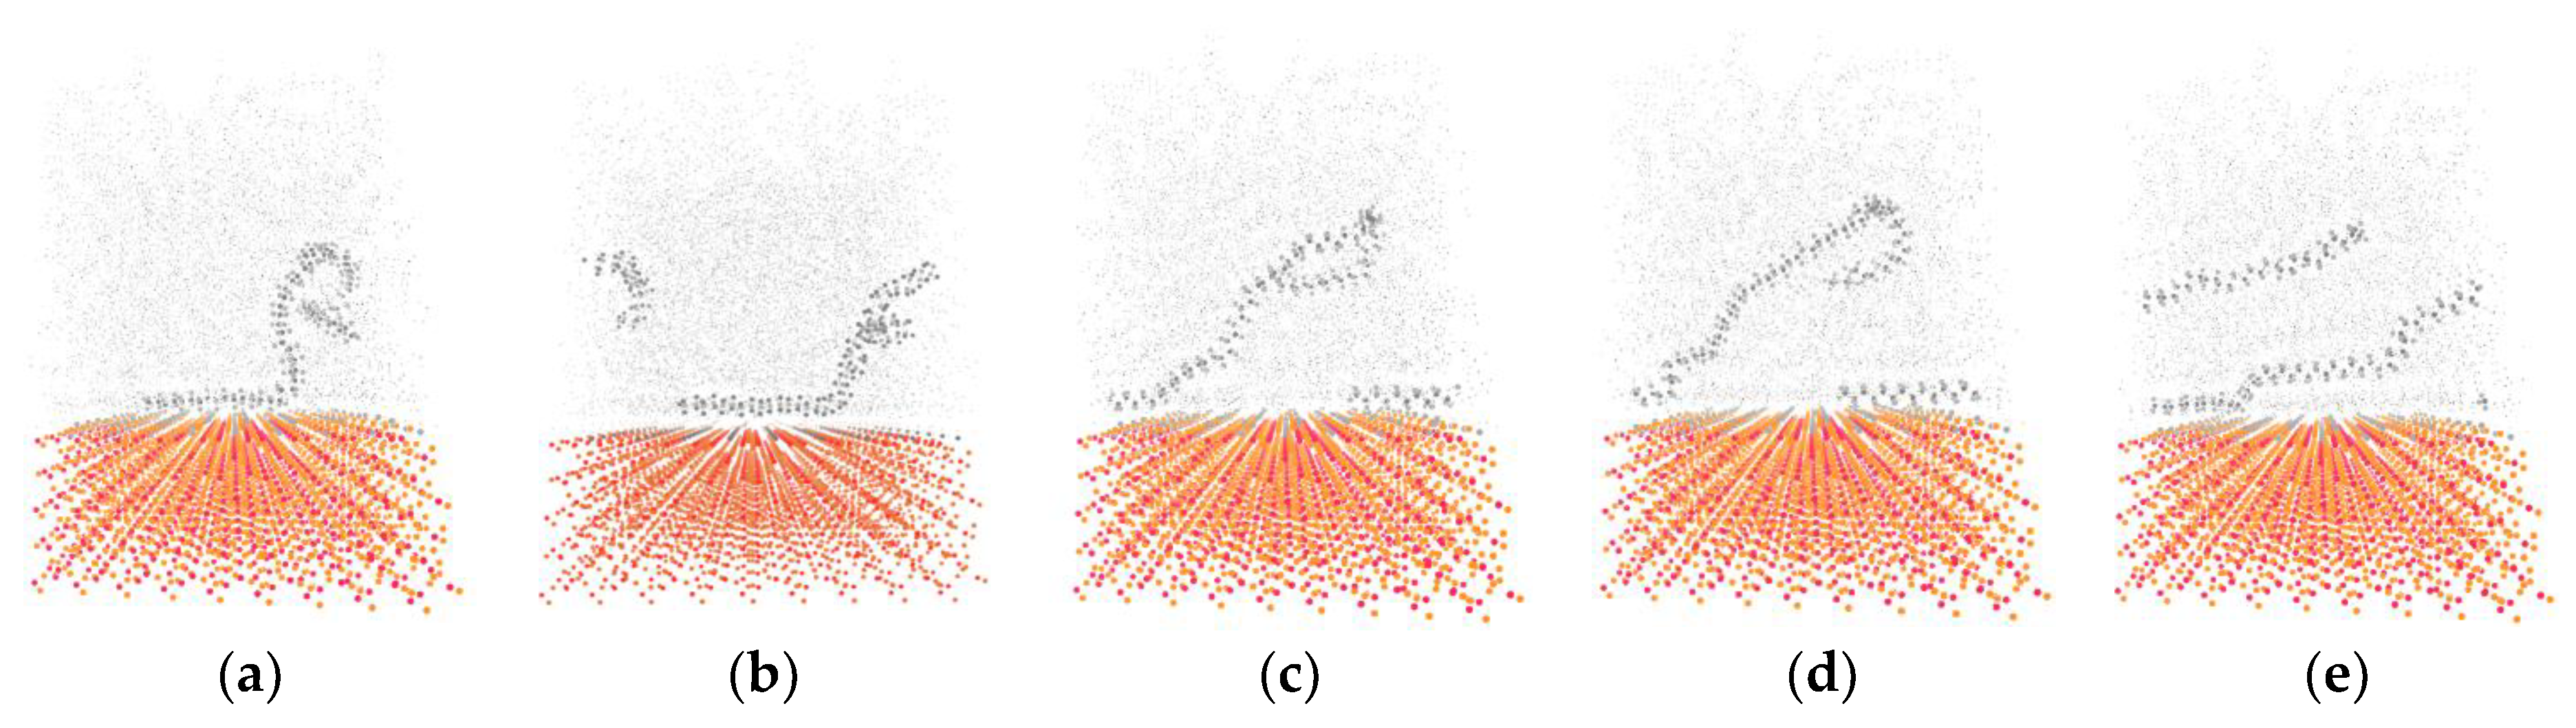
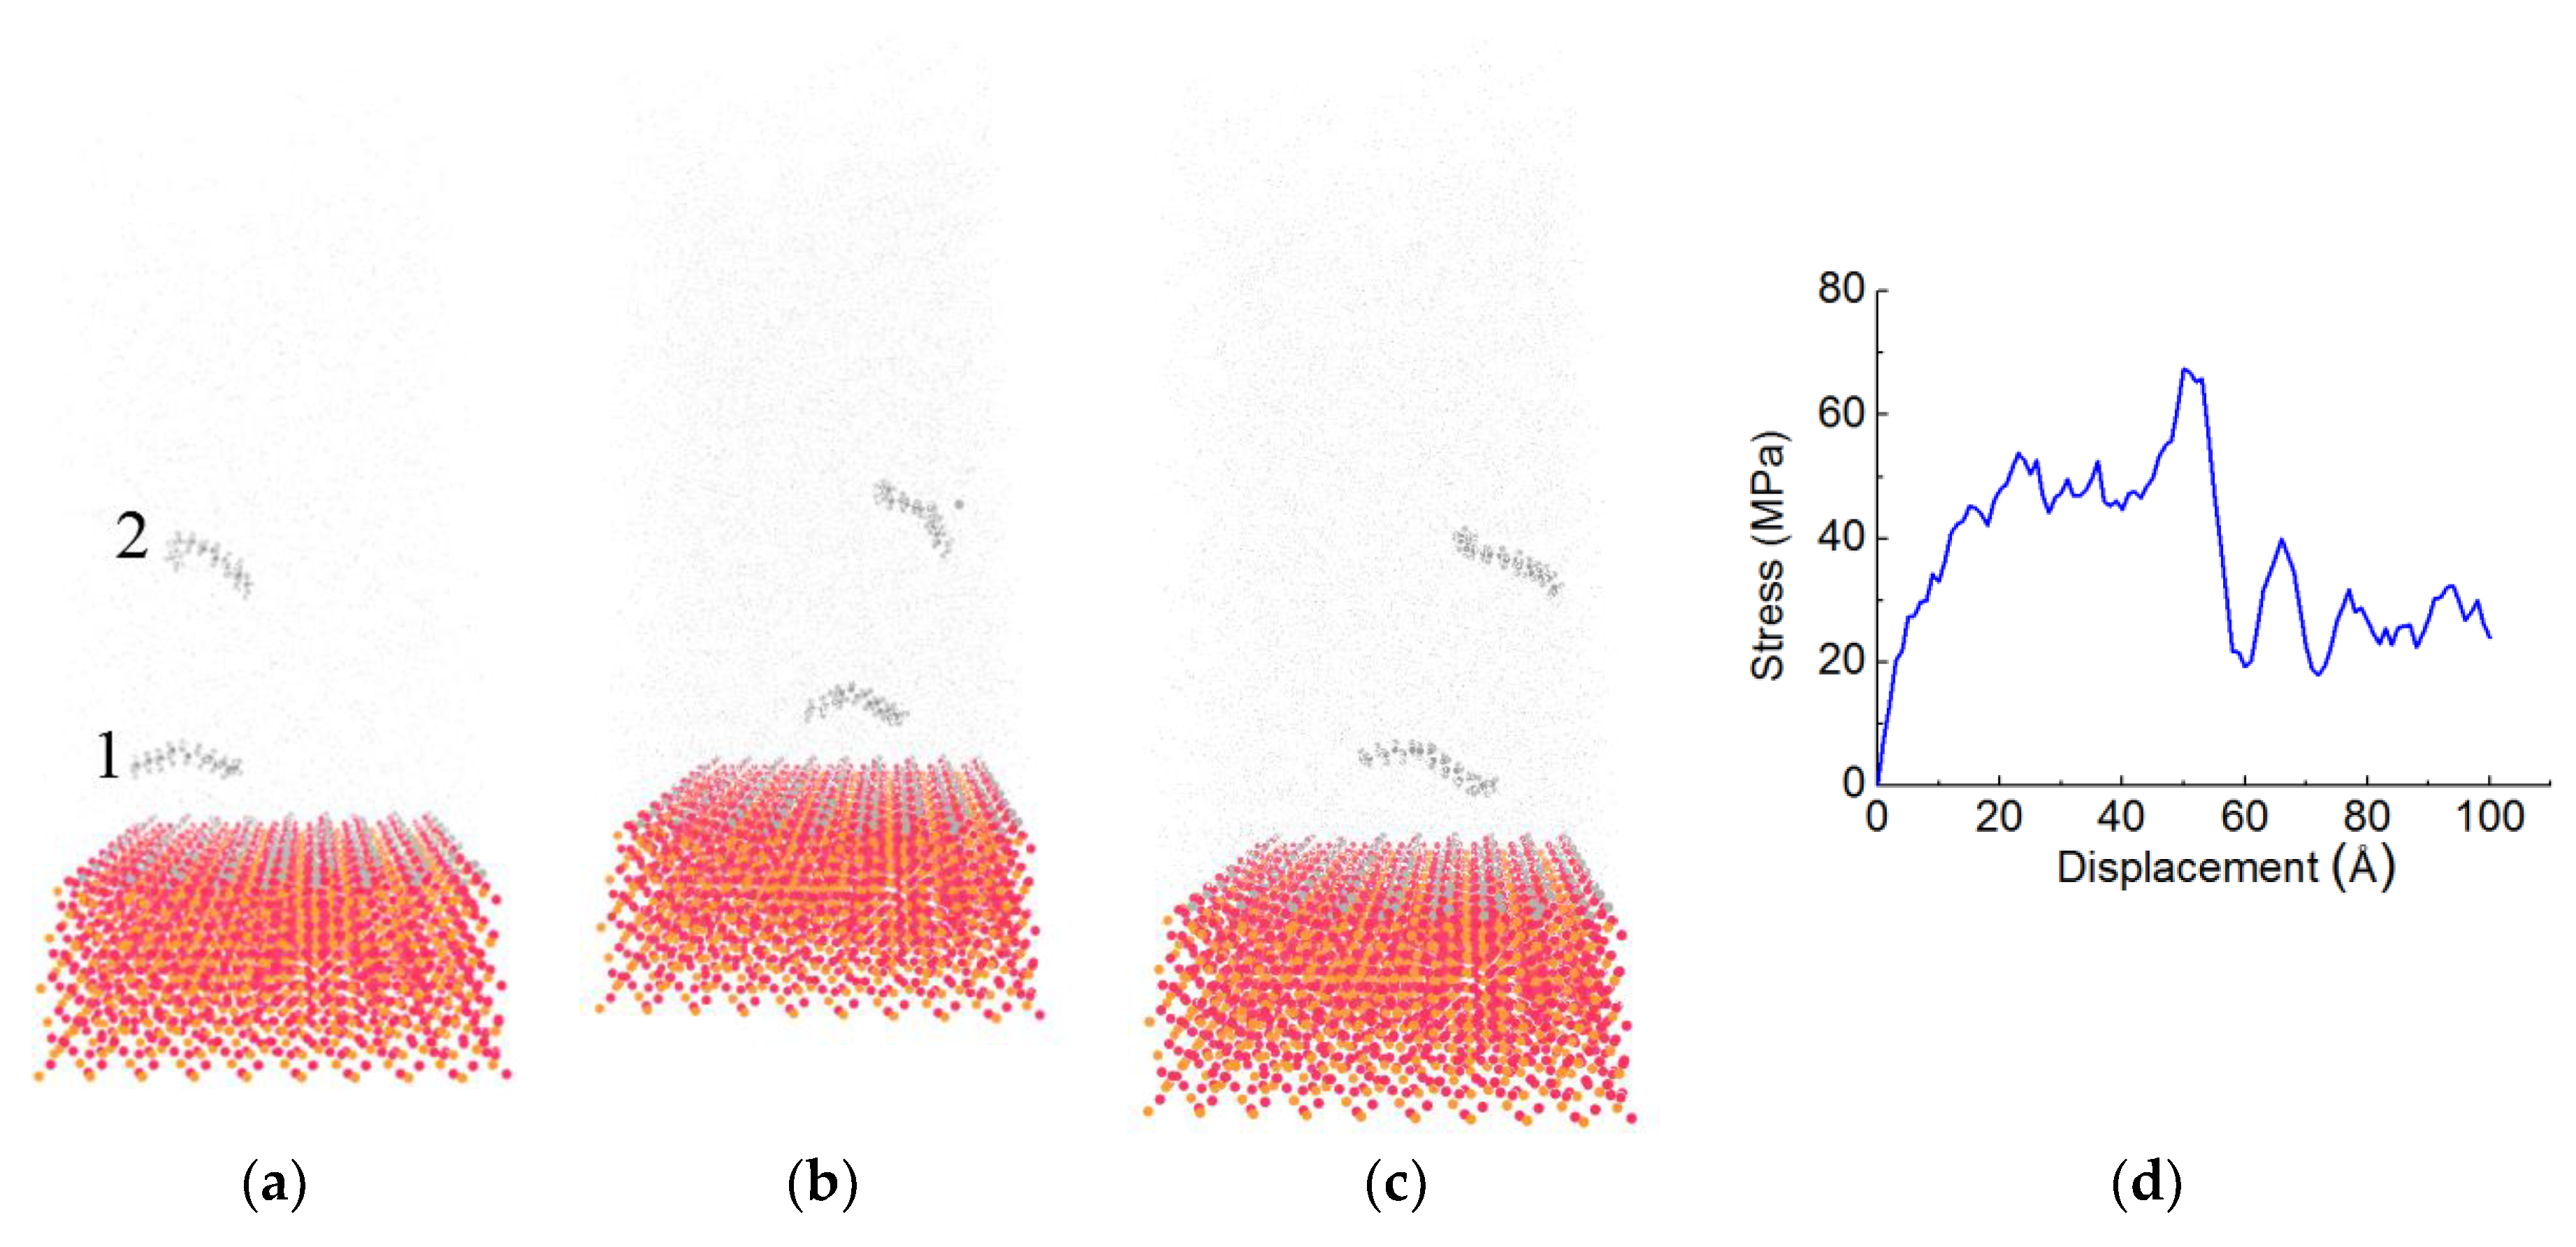
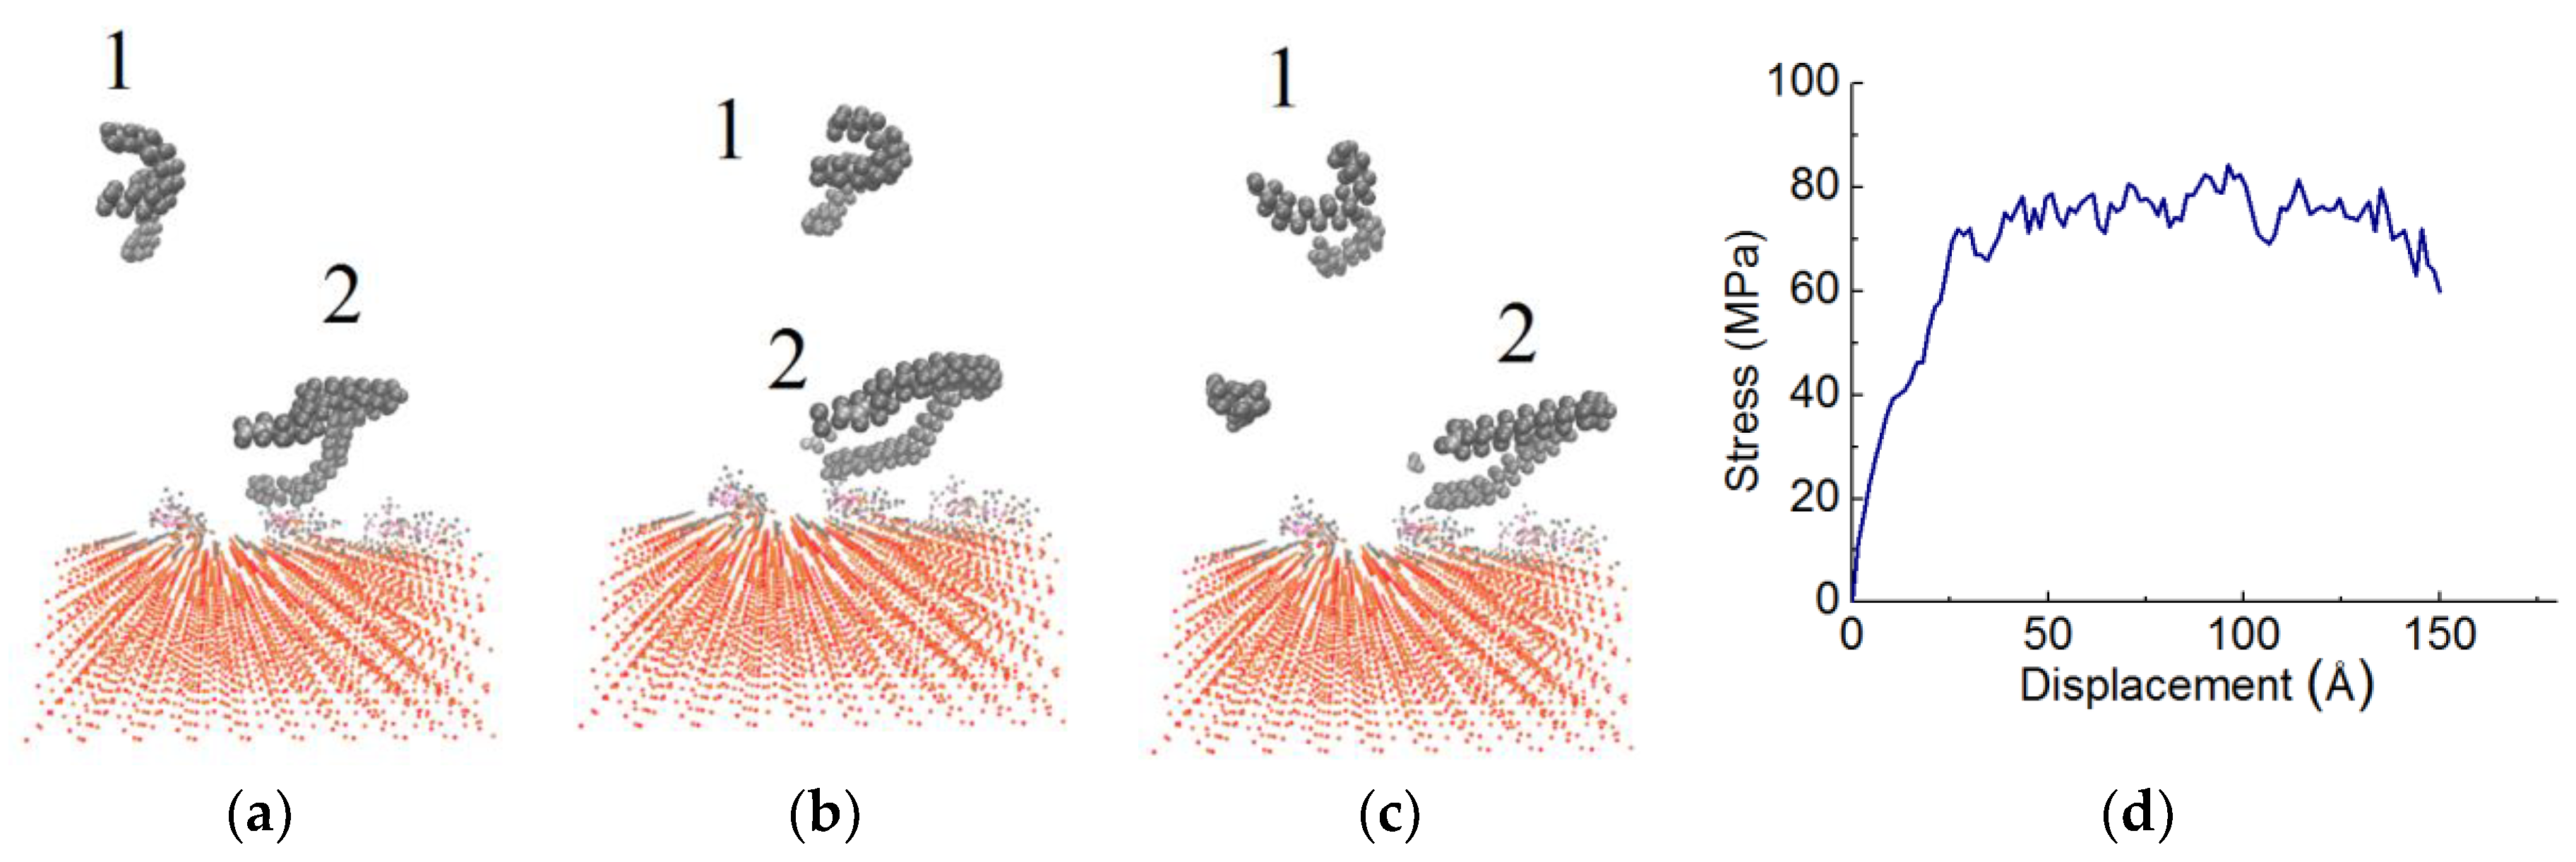
2.2. Simulation of Sliding Deformation of the Interfaces
3. Results and Discussion
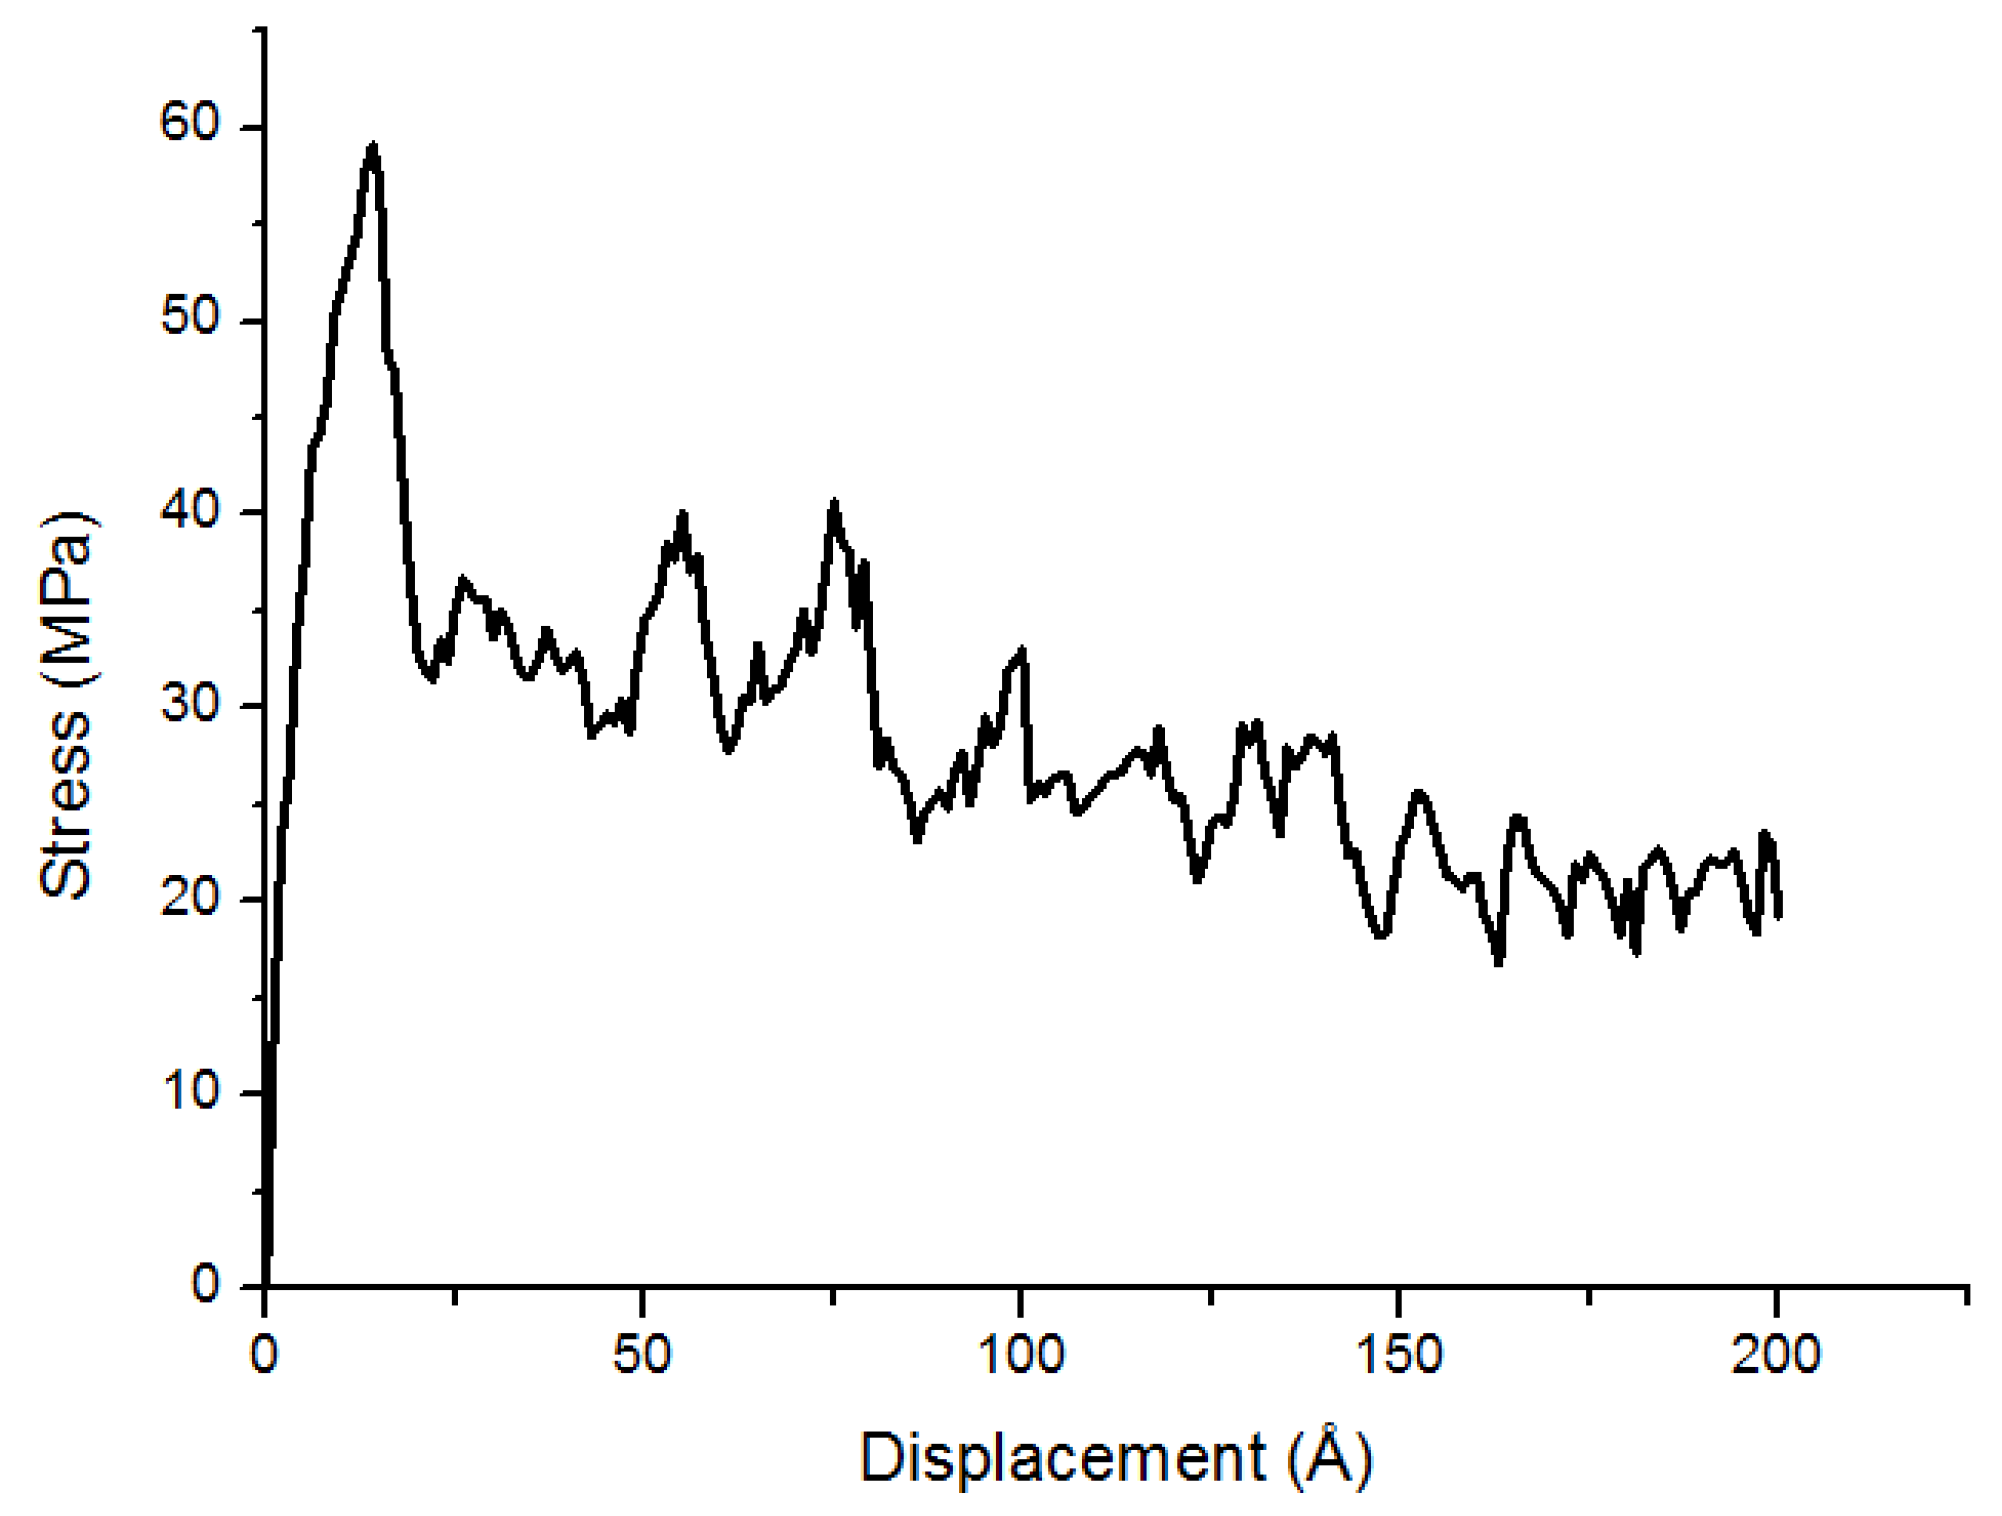
3.1. Stress-Displacement Behavior
3.2. Effect of Chain Length, Number of Chains and Coupling Agents
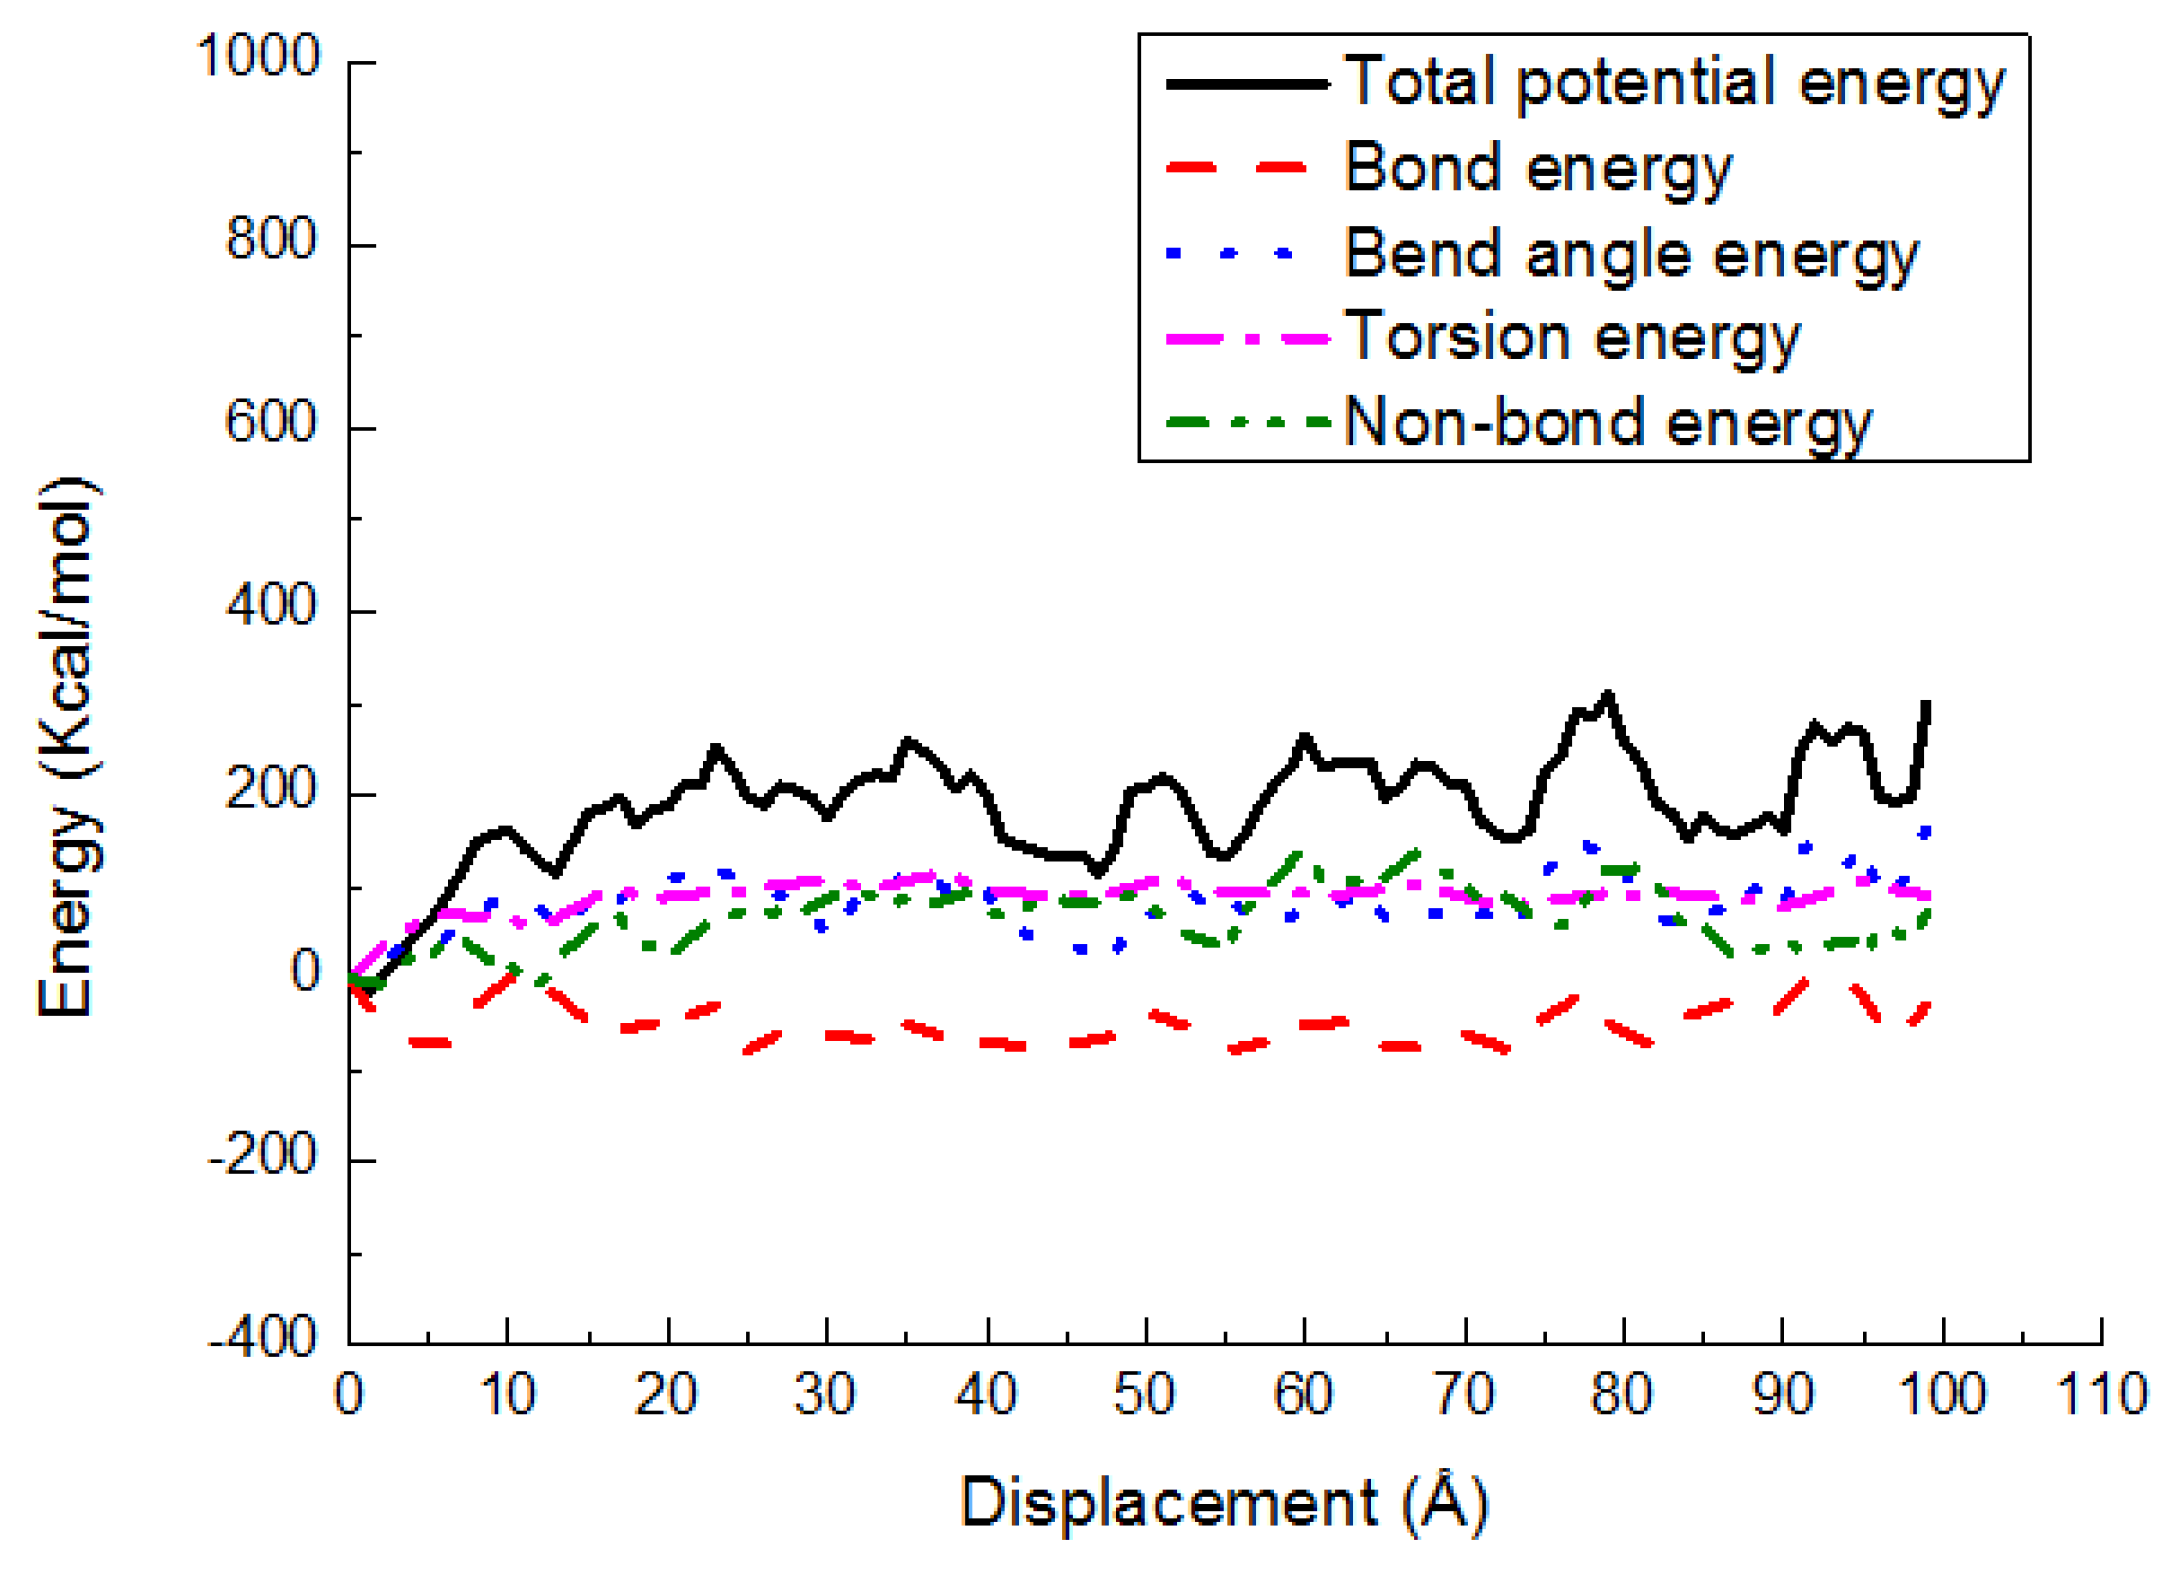
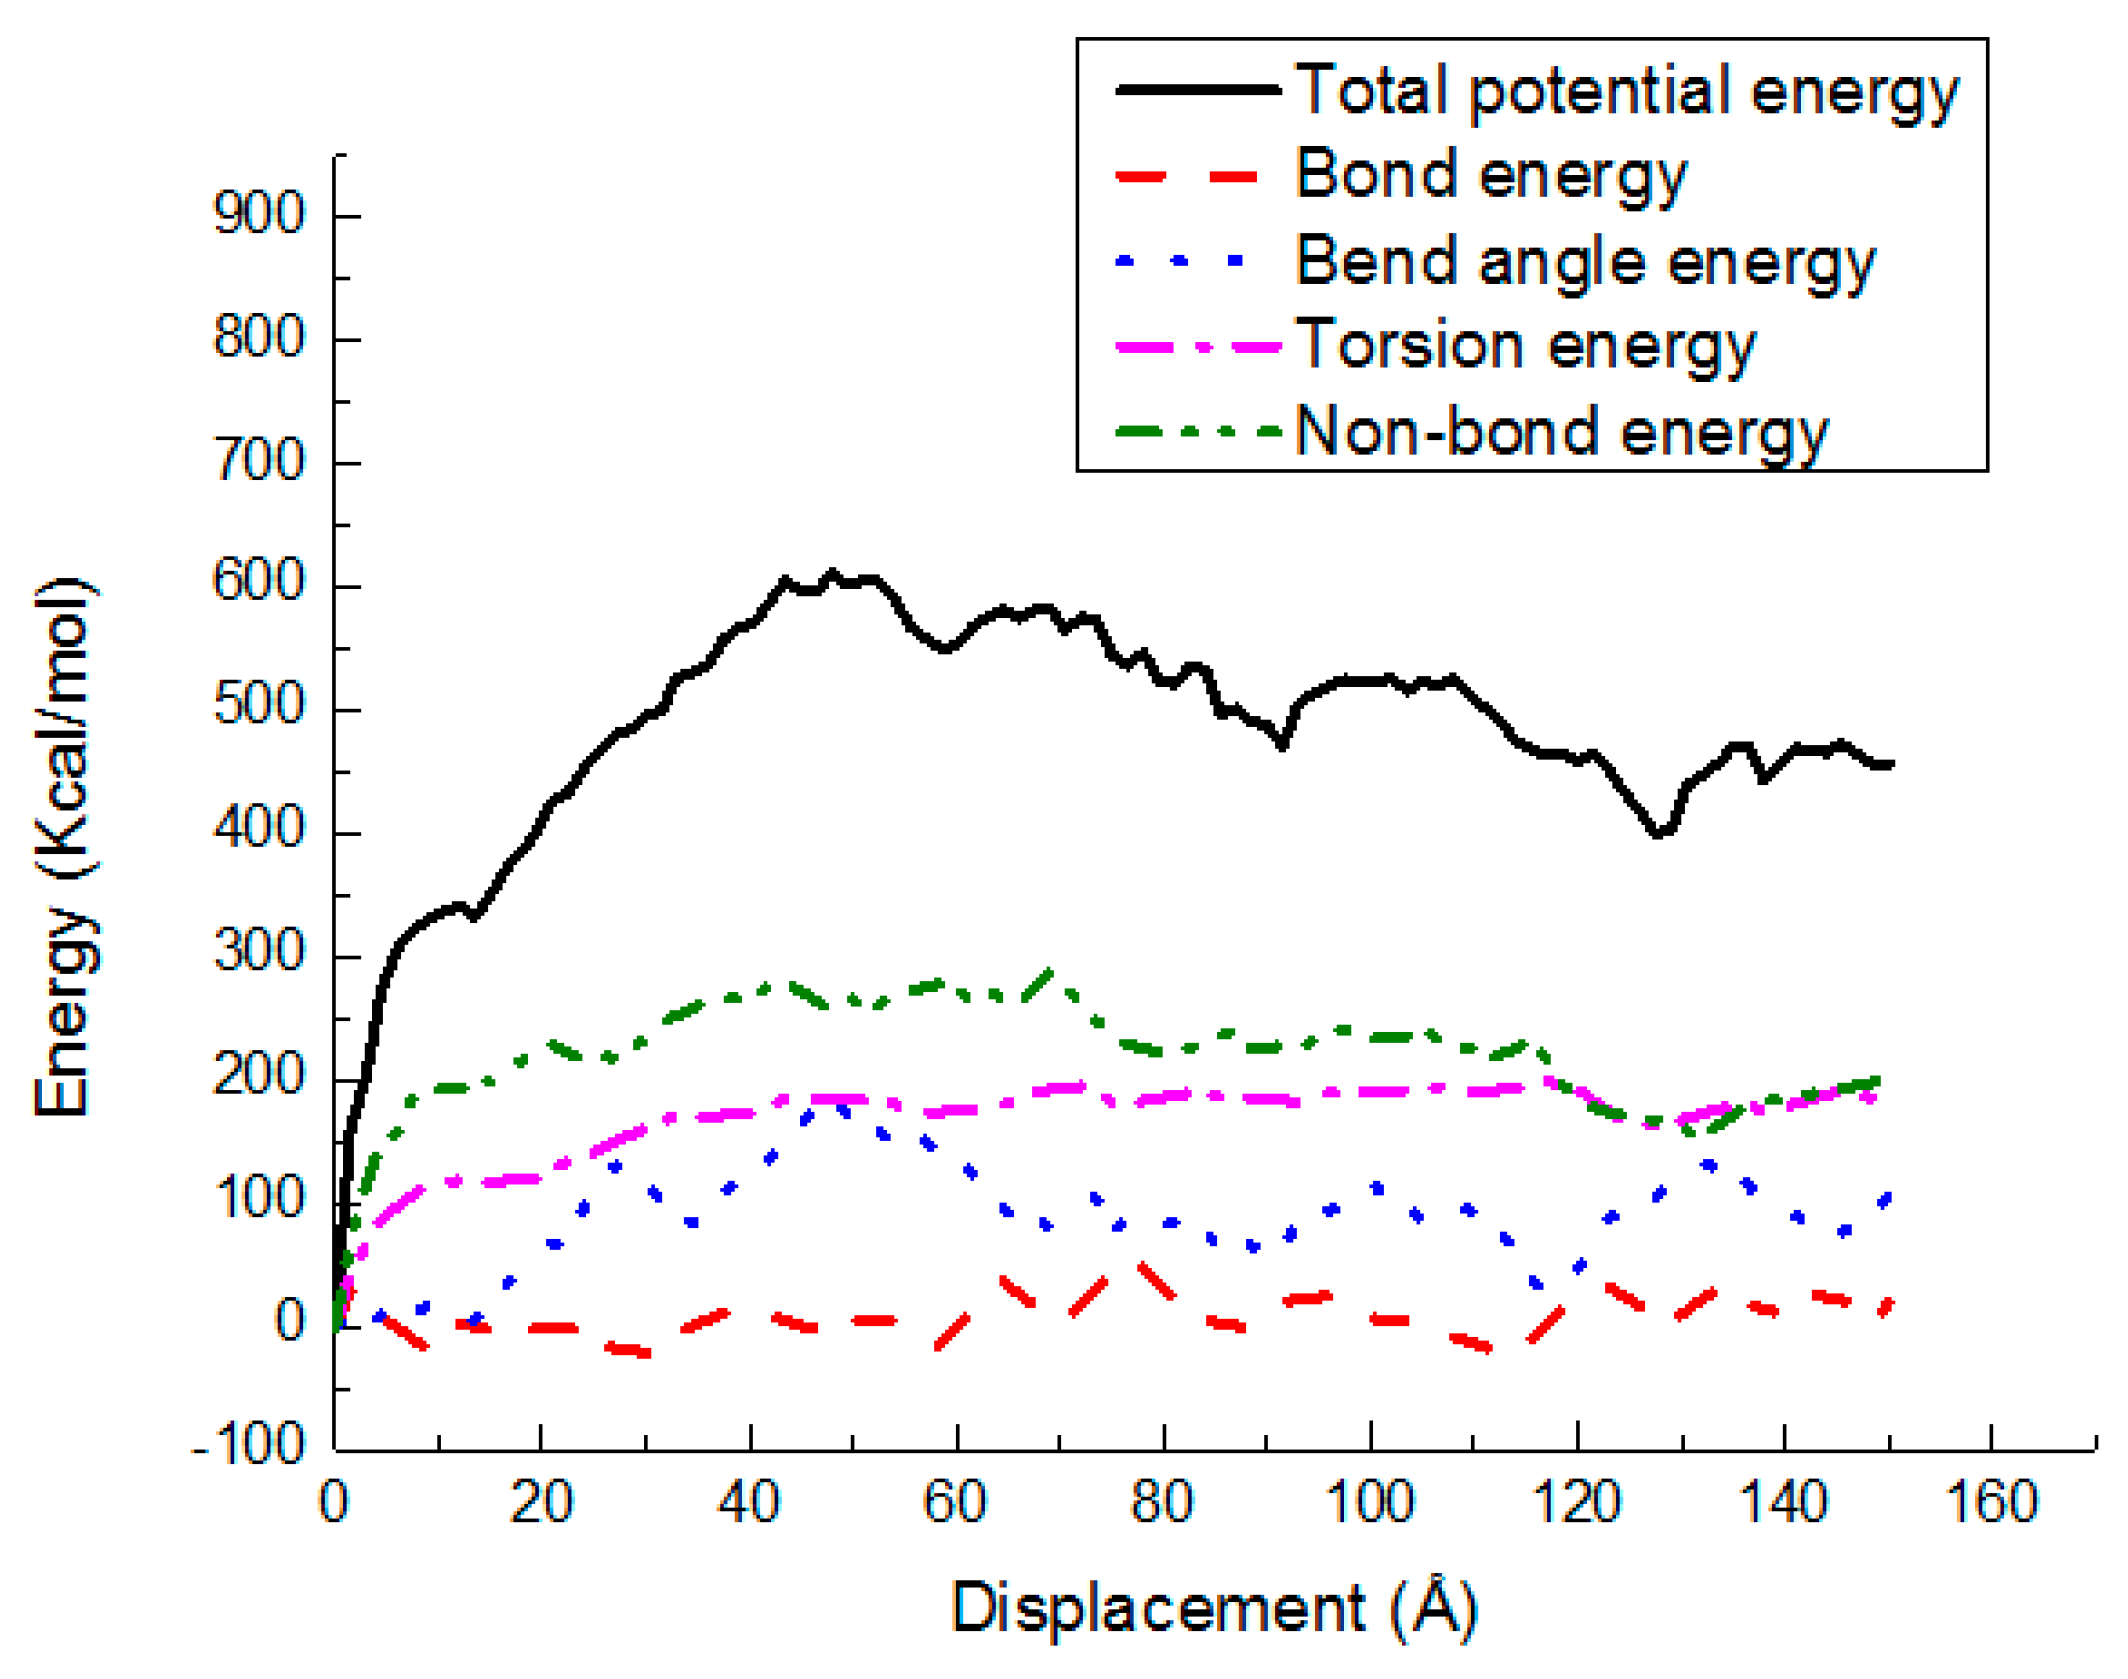
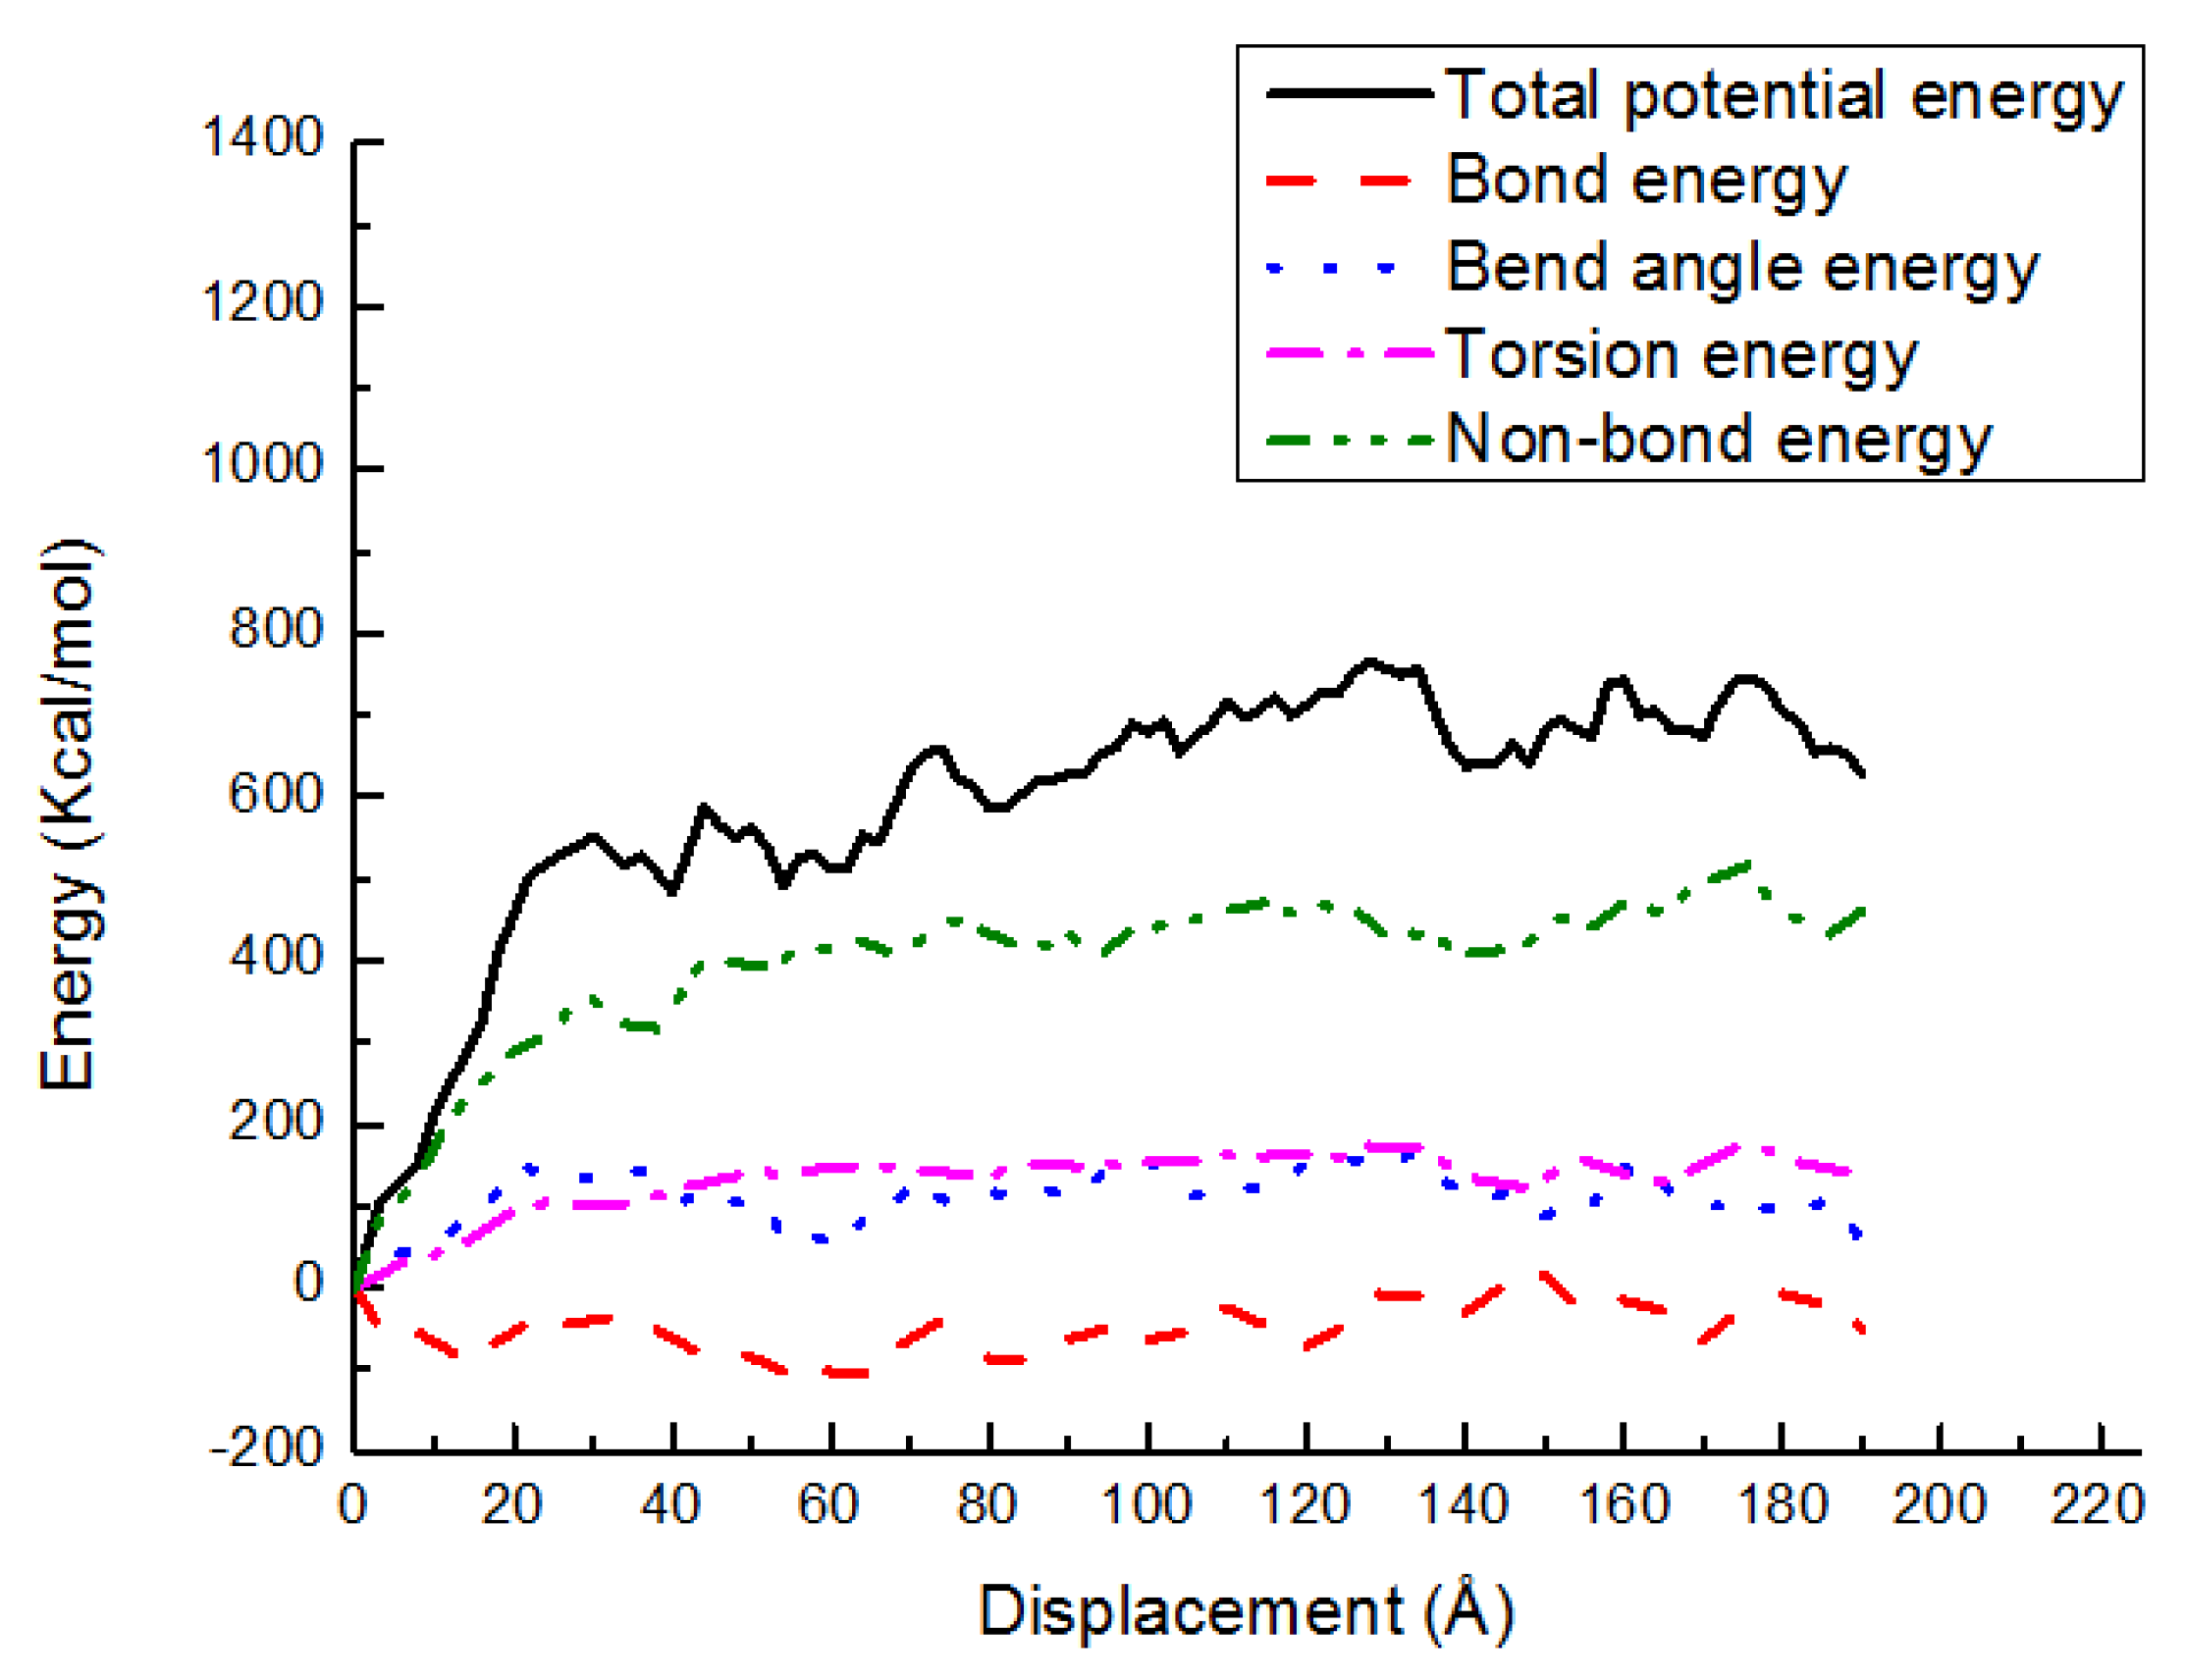
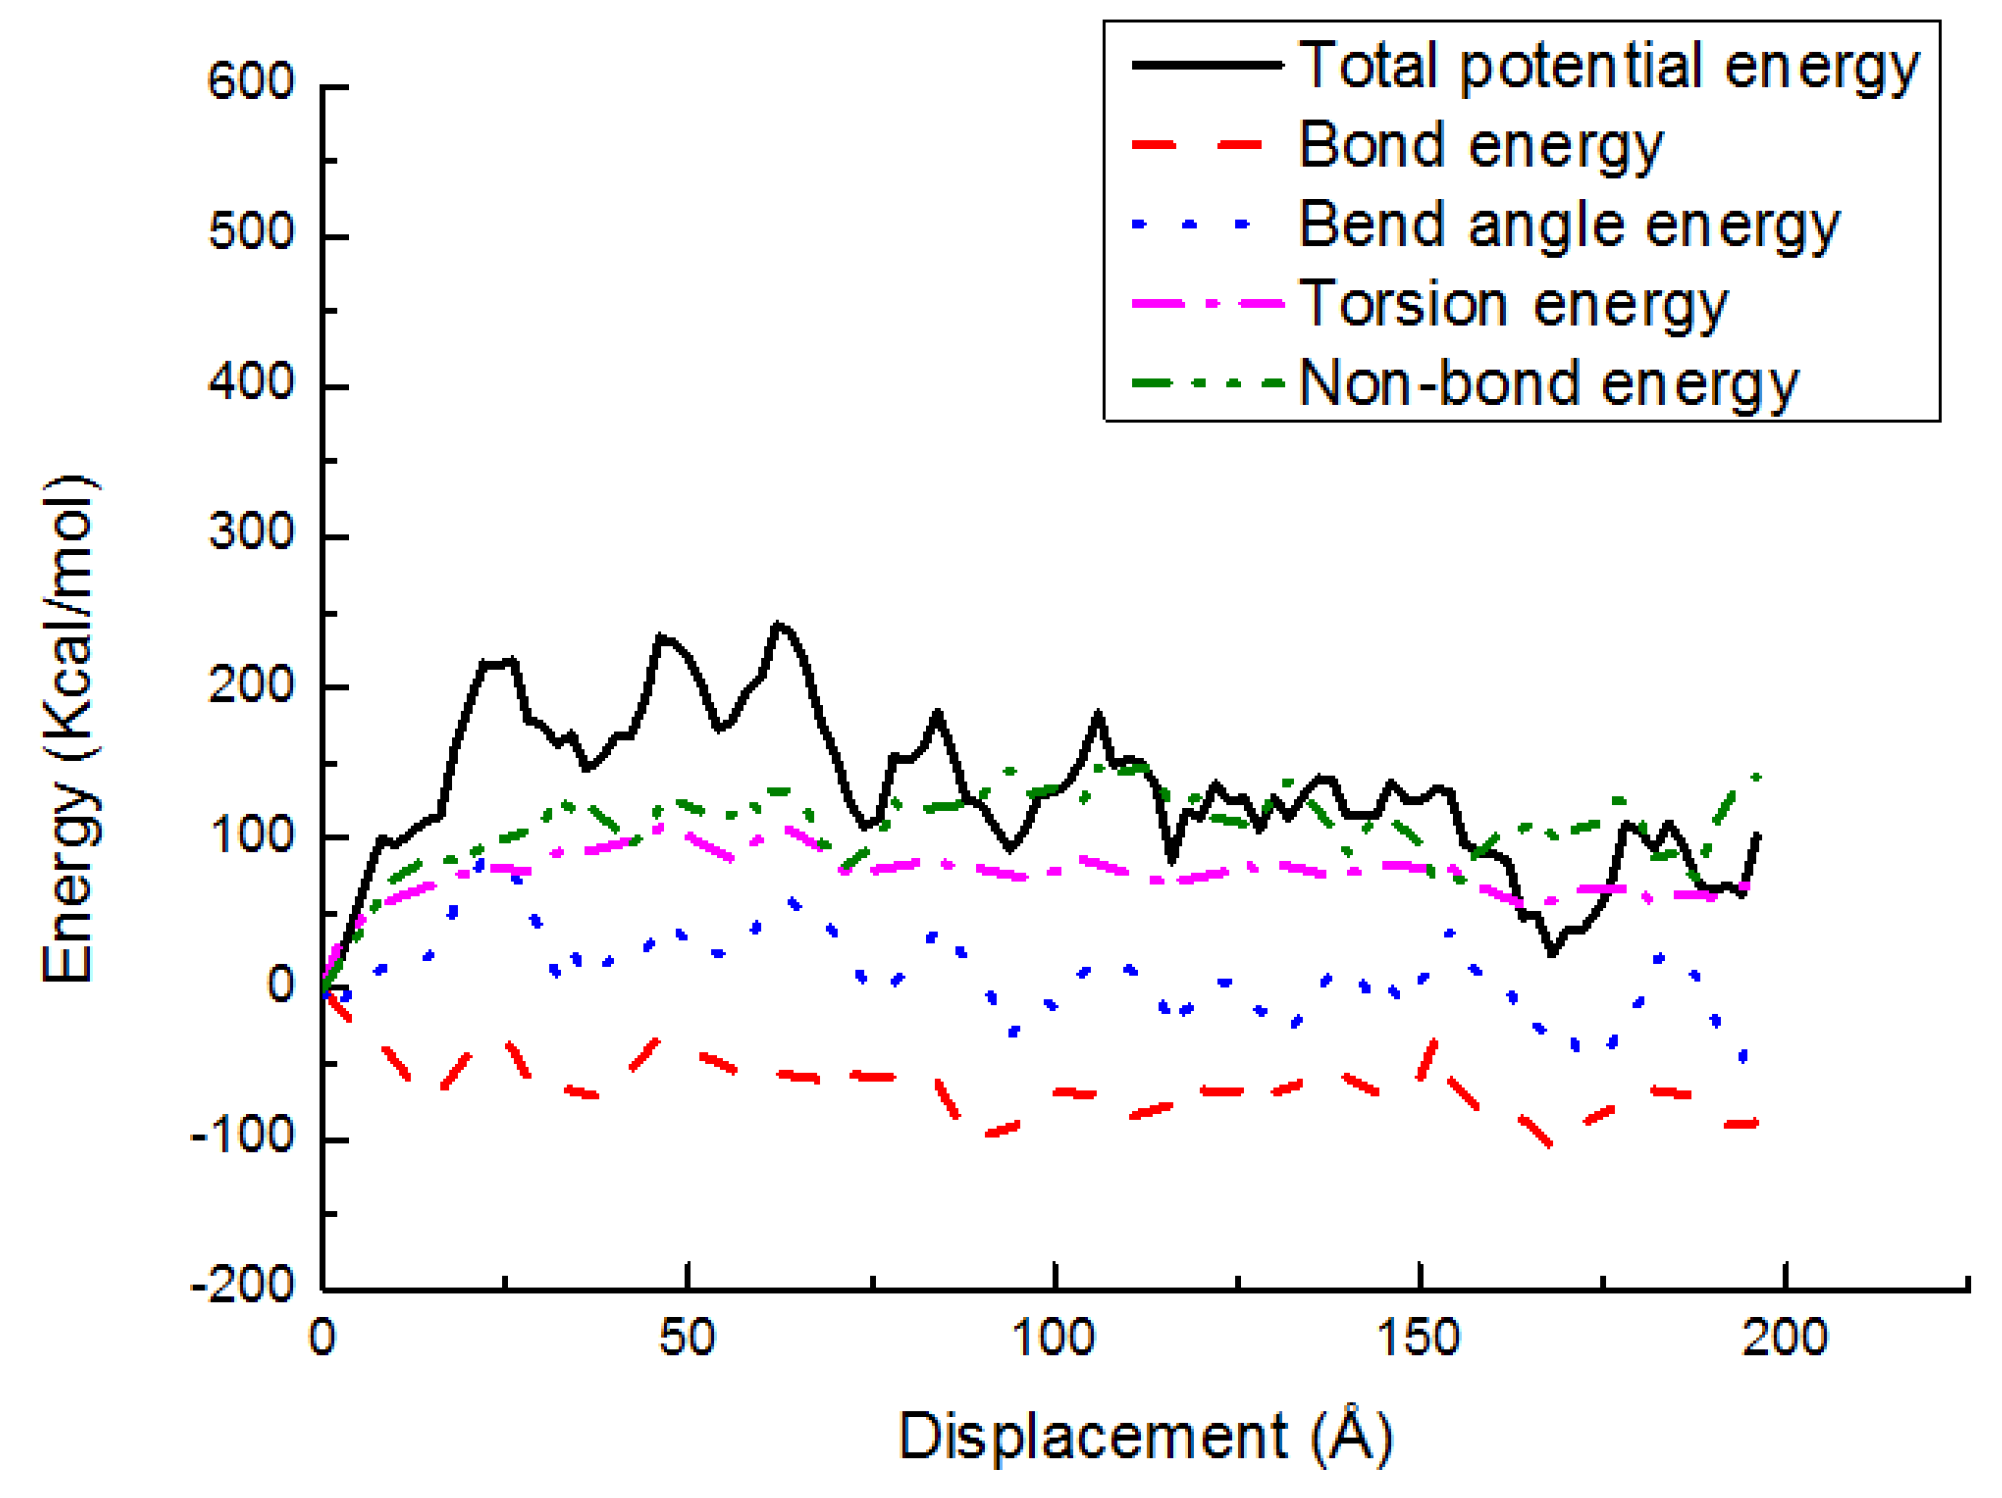
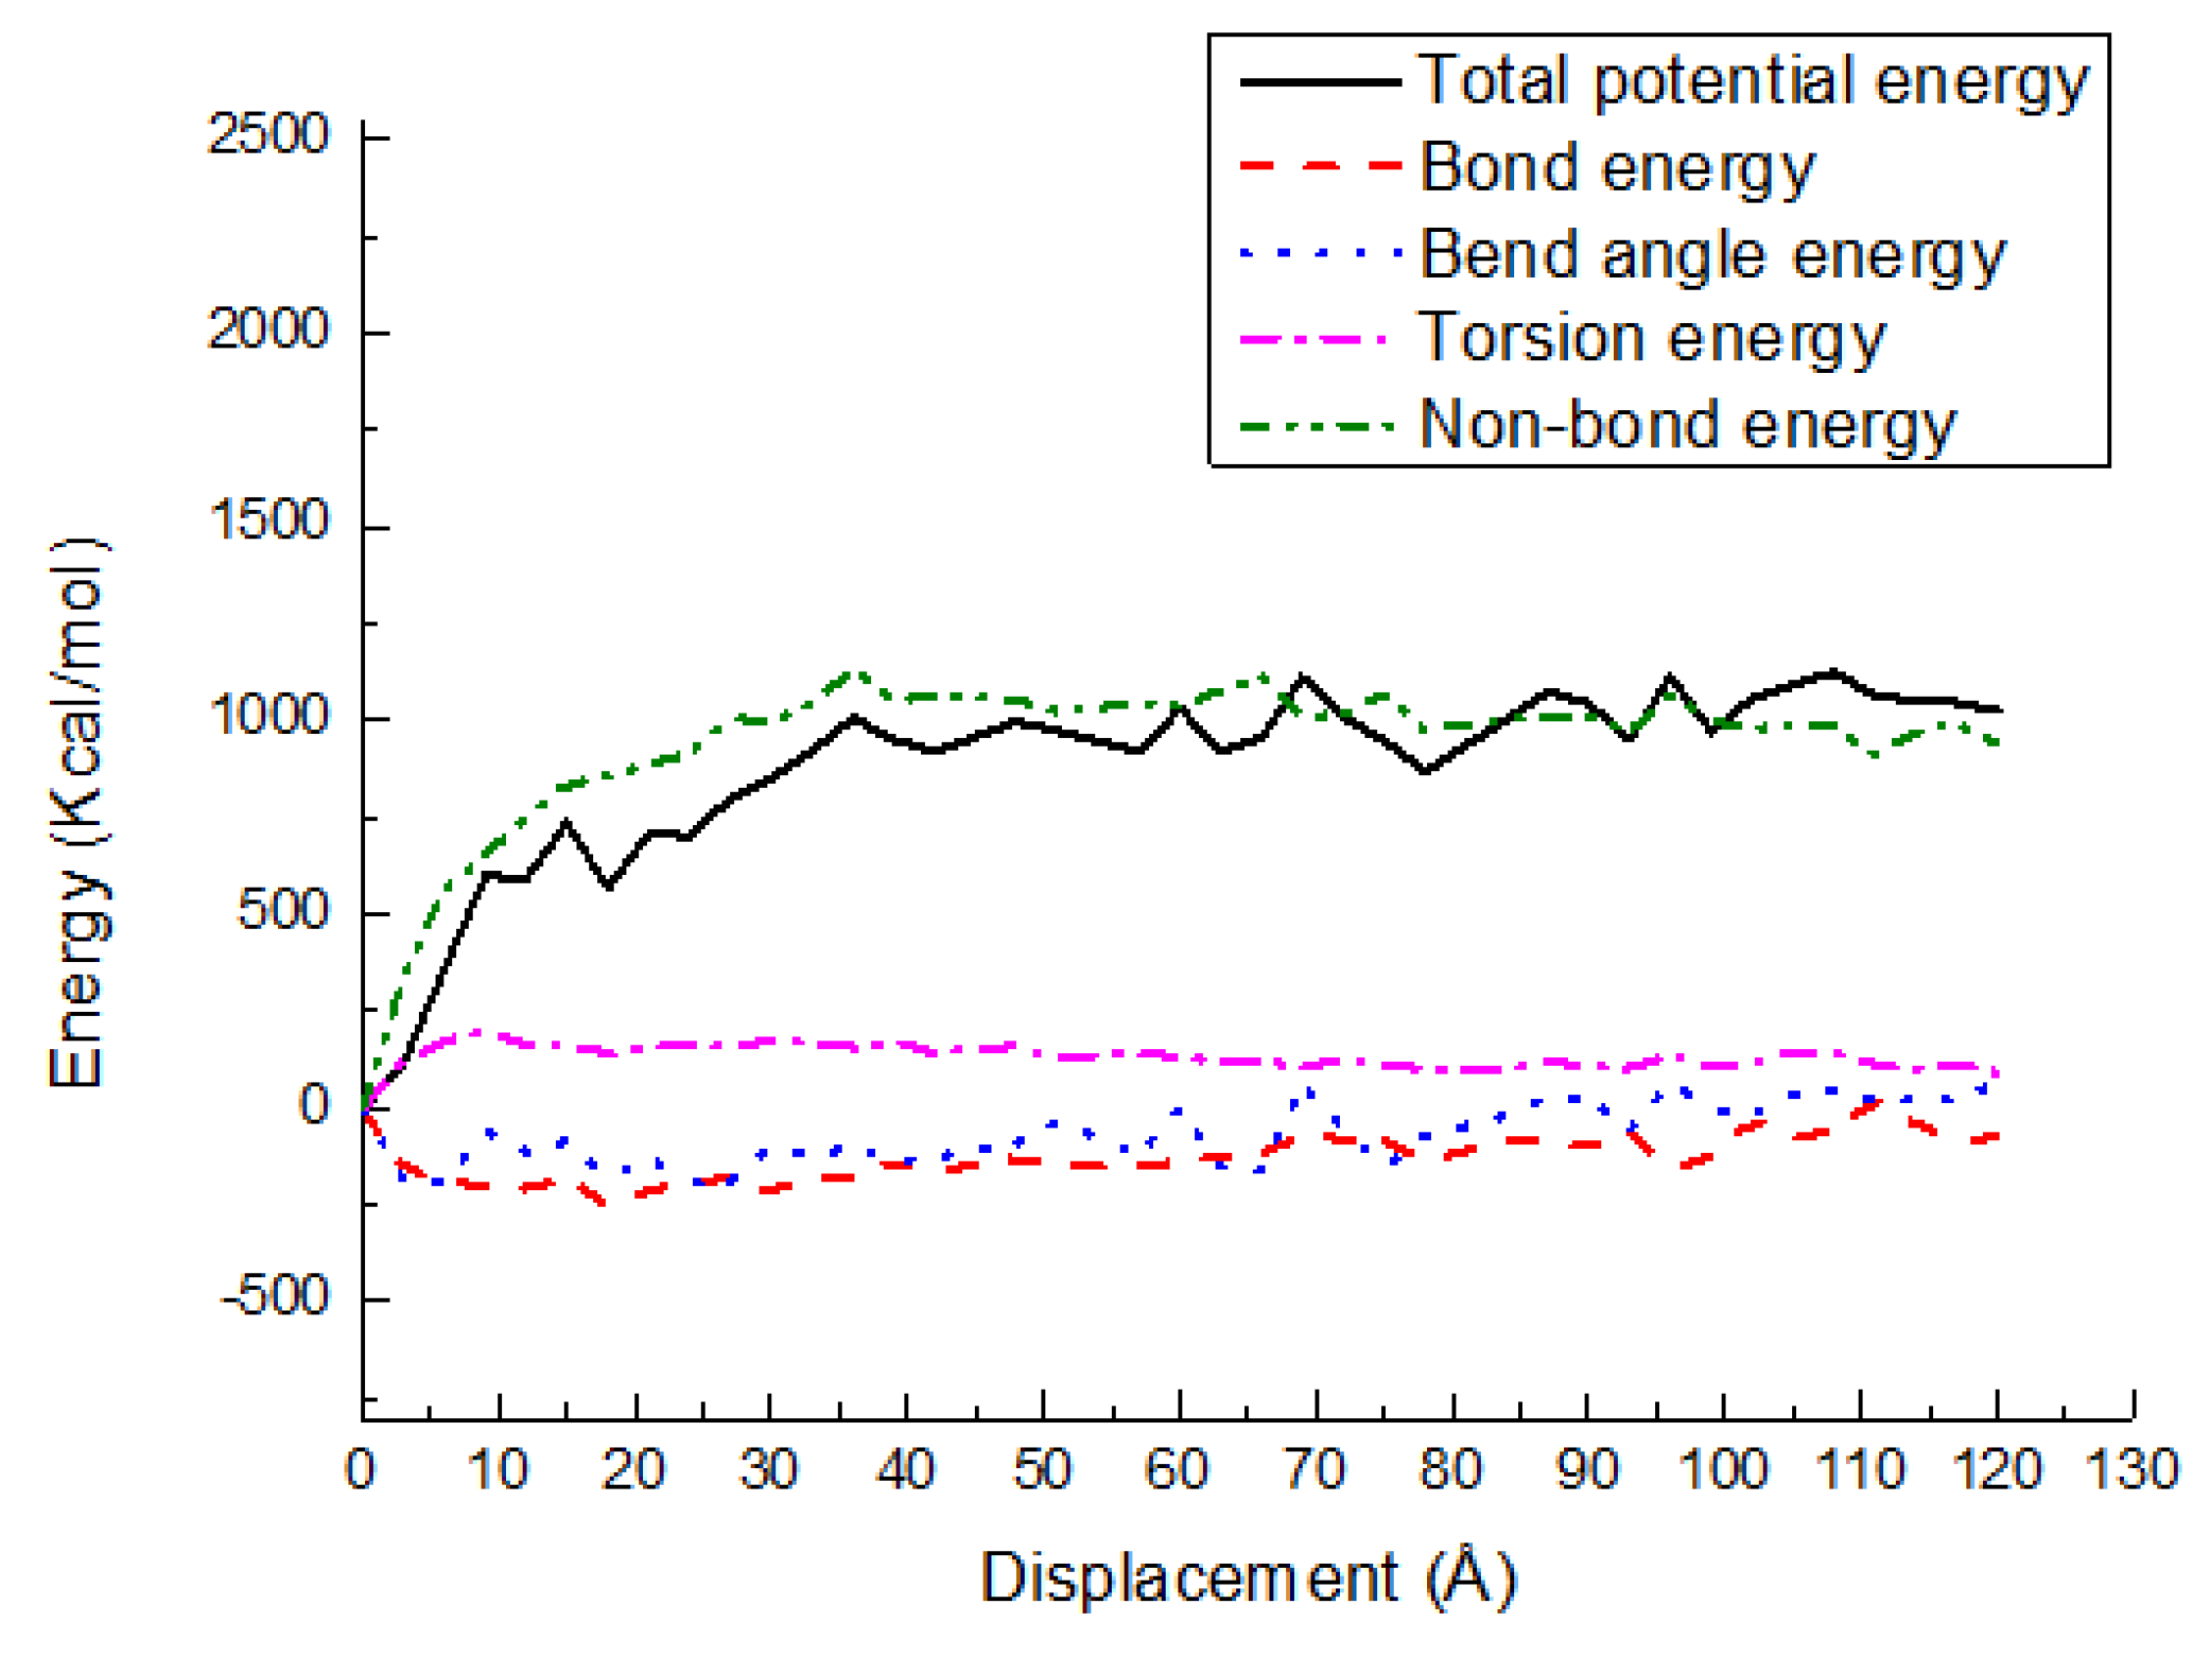
3.3. Potential Energy Evolutions
4. Conclusions
Author Contributions
Funding
Acknowledgments
Conflicts of Interest
References
- Wei, L.; Tang, T.; Huang, B. Synthesis and characterization of polyethylene/clay-silica nanocomposites: A montmorillonite/silica-hybrid-supported catalyst and in situ polymerization. J. Polym. Sci. Part A Polym. Chem. 2004, 42, 941–949. [Google Scholar] [CrossRef]
- Cao, J.H.; Liu, Y.; Ning, X.S. Influence of AlN(0001) surface reconstructions on the wettability of an Al/AlN system: A first-principle study. Materials 2018, 11, 775. [Google Scholar] [CrossRef] [PubMed]
- Liang, H.J.; Li, S.; Lu, Y.Y.; Yang, T. Reliability analysis of bond behaviour of CFRP–concrete interface under wet–dry cycles. Materials 2018, 11, 741. [Google Scholar] [CrossRef] [PubMed]
- Yang, W.; Luo, R.Y.; Hou, Z.H. Effect of interface modified by graphene on the mechanical and frictional properties of carbon/graphene/carbon composites. Materials 2016, 9, 492. [Google Scholar] [CrossRef] [PubMed]
- Tajaddod, N.; Song, K.; Green, E.C.; Zhang, Y.; Minus, M.L. Exfoliation of boron nitride platelets by enhanced interfacial interaction with polyethylene. Macromol. Mater. Eng. 2016, 301, 315–327. [Google Scholar] [CrossRef]
- Zhou, S.; Zhu, H.H.; Yan, Z.G.; Ju, J.W.; Zhang, L.Y. A micromechanical study of the breakage mechanism of microcapsules in concrete using PFC2D. Constr. Build. Mater. 2016, 115, 452–463. [Google Scholar] [CrossRef]
- Zhou, S.; Zhu, H.H.; Ju, J.W.; Yan, Z.G.; Chen, Q. Modeling microcapsule-enabled self-healing cementitious composite materials using discrete element method. Int. J. Damage Mech. 2017, 26, 340–357. [Google Scholar] [CrossRef]
- Zhu, H.H.; Zhou, S.; Yan, Z.G.; Ju, J.W.; Chen, Q. A two-dimensional micromechanical damage-healing model on microcrack-induced damage for microcapsule-enabled self-healing cementitious composites under compressive loading. Int. J. Damage Mech. 2016, 25, 727–749. [Google Scholar] [CrossRef]
- Jin, K.; Feng, X.; Xu, Z. Mechanical properties of chitin–protein interfaces: A molecular dynamics study. BioNanoScience 2013, 3, 312–320. [Google Scholar] [CrossRef]
- Nikkhah, S.J.; Moghbeli, M.R.; Hashemianzadeh, S.M. Dynamic study of deformation and adhesion of an amorphous polyethylene/graphene interface: A simulation study. Macromol. Theory Simul. 2016, 25, 533–549. [Google Scholar] [CrossRef]
- Tam, L.H.; Lau, D. Moisture effect on the mechanical and interfacial properties of epoxy-bonded material system: An atomistic and experimental investigation. Polymer 2015, 57, 132–142. [Google Scholar] [CrossRef]
- Zhou, A.; Tam, L.H.; Yu, Z.; Lau, D. Effect of moisture on the mechanical properties of CFRP-wood composite: An experimental and atomistic investigation. Compos. Part B Eng. 2015, 71, 63–73. [Google Scholar] [CrossRef]
- Min, K.; Kim, Y.; Goyal, S.; Lee, S.H.; McKenzie, M.; Park, H.; Savoy, E.S.; Rammohan, A.R.; Mauro, J.C.; Kim, H.; et al. Interfacial adhesion behavior of polyimides on silica glass: A molecular dynamics study. Polymer 2016, 98, 1–10. [Google Scholar] [CrossRef]
- Meng, J.; Tajaddod, N.; Cranford, S.W.; Minus, M.L. Polyethylene-assisted exfoliation of hexagonal boron nitride in composite fibers: A combined experimental and computational study. Macromol. Chem. Phys. 2015, 216, 847–855. [Google Scholar] [CrossRef]
- Qin, Z.; Buehler, M. Molecular mechanics of dihydroxyphenylalanine at a silica interface. Appl. Phys. Lett. 2012, 101, 083702. [Google Scholar] [CrossRef]
- Ndoro, T.V.; Voyiatzis, E.; Ghanbari, A.; Theodorou, D.N.; Böhm, M.C.; Müller-Plathe, F. Interface of grafted and ungrafted silica nanoparticles with a polystyrene matrix: Atomistic molecular dynamics simulations. Macromolecules 2011, 44, 2316–2327. [Google Scholar] [CrossRef]
- Ozden-Yenigun, E.; Atilgan, C.; Elliott, J.A. Multi-scale modelling of carbon nanotube reinforced crosslinked interfaces. Comp. Mater. Sci. 2017, 129, 279–289. [Google Scholar] [CrossRef][Green Version]
- Lee, S. Molecular dynamics study of the separation behavior at the interface between PVDF binder and copper current collector. J. Nanomater. 2016, 20, 1–12. [Google Scholar] [CrossRef]
- Yang, S.; Gao, F.; Qu, J. A molecular dynamics study of tensile strength between a highly-crosslinked epoxy molding compound and a copper substrate. Polymer 2013, 54, 5064–5074. [Google Scholar] [CrossRef]
- Zhang, H.P.; Lu, X.; Leng, Y.; Fang, L.; Qu, S.; Feng, B.; Weng, J.; Wang, J. Molecular dynamics simulations on the interaction between polymers and hydroxyapatite with and without coupling agents. Acta Biomater. 2009, 5, 1169–1181. [Google Scholar] [CrossRef] [PubMed]
- Chen, Y.; Chia, J.Y.H.; Su, Z.C.; Tay, T.E.; Tan, V.B.C. Mechanical characterization of interfaces in epoxy-clay nanocomposites by molecular simulations. Polymer 2013, 54, 766–773. [Google Scholar] [CrossRef]
- Yi, P.; Locker, C.R.; Rutledge, G.C. Molecular dynamics simulation of homogeneous crystal nucleation in polyethylene. Macromolecules 2013, 46, 4723–4733. [Google Scholar] [CrossRef]
- Plimpton, S. Fast parallel algorithms for short-range molecular dynamics. J. Comput. Phys. 1995, 117, 1–19. [Google Scholar] [CrossRef]
- Mayo, S.L.; Olafson, B.D.; Goddard, W.A. DREIDING: A generic force field for molecular simulations. J. Phys. Chem. 1990, 94, 8897–8909. [Google Scholar] [CrossRef]
- Vu-Bac, N.; Bessa, M.A.; Rabczuk, T.; Liu, W.K. A multiscale model for the quasi-static thermo-plastic behavior of highly cross-linked glassy polymers. Macromolecules 2015, 48, 6713–6723. [Google Scholar] [CrossRef]
- Paek, E.; Hwang, G.S. A computational analysis of graphene adhesion on amorphous silica. J. Appl. Phys. 2013, 113, 164901. [Google Scholar] [CrossRef]
- Viani, L.; Risko, C.; Toney, M.F.; Breiby, D.W.; Brédas, J.L. Substrate-induced variations of molecular packing, dynamics, and intermolecular electronic couplings in pentacene monolayers on the amorphous silica dielectric. ACS Nano 2014, 8, 690–700. [Google Scholar] [CrossRef] [PubMed]
- Nosé, S. A molecular dynamics method for simulations in the canonical ensemble. Mol. Phys. 1984, 52, 255–268. [Google Scholar] [CrossRef]
- Hoover, W.G. Canonical dynamics: Equilibrium phase-space distributions. Phys. Rev. A 1985, 31, 1695–1697. [Google Scholar] [CrossRef]
- Awasthi, A.P.; Lagoudas, D.C.; Hammerand, D.C. Modeling of graphene–polymer interfacial mechanical behavior using molecular dynamics. Model. Simul. Mater. Sci. Eng. 2008, 17, 015002. [Google Scholar] [CrossRef]
- Han, J.; Gee, R.H.; Boyd, R.H. Glass transition temperatures of polymers from molecular dynamics simulations. Macromolecules 1994, 27, 7781–7784. [Google Scholar] [CrossRef]
- Pothan, L.A.; Thomas, S.; Groeninckx, G. The role of fibre/matrix interactions on the dynamic mechanical properties of chemically modified banana fibre/polyester composites. Compos. Part A Appl. Sci. Manuf. 2006, 37, 1260–1269. [Google Scholar] [CrossRef]
- Xie, Y.; Hill, C.A.; Xiao, Z.; Militz, H.; Mai, C. Silane coupling agents used for natural fiber/polymer composites: A review. Compos. Part A Appl. Sci. Manuf. 2010, 41, 806–819. [Google Scholar] [CrossRef]
- Miller, J.D.; Ishida, H.; Maurer, F.H.J. Dynamic-mechanical properties of interfacially modified glass sphere filled polyethylene. Rheol. Acta 1988, 27, 397–404. [Google Scholar] [CrossRef]
- Bengtsson, M.; Oksman, K. Silane crosslinked wood plastic composites: Processing and properties. Compos. Sci. Technol. 2006, 66, 2177–2186. [Google Scholar] [CrossRef]
- McFarren, G.A.; Sanderson, T.F.; Schappell, F.G. Azidosilane polymer-filler coupling agent. Polym. Eng. Sci. 1977, 17, 46–49. [Google Scholar] [CrossRef]
- Tsai, D.H. The virial theorem and stress calculation in molecular dynamics. J. Chem. Phys. 1979, 70, 1375–1382. [Google Scholar] [CrossRef]


| System | Adhesion Strength (MPa) | Displacement (Å) |
|---|---|---|
| PE(76–40)/S | 59.3 | 14 |
| PE(76–40)/mS1 | 59.4 | 21 |
| PE(76–40)/mS2 | 62.1 | 42 |
| PE(150–20)/S | 66.8 | 34 |
| PE(150–20)/mS1 | 67.9 | 62 |
| PE(150–20)/mS2 | 90.4 | 66 |
| PE(150–40)/S | 67.4 | 50 |
| PE(150–40)/mS1 | 84.3 | 96 |
| PE(150–40)/mS2 | 86.6 | 98 |
© 2018 by the authors. Licensee MDPI, Basel, Switzerland. This article is an open access article distributed under the terms and conditions of the Creative Commons Attribution (CC BY) license (http://creativecommons.org/licenses/by/4.0/).
Share and Cite
Zhuang, X.; Zhou, S. Molecular Dynamics Study of an Amorphous Polyethylene/Silica Interface with Shear Tests. Materials 2018, 11, 929. https://doi.org/10.3390/ma11060929
Zhuang X, Zhou S. Molecular Dynamics Study of an Amorphous Polyethylene/Silica Interface with Shear Tests. Materials. 2018; 11(6):929. https://doi.org/10.3390/ma11060929
Chicago/Turabian StyleZhuang, Xiaoying, and Shuai Zhou. 2018. "Molecular Dynamics Study of an Amorphous Polyethylene/Silica Interface with Shear Tests" Materials 11, no. 6: 929. https://doi.org/10.3390/ma11060929
APA StyleZhuang, X., & Zhou, S. (2018). Molecular Dynamics Study of an Amorphous Polyethylene/Silica Interface with Shear Tests. Materials, 11(6), 929. https://doi.org/10.3390/ma11060929