Noninvasive Mechanochemical Imaging in Unconstrained Caenorhabditis elegans

Abstract
:1. Introduction
2. Materials and Methods
3. Results
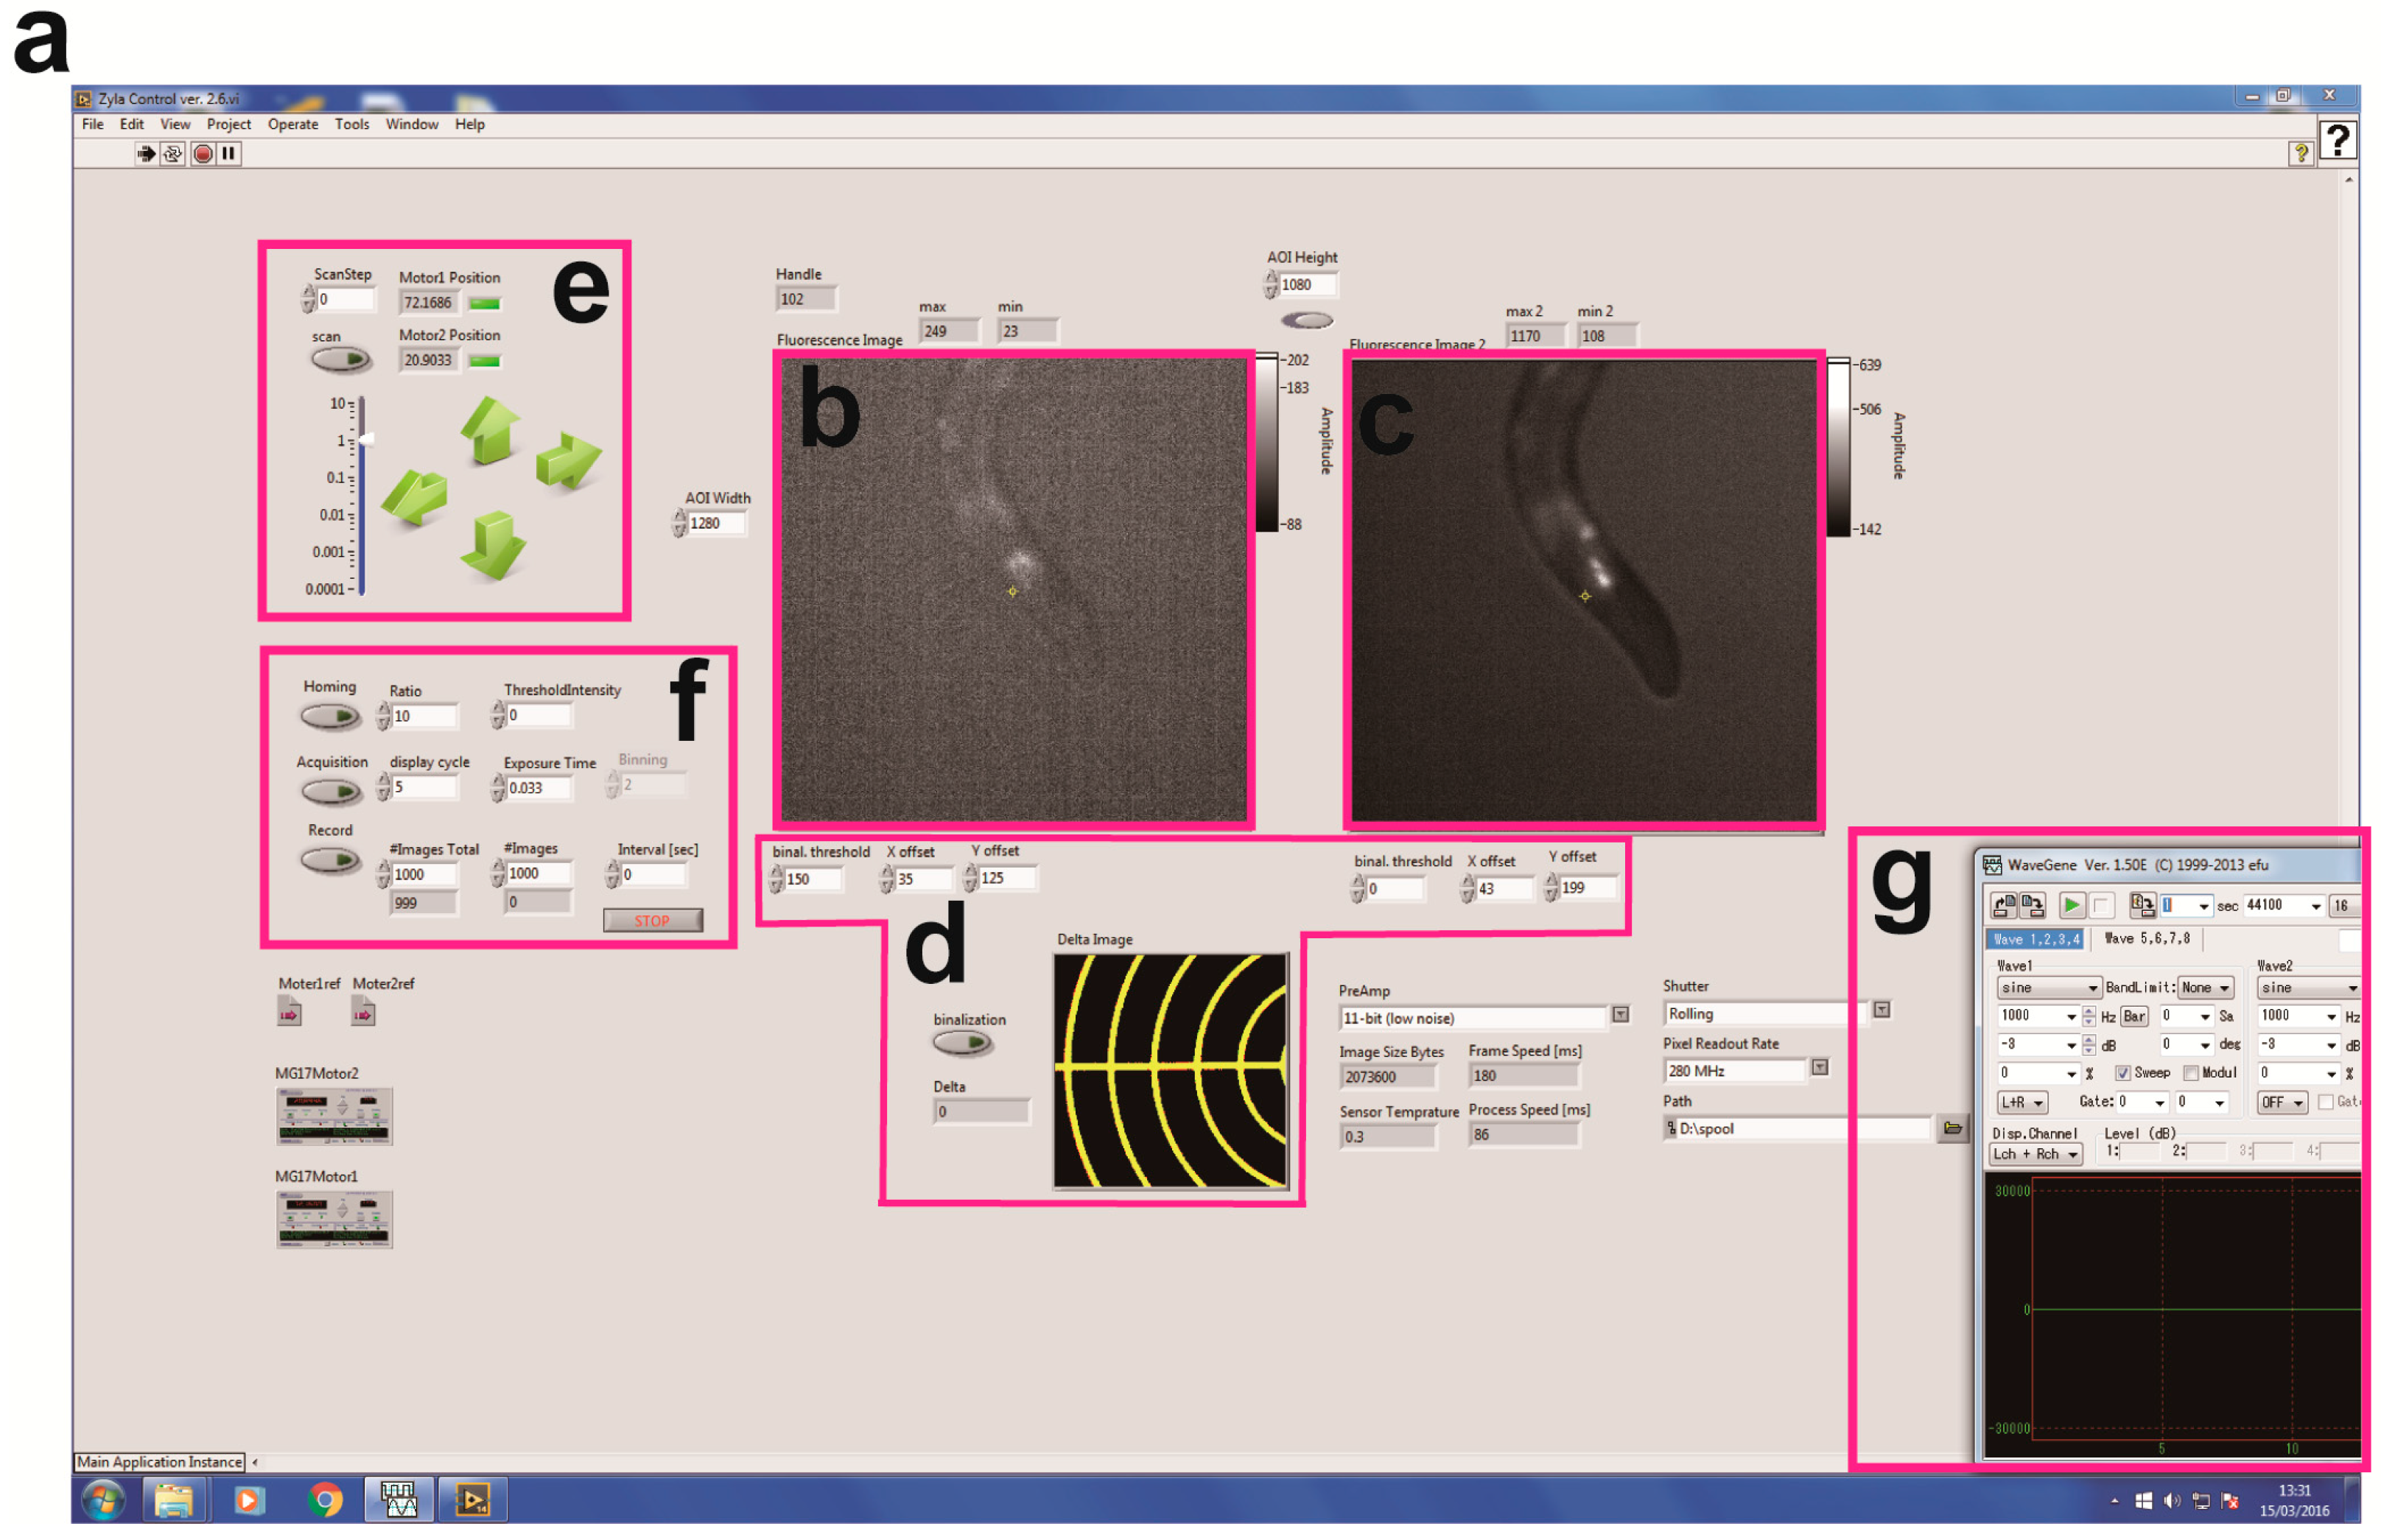
3.1. Device Design
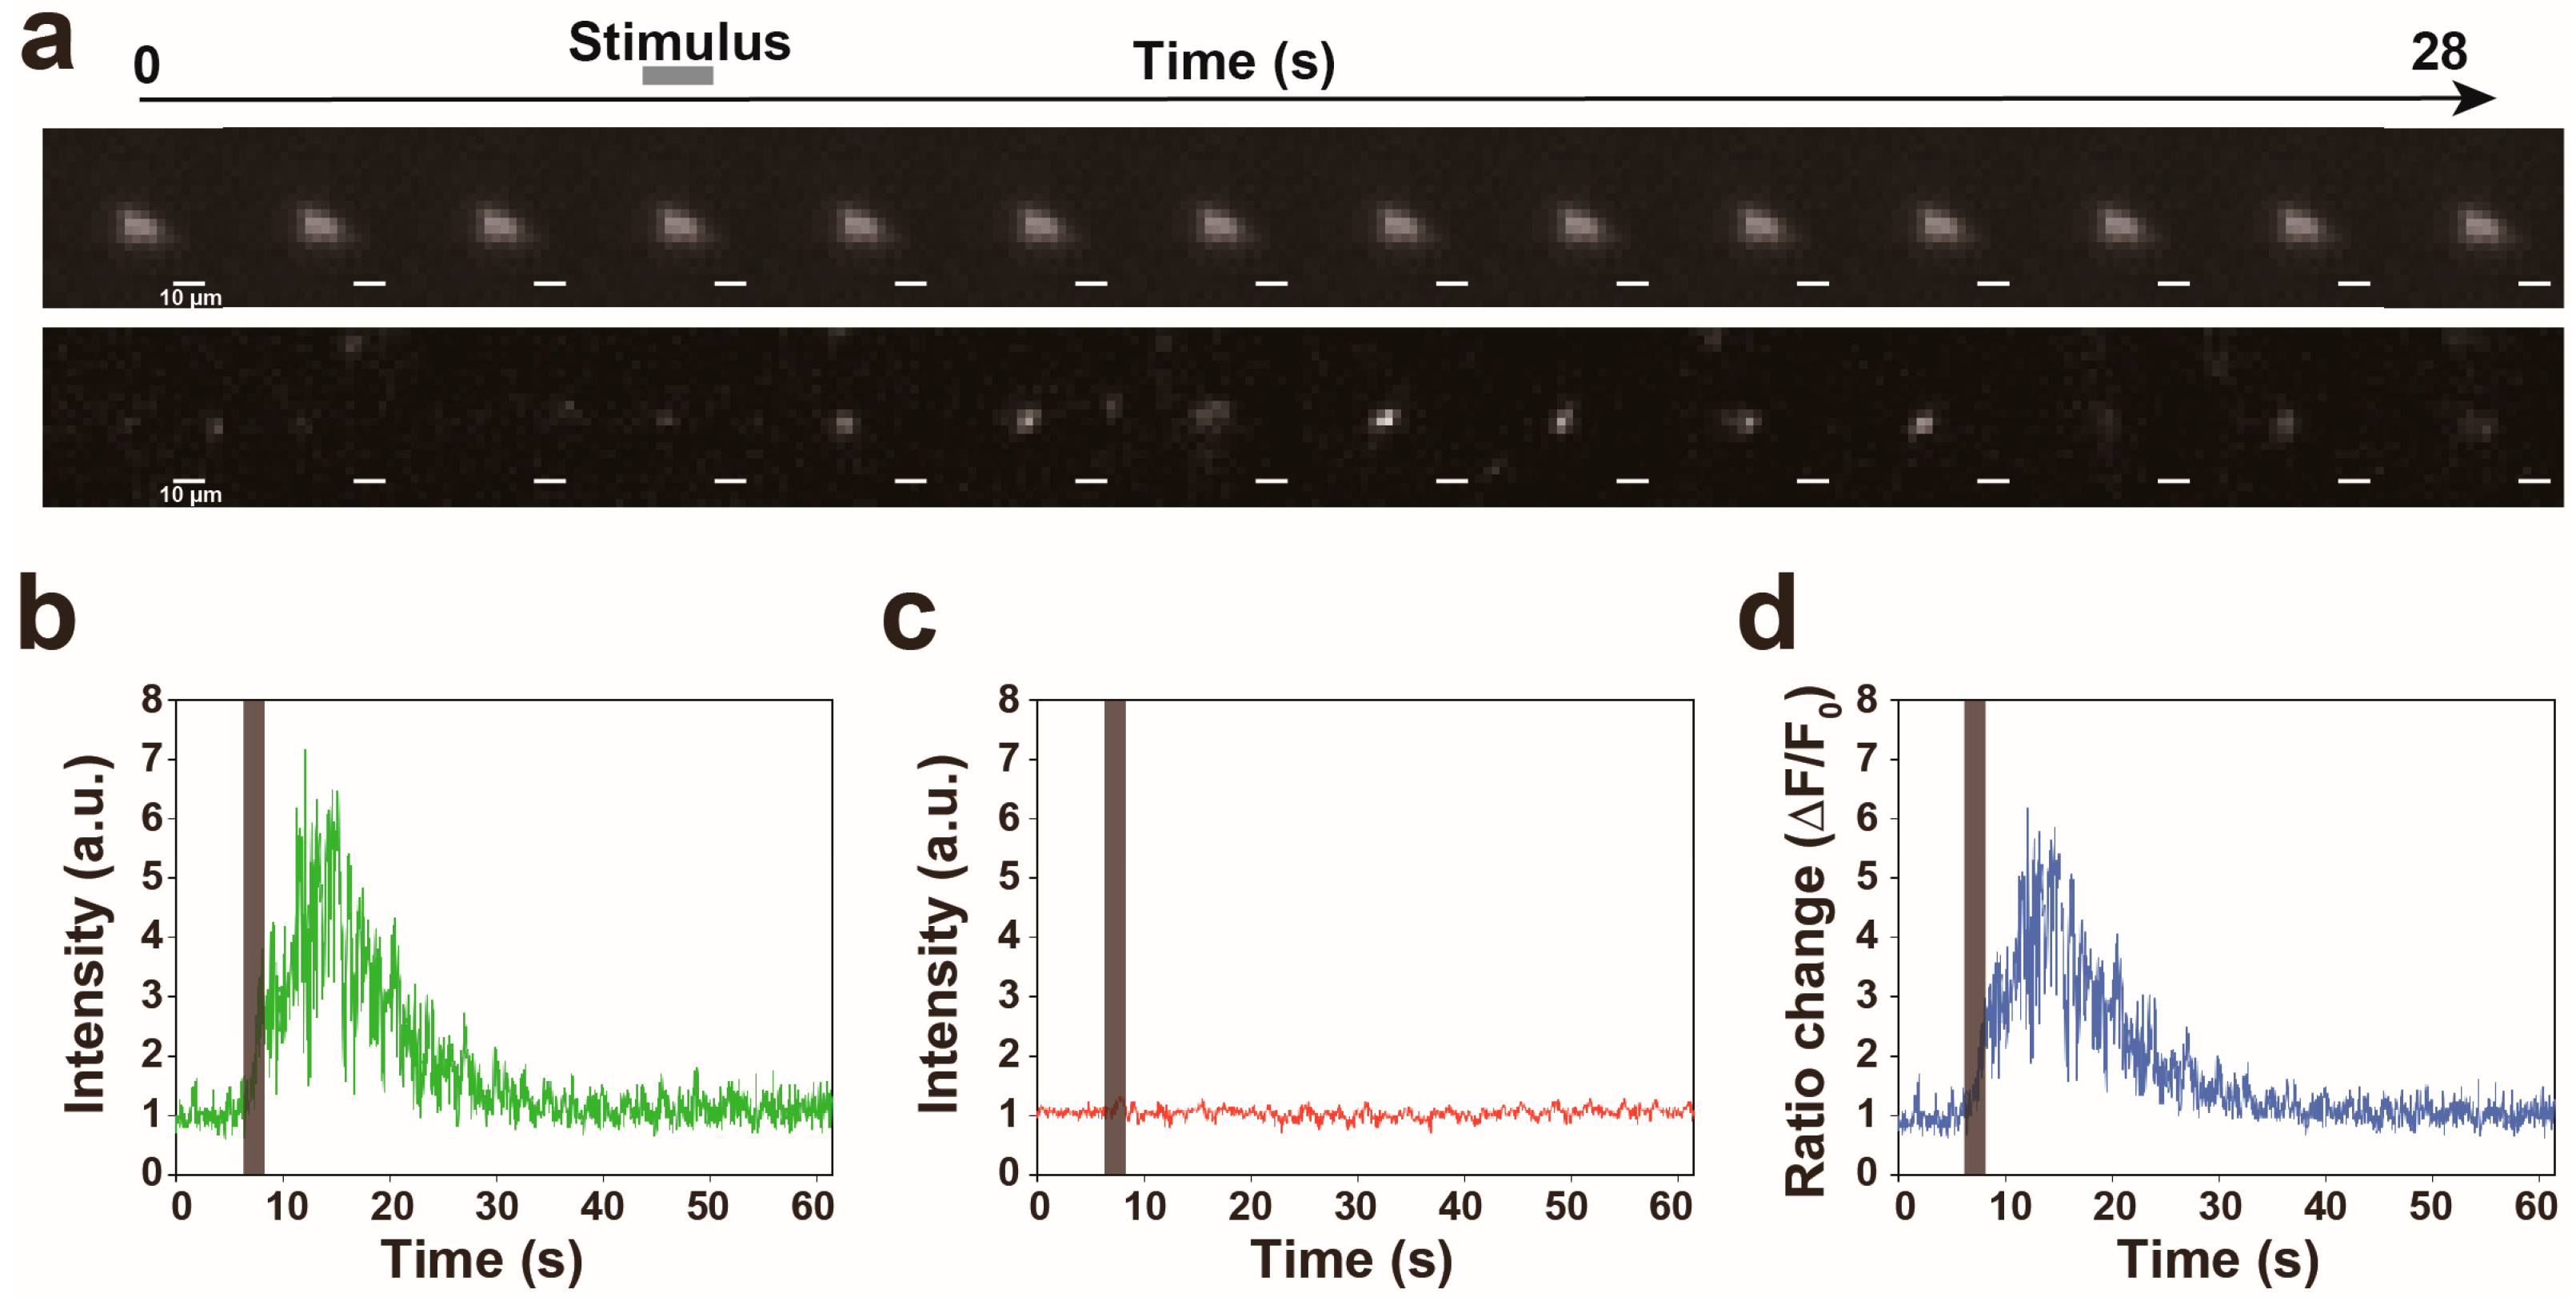
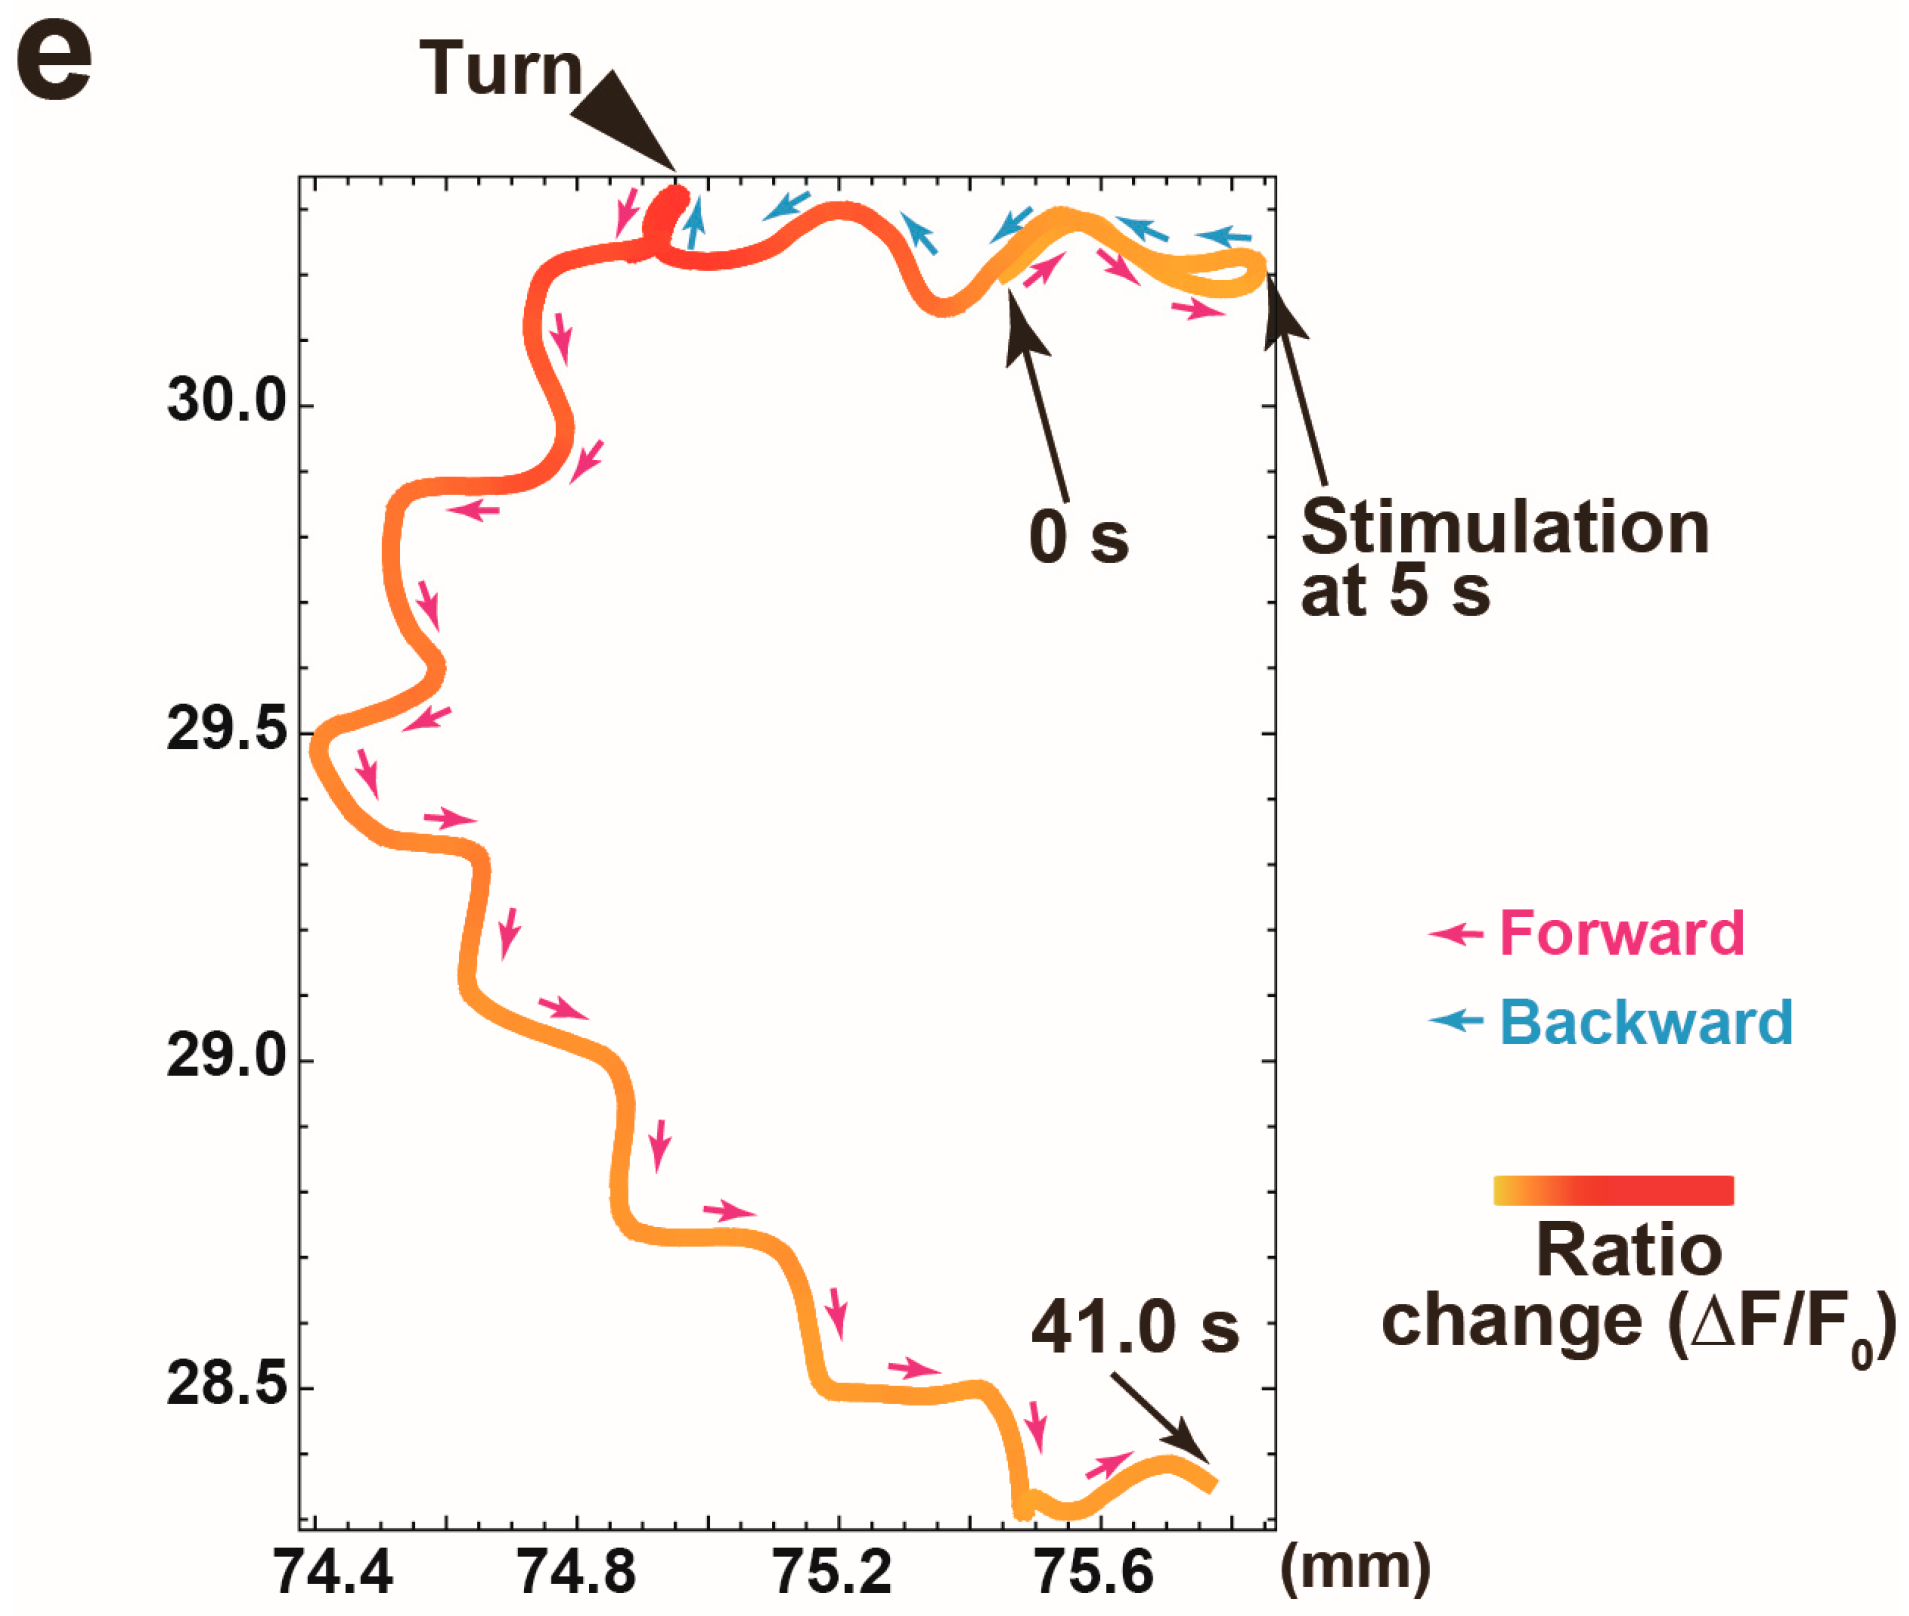
3.2. Proof of Princple Experiment
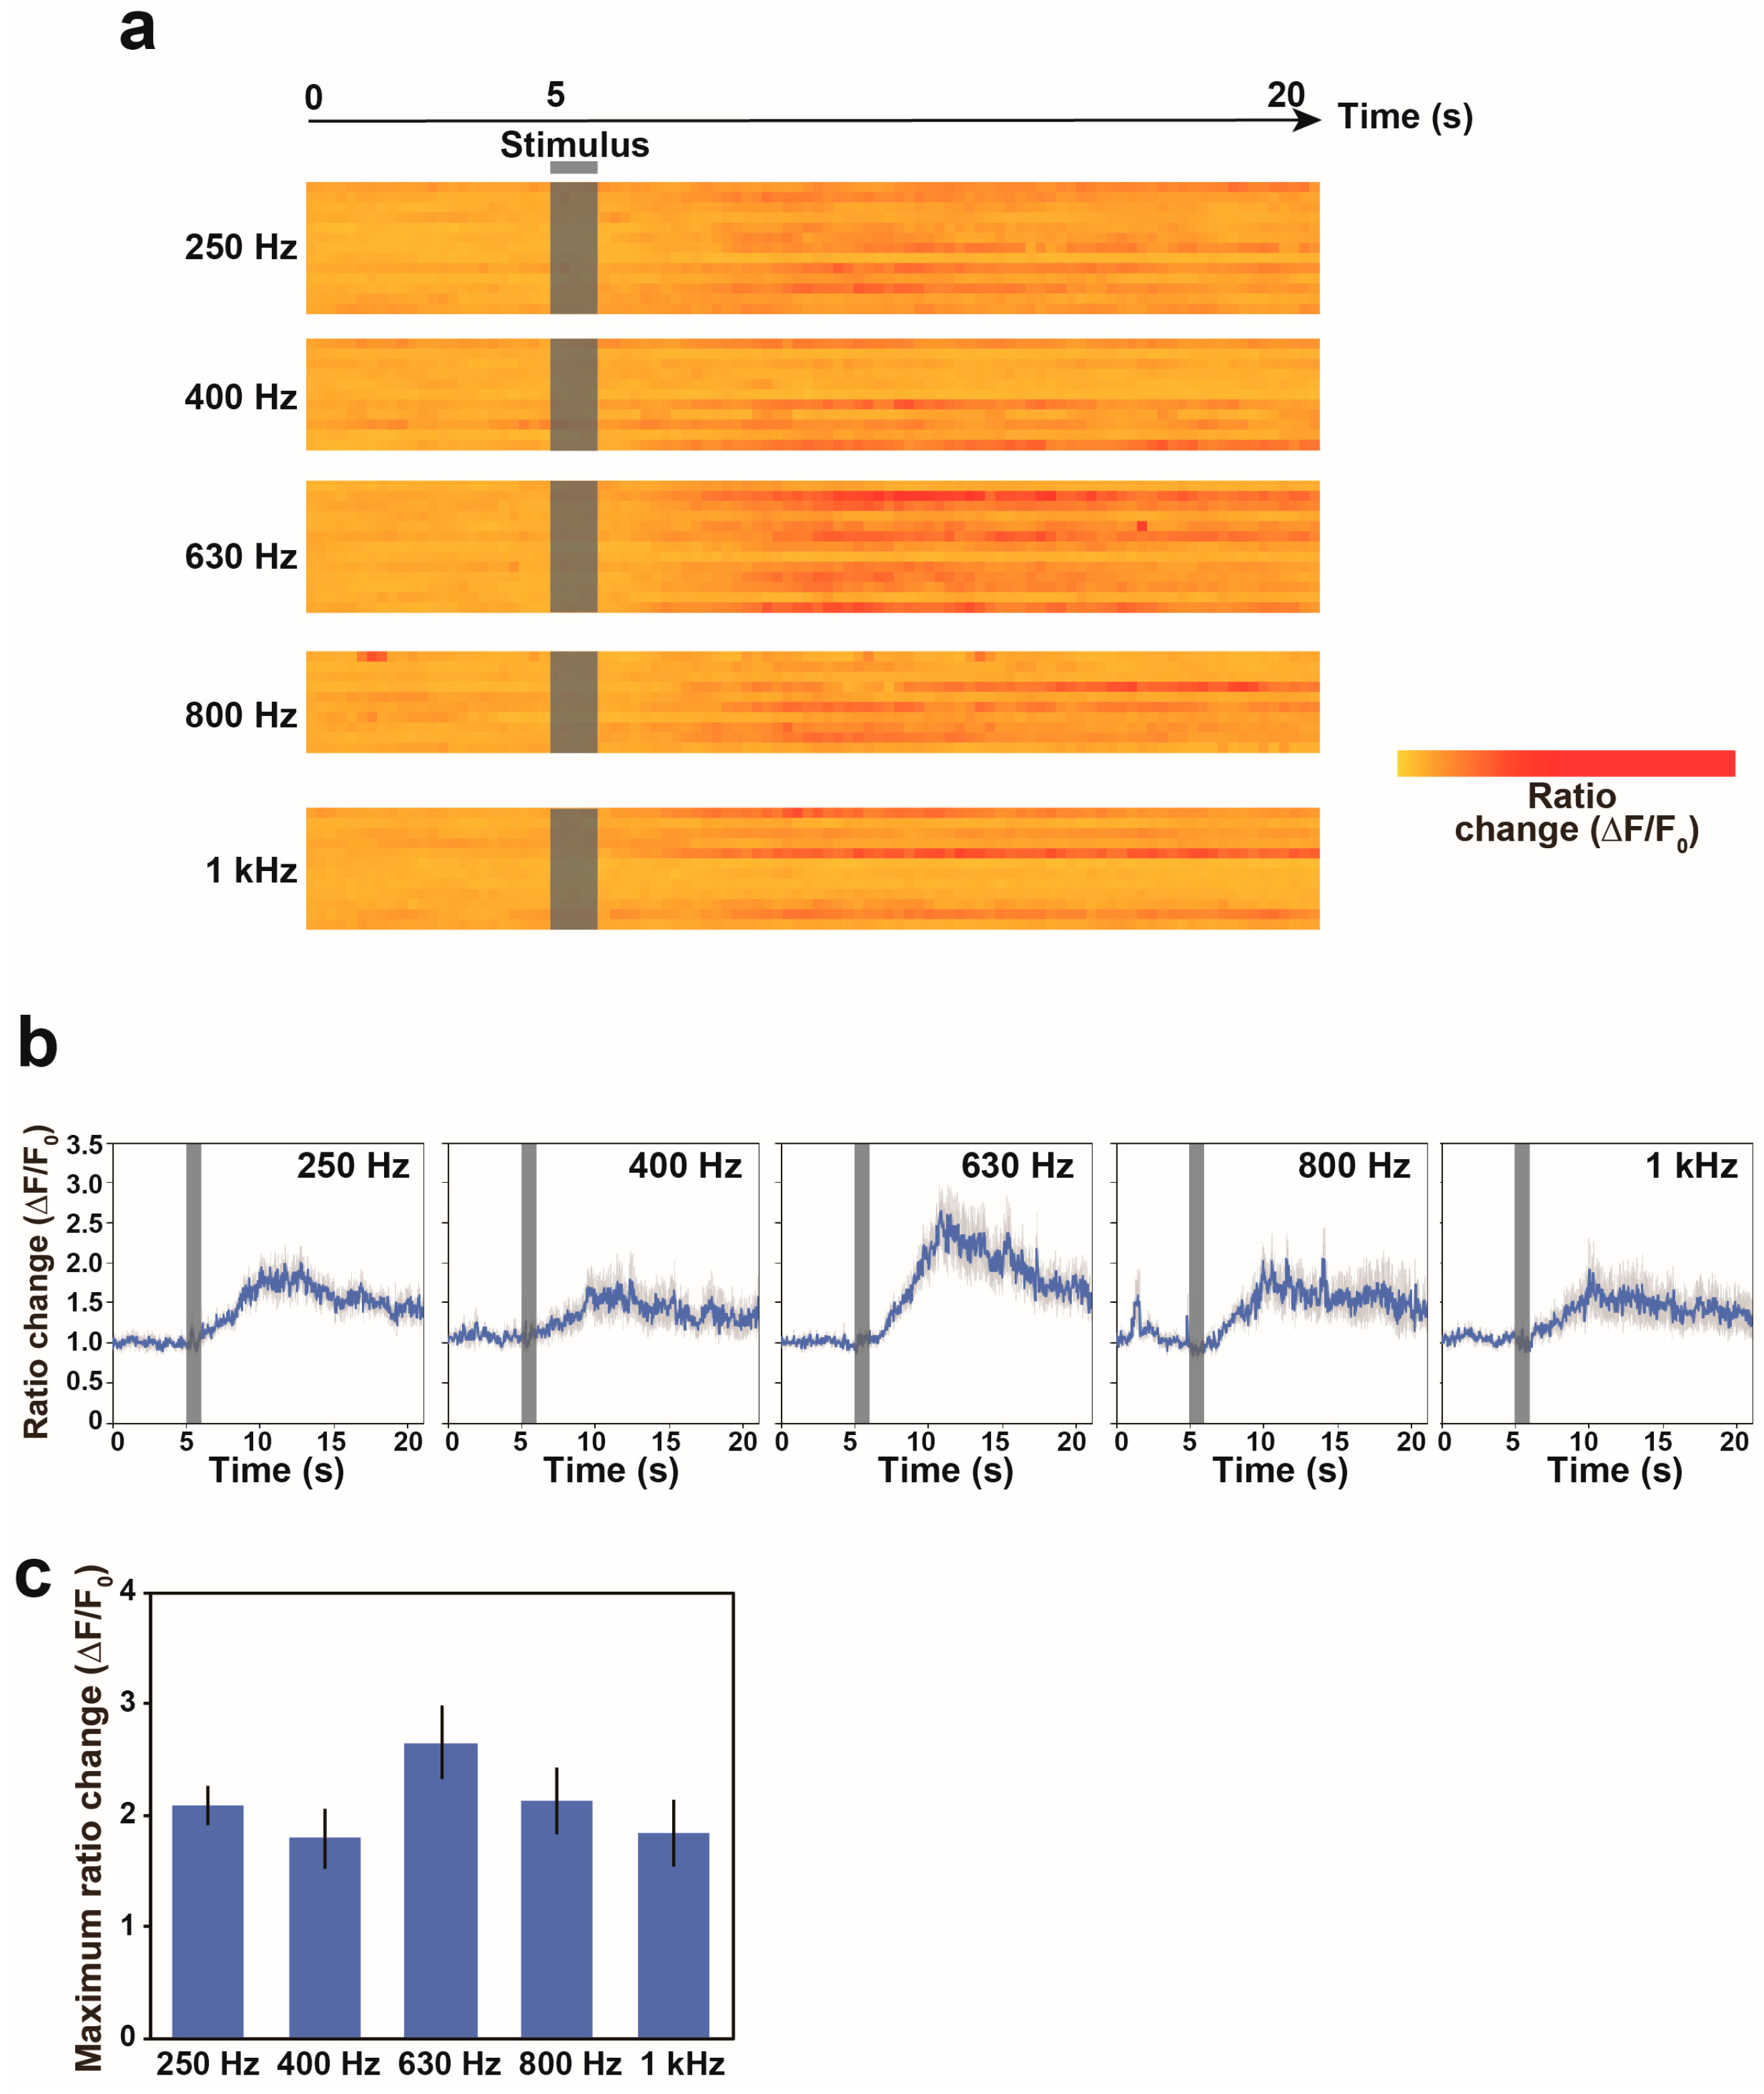
3.3. Calcium Responses of the AVA Neuron to Nonlocalized Vibration with Different Frequencies
4. Discussion
Supplementary Materials
Author Contributions
Funding
Acknowledgments
Conflicts of Interest
References
- Vogel, V.; Sheetz, M. Local force and geometry sensing regulate cell functions. Nat. Rev. Mol. Cell Biol. 2006, 7, 265–275. [Google Scholar] [CrossRef] [PubMed]
- Katta, S.; Krieg, M.; Goodman, M.B. Feeling force: Physical and physiological principles enabling sensory mechanotransduction. Annu. Rev. Cell Dev. Biol. 2015, 31, 347–371. [Google Scholar] [CrossRef] [PubMed]
- Orr, A.W.; Helmke, B.P.; Blackman, B.R.; Schwartz, M.A. Mechanisms of mechanotransduction. Dev. Cell 2006, 10, 11–20. [Google Scholar] [CrossRef] [PubMed]
- Bozorgmehr, T.; Ardiel, E.L.; McEwan, A.H.; Rankin, C.H. Mechanisms of plasticity in a Caenorhabditis elegans mechanosensory circuit. Front. Physiol. 2013, 4, 88. [Google Scholar] [CrossRef] [PubMed]
- Sugi, T.; Ohtani, Y.; Kumiya, Y.; Igarashi, R.; Shirakawa, M. High-throughput optical quantification of mechanosensory habituation reveals neurons encoding memory in Caenorhabditis elegans. Proc. Natl. Acad. Sci. USA 2014, 111, 17236–17241. [Google Scholar] [CrossRef] [PubMed]
- Timbers, T.A.; Rankin, C.H. Tap withdrawal circuit interneurons require CREB for long-term habituation in Caenorhabditis elegans. Behav. Neurosci. 2011, 125, 560–566. [Google Scholar] [CrossRef] [PubMed]
- Chalfie, M.; Sulston, J.E.; White, J.G.; Southgate, E.; Thomson, J.N.; Brenner, S. The neural circuit for touch sensitivity in Caenorhabditis elegans. J. Neurosci. 1985, 5, 956–964. [Google Scholar] [CrossRef] [PubMed]
- Ben Arous, J.; Tanizawa, Y.; Rabinowitch, I.; Chatenay, D.; Schafer, W.R. Automated imaging of neuronal activity in freely behaving Caenorhabditis elegans. J. Neurosci. Methods 2010, 187, 229–234. [Google Scholar] [CrossRef] [PubMed]
- Clark, D.A.; Gabel, C.V.; Gabel, H.; Samuel, A.D.T. Temporal activity patterns in thermosensory neurons of freely moving Caenorhabditis elegans encode spatial thermal gradients. J. Neurosci. 2007, 27, 6083–6090. [Google Scholar] [CrossRef] [PubMed]
- Piggott, B.J.; Liu, J.; Feng, Z.; Wescott, S.A.; Xu, X.Z.S. The neural circuits and synaptic mechanisms underlying motor initiation in C. elegans. Cell 2011, 147, 922–933. [Google Scholar] [CrossRef] [PubMed]
- Kawano, T.; Po, M.D.; Gao, S.; Leung, G.; Ryu, W.S.; Zhen, M. An imbalancing act: Gap junctions reduce the backward motor circuit activity to bias C. elegans for forward locomotion. Neuron 2011, 72, 572–586. [Google Scholar] [CrossRef] [PubMed]
- Sugi, T.; Okumura, E.; Kiso, K.; Igarashi, R. Nanoscale Mechanical Stimulation Method for Quantifying C. elegans Mechanosensory Behavior and Memory. Anal. Sci. 2016, 32, 1159–1164. [Google Scholar] [CrossRef] [PubMed]
- Mello, C.C.; Kramer, J.M.; Stinchcomb, D.; Ambros, V. Efficient gene transfer in C. elegans: Extrachromosomal maintenance and integration of transforming sequences. EMBO J. 1991, 10, 3959–3970. [Google Scholar] [PubMed]
- Guo, Z.V.; Hart, A.C.; Ramanathan, S. Optical interrogation of neural circuits in Caenorhabditis elegans. Nat. Methods 2009, 6, 891–896. [Google Scholar] [CrossRef] [PubMed]
- Brenner, S. The genetics of Caenorhabditis elegans. Genetics 1974, 77, 71–94. [Google Scholar] [PubMed]
- Swierczek, N.A.; Giles, A.C.; Rankin, C.H.; Kerr, R.A. High-throughput behavioral analysis in C. elegans. Nat. Methods 2011, 8, 592–598. [Google Scholar] [CrossRef] [PubMed]
- Eastwood, A.L.; Sanzeni, A.; Petzold, B.C.; Park, S.-J.; Vergassola, M.; Pruitt, B.L.; Goodman, M.B. Tissue mechanics govern the rapidly adapting and symmetrical response to touch. Proc. Natl. Acad. Sci. USA 2015, 112, E6955–E6963. [Google Scholar] [CrossRef] [PubMed]
- Cho, Y.; Porto, D.A.; Hwang, H.; Grundy, L.J.; Schafer, W.R.; Lu, H. Automated and controlled mechanical stimulation and functional imaging in vivo in C. elegans. Lab Chip 2017, 17, 2609–2618. [Google Scholar] [CrossRef] [PubMed]
- Kubanek, J.; Shukla, P.; Das, A.; Baccus, S.A.; Goodman, M.B. Ultrasound Elicits Behavioral Responses through Mechanical Effects on Neurons and Ion Channels in a Simple Nervous System. J. Neurosci. 2018, 38, 3081–3091. [Google Scholar] [CrossRef] [PubMed]
- Wicks, S.R.; Rankin, C.H. Integration of mechanosensory stimuli in Caenorhabditis elegans. J. Neurosci. 1995, 15, 2434–2444. [Google Scholar] [CrossRef] [PubMed]


© 2018 by the authors. Licensee MDPI, Basel, Switzerland. This article is an open access article distributed under the terms and conditions of the Creative Commons Attribution (CC BY) license (http://creativecommons.org/licenses/by/4.0/).
Share and Cite
Sugi, T.; Igarashi, R.; Nishimura, M. Noninvasive Mechanochemical Imaging in Unconstrained Caenorhabditis elegans. Materials 2018, 11, 1034. https://doi.org/10.3390/ma11061034
Sugi T, Igarashi R, Nishimura M. Noninvasive Mechanochemical Imaging in Unconstrained Caenorhabditis elegans. Materials. 2018; 11(6):1034. https://doi.org/10.3390/ma11061034
Chicago/Turabian StyleSugi, Takuma, Ryuji Igarashi, and Masaki Nishimura. 2018. "Noninvasive Mechanochemical Imaging in Unconstrained Caenorhabditis elegans" Materials 11, no. 6: 1034. https://doi.org/10.3390/ma11061034
APA StyleSugi, T., Igarashi, R., & Nishimura, M. (2018). Noninvasive Mechanochemical Imaging in Unconstrained Caenorhabditis elegans. Materials, 11(6), 1034. https://doi.org/10.3390/ma11061034