Arc Discharges of a Pure Carbon Strip Affected by Dynamic Contact Force during Current-Carrying Sliding


Abstract
1. Introduction
2. Materials and Methods
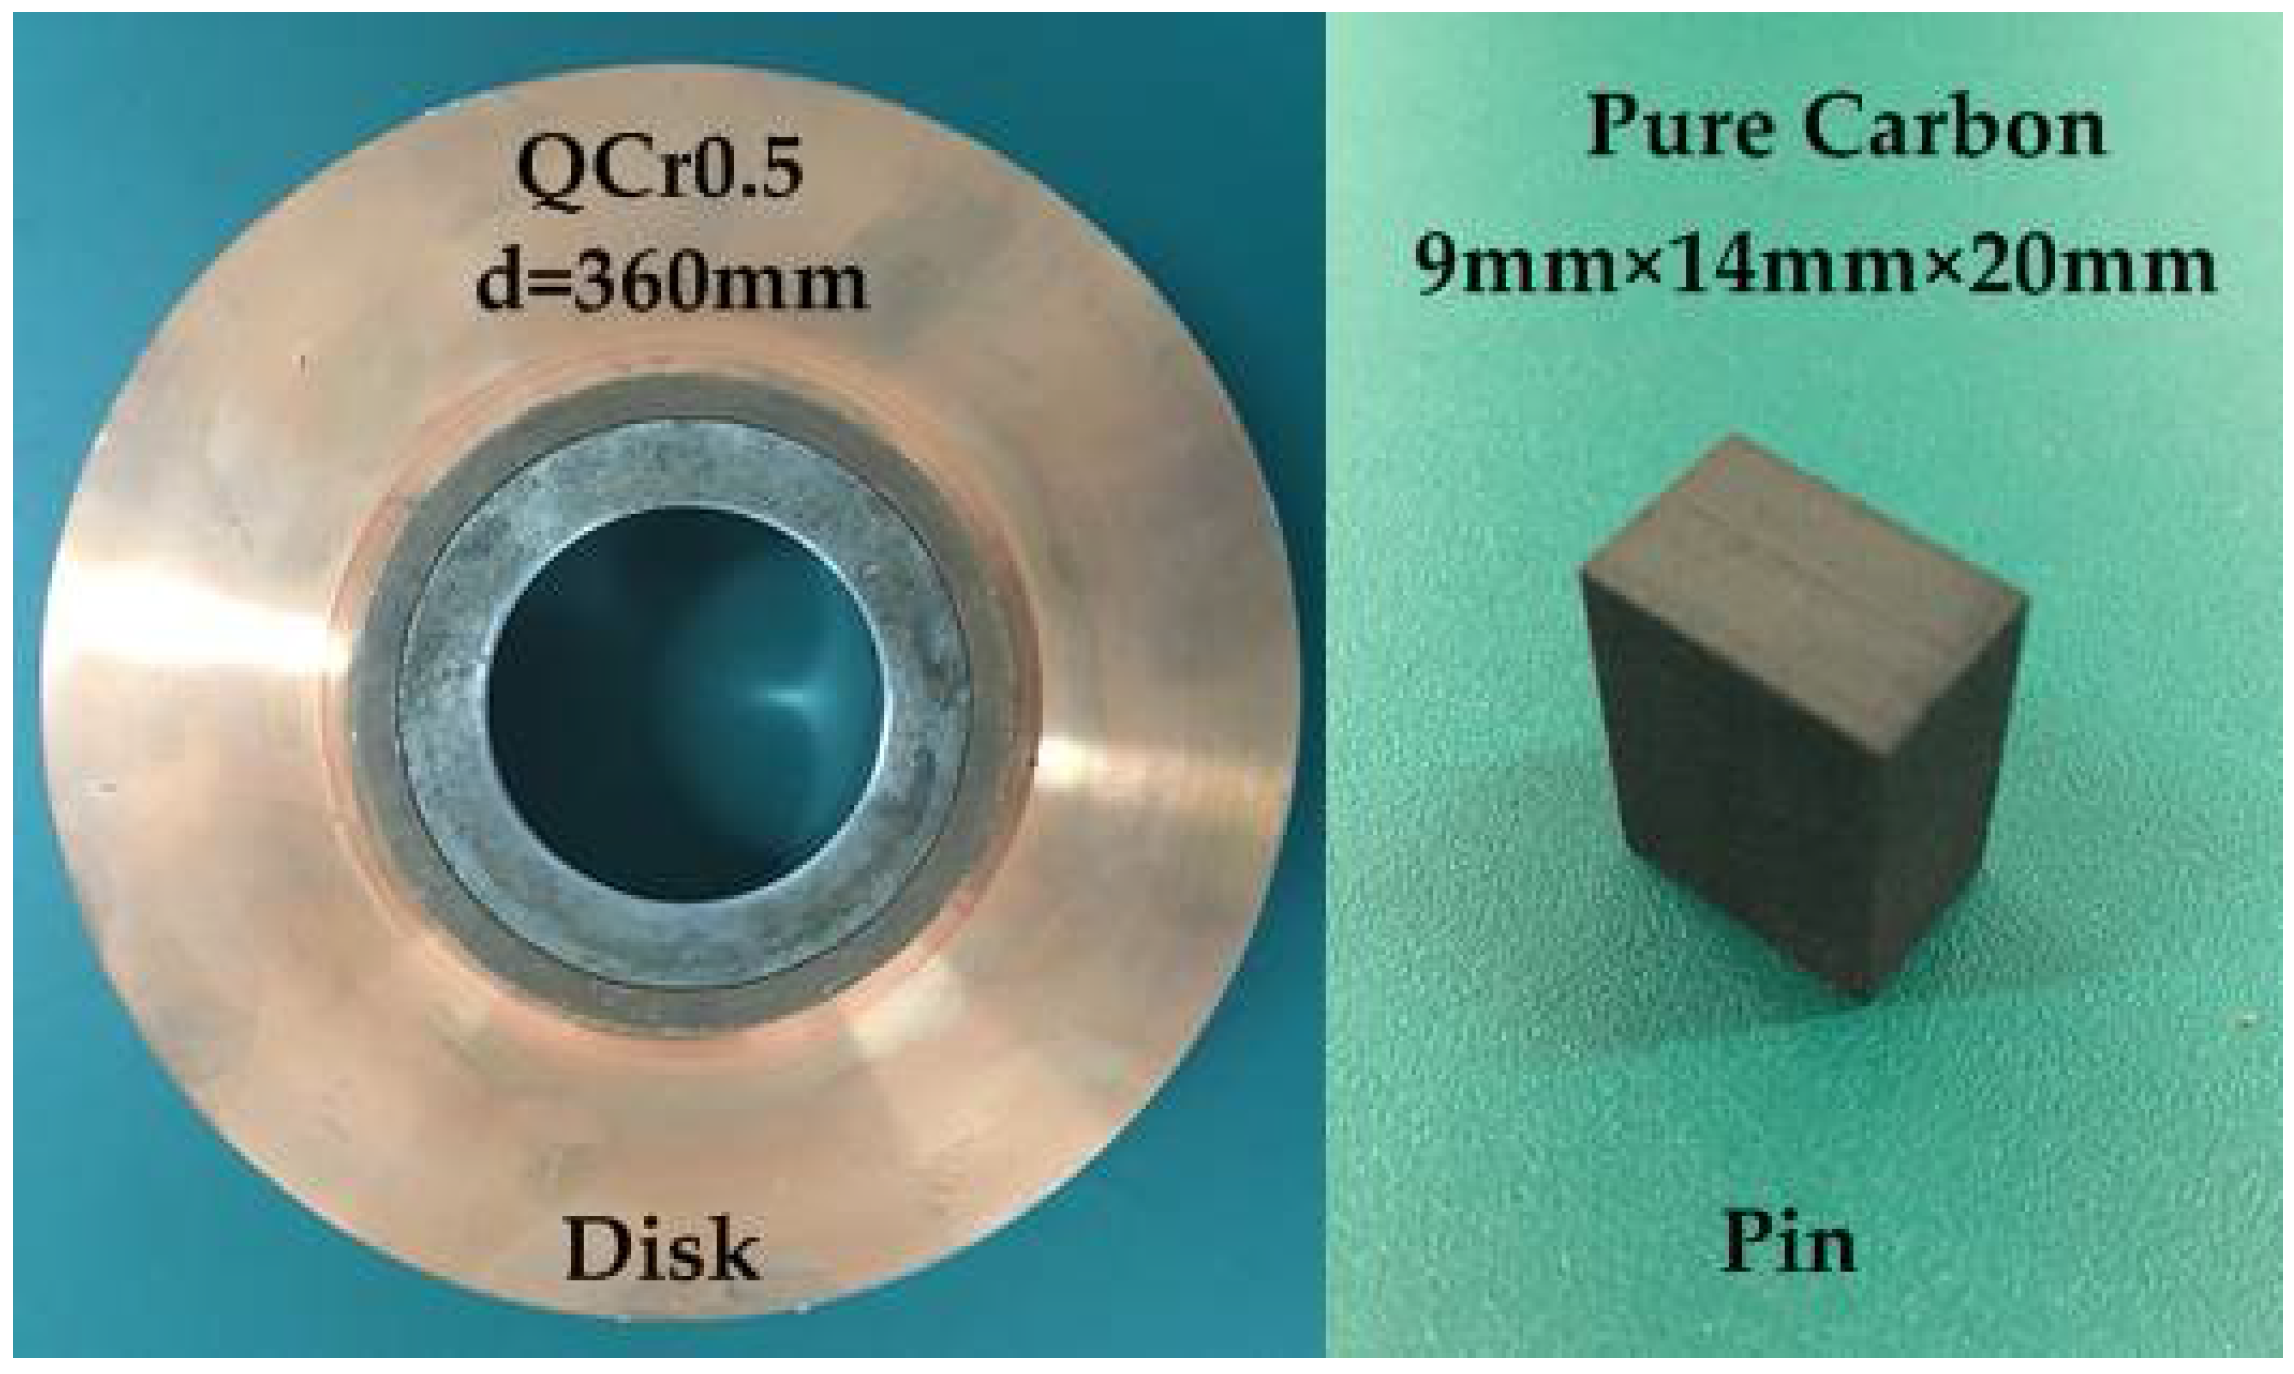
2.1. Test Materials
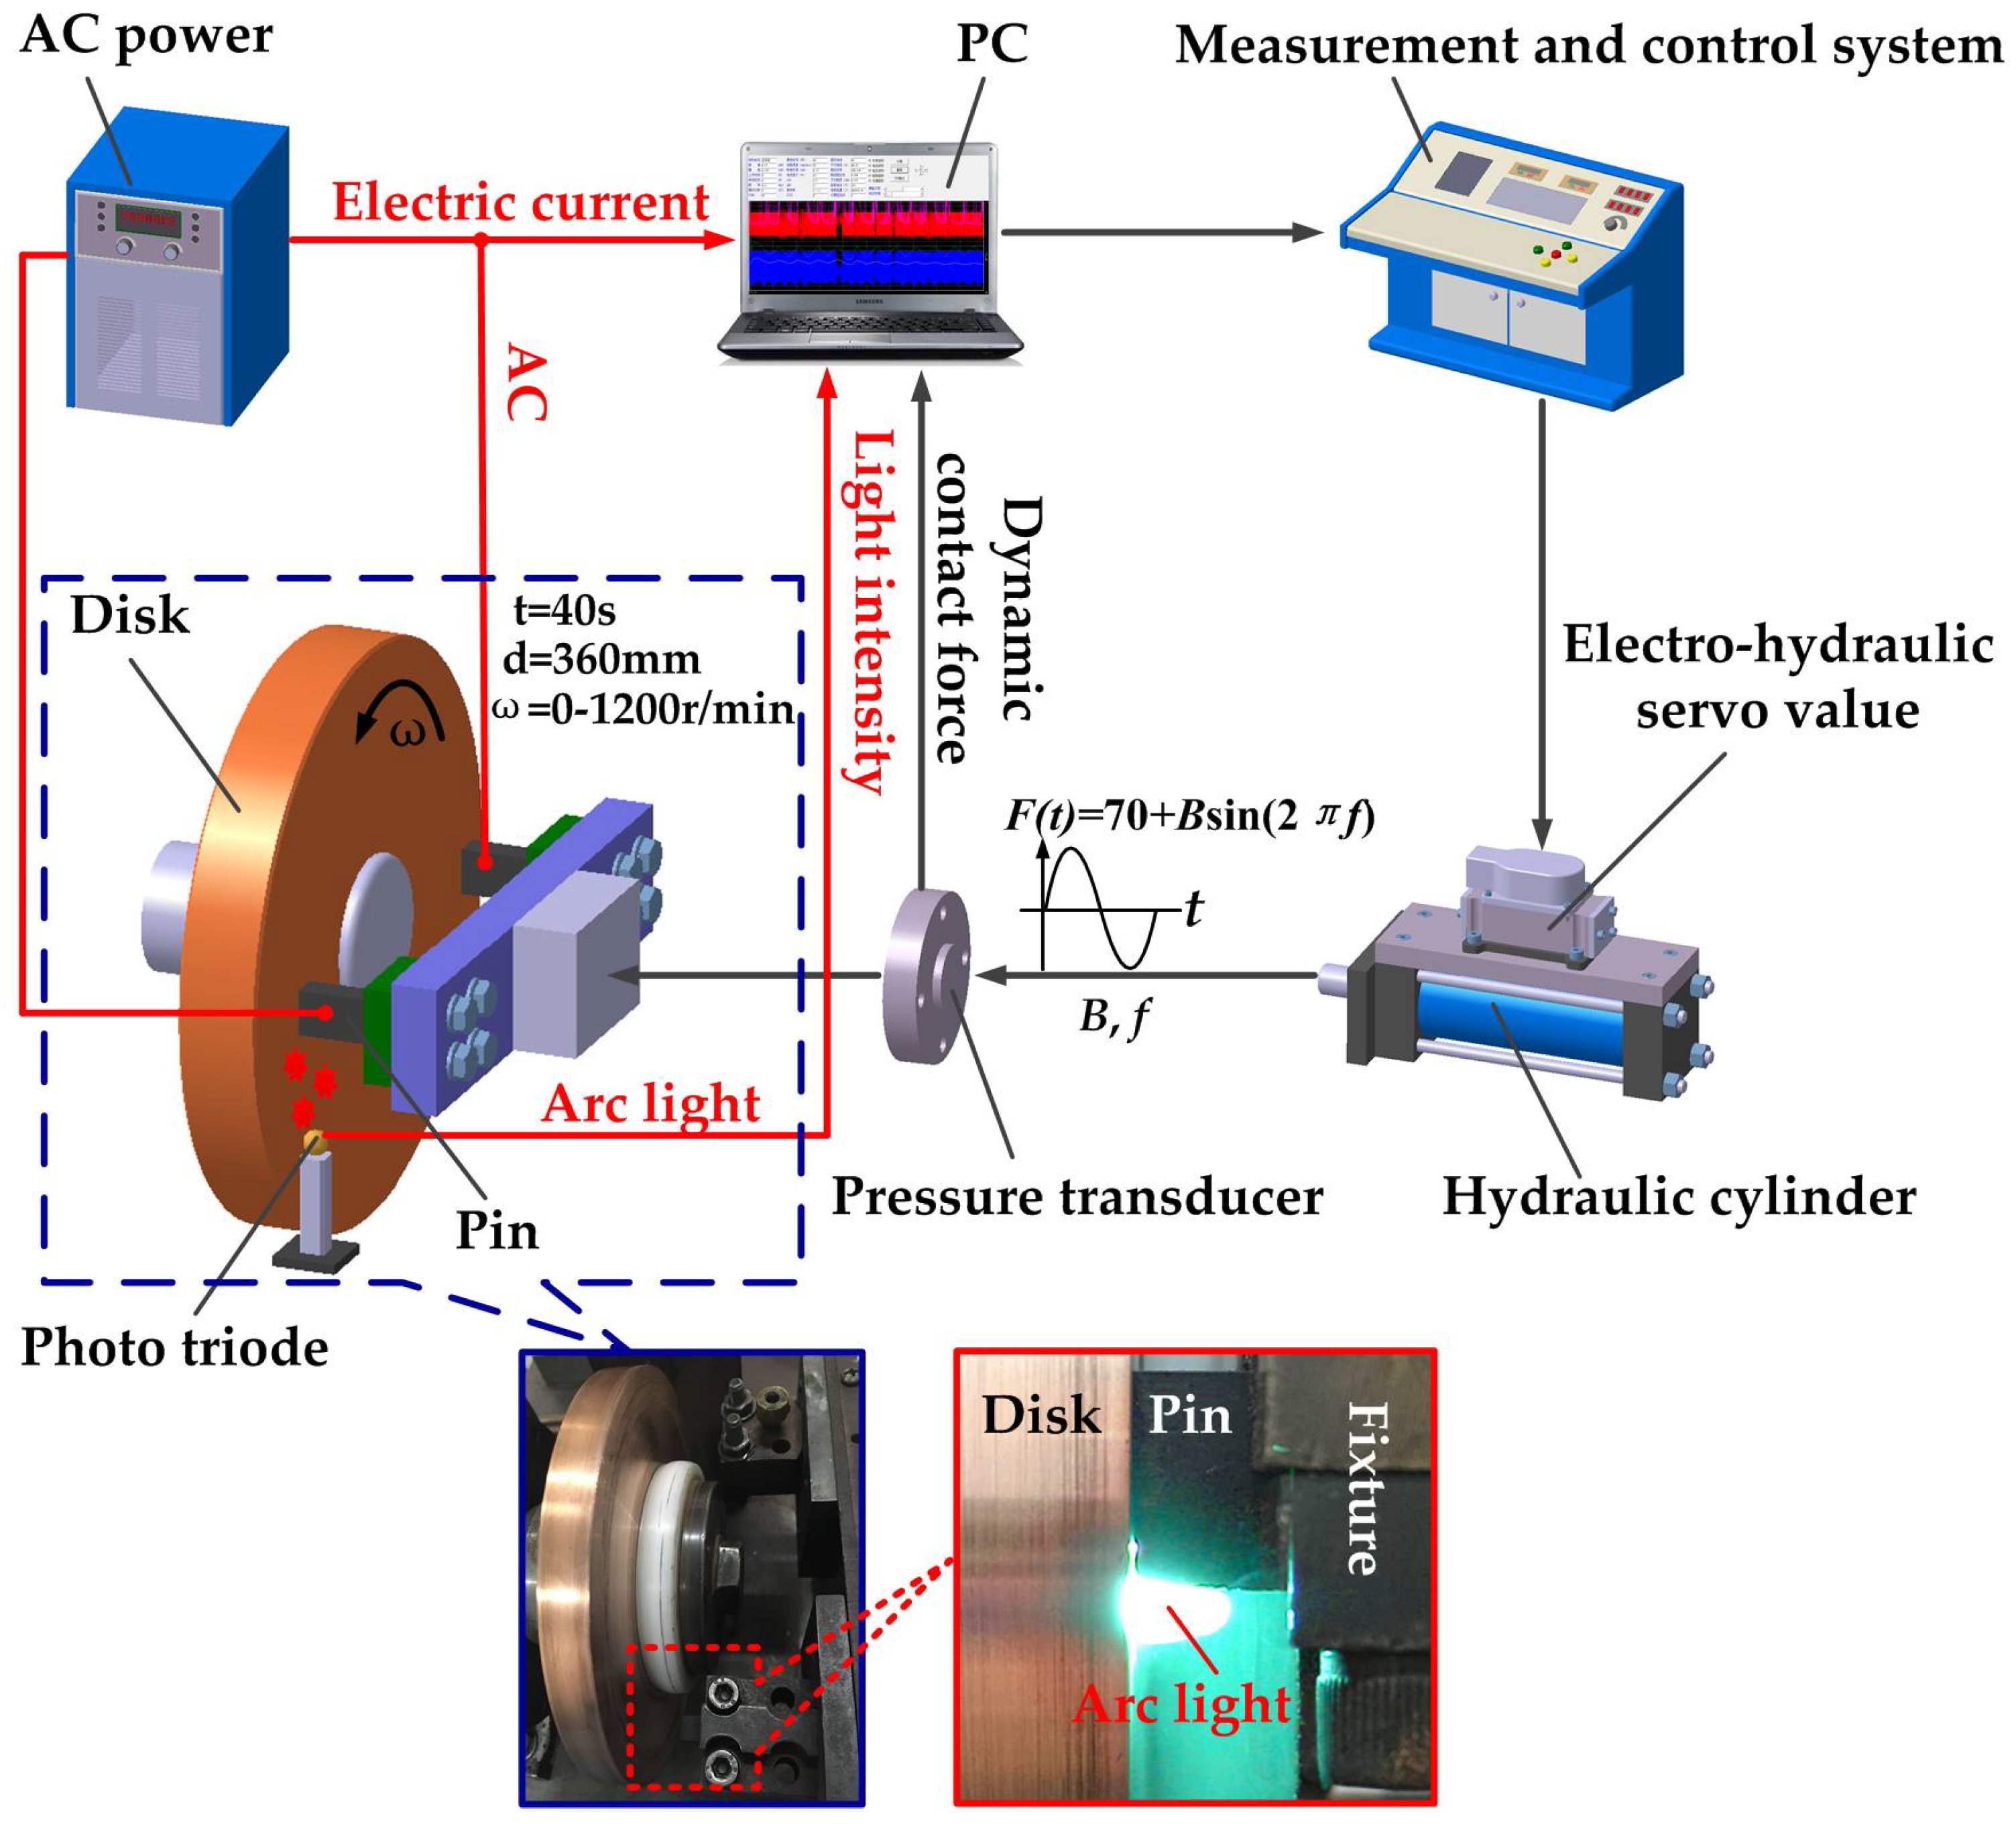
2.2. Test Equipment
3. Results and Discussion
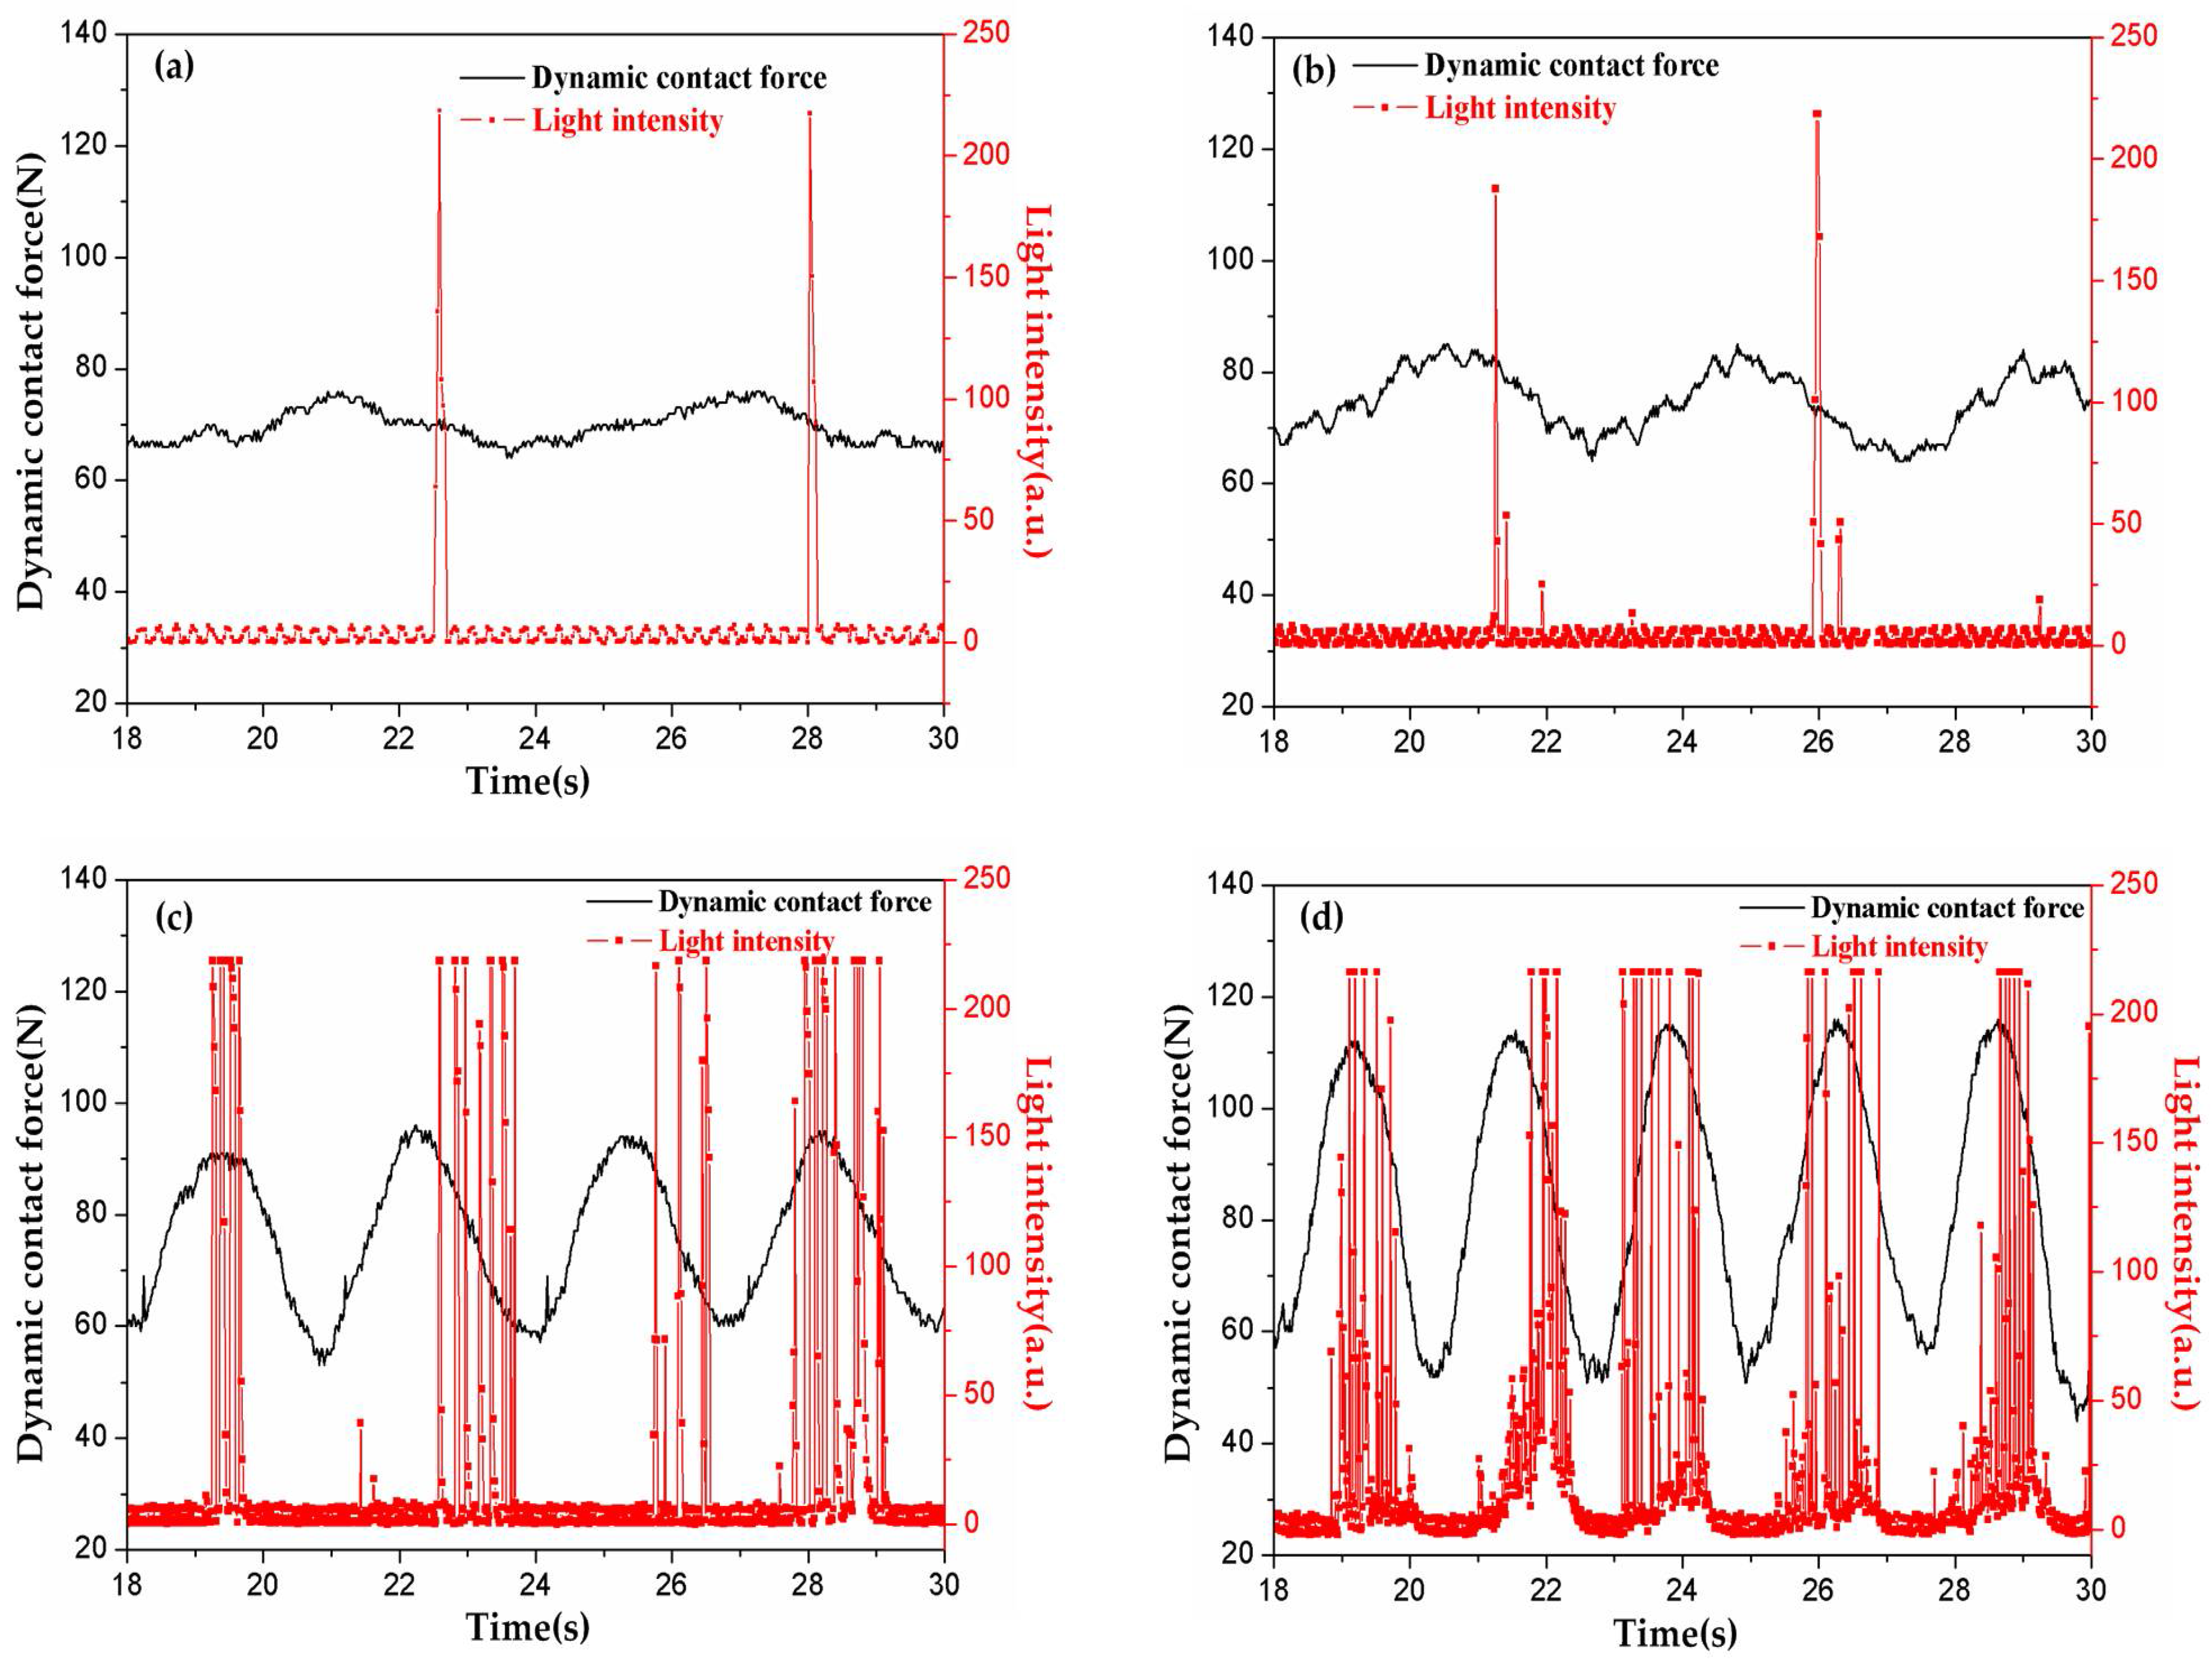
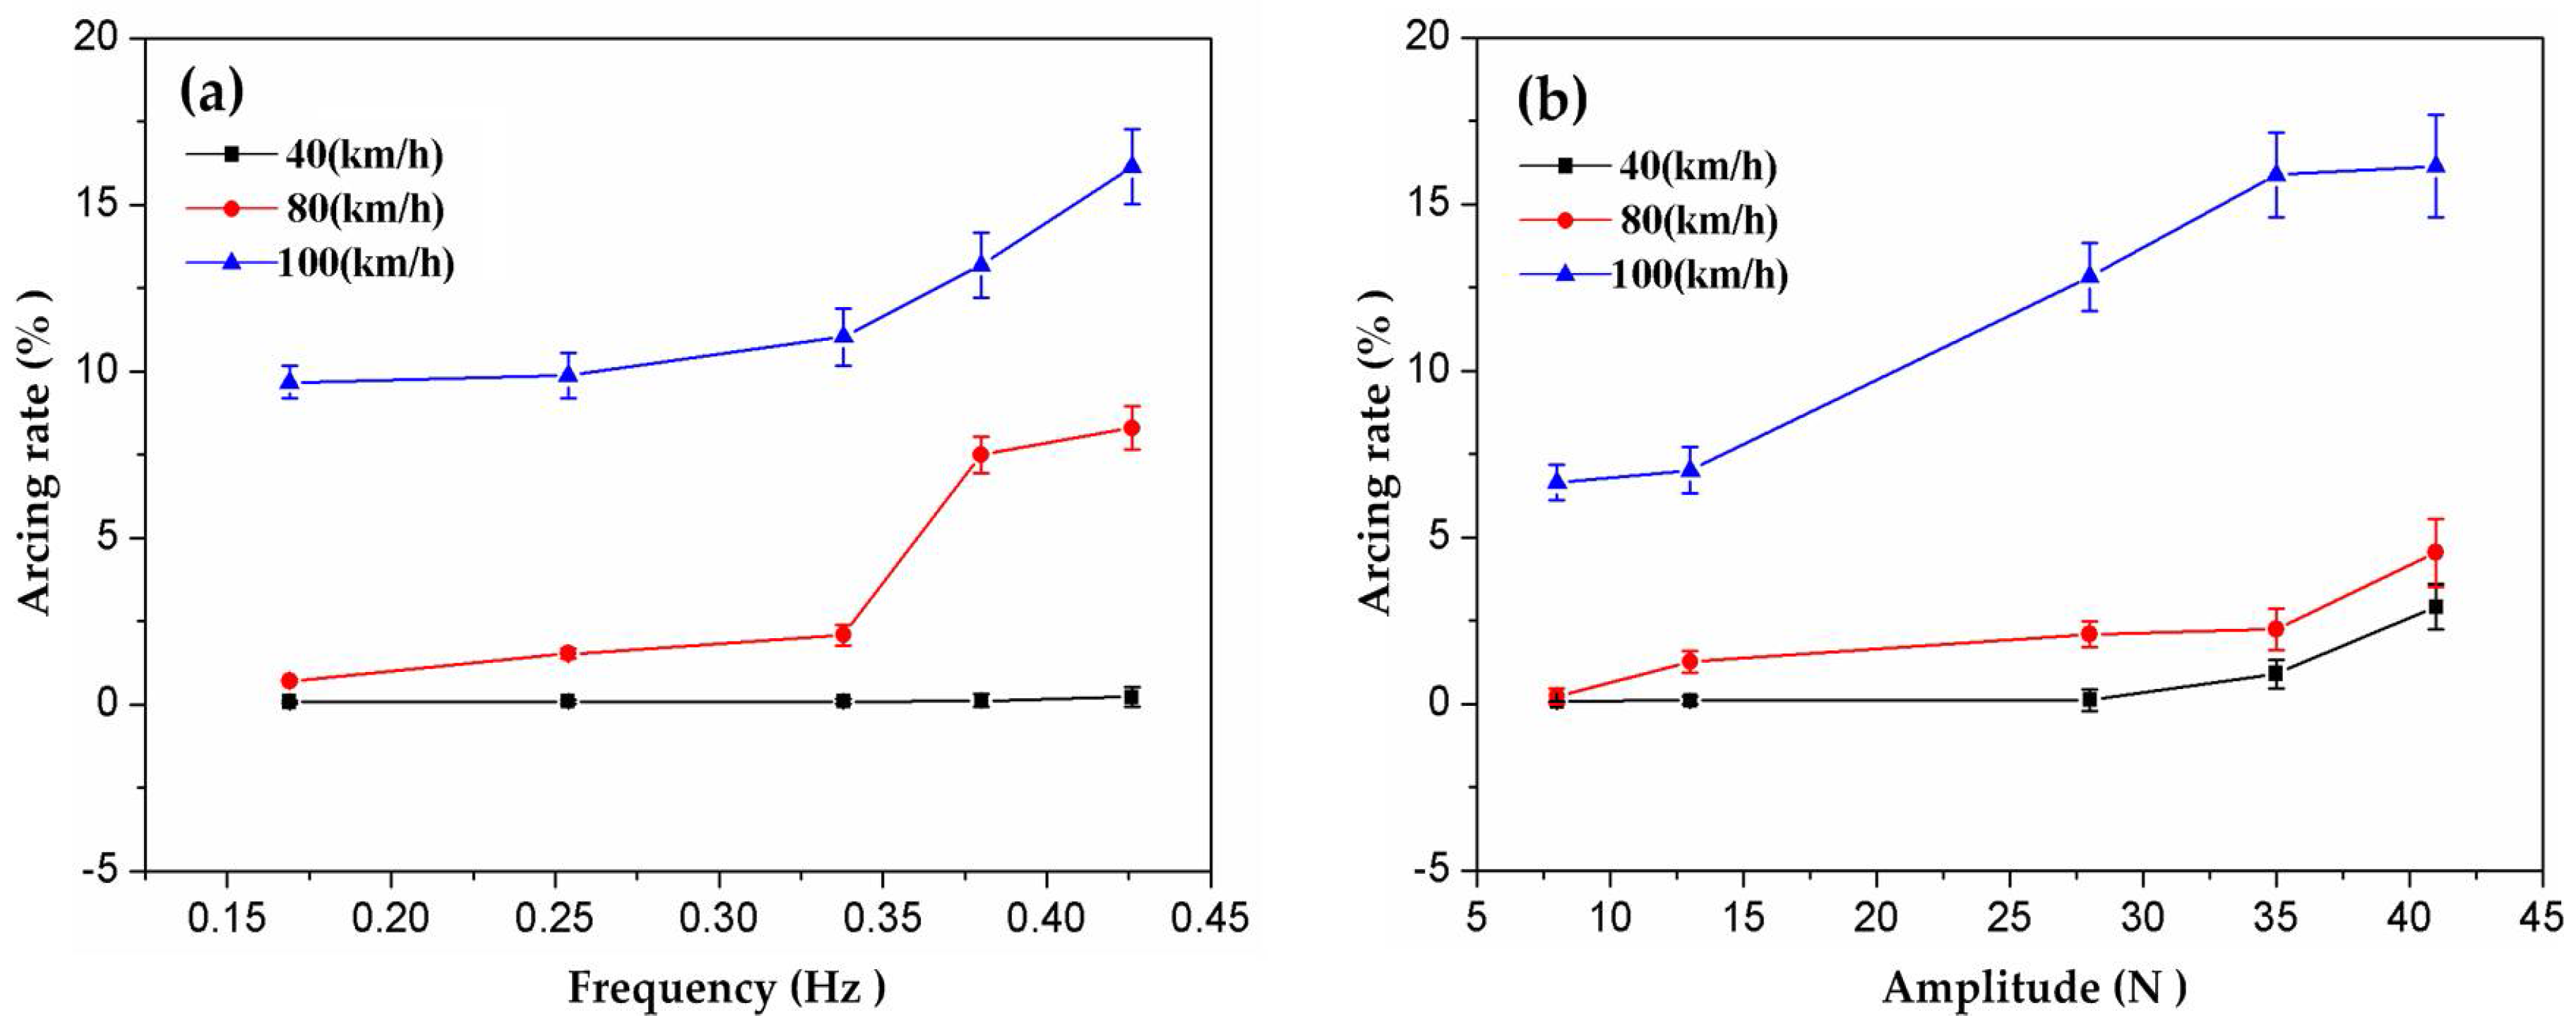
3.1. Arc Discharge Characteristics
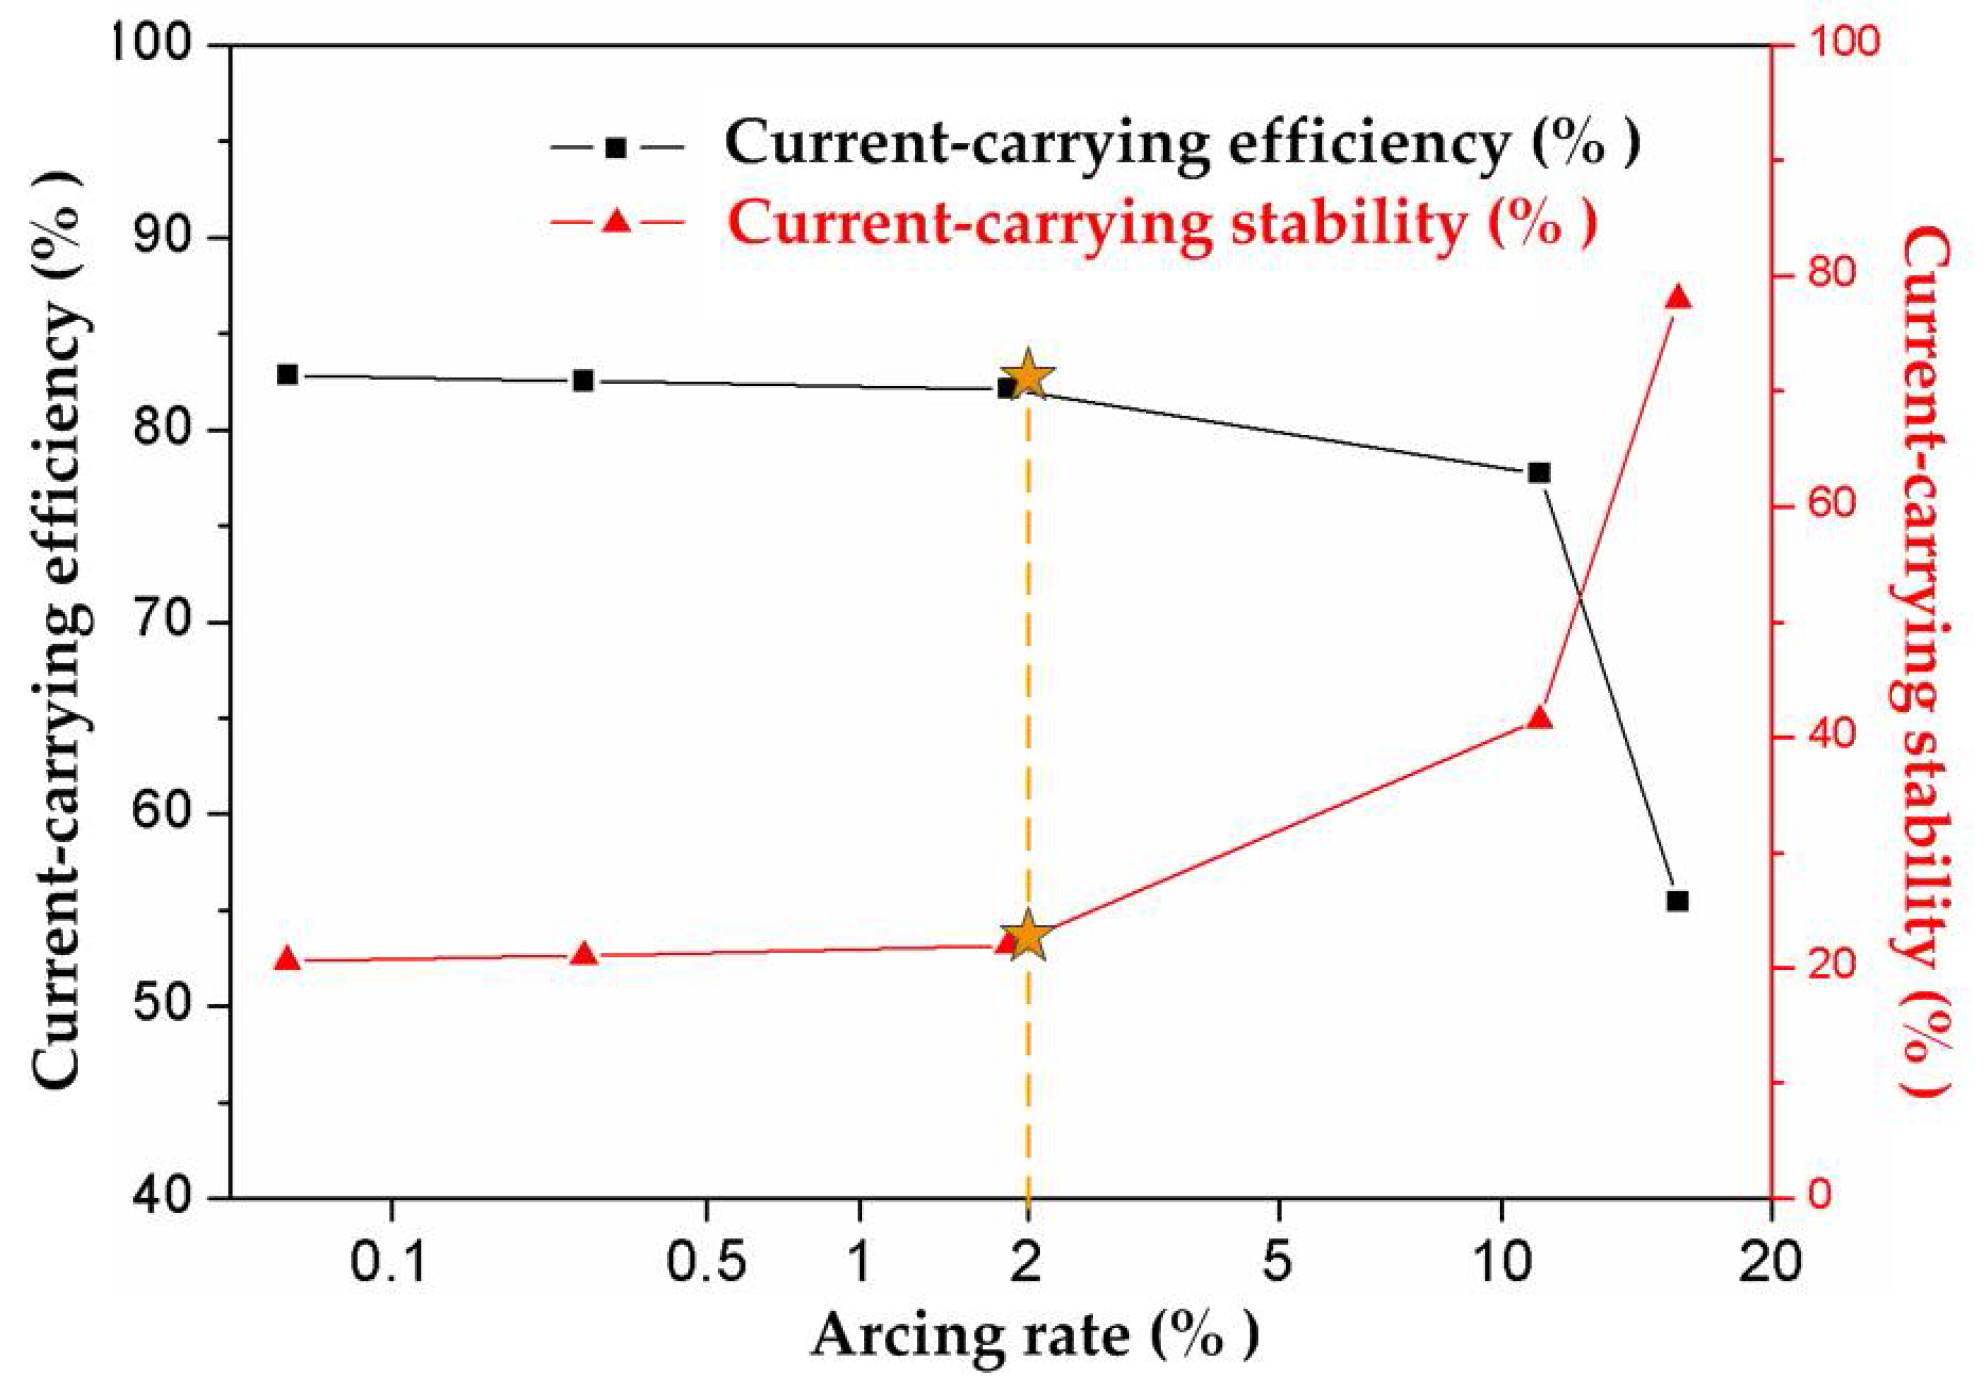
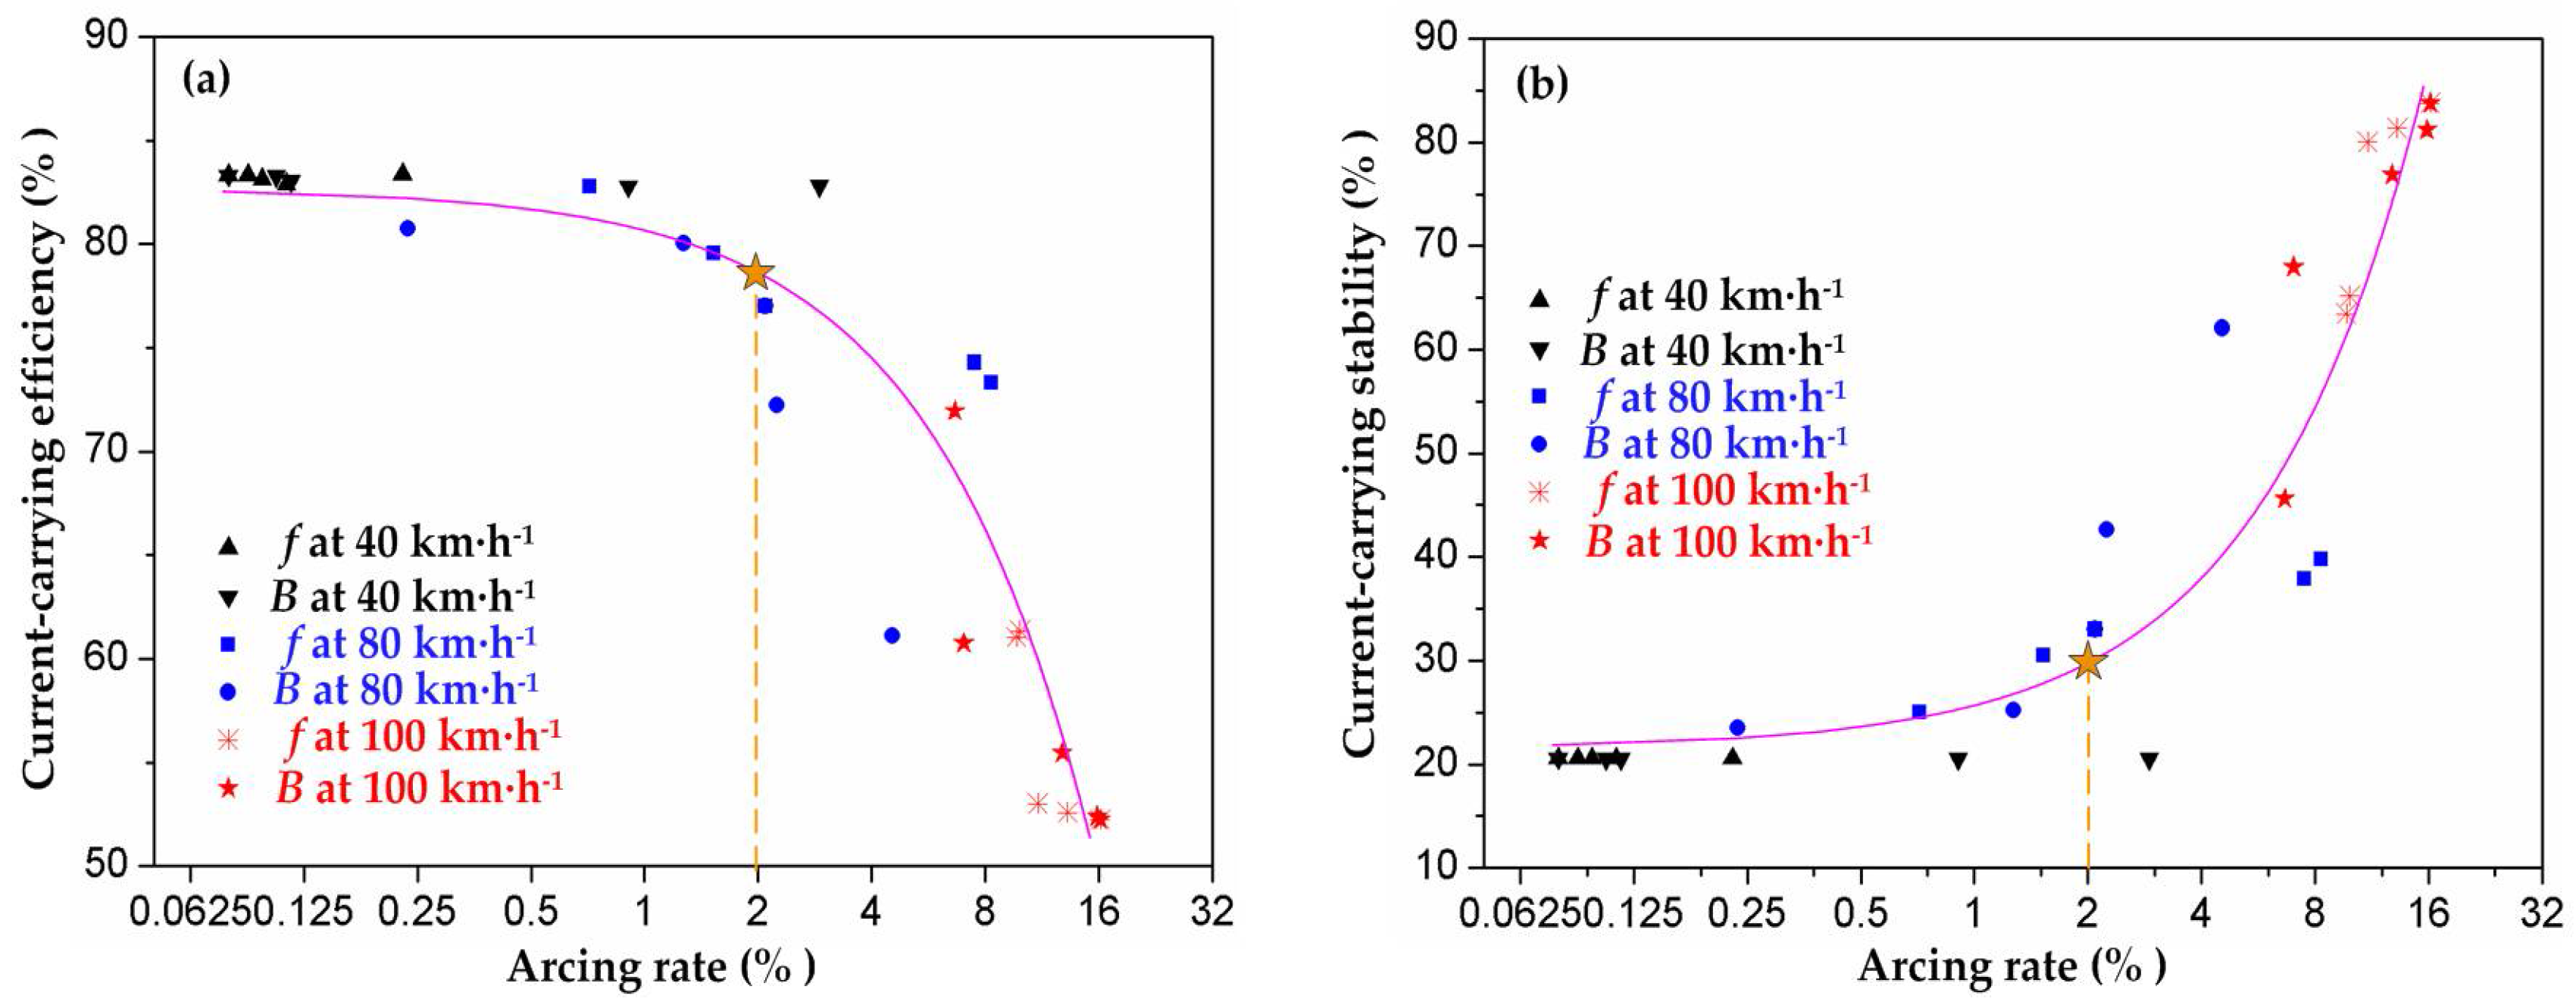
3.2. Effects of Arcing Rate on Current-Carrying Quality
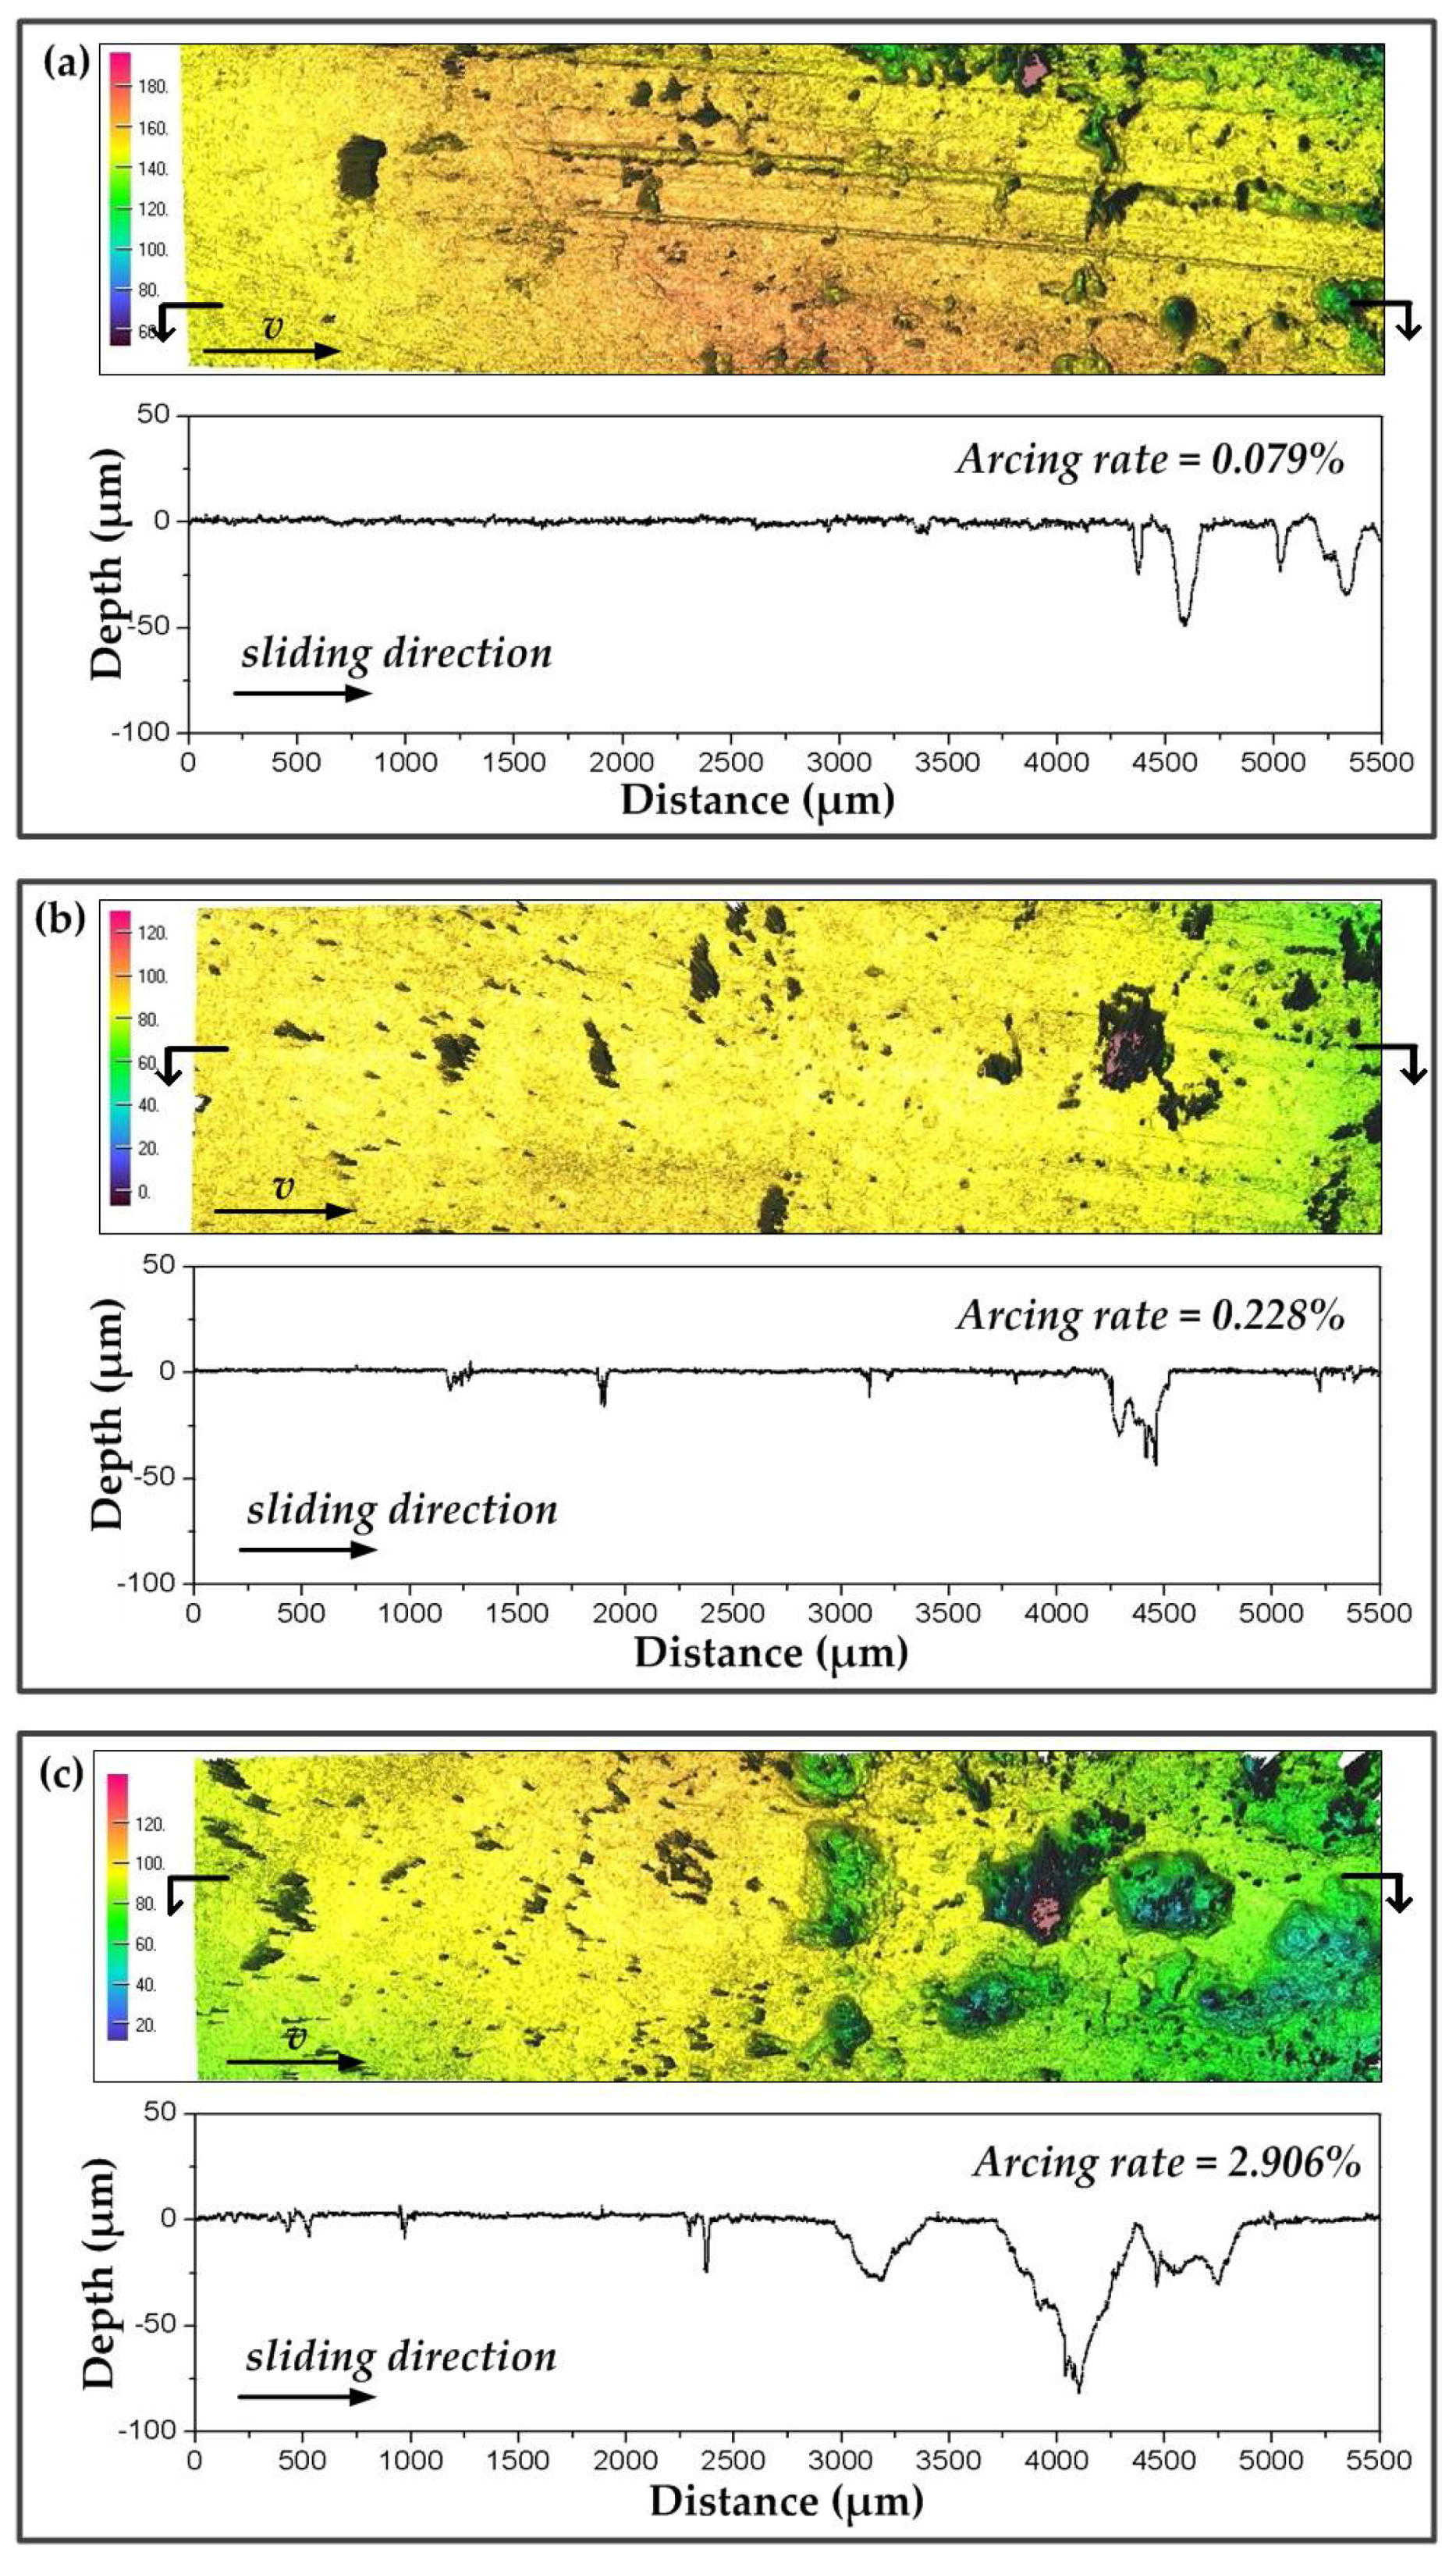
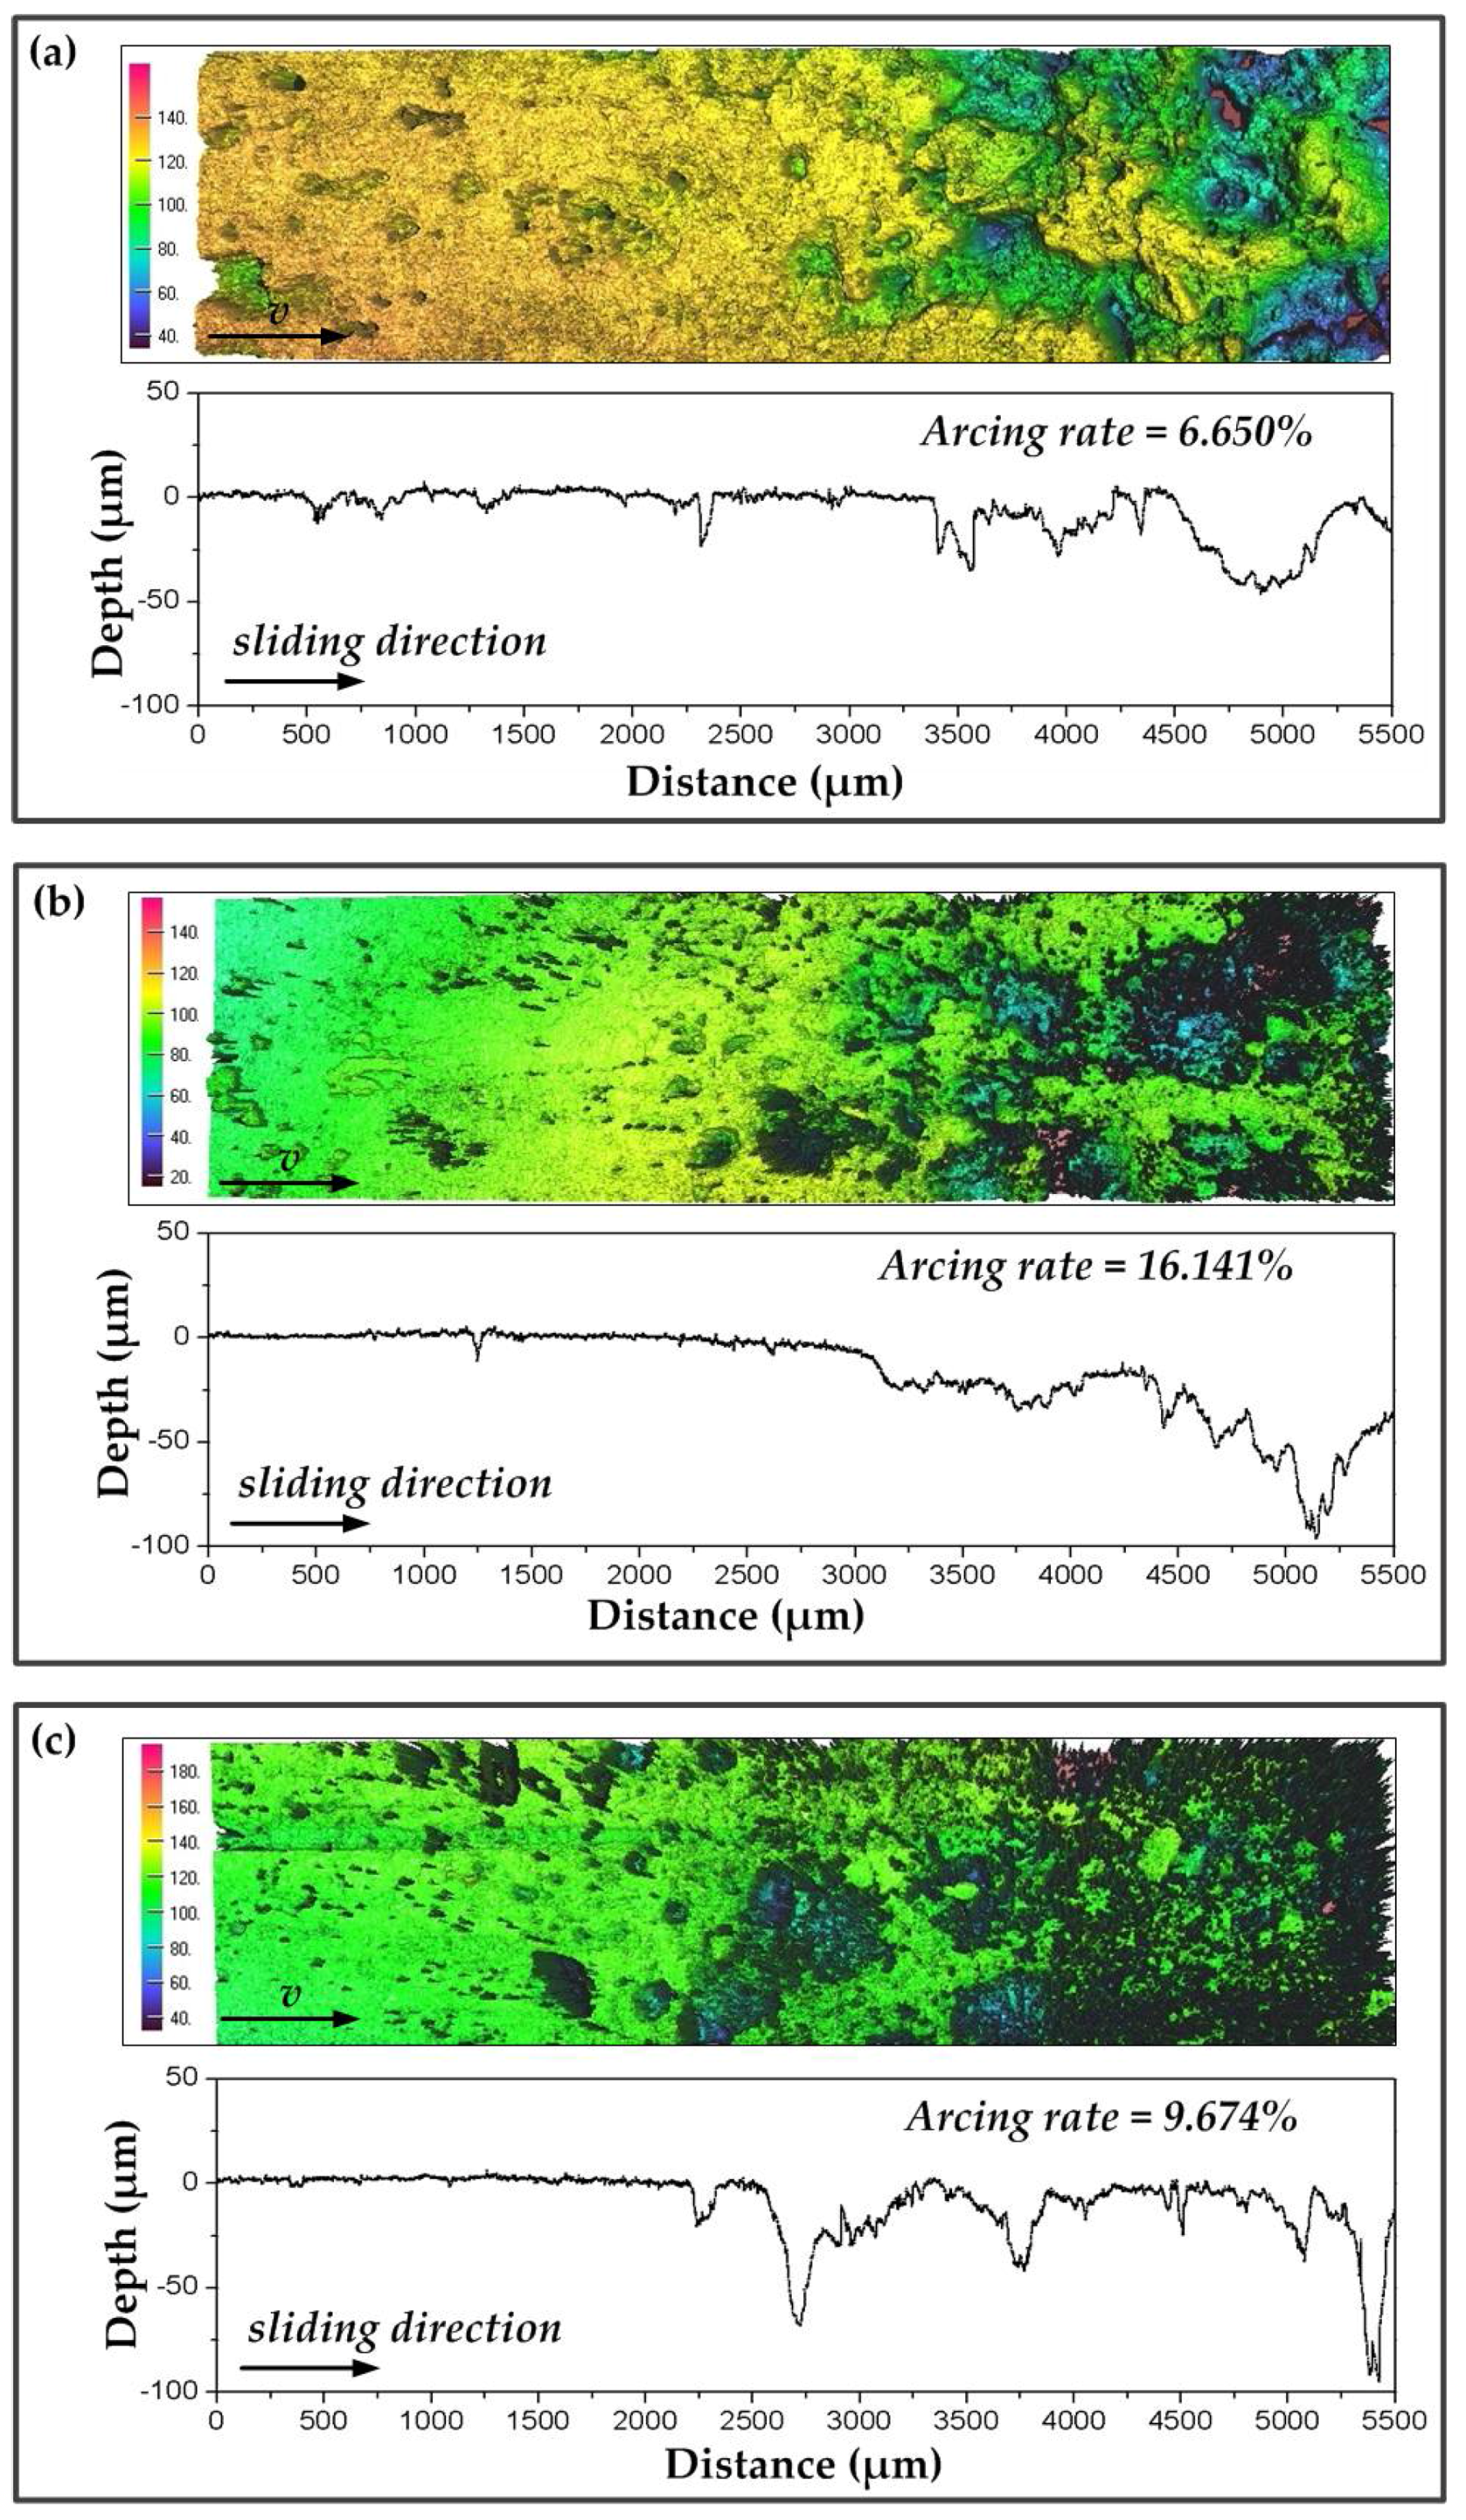
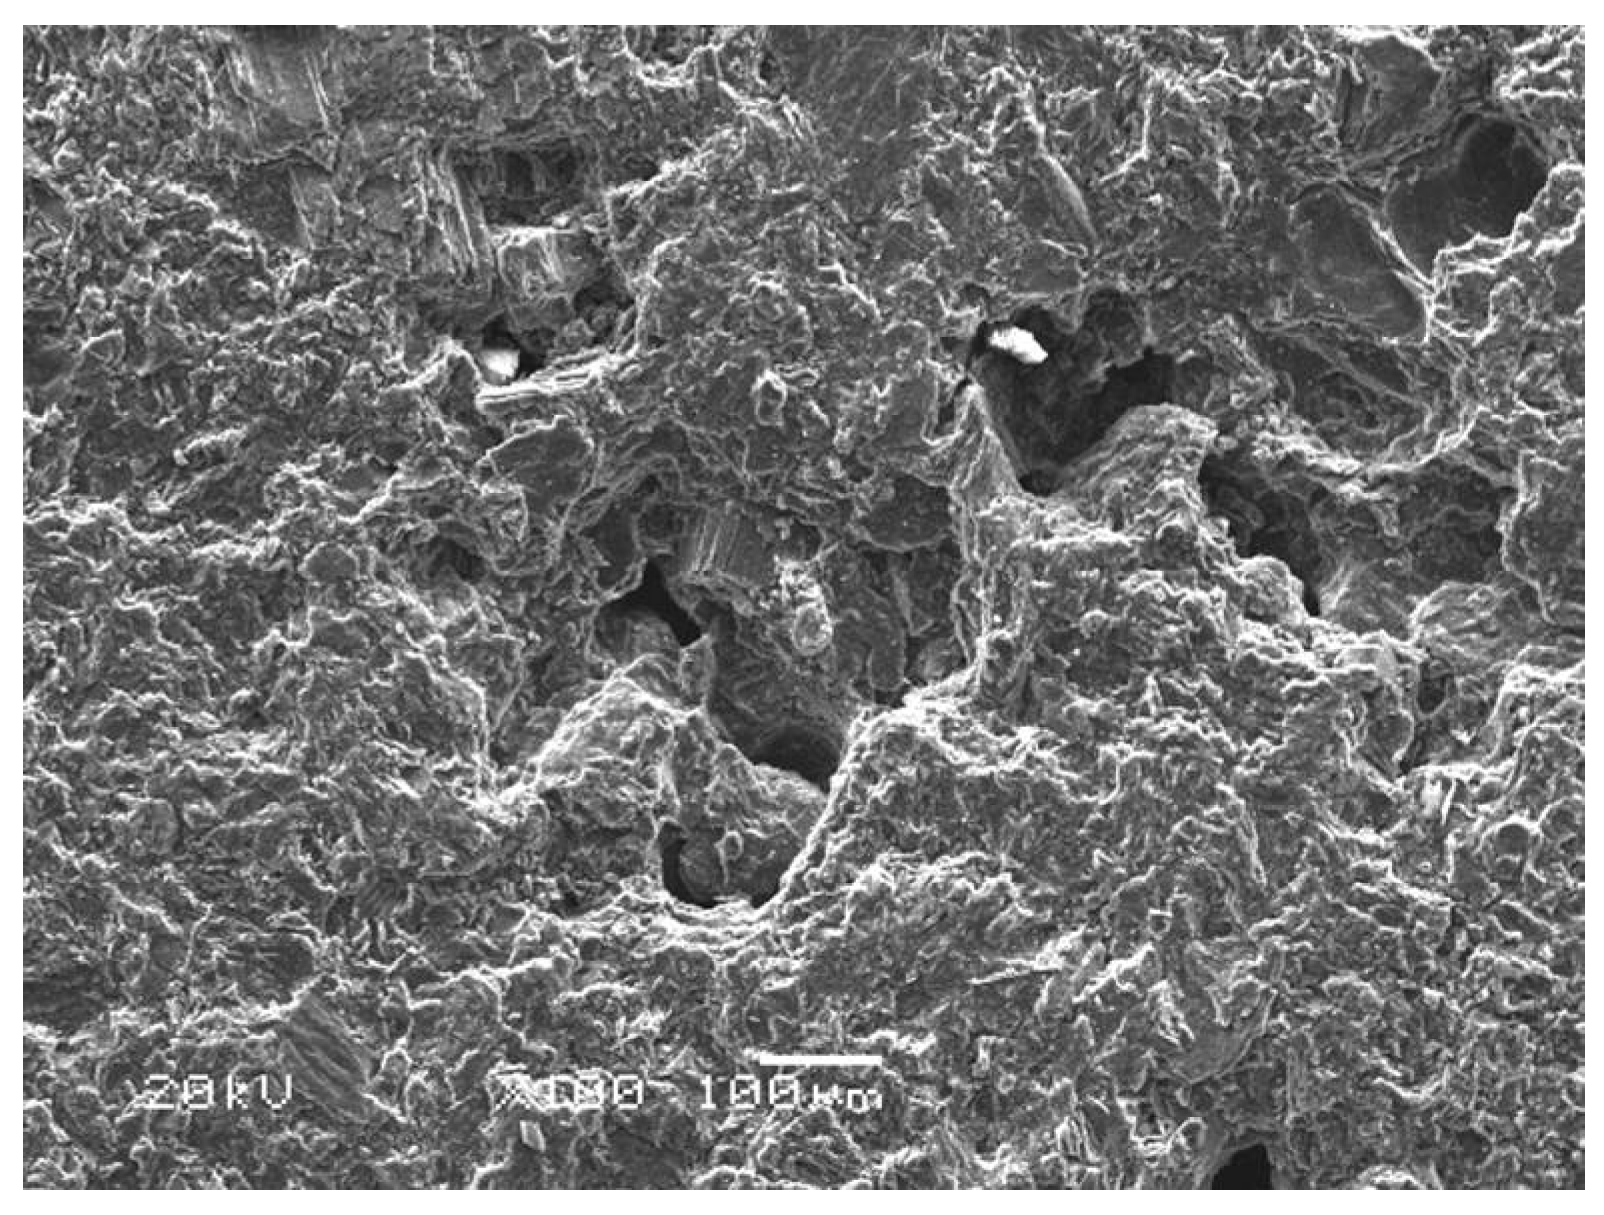
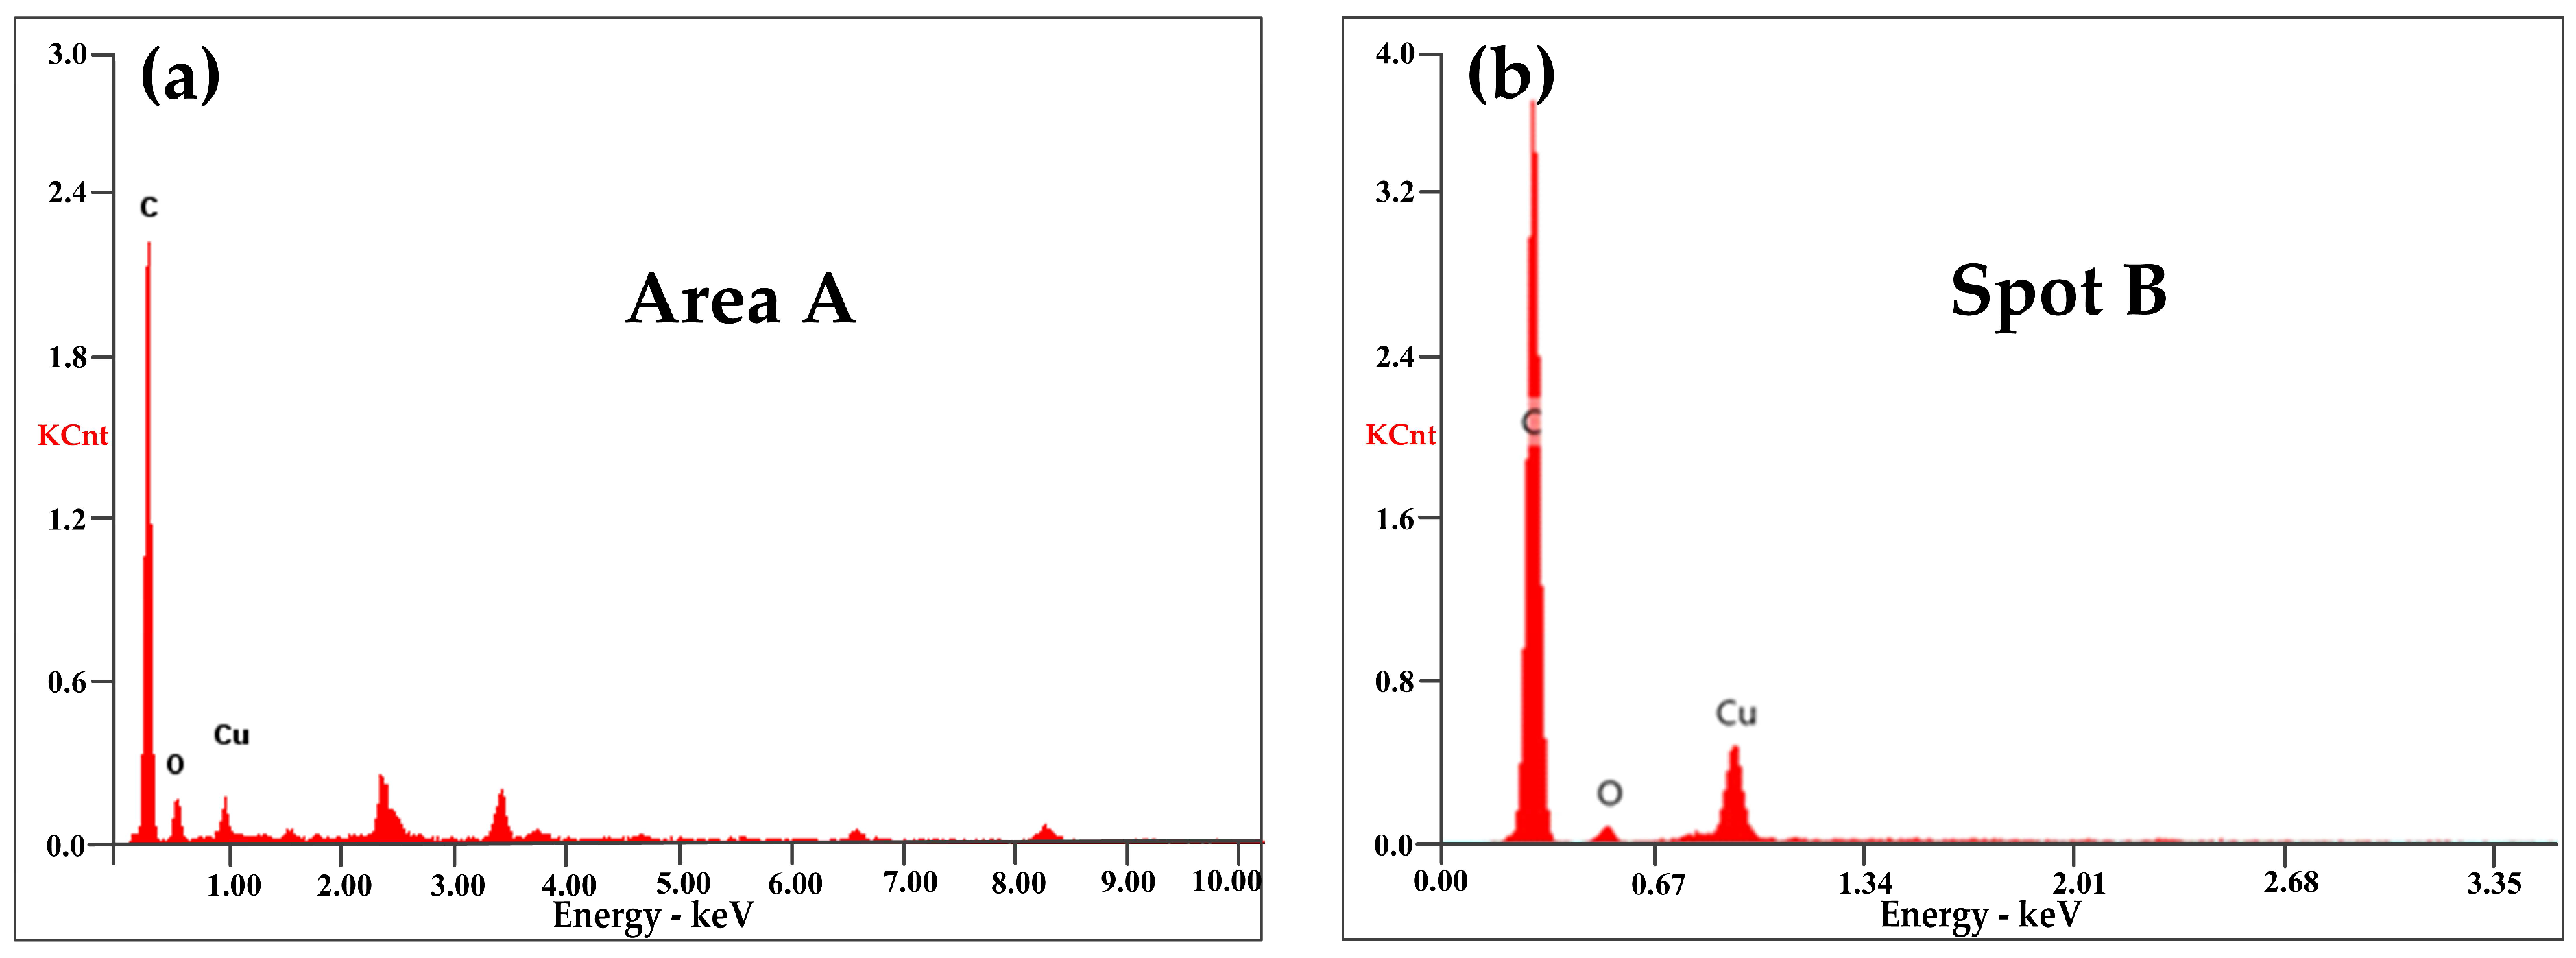
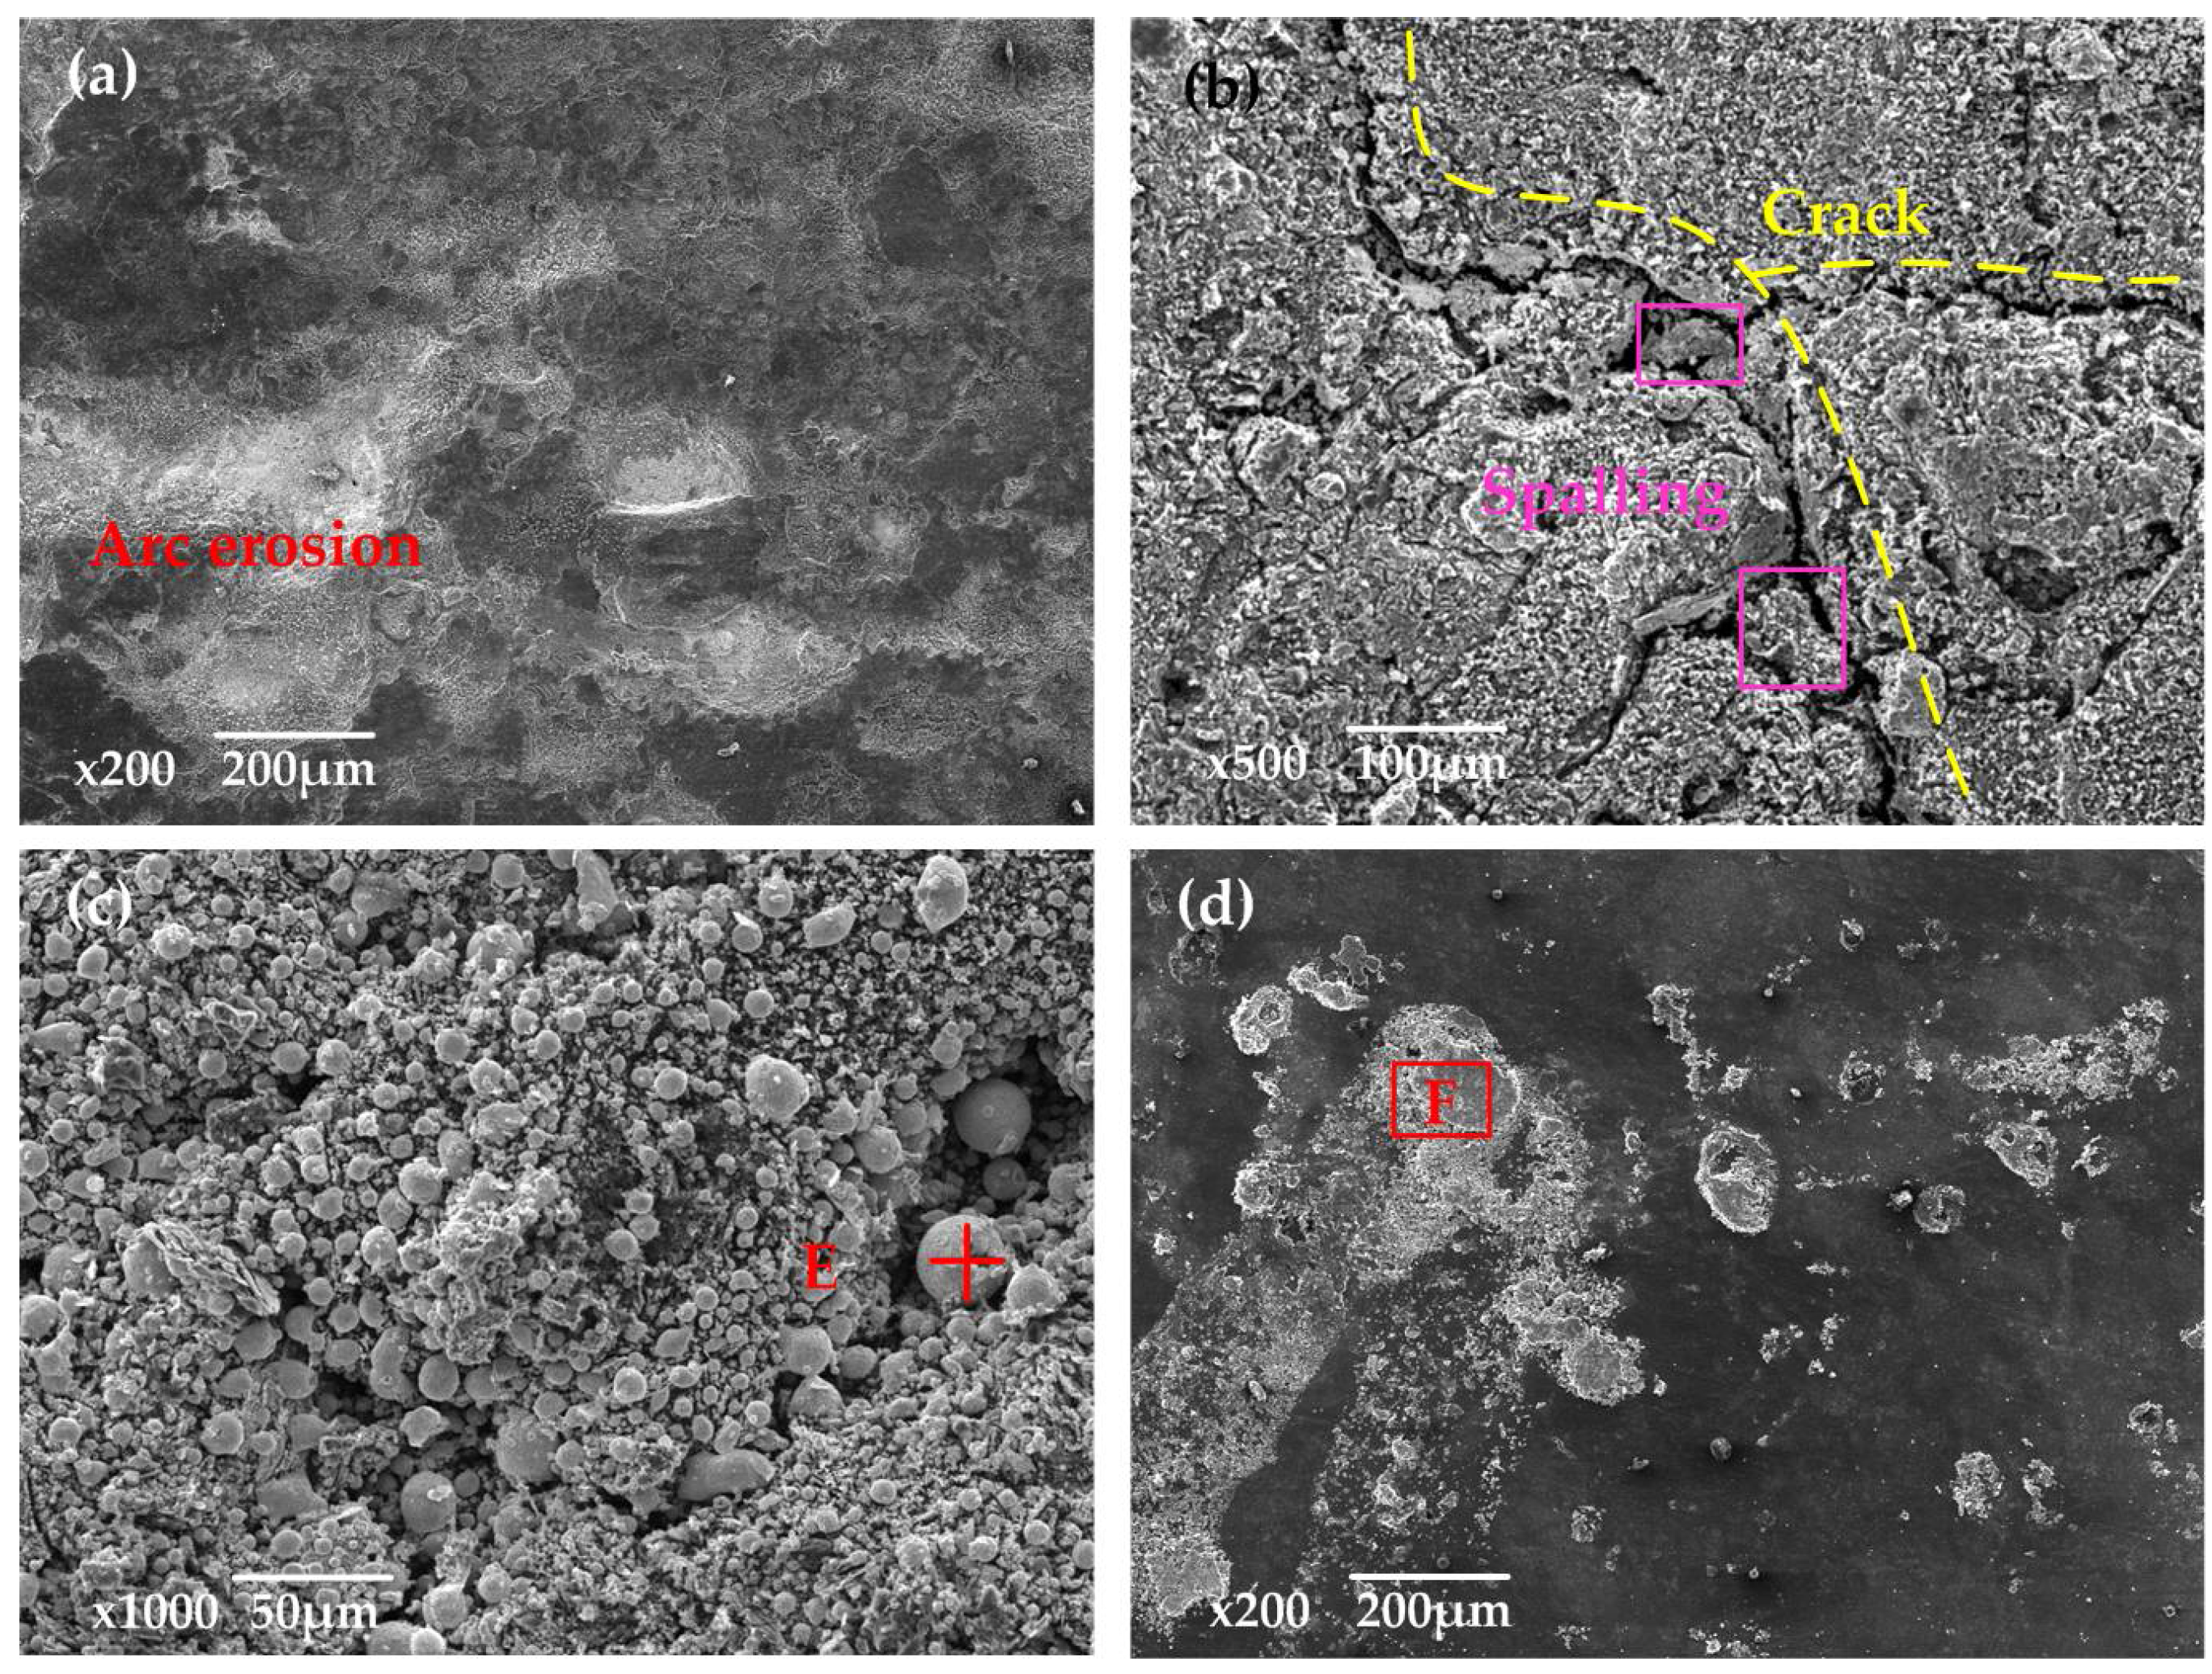
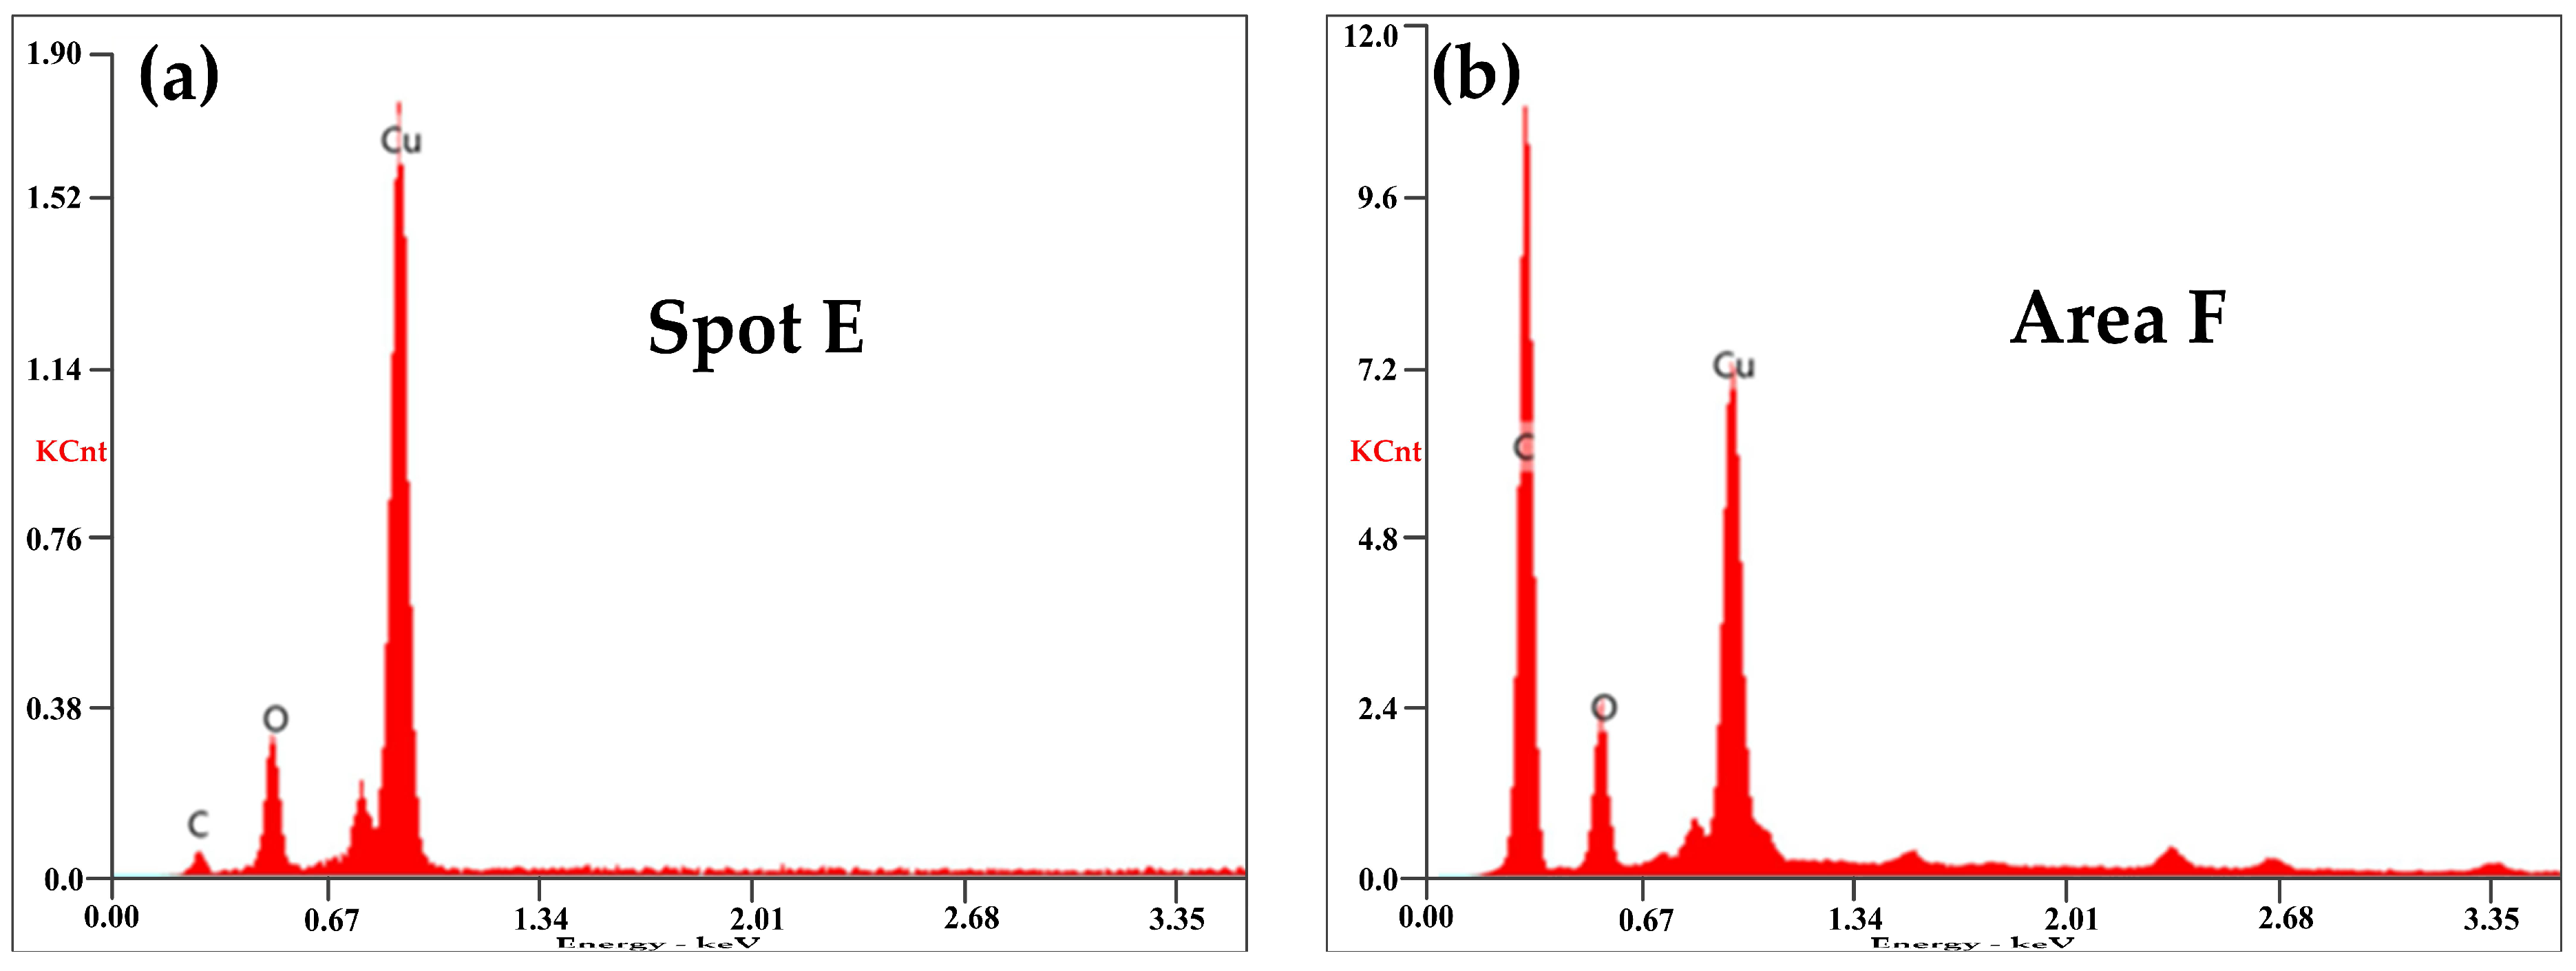
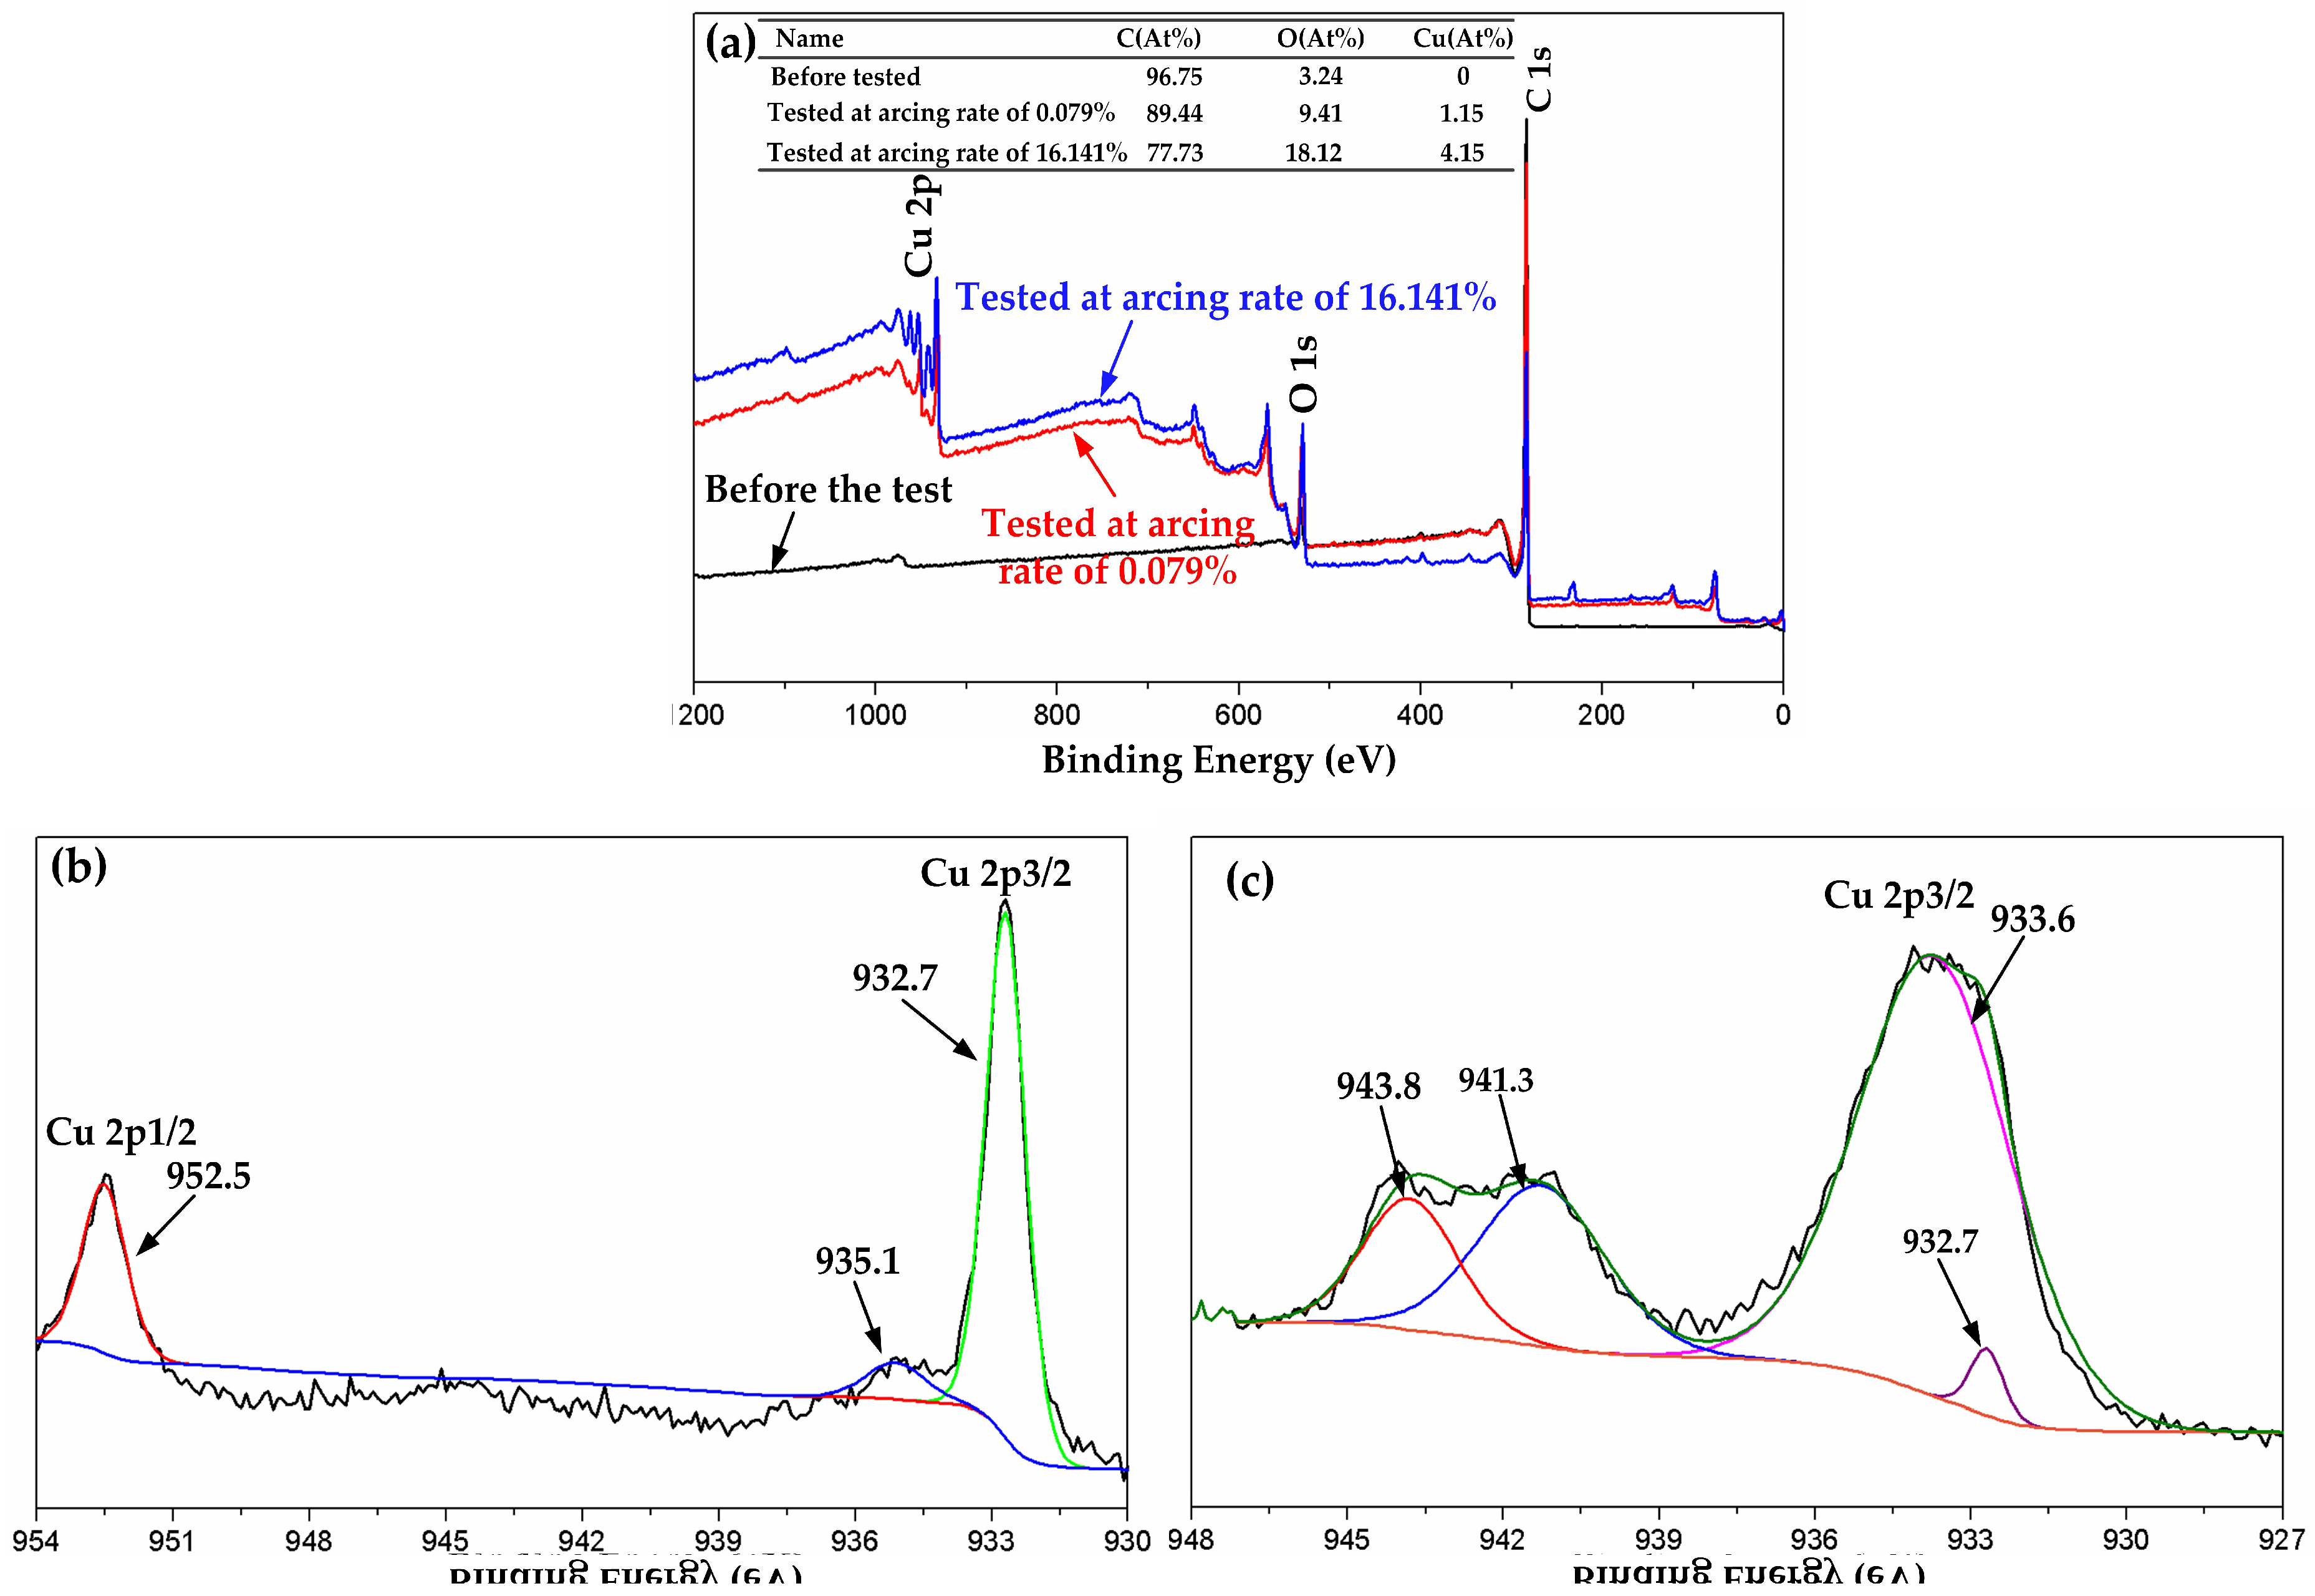
3.3. Effects of Arc Discharge on Damage to the Pure Carbon Strip
3.4. Arc Erosion Characteristics
4. Conclusions
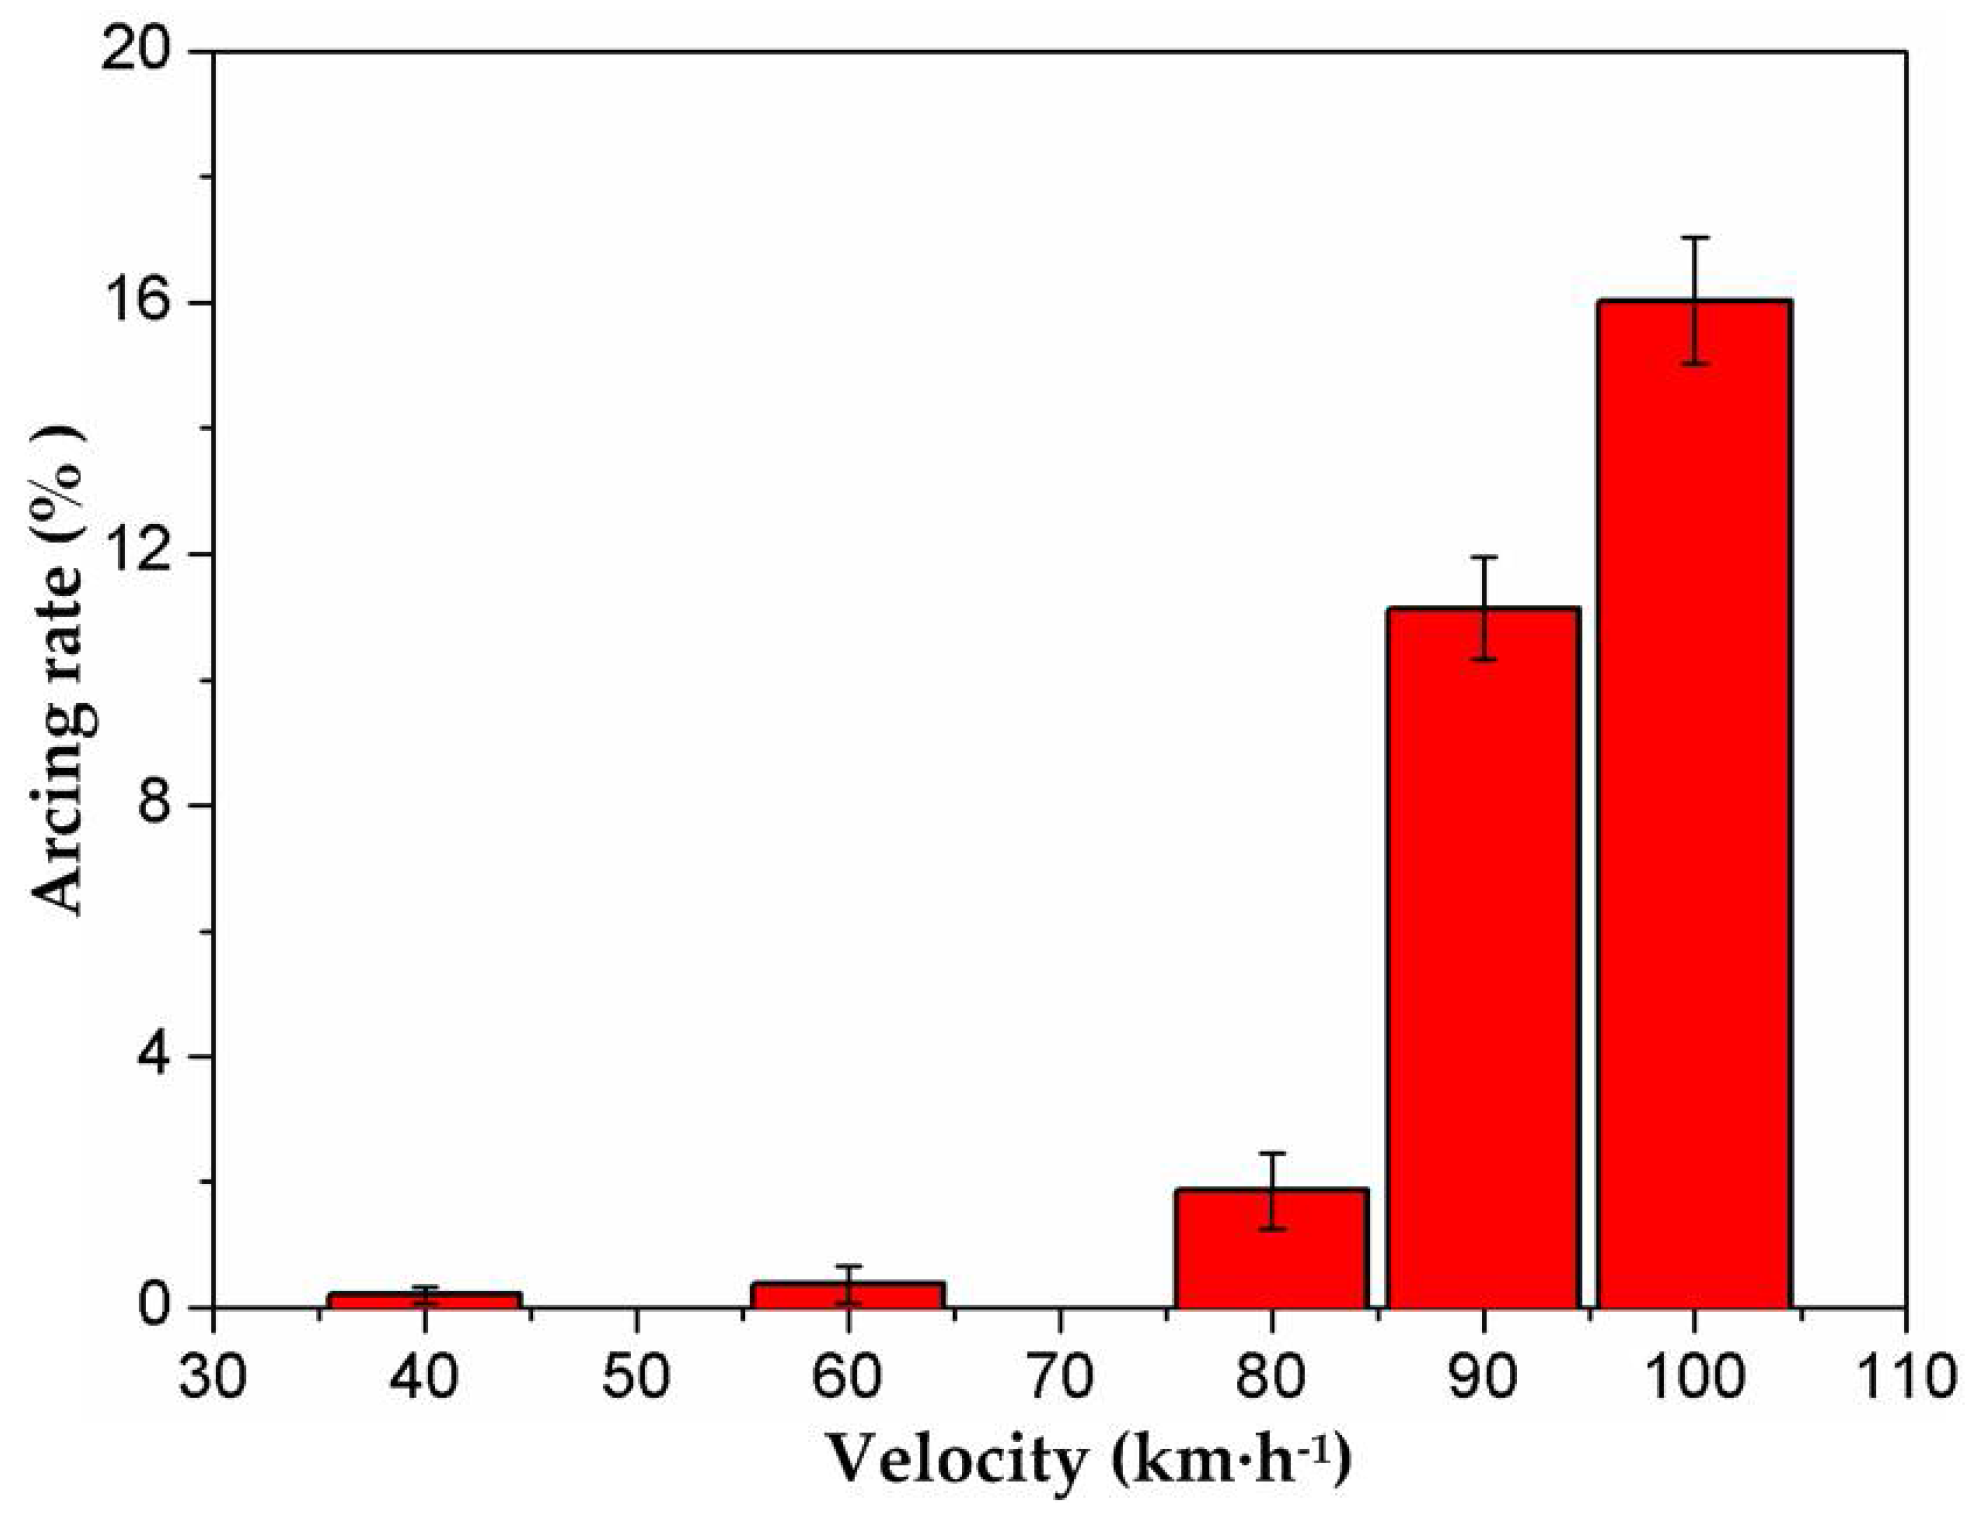
- Arc discharges of the pure carbon strip were produced periodically in accordance with the period of the dynamic contact force. The arcing rate increased with the increase of velocity in the same test duration (40 s). What is more, the increase of f and B led to the rising of the arcing rate. The faster the train ran, the more influence f and B had.
- Current-carrying qualities decreased with the increase of the arcing rate. A critical point of the arcing rate at around 2% was detected, lower than which the pure carbon strip maintained an excellent current-carrying capability. At a higher arcing rate, the current-carrying quality deteriorated abruptly.
- Based on SEM and XPS, obvious scratches and scale-like debris were detected at low arcing rates. Metal Cu was transferred from the QCr0.5 disk to the pins by abrasive wear. At high arcing rates, cracks with a number of CuO spherical particles were captured. This means that the wear mechanism transferred from mechanical wear to arc erosion with the increase of the arcing rate.
Author Contributions
Acknowledgments
Conflicts of Interest
References
- Ushio, M. Arc discharge and electrode phenomena. Pure Appl. Chem. 2009, 60, 809–814. [Google Scholar] [CrossRef][Green Version]
- Wu, C.P.; Yi, D.Q.; Weng, W.; Li, S.H.; Zhou, J.M.; Zheng, F. Arc erosion behavior of Ag/Ni electrical contact materials. Mater. Des. 2015, 85, 511–519. [Google Scholar] [CrossRef]
- Midya, S.; Bormann, D. Pantograph arcing in electrified railways—Mechanism and influence of various parameters—Part I: With DC traction power supply. IEEE Trans. Power Del. 2009, 24, 1931–1939. [Google Scholar] [CrossRef]
- Ashraf, A.; Yaqub, K.; Javeed, S.; Zeeshan, S.; Khalid, R.; Janjua, S.A.; Ahmad, S. Sublimation of graphite in continuous and pulsed arc discharges. Turk. J. Phys. 2010, 34, 33–42. [Google Scholar]
- Kubo, S.; Kato, K. Effect of arc discharge on the wear rate and wear mode transition of a copper-impregnated metallized carbon contact strip sliding against a copper disk. Tribol. Int. 1999, 32, 367–378. [Google Scholar] [CrossRef]
- Chen, G.X.; Yang, H.J.; Zhang, W.H.; Zhang, X.; Wang, S.D. Experimental study on arc ablation occurring in a contact strip rubbing against a contact wire with electrical current. Tribol. Int. 2013, 61, 88–94. [Google Scholar] [CrossRef]
- Xiong, X.Z.; Tu, C.J.; Chen, D.; Zhang, J.Q.; Ding, C.J. Arc erosion wear characteristics and mechanisms of pure carbon strip against copper under arcing conditions. Tribol. Lett. 2014, 53, 293–301. [Google Scholar] [CrossRef]
- Yang, Z.H.; Zhang, Y.Z.; Zhao, F.; Shangguan, B. Dynamic variation of arc discharge during current-carrying sliding and its effect on directional erosion. Tribol. Int. 2016, 94, 71–76. [Google Scholar] [CrossRef]
- Ding, T.; Chen, G.X.; Bu, J.; Zhang, W.H. Effect of temperature and arc discharge on friction and wear behaviours of carbon strip/copper contact wire in pantograph-catenary systems. Wear 2011, 271, 1629–1636. [Google Scholar] [CrossRef]
- Shangguan, B.; Zhang, Y.Z.; Xing, J.D.; Sun, L.M.; Chen, Y. Comparative study on wear behaviors of metal-impregnated carbon material and C/C composite under electrical sliding. Tribol. Trans. 2010, 53, 933–938. [Google Scholar] [CrossRef]
- Lin, X.Z.; Zhu, M.H.; Mo, J.L.; Chen, G.X.; Jin, X.S.; Zhou, Z.R. Tribological and electric-arc behaviors of carbon/copper pair during sliding friction process with electric current applied. Trans. Nonferr. Met. Soc. China 2011, 21, 292–299. [Google Scholar] [CrossRef]
- Jia, S.G.; Liu, P.; Ren, F.Z.; Tian, B.H.; Zheng, M.S.; Zhou, J.S. Sliding wear behavior of copper alloy contact wire against copper-based strip for high-speed electrified railways. Wear 2007, 262, 772–777. [Google Scholar] [CrossRef]
- He, D.H.; Manory, R. A novel electrical contact material with improved self-lubrication for railway current collectors. Wear 2001, 249, 626–636. [Google Scholar] [CrossRef]
- Zhang, W.H.; Mei, G.M.; Wu, X.J.; Shen, Z.Y. Hybrid simulation of dynamics for the pantograph-catenary system. Veh. Syst. Dyn. 2002, 38, 393–414. [Google Scholar] [CrossRef]
- Lee, J.H.; Kim, Y.G.; Paik, J.S.; Park, T.W. Performance evaluation and design optimization using differential evolutionary algorithm of the pantograph for the high-speed train. J. Mech. Sci. Technol. 2012, 26, 3253–3260. [Google Scholar] [CrossRef]
- Cho, Y.H. Numerical simulation of the dynamic responses of railway overhead contact lines to a moving pantograph, considering a nonlinear dropper. J. Sound Vib. 2008, 315, 433–454. [Google Scholar] [CrossRef]
- Metrikine, A.V.; Bosch, A.L. Dynamic response of a two-level catenary to a moving load. J. Sound Vib. 2006, 292, 676–693. [Google Scholar] [CrossRef]
- Finner, L.; Poetsch, G.; Sarnes, B.; Kolbe, M. Program for catenary-pantograph analysis, PrOSA statement of methods and validation according EN 50318. Veh. Syst. Dyn. 2015, 53, 305–313. [Google Scholar] [CrossRef]
- Liu, Y.; Zhang, W.H.; Mei, G.M. Study of dynamic stress of the catenary in the pantograph/catenary vertical coupling movement. J. China Railw. Soc. 2003, 25, 23–26. [Google Scholar]
- Mei, G.M.; Zhang, W.H. Dynamic model and behavior of pantograph catenary system. J. Traffic Transp. Eng. 2002, 2, 20–25. [Google Scholar]
- Fu, X.T.; Zhang, F.S. Numerical simulation and experimental studies on coupling dynamics of wheel /rail-pantograph /catenary whole system. J. China Railw. Soc. 1998, 20, 25–32. [Google Scholar]
- Rauter, F.G.; Pombo, J.; Ambrósio, J.; Chalansonnet, J.; Bobillot, A. Contact model for the pantograph-catenary interaction. Math. Comput. Simulat. 2007, 1, 447–457. [Google Scholar] [CrossRef]
- Balestrino, A.; Bruno, O.; Landi, A.; Sani, L. Innovative solutions for overhead catenary-pantograph system: Wire Actuated Control and Observed Contact Force. Veh. Syst. Dyn. 2000, 33, 69–89. [Google Scholar] [CrossRef]
- Collina, A.; Bruni, S. Numerical simulation of pantograph-overhead equipment Interaction. Veh. Syst. Dyn. 2002, 38, 261–291. [Google Scholar] [CrossRef]
- Zhang, W.H.; Zhou, N.; Li, R.P.; Mei, G.M.; Song, D.L. Pantograph and catenary system with double pantographs for high-speed trains at 350 km/h or higher. J. Mod. Transp. 2011, 19, 7–11. [Google Scholar] [CrossRef]
- Laurent, C.; Massat, J.P.; Nguyent-Tajan, T.M.L.; Bianchi, J.P.; Balmes, E. Pantograph catenary dynamic optimisation based on advanced multi-body and finite element co-simulation tools. Veh. Syst. Dyn. 2014, 52, 338–354. [Google Scholar]
- Massat, J.P.; Laine, J.P.; Bobillot, A. Pantograph–catenary dynamics simulation. Veh. Syst. Dyn. 2006, 44, 551–559. [Google Scholar] [CrossRef]
- Moulder, J.F.; Stickle, W.F.; Sobol, P.E.; Bomben, K.D. Handbook of X-ray Photoelectron Spectroscopy, 2nd ed.; Perkin-Elmer Corporation, Physical Electronics Division: Eden Prairie, MN, USA, 1992; pp. 86–87. ISBN 0-9627026-2-5. [Google Scholar]
- Abrahamson, J. Graphite sublimation temperatures, carbon arcs and crystallite erosion. Carbon 1974, 12, 111–141. [Google Scholar] [CrossRef]
- Hu, Y.; Chen, G.X.; Gao, G.Q.; Wu, G.N.; Zhang, W.H.; Chen, G.X. Study on material transfer in the process of contact strips rubbing against a contact wire with electric current. J. Eng. Tribol. 2016, 230, 202–211. [Google Scholar] [CrossRef]


| Material | Density (kg·m−3) | Elasticity Modulus (GPa) | Electrical Resistivity (µΩ·m) | Bending Strength (MPa) | Hardness |
|---|---|---|---|---|---|
| Pure carbon | 1.68 | 98.7 | <40 | >25 | 65 HS |
| Composition | Pb | Zn | Fe | Sn | S | Si | Ni | Cr | Cu |
|---|---|---|---|---|---|---|---|---|---|
| QCr0.5 | 0.005 | 0.005 | 0.005 | 0.005 | 0.005 | 0.002 | 0.005 | 0.5 | Bal. |
| Velocity v/(km·h−1) | 40 | 60 | 70 | 80 | 90 | 100 |
|---|---|---|---|---|---|---|
| Amplitude B (N) | 8 | 13 | 21 | 28 | 35 | 41 |
| Frequency f (Hz) | 0.169 | 0.254 | 0.296 | 0.338 | 0.380 | 0.426 |
| Test | Velocity/( km·h−1) | Amplitude B/(N) | Frequency f/(Hz) |
|---|---|---|---|
| Test 1 | 40 | 8 | 0.169, 0.254, 0.338, 0.380, 0.426 |
| 80 | 28 | 0.169, 0.254, 0.338, 0.380, 0.426 | |
| 100 | 41 | 0.169, 0.254, 0.338, 0.380, 0.426 | |
| Test 2 | 40 | 8, 13, 28, 35, 41 | 0.169 |
| 80 | 8, 13, 28, 35, 41 | 0.338 | |
| 100 | 8, 13, 28, 35, 41 | 0.426 |
© 2018 by the authors. Licensee MDPI, Basel, Switzerland. This article is an open access article distributed under the terms and conditions of the Creative Commons Attribution (CC BY) license (http://creativecommons.org/licenses/by/4.0/).
Share and Cite
Zhang, Y.; Zhang, Y.; Song, C. Arc Discharges of a Pure Carbon Strip Affected by Dynamic Contact Force during Current-Carrying Sliding. Materials 2018, 11, 796. https://doi.org/10.3390/ma11050796
Zhang Y, Zhang Y, Song C. Arc Discharges of a Pure Carbon Strip Affected by Dynamic Contact Force during Current-Carrying Sliding. Materials. 2018; 11(5):796. https://doi.org/10.3390/ma11050796
Chicago/Turabian StyleZhang, Yanyan, Yongzhen Zhang, and Chenfei Song. 2018. "Arc Discharges of a Pure Carbon Strip Affected by Dynamic Contact Force during Current-Carrying Sliding" Materials 11, no. 5: 796. https://doi.org/10.3390/ma11050796
APA StyleZhang, Y., Zhang, Y., & Song, C. (2018). Arc Discharges of a Pure Carbon Strip Affected by Dynamic Contact Force during Current-Carrying Sliding. Materials, 11(5), 796. https://doi.org/10.3390/ma11050796