3.1. The Influence of Doped Co2+ Content on the Absorbing-Wave Performance of Nano-Nickel Zinc Ferrite
The XRD patterns of nano Ni
0.6Zn
(0.4−x)Co
xFe
2O
4 for several samples with varying Co
2+ content are shown in
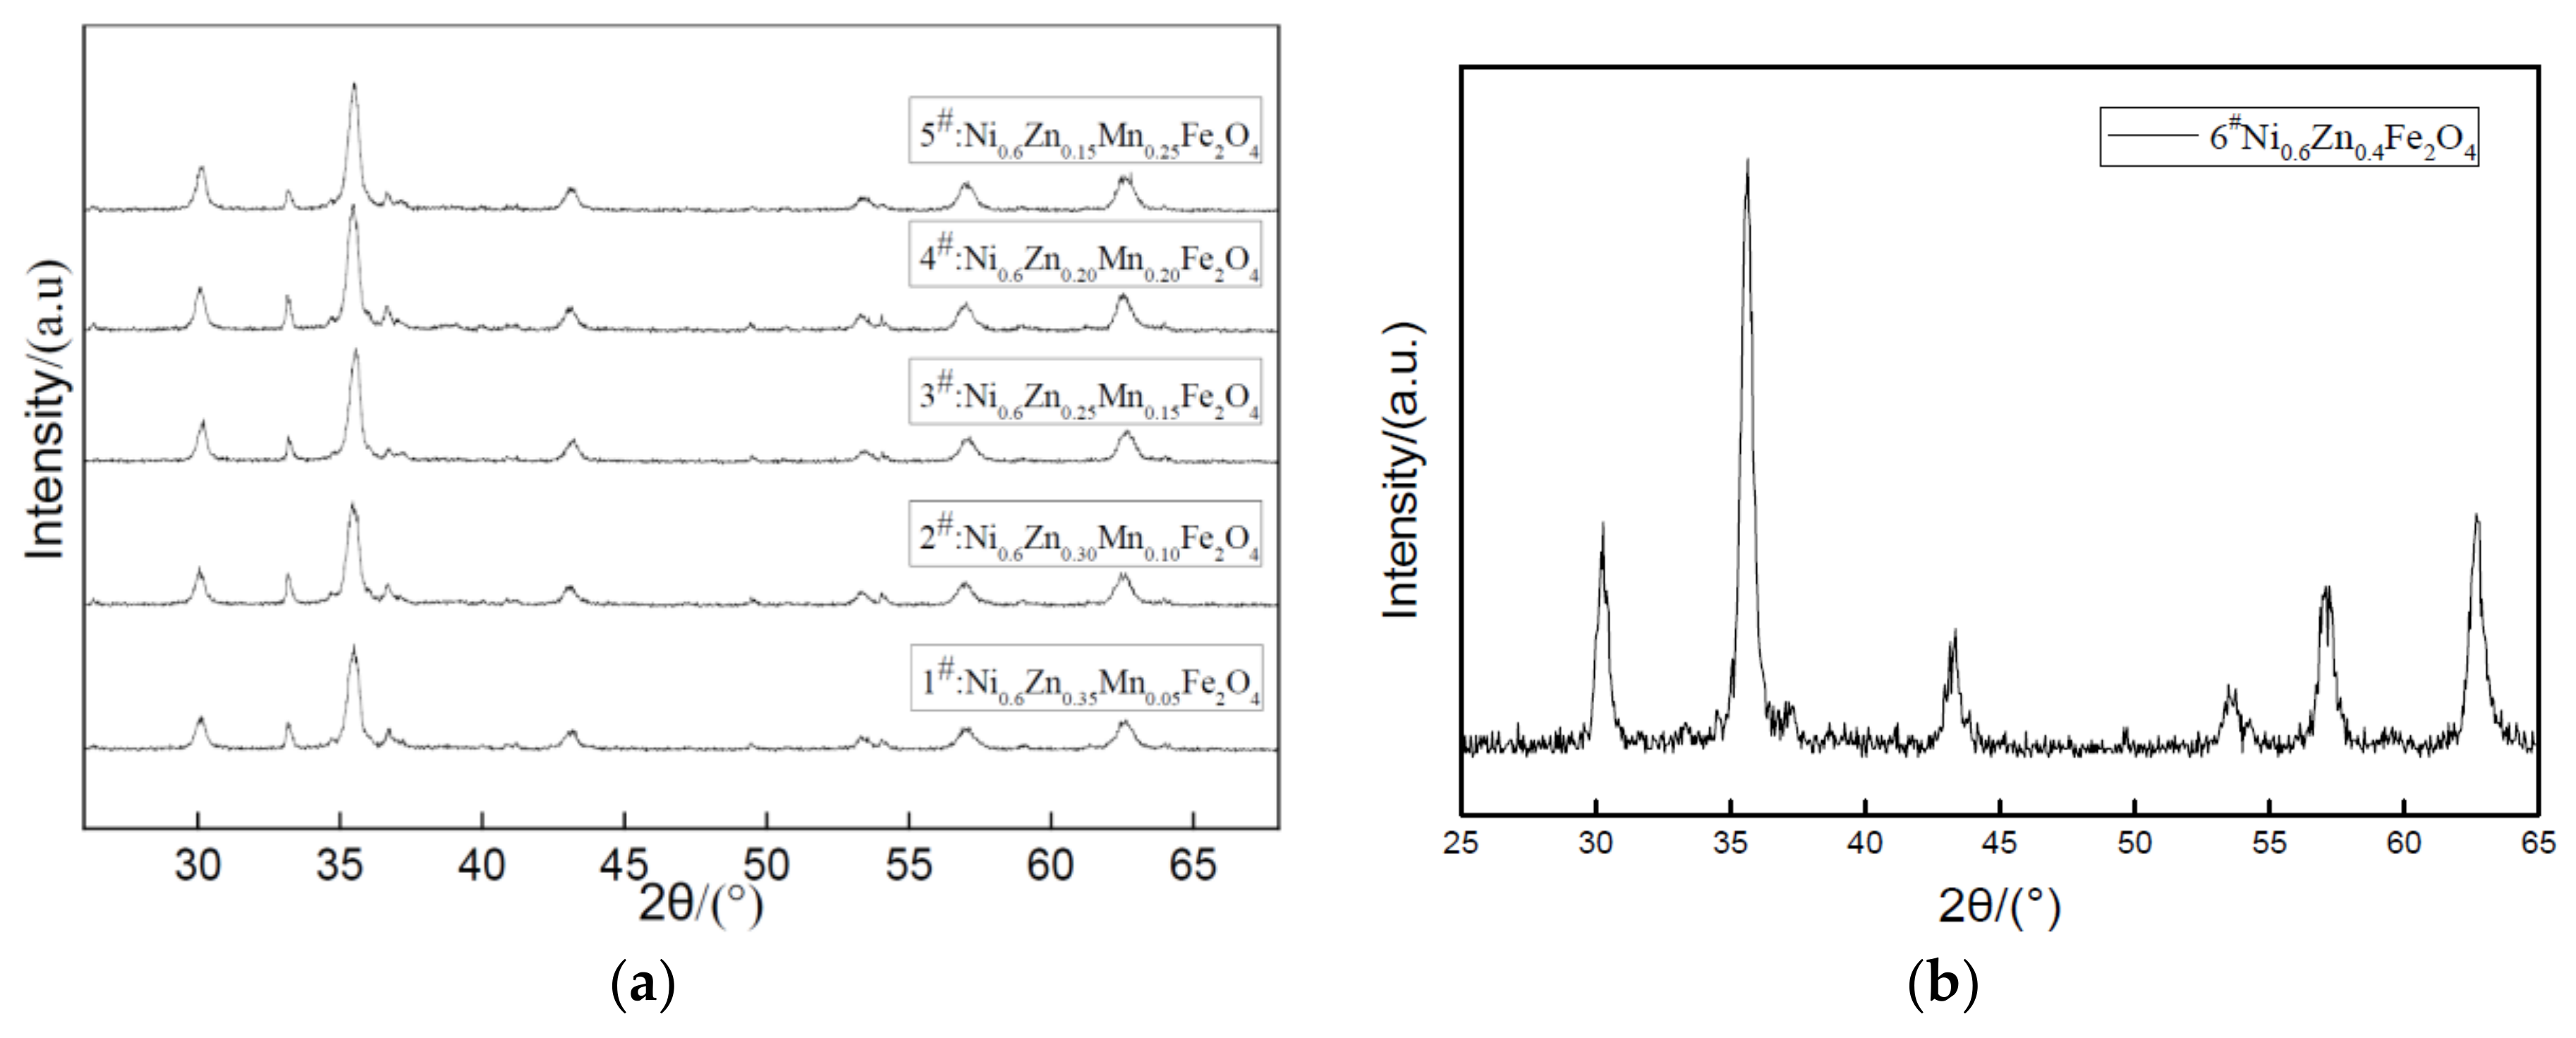
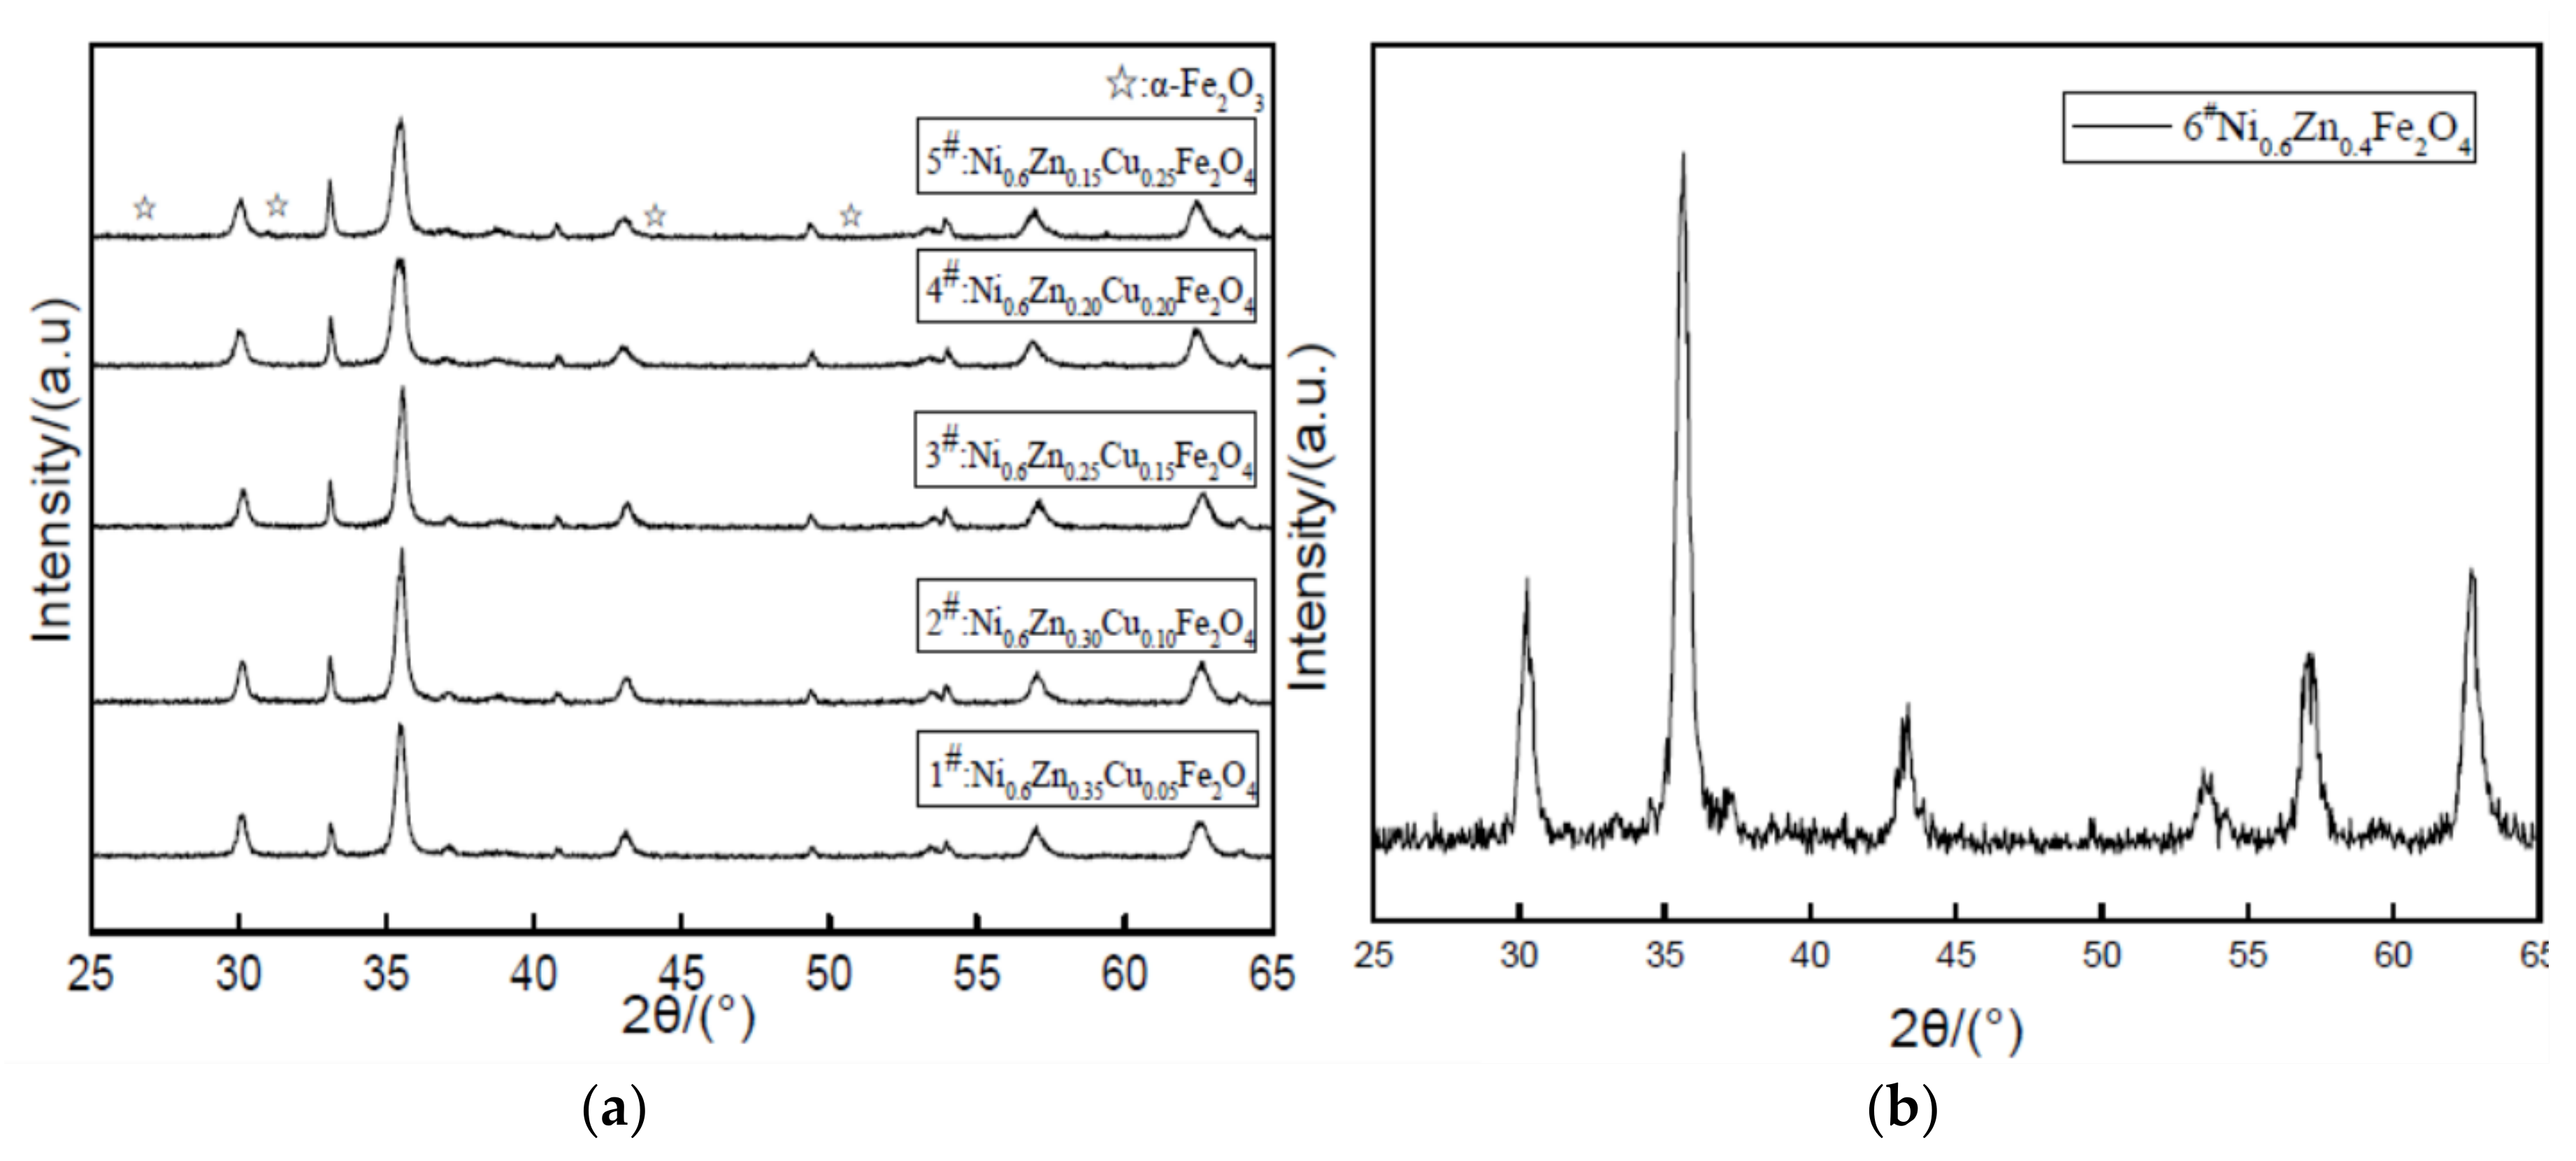
Figure 1. For all the samples’ X-ray diffraction patterns, peak positions correspond with the nickel zinc ferrite (111) crystal plane, (220) face, (311), (400), (422), (511), and (440) faces. The cubic crystal system of the pure spinel structure is represented without the presence of any impurity phases such as seen in alpha Fe
2O
3. This indicates that an experimental synthesis of the pure cobalt nickel zinc ferrite phase is possible, but it is difficult to achieve for the dry method of doping ions. When the Co
2+ content increases, the diffraction peak intensity decreases first. However, when Co
2+ doping reaches x = 0.15, no missing diffraction peaks are seen, which indicates that the crystallization is complete. The intensity of the (311) Bragg reflection is strong, which suggests that the preferred crystal crystallization orientation is (311). Additionally, the peak is particularly wide, which indicates that the polycrystalline material is nano-sized [
13,
14]. In applying the Scherrer formula, the average grain size in these cobalt-doped nickel zinc ferrites and the average particle size of the crystal grain increases by 35~60 nm with doping while the lattice constant increases from 0.8352 nm to 0.8404 nm in
Table 1. The hydrothermal method of doping can allow for the introduction of large elements in the Co
2+ lattice, which decreases the solution surface tension. This results in a reduction in the formation of the new phase activation energy. It also avoids the defects of the traditional method, which may promote dopant and ferrite mixing, and also controls the specific amount of dopant in the nanomaterials to maintain a certain stoichiometric ratio.
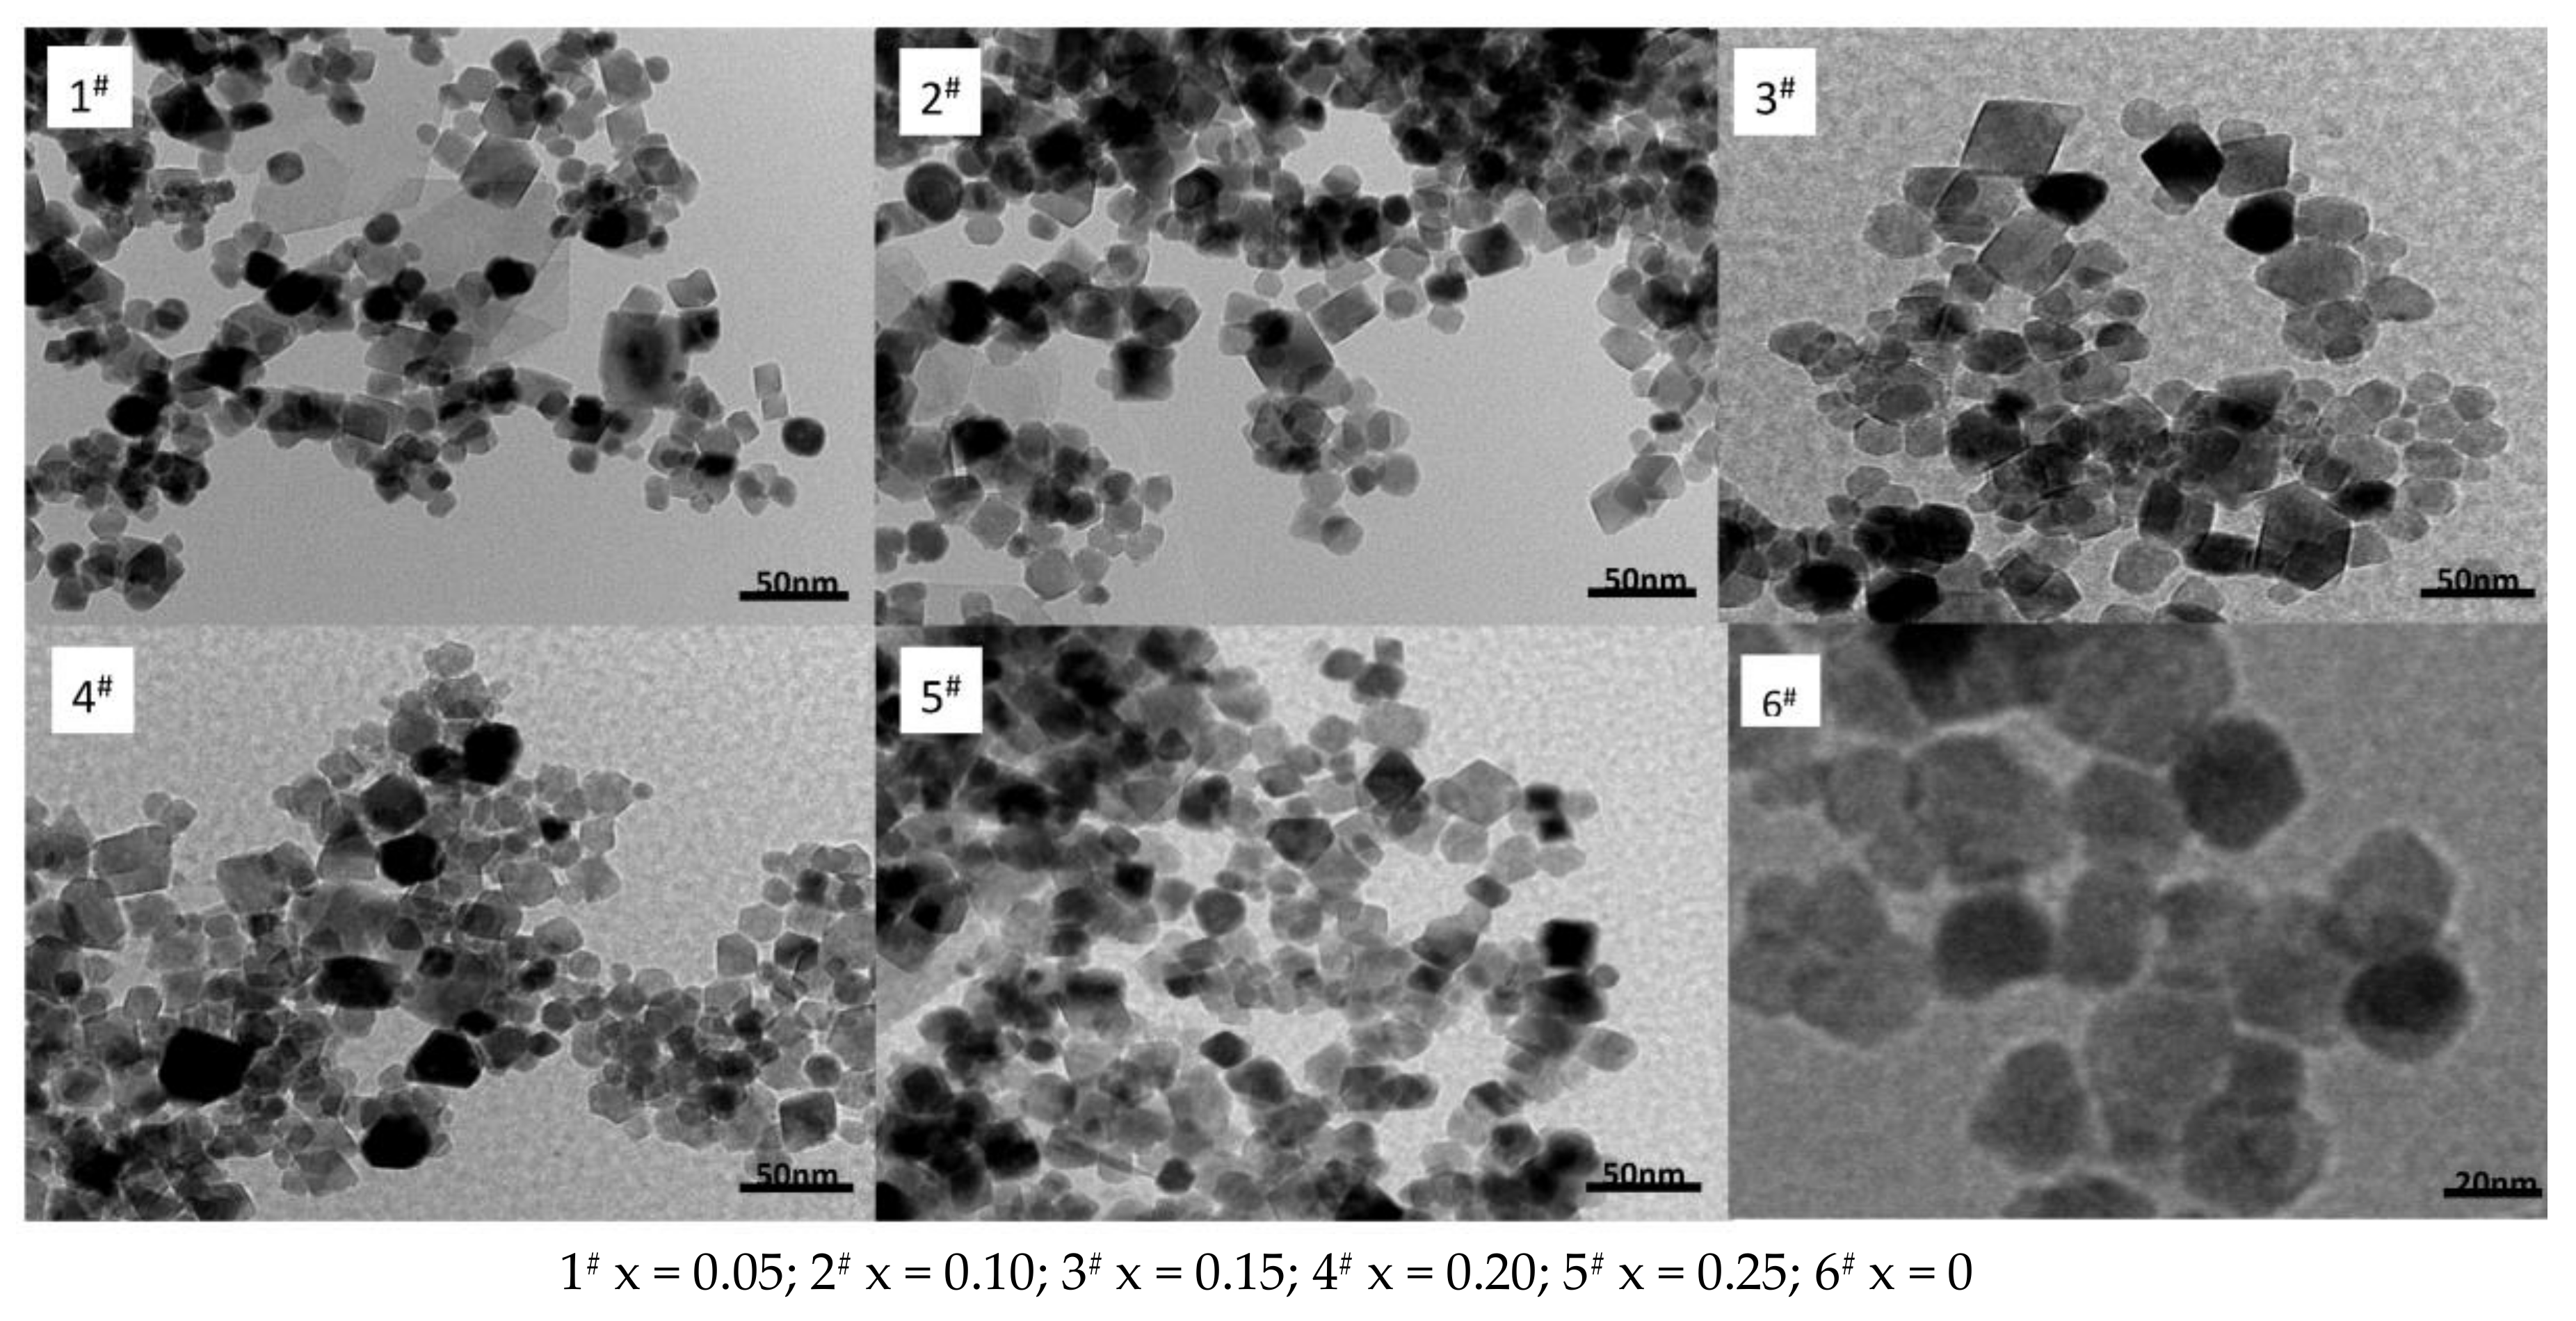
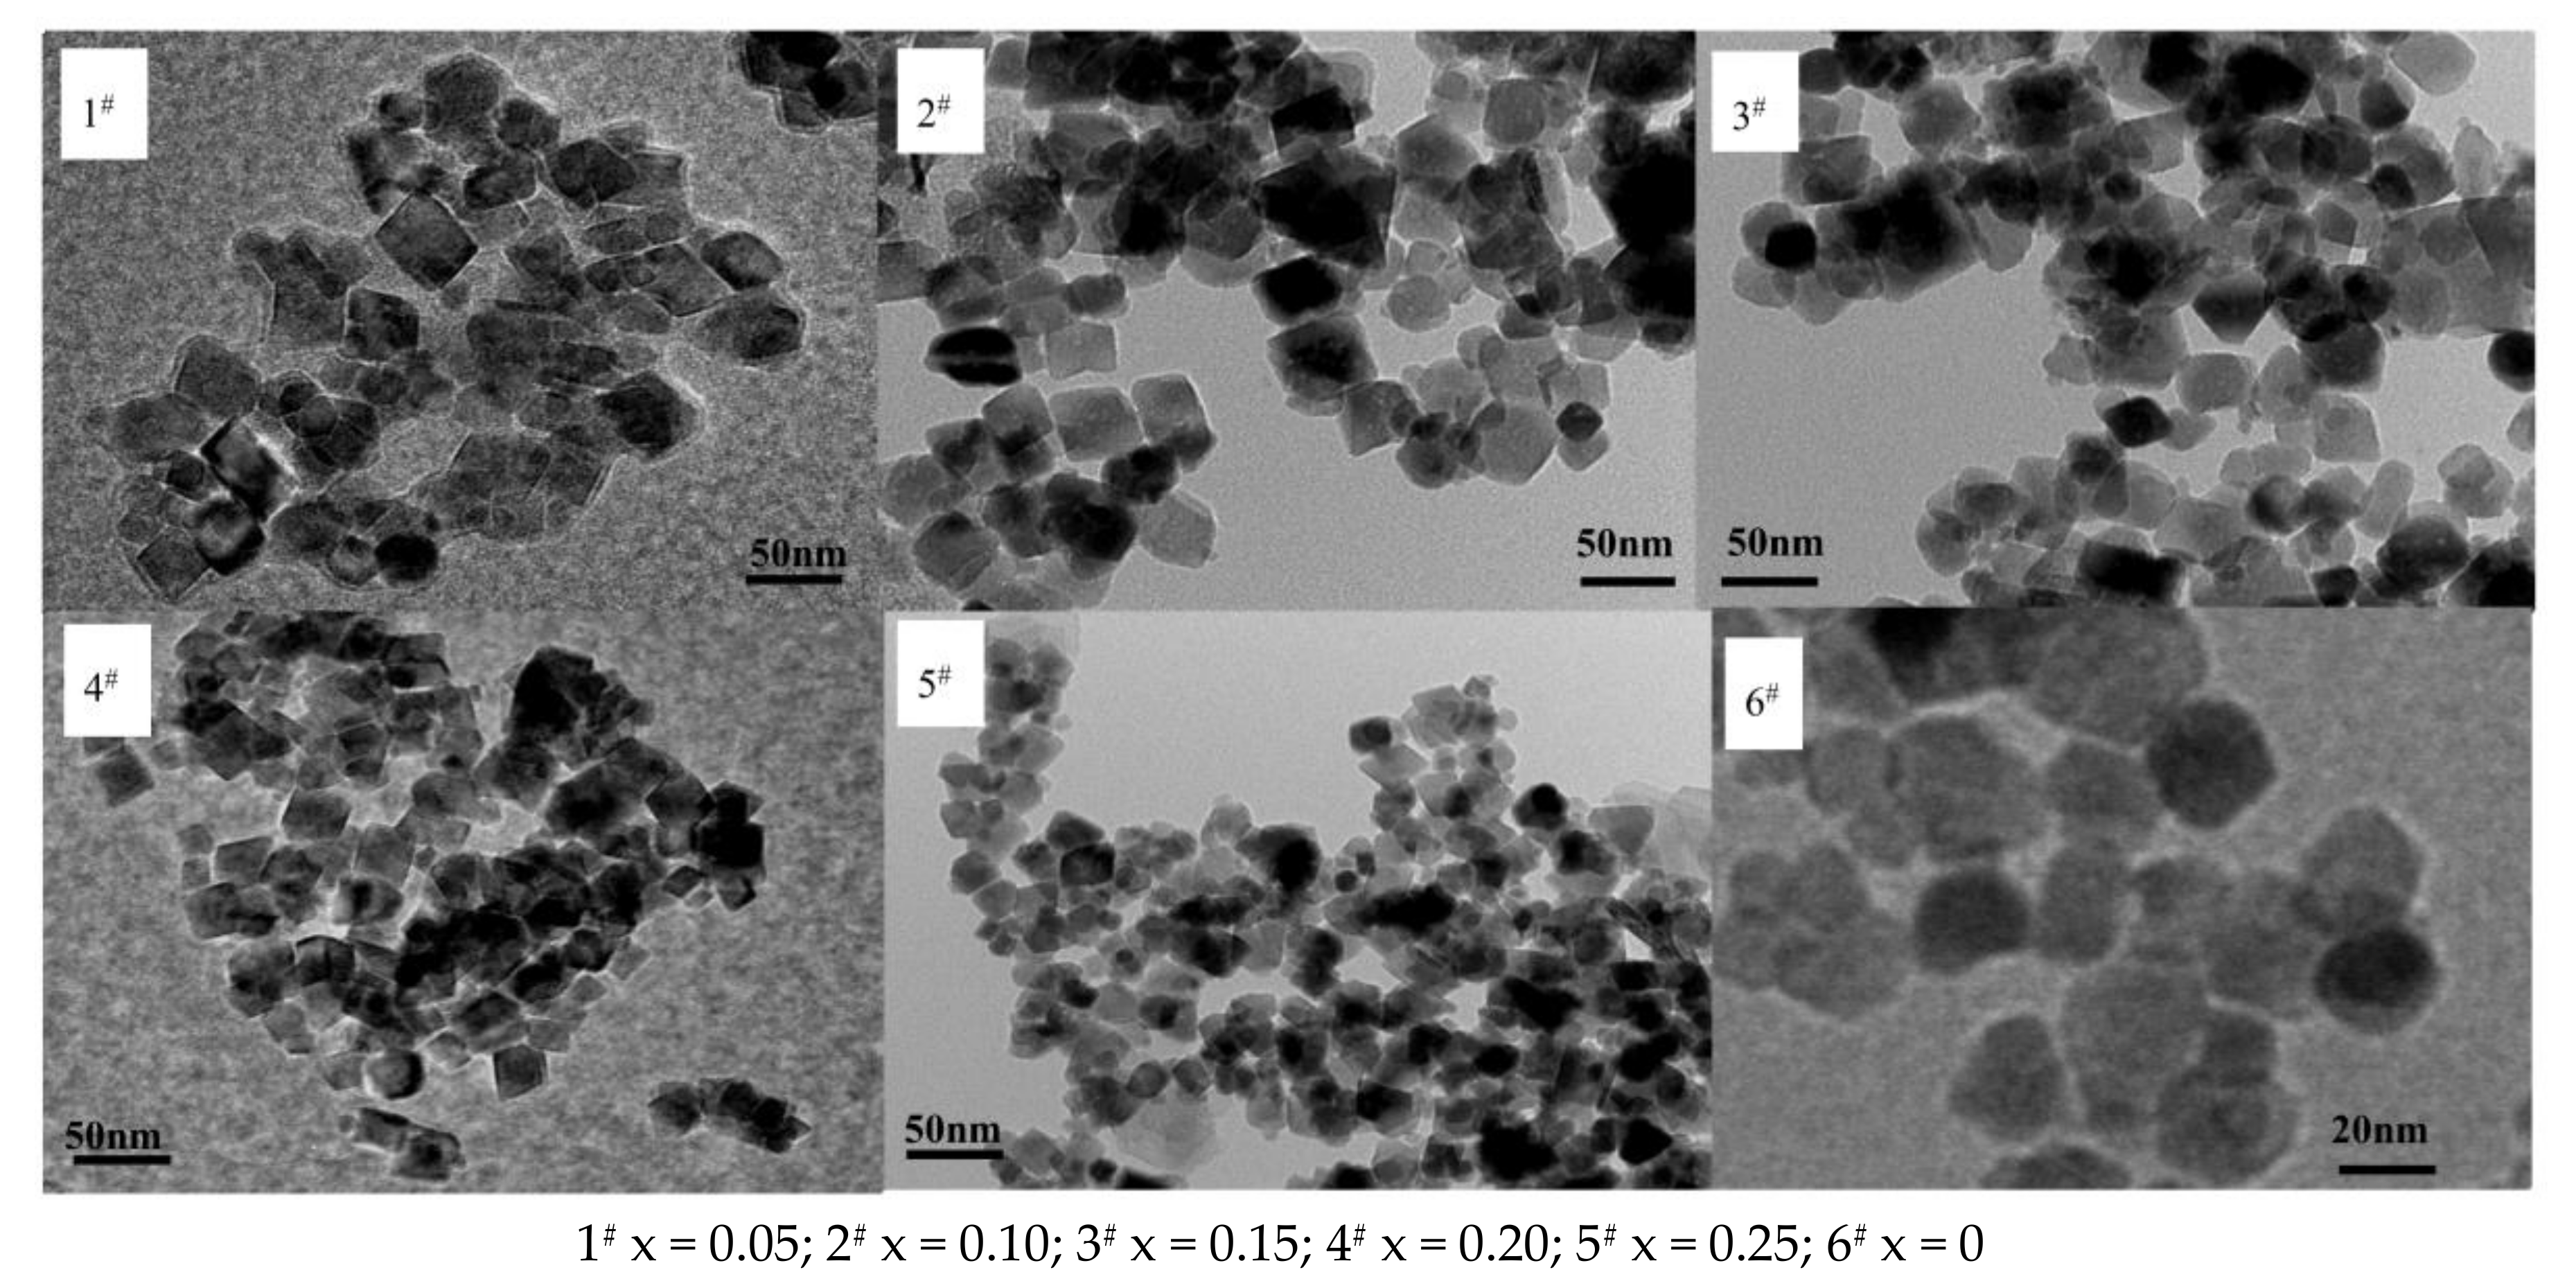
Figure 2 shows nano Ni
0.6Zn
(0.4−x)Co
xFe
2O
4 TEM micrographs. In the figure, it can be observed that after doping with Co
2+, the intrinsically spherical nickel zinc ferrite nanoparticles assumed a more irregular quadrilateral structure. With increasing Co
2+ content, the grain size increases, the irregular grain arrangement becomes denser, it exhibits poorer dispersion, and the grain becomes more uneven in size. The average particle size reaches 60 nm, which is roughly the same size as the one obtained with the Scherrer formula in the XRD results. Doping with Co
2+ nanometer nickel zinc ferrite can visibly change the direction of the crystal growth. This can affect the samples’ surface tension and surface energy. The radius of doped Co
2+ is 453 (pm), which is smaller than the radius of Ni
2+ or Zn
2+. It is possible that it occupies the oxygen ions’ tetrahedral hole in a very minute amount, if at all. Priority is taken to enter the octahedra (B) in which part of the Fe
3+ ions are removed [
15]. The lattice distortion causes distortion of the spinel structure and the grain shape becomes irregular. Additionally, as the Co
2+ content increases, the Co
2+ that does not enter the crystal structure is dispersed to the grain boundary in which the grain grows significantly larger.
A microwave passing through a medium undergoes three main mechanisms including reflection, absorption, and penetration. As the microwave passes through a glossy dispersive material, its reflection is affected by factors such as complex permittivity, magnetic permeability, sample thickness, and specific surface area. Real permittivity and permeability relate to the amount of polarization in the materials and indicate the ability to store electromagnetic energy. Imaginary permittivity and permeability signify magnetic loss and energy dissipation within a material, which result from conductance, resonance, and relaxation.
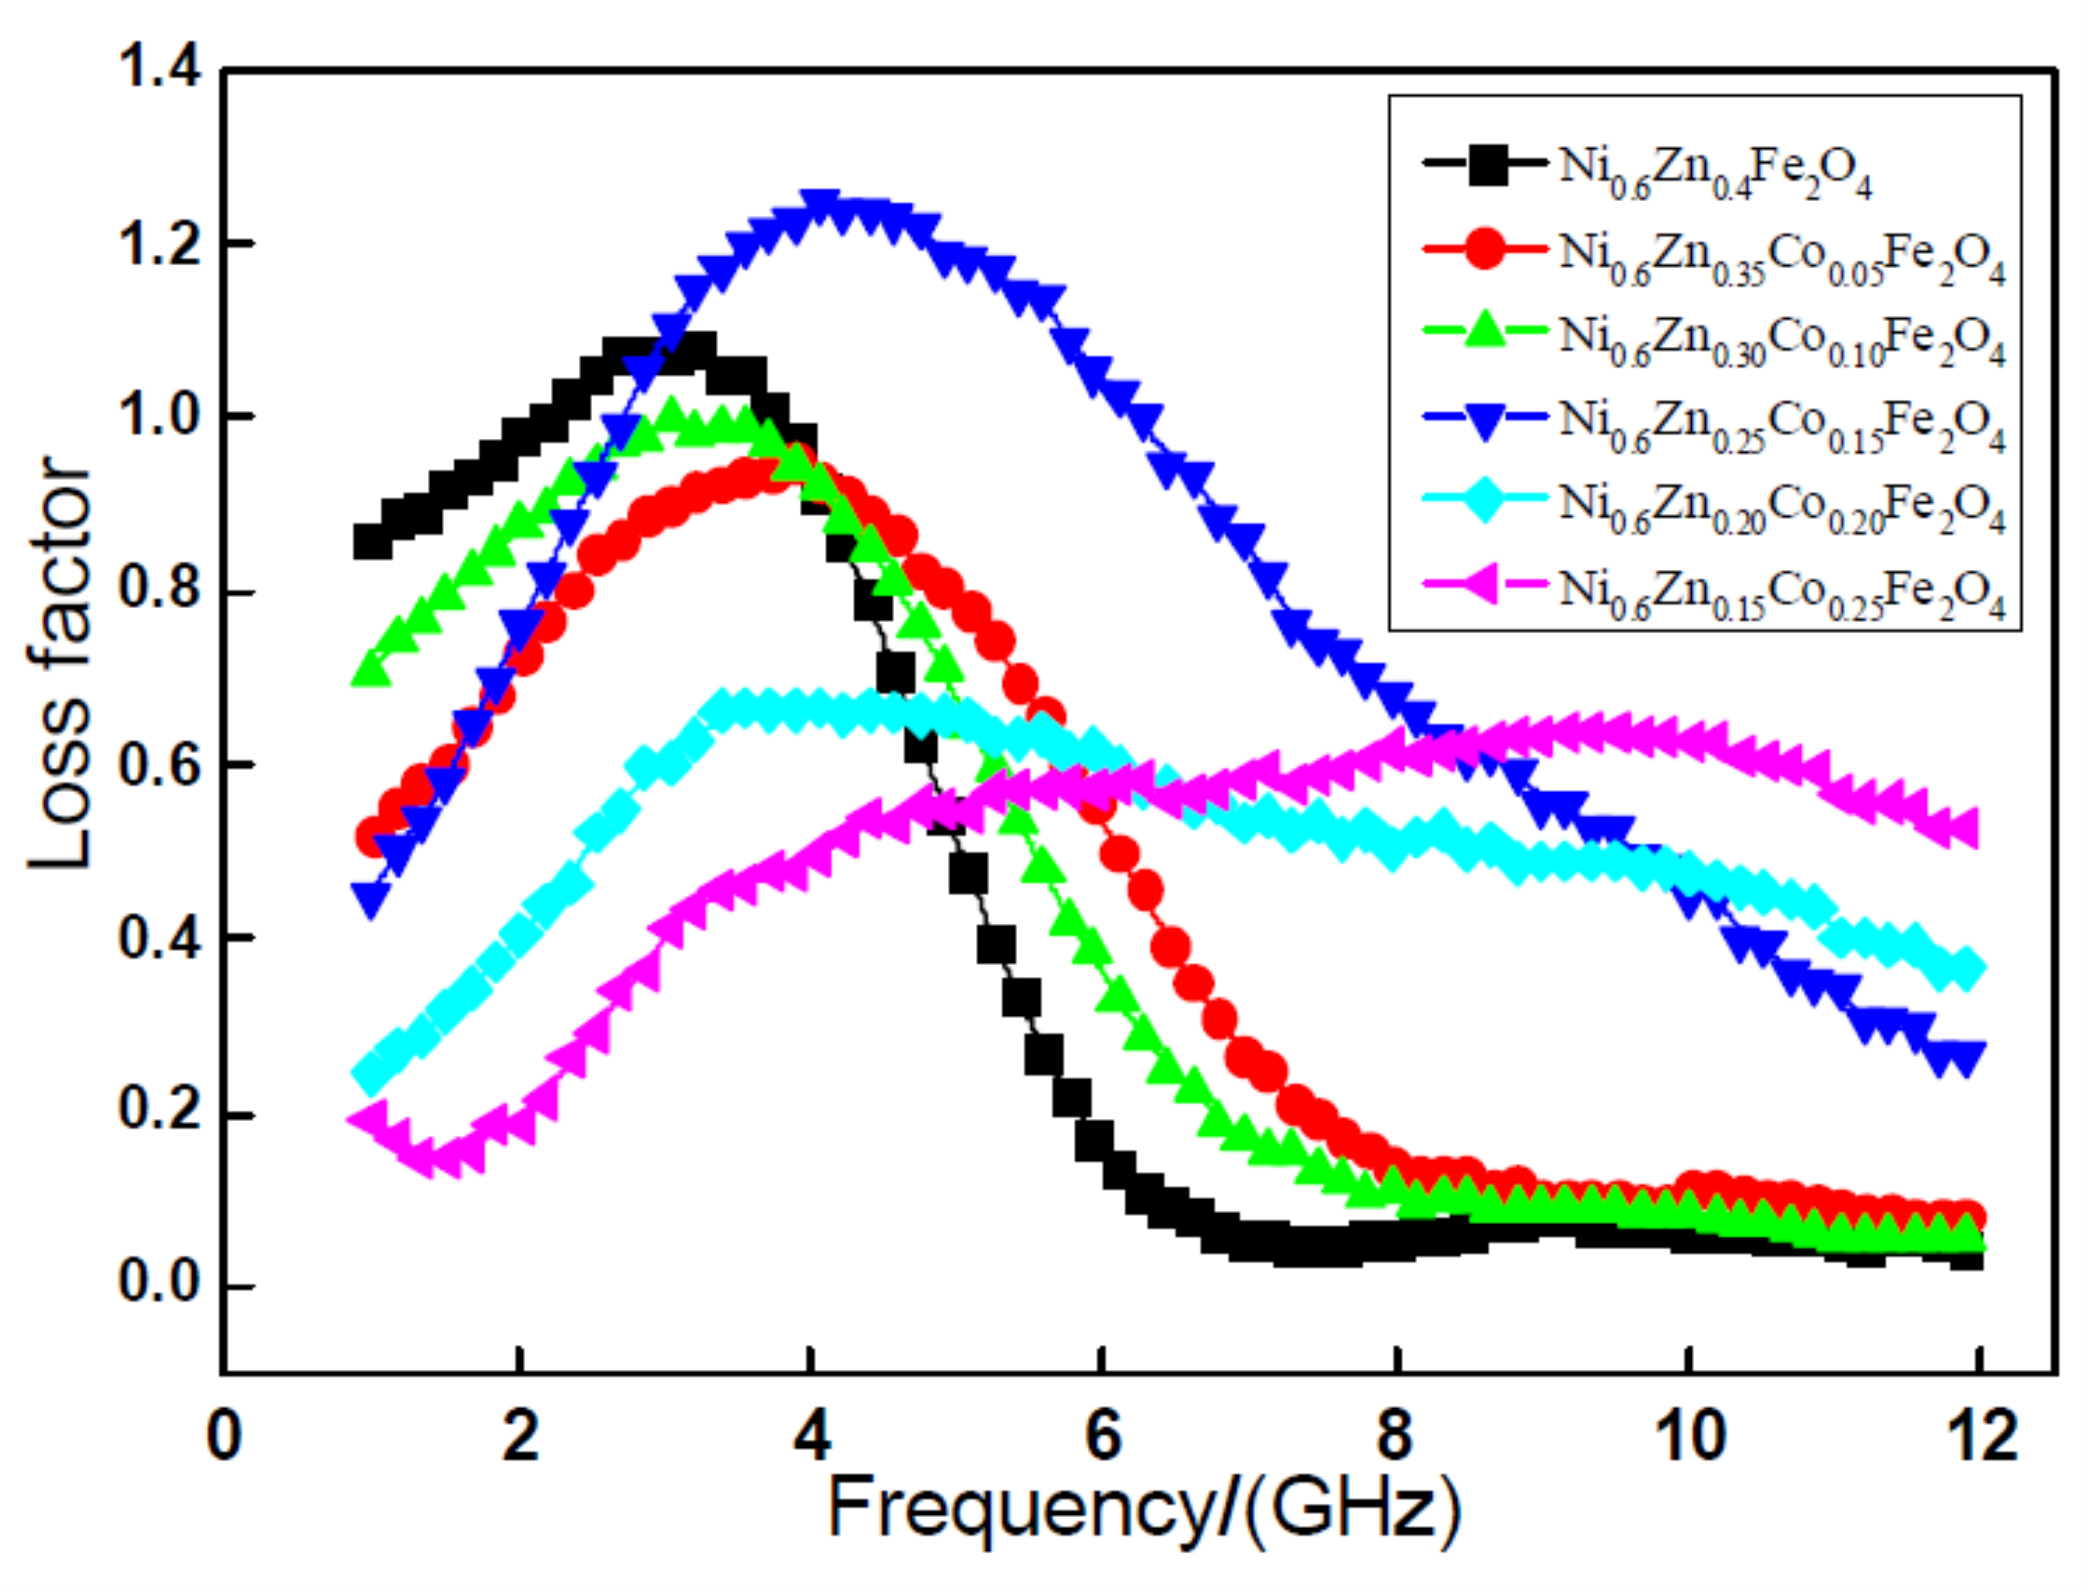
Figure 3 exhibits the relationship curve of the tangent delta with frequency variation of the loss factor tangent delta of the nano Ni
0.6Zn
(0.4−x)Co
xFe
2O
4. As the graph shows, with an increase in frequency, the nano Ni
0.6Zn
(0.4−x)Co
xFe
2O
4 system of the tan delta value exhibits an overall trend of increasing after first decreasing. However, with an increase in the Co
2+ dopant and the change of loss factor, tan delta is nonlinear. When doping x < 0.15, the tangent of the tangent of the tangent exhibits an increase and, when the quantity is small, the tangent delta is smaller than that of the un-doped parent material. When the dopant amount reaches x = 0.15, the material loss factor of the strongest peak moves to higher frequency. The peak at 1.25 is significantly more intense than that of other samples. At the same time, to achieve the most effective frequency width, the wave absorption performance is optimal here. When the doping quantity is x = 0.20, 0.25, the effective frequency band widens, but the tangent delta grows smaller and the absorbing effect is not very satisfactory [
16]. A comprehensive analysis of the electromagnetic loss shows that within the 1~12 GHz frequencies, when the Co
2+ doping amount is 0.15 of the nano Ni
0.6Zn
0.25Co
0.15Fe
2O
4, it exhibits an enhanced performance of the electromagnetic wave and electromagnetic loss in which the wave absorption performance is better.
This is because the nanometer Ni0.6Zn(0.4−x)CoxFe2O4, Ni2+, and Co2+ prefer to occupy the octahedra (B). With an increase in the Co2+ content, the grain boundary phase reduces. Demagnetization can decrease this grain boundary growth and increase the strength of Ni0.6Zn(0.4−x)CoxFe2O4, which improves the magnetic hysteresis loss of the material. At the same time, with the octahedral crystal lattice distortion (B), the internal stress increases. With less material containing Fe2+, the Fe2+-Fe3+ electron mobility is reduced. This makes the hole type more conductive and the dielectric loss increase. With an increase in Co2+ content, the octahedral Co3+ (B), the Co3+ undergoing electron exchange with Co2+, and the octahedron (B) Fe2+ and Fe3+ electronic exchange disappear. As a result, the equivalent electronic exchange decreases and the electrical conductivity is abated. The dielectric constant and loss are also reduced. In this manner, in the nano nickel zinc ferrite, the Co2+ dopant can improve the electromagnetic loss properties of the nickel zinc ferrite nanoparticles and can effectively broaden the spectrum. When the doping amount reaches x = 0.15, the electromagnetic loss characteristics of the sample are the most positive in which the absorbing effect is the greatest.
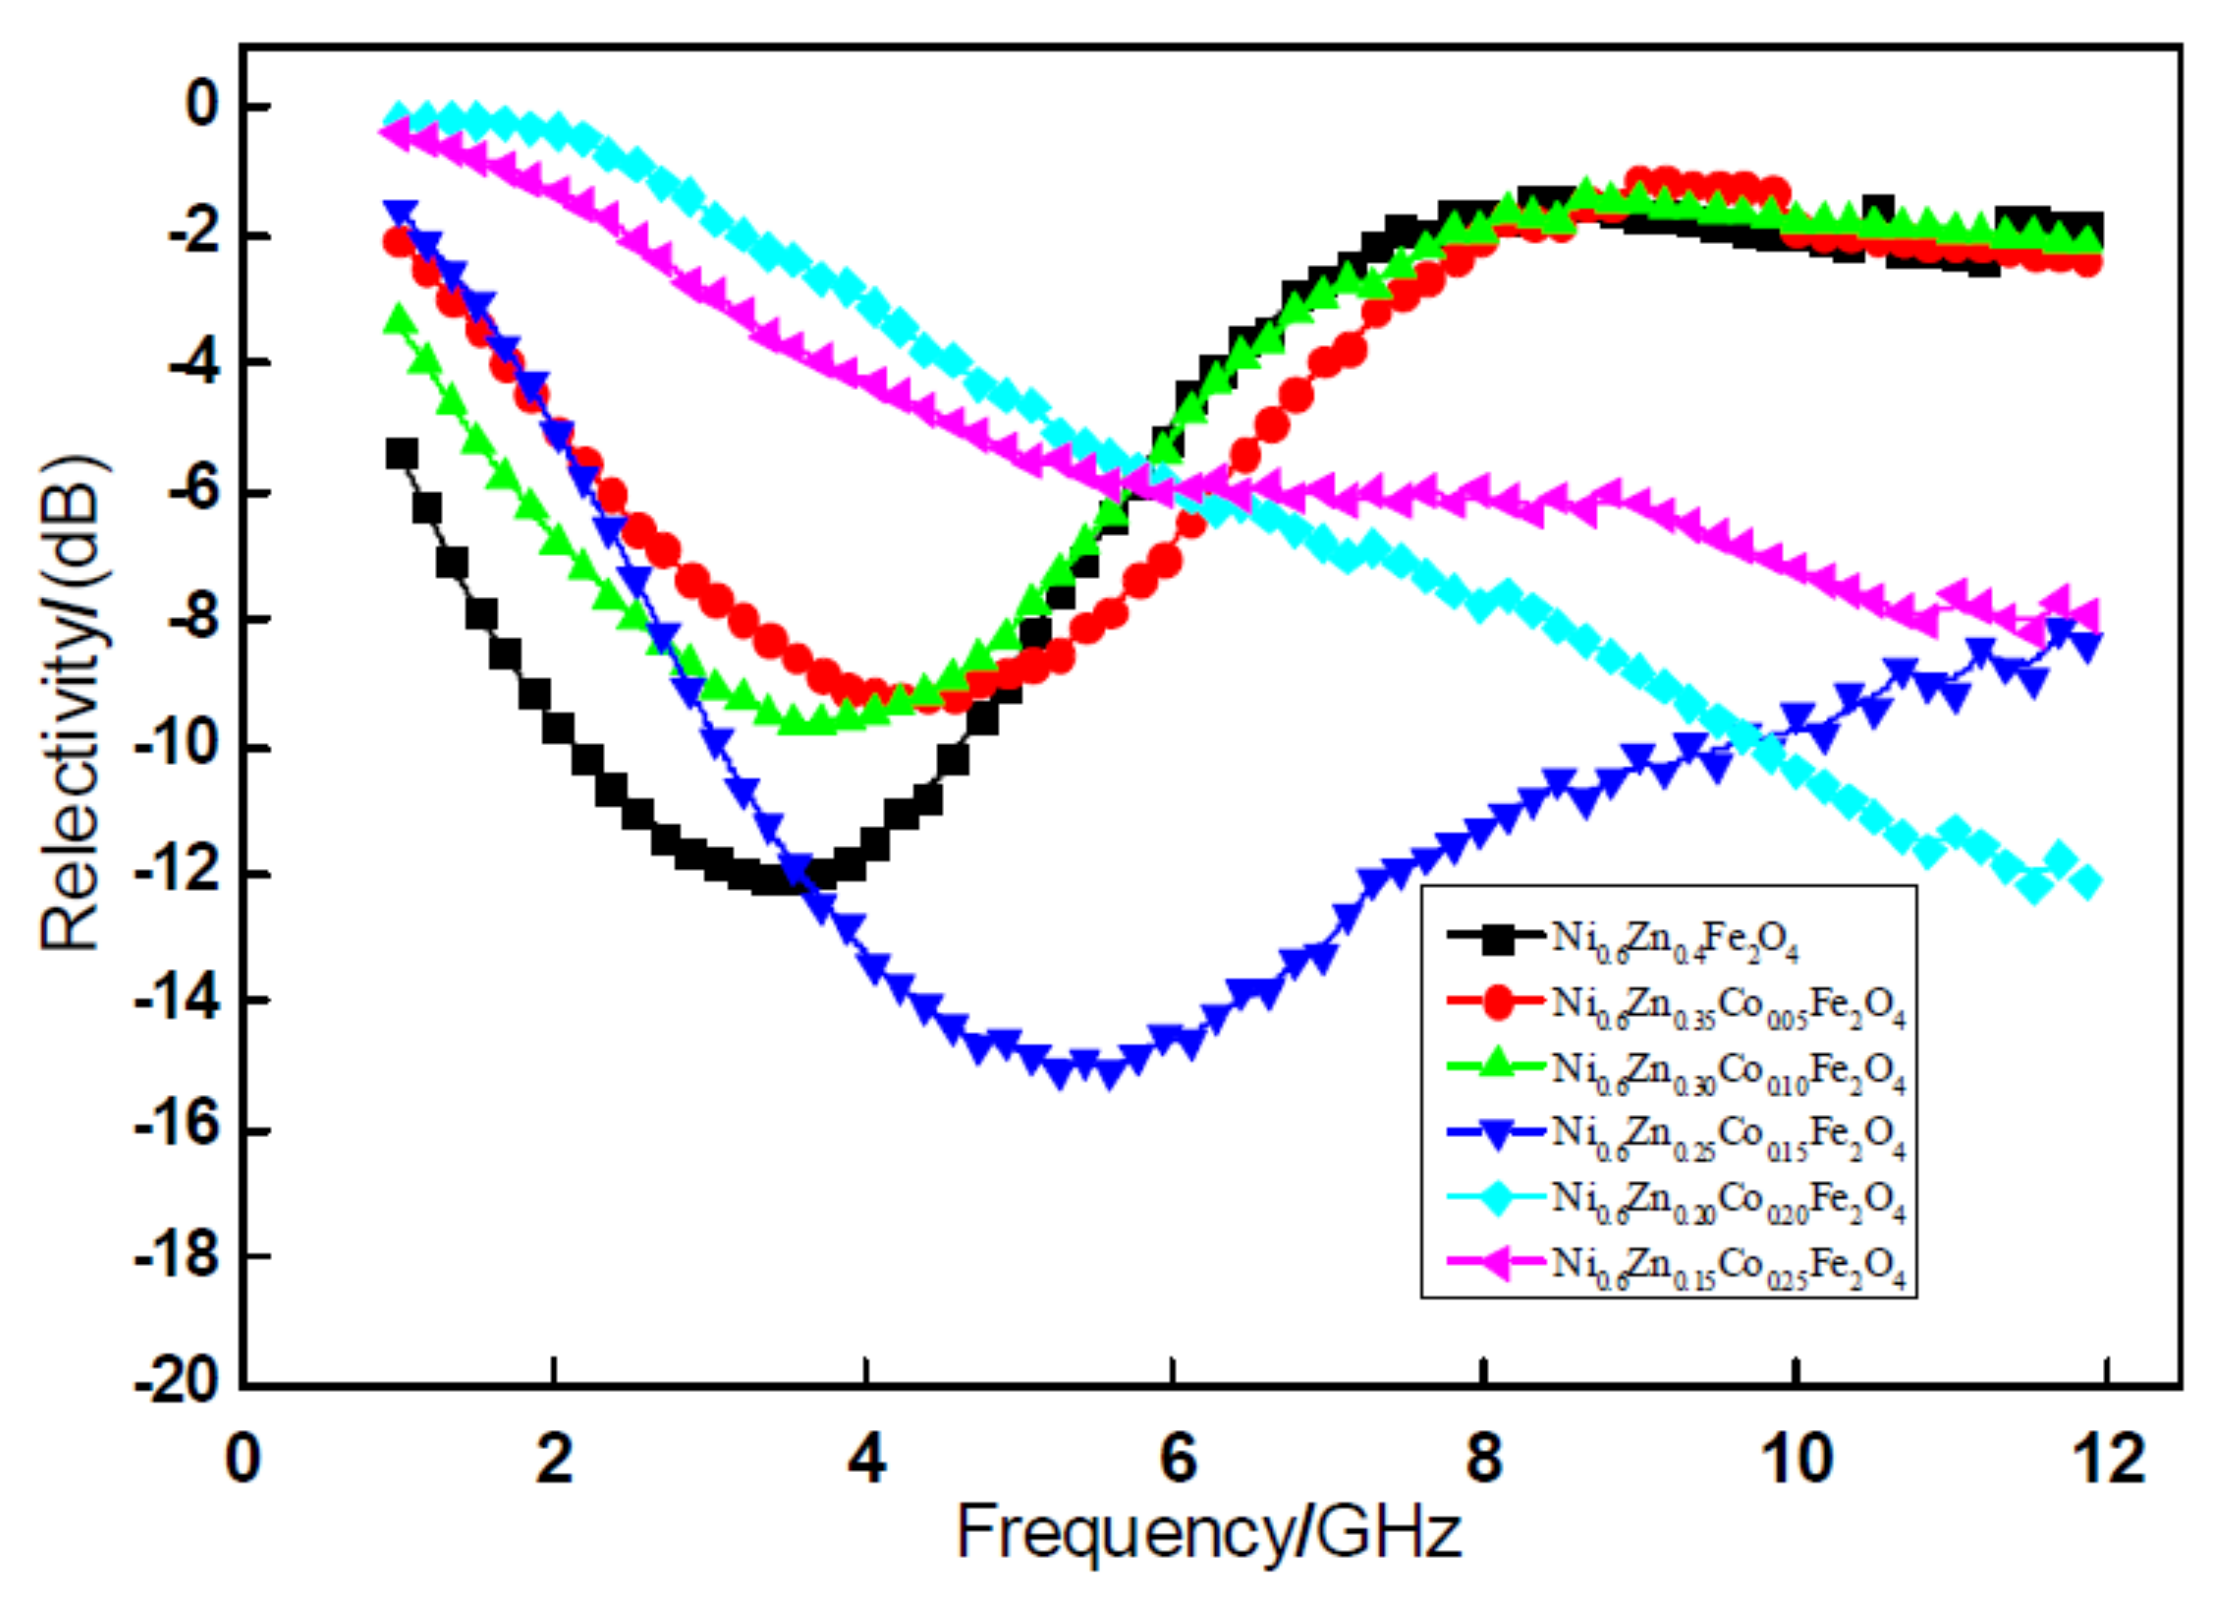
Figure 4 shows the relationship curve of the absorbency reflectivity of 2-mm nanometer Ni
0.6Zn
(0.4−x)Co
xFe
2O
4. The figure reveals that, within the 1~12 GHz band, the nano nickel zinc ferrite absorbing reflectivity is 12.02 dB, which is valid for the 1~6 GHz frequency band. After doping Co
2+, along with an increase in the dopant x, when x = 0.05, 0.10, the absorbing peak reflectivity is 9.21 dB and 9.64 dB. When the Co
2+ doping quantity is low, the material’s absorbing effect is not clear. When the doping quantity x = 0.15, the absorbing wave reflectivity is reduced from −12.01 dB to −15.05 dB. The effective band width nearly doubles, but the absorbing wave performance is the highest value. Although an excessive amount of Co
2+ doping increased the reflectivity, there was no clear peak value. Even though peaks tend to move to higher frequency, within the test frequency band, the overall wave absorption bands improved significantly. At the same time, by doping Co
2+, the absorption peak position can change [
17]. The peak value of the curve in the diagram and the corresponding frequency are shown in
Figure 3. In this regard, the appropriate amount of Co
2+ can effectively be used to increase the absorbance frequency and improve the absorbing performance of the material. Doping Co
2+ ions in the ferrite use the compensation of negative anisotropy to achieve a stable domain wall and increase the electromagnetic loss. These factors meet the requirements of electromagnetic wave ferrite devices.
3.2. The Influence of Mn2+ Content on the Absorption Properties of Nano-Nickel Zinc Ferrite
Figure 5 shows the XRD pattern of nano Ni
0.6Zn
(0.4−x)Mn
xFe
2O
4 mixing different levels of Mn
2+.
Table 2 exhibits the ferrite component and structure parameters with various Mn
2+ content. As can be seen from
Figure 5 and
Table 2, all the samples, in compliance with the standard atlas JCPDS reference, exist in the single phase spinel structure. No other impurities can be detected and the five main diffraction peaks appear in the sample at 35°. The diffraction peak intensity increases as the amount of Mn
2+ doped increases from 346.33 to 574.67. The peak intensity significantly sharpens with the dopant, which indicates that doping Mn
2+ into the crystal lattice does not change the crystal structure. However, it increases its crystallinity and promotes the crystallization of pure phase nanometer nickel manganese zinc ferrite. With an increase in x, the (311) crystal plane diffraction Lord peak moves to smaller angles. This is associated with an increase in the lattice constant of the product [
18]. The grain size at the same time also experiences a slight increase, but this increase is less than that of the cobalt nickel zinc ferrite nanoparticles. This is because the Ni
0.6Zn
(0.4−x)Co
xFe
2O
4 ionic radius is larger than that of Mn
2+. The dopant may enter the tetrahedron to replace the original small Zn
2+ ion radius and Fe
3+. Due to the volume of A, the crystal structure effect makes the lattice constant change by increasing it from 0.8352 nm to 0.8440 nm. But the lattice constant decreases when the doping quantity x = 0.15, so the doping ratio of Mn
2+ affects the size of the lattice constant.
Figure 6 reveals a nano Ni
0.6Zn
(0.4−x)Mn
xFe
2O
4 TEM image. The image at the nanometer scale shows that the nickel and manganese zinc ferrite grain size is spherical in nature. There are fewer quadrilateral, loose aggregate surfactant, and large translucent, irregular particle shapes that may form in the reaction process. The fewer Mn
2+ content, the smaller the ferrite particles are with most being roughly 30 nm in size, which is consistent with the XRD results. The grain growth is good and evenly dispersed. However, with an increase in Mn
2+ content, the grain grows. With this growth, the particles assume looser, aggregate quadrilateral structures and are relatively dense, uneven in size, and have a mean grain size of 40 nm. They also exhibit poor dispersion and agglomeration. Because of the hydrothermal preparation of nickel and manganese zinc ferrite nano powder, the nanometer grain specific surface area is larger [
19]. Due to the influence of the surface effect and the magnetic attraction between the particles and the molecular inter-atomic forces, the particles reunite easily into large aggregates at the interface. This works to reduce the surface and static magnetic energy. At the same time, the grain growth speed is not easy to control and the sizes will differ. The second is capillary contraction in the drying process, which causes the agglomeration.
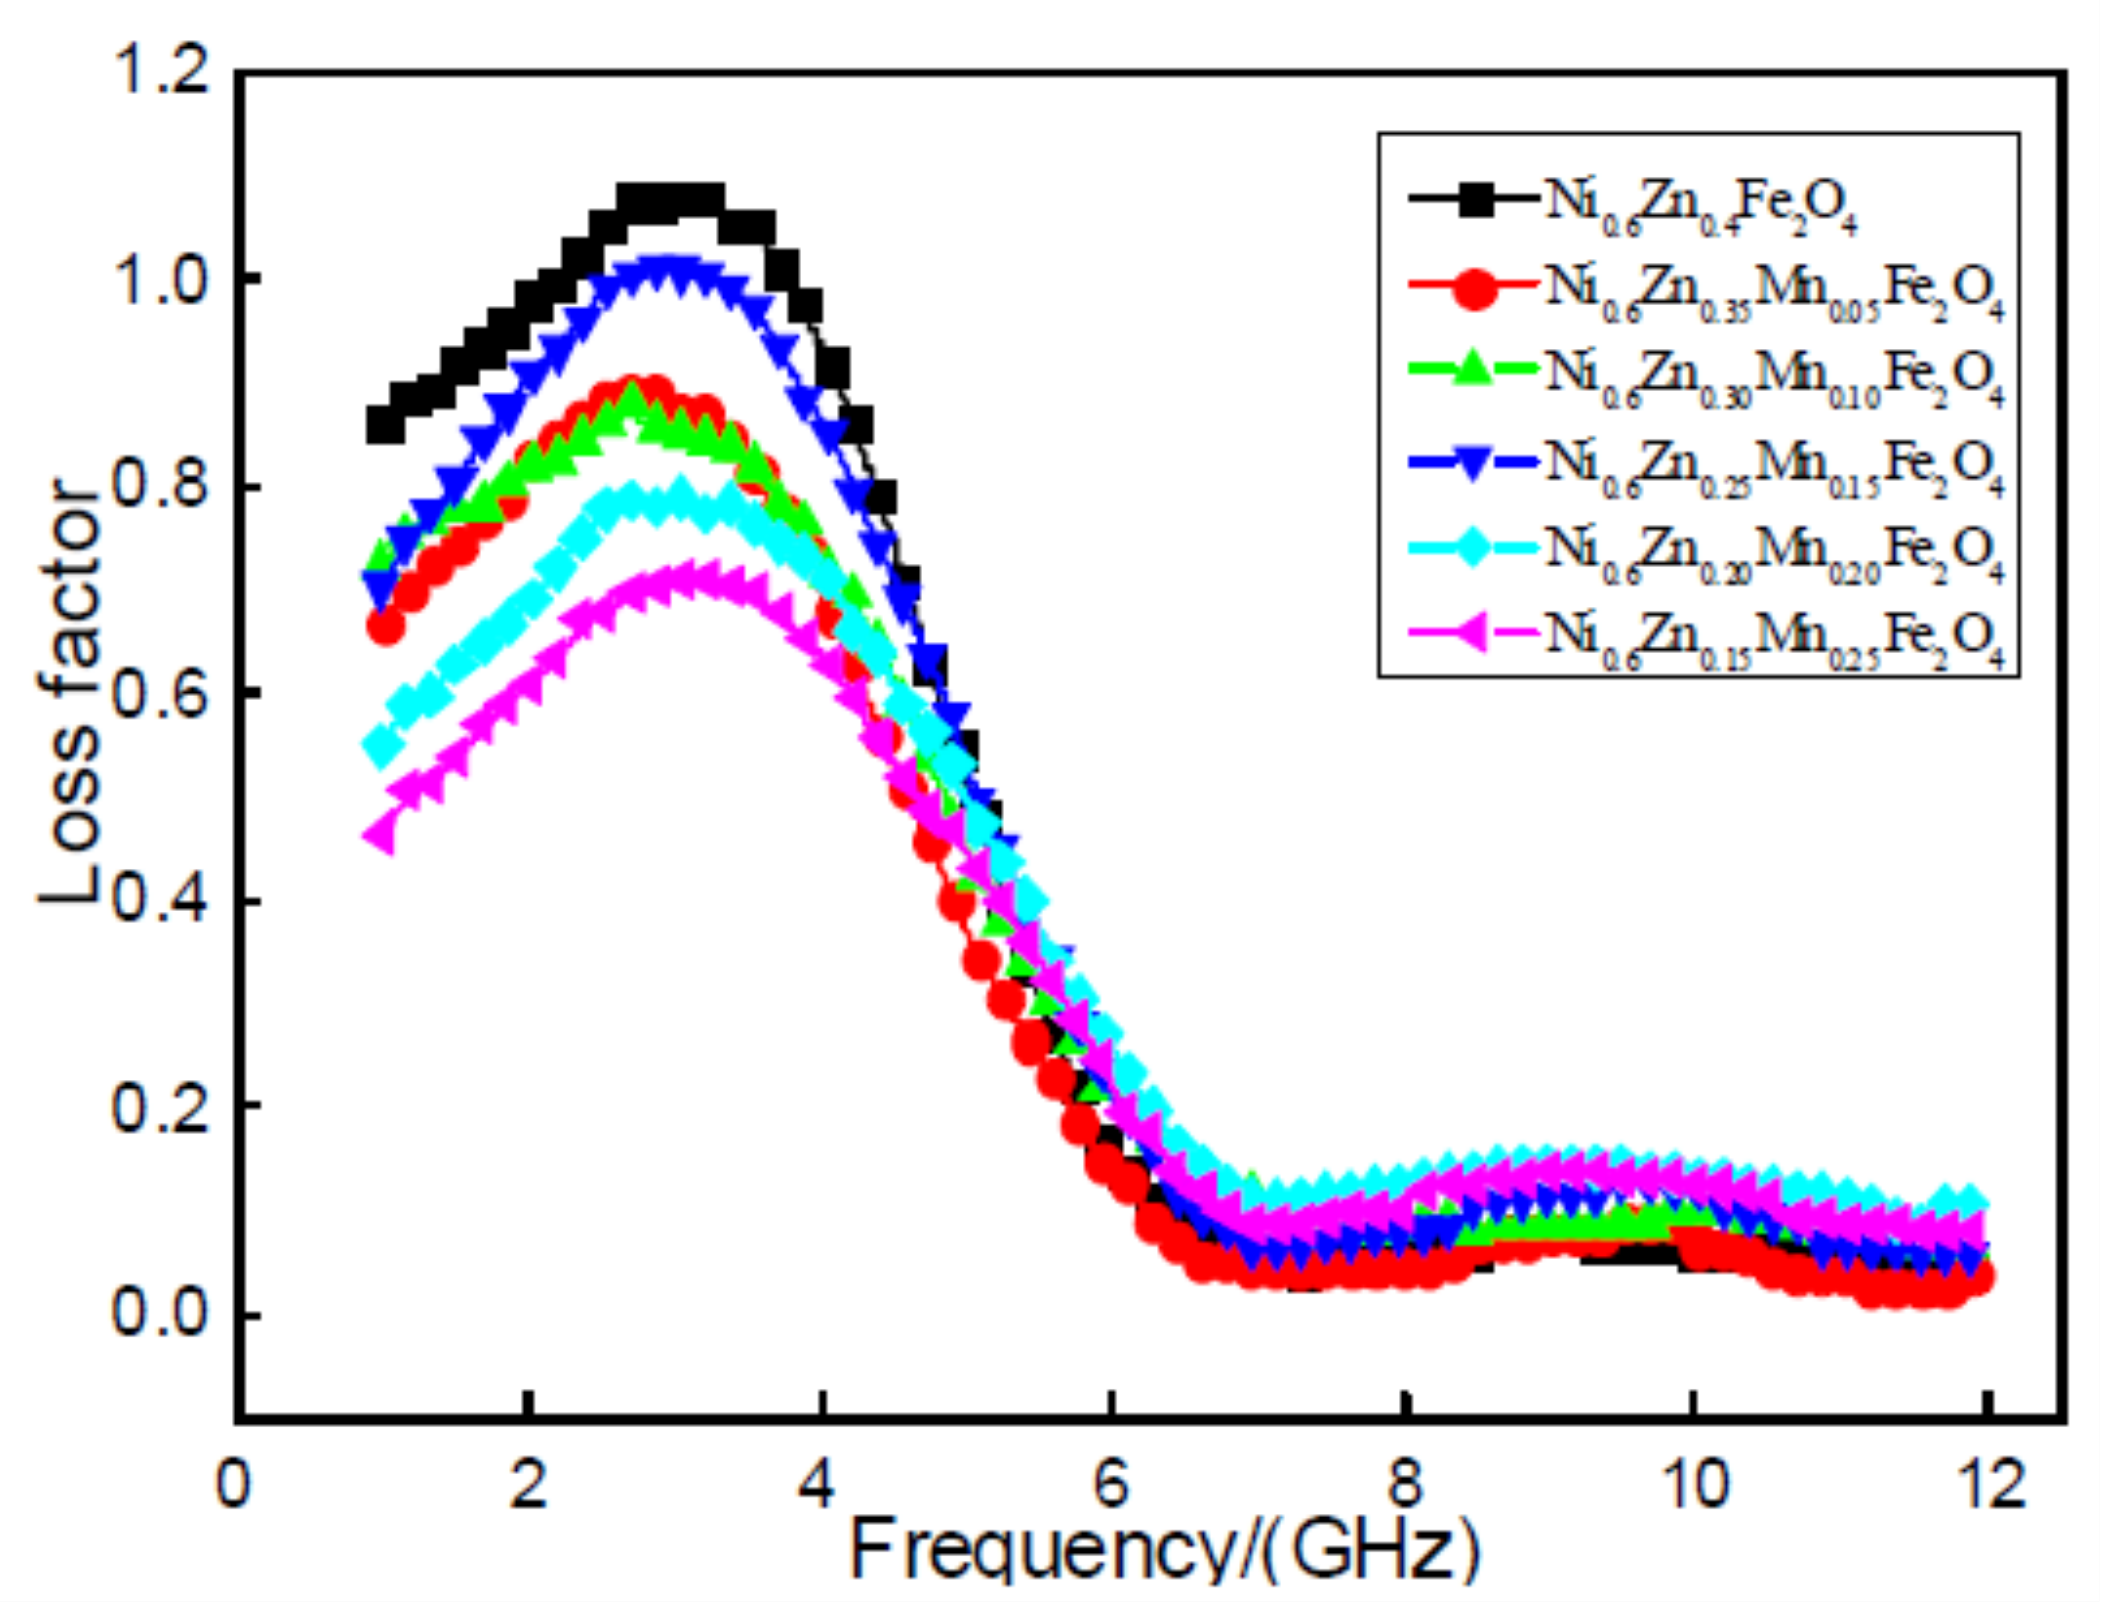
Figure 7 shows the loss factor tan delta of nano Ni
0.6Zn
(0.4−x)Mn
xFe
2O
4. It does not improve after doping with Mn
2+. The nano nickel zinc manganese ferrite magnetic loss, loss factor, tan delta value in the 1~12 GHz frequency, and the increase of frequency first increased after decreasing. With the increase of Mn
2+ dopant, the loss factor, tan
δ value, does not exhibit a linear change, but is reduced after increasing and then decreases once again. When the doping quantity is x = 0.05, 0.10, the tan
δ value does not change significantly. When the doping amount is x = 0.15, in the 1~6 GHz frequency, it is bigger than the loss factor in the other doped samples. The effective frequency band widens slightly, but is still below the doping tan and the size of the tan
δ value. When the doping quantity x = 0.20, 0.25, the tan
δ value decreases with an increase in doped Mn
2+. The excess Mn
2+ dopant minimizes the dissipation factor. Doping of Mn
2+ in the nano nickel zinc manganese ferrite shows a loss in magnetic performance and does not reach the effect of the wave absorption performance of the reinforced material. This is because the Mn
2+ effective magnetic moment is less than that of Fe
3+. With the increase in Mn
2+ dopant, the Fe
3+ concentration is reduced, which results in a decrease in the effective magnetic moment of the nanometer nickel manganese zinc ferrite and the saturation magnetization. This leads to loss in the overall electromagnetic intensity [
20].
Figure 8 shows 2 mm nanoscale Ni
0.6Zn
(0.4−x)Mn
xFe
2O
4. In the diagram, between the 1~7 GHz band, the nano nickel zinc manganese ferrite absorbing peak reflectivity is relative to the electromagnetic wave absorbing effect at low frequency. With the increase of Mn
2+ doping amount, the absorbing peak reflectivity of the sample is: 9.65 dB, 9.31 dB, 11.65 dB, 8.64 dB, and 7.63 dB. The absorbing reflectivity increased by 12.01 dB at the doping amount of x = 0.25–7.63 dB, which is shown by the curve in
Figure 8. As a result, the Mn
2+ impurity in the nano-nickel-zinc ferrite decreases the absorbing-wave performance of the material. With this decrease in the absorbing effect, the effective band width will not change significantly. This is because when doping with Mn
2+, the octahedral Fe
3+ (B), the concentration of Fe
2+, and the octahedron (B) Fe
2+ with its positive magnetocrystalline anisotropy constant are replaced. The Mn
2+ negative magnetocrystalline anisotropy constant makes it smaller and, therefore, reduces the electromagnetic loss of the material. This weakens the wave absorption performance.
3.3. The Influence of the Doped Cu2+ Content on the Performance of Nano-Nickel Zinc Ferrite Absorbability
As can be seen from the
Figure 9, five samples of peak type are compared with standard atlas JCPDS and all have the characteristic diffraction peaks of the spinel ferrite. The main diffraction peak position essentially remains unchanged. With an increase in the Cu
2+ dopant, the intensity of the main (311) peak at 718.00 and decreases to 496.67. The diffraction peak gradually broadens. While the crystalline degree is smaller, there are different alpha Fe
2O
3 diffraction peak intensities in the pattern. The nanometer copper nickel zinc ferrite peaks are impurities.
Table 3 shows the copper nickel zinc ferrite grain sizes. The lattice constant increased with an increase in Cu
2+ dopant while the grain size and lattice constant undergo an opposite change. Because of the copper defects in the lattice, the nickel-zinc ferrite lattice distortion is not conducive to the growth of the lattice constant [
21]. The grain size is smaller because the Cu
2+ first entered the lattice on the surface of the grain. The surface defects of the grain prevent the combination between grains. This inhibits grain growth. Conversely, due to the contraction of the cell size, the Cu
2+ radius is smaller than the radii of Ni
2+ and Zn
2+, which causes lattice distortion of the nanocrystals and results in a decrease in the cell size. As revealed here, the doped influence of Cu
2+ on the structural parameters of the ferrite will affect the material’s absorbability.
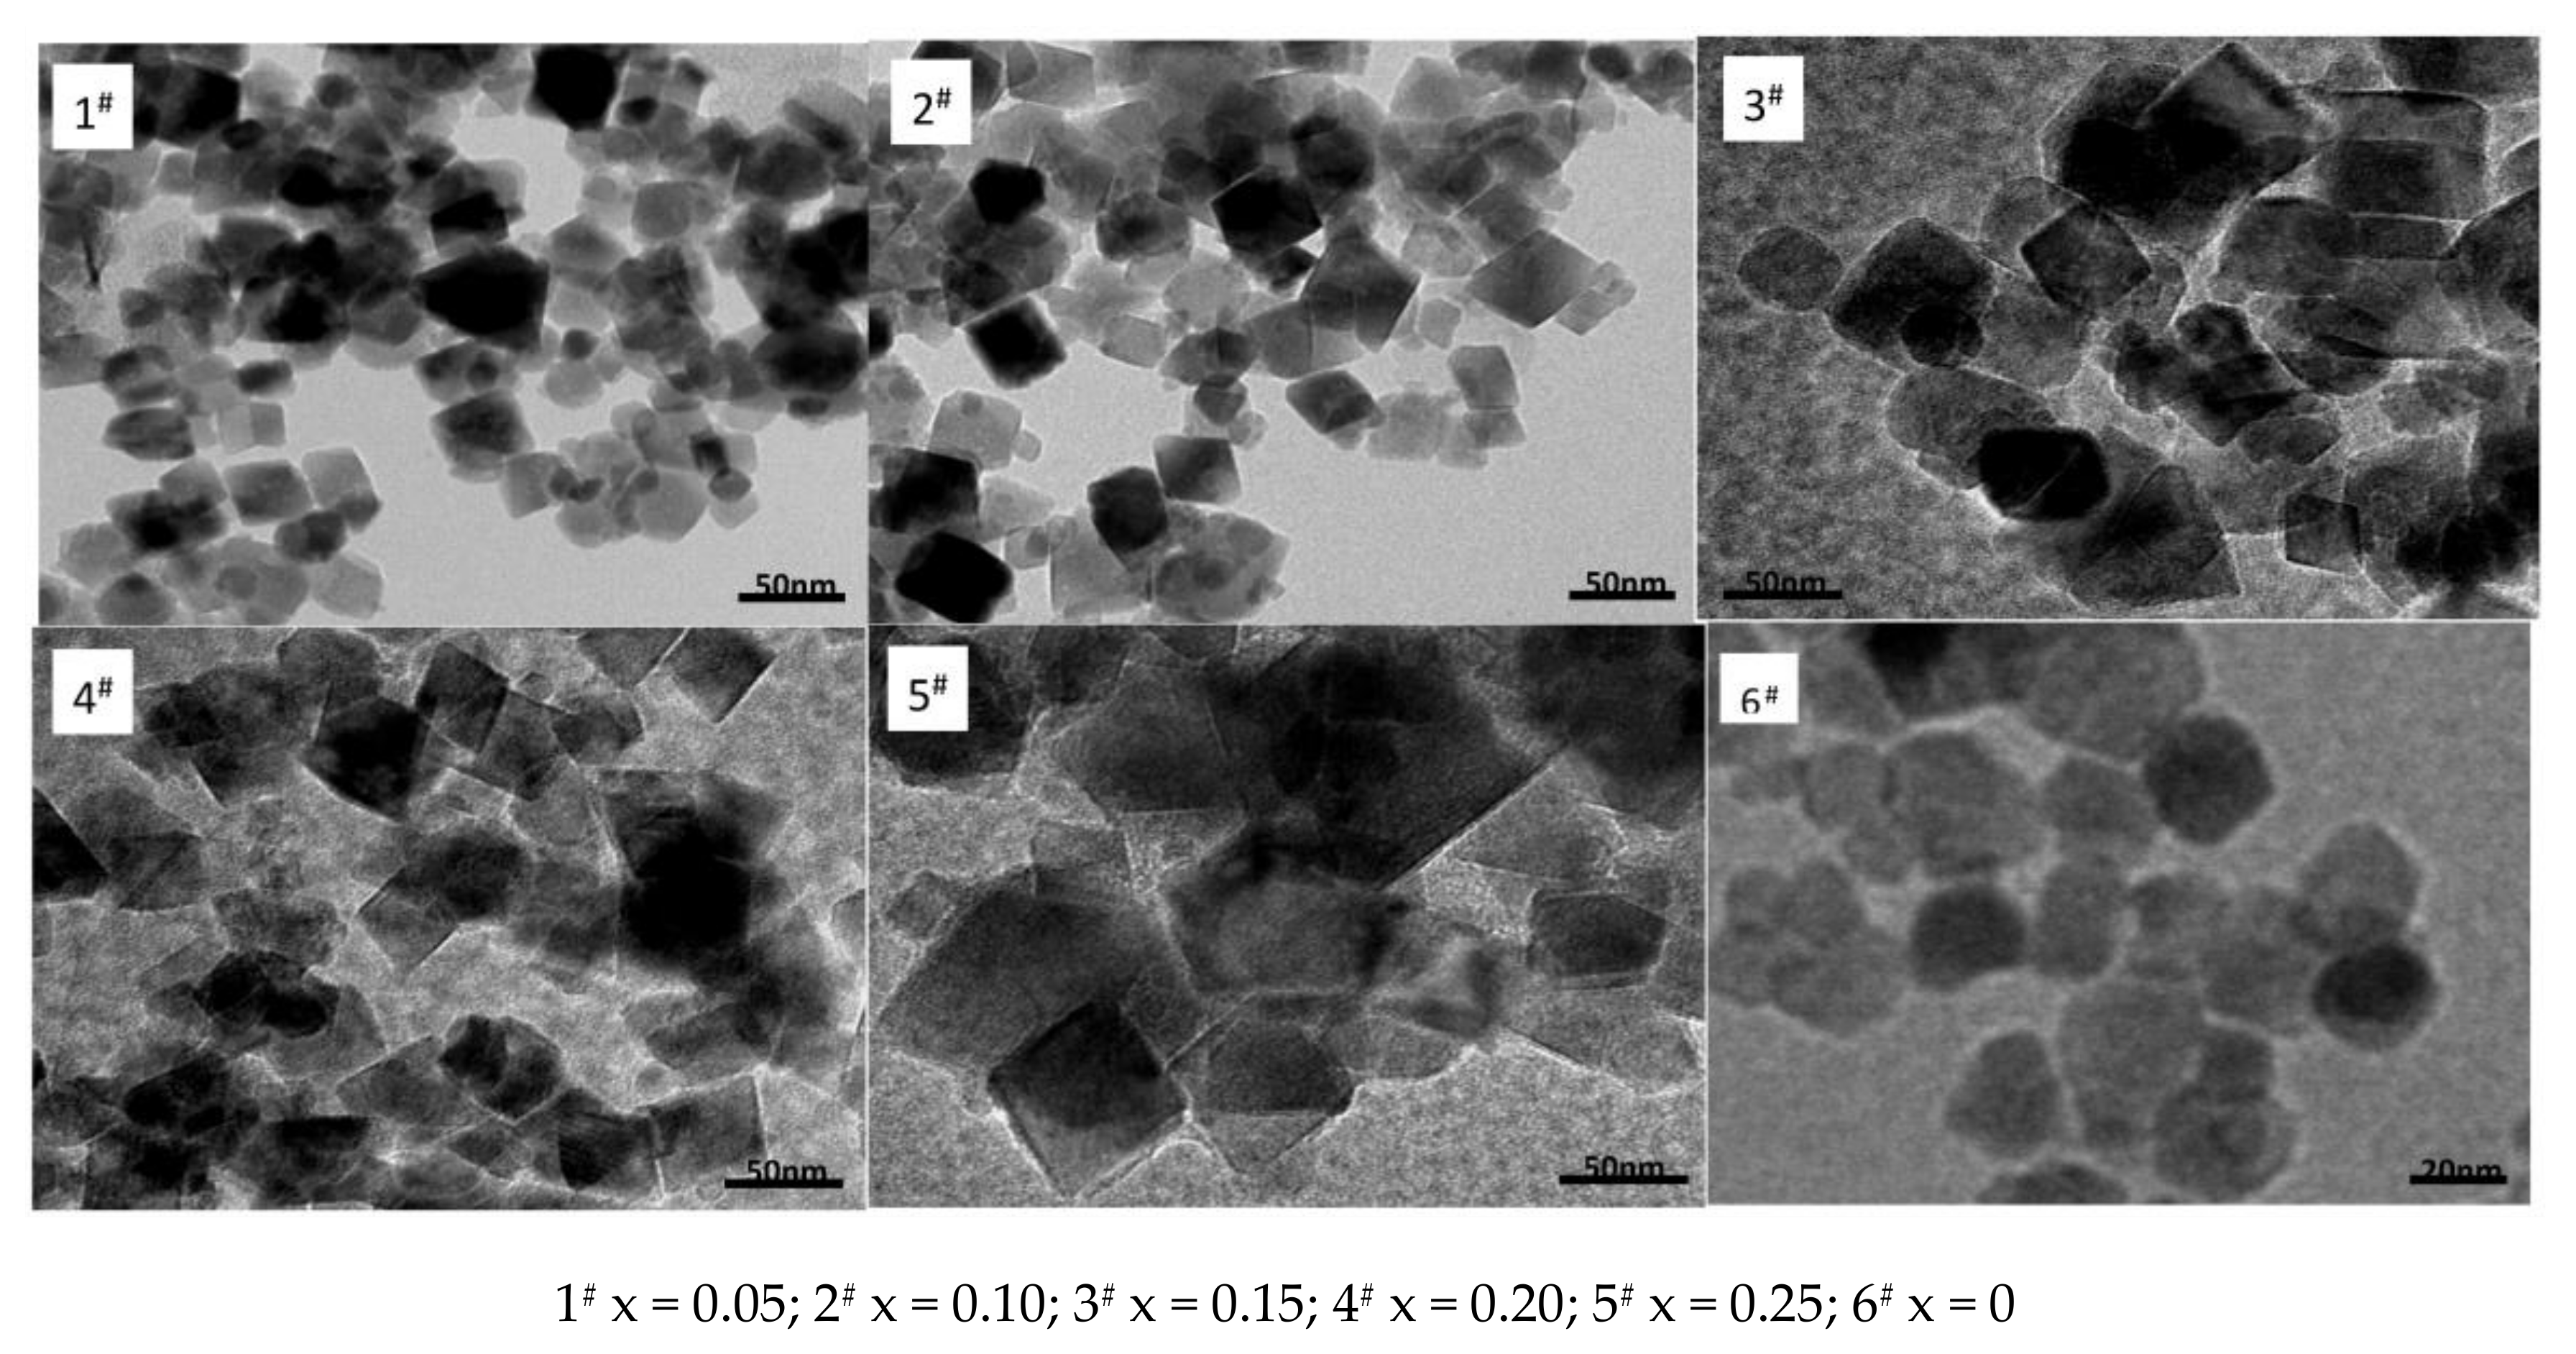
Figure 10 exhibits a nano Ni
0.6Zn
(0.4−x)Cu
xFe
2O
4 TEM diagram. As shown in the figure, the generated nano nickel zinc ferrite morphology has characteristics of the copper quadrilateral structure, grain shape, and size distribution. When the Cu
2+ content decreases, the ferrite particles are larger than the unadulterated ones, but the spatial dispersion is still relatively good with decent agglomeration of the material. With an increase in Cu
2+ dopant, the grain size is smaller and the agglomeration phenomenon is more dramatic. When the Cu
2+ dopant reaches x = 0.25, the nanometer copper nickel zinc ferrite grain size changes from 59.63 nm to 32.46 nm and the agglomeration phenomenon intensifies. This is because the radius of Cu
2+ and Ni
2+ are similar. In the reaction, Cu
2+ fills the space between the mutual ions and maintains the balance of charge. Through a spin mechanism, it inhibits the growth of particles. With the increase in the Cu
2+ dopant, the grain size decreases. At the same time, transmission electron microscopy (TEM) sample preparation takes roughly half an hour. Through the ultrasonic oscillations of the scattered material, the sample structure is not damaged, which indicates that the structure itself is very stable.
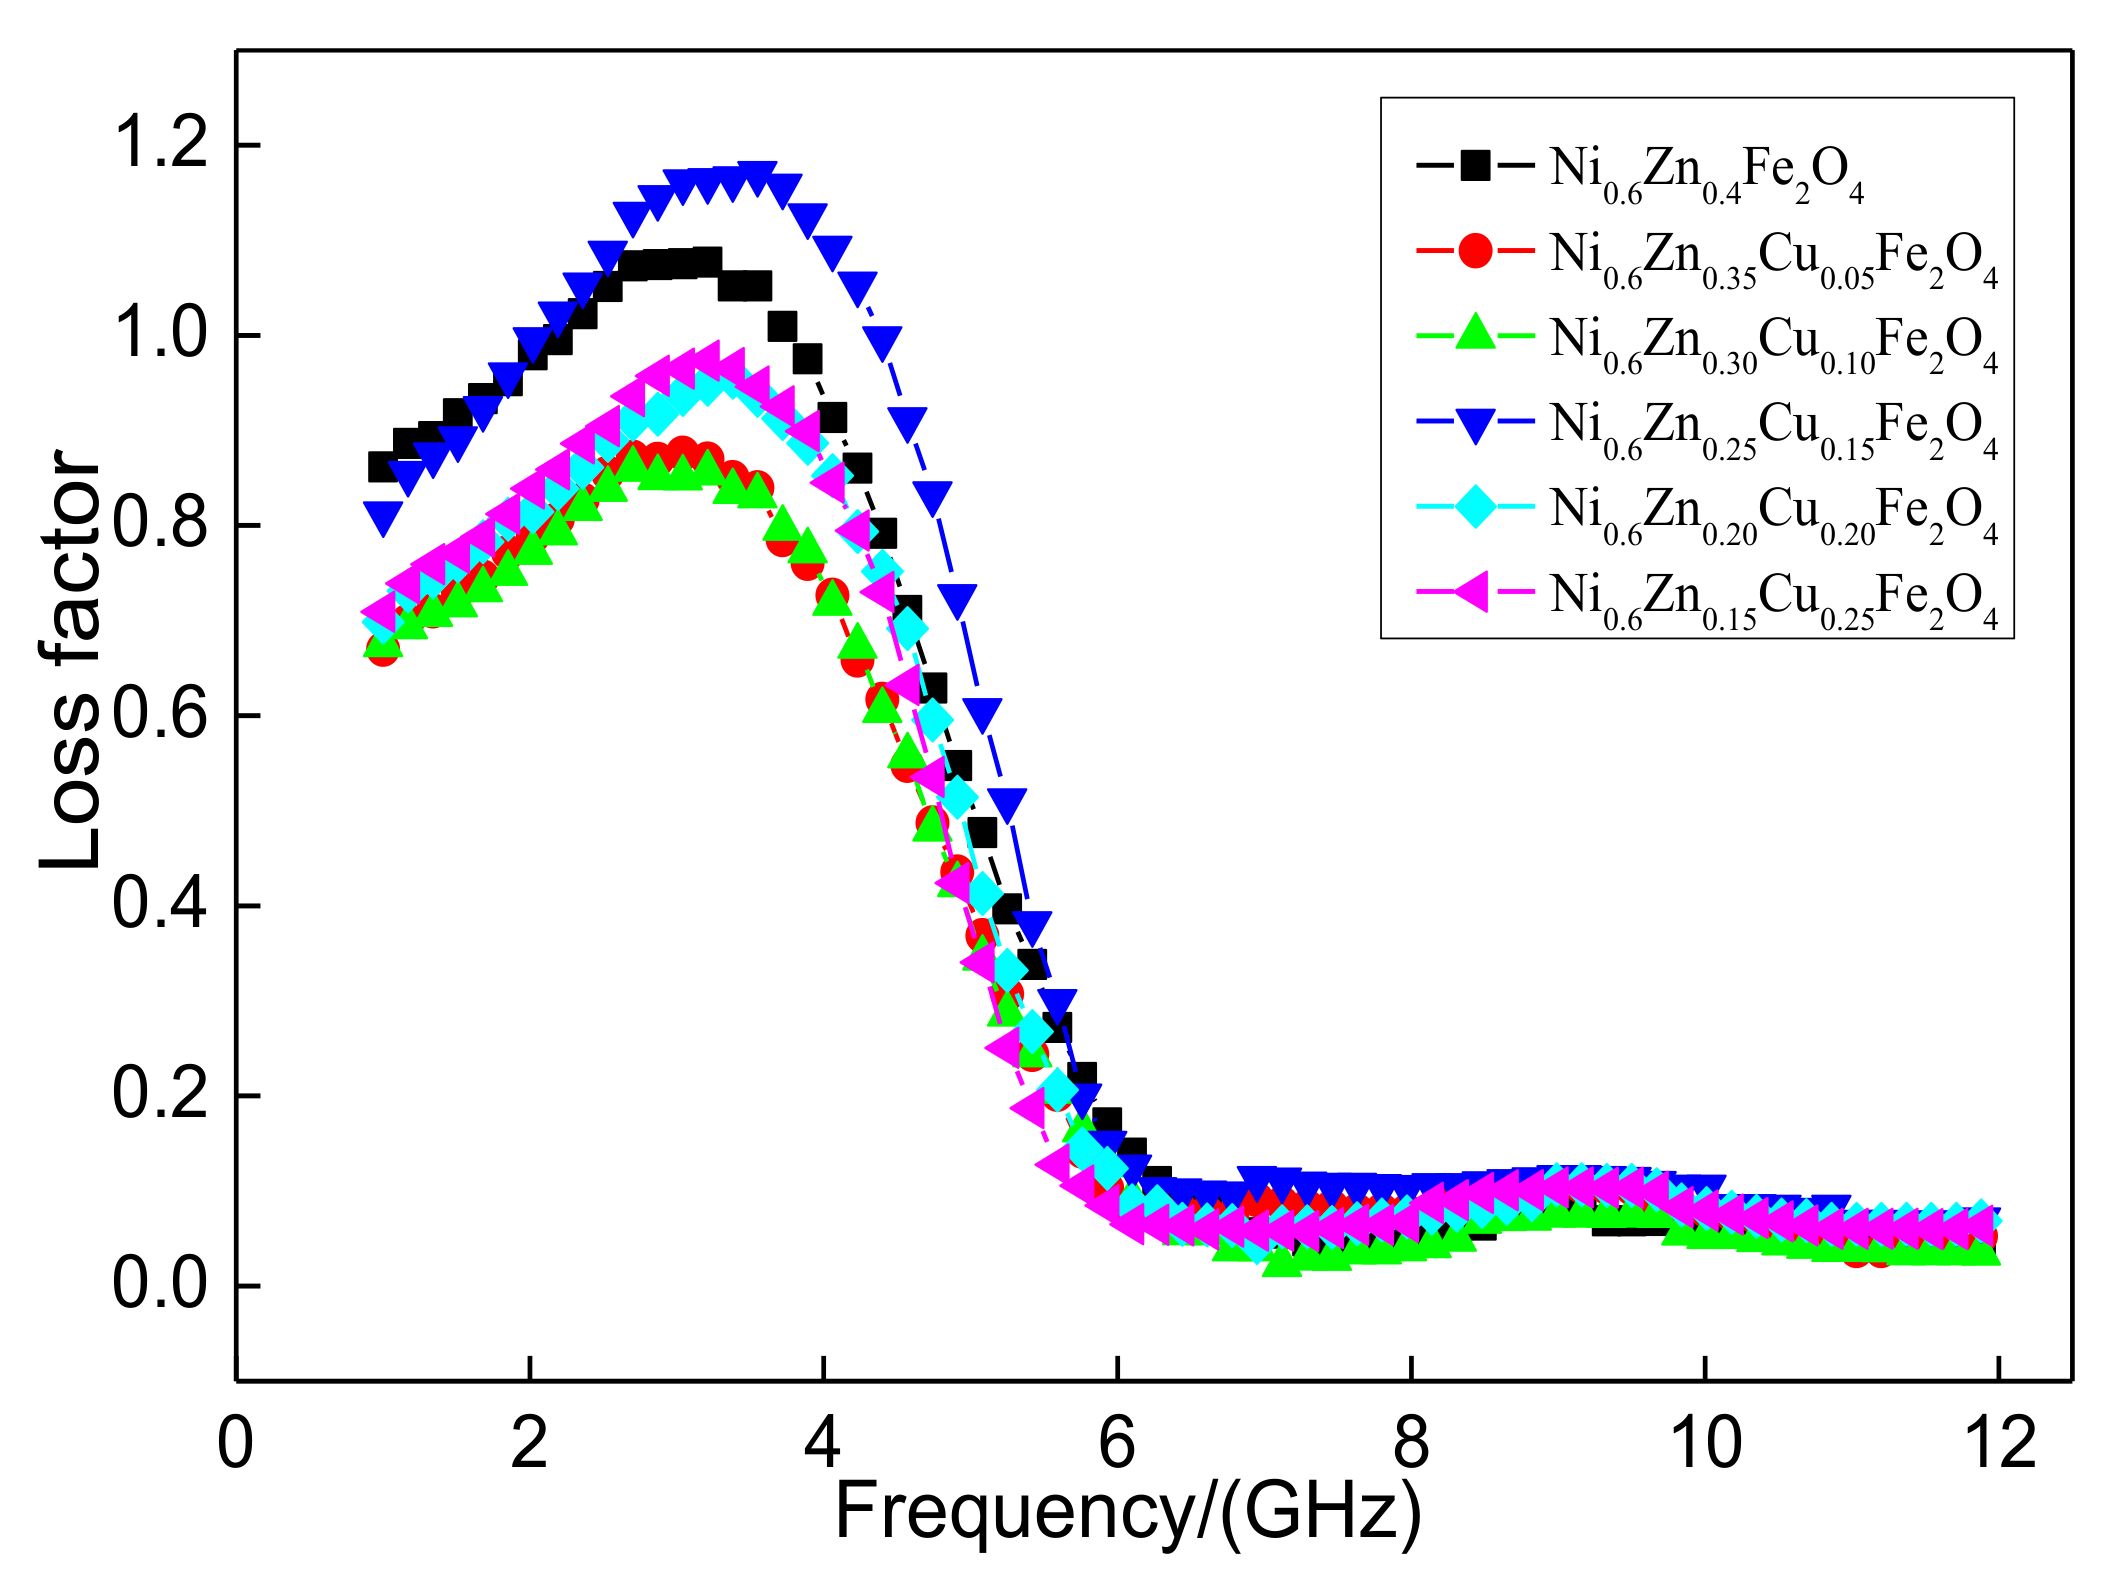
Figure 11 shows the loss factor tan
δ of the nanometer Ni
0.6Zn
(0.4−x)Cu
xFe
2O
4. The loss factor is overall consistent while the change in frequency first decreases and then increases. There are no special fluctuations, which illustrates that the Cu
2+ doping does not affect the effective frequency band range of the nanometer nickel zinc ferrite magnetic loss in the 1~5 GHz frequency range. With an increase in Cu
2+ dopant, the loss factor or tanδ value decreases after a quick increase and then decreases again. When the Cu
2+ content is too low, the tangent essentially goes unchanged. When the doping quantity reaches x = 0.15, the loss factor of the material, “the tangent of the tangent of the tangent,” exhibits a large change, which reaches a maximum of 1.17. This is where the absorbance-wave performance is at the highest value. When the Cu
2+ content is too high, the tangent of the tangent is smaller and much less than the unadulterated value. As revealed by a comprehensive analysis of the electromagnetic loss, within the 1~12 GHz band, Cu
2+ doping did not improve the absorbance area. The appropriate Cu
2+ doping amount is necessary to reach the absorbance performance of the reinforced material. When the Cu
2+ dose reaches 0.15, the nanometer Ni
0.6Zn
0.25Cu
0.15Fe
2O
4 is more suitable for electromagnetic dissipation of the electromagnetic waves and, therefore, it performs better.
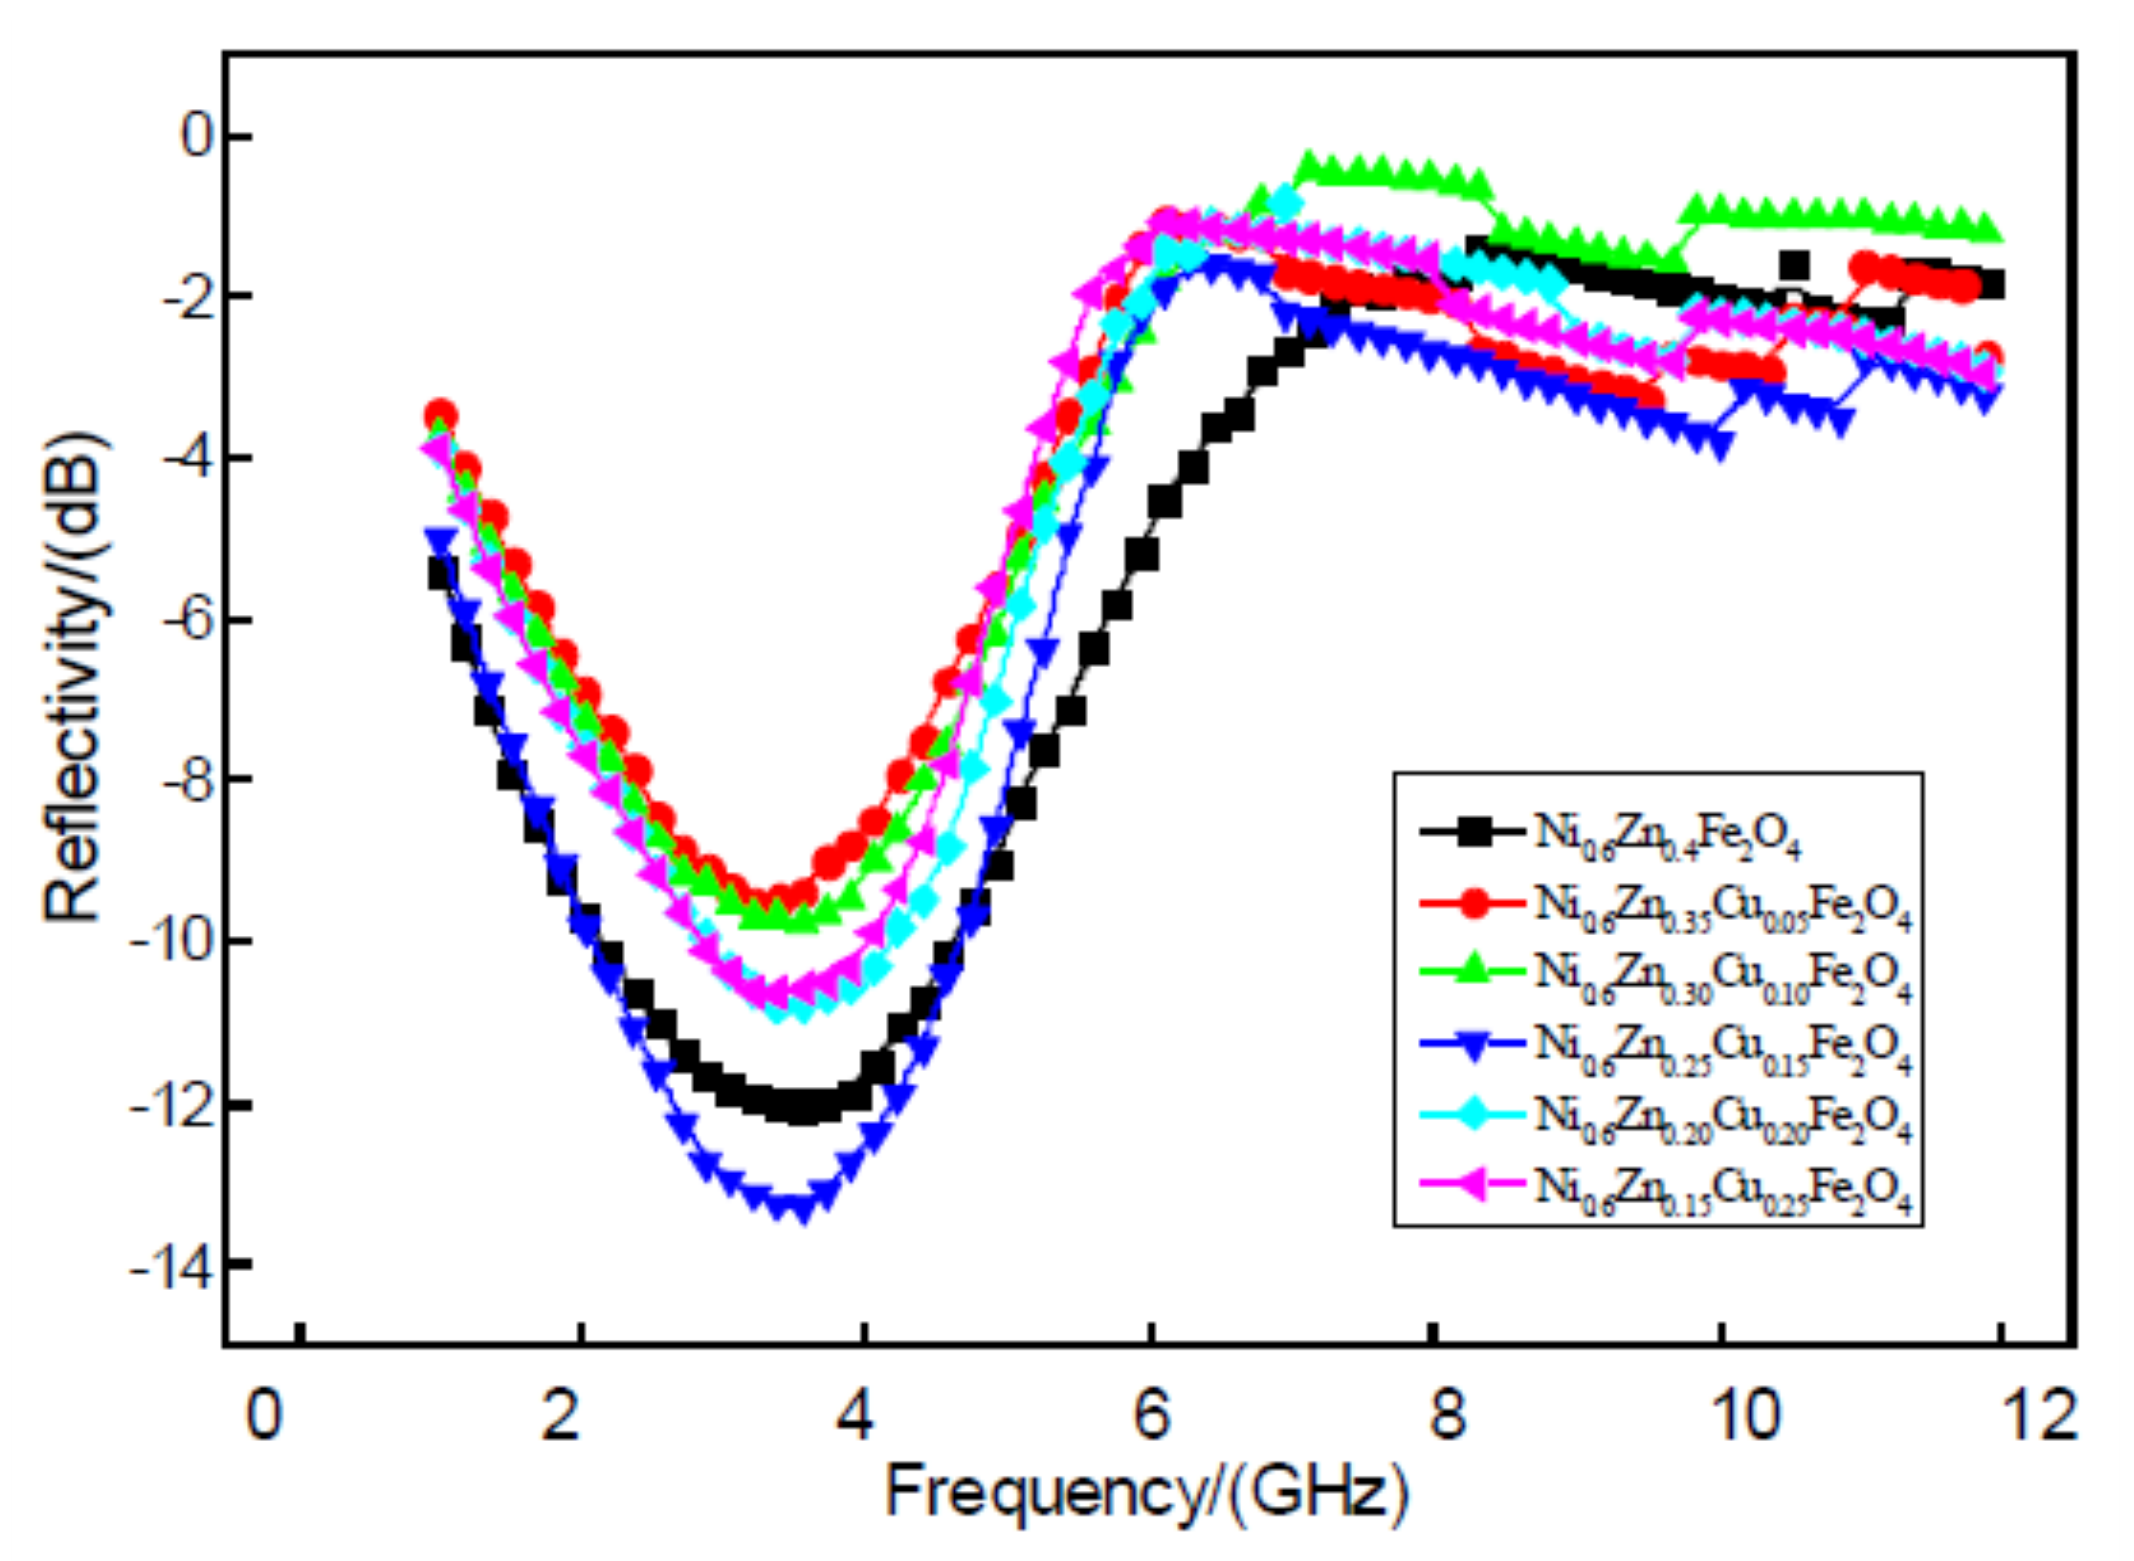
Figure 12 displays a 2 mm nanoscale image of the Ni
0.6Zn
(0.4−x)Cu
xFe
2O
4 material. Within the test range, six samples showed a strong reflectivity absorption peak at 1~5 GHz frequencies while the other peaks were not as intense. With the addition of Cu
2+, the position of the strong peak does not change and the wave band does not widen but instead exhibits a slight narrowing. The Cu
2+ doping amount at x > 0.15 reveals a greater influence on the reflectivity of the samples. Such reflectivity values of −10 dB are obtained near the 3.5 GHz absorbing peak reflectivity from 12.01 dB down to a dopant concentration of x = 0.15, −13.29 dB. While the absorbance performance improves, the other doping amount of the reflectivity is greater than 12.01 dB. This overall weakens the wave absorption performance of the nanometer nickel zinc ferrite. This may be due to the material’s structure. Zn
2+ first enters the tetrahedral holes (A) while Cu
2+ and Ni
2+ prefer to occupy the octahedral holes (B). At the same time, Fe
3+ occupies both A and B [
22]. The magnetic moment of Fe
3+ is 5 μB. The magnetic moment of Cu
2+ (2 μB) is greater than that of Zn
2+, which carries no magnetic moment. Because some Cu
2+ ions replace A and Zn
2+, the B net magnetic moment is reduced, which decreases the magnetic loss and weakens the wave absorption performance. However, just the right amount of Cu
2+ could enter the tetrahedral holes by arriving at the location of Fe
3+ A. The B to B A net magnetic moment could increase, enhance the A magnetic moment of exchange, and, thereby, increase the magnetic loss. This would then improve wave absorption performance. Therefore, it is possible to apply the appropriate amount of Cu
2+ to enhance the absorbing performance of the material.


