Revealing Grain Boundary Sliding from Textures of a Deformed Nanocrystalline Pd–Au Alloy

 ,
, 
 and
and
Abstract
:
1. Introduction
2. Experimental Details
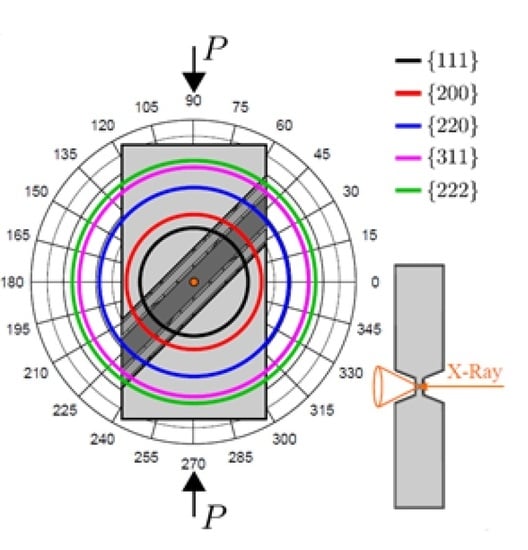
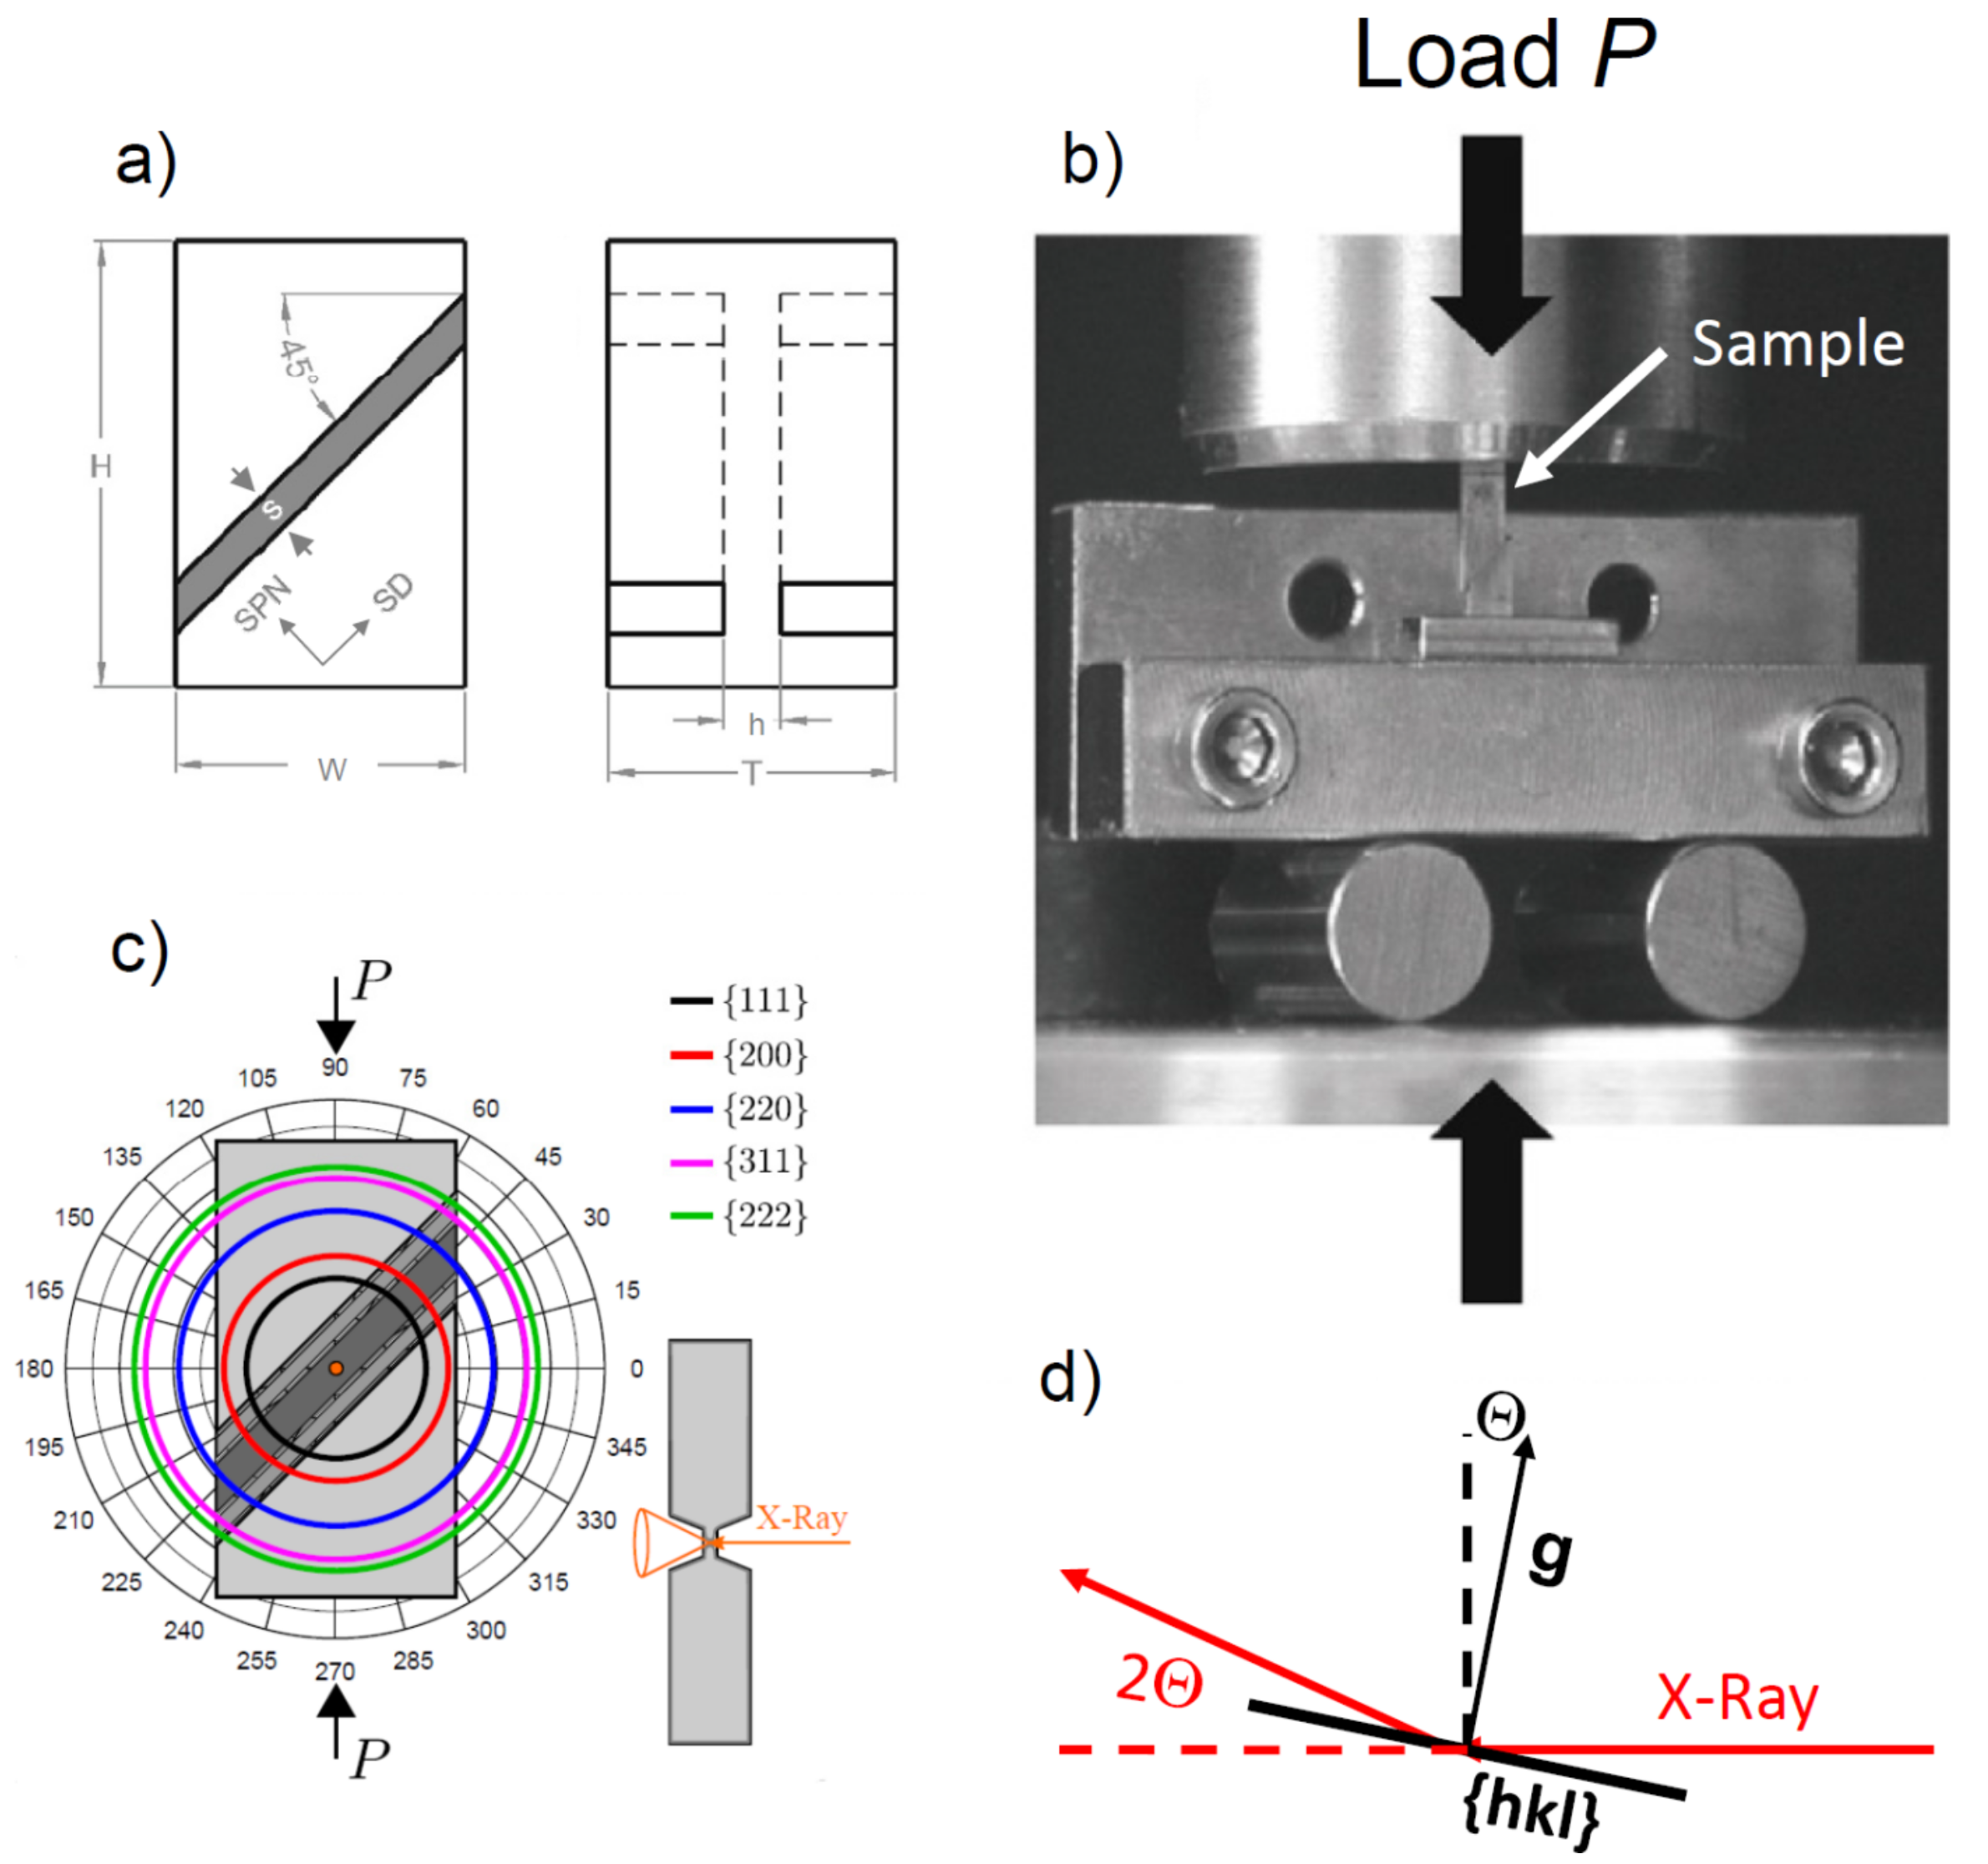
2.1. Material, Deformation, and In-Situ X-ray Microdiffraction
2.2. Texture Simulations
3. Results and Discussion
4. Conclusions
- (i)
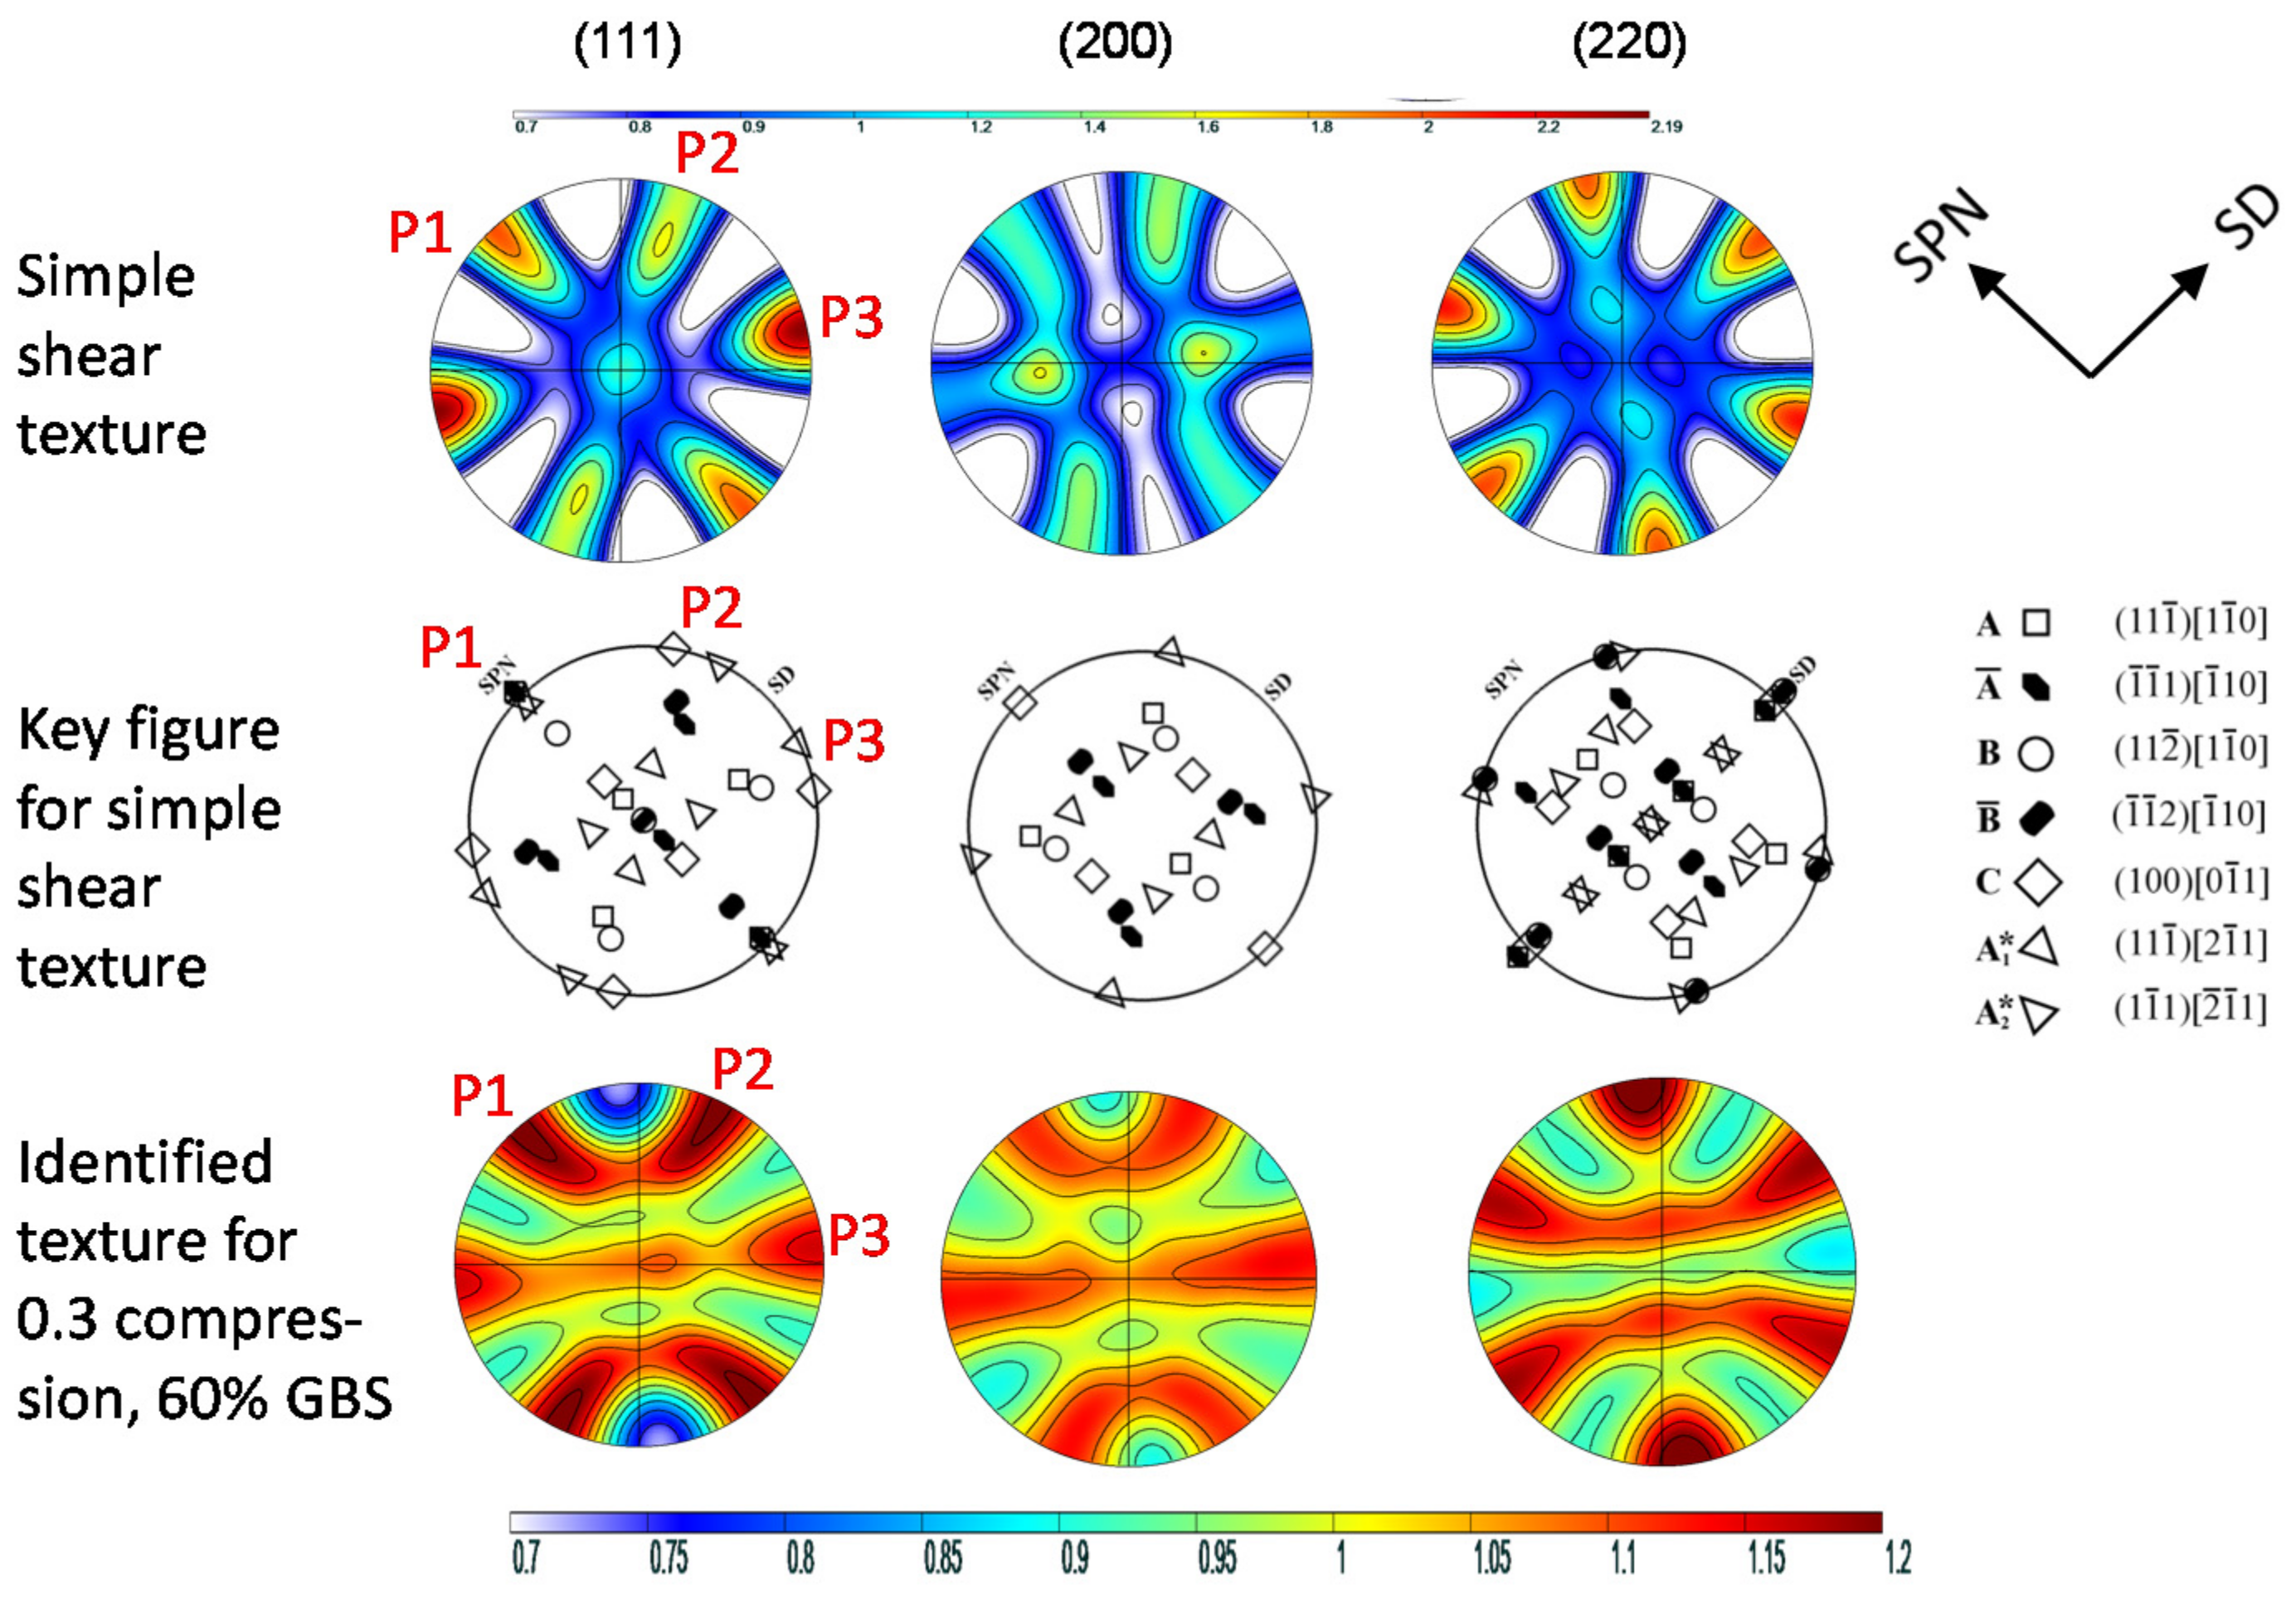
- GBS decreases the texture strength but keeps the signatures of the texture type.
- (ii)
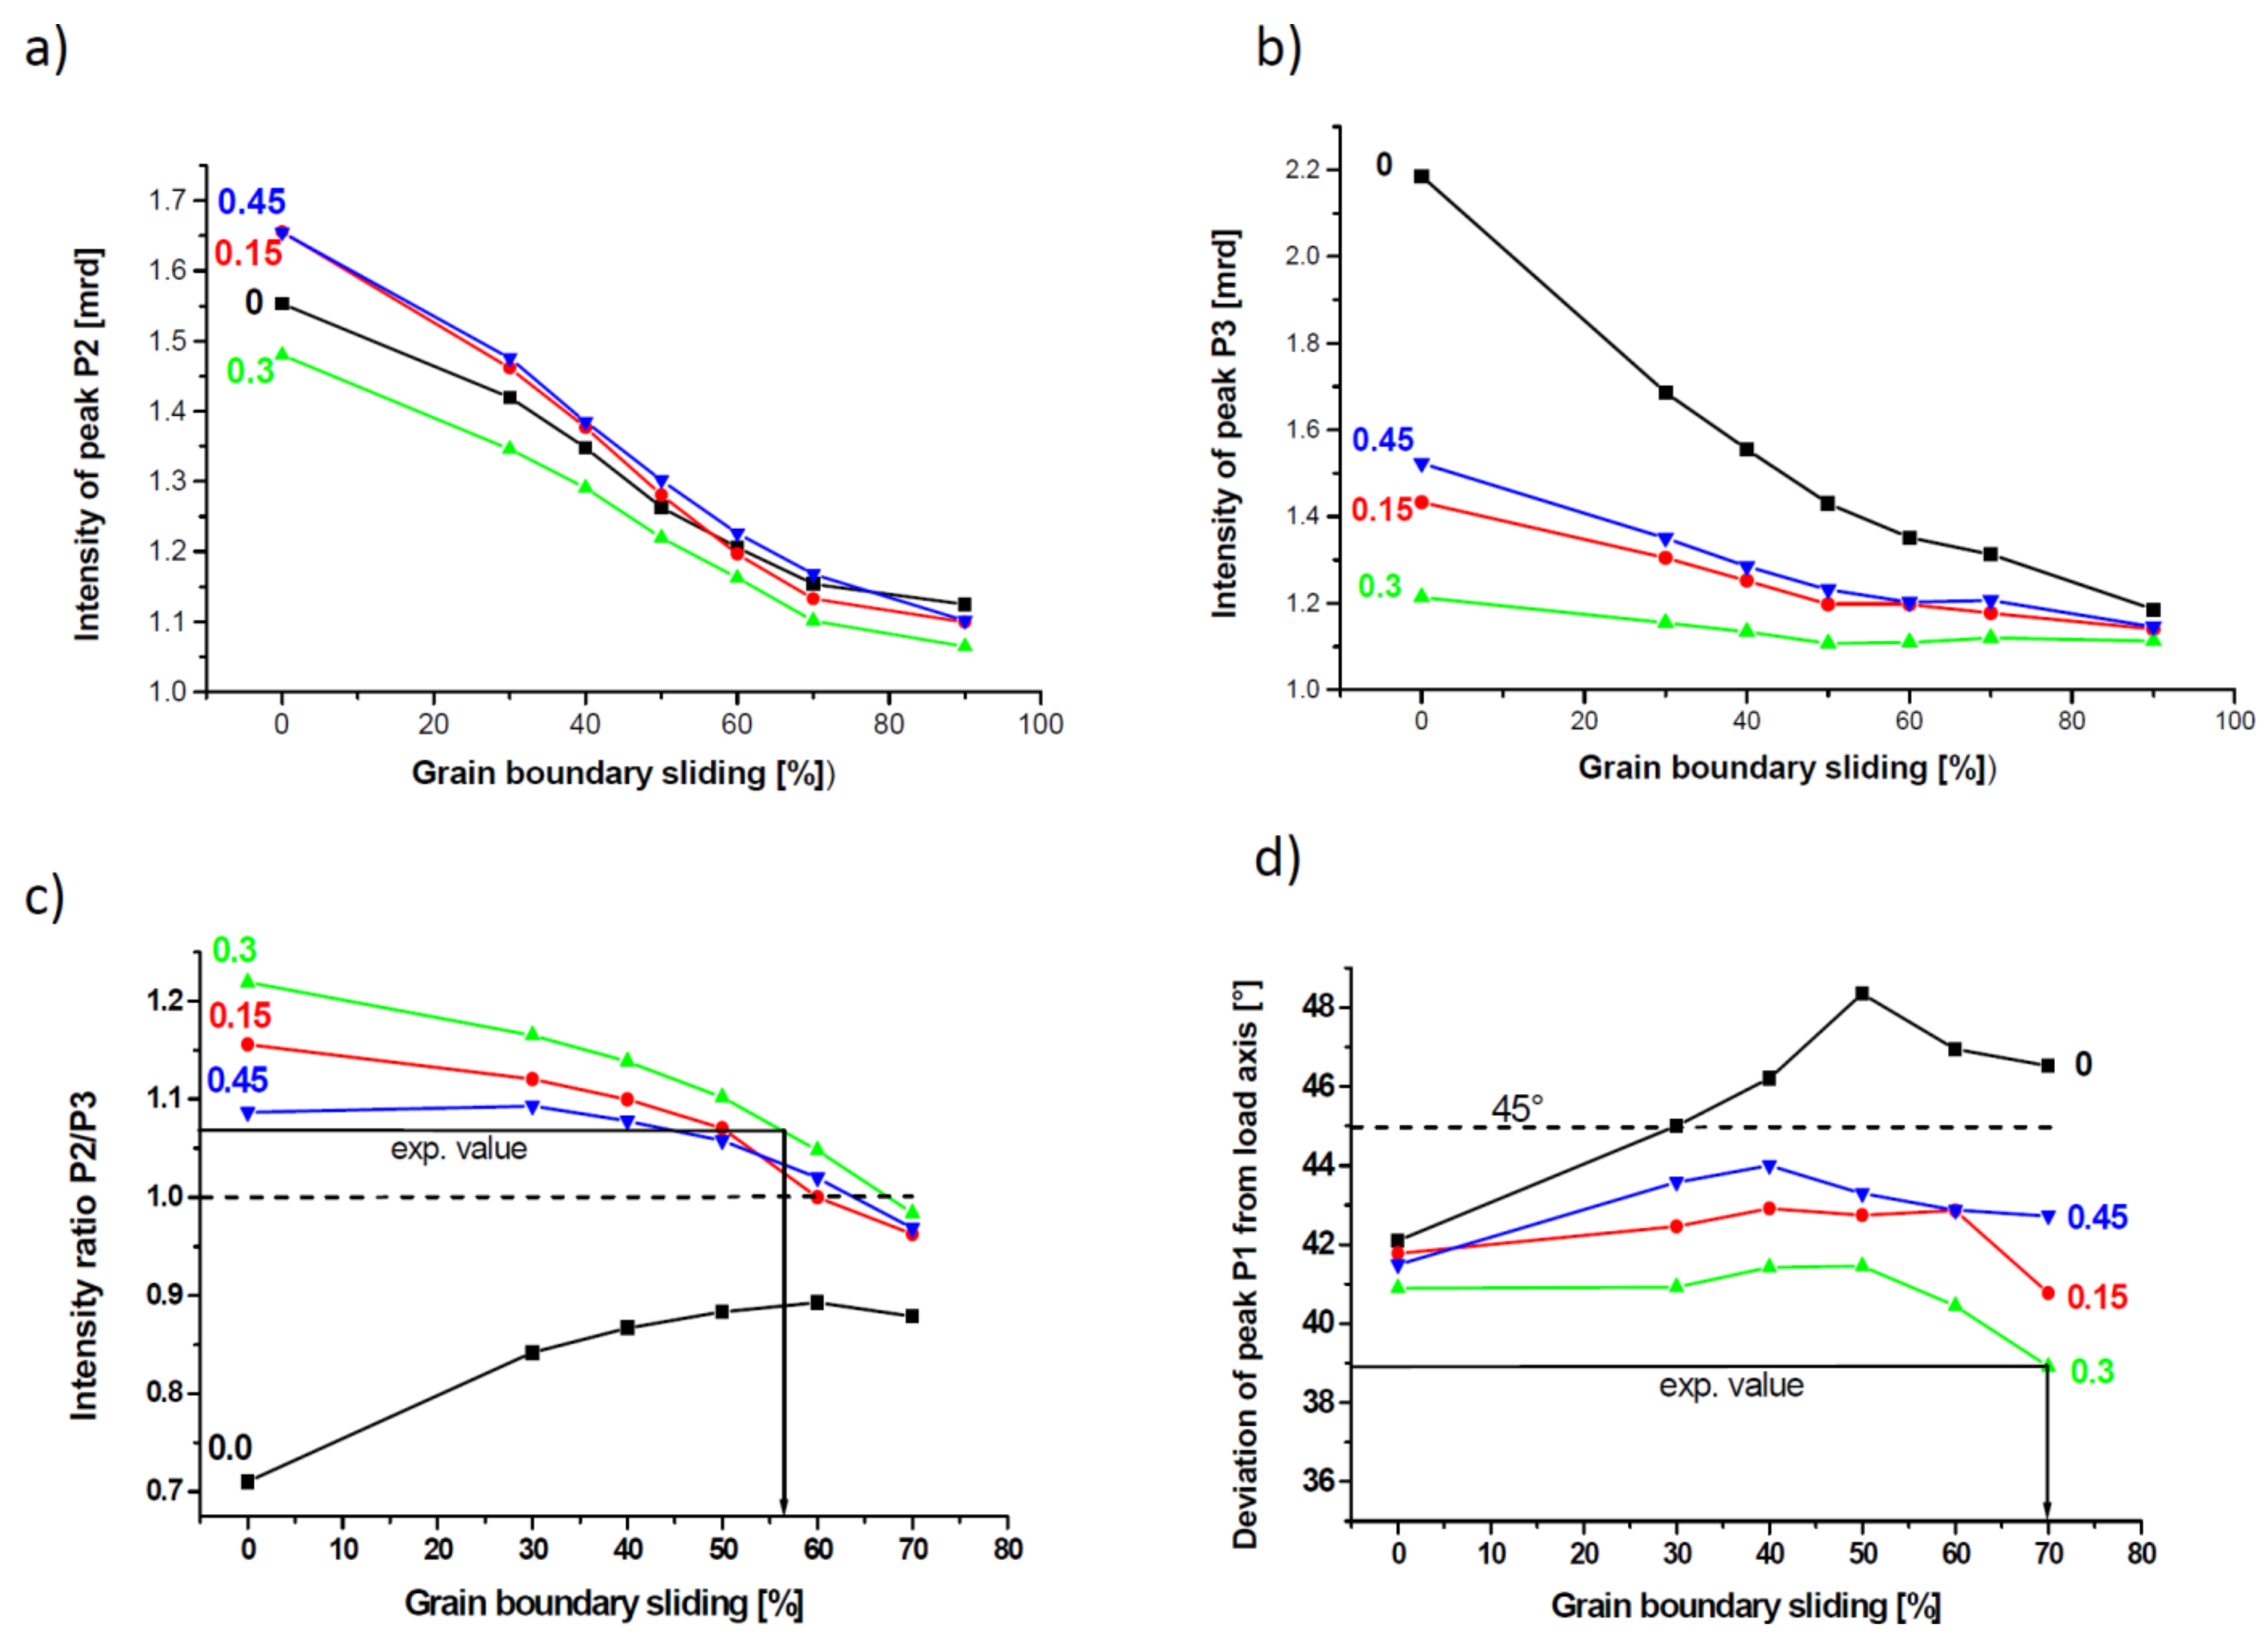
- GBS affects the texture components differently with respect to intensity and angular position.
- (iii)
- The amount of GBS can be estimated from the texture evolution as a function of GBS.
- (iv)
- In the investigated Pd–10 atom % Au alloy with a grain size of about 15 nm, GBS is the predominant deformation mode at room temperature, contributing to strain by about 60%.
Acknowledgments
Author Contributions
Conflicts of Interest
References
- Skrotzki, W.; Eschke, A.; Jóni, B.; Ungár, T.; Tóth, L.S.; Ivanisenko, Y.; Kurmanaeva, L. New experimental insight into the mechanisms of nanoplasticity. Acta Mater. 2013, 61, 7271–7284. [Google Scholar] [CrossRef]
- Chokshi, A.; Rosen, A.; Karch, J.; Gleiter, H. On the validity of the Hall-Petch relationship in nanocrystalline materials. Scr. Metall. 1989, 23, 1679–1683. [Google Scholar] [CrossRef]
- Ivanisenko, Y.; Skrotzki, W.; Chulist, R.; Lippmann, T.; Kurmanaeva, L. Texture development in a nanocrystalline Pd–Au alloy studied by synchrotron radiation. Scr. Mater. 2012, 66, 131–134. [Google Scholar] [CrossRef]
- Hahn, H.; Mondal, P.; Padmanabhan, K.A. Plastic deformation of nanocrystalline materials. Nanostruct. Mater. 1997, 9, 603–606. [Google Scholar] [CrossRef]
- Grewer, M.; Braun, C.; Deckarm, M.J.; Lohmiller, J.; Gruber, P.A.; Honkimäki, V.; Birringer, R. Anatomizing deformation mechanisms in nanocrystalline Pd90Au10. Mech. Mater. 2017, 114, 254–267. [Google Scholar] [CrossRef]
- Li, L.; Ungár, T.; Toth, L.S.; Skrotzki, W.; Wang, Y.D.; Ren, Y.; Choo, H.; Fogarassy, Z.; Zhou, X.T.; Liaw, P.K. Shear-coupled grain growth and texture development in a nanocrystalline ni-fe alloy during cold rolling. Met. Trans. A 2016, 47, 6632–6644. [Google Scholar] [CrossRef]
- Zhao, Y.; Toth, L.S.; Massion, R.; Skrotzki, W. Role of grain boundary sliding in texture evolution for nanoplasticity. Adv. Eng. Mater. 2017, 2700212. [Google Scholar] [CrossRef]
- Birringer, R. Nanocrystalline materials. Mater. Sci. Eng. A 1989, 117, 33–43. [Google Scholar] [CrossRef]
- Rittel, D.; Lee, S.; Ravichandran, G. A shear-compression specimen for large strain testing. Exp. Mech. 2002, 42, 58–64. [Google Scholar] [CrossRef]
- Ames, M.; Markmann, J.; Birringer, R. Mechanical testing via dominant shear deformation of small-sized specimen. Mater. Sci. Eng. A 2010, 528, 526–532. [Google Scholar] [CrossRef]
- Lohmiller, J.; Grewer, M.; Braun, C.; Kobler, A.; Kübel, C.; Schüler, K.; Honkimäki, V.; Hahn, H.; Kraft, O.; Birringer, R.; et al. Untangling dislocation and grain-boundary-mediated plasticity in nanocrystalline nickel. Acta Mater. 2014, 65, 295–307. [Google Scholar] [CrossRef]
- Ames, M.; Grewer, M.; Braun, C.; Birringer, R. Nanocrystalline metals go ductile under shear deformation. Mater. Sci. Eng. A 2012, 546, 248–257. [Google Scholar] [CrossRef]
- Hutchinson, J.W. Bounds and self-consistent estimates for creep of polycrystalline materials. Proc. R. Soc. A 1976, 348, 101–127. [Google Scholar] [CrossRef]
- Tóth, L.S.; Gilormini, P.; Jonas, J.J. Effect of rate sensitivity on the stability of torsion textures. Acta Metall. 1988, 36, 3077–3091. [Google Scholar] [CrossRef]
- Meyers, M.A.; Mishra, A.; Benson, D.J. Mechanical properties of nanocrystalline materials. Prog. Mater. Sci. 2006, 51, 427–556. [Google Scholar] [CrossRef]
- Braun, C. Plastizität von PdAu-Legierungen am unteren Ende der Nanoskala: Ein Übergang zu glasartigem Verhalten? Ph.D. Thesis, Universität des Saarlandes, Saarbrücken, Germany, April 2015. [Google Scholar] [CrossRef]


© 2018 by the authors. Licensee MDPI, Basel, Switzerland. This article is an open access article distributed under the terms and conditions of the Creative Commons Attribution (CC BY) license (http://creativecommons.org/licenses/by/4.0/).
Share and Cite
Toth, L.S.; Skrotzki, W.; Zhao, Y.; Pukenas, A.; Braun, C.; Birringer, R. Revealing Grain Boundary Sliding from Textures of a Deformed Nanocrystalline Pd–Au Alloy. Materials 2018, 11, 190. https://doi.org/10.3390/ma11020190
Toth LS, Skrotzki W, Zhao Y, Pukenas A, Braun C, Birringer R. Revealing Grain Boundary Sliding from Textures of a Deformed Nanocrystalline Pd–Au Alloy. Materials. 2018; 11(2):190. https://doi.org/10.3390/ma11020190
Chicago/Turabian StyleToth, Laszlo S., Werner Skrotzki, Yajun Zhao, Aurimas Pukenas, Christian Braun, and Rainer Birringer. 2018. "Revealing Grain Boundary Sliding from Textures of a Deformed Nanocrystalline Pd–Au Alloy" Materials 11, no. 2: 190. https://doi.org/10.3390/ma11020190
APA StyleToth, L. S., Skrotzki, W., Zhao, Y., Pukenas, A., Braun, C., & Birringer, R. (2018). Revealing Grain Boundary Sliding from Textures of a Deformed Nanocrystalline Pd–Au Alloy. Materials, 11(2), 190. https://doi.org/10.3390/ma11020190