Incorporating Liquid Crystal Display (LCD) Glass Waste as Supplementary Cementing Material (SCM) in Cement Mortars—Rationale Based on Hydration, Durability, and Pore Characteristics


Abstract
1. Introduction
2. Materials and Experimental Methods
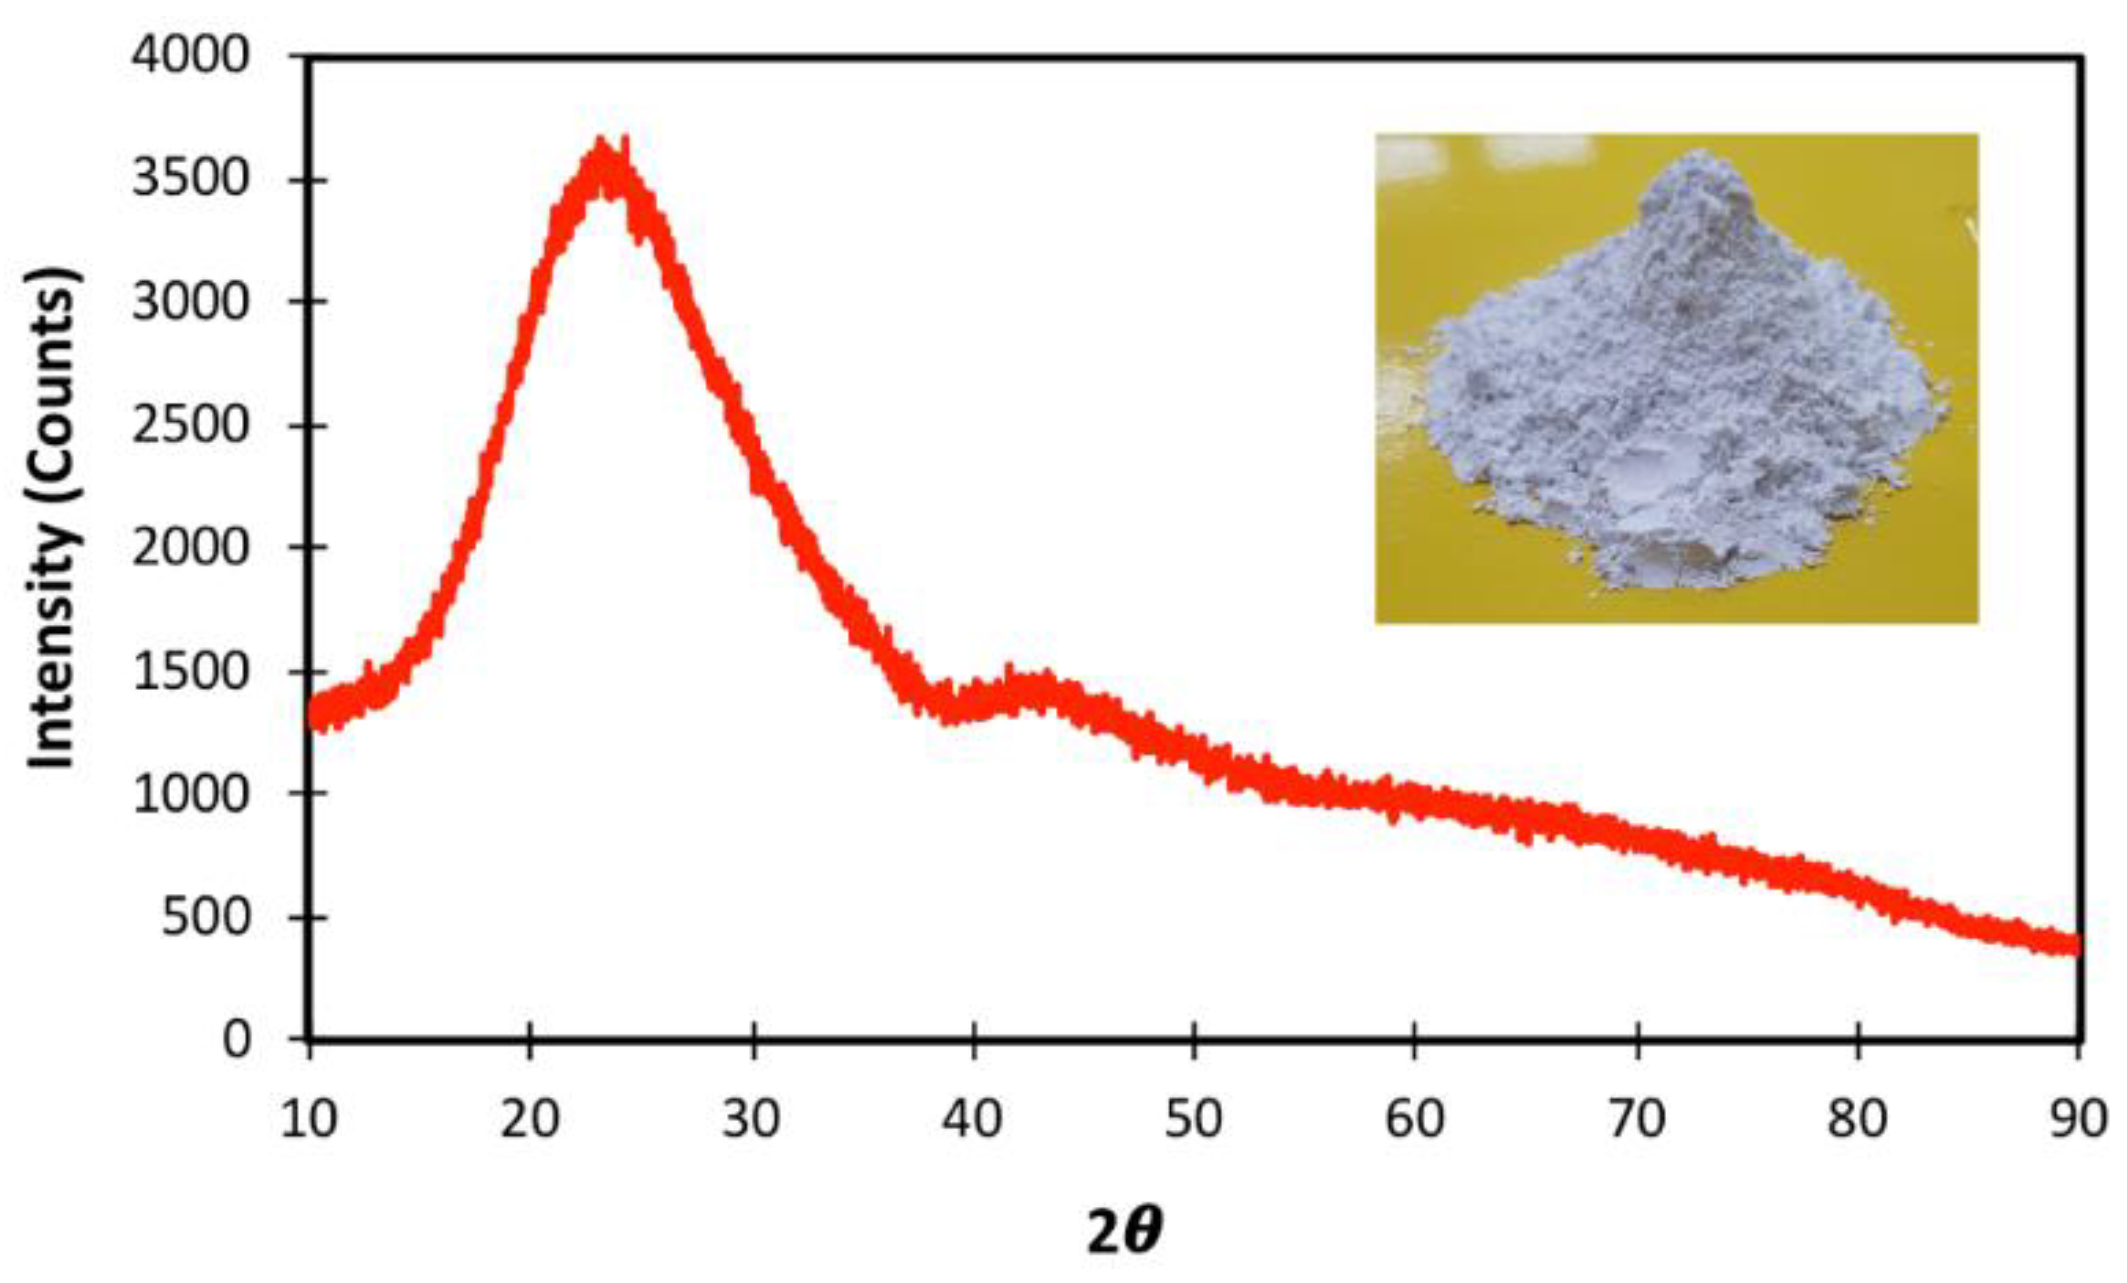
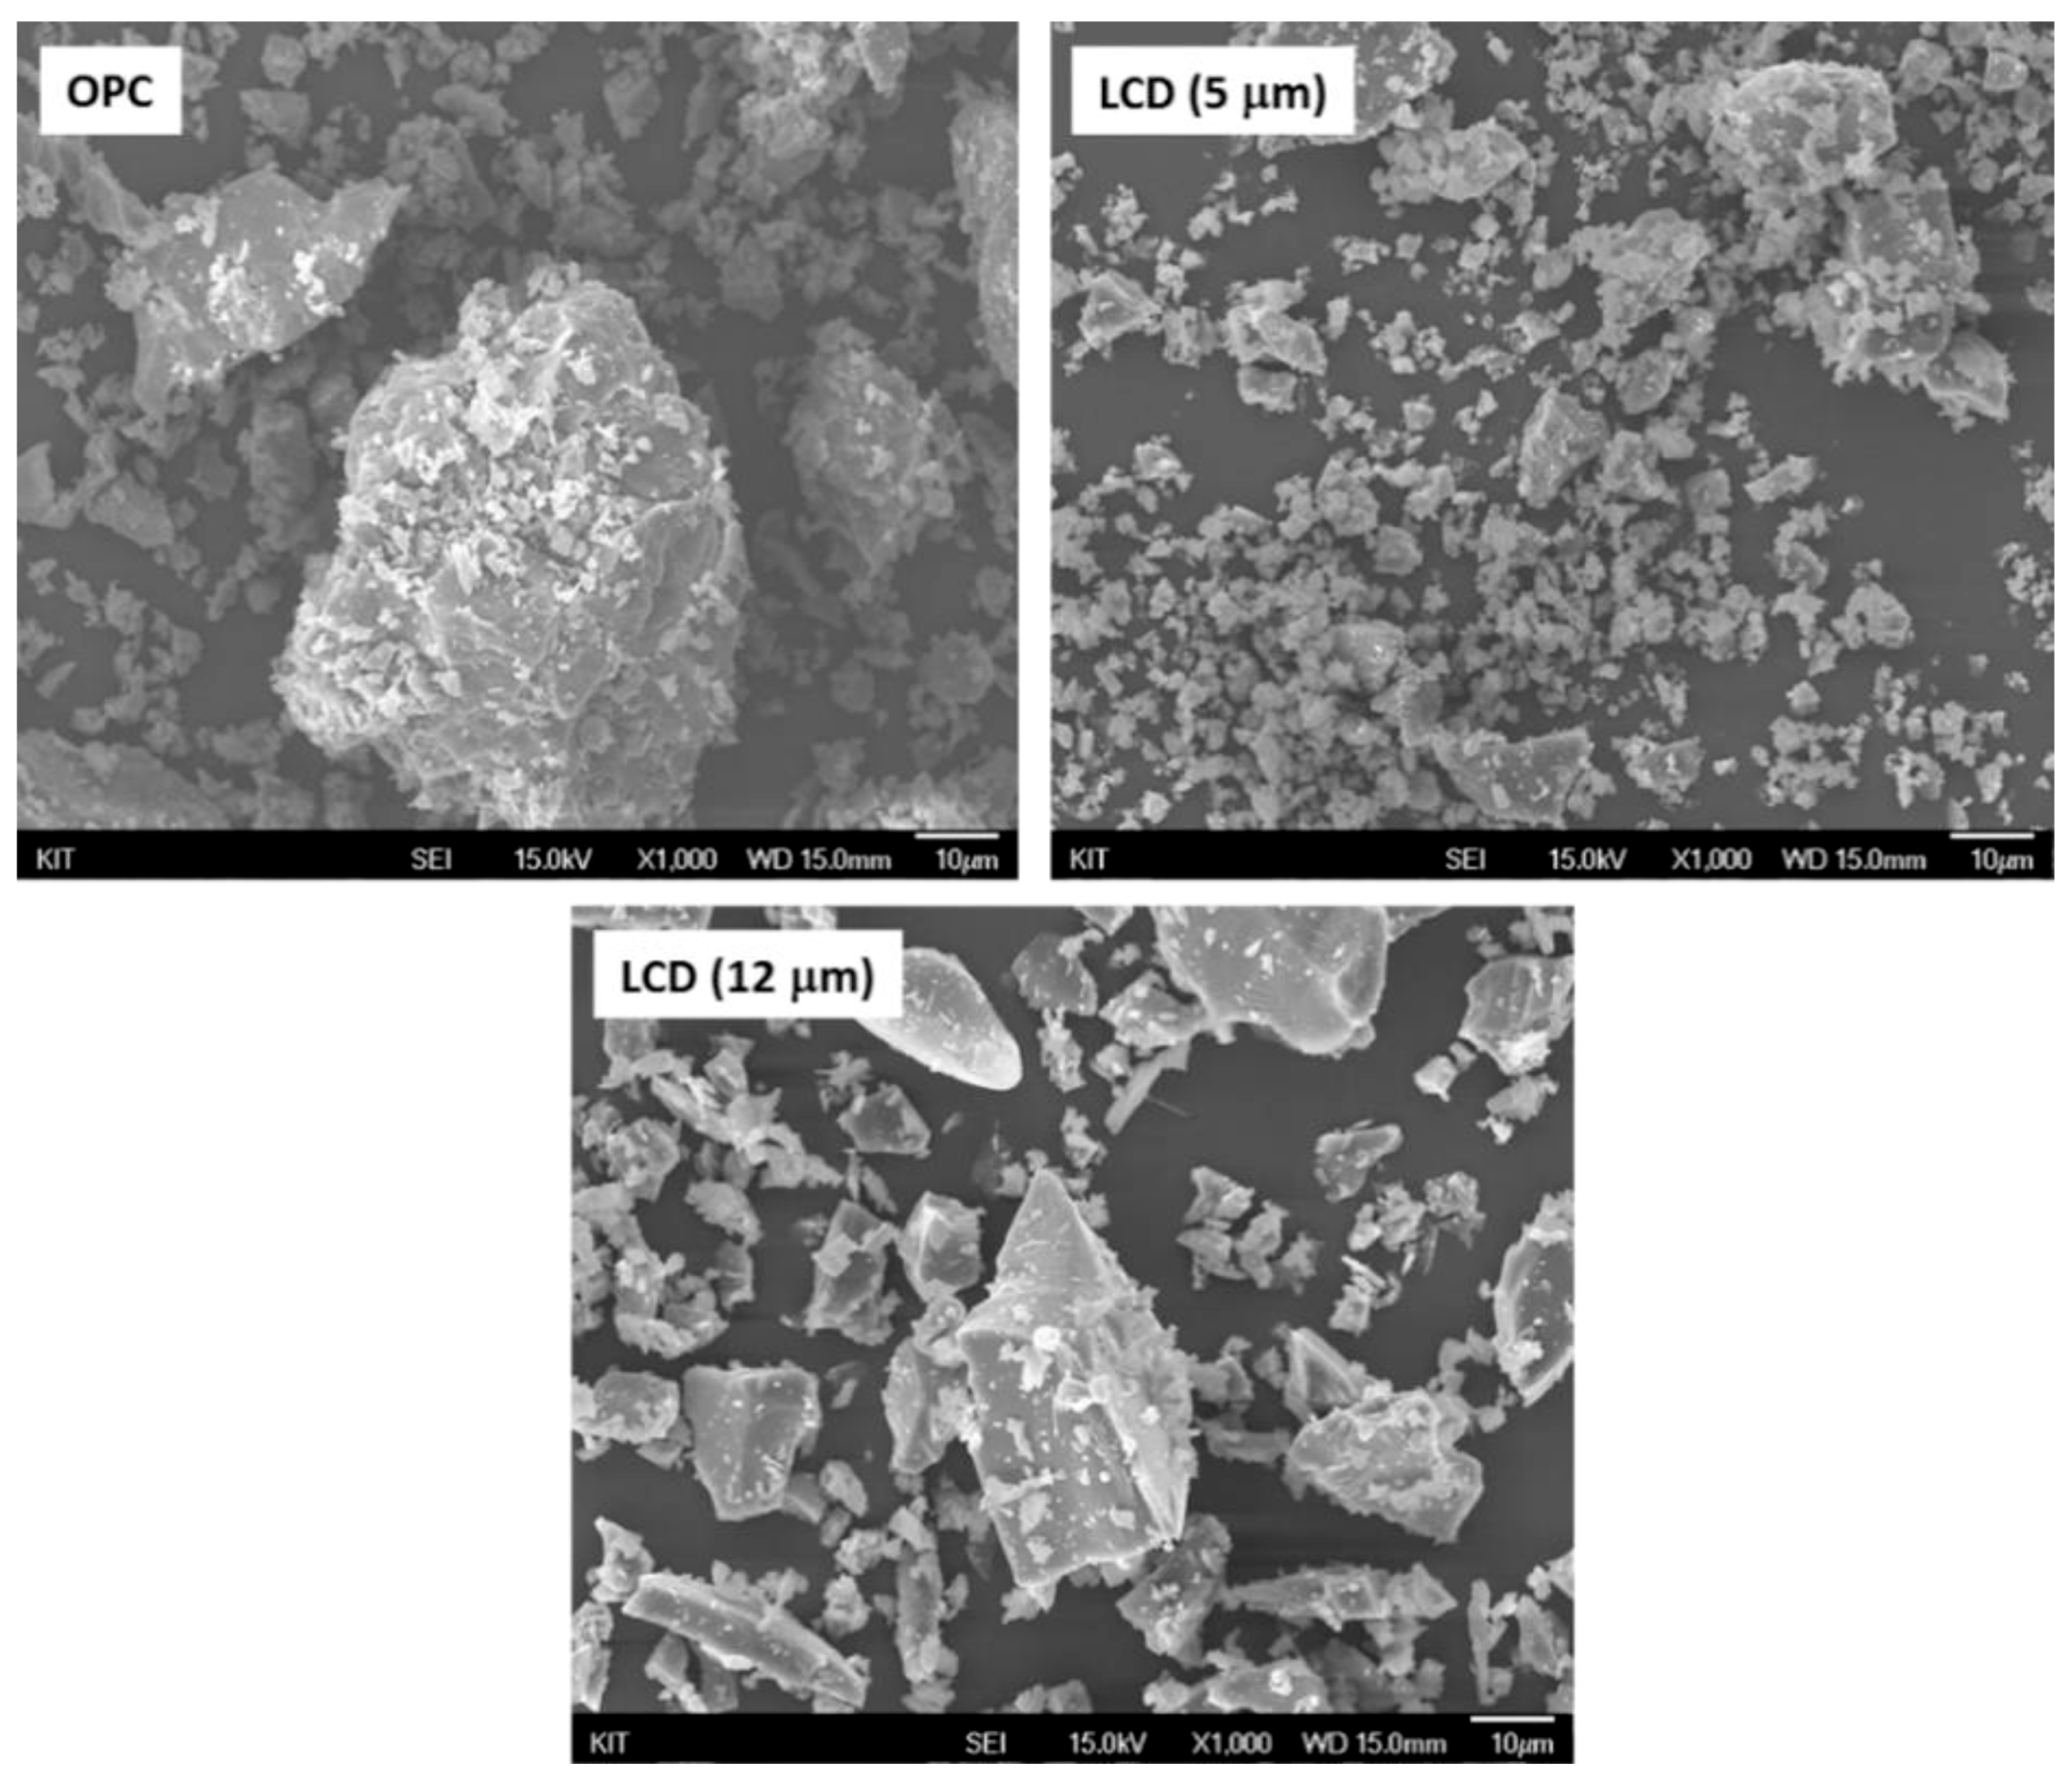
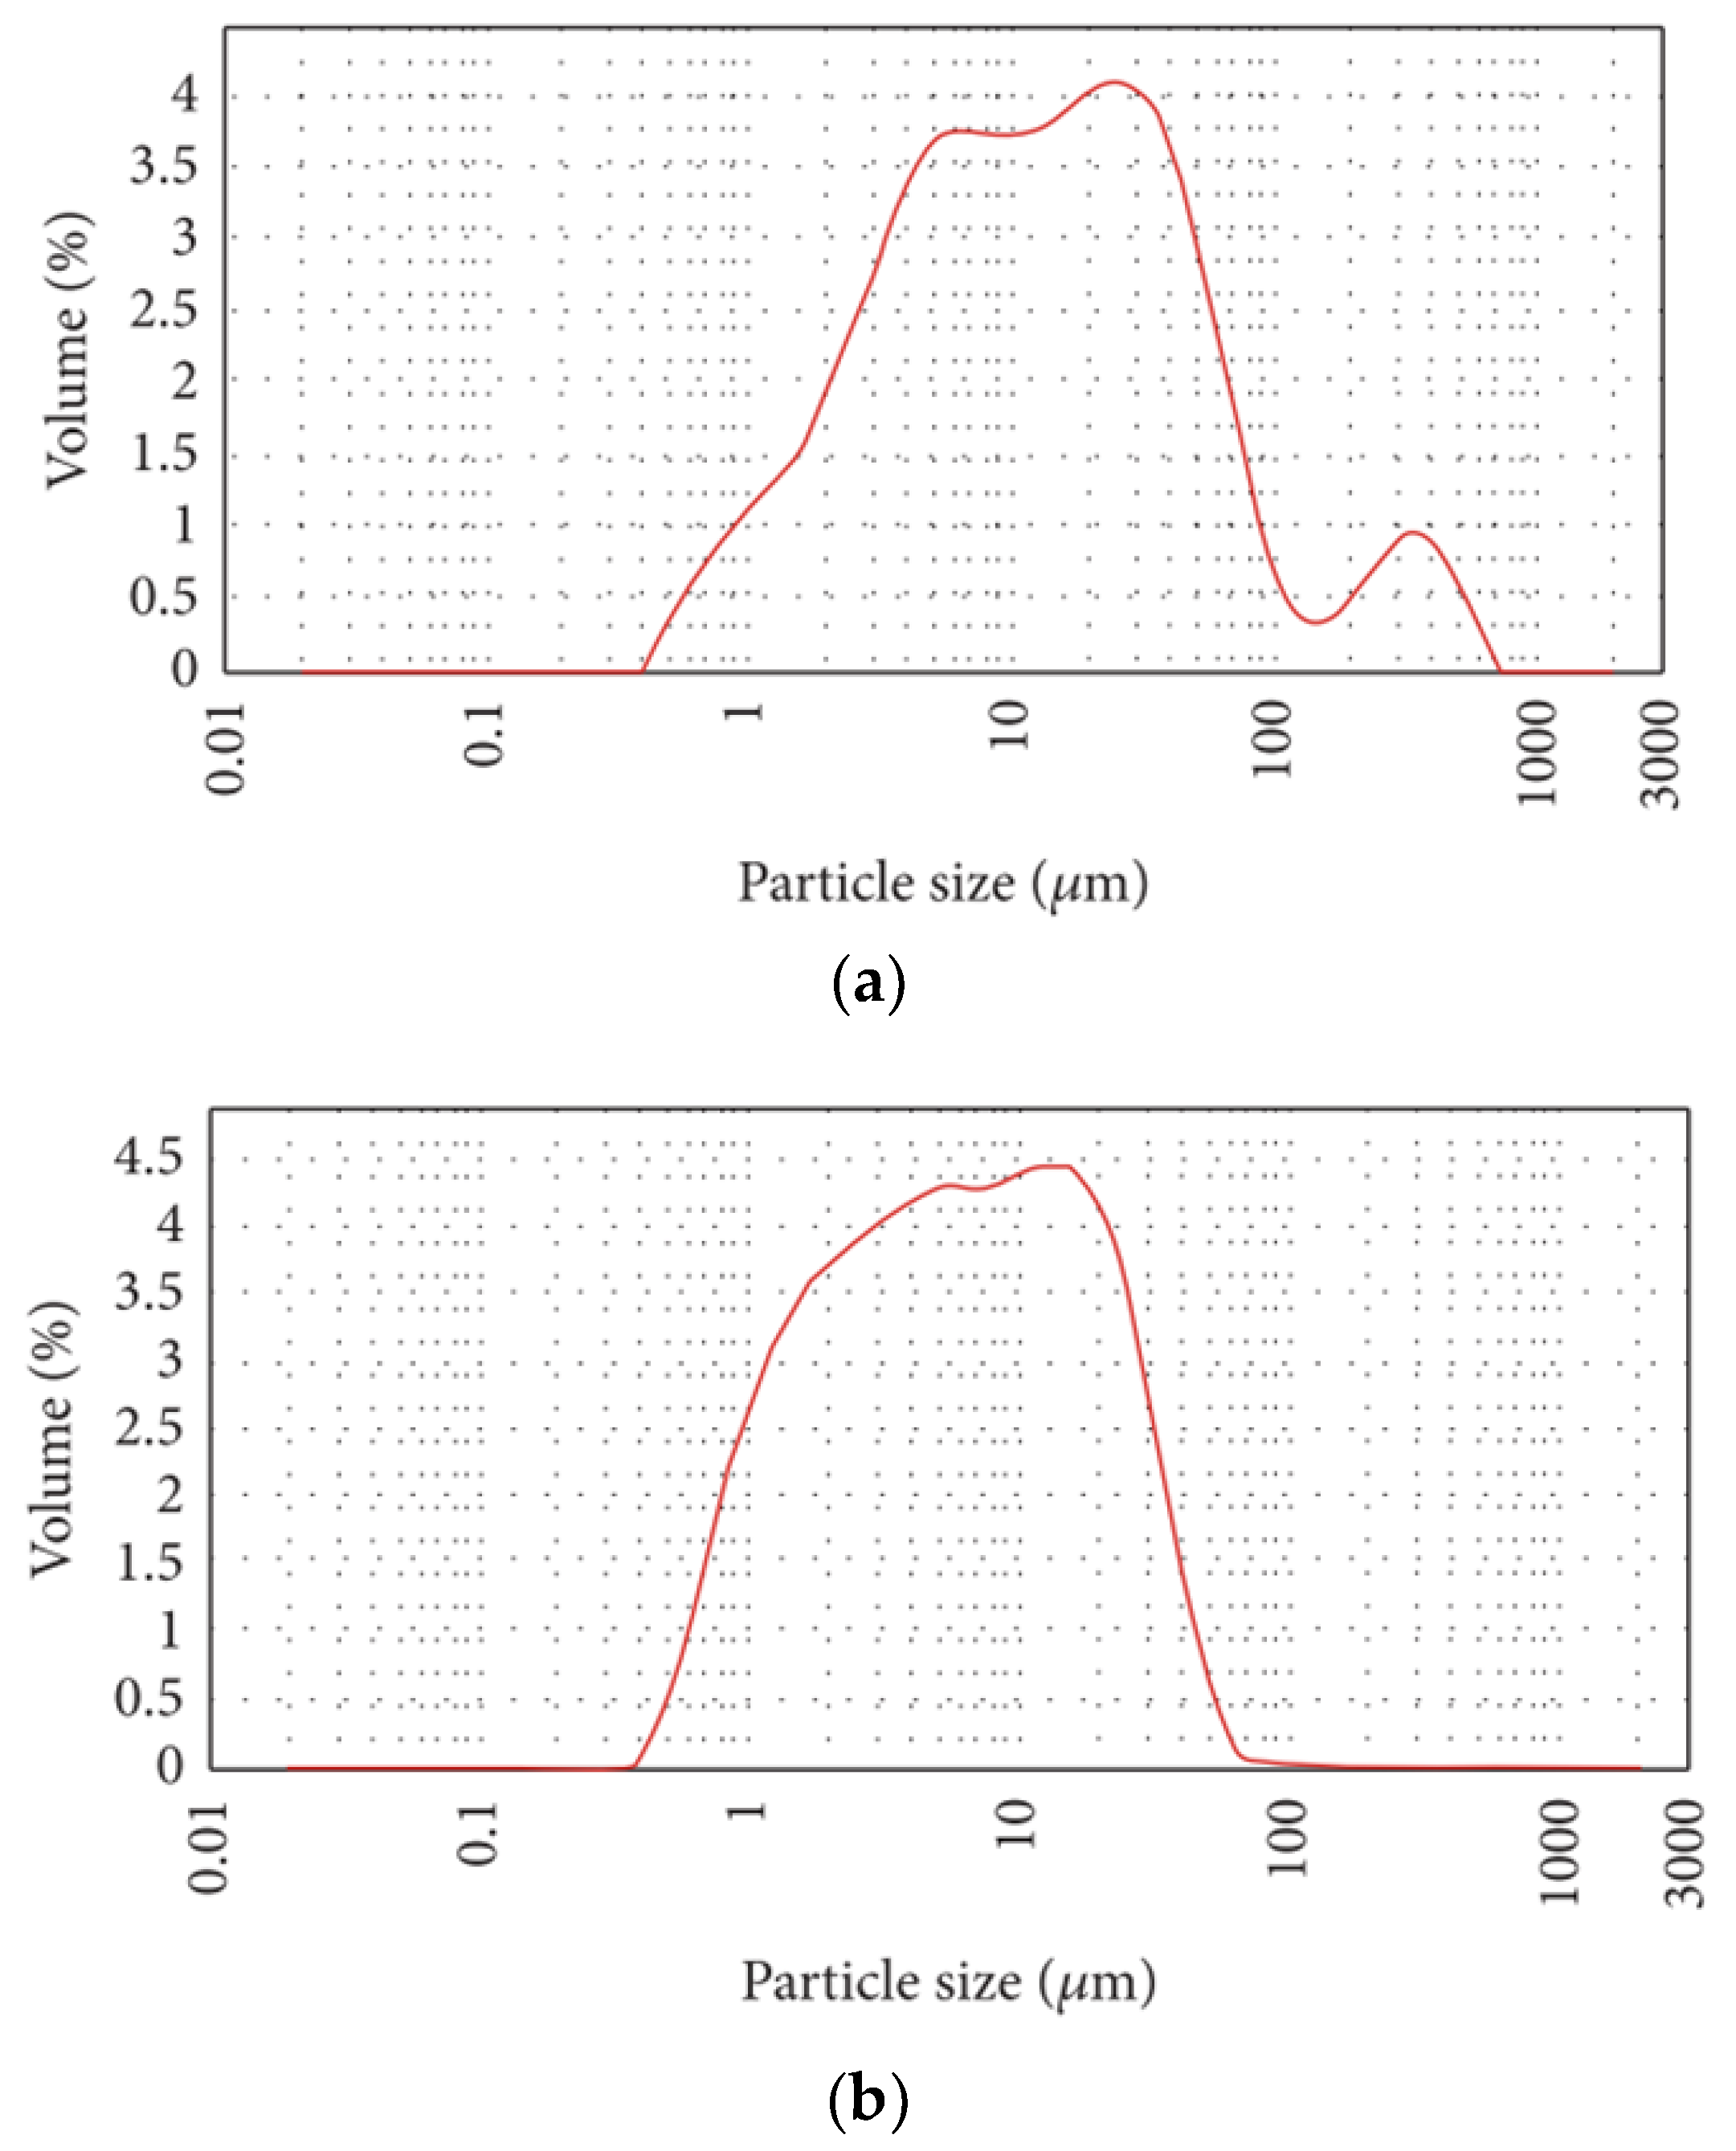
2.1. Materials Characterization
2.2. Mixture Proportioning and Specimens Casting
2.3. Experimental Methods and Procedures
2.3.1. Compressive Strength Testing
2.3.2. Chloride Diffusion
2.3.3. Porosity and Pore Size Distribution
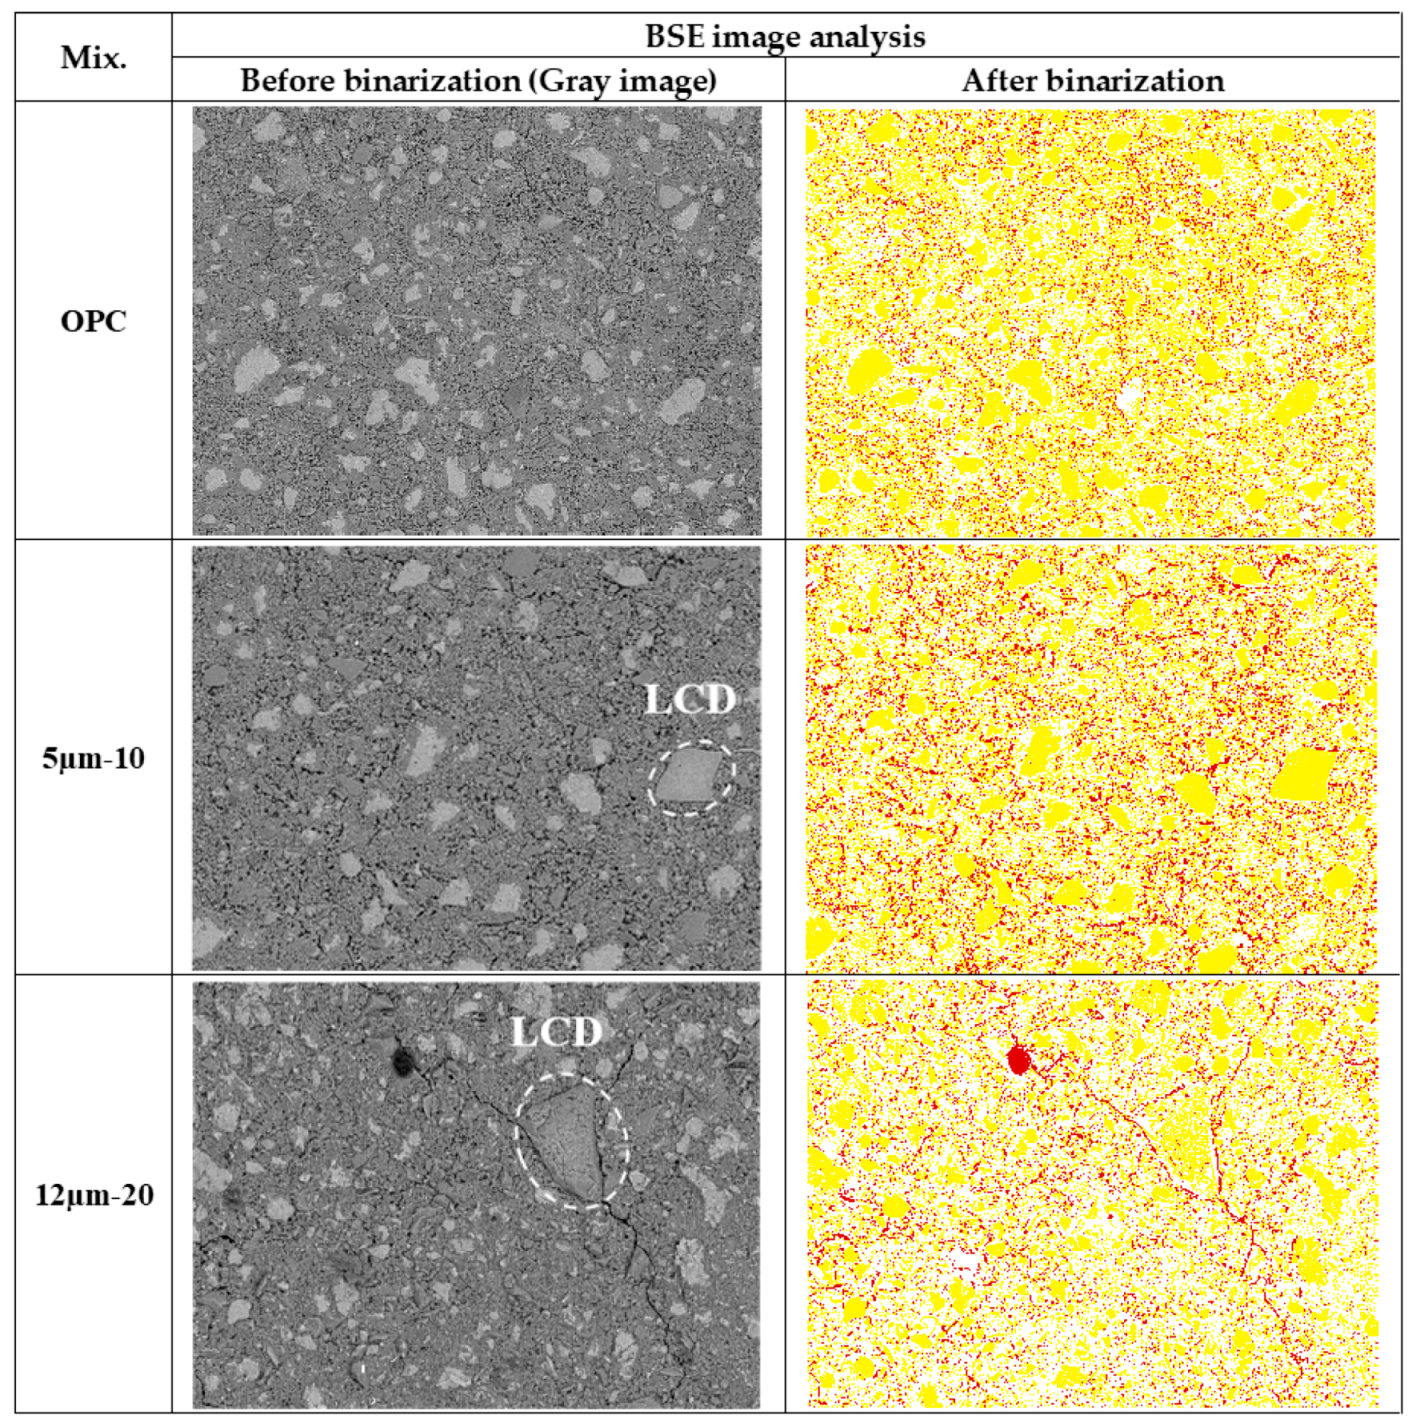
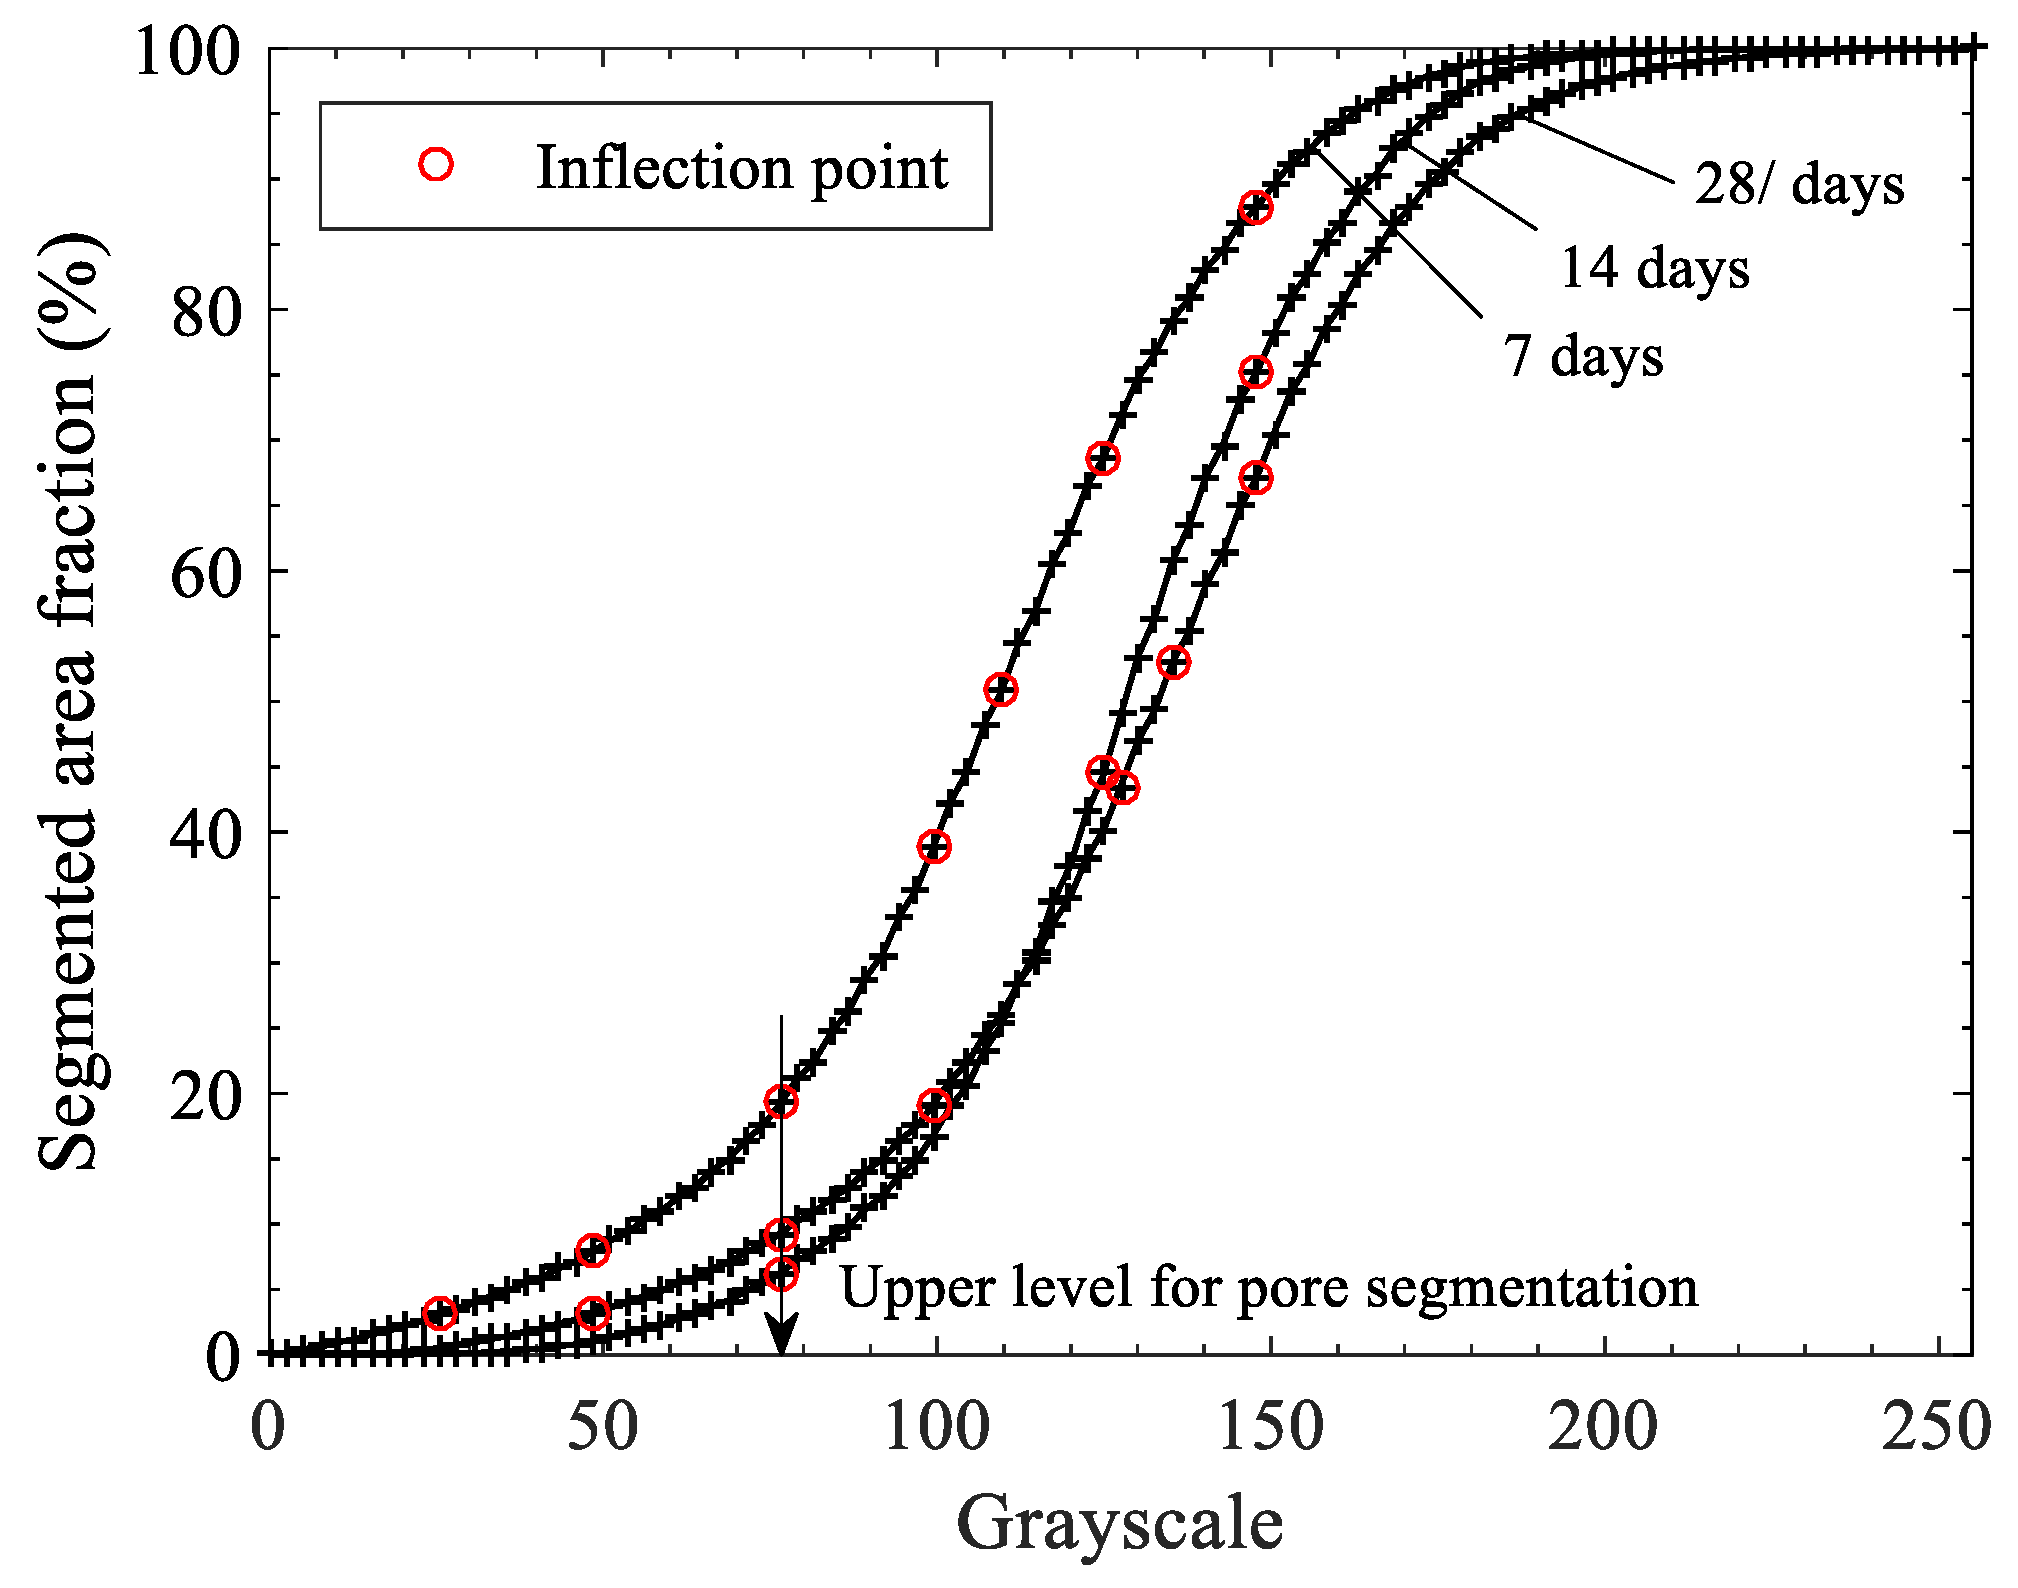
2.3.4. Backscattered Electron (BSE) Image Analysis
3. Results, Discussion, and Analyses
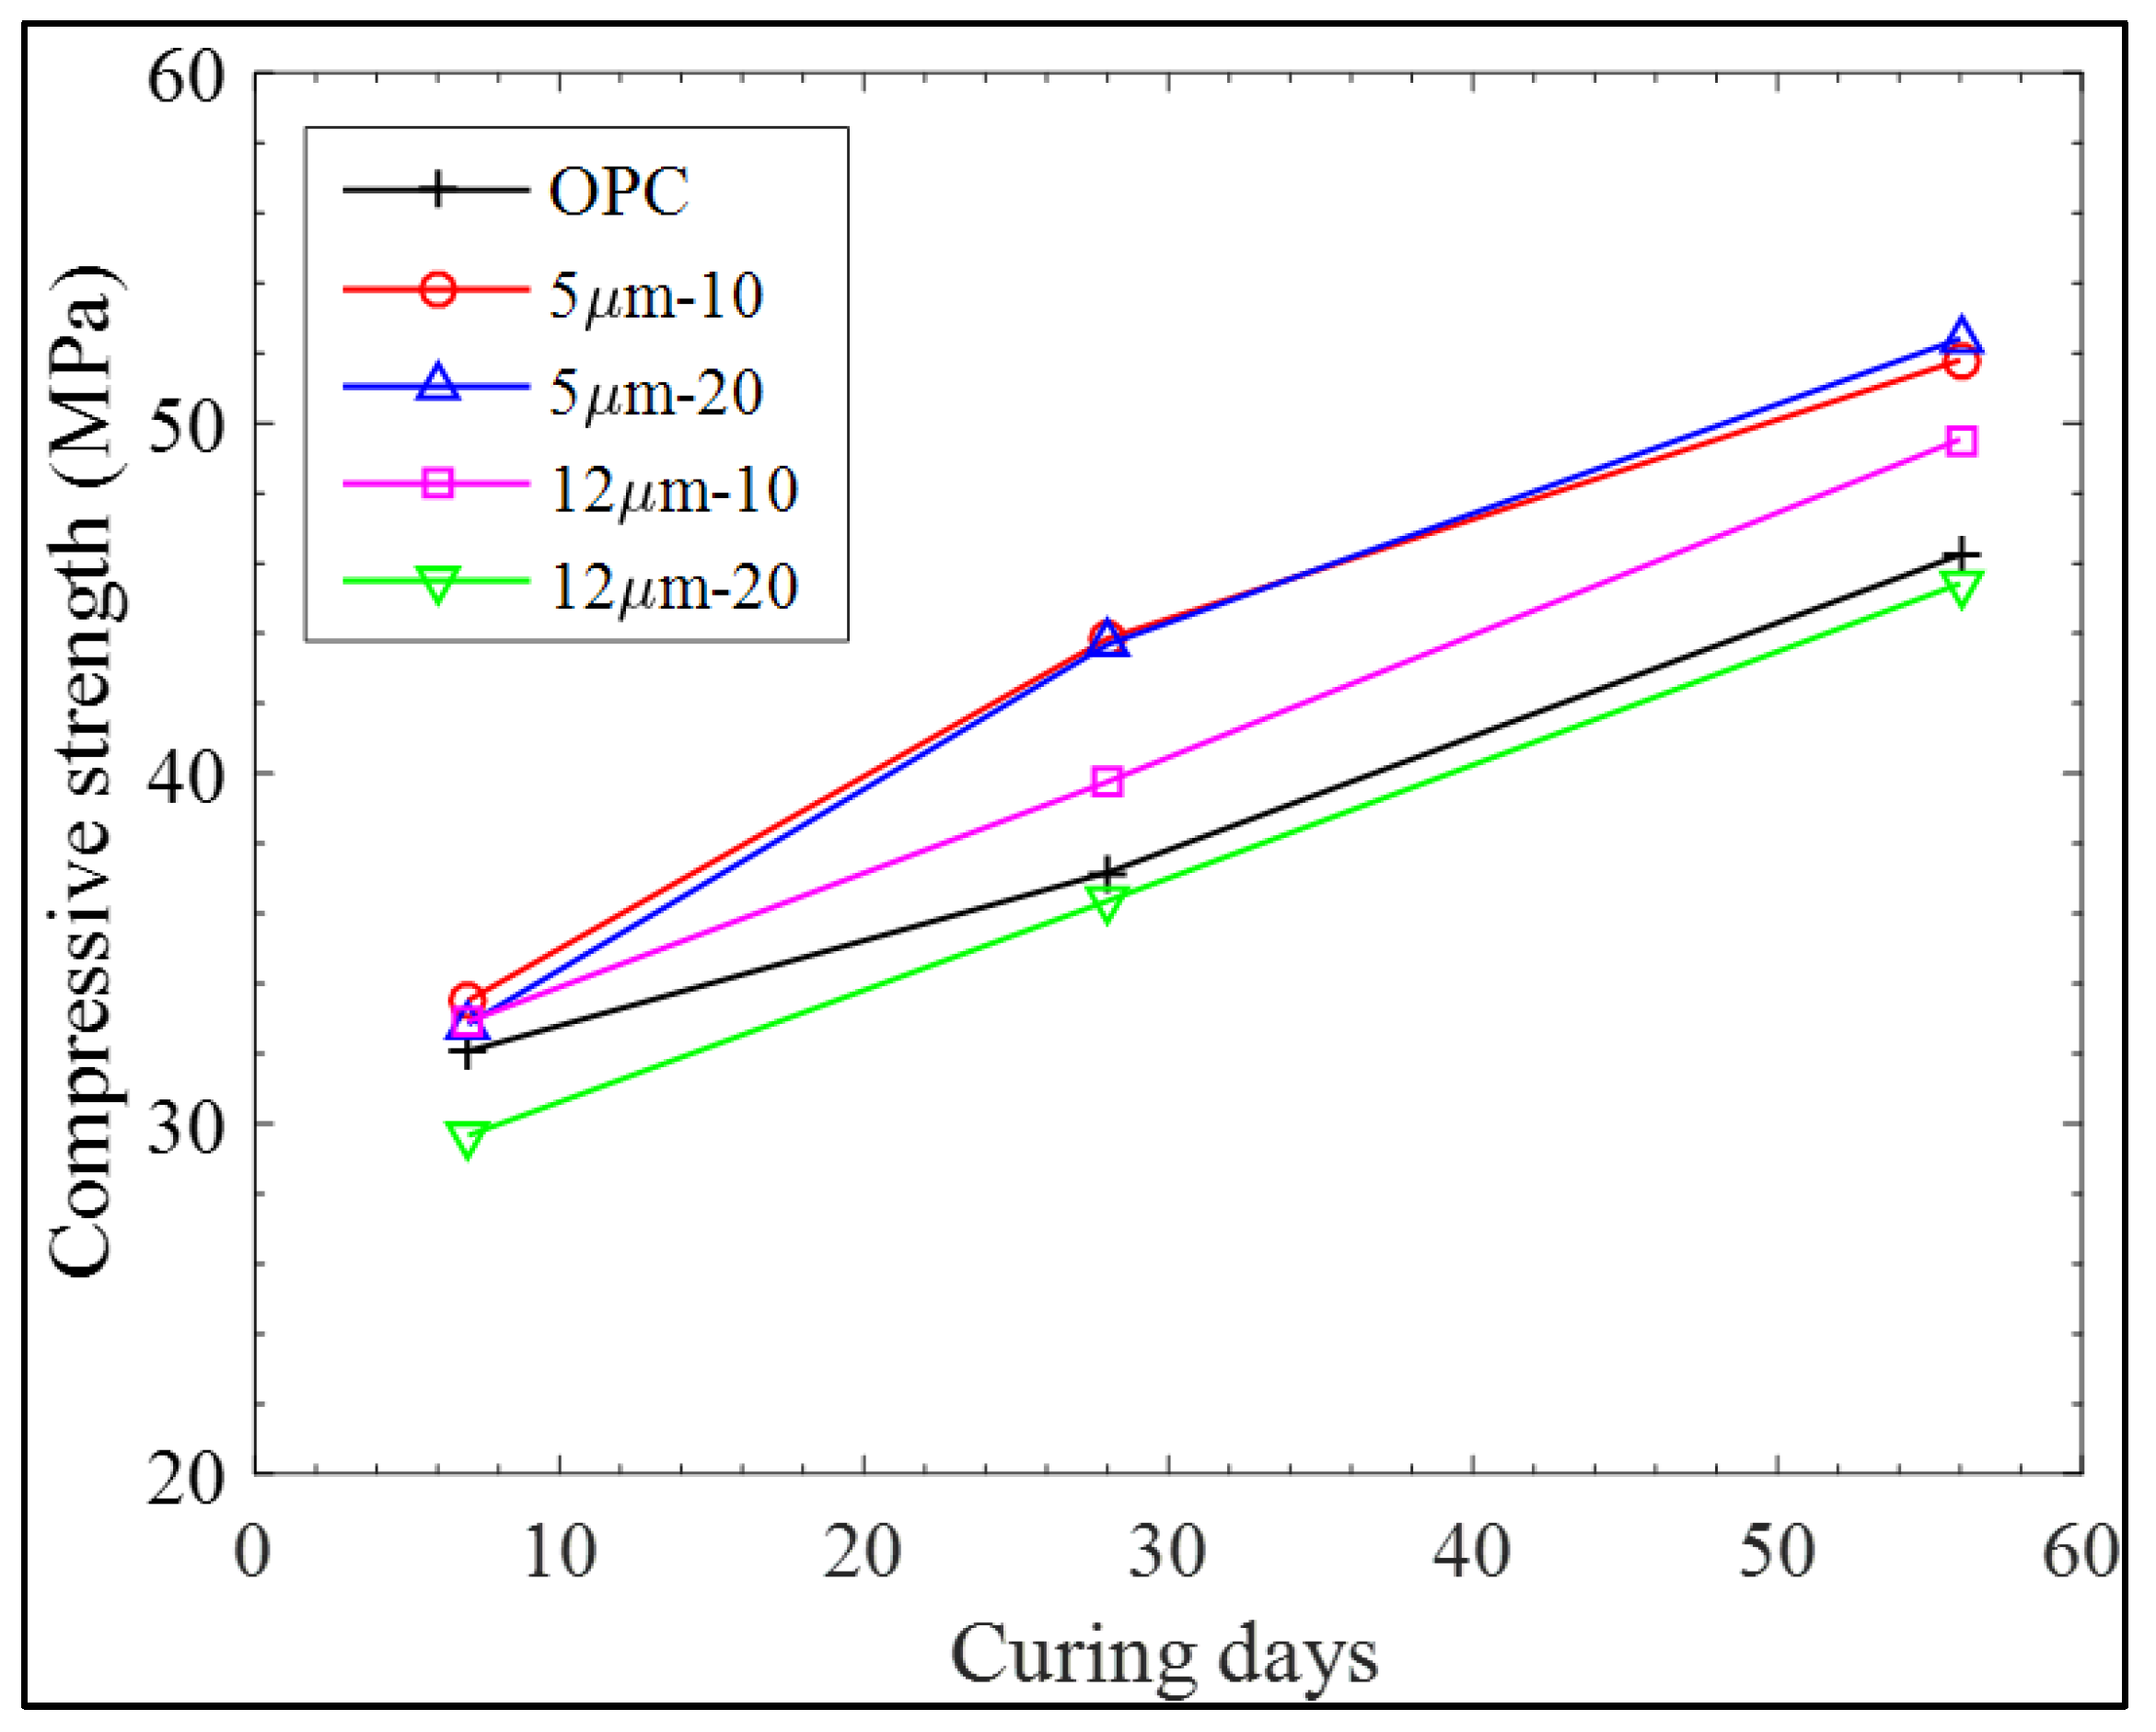
3.1. Compressive Strength
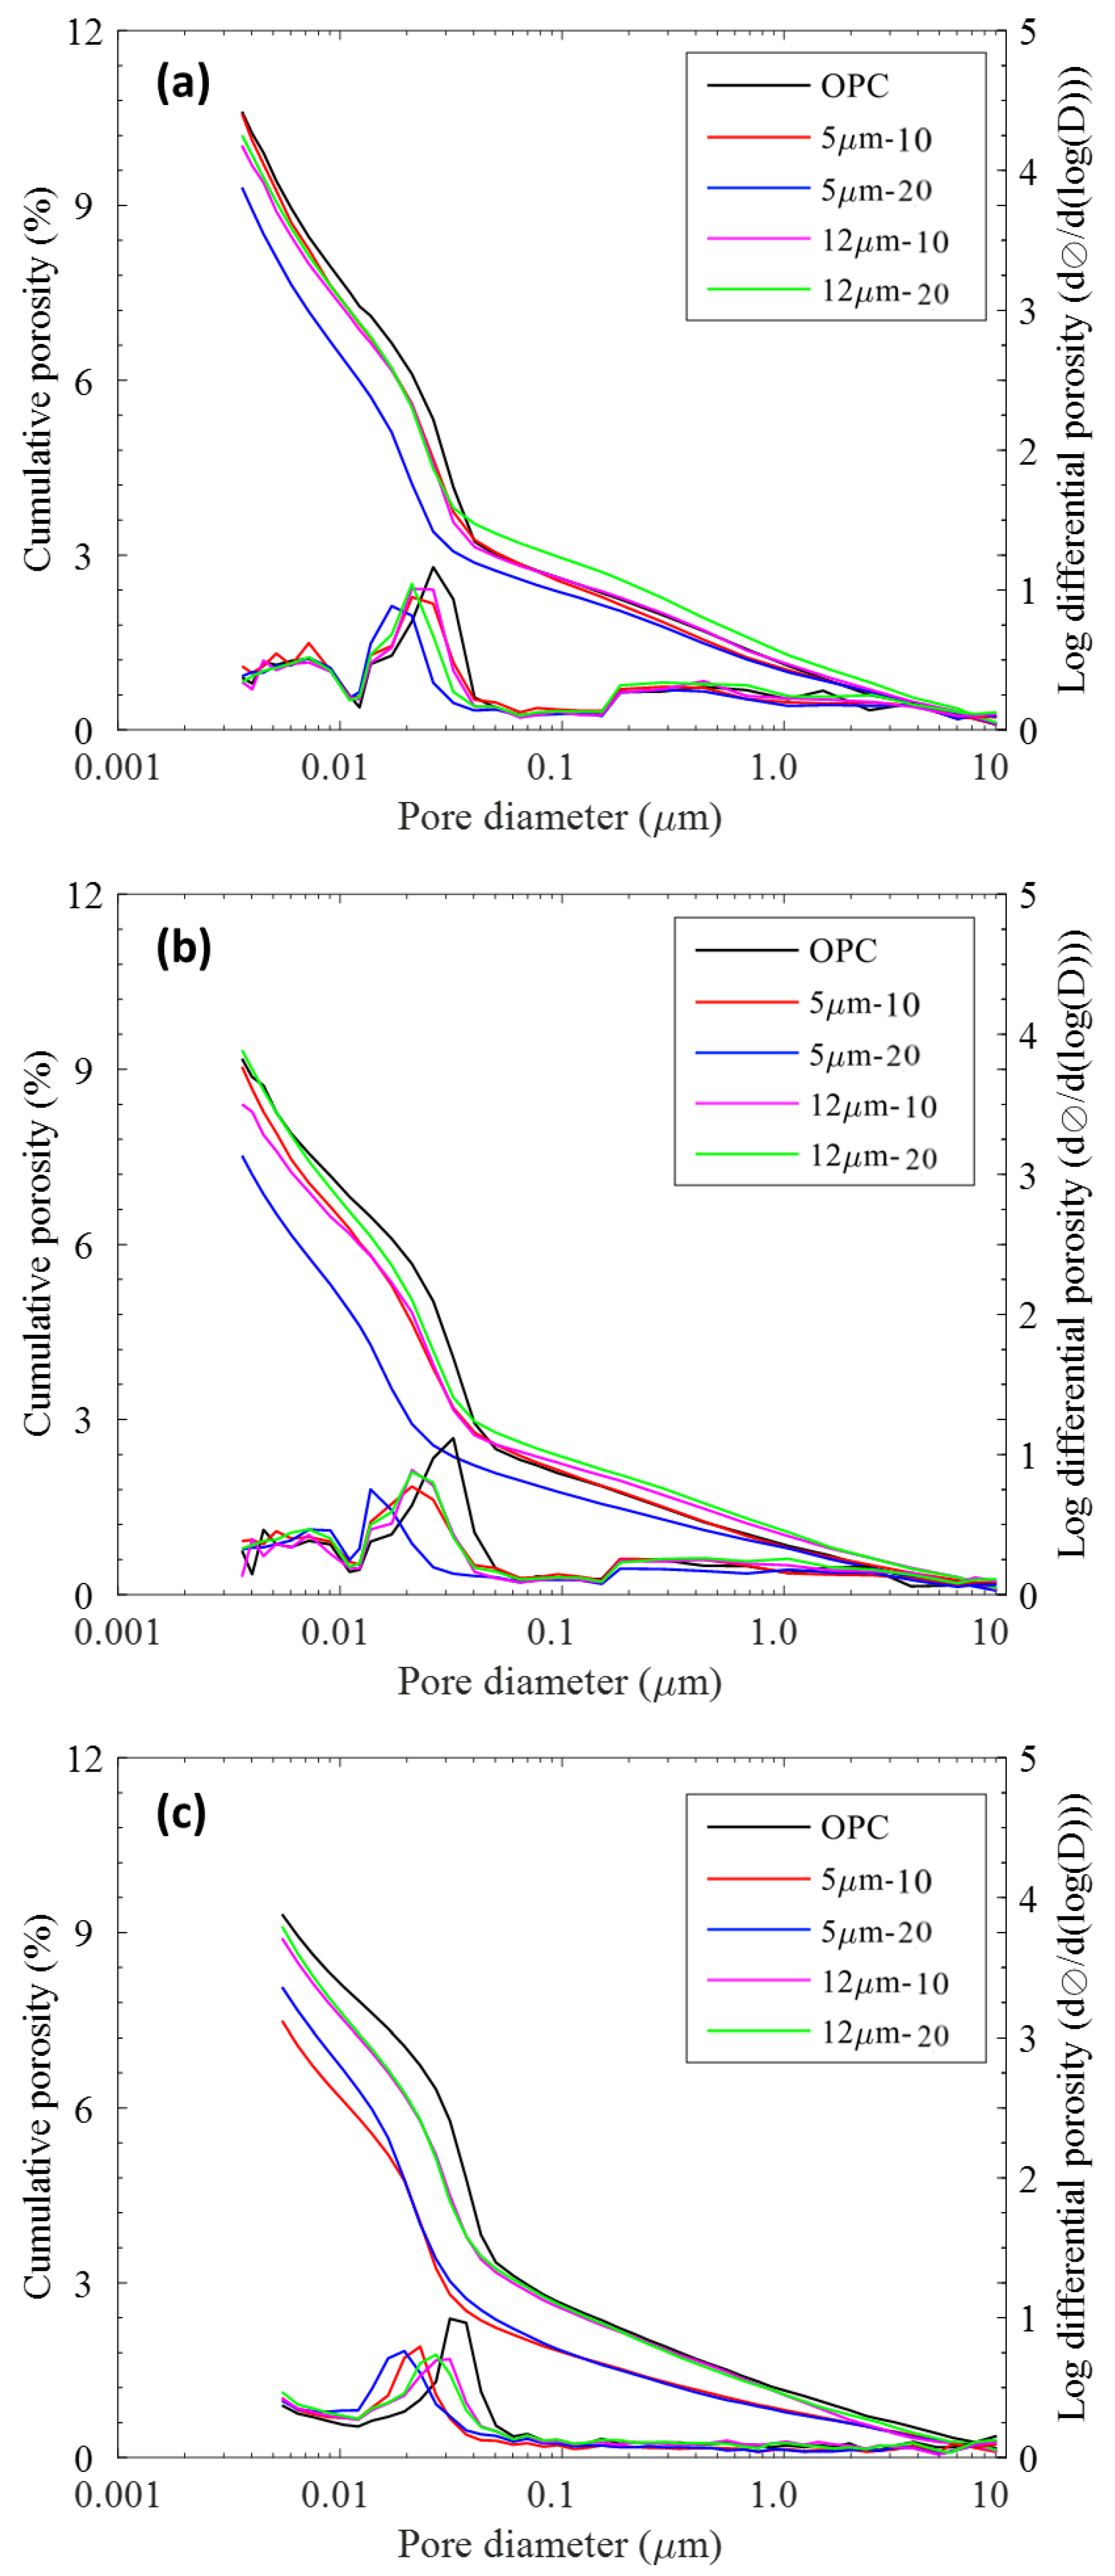
3.2. Porosity and Pore Size Distribution
3.3. Image Analysis for Porosity & Degree of Hydration
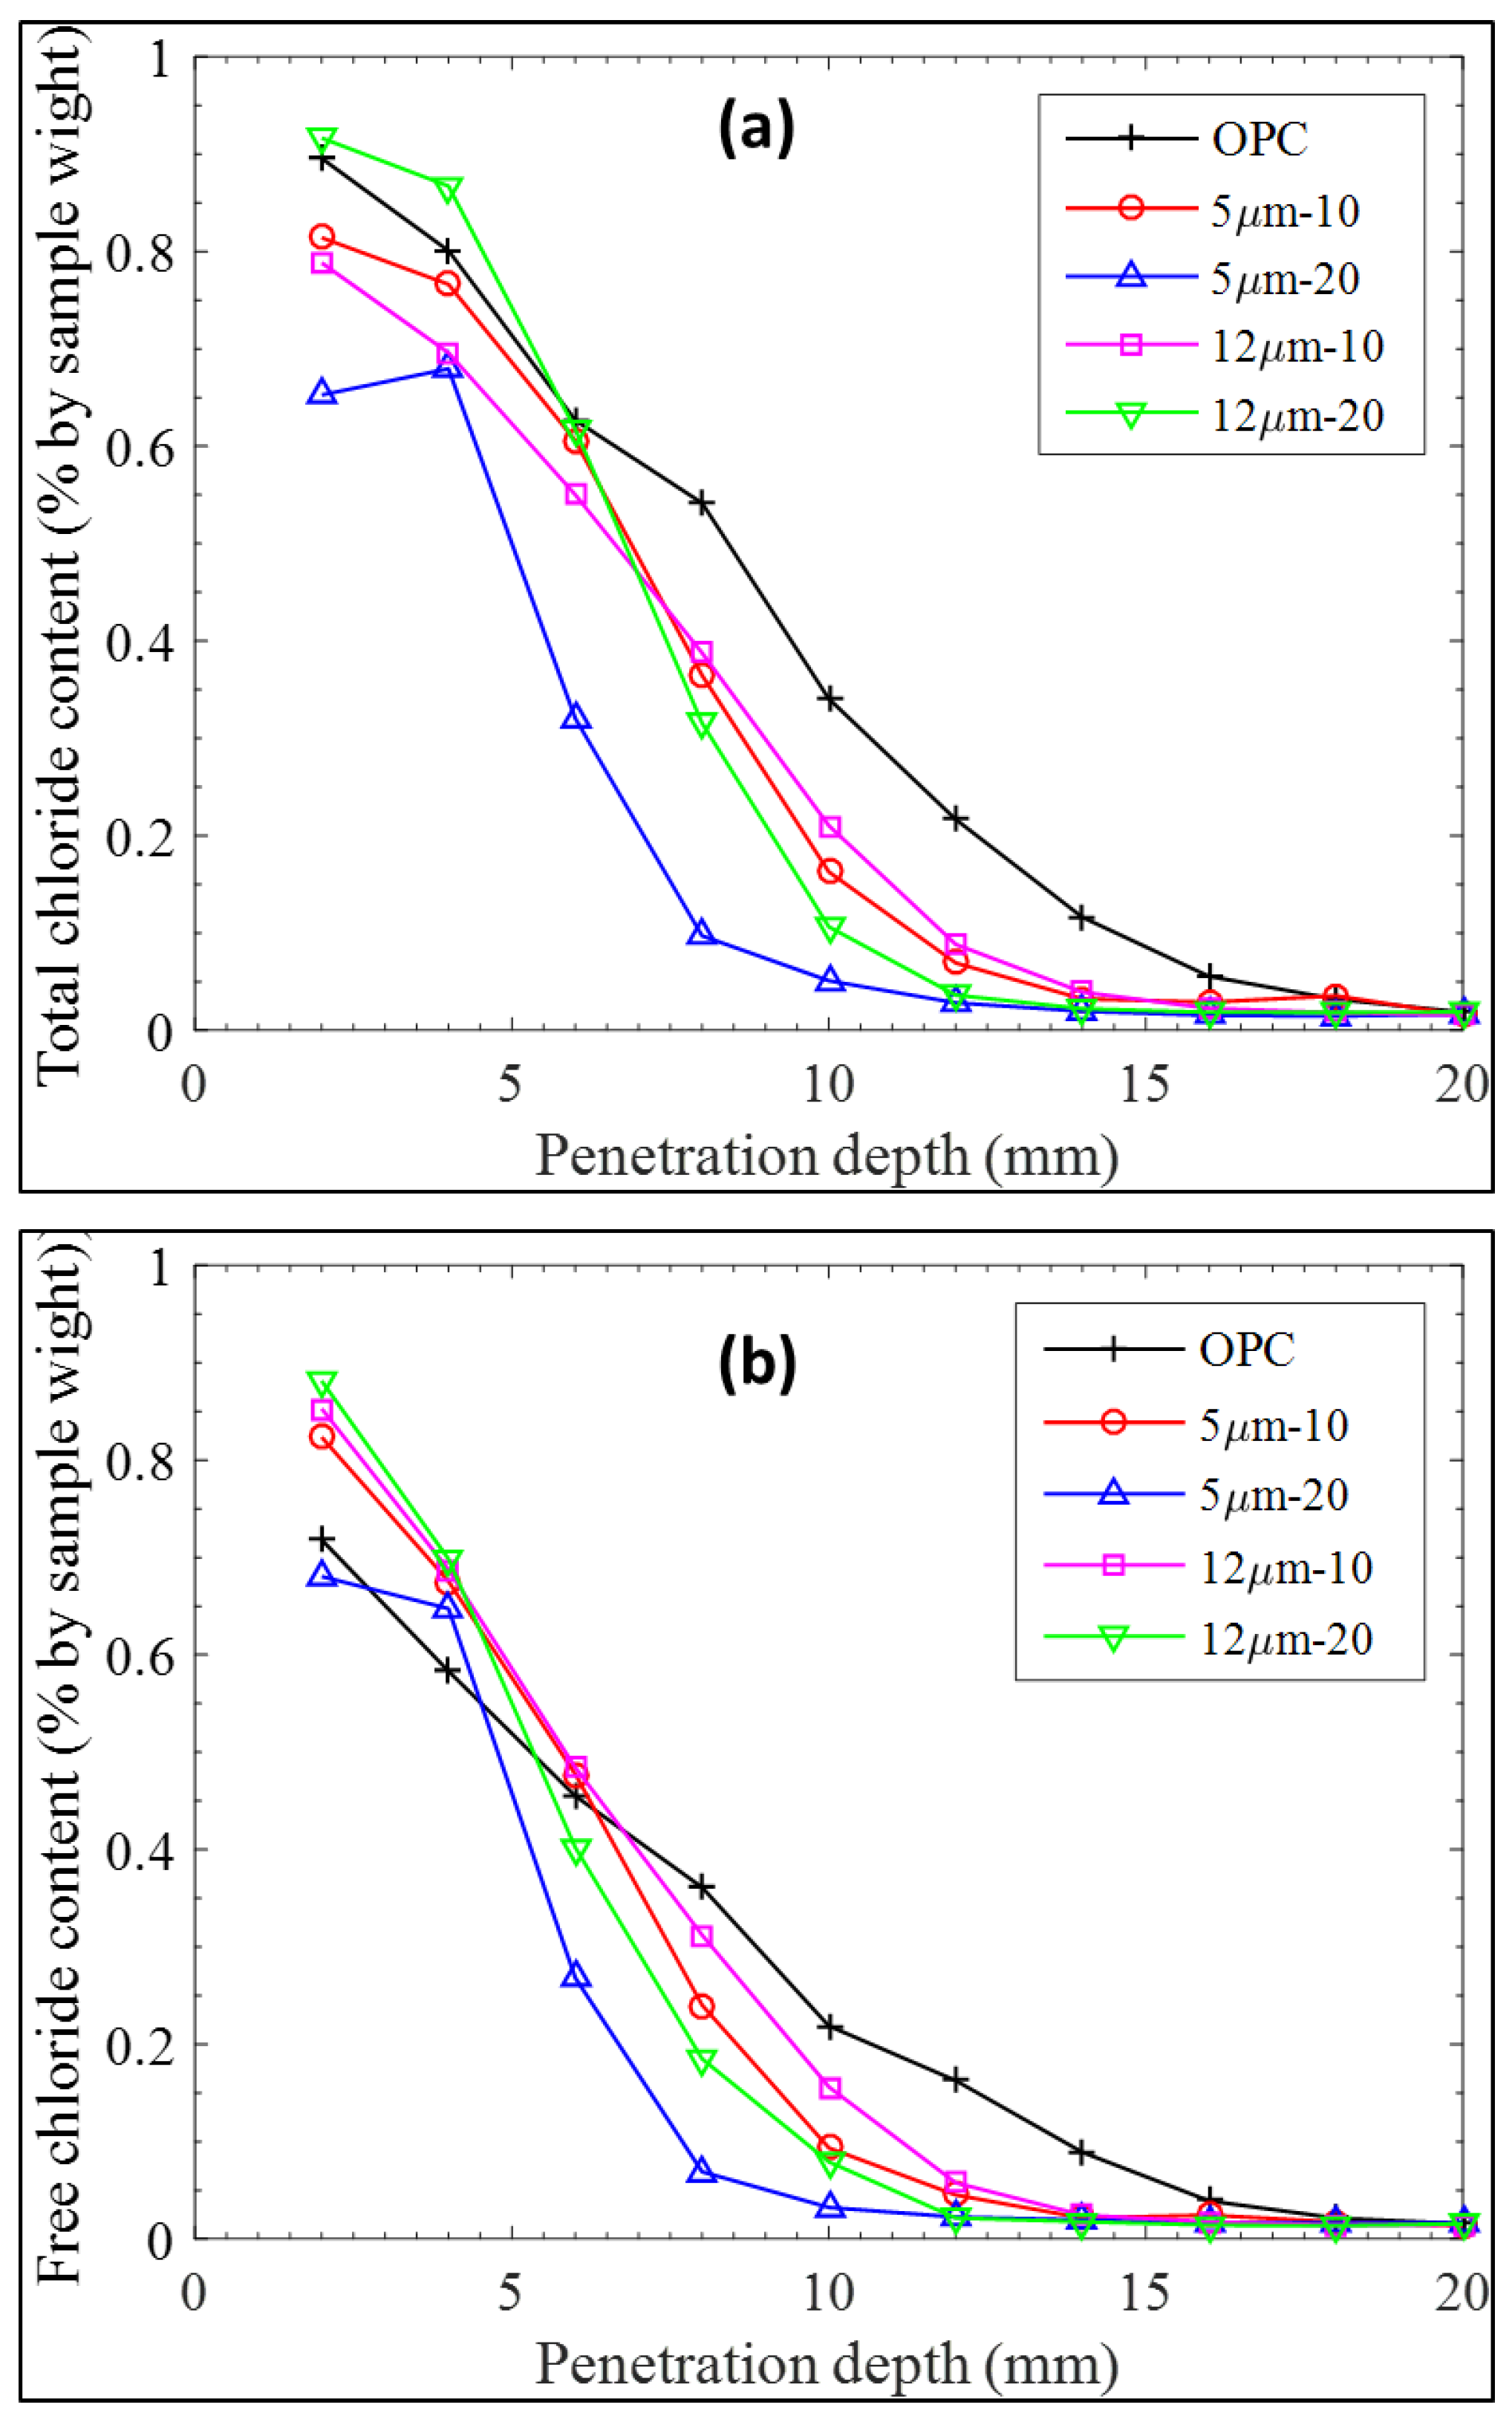
3.4. Chloride Diffusion
4. Inferences, Conclusions, and Prospects—A Way Forward
- (1)
- LGP is useful in improving the hydration degree and hydration rate at almost all the curing ages; however, the beneficial effect is more pronounced at later stages of strength development (28 days).
- (2)
- The particle size and surface area of LGP greatly affect the pozzolanic reaction in alkaline cementitious matrix. Thus, finer particles increase the reaction rate and help in strength gain in a more effective way than coarser particles. More refined, compact, and uniform microstructural features are also prominent in case of LGP-incorporated pastes.
- (3)
- LGP addition in cement mortars and pastes significantly improves strength and durability owing to reduced porosity, primarily due to the reaction of amorphous silica (present in LGP) with calcium hydroxide (cement hydration product), resulting in the formation of secondary hydrates, and secondarily due to the pore filling effect indebted to the fine LGP particle size.
Author Contributions
Funding
Conflicts of Interest
References
- Spiesz, P.; Rouvas, S.; Brouwers, H.J.H. Utilization of waste glass in translucent and photocatalytic concrete. Constr. Build. Mater. 2016, 128, 436–448. [Google Scholar] [CrossRef]
- Korea Environmental Industry & Technology Institute LCI Database 2015. Available online: http://www.epd.or.kr/en/ (accessed on 12 December 2018).
- Hanif, A.; Kim, Y.; Lu, Z.; Park, C. Early-age behavior of recycled aggregate concrete under steam curing regime. J. Clean. Prod. 2017, 152, 103–114. [Google Scholar] [CrossRef]
- Qiao, F.; Chau, C.K.; Li, Z. Property evaluation of magnesium phosphate cement mortar as patch repair material. Constr. Build. Mater. 2010, 24, 695–700. [Google Scholar] [CrossRef]
- Xu, B.; Ma, H.; Hu, C.; Yang, S.; Li, Z. Influence of curing regimes on mechanical properties of magnesium oxychloride cement-based composites. Constr. Build. Mater. 2016, 102, 613–619. [Google Scholar] [CrossRef]
- Péra, J.; Ambroise, J. New applications of calcium sulfoaluminate cement. Cem. Concr. Res. 2004, 34, 671–676. [Google Scholar] [CrossRef]
- Parthasarathy, P.; Hanif, A.; Shao, H.; Li, Z. Microstructural and morphological studies of ordinary portland cement paste and fly ash based geopolymer in the presence of chloride ions. In Proceedings of the 71st RILEM Week and ICACMS 2017—International Conference on Advances in Construction Materials and Systems, Chennai, India, 3–8 September 2017. [Google Scholar]
- Nuaklong, P.; Sata, V.; Chindaprasirt, P. Influence of recycled aggregate on fly ash geopolymer concrete properties. J. Clean. Prod. 2015, 112, 2300–2307. [Google Scholar] [CrossRef]
- Hu, C. Microstructure and mechanical properties of fly ash blended cement pastes. Constr. Build. Mater. 2014, 73, 618–625. [Google Scholar] [CrossRef]
- Khan, M.I.; Siddique, R. Utilization of silica fume in concrete: Review of durability properties. Resour. Conserv. Recyc. 2011, 57, 30–35. [Google Scholar] [CrossRef]
- Hu, C.; Li, Z.; Gao, Y.; Han, Y.; Zhang, Y. Investigation on microstructures of cementitious composites incorporating slag. Adv. Cem. Res. 2014, 26, 222–232. [Google Scholar] [CrossRef]
- Kim, Y.; Hanif, A.; Usman, M.; Munir, M.J.; Kazmi, S.M.S.; Kim, S. Slag waste incorporation in high early strength concrete as cement replacement: Environmental impact and influence on hydration & durability attributes. J. Clean. Prod. 2018, 172, 3056–3065. [Google Scholar] [CrossRef]
- Ding, J.; Li, Z. Effects of Metakaolin and Silica Fume on Properties of Concrete. ACI Mater. J. 2002, 99, 393–398. [Google Scholar]
- Rodríguez de Sensale, G. Strength development of concrete with rice-husk ash. Cem. Concr. Compos. 2006, 28, 158–160. [Google Scholar] [CrossRef]
- Lee, H.; Hanif, A.; Usman, M.; Sim, J.; Oh, H. Performance evaluation of concrete incorporating glass powder and glass sludge wastes as supplementary cementing material. J. Clean. Prod. 2018. [Google Scholar] [CrossRef]
- Xiao, J. Recycled Aggregate Concrete; Springer Nature (Springer-Verlag GmbH Germany): Berlin, Germany, 2018; ISBN 9783662539859. [Google Scholar]
- Hanif, A.; Kim, Y.; Lee, K.; Park, C.; Sim, J. Influence of cement and aggregate type on steam-cured concrete—An experimental study. Mag. Concr. Res. 2017, 69, 694–702. [Google Scholar] [CrossRef]
- Ogrodnik, P.; Zegardło, B.; Szeląg, M. The Use of Heat-Resistant Concrete Made with Ceramic Sanitary Ware Waste for a Thermal Energy Storage. Appl. Sci. 2017, 7, 1303. [Google Scholar] [CrossRef]
- Zegardło, B.; Szeląg, M.; Ogrodnik, P. Concrete resistant to spalling made with recycled aggregate from sanitary ceramic wastes—The effect of moisture and porosity on destructive processes occurring in fire conditions. Constr. Build. Mater. 2018, 173, 58–68. [Google Scholar] [CrossRef]
- López, V.; Llamas, B.; Juan, A.; Morán, J.M.; Guerra, I. Eco-efficient Concretes: Impact of the Use of White Ceramic Powder on the Mechanical Properties of Concrete. Biosyst. Eng. 2007, 96, 559–564. [Google Scholar] [CrossRef]
- Debieb, F.; Kenai, S. The use of coarse and fine crushed bricks as aggregate in concrete. Constr. Build. Mater. 2008, 22, 886–893. [Google Scholar] [CrossRef]
- Sharifi, Y.; Afshoon, I.; Firoozjaei, Z.; Momeni, A. Utilization of Waste Glass Micro-particles in Producing Self-Consolidating Concrete Mixtures. Int. J. Concr. Struct. Mater. 2016, 10, 337–353. [Google Scholar] [CrossRef]
- Wang, C.-C.; Wang, H.-Y.; Chen, C.-H.; Huang, C. Prediction of Compressive Strength Using Ultrasonic Pulse Velocity for CLSM with Waste LCD Glass Concrete. J. Civil Eng. Archit. 2015, 9. [Google Scholar] [CrossRef]
- Kim, S.K.; Kang, S.T.; Kim, J.K.; Jang, I.Y. Effects of particle size and cement replacement of LCD glass powder in concrete. Adv. Mater. Sci. Eng. 2017, 2017. [Google Scholar] [CrossRef]
- Kim, K.; Kim, K.; Hwang, J. Characterization of ceramic tiles containing LCD waste glass. Ceram. Int. 2016, 42, 7626–7631. [Google Scholar] [CrossRef]
- Tang, C.-W. Properties of fired bricks incorporating TFT-LCD waste glass powder with reservoir sediments. Sustainability 2018, 10, 2503. [Google Scholar] [CrossRef]
- Senthil Kumar, K.; Premalatha, P.V.; Baskar, K.; Sankaran Pillai, G.; Shahul Hameed, P. Assessment of Radioactivity in Concrete Made with e-Waste Plastic. J. Test. Eval. 2018, 46, 20160006. [Google Scholar] [CrossRef]
- Senthil Kumar, K.; Baskar, K. Development of Ecofriendly Concrete Incorporating Recycled High-Impact Polystyrene from Hazardous Electronic Waste. J. Hazard. Toxic Radioact. Waste 2015, 19, 04014042. [Google Scholar] [CrossRef]
- Kim, K.; Kim, K.; Hwang, J. LCD waste glass as a substitute for feldspar in the porcelain sanitary ware production. Ceramics International 2015, 41, 7097–7102. [Google Scholar] [CrossRef]
- Wang, H.-Y. A study of the effects of LCD glass sand on the properties of concrete. Waste Manag. 2009, 29, 335–341. [Google Scholar] [CrossRef]
- Her-Yung, W. A study of the engineering properties of waste LCD glass applied to controlled low strength materials concrete. Constr. Build. Mater. 2009, 23, 2127–2131. [Google Scholar] [CrossRef]
- Wang, H.Y.; Huang, W.L. Durability of self-consolidating concrete using waste LCD glass. Constr. Build. Mater. 2010, 24, 1008–1013. [Google Scholar] [CrossRef]
- Wang, H.; Hou, T. A study of elevated temperatures on the strength properties of LCD glass powder cement mortars. Integr. Waste Manag. 2011. [Google Scholar] [CrossRef]
- Lin, K.L.; Huang, W.J.; Shie, J.L.; Lee, T.C.; Wang, K.S.; Lee, C.H. The utilization of thin film transistor liquid crystal display waste glass as a pozzolanic material. J. Hazard. Mater. 2009, 163, 916–921. [Google Scholar] [CrossRef] [PubMed]
- Lin, K.L.; Wang, N.F.; Shie, J.L.; Lee, T.C.; Lee, C. Elucidating the hydration properties of paste containing thin film transistor liquid crystal display waste glass. J. Hazard. Mater. 2008, 159, 471–475. [Google Scholar] [CrossRef] [PubMed]
- Lin, K.L. Use of thin film transistor liquid crystal display (TFT-LCD) waste glass in the production of ceramic tiles. J. Hazard. Mater. 2007, 148, 91–97. [Google Scholar] [CrossRef]
- KS L 5201 Standard Specifications for Ordinary Portlance Cement; Korean Standard Specifications: Seoul, Korea, 1998.
- Standard Test Method for Sieve Analysis of Fine and Coarse Aggregate. Korean Standards KS F 2502–2010; Korean Standards: Seoul, Korea, 2010. [Google Scholar]
- Testing Method for Density and Absorption of Coarse Aggregate. Korean Standards KS F 2503-2007; Korean Standards: Seoul, Korea, 2007. [Google Scholar]
- Testing Method for Density and Absorption of Fine Aggregate. Korean Standards KS F 2504–2007; Korean Standards: Seoul, Korea, 2007. [Google Scholar]
- Hanif, A.; Kim, Y.; Usman, M.; Park, C. Optimization of Steam-Curing Regime for Recycled Aggregate Concrete Incorporating High Early Strength Cement—A Parametric Study. Materials 2018, 11, 2487. [Google Scholar] [CrossRef]
- Hanif, A.; Lu, Z.; Cheng, Y.; Diao, S.; Li, Z. Effects of Different Lightweight Functional Fillers for Use in Cementitious Composites. Int. J. Concr. Struct. Mater. 2017, 11, 99–113. [Google Scholar] [CrossRef]
- Hanif, A.; Parthasarathy, P.; Lu, Z.; Sun, M.; Li, Z. Fiber—Reinforced Cementitious Composites Incorporating Glass Cenospheres—Mechanical properties and Microstructure. Constr. Build. Mater. 2017, 154, 529–538. [Google Scholar] [CrossRef]
- Li, Z. Advanced Concrete Technology; John Wiley & Sons, Inc.: Hoboken, NJ, USA, 2011. [Google Scholar]
- ASTM C109 Standard Test Method for Compressive Strength of Hydraulic Cement Mortars; American Standard for Testing and Materials: West Conshohocken, PA, USA, 2002.
- Concrete, Hardened: Accelerated Chloride Penetration. Available online: http://210.42.35.80/G2S/eWebEditor/uploadfile/20110819235408743.pdf (accessed on 12 December 2018).
- Kim, Y.; Hanif, A.; Kazmi, S.M.S.; Munir, M.J.; Park, C. Properties enhancement of recycled aggregate concrete through pretreatment of coarse aggregates—Comparative assessment of assorted techniques. J. Clean. Prod. 2018, 191, 339–349. [Google Scholar] [CrossRef]
- Hanif, A.; Diao, S.; Lu, Z.; Fan, T.; Li, Z. Green lightweight cementitious composite incorporating aerogels and fly ash cenospheres—Mechanical and thermal insulating properties. Constr. Build. Mater. 2016, 116, 422–430. [Google Scholar] [CrossRef]
- Hanif, A.; Parthasarathy, P.; Ma, H.; Fan, T.; Li, Z. Properties Improvement of Fly Ash Cenosphere Modified Cement Pastes Using Nano-Silica. Cem. Concr. Compos. 2017, 81, 35–48. [Google Scholar] [CrossRef]
- Van, V.T.A.; Rößler, C.; Bui, D.D.; Ludwig, H.M. Rice husk ash as both pozzolanic admixture and internal curing agent in ultra-high performance concrete. Cem. Concr. Compos. 2014, 53, 270–278. [Google Scholar] [CrossRef]
- Winslow, D.N.; Diamond, S. Specific Surface of Hardened Portland Cement Paste as Determined by Small-Angle X-Ray Scattering. J. Am. Ceram. Soc. 1974, 57, 193–197. [Google Scholar] [CrossRef]
- Aligizaki, K.K. Pore Structure of Cement-Based Materials: Testing, Interpretation and Requirements; Taylor and Francis: London, UK; New York, NY, USA, 2006; ISBN 9780419228004. [Google Scholar]
- Hu, C.; Li, Z. A review on the mechanical properties of cement-based materials measured by nanoindentation. Constr. Build. Mater. 2015, 90, 80–90. [Google Scholar] [CrossRef]
- Hu, C.; Li, Z. Property investigation of individual phases in cementitious composites containing silica fume and fly ash. Cem. Concr. Compos. 2015, 57, 17–26. [Google Scholar] [CrossRef]
- Hu, C. Multi-scale Characterization of Concrete. Ph.D. Thesis, Hong Kong University of Science and Technology, Hong Kong, China, August 2014. [Google Scholar]
- Scrivener, K.L. Backscattered electron imaging of cementitious microstructures: Understanding and quantification. Cem. Concr. Compos. 2004, 26, 935–945. [Google Scholar] [CrossRef]
- Wong, H.S.; Head, M.K.; Buenfeld, N.R. Pore segmentation of cement-based materials from backscattered electron images. Cement and Concrete Research 2006, 36, 1083–1090. [Google Scholar] [CrossRef]
- Scrivener, K.L.; Snellings, R.; Lothenbach, B. A Practical Guide to Microstructural Analysis of Cementitious Materials; Taylor & Francis Group, LLC: Milton, Abingdon, UK, 2016; ISBN 9781498738675. [Google Scholar]
- Mehta, P.K.; Monteiro, P.J.M. Concrete: Microstructure, Properties and Materials, 3rd ed.; McGraw-Hill Companies: New York, NY, USA, 2006. [Google Scholar]
- Nunes, C.; Slížková, Z.; Stefanidou, M.; Němeček, J. Microstructure of lime and lime-pozzolana pastes with nanosilica. Cem. Concr. Res. 2016, 83, 152–163. [Google Scholar] [CrossRef]
- Kosmatka, S.H.; Kerkhoff, B.; Panarase, W.C. Design and Control of Concrete Mixtures, 14th ed.; Portland Cement Association (PCA): Skokie, IL, USA, 2008; ISBN 0-89312-217-3. [Google Scholar]
- Chen, X.; Wu, S.; Zhou, J. Influence of porosity on compressive and tensile strength of cement mortar. Constr. Build. Mater. 2013, 40, 869–874. [Google Scholar] [CrossRef]
- Allen, A.J.; Thomas, J.J.; Jennings, H.M. Composition and density of nanoscale calcium-silicate-hydrate in cement. Nat. Mater. 2007, 6, 311–316. [Google Scholar] [CrossRef]
- Cook, R.A.; Hover, K.C. Mercury porosimetry of hardened cement pastes. Cem. Concr. Res. 1999, 29, 933–943. [Google Scholar] [CrossRef]


| Binder | Mean Size (µm) | Surface Area (m2/g) | Oxide Composition (%) | ||||||
|---|---|---|---|---|---|---|---|---|---|
| MgO | Al2O3 | SiO2 | CaO | Fe2O3 | SO3 | K2O | |||
| OPC | 21 | 1.288 | 2.84 | 4.04 | 19.0 | 65.1 | 3.09 | 3.77 | 1.570 |
| LCD | 5 | 0.996 | 0.4 | 18.2 | 66.9 | 10.0 | 0.08 | - | 0.057 |
| 12 | 0.935 | 0.42 | 18.0 | 65.7 | 10.3 | 0.14 | - | 0.044 | |
| Mix ID | 7-Day Age | 14-Day Age | 28-Day Age | |||
|---|---|---|---|---|---|---|
| Bulk Density (g/cc) | Skeletal Density (g/cc) | Bulk Density (g/cc) | Skeletal Density (g/cc) | Bulk Density (g/cc) | Skeletal Density (g/cc) | |
| OPC | 2.123 | 2.475 | 2.159 | 2.453 | 2.120 | 2.425 |
| 5 µm-10 | 2.130 | 2.470 | 2.129 | 2.426 | 2.159 | 2.406 |
| 5 µm-20 | 2.087 | 2.382 | 2.094 | 2.344 | 2.152 | 2.411 |
| 12 µm-10 | 2.131 | 2.463 | 2.180 | 2.461 | 2.136 | 2.417 |
| 12 µm-20 | 2.059 | 2.392 | 2.070 | 2.360 | 2.109 | 2.393 |
| Mix | Parameter | Average Values* | ||
|---|---|---|---|---|
| 7 Days (Age) | 14 Days (Age) | 28 Day (Age) | ||
| OPC | Porosity (%) | 19.31 | 6.37 | 9.88 |
| Hydration Degree (%) | 50.76 | 56.25 | 62.91 | |
| 5 μm-10 | Porosity (%) | 20.51 | 11.61 | 7.22 |
| Degree of Hydration (%) | 43.76 | 61.72 | 67.11 | |
| 5 μm-20 | Porosity (%) | 21.70 | 10.54 | 8.16 |
| Hydration Degree (%) | 39.63 | 52.45 | 65.96 | |
| 12 μm-10 | Porosity (%) | 22.36 | 7.57 | 6.51 |
| Hydration Degree (%) | 42.42 | 60.65 | 69.04 | |
| 12 μm-20 | Porosity (%) | 18.73 | 12.37 | 13.16 |
| Hydration Degree (%) | 35.27 | 67.55 | 83.66 | |
| Mix | Cs (% by Sample Weight) | D (E-12 m2/s) | R Squared |
|---|---|---|---|
| OPC | 1.15 | 12.28 | 0.98 |
| 5 μm-10 | 1.14 | 8.24 | 0.96 |
| 5 μm-20 | 1.01 | 4.86 | 0.93 |
| 12 μm-10 | 1.06 | 8.98 | 0.97 |
| 12 μm-20 | 1.33 | 6.59 | 0.95 |
© 2018 by the authors. Licensee MDPI, Basel, Switzerland. This article is an open access article distributed under the terms and conditions of the Creative Commons Attribution (CC BY) license (http://creativecommons.org/licenses/by/4.0/).
Share and Cite
Kim, S.K.; Hanif, A.; Jang, I.Y. Incorporating Liquid Crystal Display (LCD) Glass Waste as Supplementary Cementing Material (SCM) in Cement Mortars—Rationale Based on Hydration, Durability, and Pore Characteristics. Materials 2018, 11, 2538. https://doi.org/10.3390/ma11122538
Kim SK, Hanif A, Jang IY. Incorporating Liquid Crystal Display (LCD) Glass Waste as Supplementary Cementing Material (SCM) in Cement Mortars—Rationale Based on Hydration, Durability, and Pore Characteristics. Materials. 2018; 11(12):2538. https://doi.org/10.3390/ma11122538
Chicago/Turabian StyleKim, Seong Kyum, Asad Hanif, and Il Young Jang. 2018. "Incorporating Liquid Crystal Display (LCD) Glass Waste as Supplementary Cementing Material (SCM) in Cement Mortars—Rationale Based on Hydration, Durability, and Pore Characteristics" Materials 11, no. 12: 2538. https://doi.org/10.3390/ma11122538
APA StyleKim, S. K., Hanif, A., & Jang, I. Y. (2018). Incorporating Liquid Crystal Display (LCD) Glass Waste as Supplementary Cementing Material (SCM) in Cement Mortars—Rationale Based on Hydration, Durability, and Pore Characteristics. Materials, 11(12), 2538. https://doi.org/10.3390/ma11122538