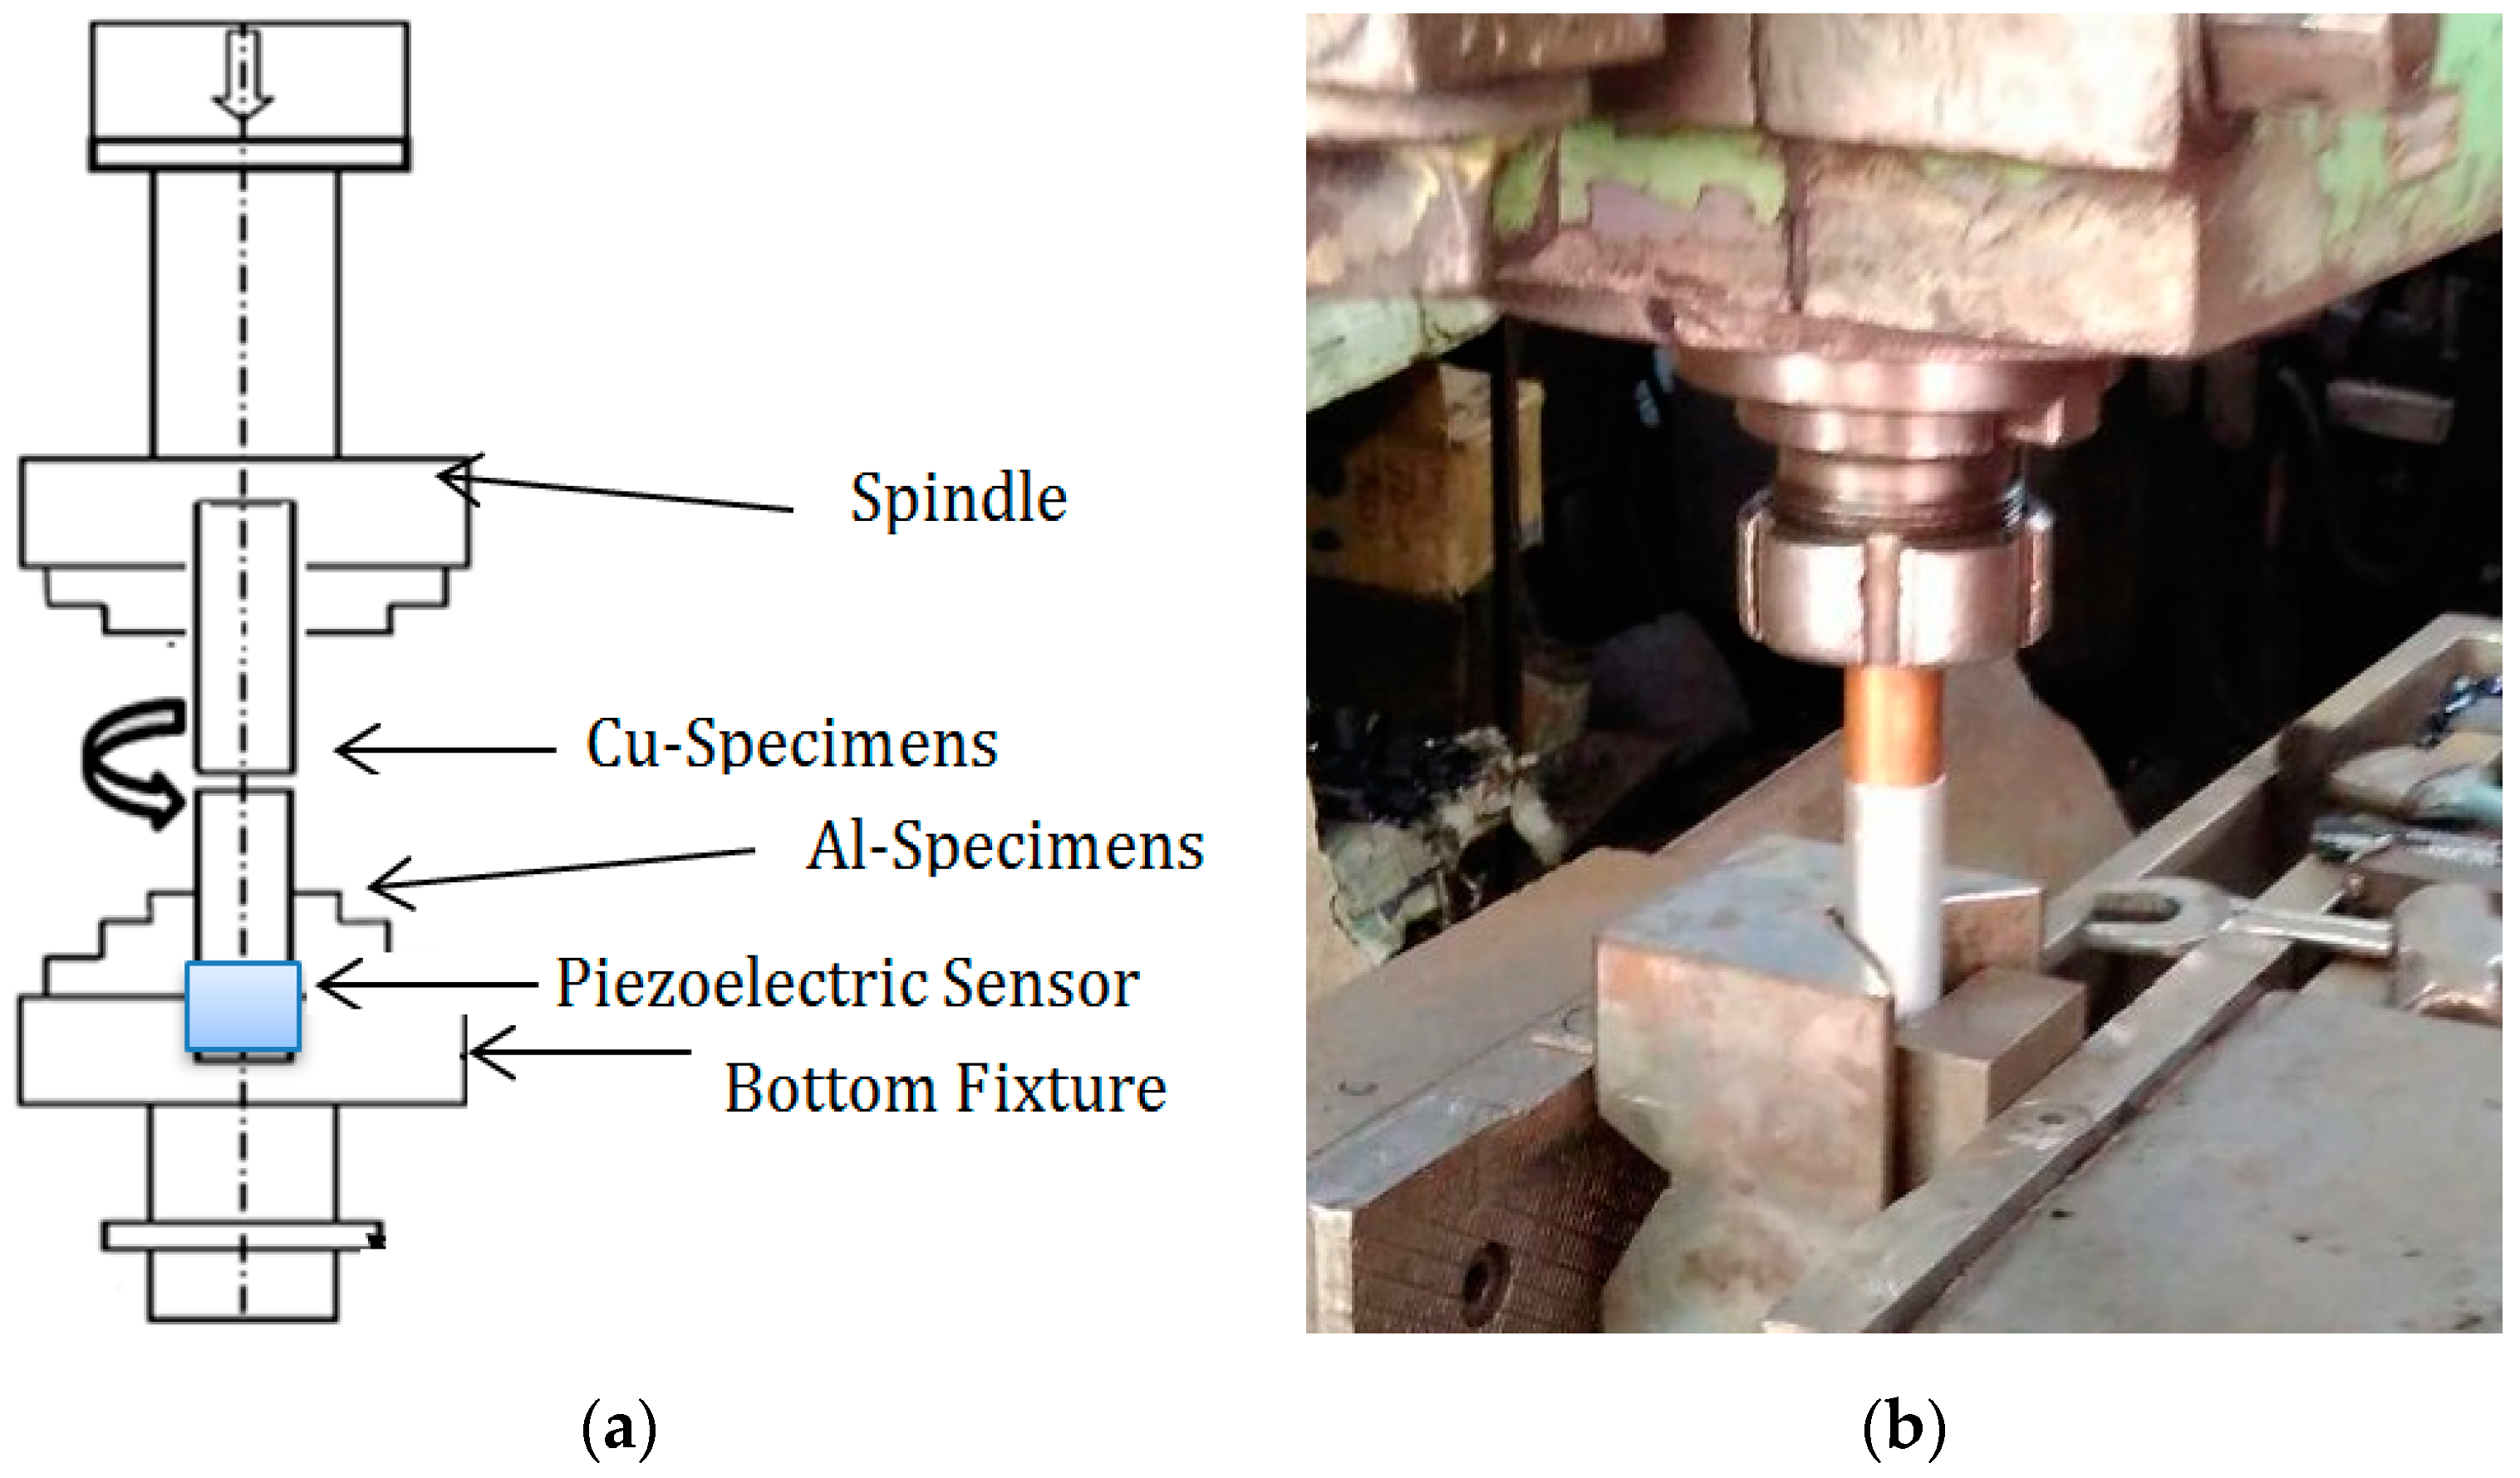
Figure 1.
(a) Schematic layout of the friction welding process. (b) Experimental set-up.
Figure 1.
(a) Schematic layout of the friction welding process. (b) Experimental set-up.
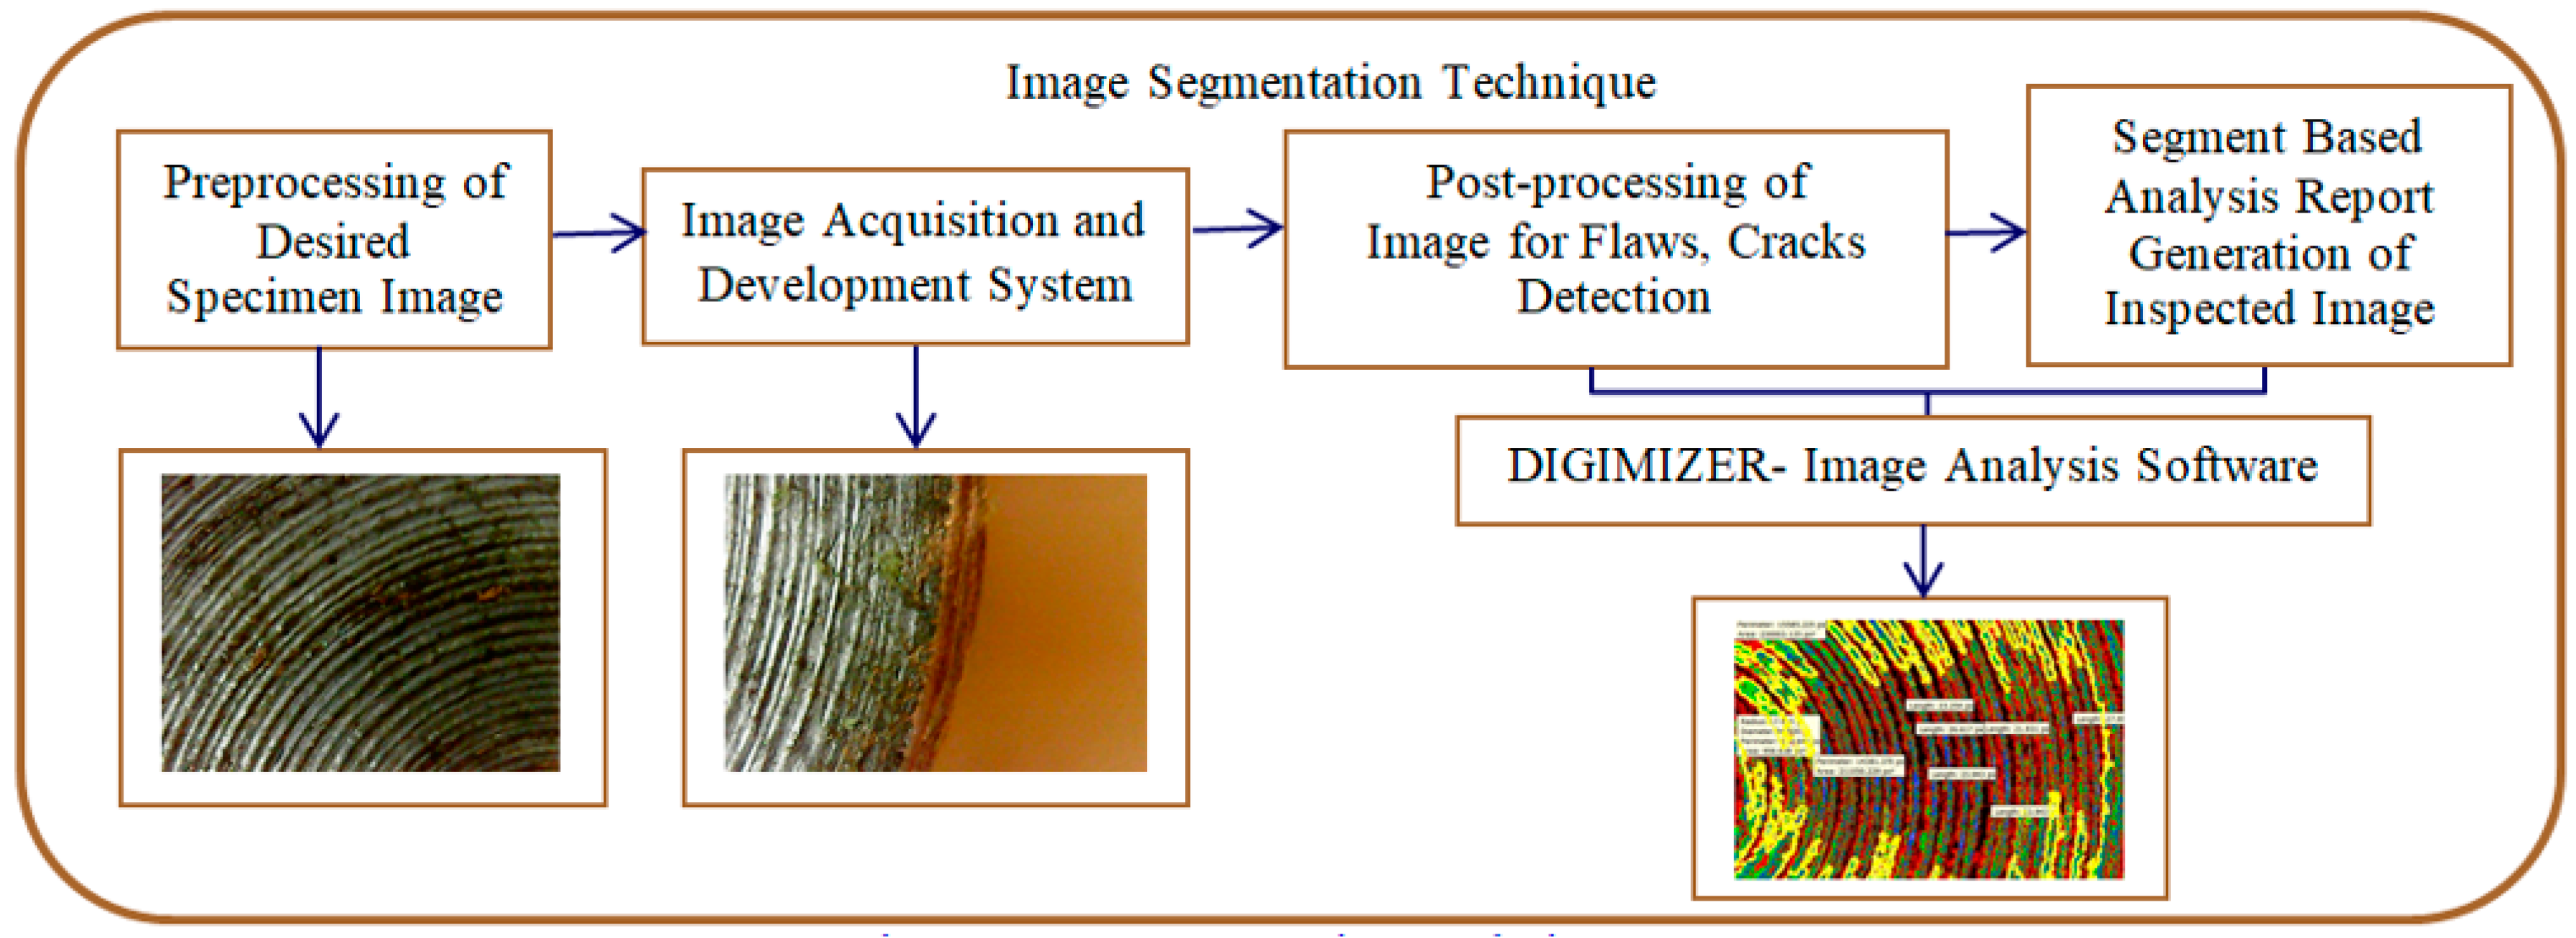
Figure 2.
Procedural steps of the image segmentation technique.
Figure 2.
Procedural steps of the image segmentation technique.
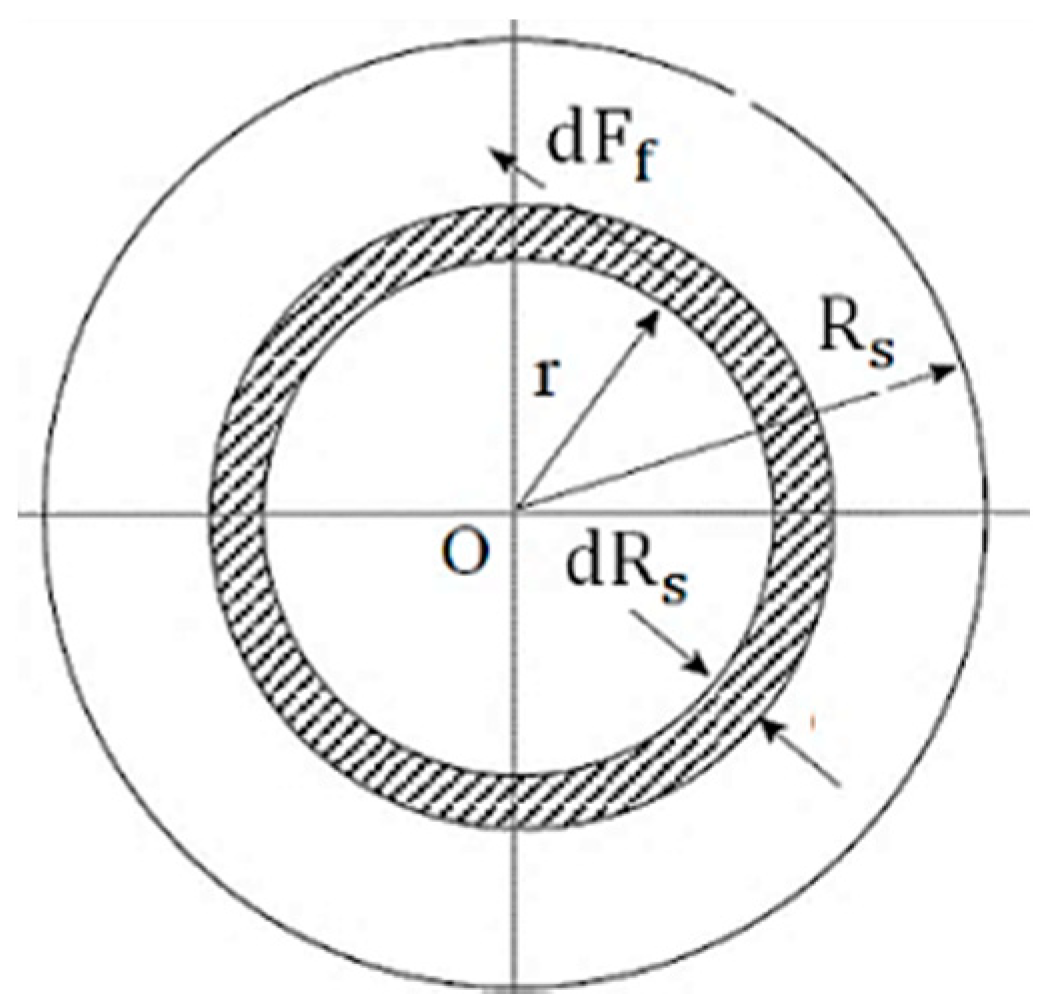
Figure 3.
Representation of the friction force acting at the elemental radius.
Figure 3.
Representation of the friction force acting at the elemental radius.
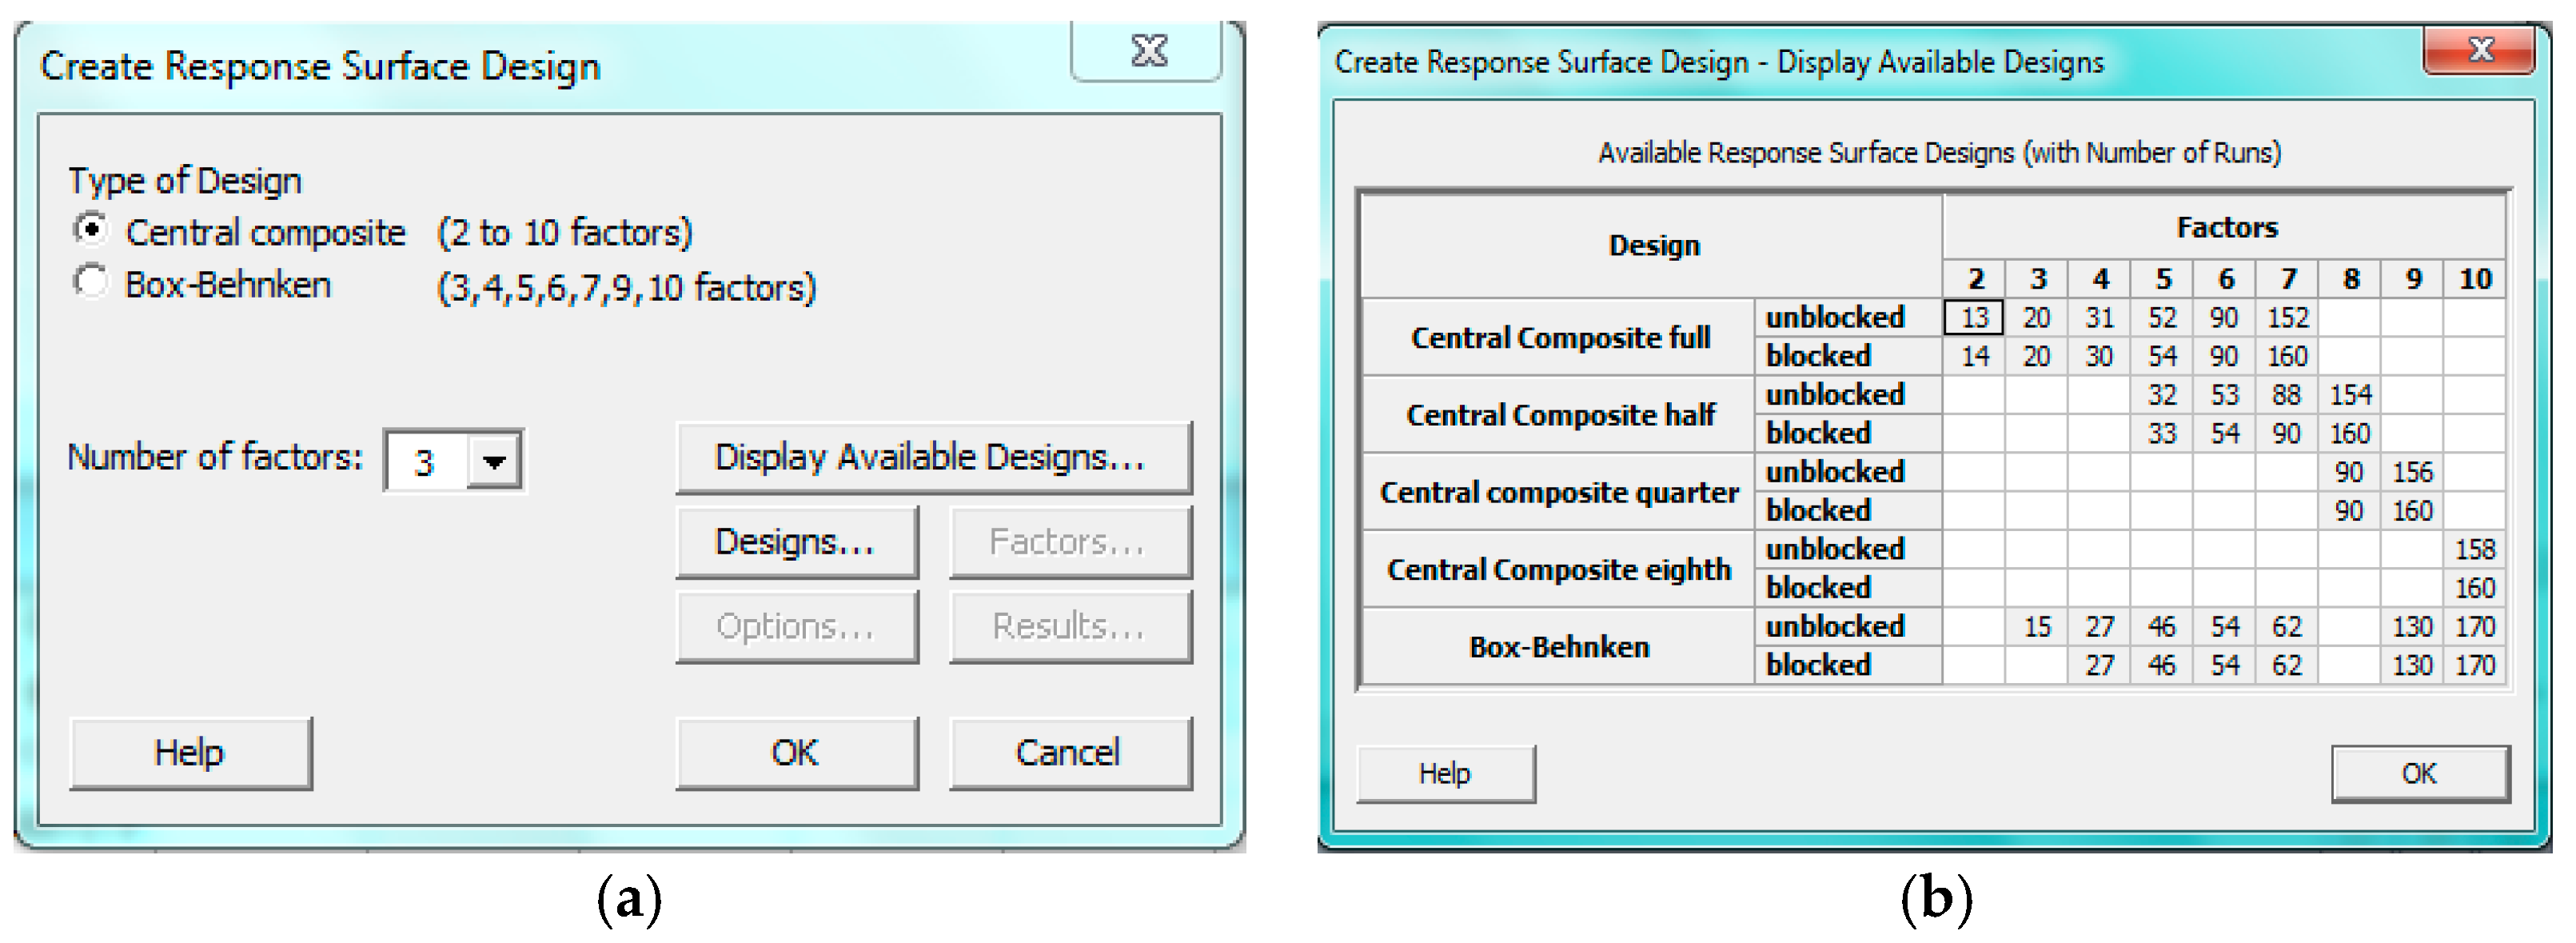
Figure 4.
(a) Type of design. (b) Available design in the response surface design method.
Figure 4.
(a) Type of design. (b) Available design in the response surface design method.
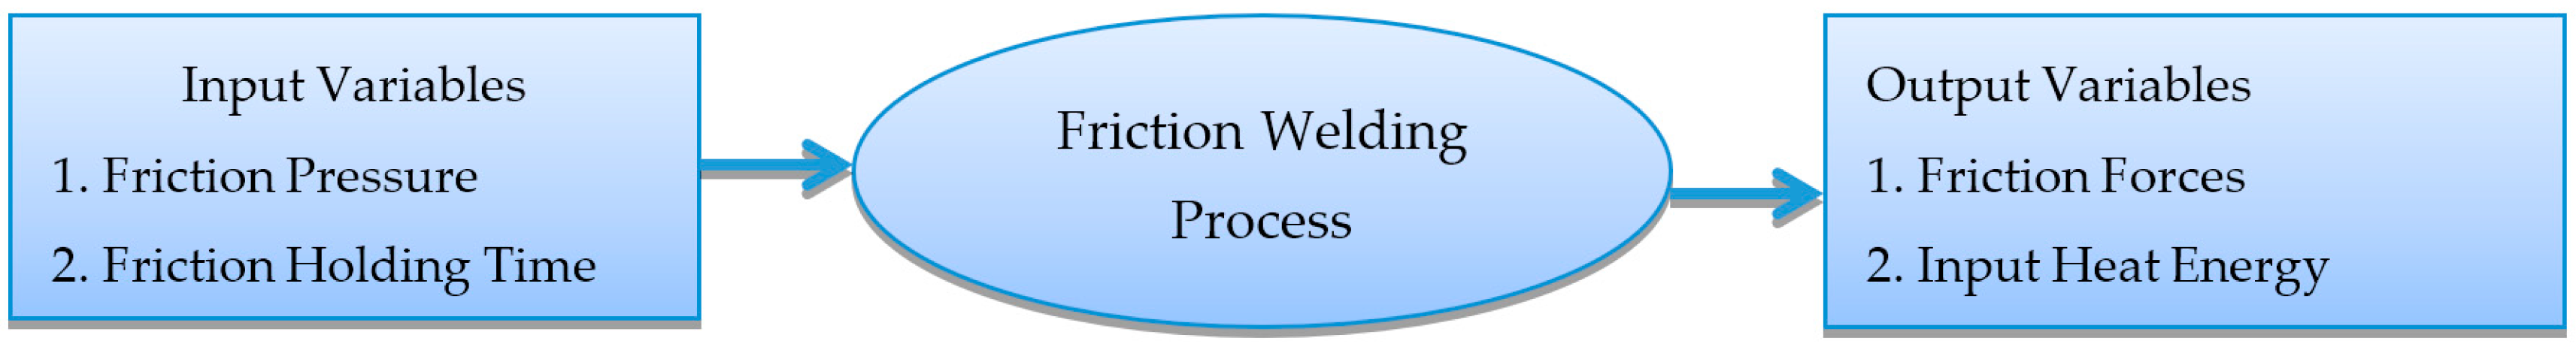
Figure 5.
Input and output parameters of the friction welding process.
Figure 5.
Input and output parameters of the friction welding process.
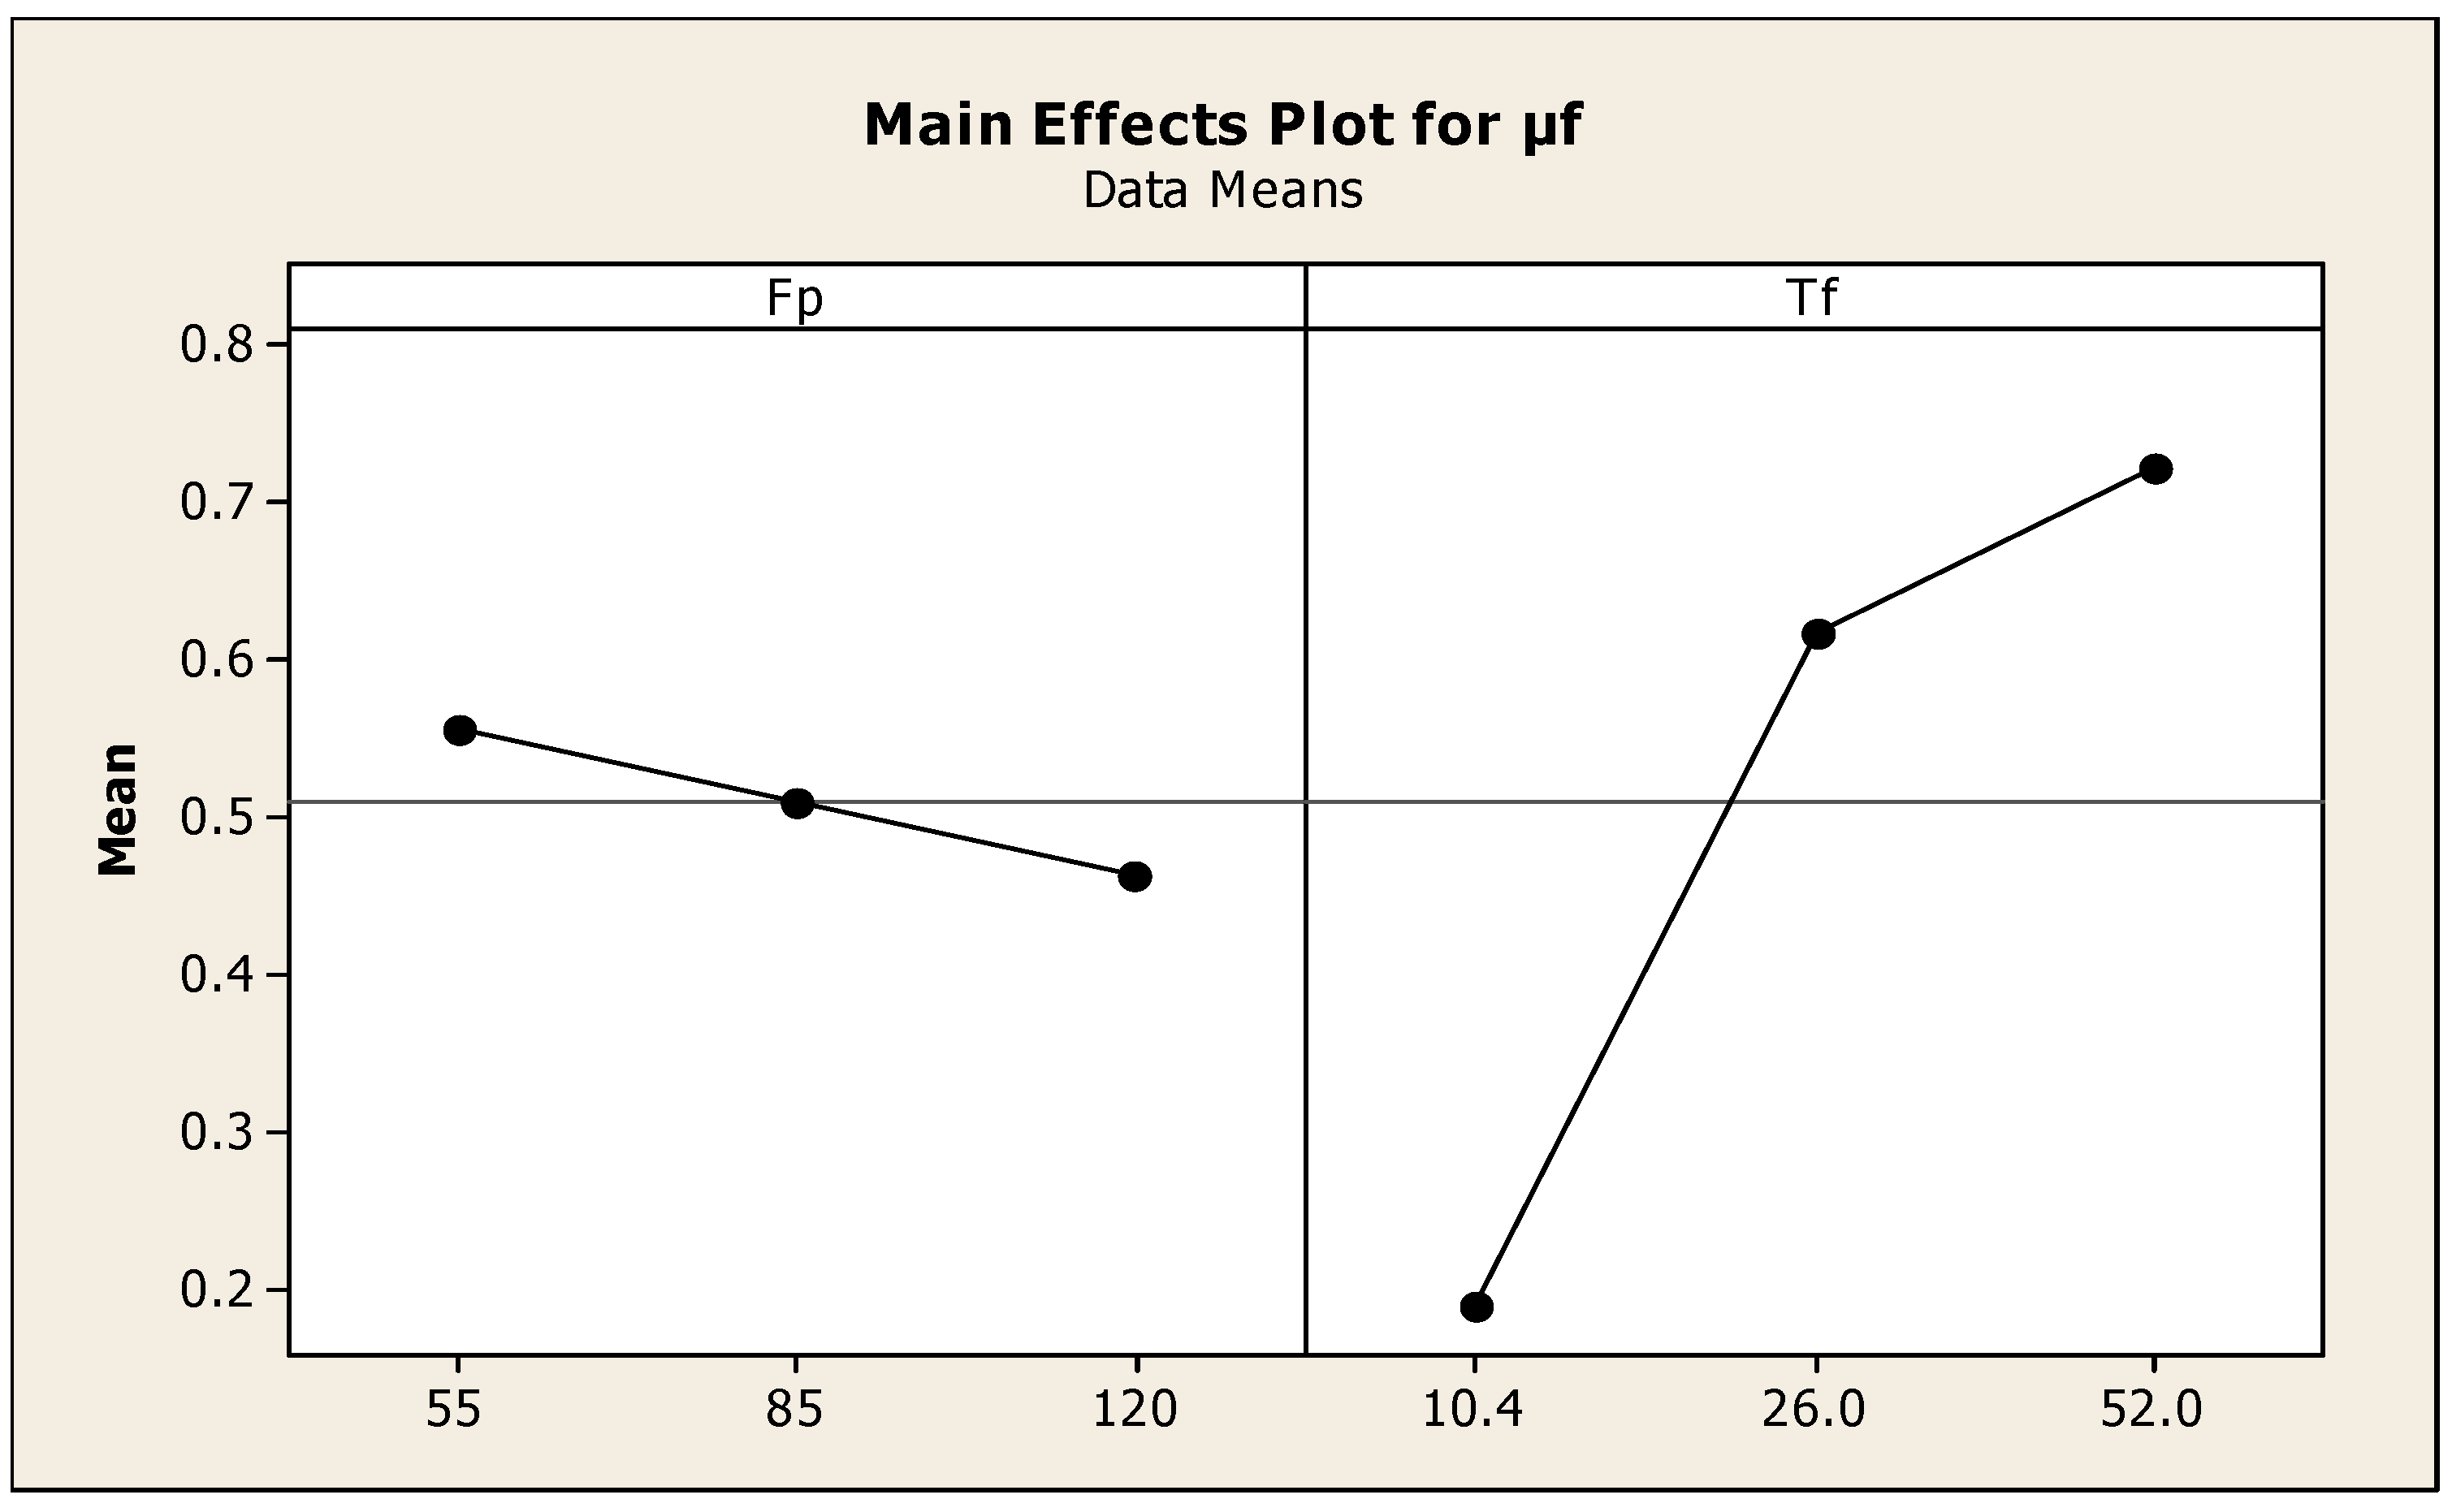
Figure 6.
Effect of friction pressure and torque on .
Figure 6.
Effect of friction pressure and torque on .
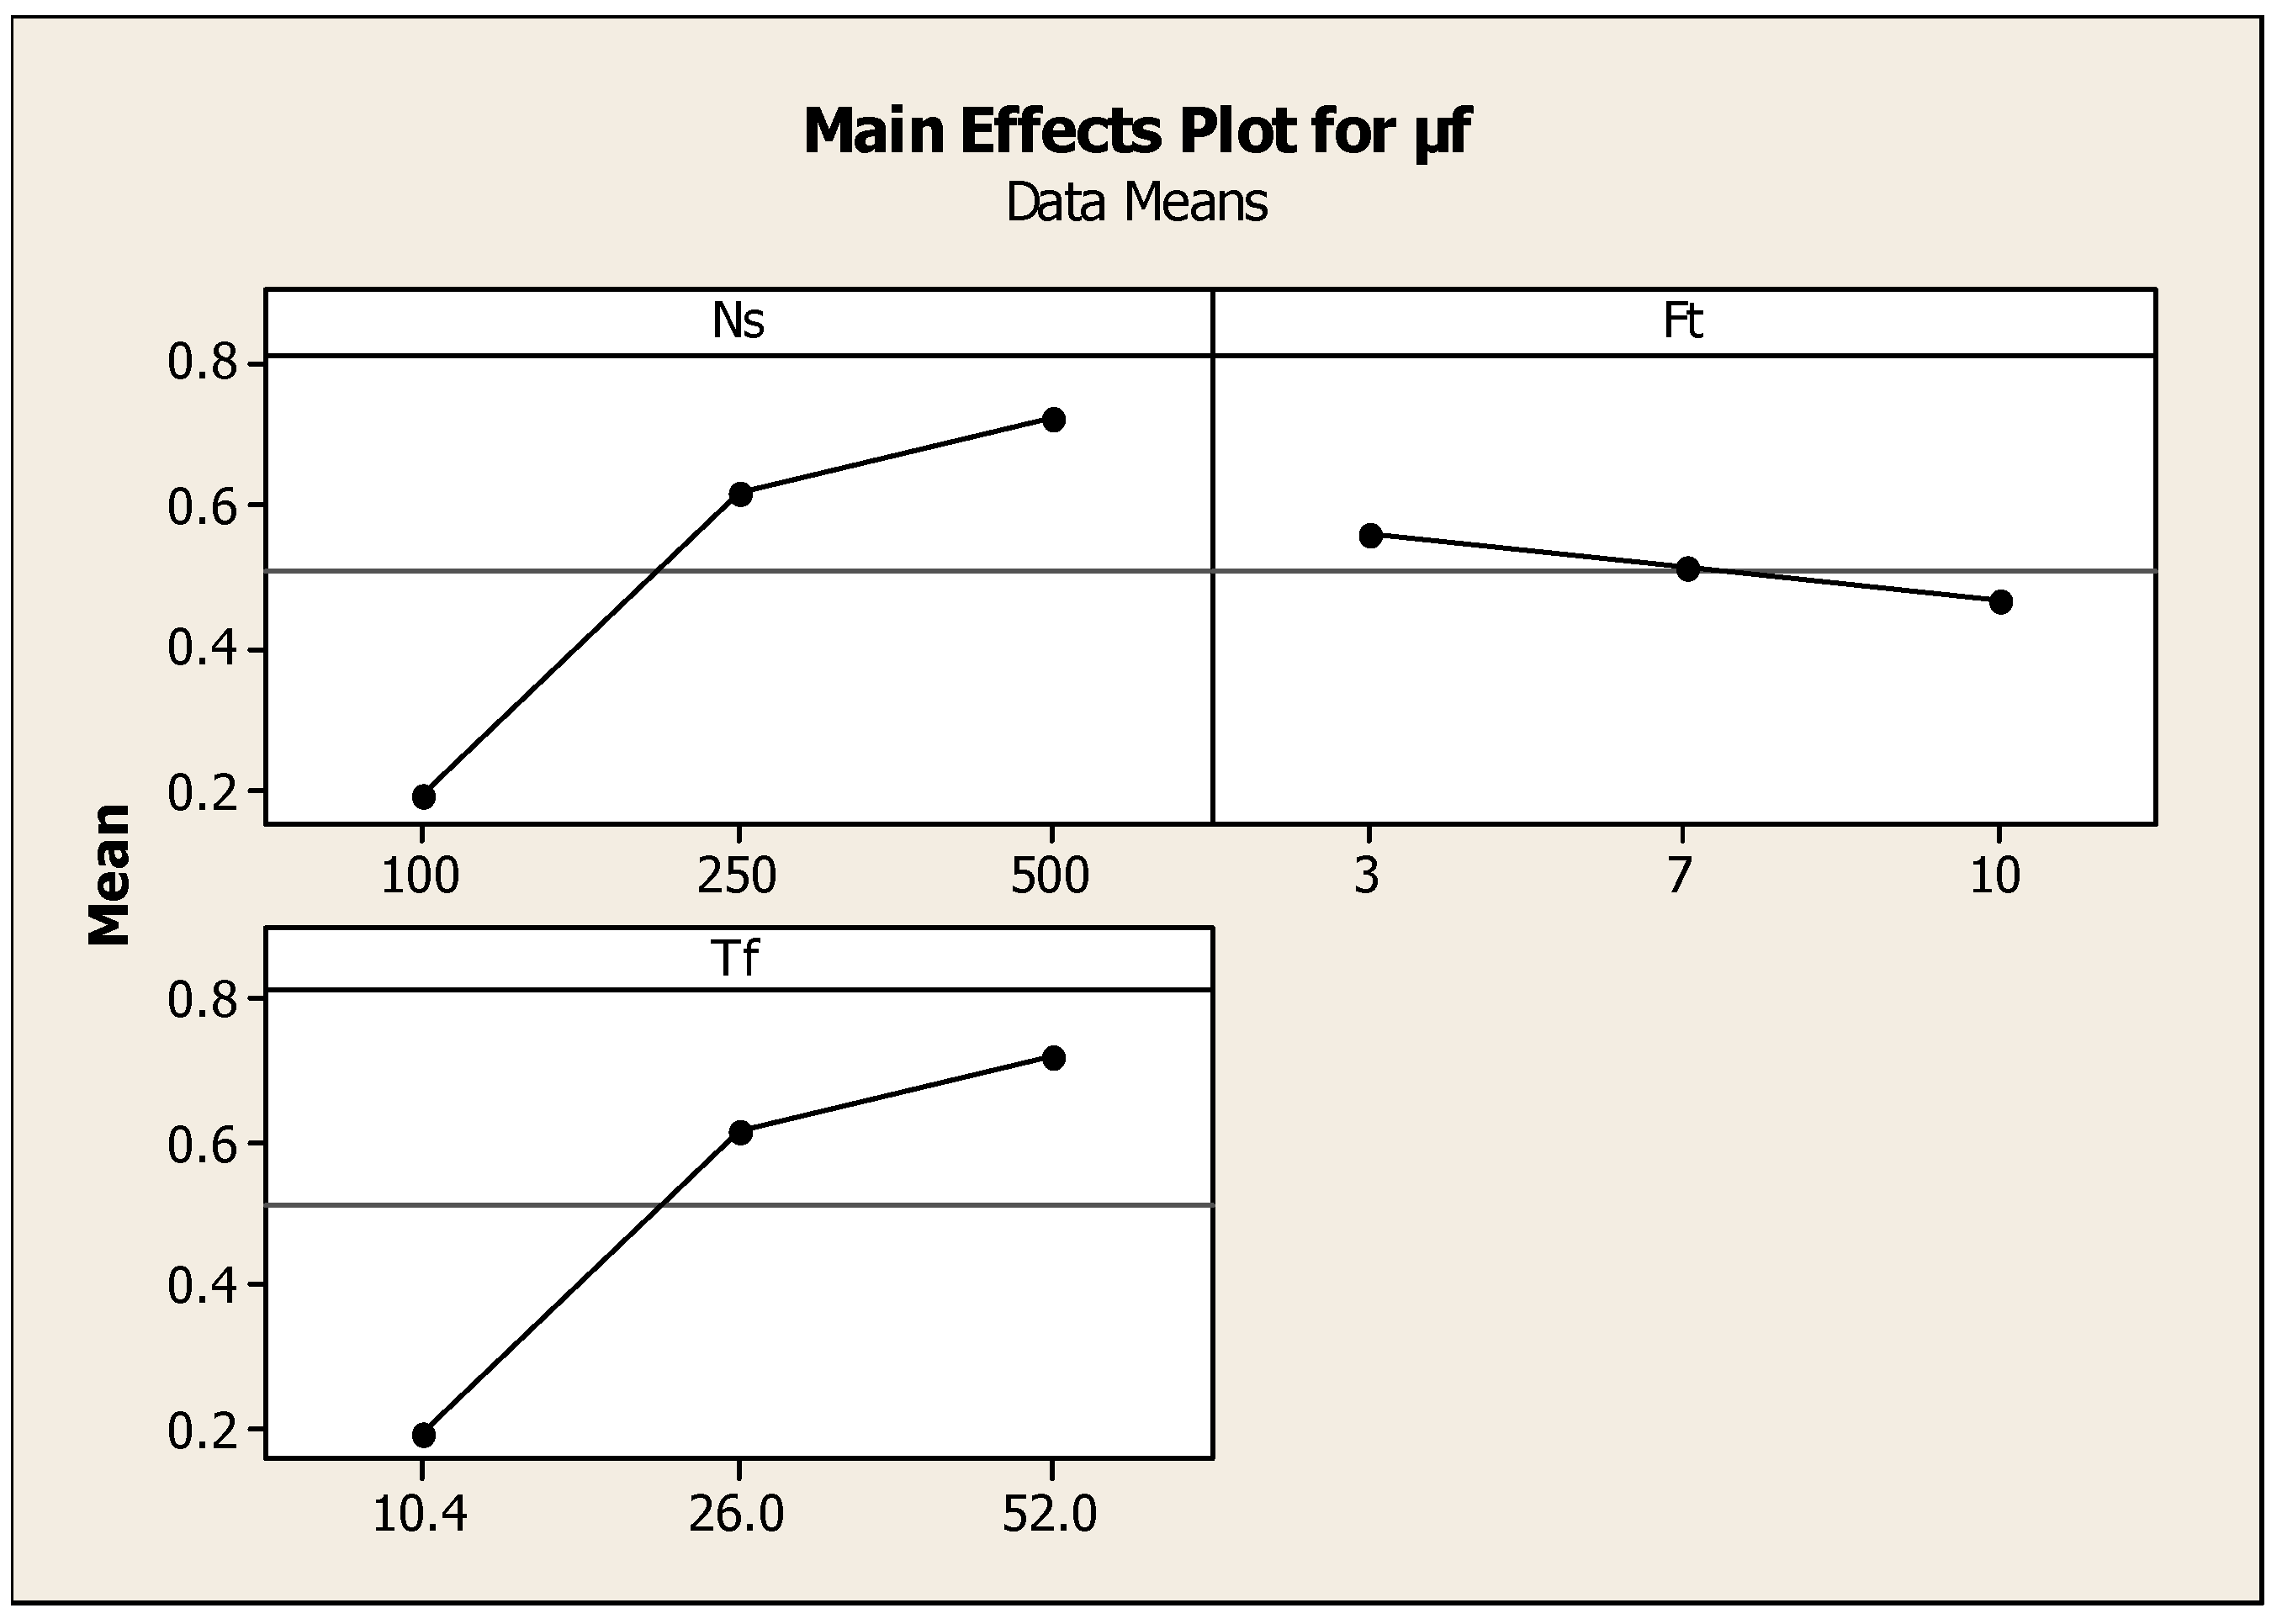
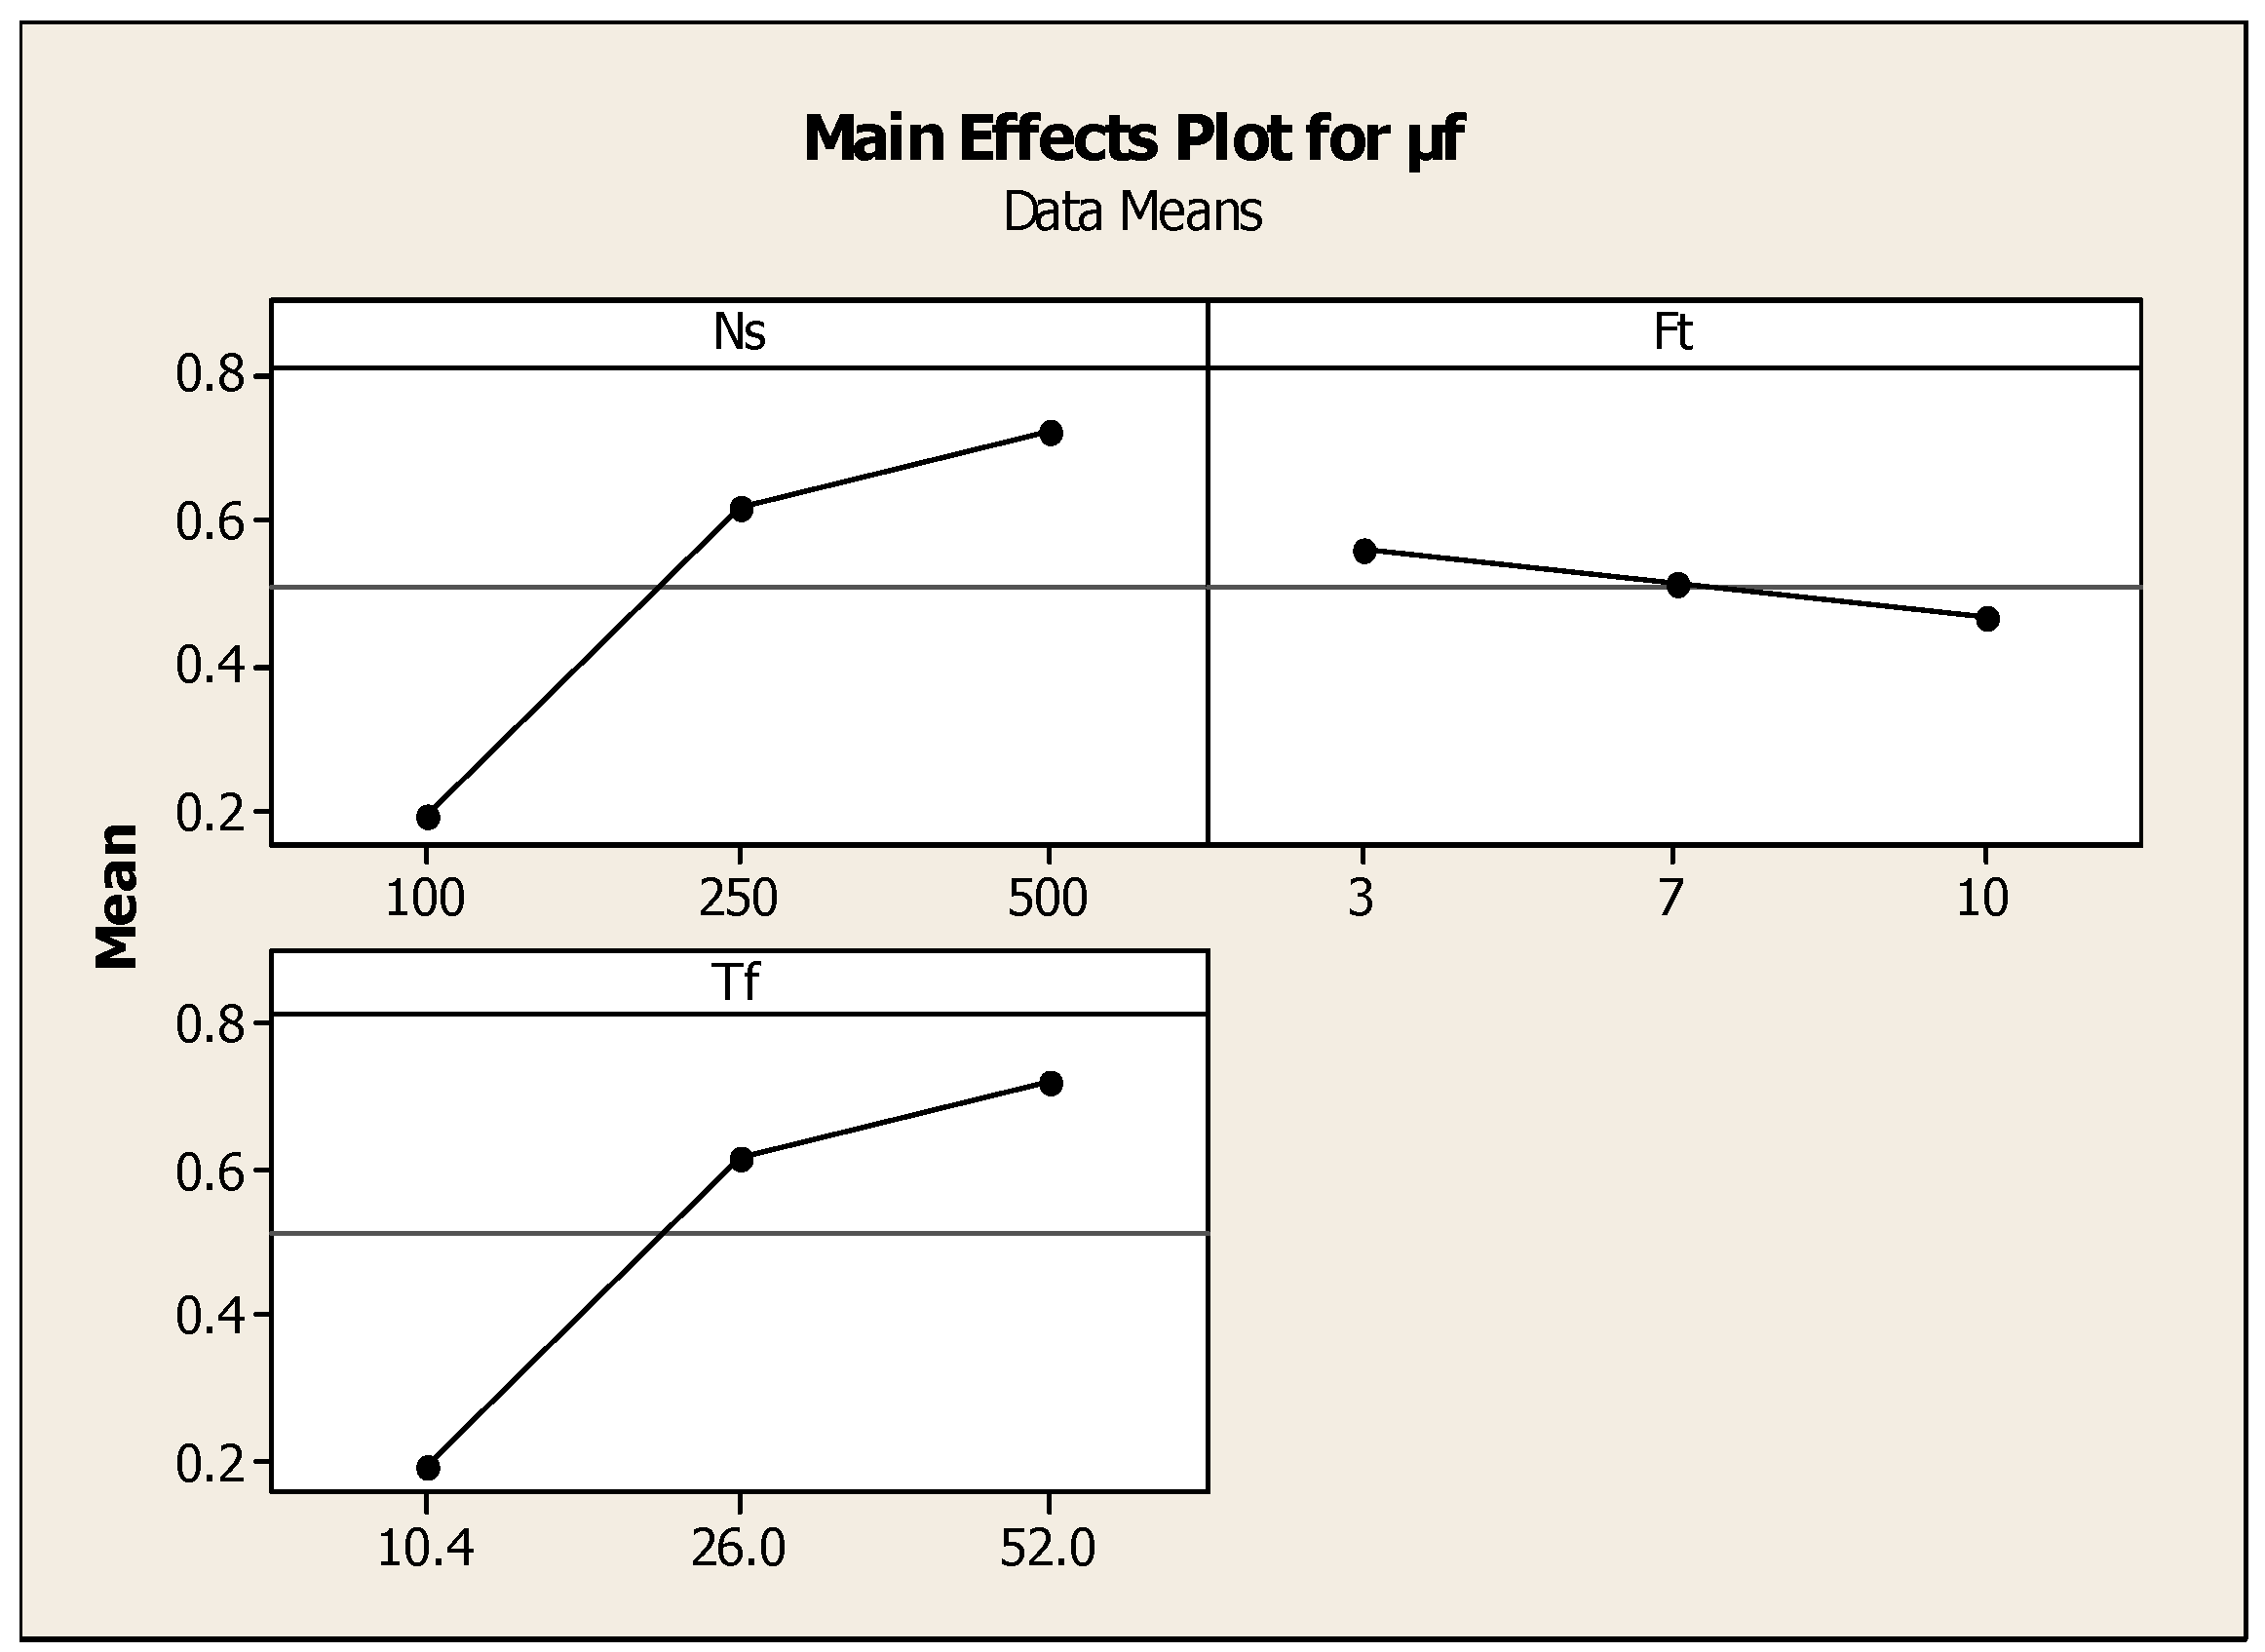
Figure 7.
Effect of speed, torque, and friction time on .
Figure 7.
Effect of speed, torque, and friction time on .
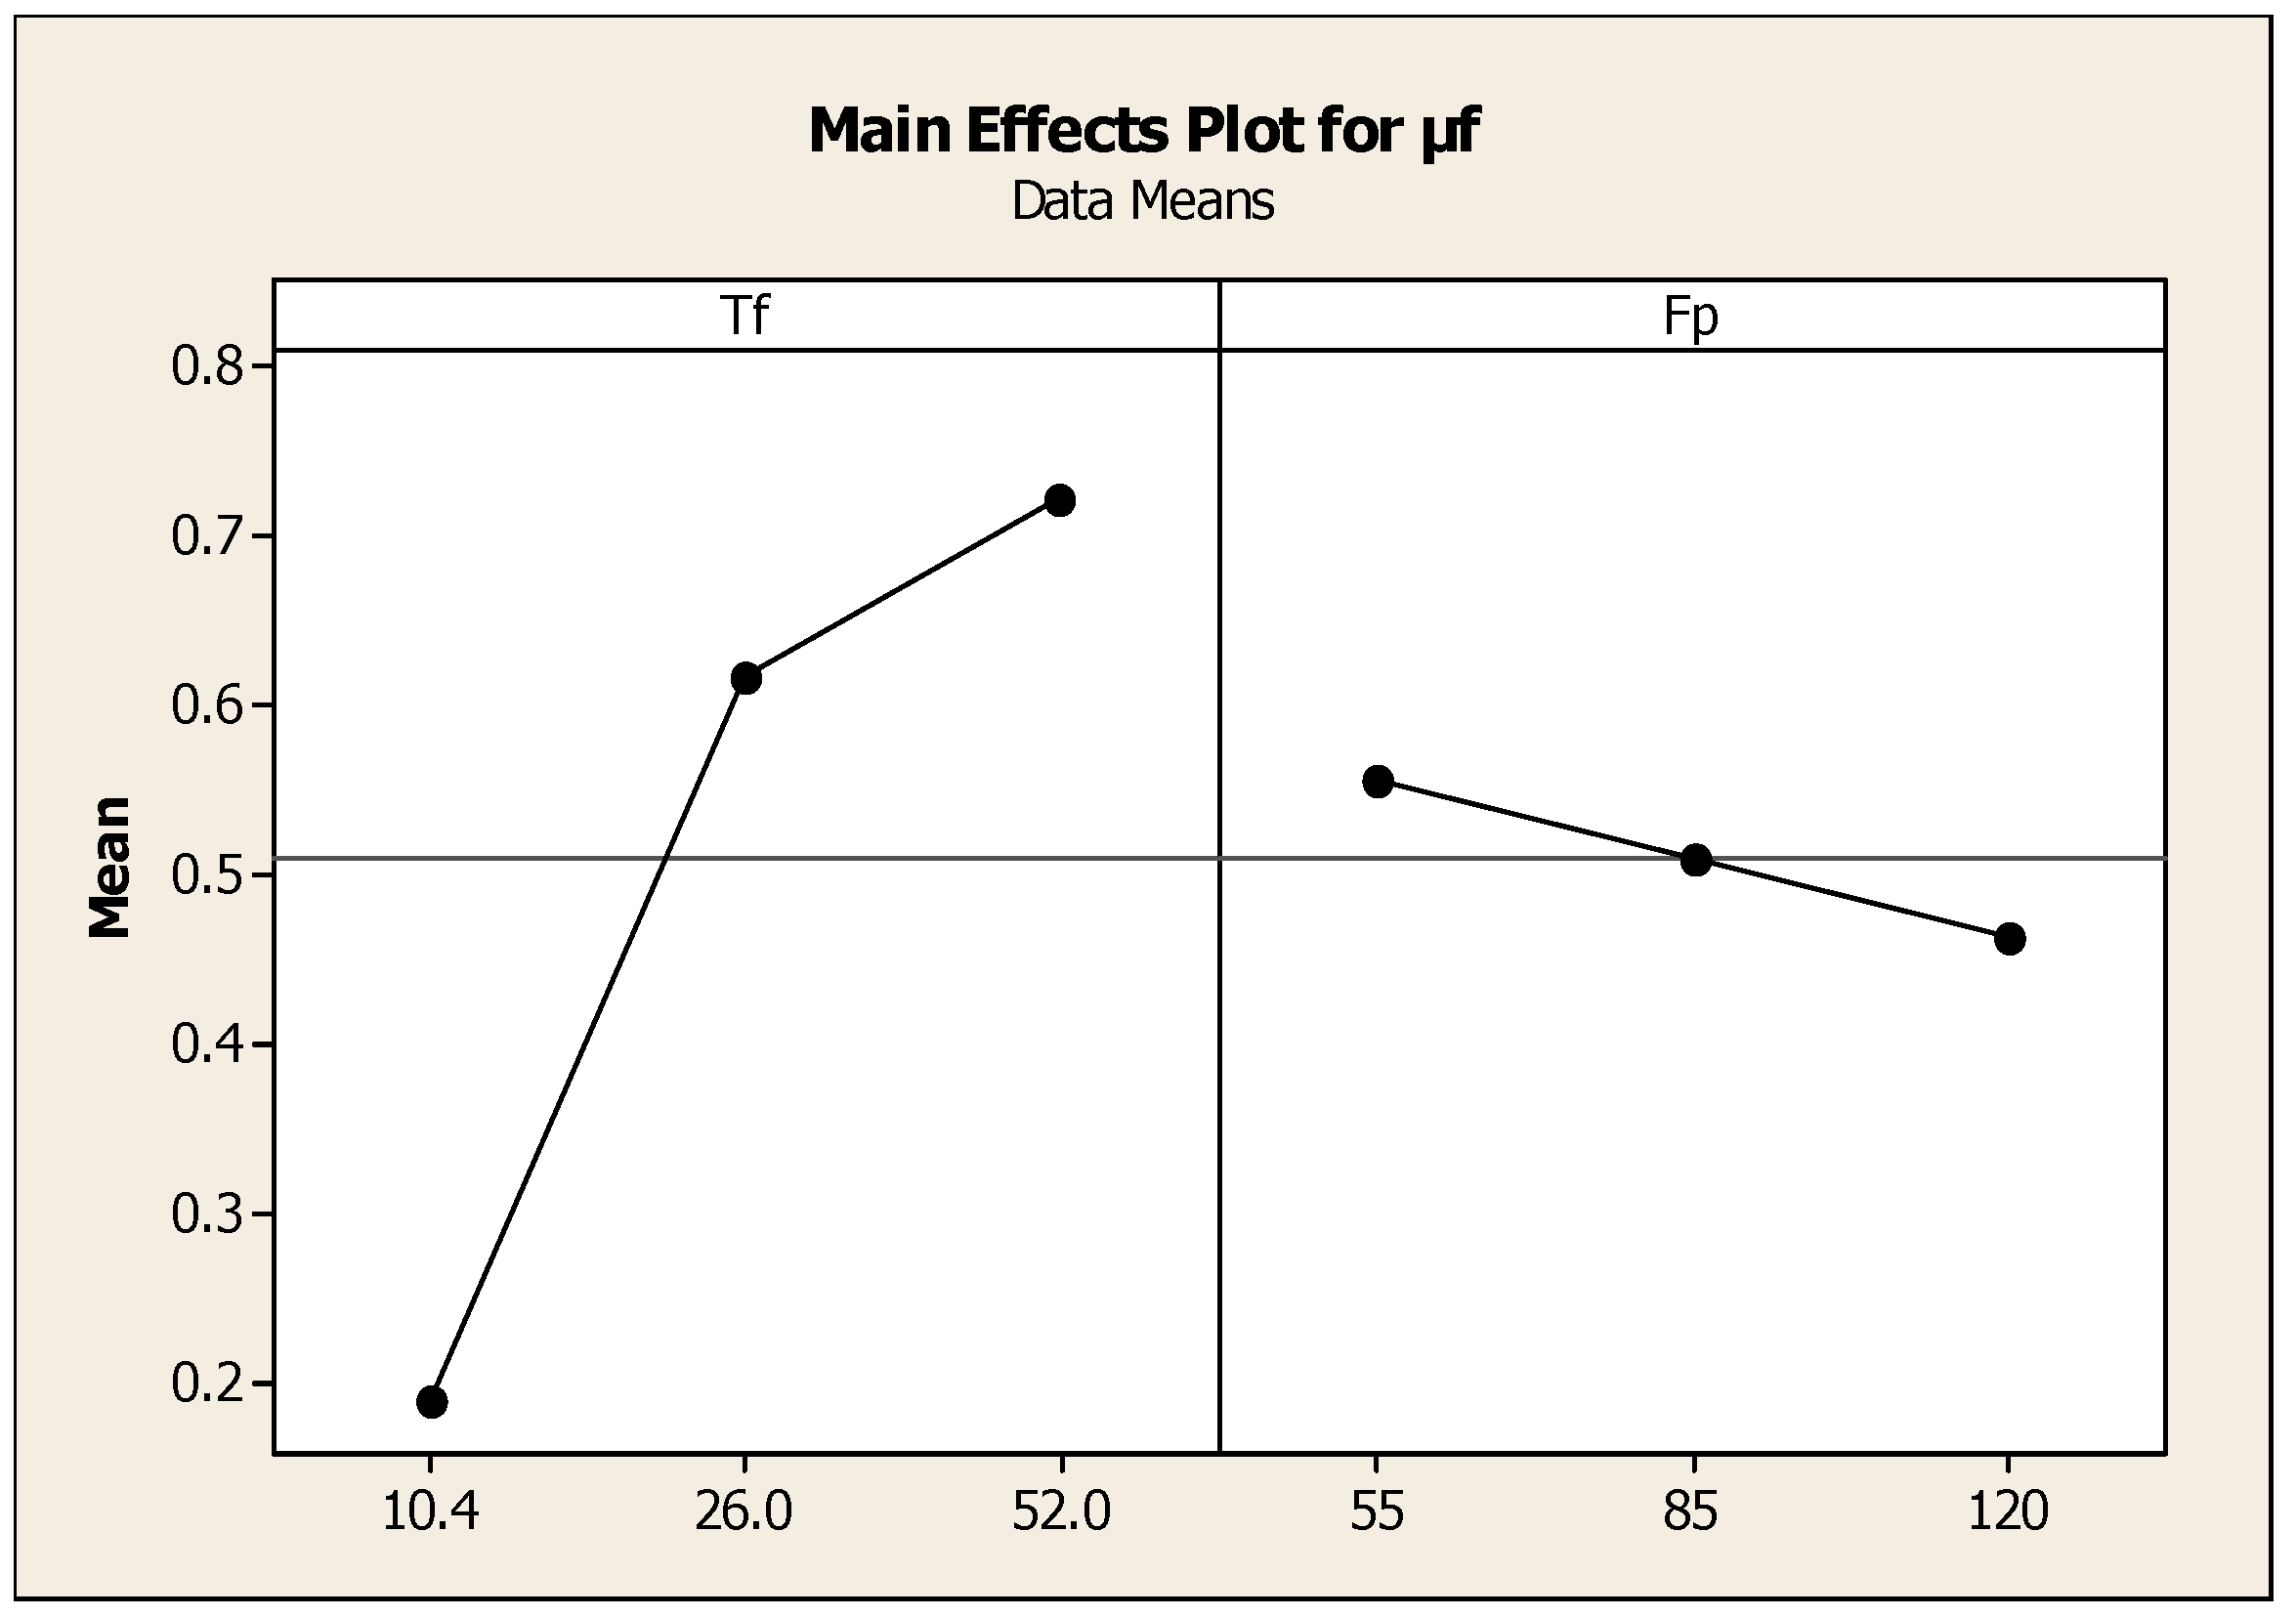
Figure 8.
Effect of torque and friction time on .
Figure 8.
Effect of torque and friction time on .
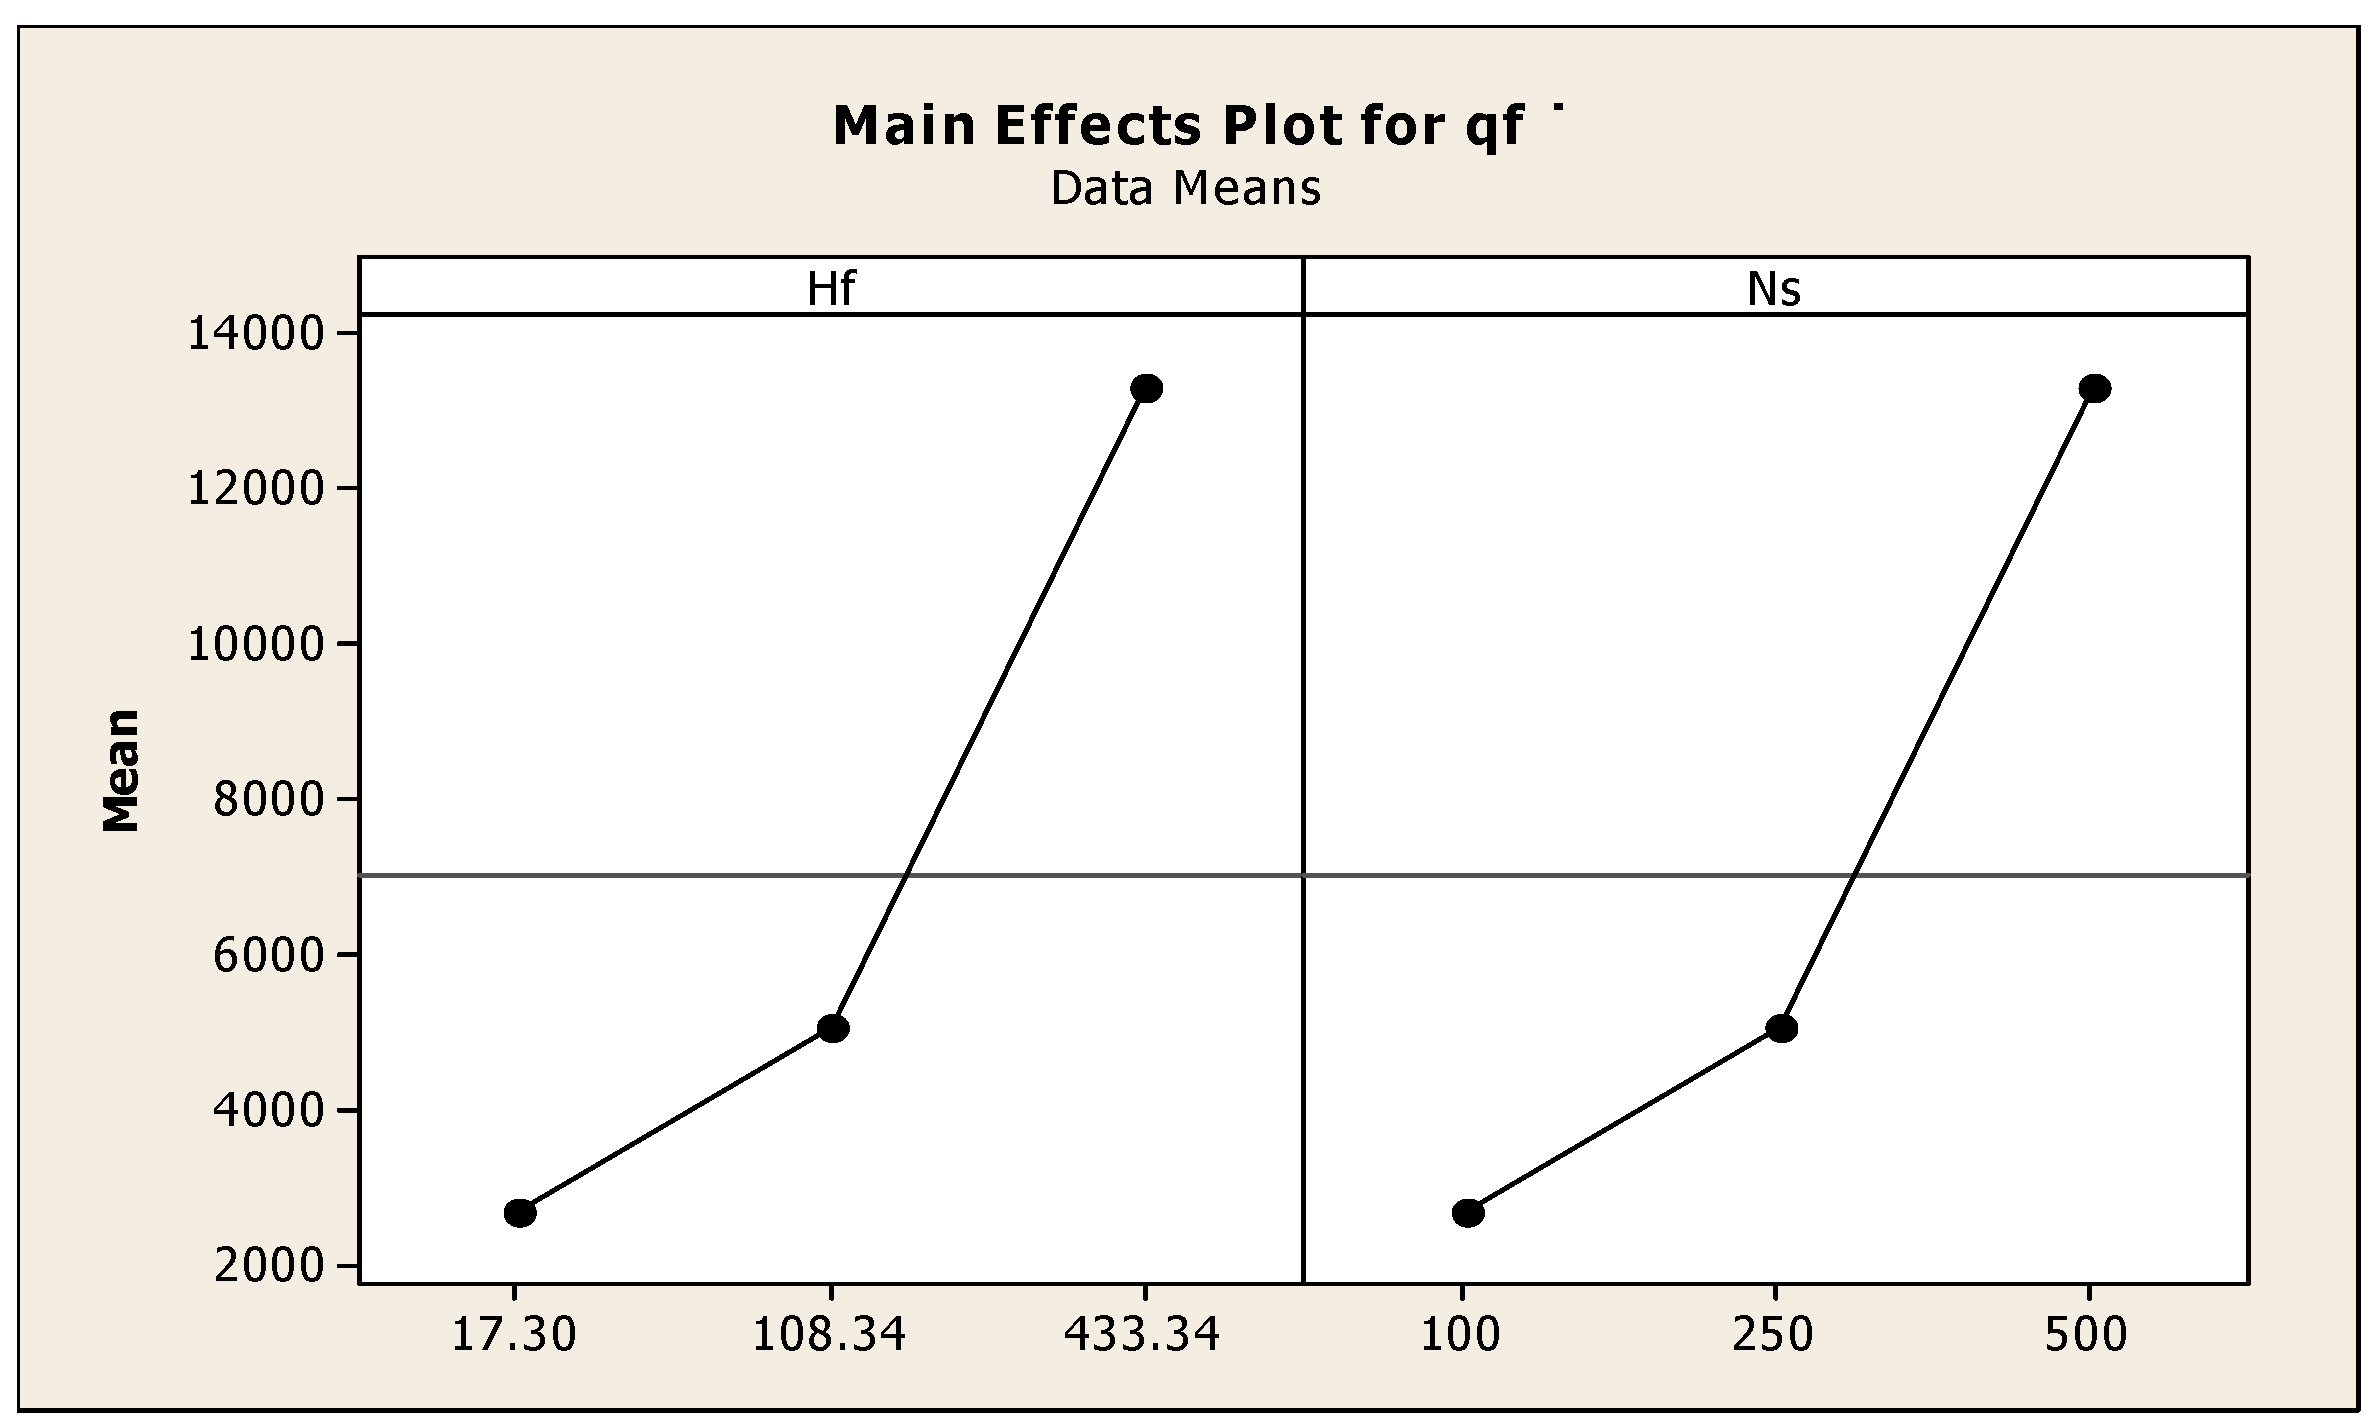
Figure 9.
Effect of input heat energy and speed on .
Figure 9.
Effect of input heat energy and speed on .
Figure 10.
Effect of friction pressure and torque on .
Figure 10.
Effect of friction pressure and torque on .
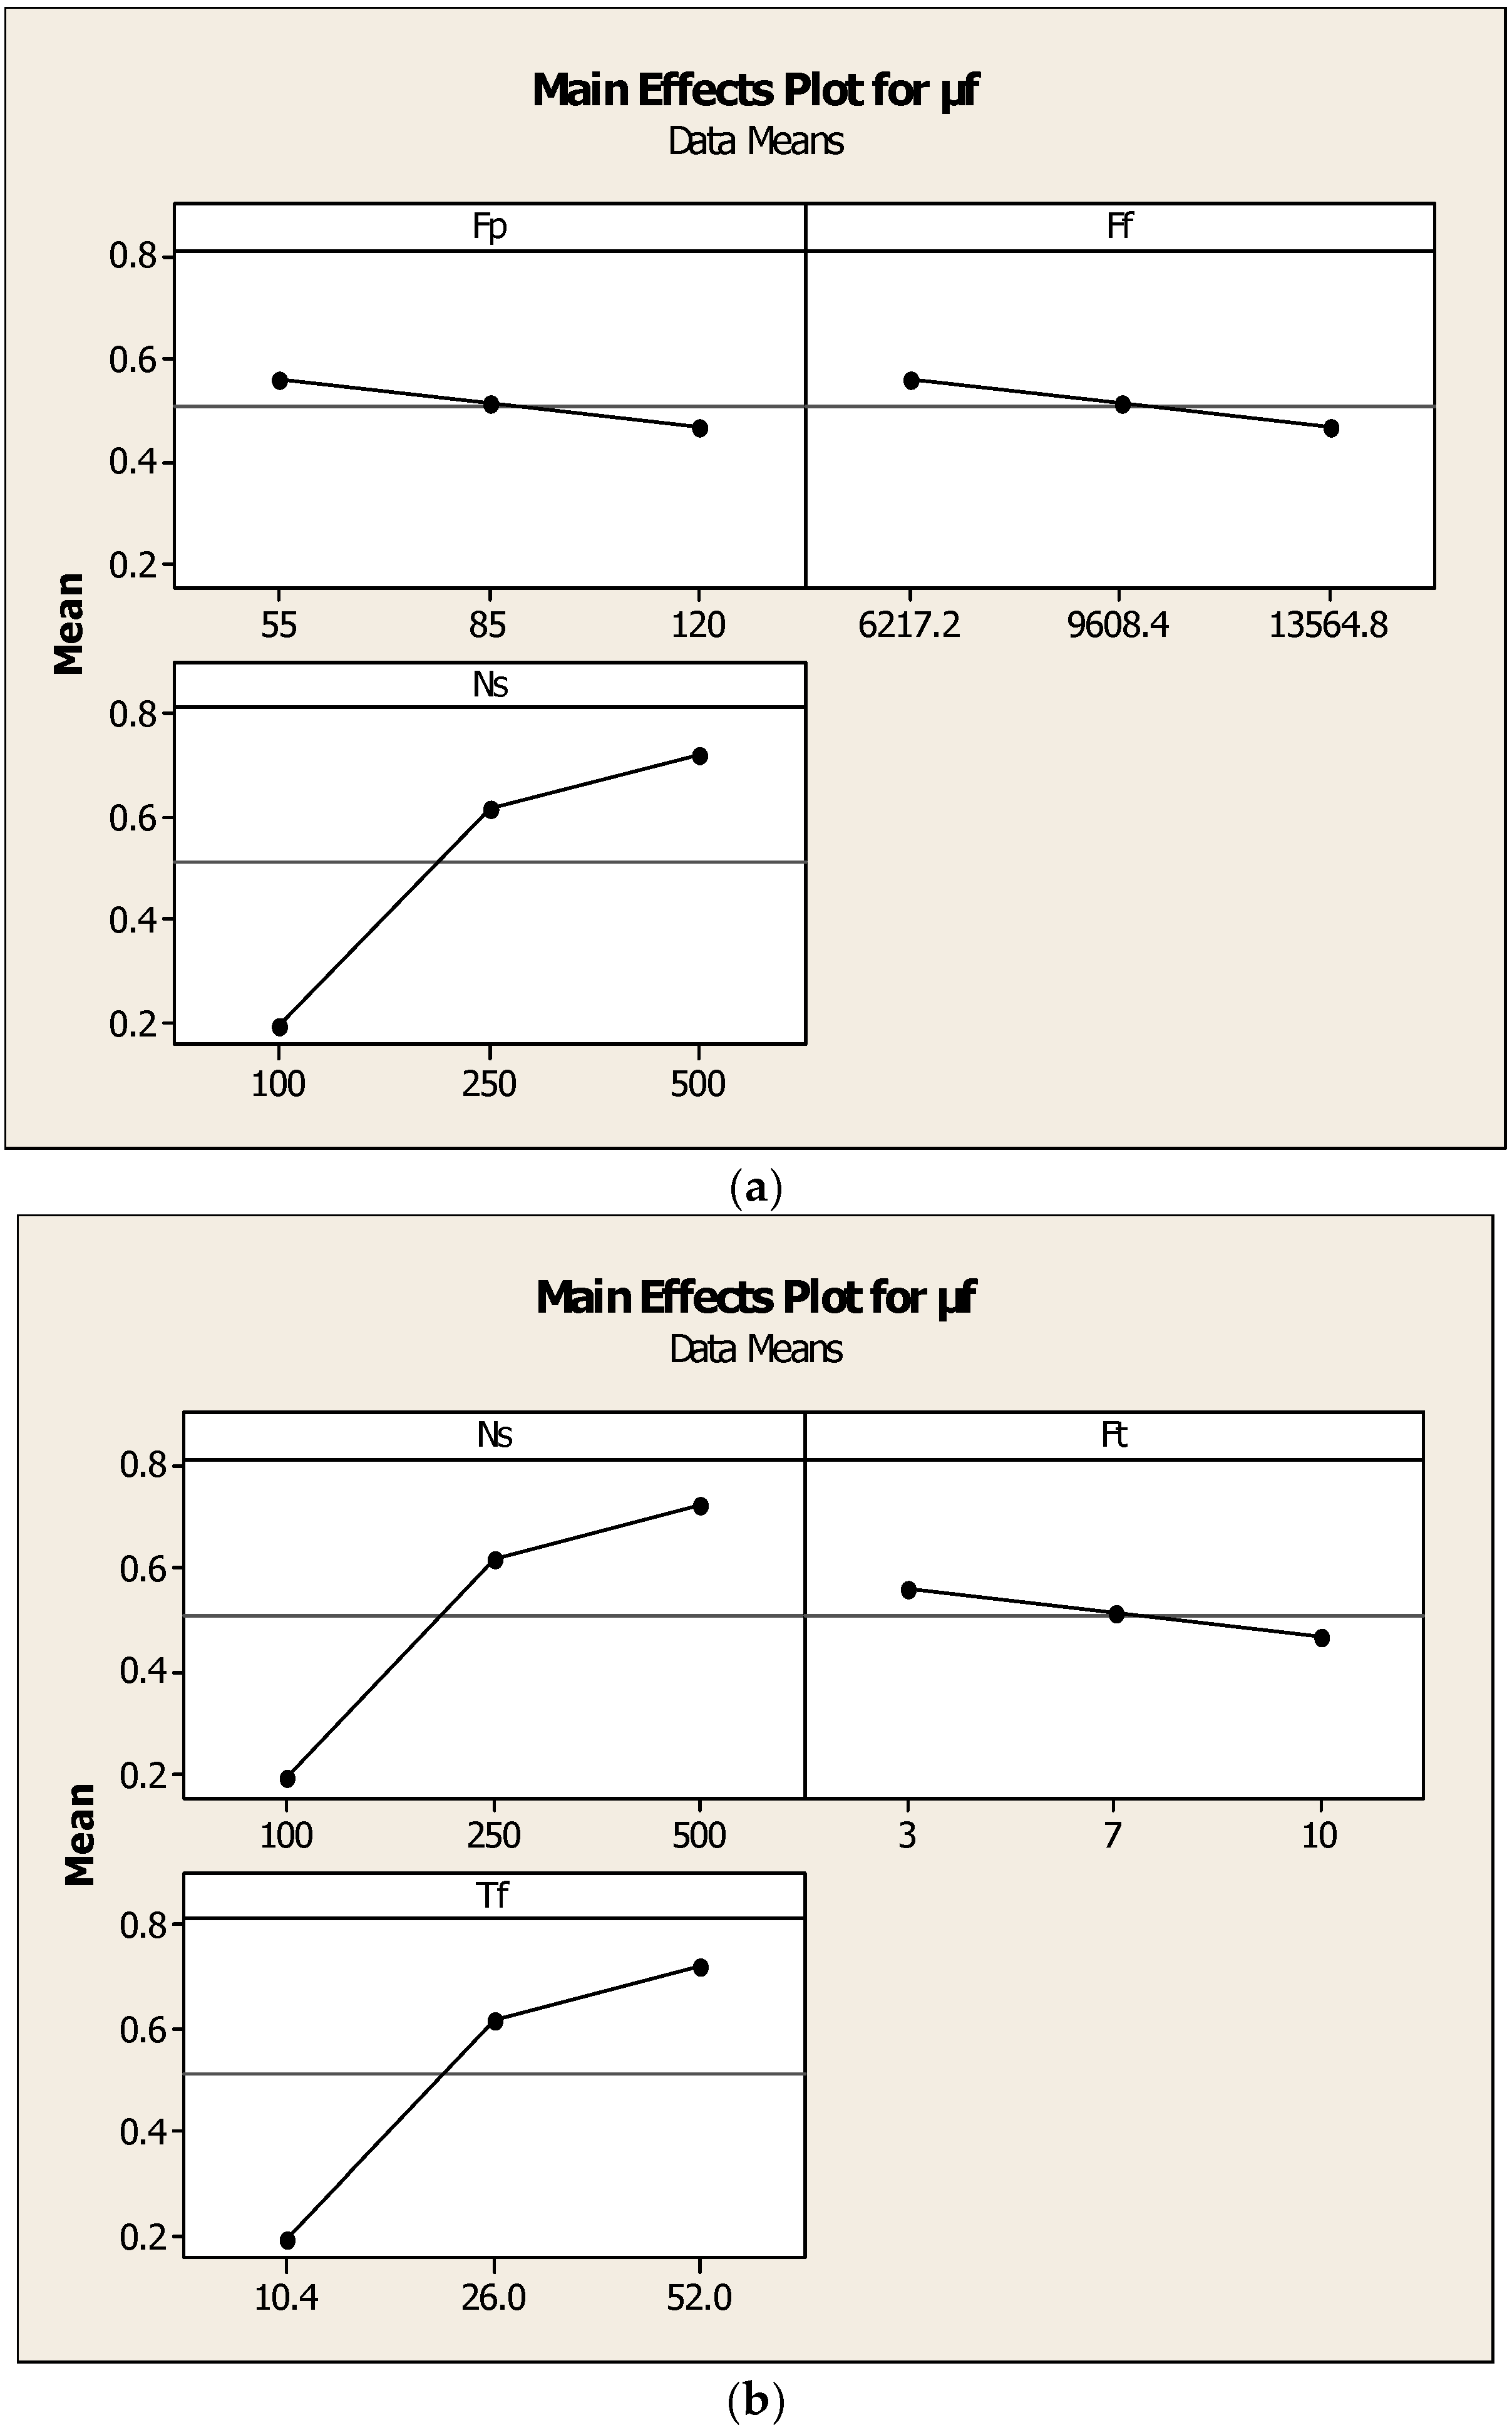
Figure 11.
(a) Effect of speed, friction pressure. (b) Effect of speed, friction torque, and friction force on .
Figure 11.
(a) Effect of speed, friction pressure. (b) Effect of speed, friction torque, and friction force on .
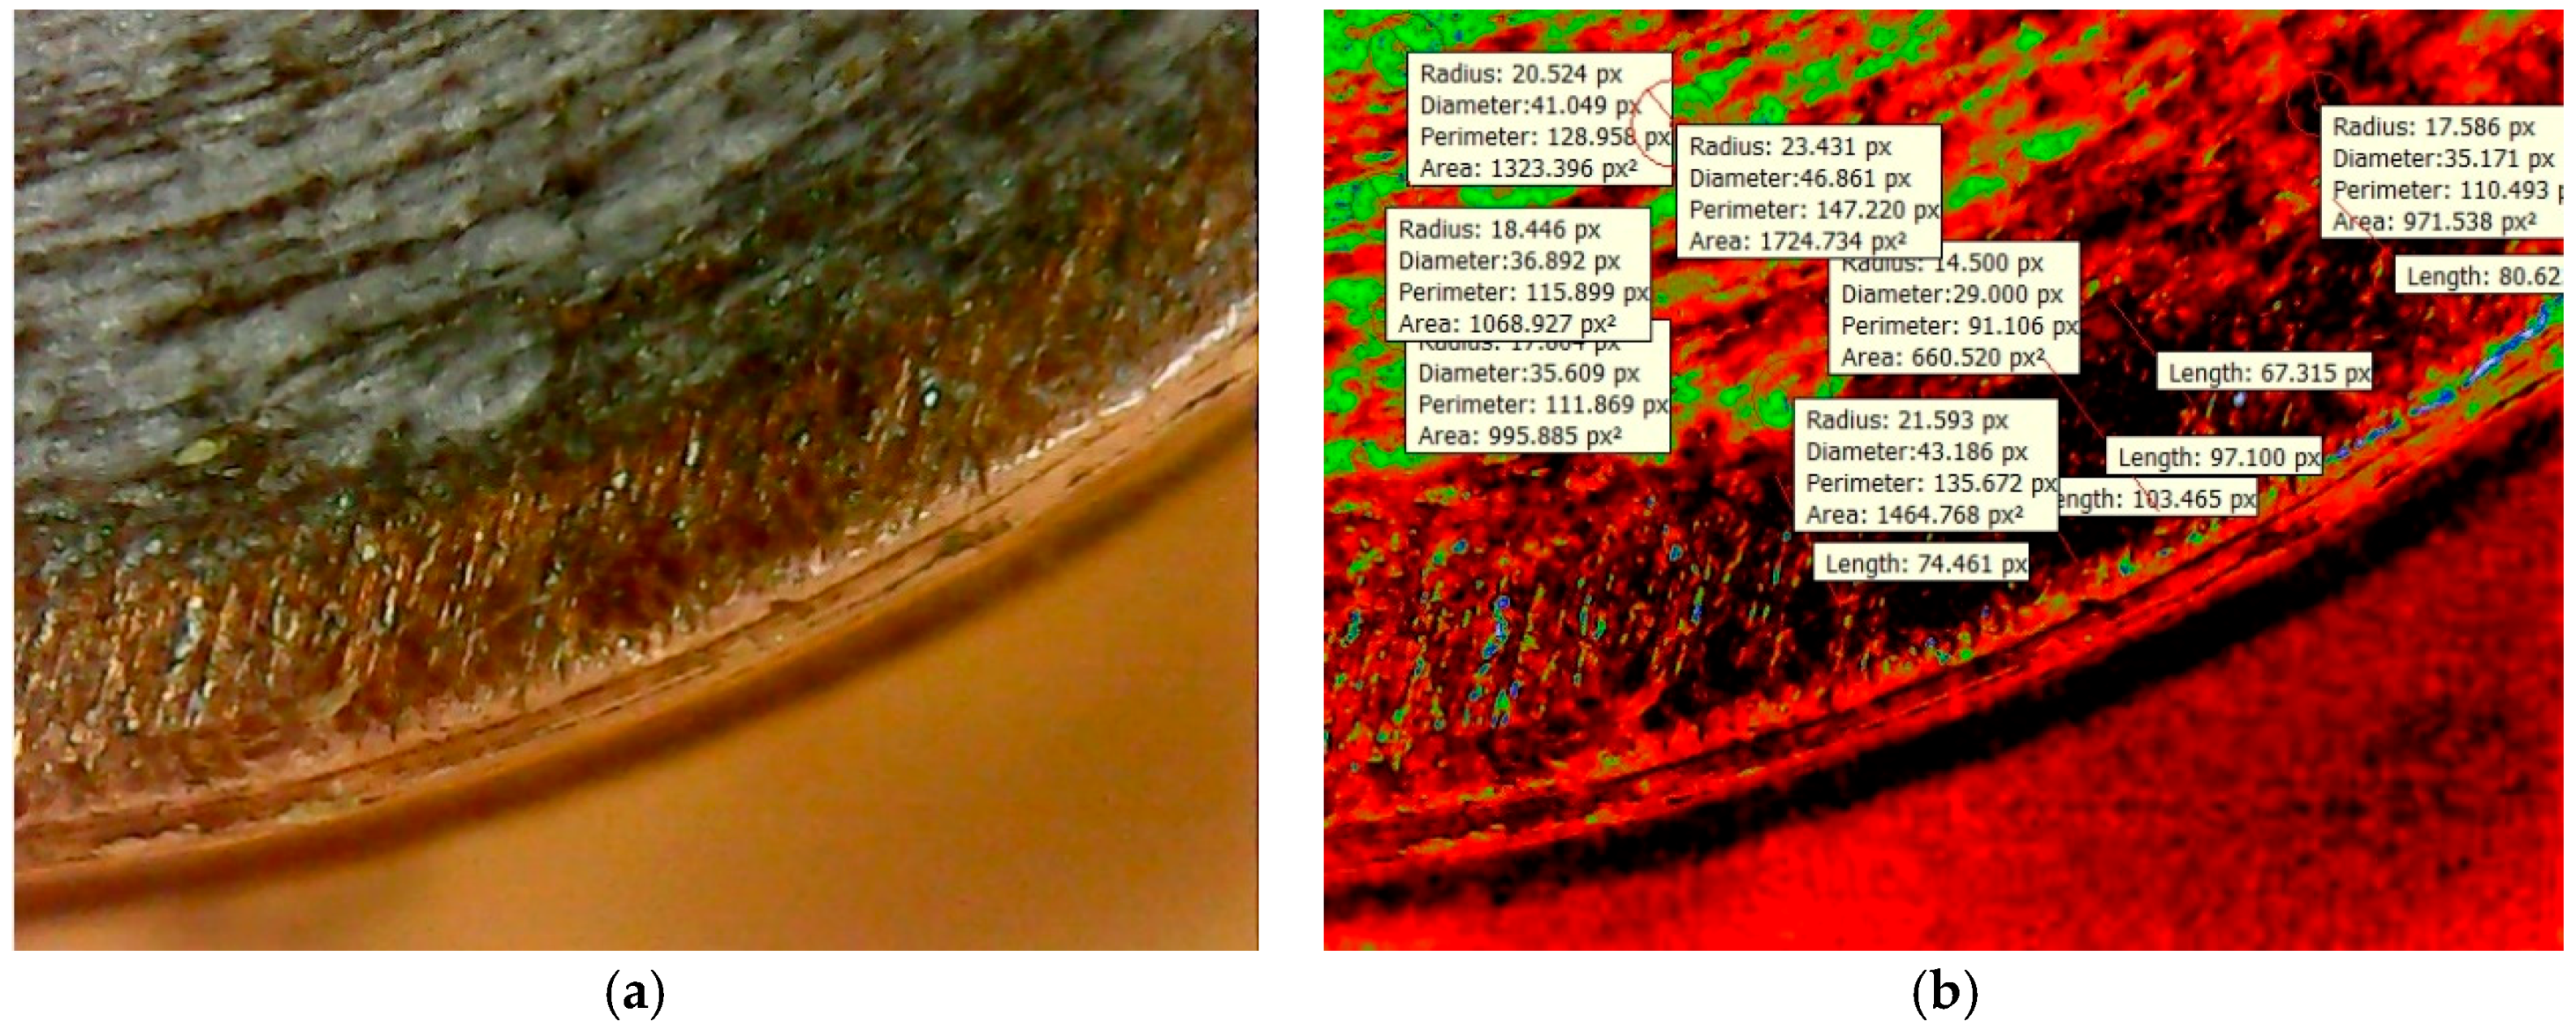
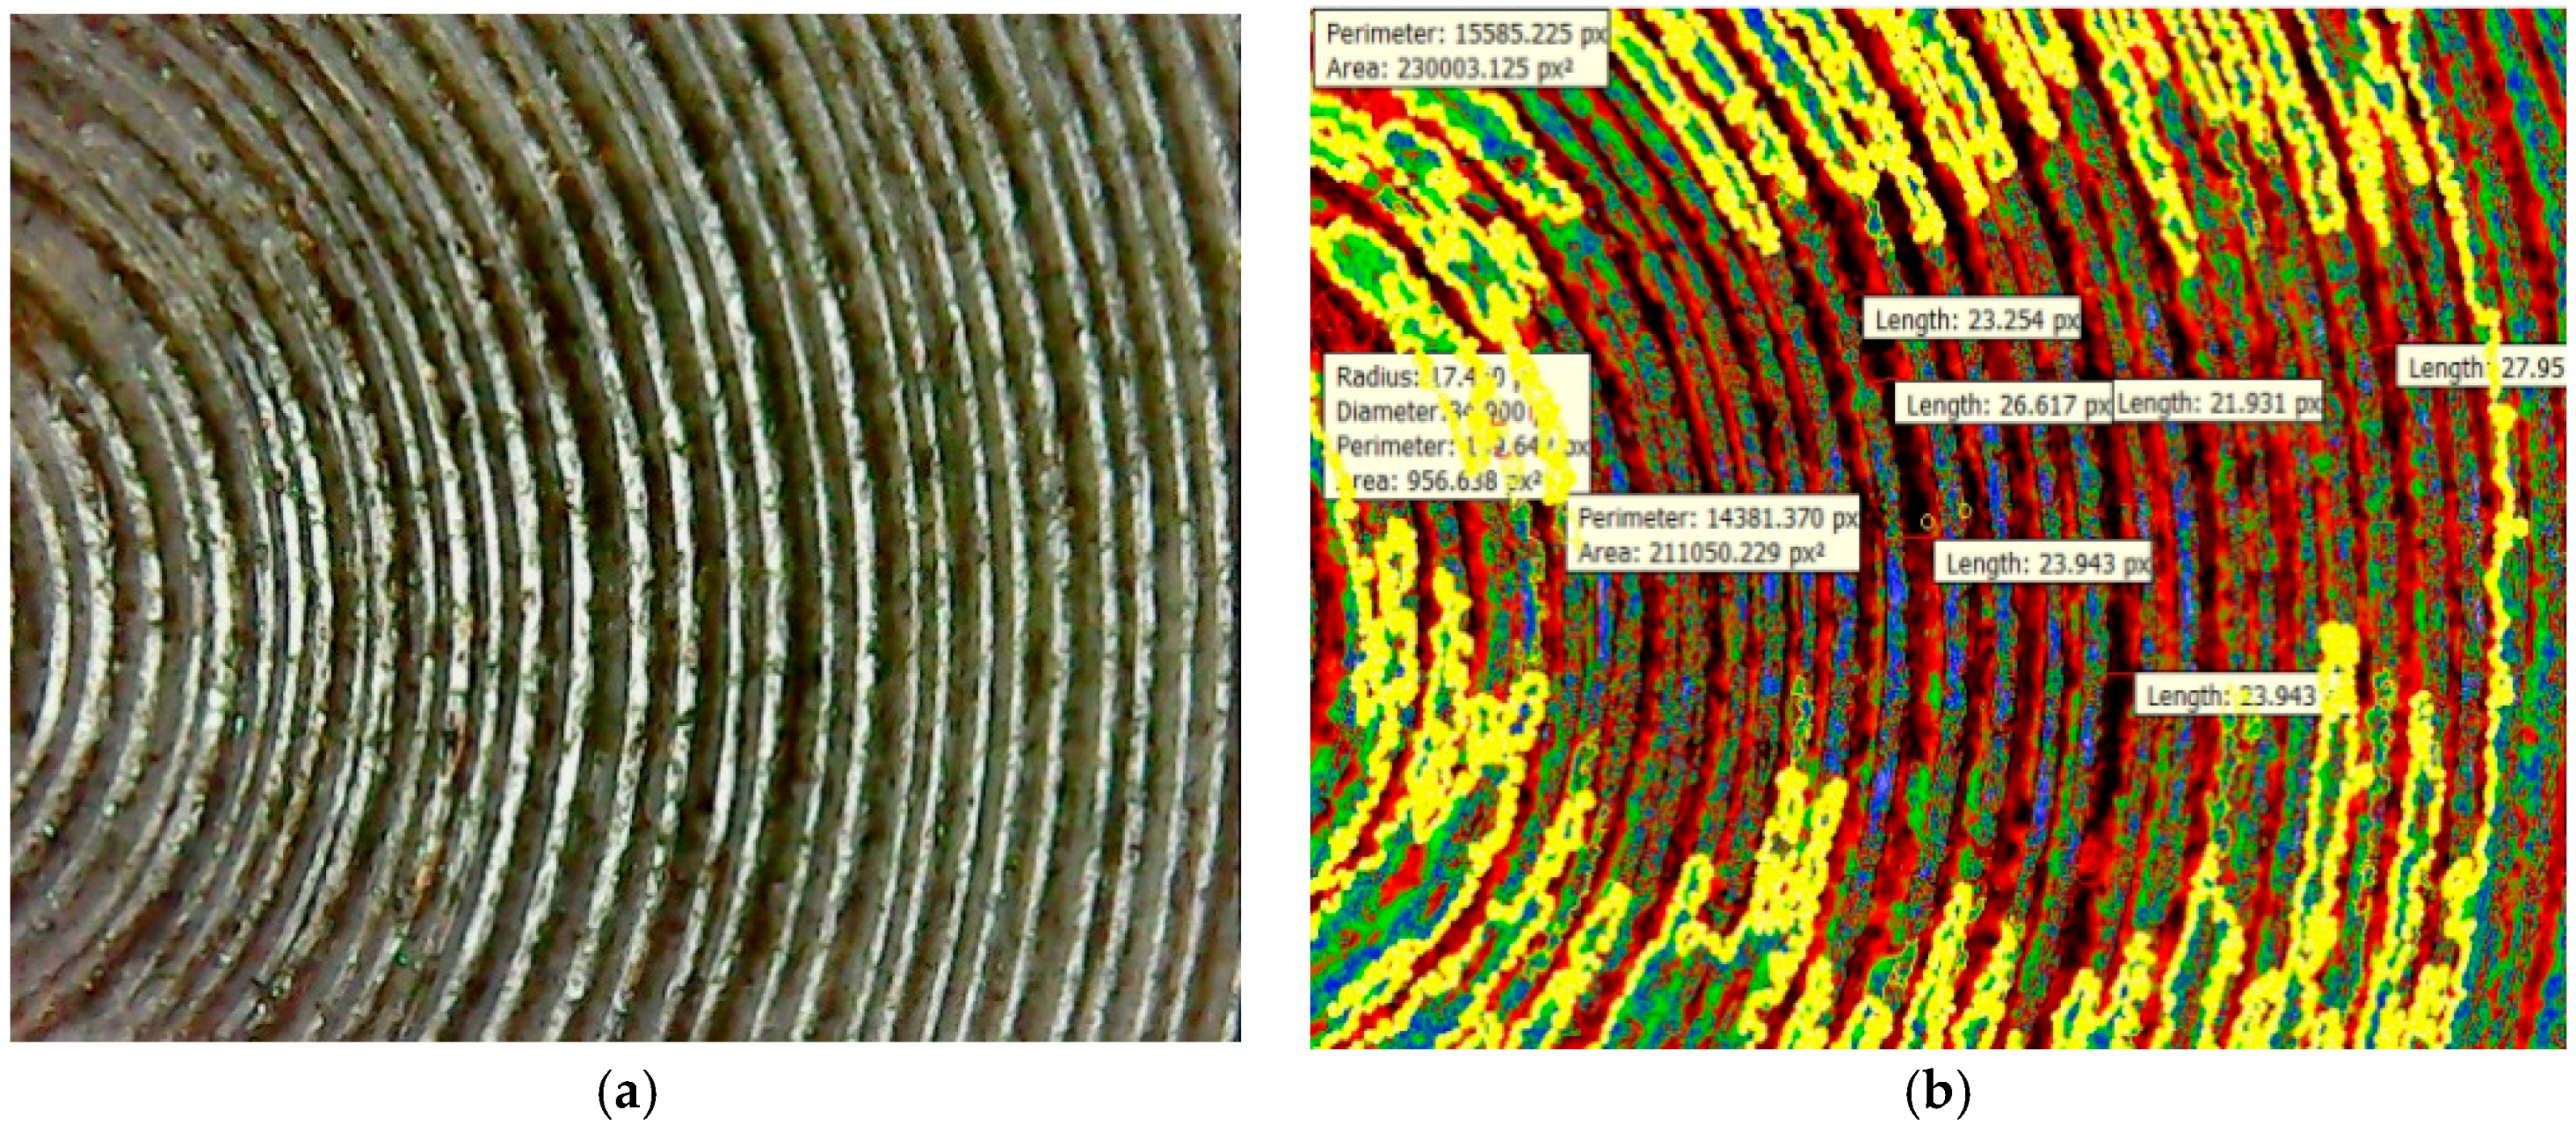
Figure 12.
(a) Friction welded tracks at the welded interface. (b) Segment based analysis image.
Figure 12.
(a) Friction welded tracks at the welded interface. (b) Segment based analysis image.
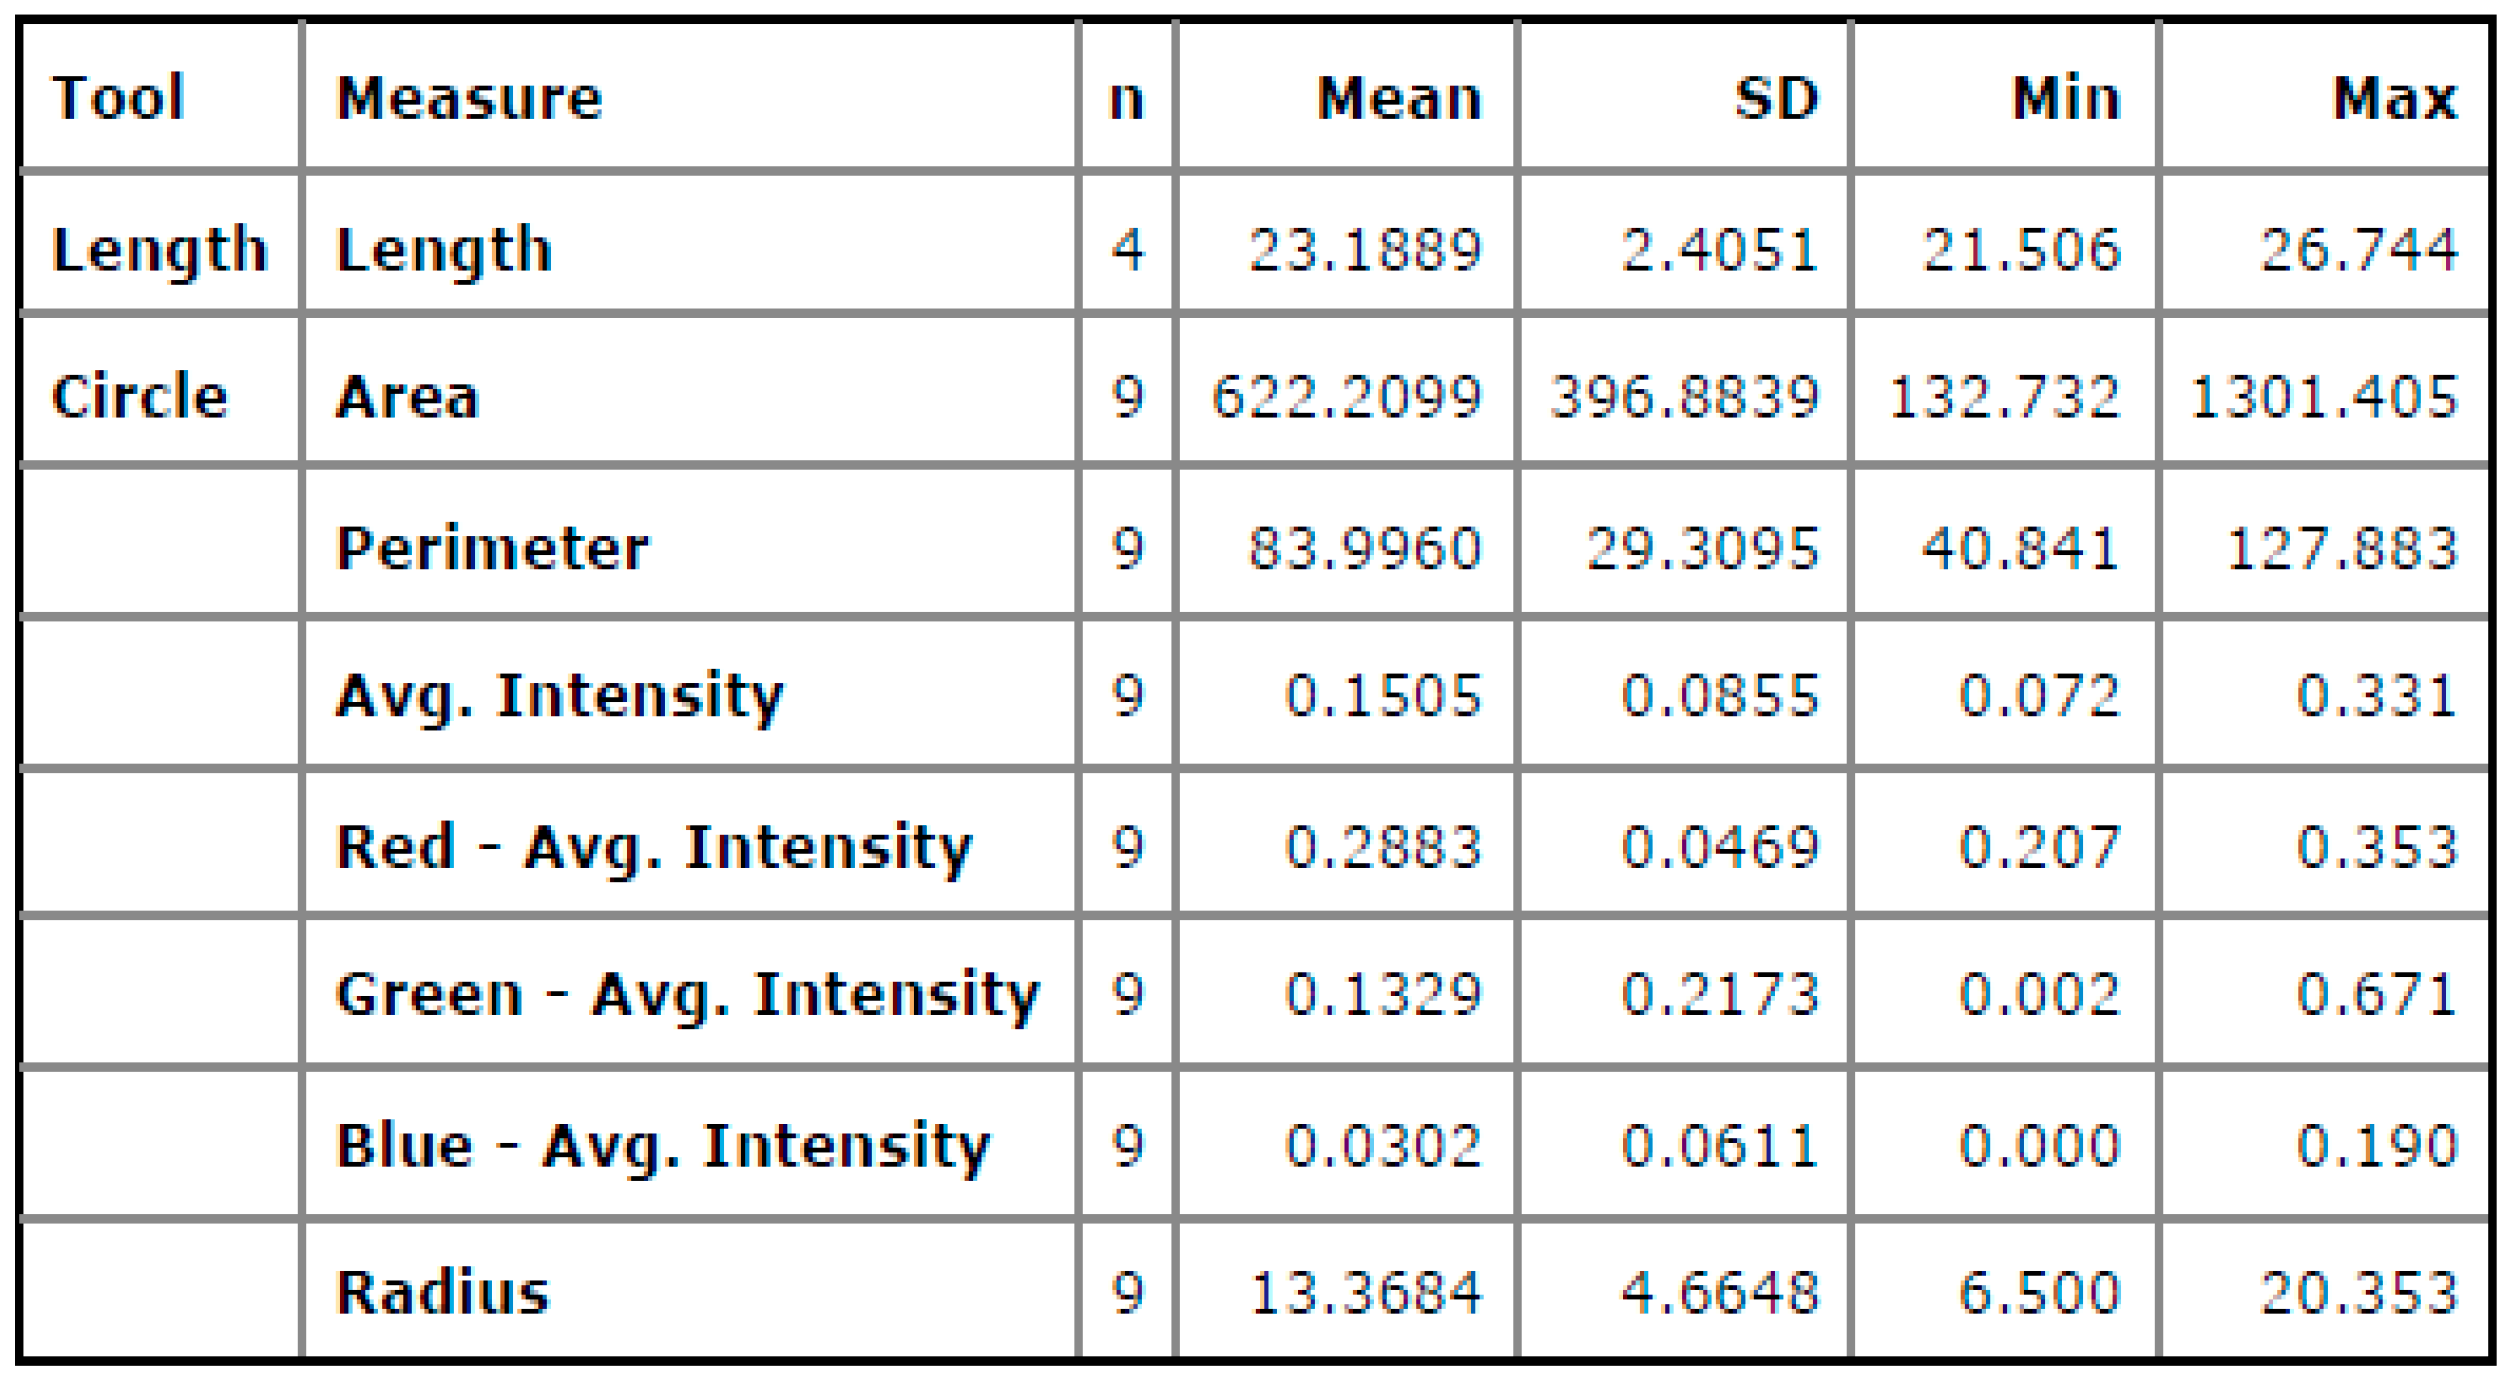
Figure 13.
Screen shot of the statistical measurements of the segments at the optimized parameters.
Figure 13.
Screen shot of the statistical measurements of the segments at the optimized parameters.
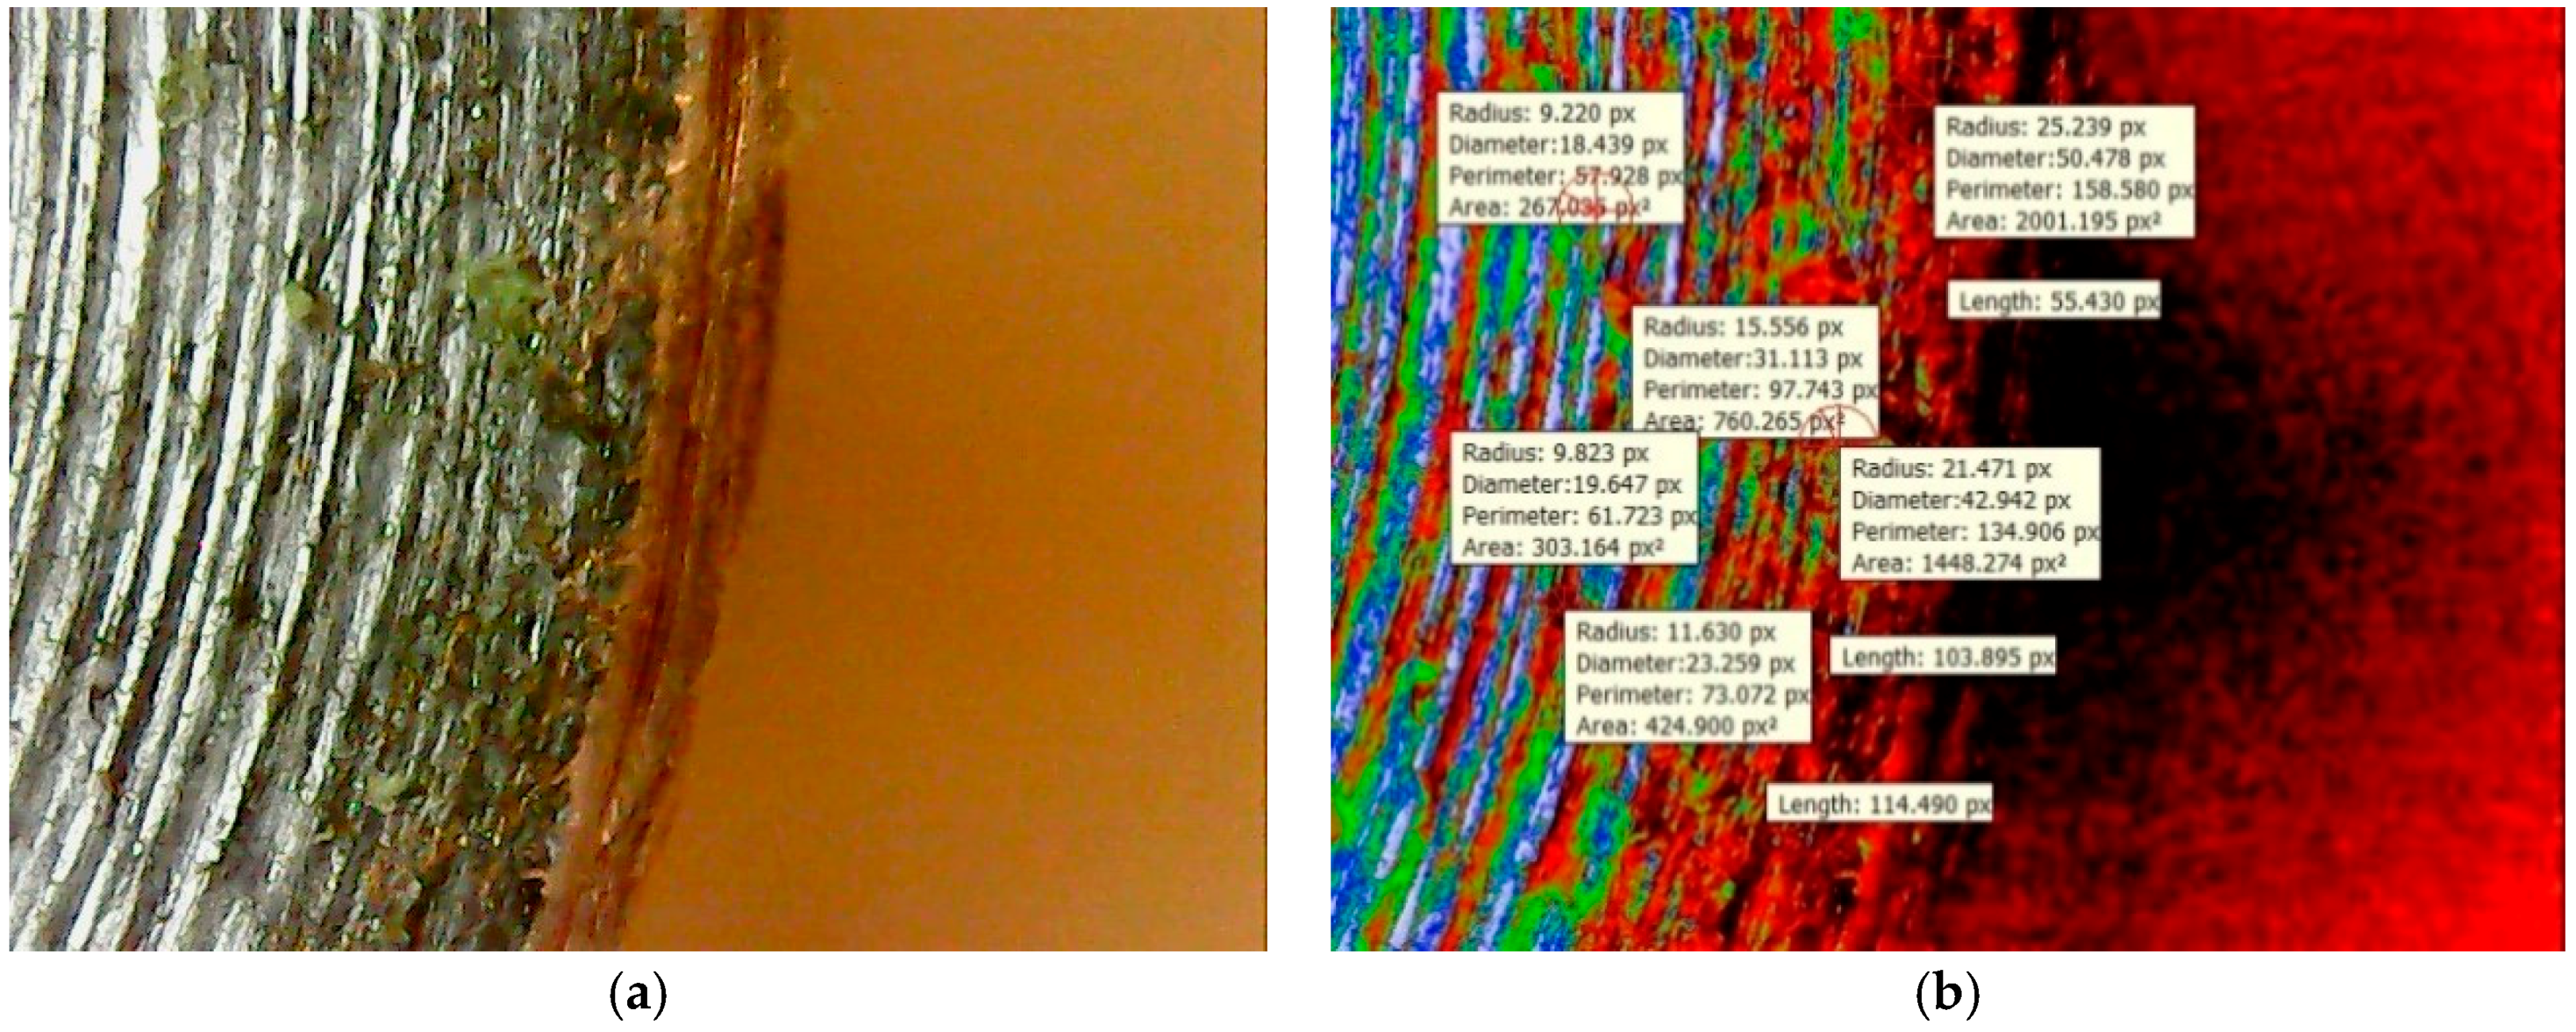
Figure 14.
(a) Al-Cu fractured surface of the welded interface. (b) Segment based analysis of the fracture surface.
Figure 14.
(a) Al-Cu fractured surface of the welded interface. (b) Segment based analysis of the fracture surface.
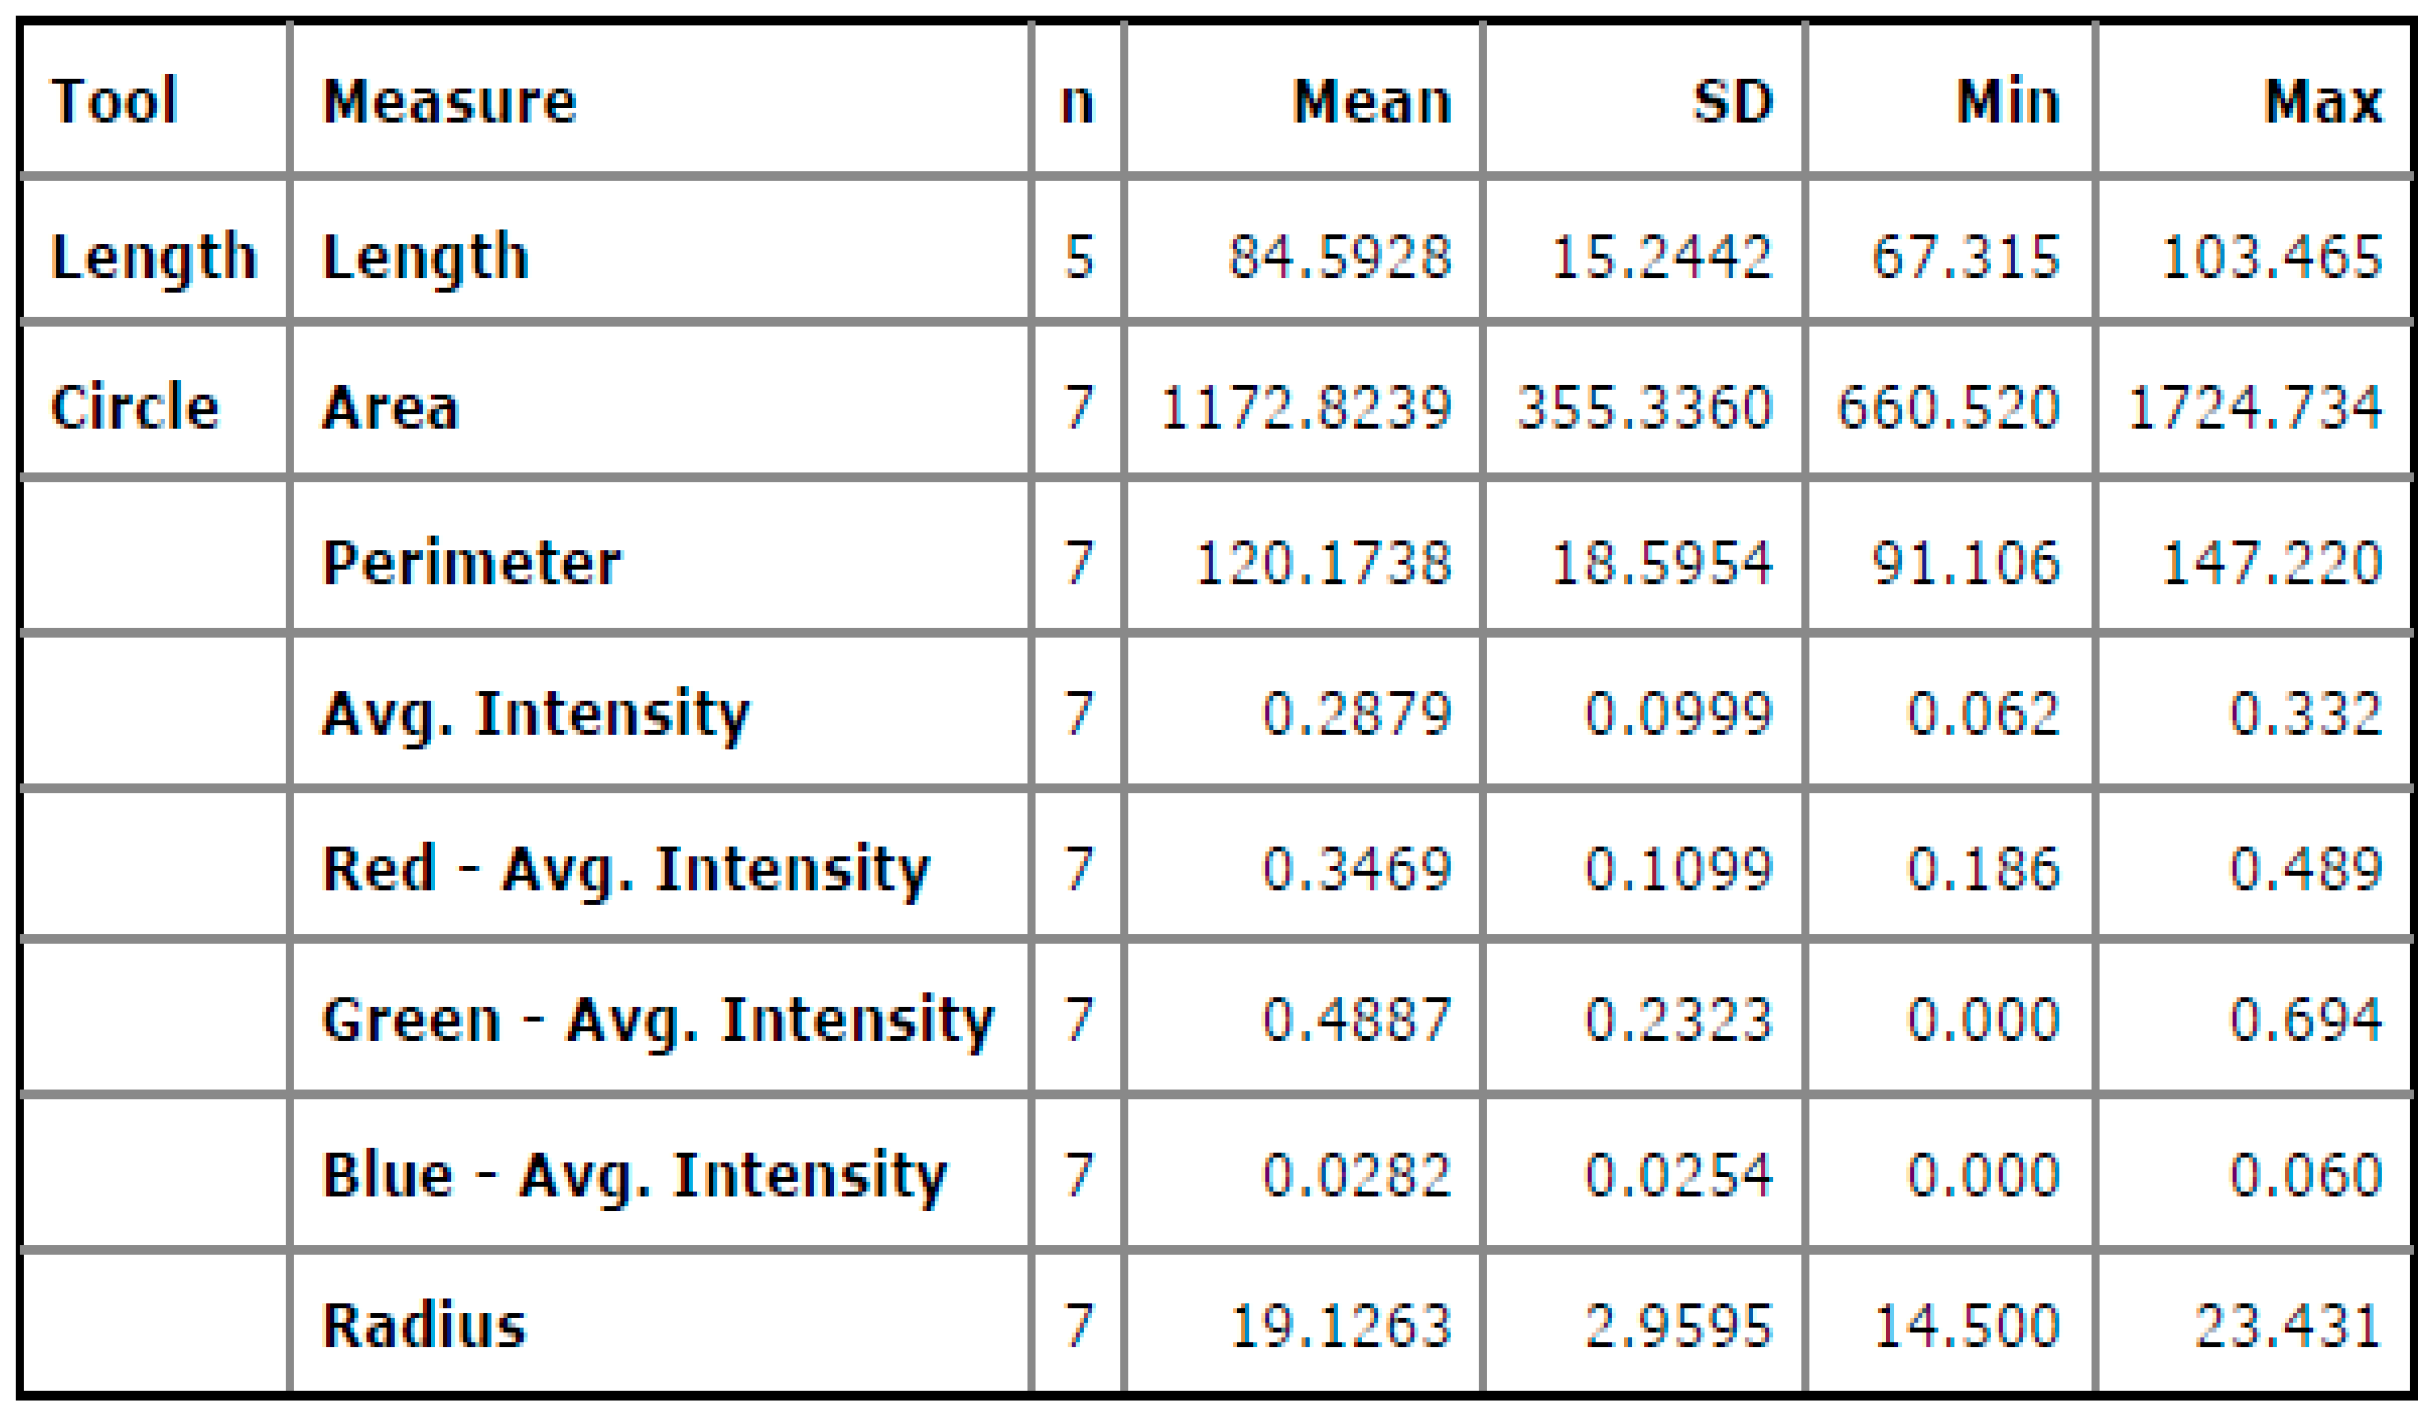
Figure 15.
Screen shot of the statistical measurements of the segments at the fractured surface.
Figure 15.
Screen shot of the statistical measurements of the segments at the fractured surface.
Figure 16.
(a) Al-Cu welded interface at the edge. (b) Segment based analysis of the crack length.
Figure 16.
(a) Al-Cu welded interface at the edge. (b) Segment based analysis of the crack length.
Figure 17.
(a) Peaks and valleys at Al-Cu interface. (b) Segment based analysis of the welded region.
Figure 17.
(a) Peaks and valleys at Al-Cu interface. (b) Segment based analysis of the welded region.
Table 1.
Chemical composition of Al-Cu dissimilar metals used in the FW process (weight %).
Table 1.
Chemical composition of Al-Cu dissimilar metals used in the FW process (weight %).
| Metal | Si | Cu | Fe | Mn | Ni | Mg | Sn | Zn | Pb | Al |
|---|
| Al | 0.85 | 0.35 | 0.2 | 0.05 | 0.05 | 0.03 | 0.03 | 0.3 | - | Remaining content |
| Cu | - | Balance | 0.04 | 0.05 | 0.05 | 1.83 | 0.03 | 0.06 | 0.04 | - |
Table 2.
Mechanical properties of metals used in the friction welding experiment.
Table 2.
Mechanical properties of metals used in the friction welding experiment.
| Metal | Density, g/cm3 | Tensile Strength, MPa | Young’s Modulus, GPa | Brinell Hardness |
|---|
| Cu | 8.9 | 220 | 104 | 75 |
| Al | 2.7 | 170 | 78 | 48 |
Table 3.
Friction welding factors and their design levels.
Table 3.
Friction welding factors and their design levels.
| S. No | Factors | Symbol | Units | Levels |
|---|
| - | −1 | 0 | 1 |
| Low | Middle | High |
| 1 | Friction Force | | N | 6217.2 | 9608.4 | 13,564.8 |
| 2 | Speed | | RPM | 100 | 500 | 1000 |
| 3 | Friction Pressure | | MPa | 55 | 85 | 120 |
| 4 | Friction Time | | s | 3 | 7 | 10 |
Table 4.
L-9 Array for the design of the experiments.
Table 4.
L-9 Array for the design of the experiments.
| Experiment. No | Actual Values | Coded Values | Output Response |
|---|
| | | | | | | |
|---|
| 1 | 100 | 55 | 3 | −1 | −1 | −1 | 0.27 | 1727 |
| 2 | 250 | 85 | 7 | 1 | −1 | −1 | 0.45 | 6672 |
| 3 | 500 | 120 | 10 | −1 | 1 | −1 | 0.63 | 18,840 |
| 4 | 250 | 55 | 3 | 1 | 1 | −1 | 0.70 | 4317.5 |
| 5 | 500 | 85 | 7 | −1 | −1 | −1 | 0.90 | 2239.8 |
| 6 | 100 | 120 | 10 | 1 | −1 | −1 | 0.12 | 3768 |
| 7 | 250 | 55 | 3 | −1 | 1 | −1 | 0.70 | 4317.5 |
| 8 | 100 | 85 | 7 | 1 | 1 | −1 | 0.18 | 2669 |
| 9 | 500 | 120 | 10 | −1 | −1 | 1 | 0.64 | 18,840 |
Table 5.
Central composite design.
Table 5.
Central composite design.
| Factors | 3 |
| Base runs | 20 |
| Base blocks | 1 |
| Two-level factorial | Full factorial |
| Cube points | 8 |
| Center points in cube | 6 |
| Axial points | 6 |
| Center points in axial | 0 |
| Alpha | 1.68179 |
| Replicates | 1 |
| Total runs | 20 |
| Total blocks | 1 |
Table 6.
Critical friction welding parameters used in the experiments.
Table 6.
Critical friction welding parameters used in the experiments.
| Runs | | | | | | | | |
|---|
| 1 | 55 | 6217.2 | 10.4 | 3 | 100 | 17.3 | 0.27 | 1727 |
| 2 | 85 | 9608.4 | 26 | 7 | 250 | 108.34 | 0.45 | 6672 |
| 3 | 120 | 13,564.8 | 52 | 10 | 500 | 433.34 | 0.63 | 18,840 |
| 4 | 55 | 6217.2 | 26 | 3 | 250 | 108.34 | 0.70 | 4317.5 |
| 5 | 85 | 9608.4 | 52 | 7 | 500 | 433.34 | 0.90 | 2239.8 |
| 6 | 120 | 13,564.8 | 10.4 | 10 | 100 | 17.3 | 0.12 | 3768 |
| 7 | 55 | 6217.2 | 26 | 3 | 250 | 108.34 | 0.70 | 4317.5 |
| 8 | 85 | 9608.4 | 10.4 | 7 | 100 | 17.3 | 0.18 | 2669 |
| 9 | 120 | 13,564.8 | 52 | 10 | 500 | 433.34 | 0.64 | 18,840 |
Table 7.
Regression equation coefficients.
Table 7.
Regression equation coefficients.
| Predictor | Coef | SE Coef | T | P |
|---|
| Constant | 0.53517 | 0.09138 | 5.86 | 0.001 |
| −0.00555 | 0.001098 | −5.052 | 0.002 |
| 0.015471 | 0.001700 | 9.10 | 0.000 |
Table 8.
Analysis of variance.
Table 8.
Analysis of variance.
| Source | DF | SS | MS | F | P |
|---|
| Regression | 2 | 0.5396 | 0.26982 | 42.42 | 0.000 |
| Residual Error | 6 | 0.0381 | 0.00636 | - | - |
| Total | 8 | 0.5778 | - | - | - |
Table 9.
Regression equation coefficients.
Table 9.
Regression equation coefficients.
| Predictor | Coef | SE Coef | T | P |
|---|
| Constant | 0.4878 | 0.2319 | 2.10 | 0.089 |
| −0.000031 | 0.00007 | −0.42 | 0.693 |
| 0.00160 | 0.00019 | 8.35 | 0.000 |
| −0.0180 | 0.0800 | −0.23 | 0.830 |
Table 10.
Analysis of variance.
Table 10.
Analysis of variance.
| Source | DF | SS | MS | F | P |
|---|
| Regression | 3 | 0.540 | 0.180 | 23.82 | 0.002 |
| Residual Error | 5 | 0.037 | 0.007 | - | - |
| Total | 8 | 0.577 | - | - | - |
Table 11.
Regression equation coefficients.
Table 11.
Regression equation coefficients.
| Predictor | Coef | SE Coef | T | P |
|---|
| Constant | 0.4878 | 0.2319 | 2.10 | 0.089 |
| −0.00003199 | 0.000076 | −0.4 | 0.69 |
| 0.0016098 | 0.00019 | 8.35 | 0.000 |
| −0.01808 | 0.080 | −0.2 | 0.83 |
Table 12.
Analysis of variance.
Table 12.
Analysis of variance.
| Source | DF | SS | MS | F | P |
|---|
| Regression | 3 | 0.5400 | 0.18001 | 23.82 | 0.002 |
| Residual Error | 5 | 0.0377 | 0.00756 | - | - |
| Total | 8 | 0.5778 | - | - | - |
Table 13.
Regression equation coefficients.
Table 13.
Regression equation coefficients.
| Predictor | Coef | SE Coef | T | P |
|---|
| Constant | −0.2055 | 0.1228 | −1.67 | 0.155 |
| −0.000018 | 0.0000061 | −2.97 | 0.031 |
| −0.003039 | 0.0009467 | −3.21 | 0.024 |
| 0.004981 | 0.001012 | 4.92 | 0.004 |
Table 14.
Analysis of variance.
Table 14.
Analysis of variance.
| Source | DF | SS | MS | F | P |
|---|
| Regression | 3 | 0.5416 | 0.1805 | 25.00 | 0.002 |
| Residual Error | 5 | 0.03612 | 0.00722 | - | - |
| Total | 8 | 0.57780 | - | - | - |
Table 15.
Regression equation coefficients.
Table 15.
Regression equation coefficients.
| Predictor | Coef | SE Coef | T | P |
|---|
| Constant | 0.4775 | 0.1088 | 4.39 | 0.007 |
| −0.00000696 | 0.00000708 | −0.98 | 0.371 |
| −0.004767 | 0.001360 | −3.51 | 0.017 |
| 0.016785 | 0.002167 | 7.75 | 0.001 |
Table 16.
Analysis of variance.
Table 16.
Analysis of variance.
| Source | DF | SS | MS | F | P |
|---|
| Regression | 3 | 0.54581 | 0.18194 | 28.44 | 0.001 |
| Residual Error | 5 | 0.03199 | 0.00640 | - | - |
| Total | 8 | 0.57780 | - | - | - |

 ,
, 


