Article

Thermal Decomposition and Thermal Reaction Process of PTFE/Al/MnO2 Fluorinated Thermite

College of Field Engineering, PLA Army Engineering University, Nanjing 210001, China
*
Authors to whom correspondence should be addressed.
Materials 2018, 11(12), 2451; https://doi.org/10.3390/ma11122451
Submission received: 15 November 2018 / Revised: 28 November 2018 / Accepted: 29 November 2018 / Published: 3 December 2018
(This article belongs to the Section Energy Materials)

Abstract

:
To better understand the thermal decomposition and reaction process of a fluorine-containing powdery thermite, PTFE/Al/MnO2, reactions at different temperatures were investigated by the TG/DSC-MS technique. The corresponding reaction products were characterized with XRD phase analysis. Another three thermite materials, i.e., PTFE/Al, Al/MnO2, and PTFE/MnO2, were also prepared for comparison. Results showed that PTFE behaved as both oxidizer and reducer in PTFE/Al/MnO2 fluorinated thermite. The thermal decomposition and reaction process of as-fabricated ternary thermite could be divided into two stages—the mutual reaction between each of PTFE, Al, and MnO2 and the subsequent reaction produced between Al and Mn2O3/Mn3O4/MnF2. Compared with the three control systems, the specially designed ternary system possessed a shorter reaction time, a faster energy release rate, and a better heat release performance.

1. Introduction

Reactive materials can explode, deflagrate, and release a huge amount of chemical energy under impact. A typical representative of reactive materials [1], thermite features high energy, high density, flexible formulation, and a high adiabatic temperature. Conventional aluminothermic agents commonly comprise Al as the fuel and metal oxides (Fe2O3, MoO3, CuO, Bi2O3, MnO2, etc.) as the oxidant. However, the limited extent of a combination between an oxidant and a reductant can result in a low reaction rate, a smaller amount of actual heat release, an unconcentrated reaction process, a high initial temperature (>900 °C), a low energy release rate, and a compromised mechanical strength [2].
Research on fluorine-containing aluminothermic agents has received extensive attention recently. Due to a strong elemental electronegativity, fluorine atoms tend to lose the outermost electrons and become highly oxidizing. Polytetrafluoroethylene (PTFE) is a commercial fluorine-containing polymer [3,4,5,6] with a fluorine content of 76 wt.% [7]. For traditional oxide-based aluminothermic agents, Al and oxides react mostly in a condensed phase, whereas the addition of PTFE as a binder can trigger a redox reaction between PTFE and Al to yield AlF3. Studying the application of fluorinated polymers in thermite, Li [8] found that the low boiling point of AlF3 could prevent it from covering the Al particle surface and hindering the reaction. Puts and Crouse [9] investigated the effect of metal fluoride on PTFE decomposition, concluding that the catalytic effect of AlF3 could accelerate the reaction process and further promote the decomposition by inducing a 30 °C drop for the reaction temperature. In the meantime, the promotion effects exerted by PTFE were also reported for the thermal reaction, including a faster energy release, a higher flame temperature, and a greater reaction pressure of the thermite [10,11,12,13]. The addition of PTFE as a binder or matrix can magnify the original advantages, e.g., a high energy density and a high adiabatic temperature, and improve the mechanical strength of conventional powdered aluminothermic agents; the reaction materials will exhibit a better energy release as well. Furthermore, an as-fabricated damage element outperforms the inert one with its flexible formula, high oxygen carrying capacity, impact-based initiation, and its capability of generating a large number of elemental C (carbon) short circuit electronic components. At present, the research focus has been gradually shifting from thermal decomposition and reaction processes in traditional studies to the combustion performance of fluorine-containing thermites [5,14].
In this work, PTFE/Al/MnO2, a powdery fluorinated aluminothermic agent, was successfully fabricated by referring to the traditional aluminum heat agent and adding PTFE as a binder or matrix. Meanwhile, PTFE/Al, Al/MnO2, and PTFE/MnO2 were also prepared for comparison. Thermogravimetric (TG) analysis, differential scanning calorimetry (DSC), and mass spectrometry (MS) were used to analyze the reaction processes at different temperatures, while X-ray diffraction (XRD) was employed for the residue characterization. This study aims at providing practical guidance for the fluorination treatment of traditional thermites.

2. Experimental Section

2.1. Sample Preparation

PTFE (average particle size of 25 μm) was purchased from Shanghai 3F New Materials Co., Ltd. (Shanghai, China), Al powder (average particle size of 1–2 μm) was provided by Jintian Aluminum High-Tech Co., Ltd. (Luxi, Hunan, China) and MnO2 powder (average particle size of 3–5 μm) were commercially available at Europe Nano Technology Co., Ltd. (Shanghai, China). The formulations of the four materials prepared, i.e., PTFE/Al, Al/MnO2, PTFE/MnO2, and PTFE/Al/MnO2, are listed in Table 1.
The samples were prepared with the following procedure. First, the powder of various raw materials was added to a beaker at a designated ratio, followed by the addition of an appropriate amount of ethanol absolute. After the initial dispersion via 20 min stirring, the beaker was transferred into an ultrasonic system and kept for 30 min. The water bath was refreshed every 5 min during ultrasonication to prevent the solution from overheating and further triggering the reaction. The samples obtained were then dried in a vacuum oven at 60 °C for 48 h. Finally, the dried powder was sieved to produce uniform powdery materials.

2.2. Experimental Process

A combined testing system of thermogravimetry-differential scanning calorimetry (TG-DSC, NETZSCH-STA449C, NETZSCH, Bavaria, Germany) and mass spectrometry (MS, NETZSCH-QMS403C, NETZSCH, Bavaria, Germany) served as the primary analytical method for thermal decomposition and reaction processes of the four samples. Gas products were introduced into the mass spectrometer through a capillary tube, and their composition changes were monitored and recorded at different temperatures from 25 °C to 1000 °C with a fixed heating rate of 10 °C/min. To prevent air from participating in the reaction, experiments were carried out in a highly pure argon atmosphere with argon purging at 30 mL/min. Meanwhile, the capillary temperature was set at 200 °C to avoid gases cooling down within the capillary tube. The solid residues thermally analyzed at different temperatures were recovered and their phase composition was characterized with X-ray diffraction (XRD, Bruker D8 ADVANCE, Bruker, Berlin, Germany). The samples were scanned from 5° to 90° (2θ) at a scan step of 0.02°.

3. Results and Discussion

To develop a better understanding of the specific processes for the thermal decomposition and the reaction of PTFE/Al/MnO2 powdery thermite, the reaction processes of PTFE/Al, Al/MnO2, and PTFE/MnO2 at different temperatures should be analyzed in advance.

3.1. Thermal Decomposition and Thermal Reaction Processes of PTFE/Al

The TG-DSC curves recorded for the PTFE/Al thermal decomposition are depicted in Figure 1, in which a total of five peaks can be observed on the DSC curve. Peak A covers a temperature range from 323.2 °C to 358.1 °C, where no change shows up on the TG curve; it stands for the melting endotherm of PTFE (PTFE shows a melting point at 327 °C [15]). The TG curve suggests that the sample weight dropped sharply from 509 °C; meanwhile, C2F4+ ions (m/z = 100, Figure 2) were detected by mass spectrometry. Thus, peak B appearing then on the DSC curve should result from the endothermic decomposition of PTFE with C2F4 as the primary decomposition product. As for peak C, which begins at 597.9 °C and ends at 607 °C, it is attributed to the exothermic reaction between micron Al and PTFE decomposition products [3] that yielded AlF3 and C (carbon). Peaks B and C are actually the superimposed results of the endothermic PTFE decomposition and the exothermic PTFE/Al reaction. According to the MS spectrum presented in Figure 2, C2F4+ was produced and accumulated at 513 °C and then largely depleted due to its reaction with Al. However, since more AlF3 were produced, a mounting catalytic effect on PTFE decomposition [9] was exerted, which raised the C2F4+ content again to the peak value of 574 °C. As the PTFE decomposition ended at 619 °C, the content of C2F4 reduced gradually to zero (Figure 2). Furthermore, the excessive Al melted at about 660 °C, which gave rise to the endothermic peak D on the DSC curve.
At about 780 °C, the TG curve shows a second decline with a mass loss of 2.21 wt.%, and the endothermic peak E appears on the DSC curve correspondingly. The sample composition then was supposed to be C (carbon black), AlF3, and excess Al, and the endothermic sublimation of AlF3 might account for the appearance of peak E. The TG-DSC curve recorded for the heating of neat AlF3 up to 1200 °C under the same conditions is further provided in Figure 3 for verification. As can be seen, AlF3 sublimation gave rise to a remarkable drop at 832 °C on the TG curve, accompanied with an endothermic peak B on the DSC curve. Therefore, peak E in Figure 1 should also be attributed to AlF3 sublimation at high temperature. The only difference was that the sublimation temperature of AlF3 in the PTFE/Al sample was 50 °C lower than that of the neat AlF3.
The products of the PTFE/Al reaction at different temperatures were further characterized with the XRD phase analysis. The XRD patterns are depicted in Figure 4, while the product composition is listed in Table 2. The results indicate that Al4C3 was synthesized from C and excess Al at high temperatures.

3.2. Thermal Decomposition and Thermal Reaction Process of Al/MnO2

Figure 5 presents the TG-DSC curves for the Al/MnO2 (30/70, w/w) thermal decomposition. MnO2 is chemically unstable and can decompose easily [16]. The two degradation stages on the TG curve correspond to the two-step decomposition process of MnO2 [17,18]. However, the appearance of two exothermic peaks, A and B, indicates that exothermic reactions still existed during the whole reaction process, and Figure 6b further suggests that the product consisted of Al, Mn2O3, and Mn3O4 after the reactions ending at 620 °C. Given that Mn2O3 decomposes into Mn3O4 at a temperature higher than 620 °C, the generation of Mn3O4 accompanied by heat release should be attributed to the reaction between Al and some MnO2—MnO2 has a stronger oxidizability than Mn2O3 and would react with Al preferentially. Al2O3, as a product, could not be detected by XRD due to its amorphous state or poor crystallinity [19]. Therefore, peaks A and B on the DSC curve were caused by the superposition of the Al/MnO2 reaction exotherm and the MnO2 decomposition endotherm. Moreover, peak C is assigned to the melting endotherm of excessive Al.
Peak D appearing later implies the existence of an exothermic reaction during the Mn2O3 decomposition, which ended as the temperature rose to about 800 °C. Meanwhile, the XRD patterns of the reaction products point out that the product components were Al, Mn3O4, and MnO, but without Mn2O3 (Figure 6). According to the process of MnO2 decomposition, MnO should not be included as a product. Hence, the reduction of the oxides of high-valence Mn by Al might account for the generation of MnO. A great amount of Al and Mn3O4 were left after the reaction was completed, which further proved that MnO was produced by Al reacting with Mn2O3.
Figure 6d is the pattern recorded at the end of the reaction represented by peak E (1000 °C), which suggests that Al2O3, Mn, MnAl2O4, and MnO existed as the product components while Al and Mn3O4 were not contained. As can be inferred, Mn and MnAl2O4 were formed during the exothermic reaction between Al and Mn3O4. Since Mn3O4 possesses a stronger oxidizability than MnO does, Al reacted with Mn3O4 preferentially. As for Al2O3, on the one hand, the reaction between MnO2 and Al would generate amorphous Al2O3, which further transformed into crystalline Al2O3 with a faster nucleation process at a higher temperature; on the other hand, the possible reaction between Al and Mn3O4 would also produce Al2O3 along with Mn.

3.3. Thermal Decomposition and Thermal Reaction Process of PTFE/MnO2

TG-DSC curves corresponding to the thermal decomposition of PTFE/MnO2 (42/58, w/w) are given in Figure 7. As discussed above in Section 3.1 and Section 3.2, peak A stands for the melting endotherm of PTFE, peak B for the decomposition endotherm of PTFE and MnO2, and peak D for the decomposition endotherm of Mn2O3.
The TG curve suggests a 41.3% decrease in the sample weight as the temperature rose from 470 °C to 580 °C. Theoretically, the weight loss should equal 47.34 wt.% if PTFE and MnO2 decomposed independently without any reaction happening between them. Thus, there might be an exothermic reaction between C2F4 and MnO2 (or Mn2O3), which gave rise to peak C on the DSC curve. The reaction mechanism is speculated as Formulas (1) and (2).
C 2 F 4 + 2 MnO 2 2 CO 2 + 2 MnF 2
2 C 2 F 4 + 2 Mn 2 O 3 4 MnF 2 + 3 CO 2 + C
During the reaction process of PTFE/Al/MnO2 samples, the amount of CO2 produced peaked at 573 °C (Figure 8a), and the formation of MnF2 was also detected (Figure 9b). With a slight endothermic peak (peak E of Figure 7) observed near 856 °C—the melting point of MnF2, the inclusion of CO2 and MnF2 in reaction products was thus confirmed. This further proves the occurrence of an exothermic reaction between PTFE and MnO2 (or Mn2O3). However, since this reaction coincided with the MnO2 decomposition, it is difficult to determine whether MnO2 or Mn2O3 was involved in the reaction.
The TG curve starts to decline sharply at 470 °C, while peak B on the DSC curve, which is an endothermic one, starts at 515 °C. As the decomposition temperatures of MnO2 and PTFE are around 530 °C and 514 °C, respectively, the weight loss between 470 °C and 515 °C should not be attributed to PTFE or MnO2 decomposition. Instead, it might result from the condensation reaction between PTFE and MnO2, as described by Formula (3).
( C 2 F 4 ) n + 2 nMnO 2 2 nCO 2 + 2 nMnF 2
At temperatures higher than 580 °C, both TG and DSC curves exhibit a downward trend. It is possible that the reaction between C2F4 and Mn2O3 pushed forward the decomposition of Mn2O3. Then, the solid residue after DSC analysis was subjected to XRD tests. Figure 10 shows the diffraction peaks only for Mn3O4, while no MnF2 has been detected. As merely about 5 mg of residue was left after DSC analysis, this ultralow content might account for MnF2 not being found.

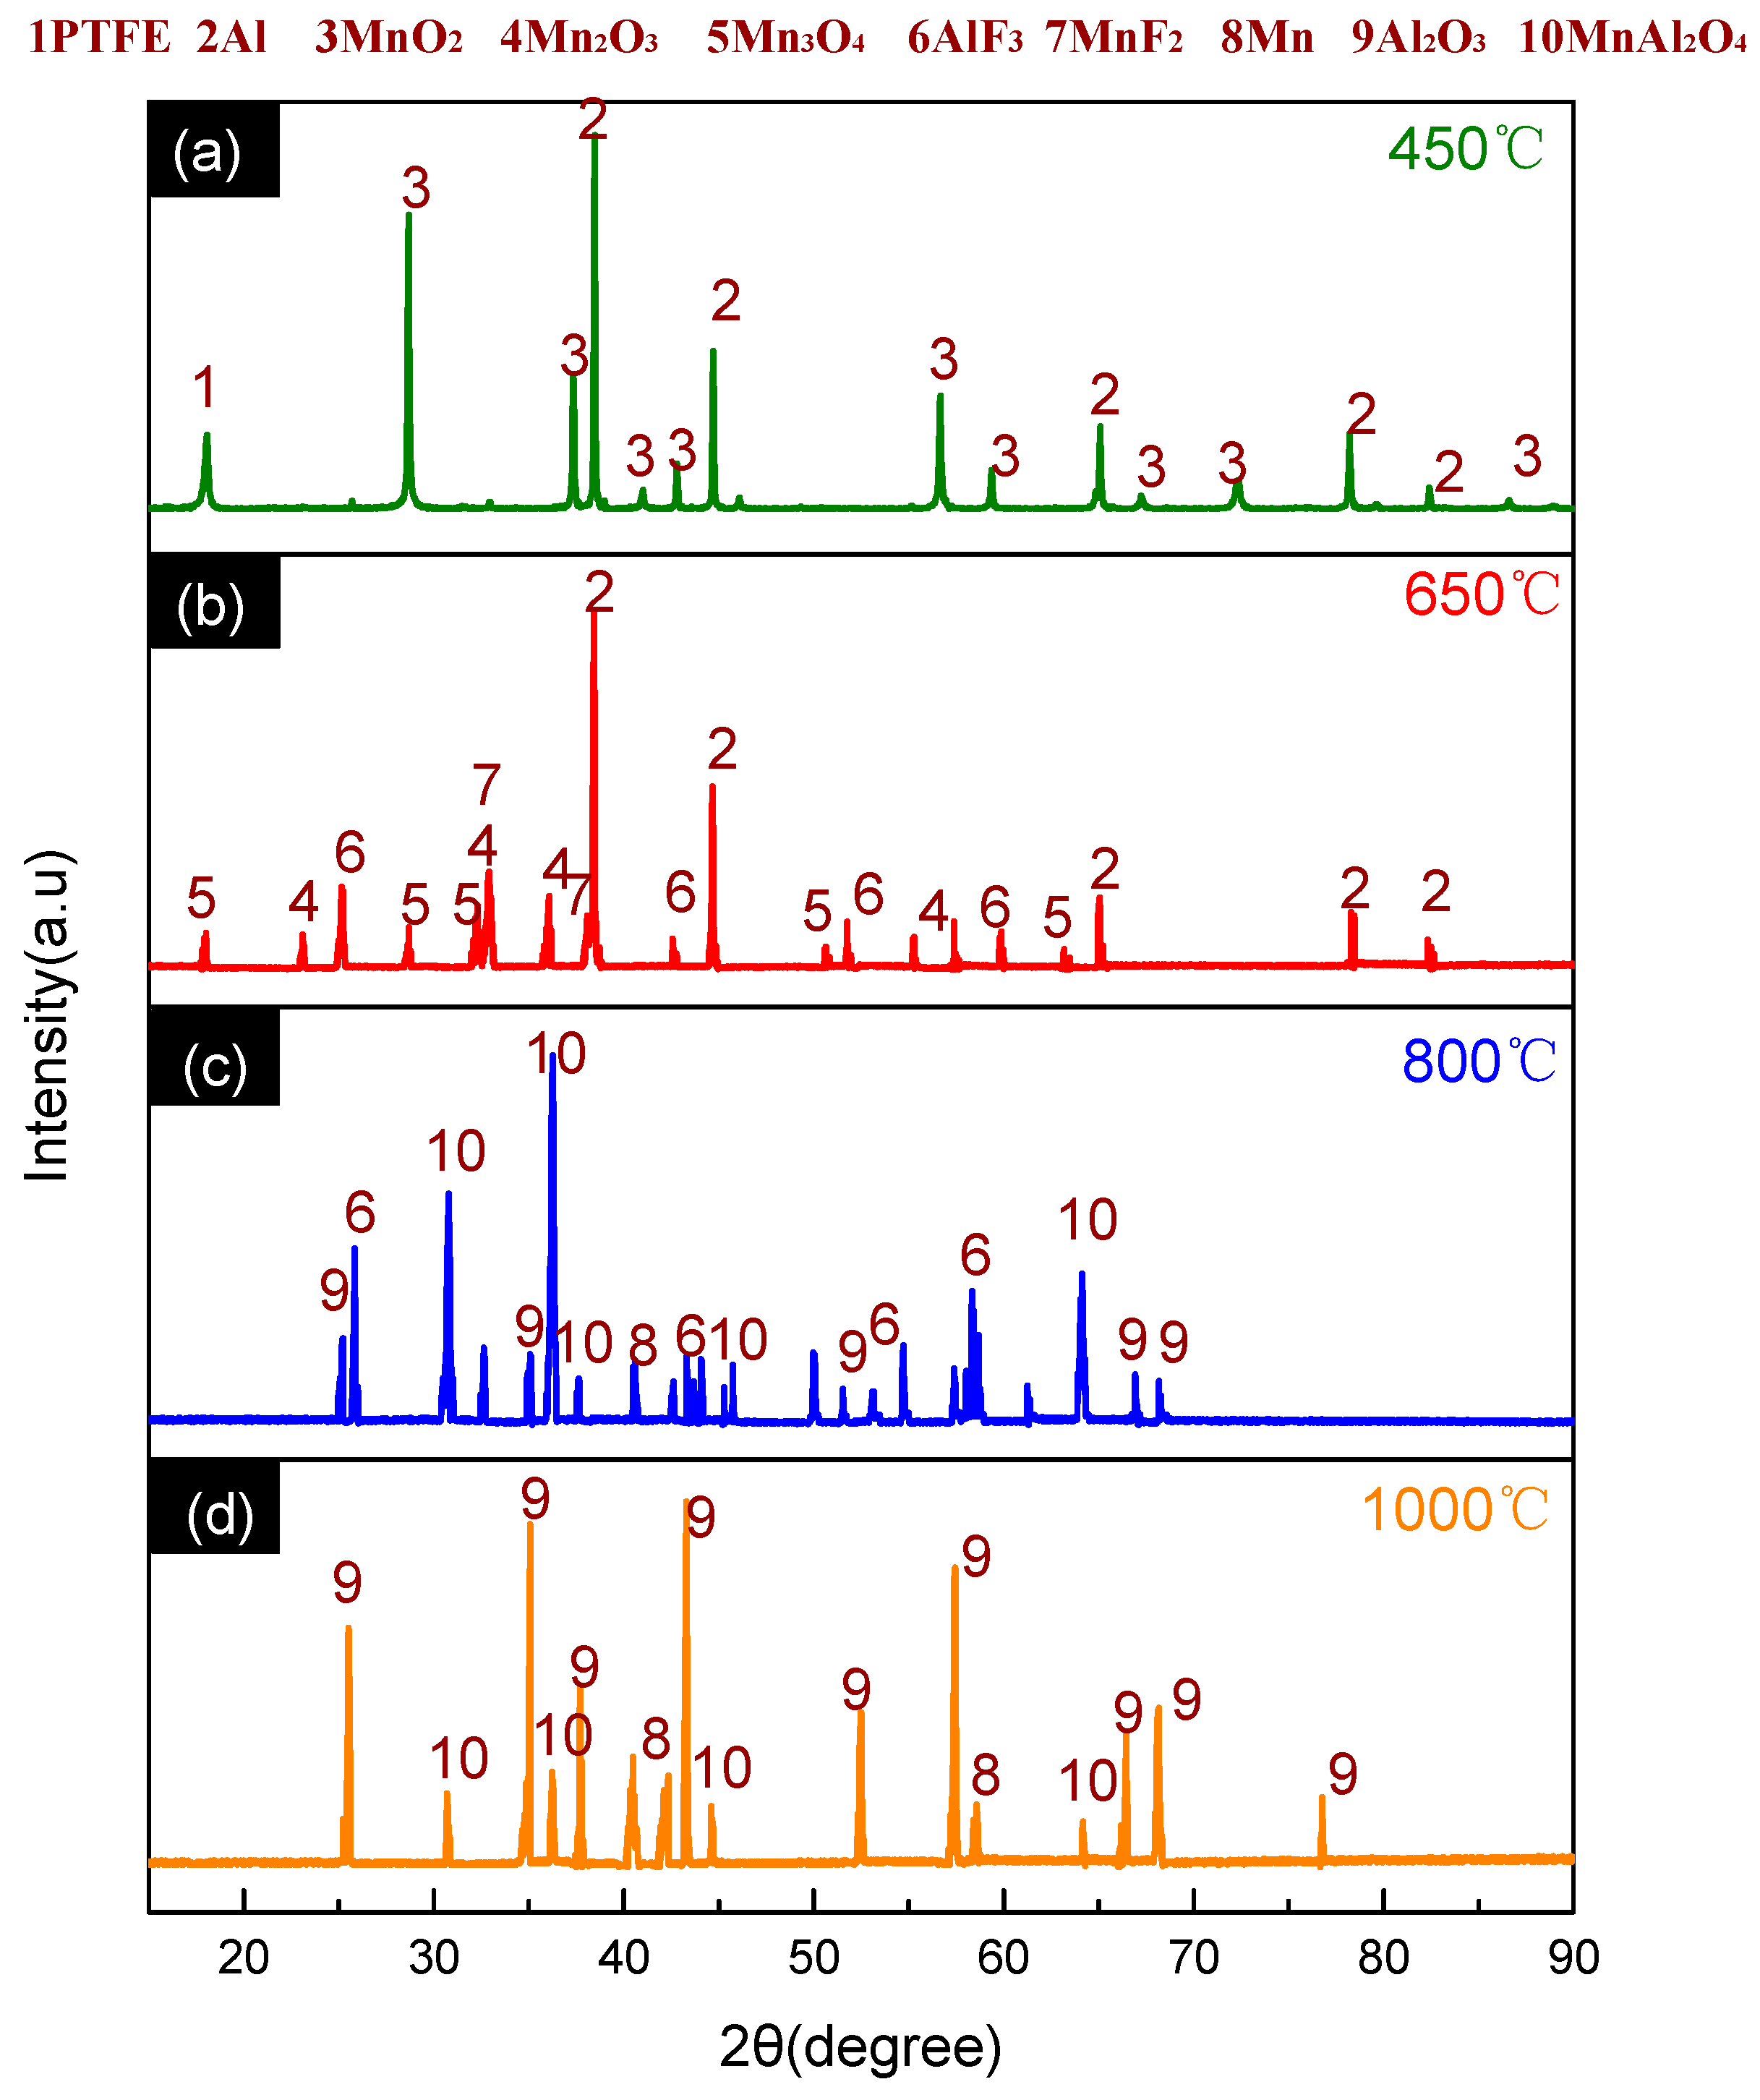
3.4. Thermal Decomposition and Thermal Reaction Process of PTFE/Al/MnO2

Figure 11 demonstrates the TG-DSC curve for the PTFE/Al/MnO2 thermal decomposition. Same as that analyzed in Section 3.3, peaks A and B are endotherms due to PTFE melting and PTFE/MnO2 decomposition, respectively, while peak C results from the exothermic reaction between C2F4 and Mn oxides. Further, the mass spectrometric analysis of the gas evolution points out that CO2+ was formed at 475 °C without C2F4+ (Figure 8), so the weight loss suggested by the TG thermogram from 475 °C to 515 °C was indeed attributed to the condensation reaction of PTFE with MnO2.
The exothermic peak D covers a temperature range from 592 °C to 635 °C. As mentioned before, the exothermic reaction between Al and C2F4 in the PTFE/Al sample happened at 597–619 °C (Figure 1), and the one between Al and MnO2 in Al/MnO2 sample proceeded at 590–639 °C (Figure 5). Together with the XRD analyses in Figure 9b, which suggested that the reaction products of PTFE/Al/MnO2 sample comprised Al, Mn2O3, Mn3O4, MnF2, and AlF3 at 650 °C, peak D was considered to result from the superposition reactions of Al with C2F4 and MnO2.
Moreover, an exothermic peak F appears on the DSC curve from 714 °C (Figure 11), which is exactly the temperature range that corresponds to the exothermic peak D in Figure 5. Thus, there should be a certain correlation between these two exothermic reactions occurring individually in PTFE/Al/MnO2 and Al/MnO2. However, a drop on the TG curve for the Al/MnO2 sample is observed in the temperature interval that stands for Mn2O3 decomposition, while no apparent change can be detected for the PTFE/Al/MnO2 sample weight. Then, the XRD analysis of the corresponding reaction products was performed (Figure 9c), which demonstrates the presence of AlF3, Mn, Al2O3, and MnAl2O4 but the absence of Al, Mn2O3, Mn3O4, and MnF2. Therefore, peak F should be caused by the aluminothermic reaction between Al and Mn2O3/Mn3O4/MnF2. The newly generated products in this process were Mn, Al2O3, and MnAl2O4. This is consistent with the ones formed during the exothermic reaction of the Al/MnO2 sample between 880 °C and 987 °C. Besides, no more exothermic peaks can be found for the PTFE/Al/MnO2 sample in this temperature range, probably because the aluminothermic reaction before was much too intense and the enhanced exotherm reaction occurred in advance. Consequently, the exothermic reaction corresponding to peak F in the PTFE/Al/MnO2 sample equated to the combined reactions corresponding to peaks D and E in the Al/MnO2 samples. Furthermore, the TG curve shows no significant change between 714 °C and 783 °C. This may be owing to the limited generation of oxygen, as the fierce reaction made Mn2O3 reduced by Al once decomposed or even not decomposed yet.
The specific reaction process of the PTFE/Al/MnO2 sample between 714 °C and 783 °C could not be completely determined by simply analyzing the reaction products. Since both Mn2O3 and Mn3O4 may react with Al, MnOx is used as an overall symbolization for Mn oxides (Mn2O3 and Mn3O4). The possible chemical reaction is described below:
Al + MnO x Al 2 O 3 + MnAl 2 O 4 + Mn
Finally, the TG-DSC curves show a slight endothermic peak H between 870 °C and 910 °C accompanied with a decrease in the sample weight of 4.78 wt.%. Meanwhile, the XRD pattern in Figure 9d indicates Mn, Al2O3, and MnAl2O4 as the product components after the reaction but no AlF3. Therefore, the peak H corresponds to the sublimation endotherm of AlF3, which is consistent with the phenomenon observed in the PTFE/Al sample.
Energy release values during the exothermic reactions within various temperature ranges for the four samples, PTFE/Al, PTFE/MnO2, Al/MnO2, and PTFE/Al/MnO2, are gathered in Table 3.
As can be seen, the energy release in PTFE/Al and PTFE/MnO2 samples was only 20.32 J/g and 43.11 J/g due to the endothermic decomposition of PTFE, while the exotherm of the aluminothermic reaction between Al and MnO2 reached 94.41 J/g. The energy release value of the PTFE/Al/MnO2 sample achieved as high as 176.12 J/g, and the heat release was much higher than those of the first three. The mutual reactions between every two reactants in the PTFE/Al/MnO2 sample system exerted an overall promotion effect, so the energy release of PTFE/Al/MnO2 sample was greatly enhanced. For the exothermic reaction between 700 °C and 1000 °C, the PTFE/Al/MnO2 sample outperformed the Al/MnO2 sample with a greater heat release, an earlier triggered reaction, a shortened reaction time, and a faster energy release. Therefore, PTFE/Al/MnO2 exhibited heat release properties superior to those of PTFE/Al and Al/MnO2.

4. Conclusions

In this study, DSC/TG-MS and XRD techniques were employed to analyze the reaction process at different temperatures for PTFE/Al/MnO2 powdery fluorinated thermite. Meanwhile, the processes in PTFE/Al, PTFE/MnO2, and Al/MnO2 samples were also examined for comparison. The research can be concluded with the following results and findings.
  • PTFE oxidized Al into AlF3 in the PTFE/Al sample but were reduced into CO2 by Mn oxides (MnO2 or Mn2O3) in the PTFE/MnO2 sample. PTFE acted as both an oxidizer and a reducer in the PTFE/Al/MnO2 sample.
  • The reaction process of the PTFE/Al/MnO2 sample could be divided into two stages. In the first stage, PTFE and partial MnO2 decomposed. C2F4, the decomposition product of PTFE, could oxidize Al into AlF3 and get reduced into C. In addition, it would reduce Mn oxides (MnO2 or Mn2O3) into MnF2 and get oxidized into CO2. In the meantime, Al reacted with MnO2 to generate Mn3O4 and Al2O3. In the second stage, the constantly increasing temperature let excessive Al reduce Mn2O3/Mn3O4/MnF2 into MnAl2O4 and Mn, with AlF3 and Al2O3 produced simultaneously.
  • In the PTFE/Al/MnO2 sample, the mutual reaction between each two components could promote the overall reaction. Compared with the other three systems, the ternary system exhibited a shorter reaction time, a faster energy release, and a better exothermic performance.

Author Contributions

X.F. and Y.L. conceived and designed the experiments; J.Z., J.H., Z.Y. and J.W. performed the experiments; Z.G., L.Y., S.W. and J.K. analyzed the data; J.Z. wrote the paper.

Funding

This research was funded by the National Natural Science Foundation of China (No. 51673213).

Acknowledgments

The financial support from the National Natural Science Foundation of China (General Program. Grant No. 51673213) is gratefully acknowledged.

Conflicts of Interest

The authors declare no conflicts of interest.

References

  1. Zhang, X.F.; Shi, A.S.; Qiao, L.; Zhang, J.; Zhang, Y.G.; Guan, Z.W. Experimental study on impact-initiated characters of multifunctional energetic structural materials. J. Appl. Phys. 2013, 113, 083508. [Google Scholar] [CrossRef]
  2. Wang, Y. Application of Nanometer Materials and Nanocomposites in Thermites. Ph.D. Thesis, Nanjing University of Science and Technology, Nanjing, China, August 2008. [Google Scholar]
  3. Osborne, D.T.; Pantoya, M.L. Effect of Al particle size on the thermal degradation of Al/Teflon mixtures. Conbust. Sci. Technol. 2007, 179, 1467–1480. [Google Scholar] [CrossRef]
  4. Kubota, N.; Serizawa, C. Combustion of magnesium/polytetrafluoroethylene. J. Propuls. Power 1987, 9, 539–545. [Google Scholar] [CrossRef]
  5. Watson, K.W.; Pantoya, M.L.; Levitas, V.I. Fast reactions with nano-and micrometer aluminum: A study on oxidation versus fluorination. Combust. Flame 2008, 155, 619–634. [Google Scholar] [CrossRef]
  6. Glavier, L.; Taton, G.; Ducéré, J.M.; Baijot, V.; Pinon, S.; Calais, T.; Rossi, C. Nanoenergetics as pressure generator for nontoxic impact primers: comparison of Al/Bi2O3, Al/CuO, Al/MoO3 nanothermites and Al/PTFE. Combust. Flame 2015, 162, 1813–1820. [Google Scholar] [CrossRef]
  7. Ye, W.J.; Wang, T.; Yu, Y.H. Research Progress of Fluoropolymer-Matrix Energetic Reactive Materials. Aerosp. Mater. Technol. 2012, 42, 19–23. [Google Scholar]
  8. Li, X.Y. Preparation and Reactivity of Fluoro-Nanothermite. Ph.D. Thesis, Nanjing University of Science and Technology, Nanjing, China, March 2016. [Google Scholar]
  9. Puts, G.J.; Crouse, P.L. The influence of inorganic materials on the pyrolysis of polytetrafluoroethylene. Part 1: The sulfates and fluorides of Al, Zn, Cu, Ni, Co, Fe and Mn. J. Fluor. Chem. 2014, 168, 260–267. [Google Scholar] [CrossRef] [Green Version]
  10. Л.П.Орленкo. Explosion Physics; Science Press: Beijing, China, 2011. [Google Scholar]
  11. Osborne, D.T. The Effects of Fuel Particle Size on the Reaction of Al/Teflon Mixtures. Ph.D. Thesis, Texas Tech University, Lubbock, TX, USA, May 2006. [Google Scholar]
  12. Cudzilo, S.; Szala, M.; Huczko, A.; Bystrejewski, M. Combustion reactions of poly(carbon monofluoride), (CF)n, with different reductants and characterization of the products. Propellants Explos. Pyrotech. 2007, 32, 149–154. [Google Scholar] [CrossRef]
  13. Zhou, X. Highly exothermic and superhydrophobic Mg/fluorocarbon core/shell nanoenergetic arrays. ACS Appl. Mater. Interfaces 2014, 6, 10497–10505. [Google Scholar] [CrossRef] [PubMed]
  14. Mccollum, J.; Pantoya, M.L.; Iacono, S.T. Activating Aluminum Reactivity with Fluoropolymer Coatings for Improved Energetic Composite Combustion. ACS Appl. Mater. Interfaces 2015, 7, 18742. [Google Scholar] [CrossRef] [PubMed]
  15. Lide, D.R. CRC Handbook of Chemistry and Physics 1999-2000: A Ready-Reference Book of Chemical and Physical Data. CRC Handb. Chem. Phys. 1999, 15, 504. [Google Scholar]
  16. Chernenko, E.V.; Afanas’Eva, L.F.; Lebedeva, V.A.; Rozenband, V.I. Inflammability of mixtures of metal oxides with aluminum. Combust. Explos. Shock Waves 1988, 24, 639–646. [Google Scholar] [CrossRef]
  17. Terayama, K.; Ikeda, M. Study on Thermal Decomposition of MnO2 and Mn2O3 by Thermal Analysis. Mater. Trans. Jim 1983, 24, 754–758. [Google Scholar] [CrossRef]
  18. Hu, X.L. Study on the preparation and kinetics of Mn3O4 from the deco potion of MnO2. Ph.D. Thesis, Guangxi University, Nanning, China, May 2007. [Google Scholar]
  19. Schoenitz, M.; Umbrajkar, S.M.; Dreizin, E.L. Kinetic Analysis of Thermite Reactions in Al-MoO3 Nanocomposites. J. Propuls. Power 2012, 23, 683–687. [Google Scholar] [CrossRef]
Figure 1. Thermogravimetry-differential scanning calorimetry (TG-DSC) curve of the PTFE/Al (polytetrafluoroethylene/aluminum) sample.
Materials 11 02451 g001
Figure 2. Mass spectrometry (MS) spectra of C2F4+ in PTFE/Al sample.
Materials 11 02451 g002
Figure 3. TG-DSC curve of neat AlF3.
Materials 11 02451 g003
Figure 4. XRD patterns of PTFE/Al solid residues at different temperatures. (a) XRD patterns at 450 °C; (b) XRD patterns at 590 °C; (c) XRD patterns at 619 °C; (d) XRD patterns at 1000 °C.
Materials 11 02451 g004
Figure 5. TG-DSC curve of Al/MnO2.
Materials 11 02451 g005
Figure 6. XRD patterns of Al/MnO2 solid residues at different temperatures. (a) XRD patterns at 450 °C; (b) XRD patterns at 620 °C; (c) XRD patterns at 800 °C; (d) XRD patterns at 1000 °C; (e) XRD patterns at 1200 °C.
Materials 11 02451 g006
Figure 7. TG-DSC curve of PTFE/MnO2.
Materials 11 02451 g007
Figure 8. MS spectra of gaseous products from PTFE/Al/MnO2 samples. (a) MS spectra of C2F4+; (b) MS spectra of CO2+.
Materials 11 02451 g008
Figure 9. XRD patterns of PTFE/Al/MnO2 solid residues at different temperatures. (a) XRD patterns at 450 °C; (b) XRD patterns at 650 °C; (c) XRD patterns at 800 °C; (d) XRD patterns at 1000 °C.
Materials 11 02451 g009
Figure 10. XRD map of PTFE/MnO2 after reaction.
Materials 11 02451 g010
Figure 11. TG-DSC curve of PTFE/Al/MnO2.
Materials 11 02451 g011
Table 1. Formulation of four experimental samples.
SampleComposition (wt.%)
PTFEAlMnO2
Al/MnO2\3070
PTFE/Al5149\
PTFE/MnO242\58
PTFE/Al/MnO2302941
Table 2. Product composition in different temperature ranges during PTFE/Al (polytetrafluoroethylene/aluminum) thermal reactions.
Temperature/°C<450450–590590–619619–1000
ProductsPTFE and AlAl, AlF3, C, and C2F4 (g)Al, AlF3, Al4C3, and C2F4 (g)Al, AlF3, and Al4C3
Table 3. Energy release values during the exothermic reactions of the four samples.
Temperature RangeEnergy Release (J/g)
PTFE/AlPTFE/MnO2Al/MnO2PTFE/Al/MnO2
500–650 °C20.3243.1194.41176.12
700–1000 °C\\129.06209.14

