Long-Term Influence of Laser-Processing Parameters on (Super)hydrophobicity Development and Stability of Stainless-Steel Surfaces


Abstract
:
1. Introduction
2. Materials and Methods
3. Results
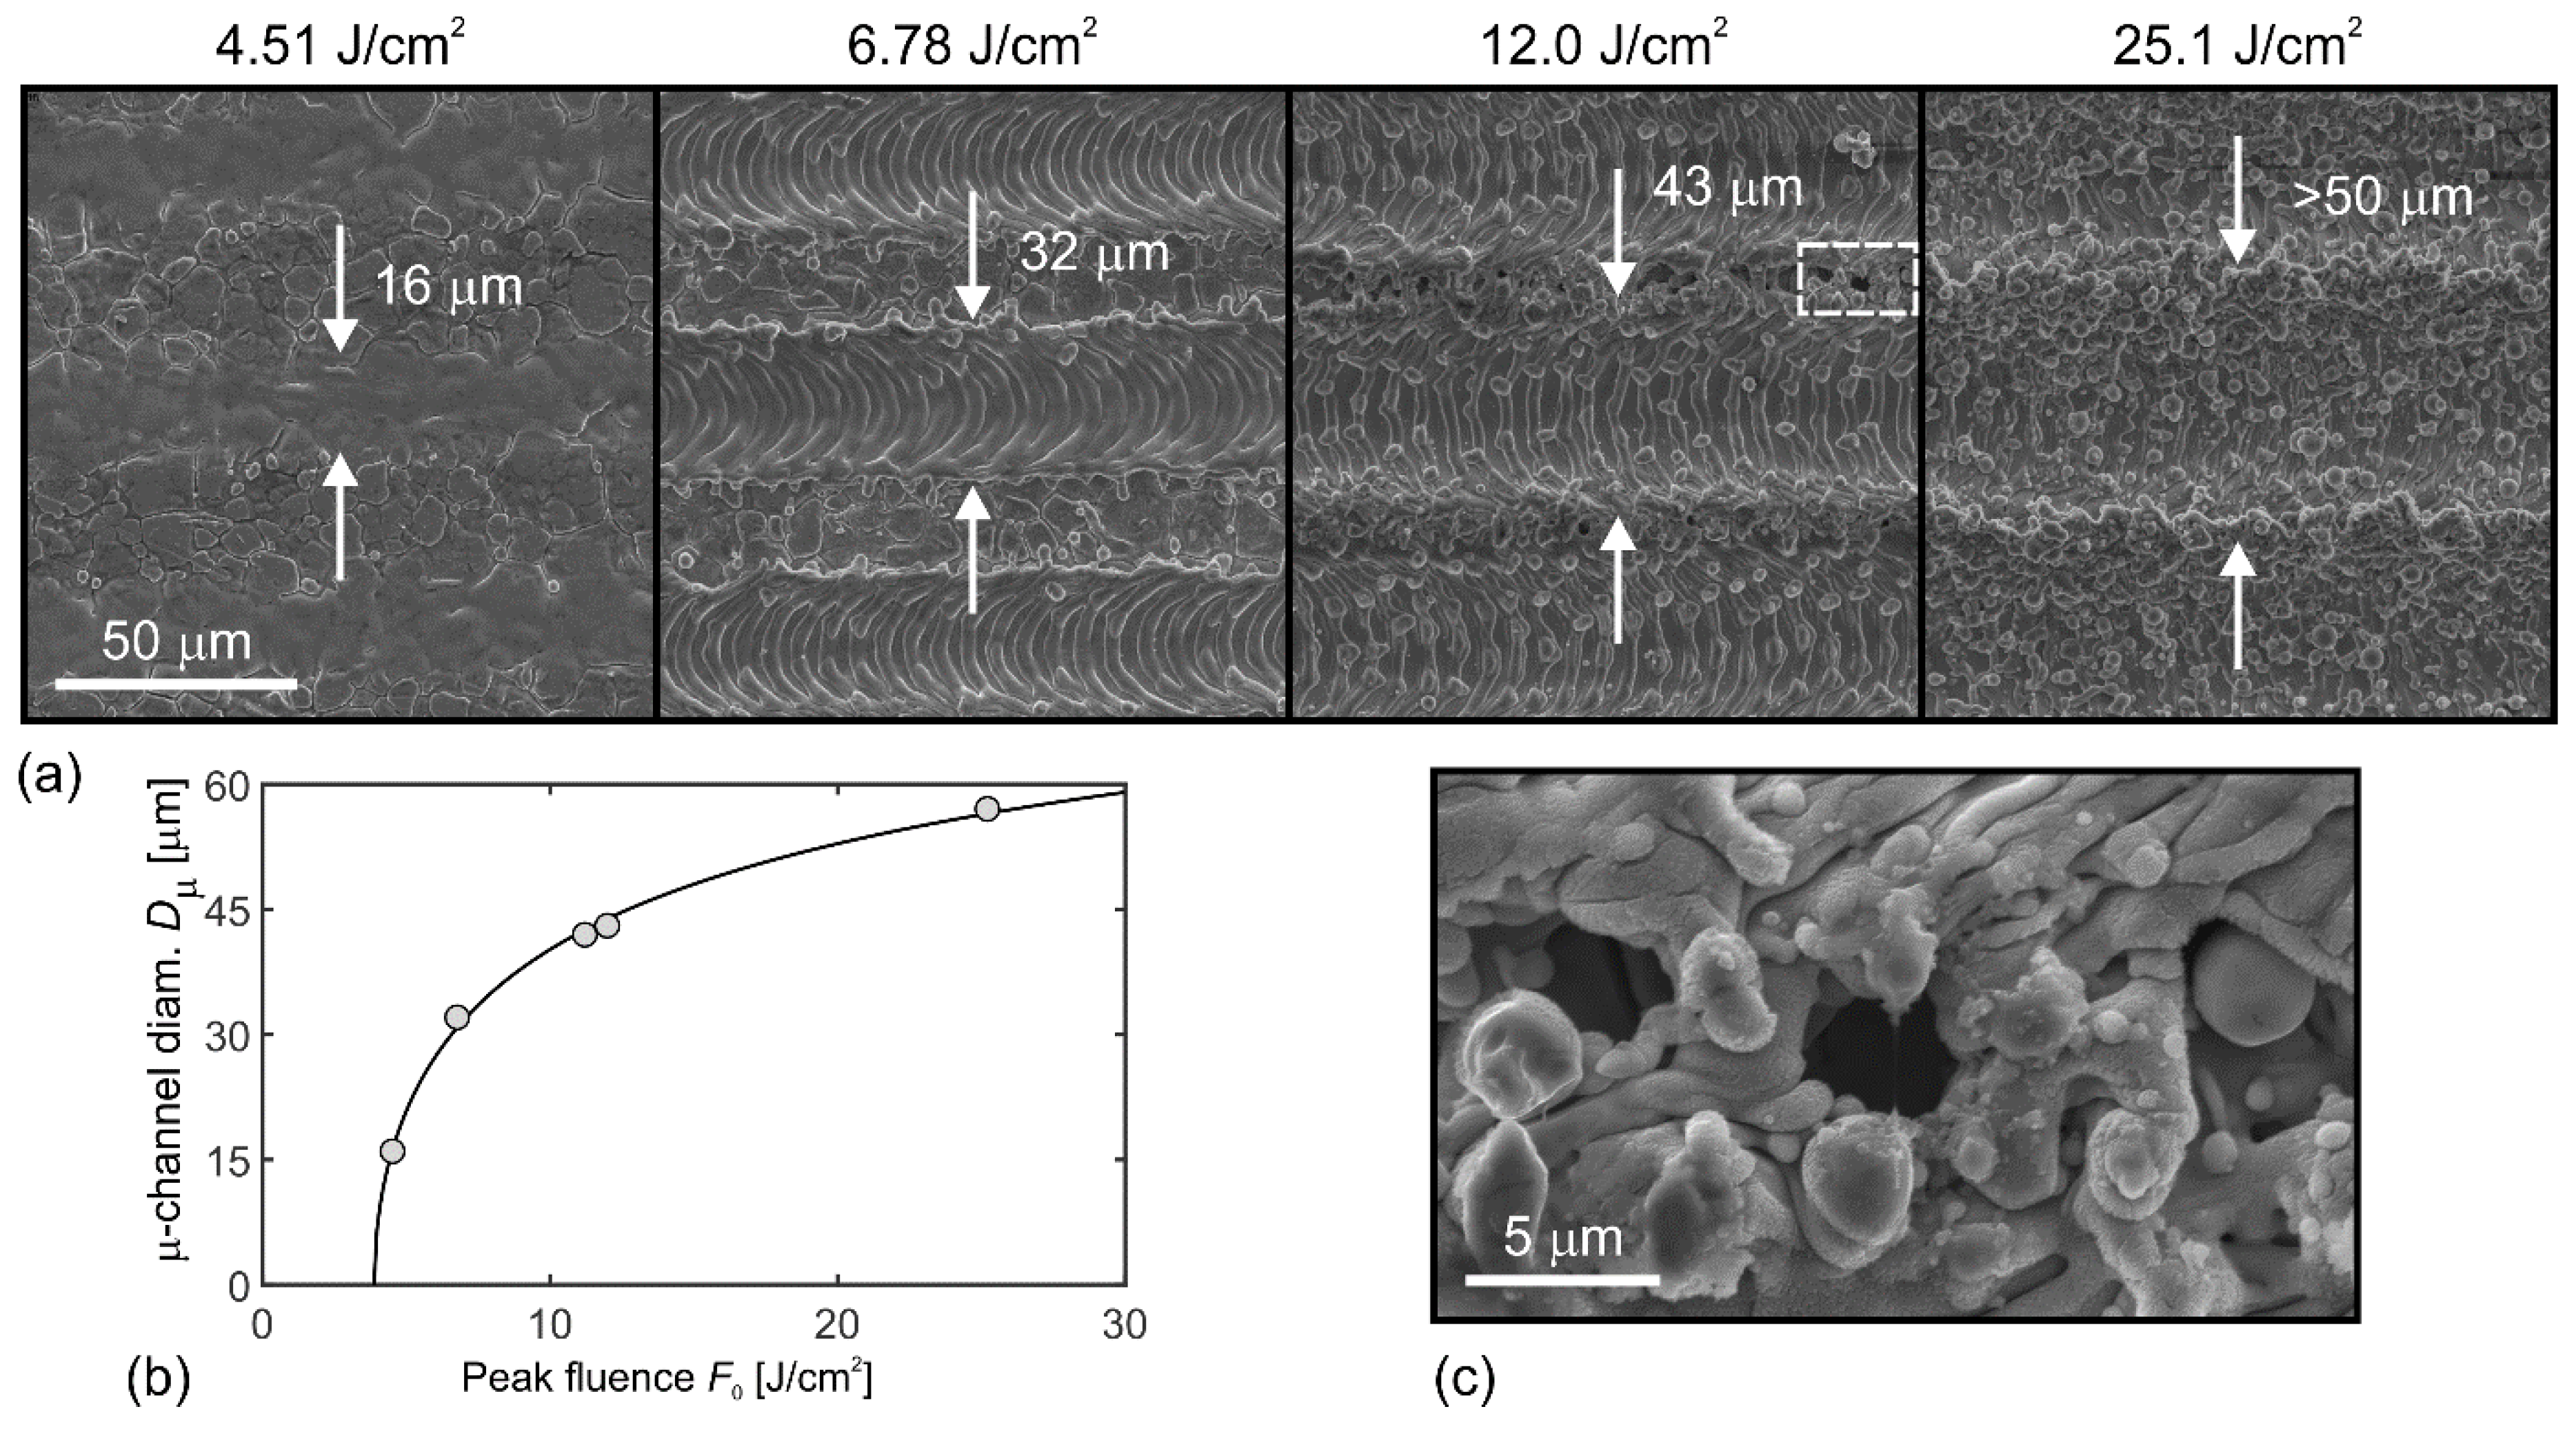
3.1. Surface Morphology after Laser Texturing
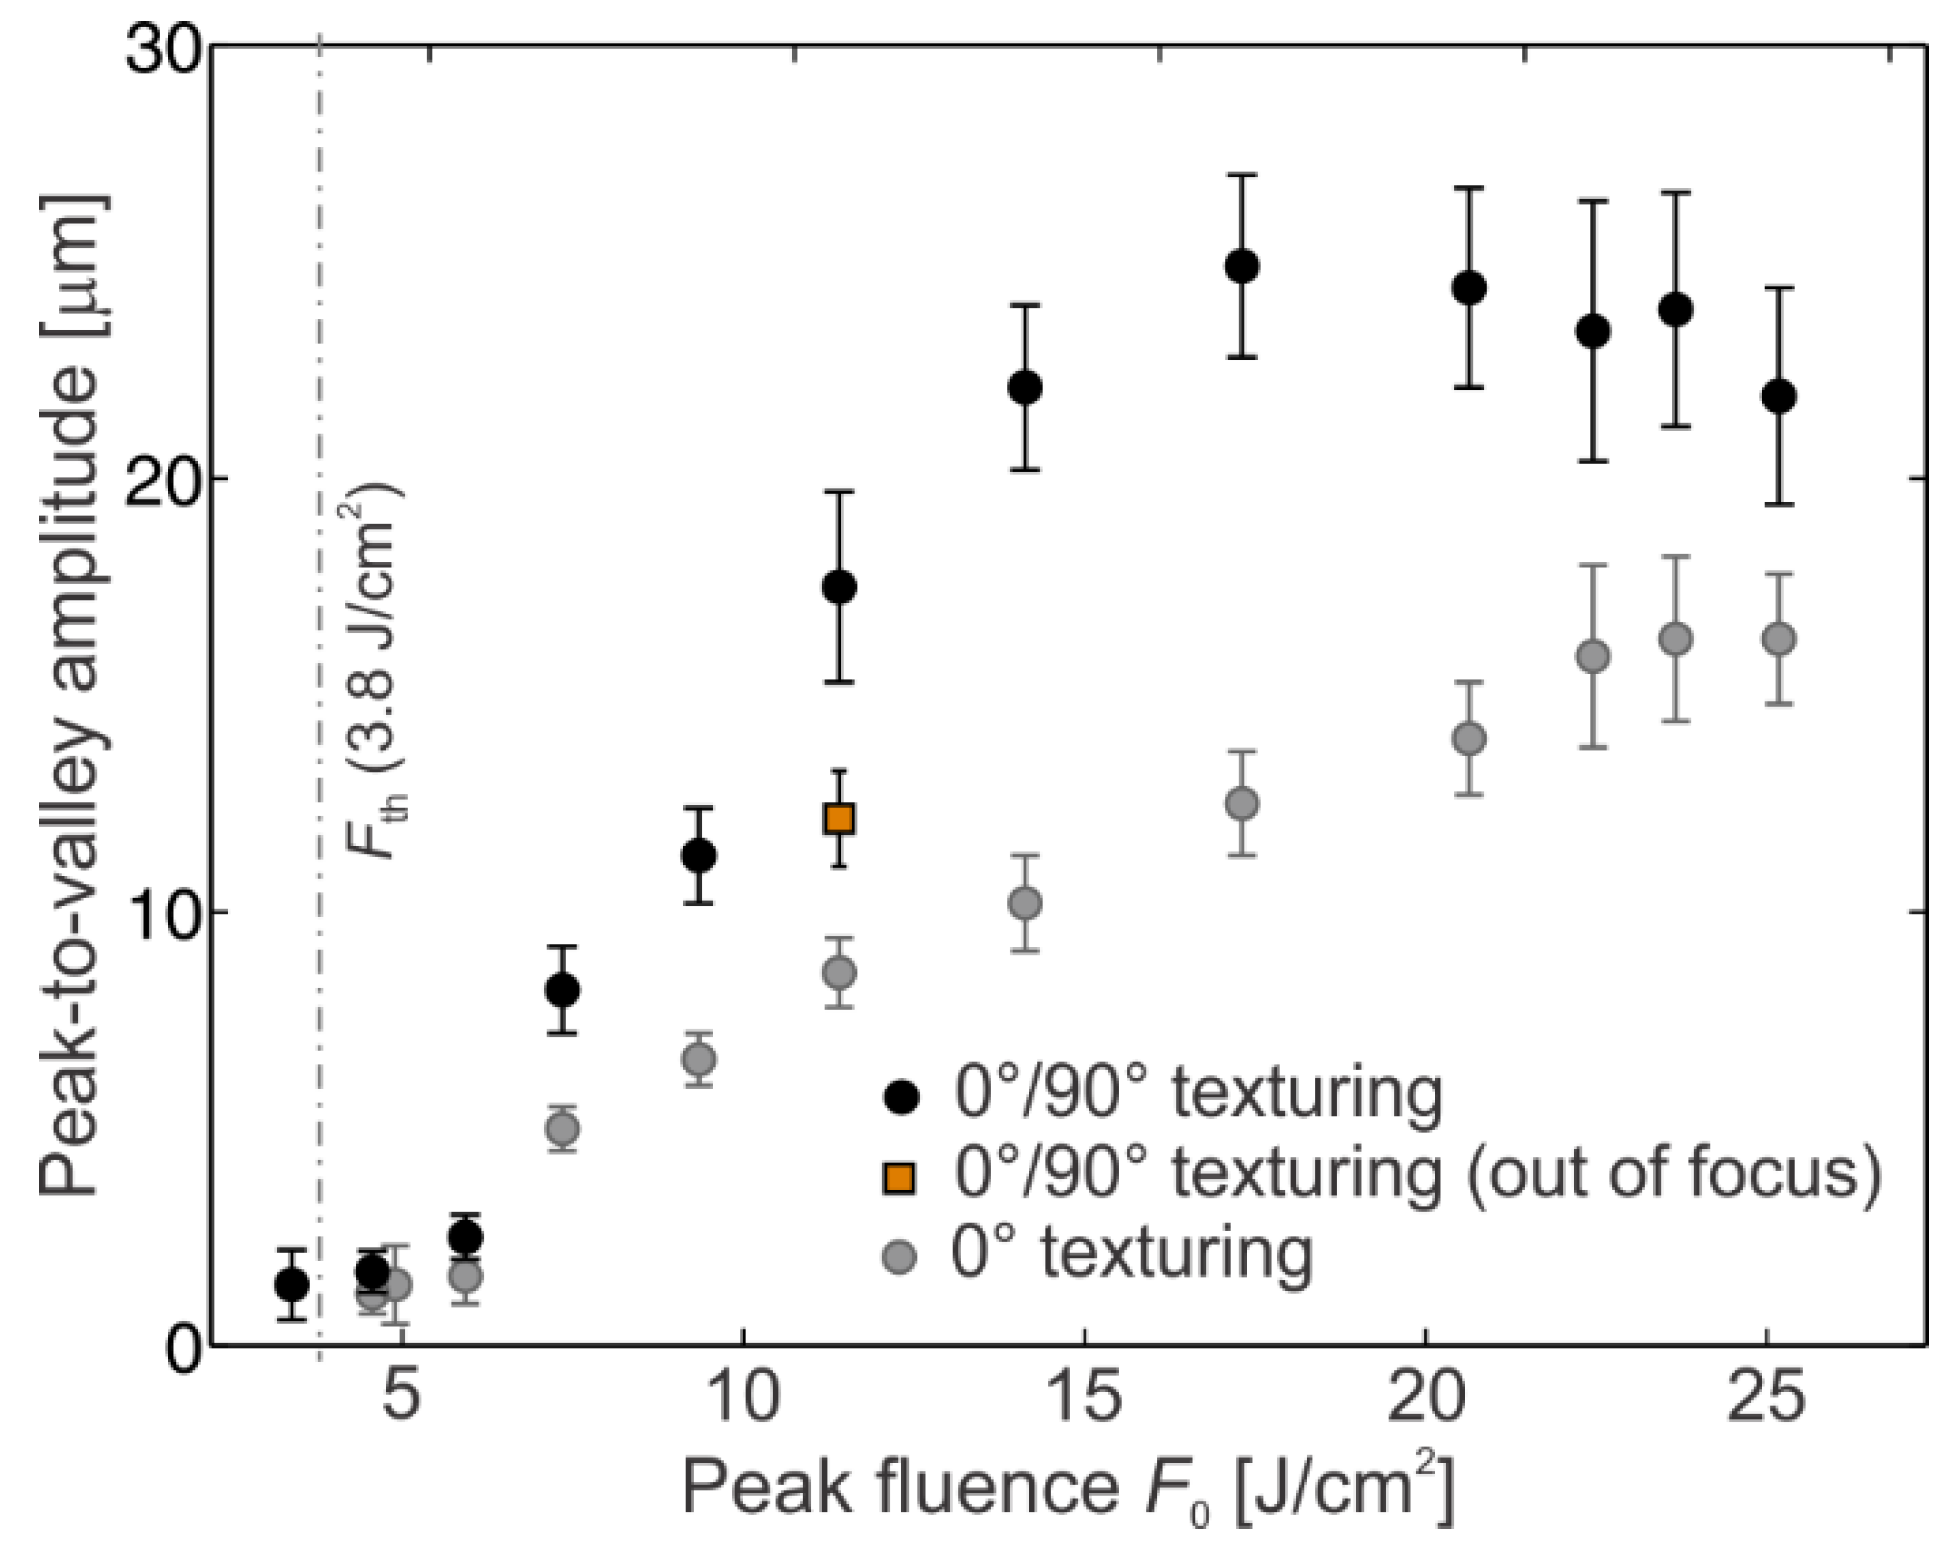
3.2. Influence of Pulse Fluence on Surface Wetting Properties
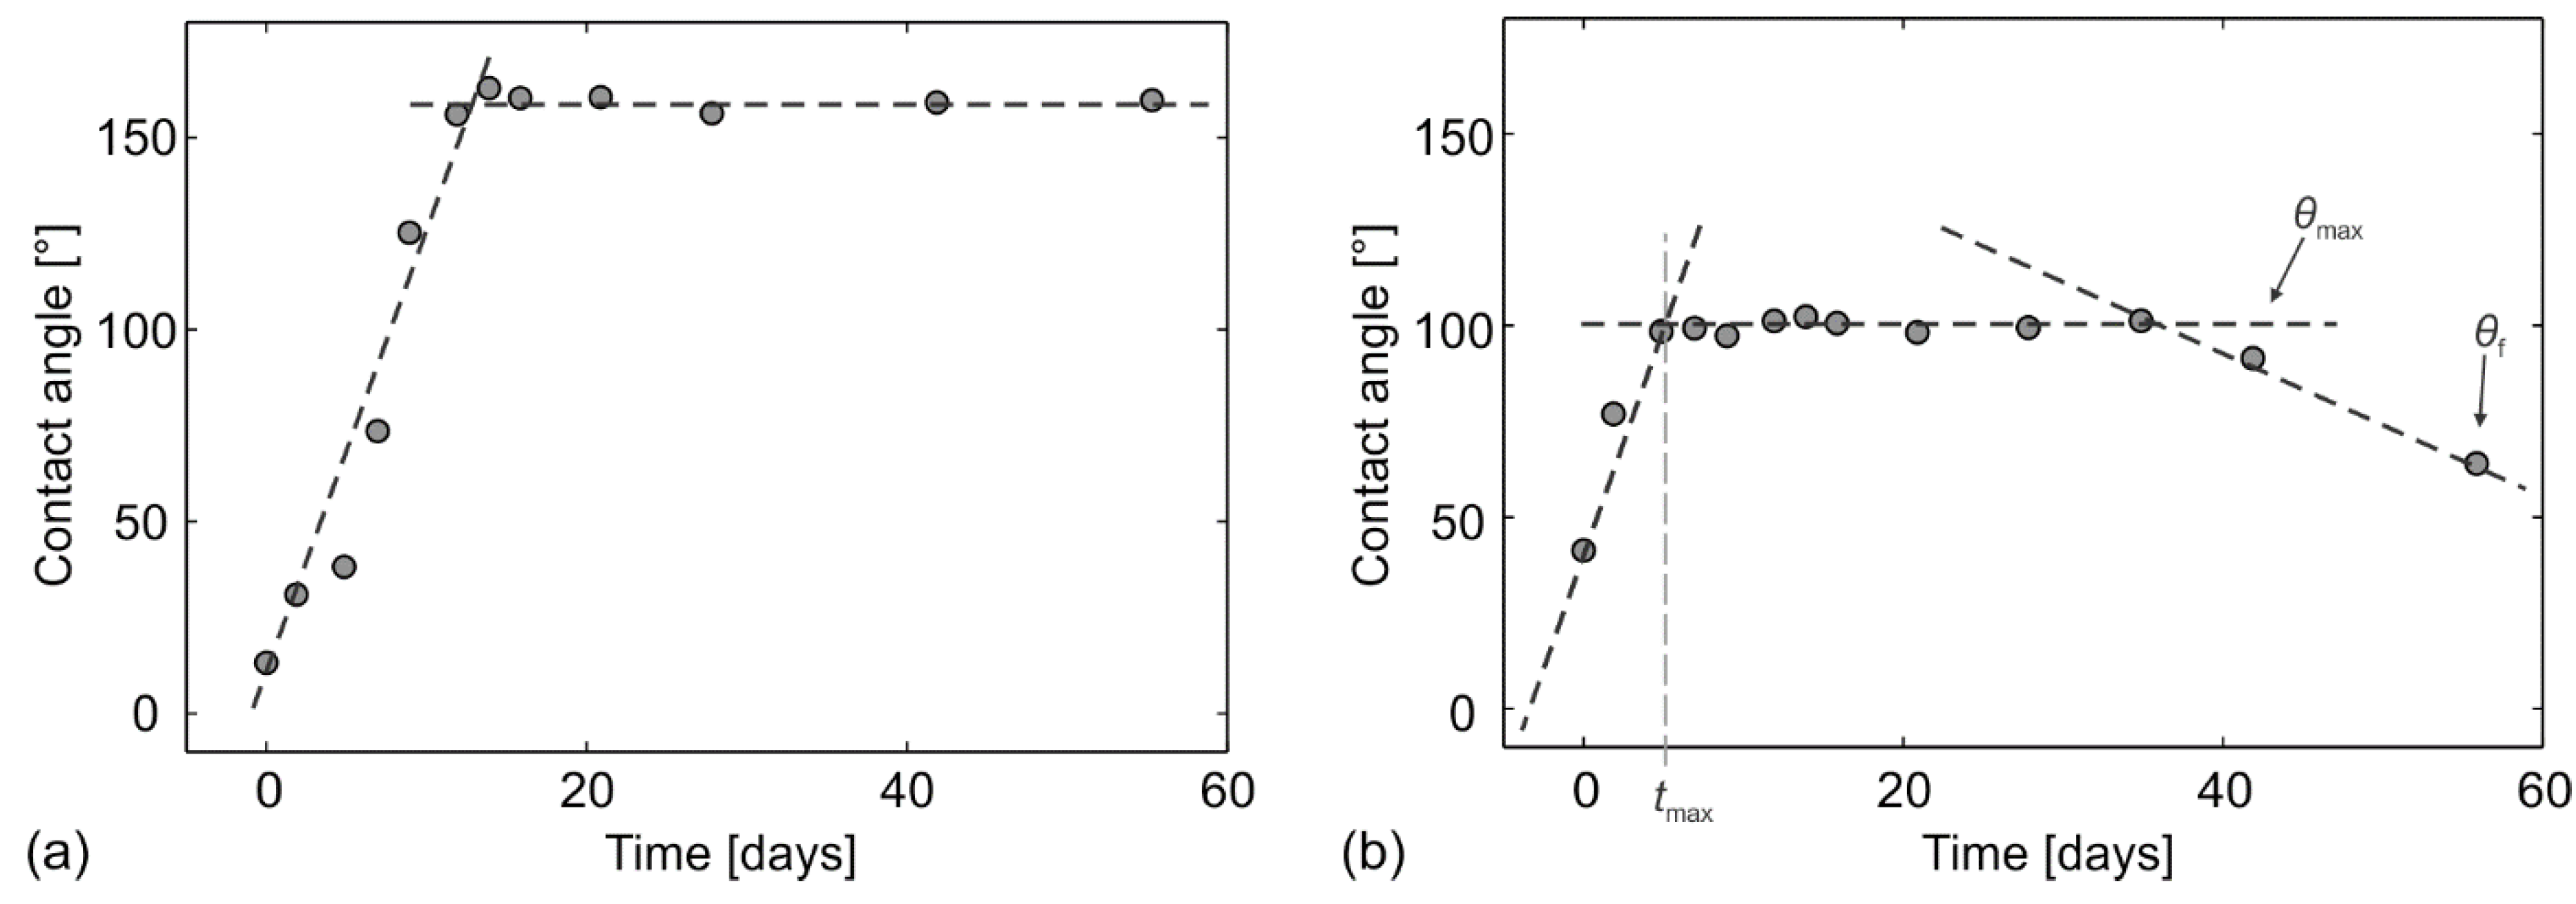
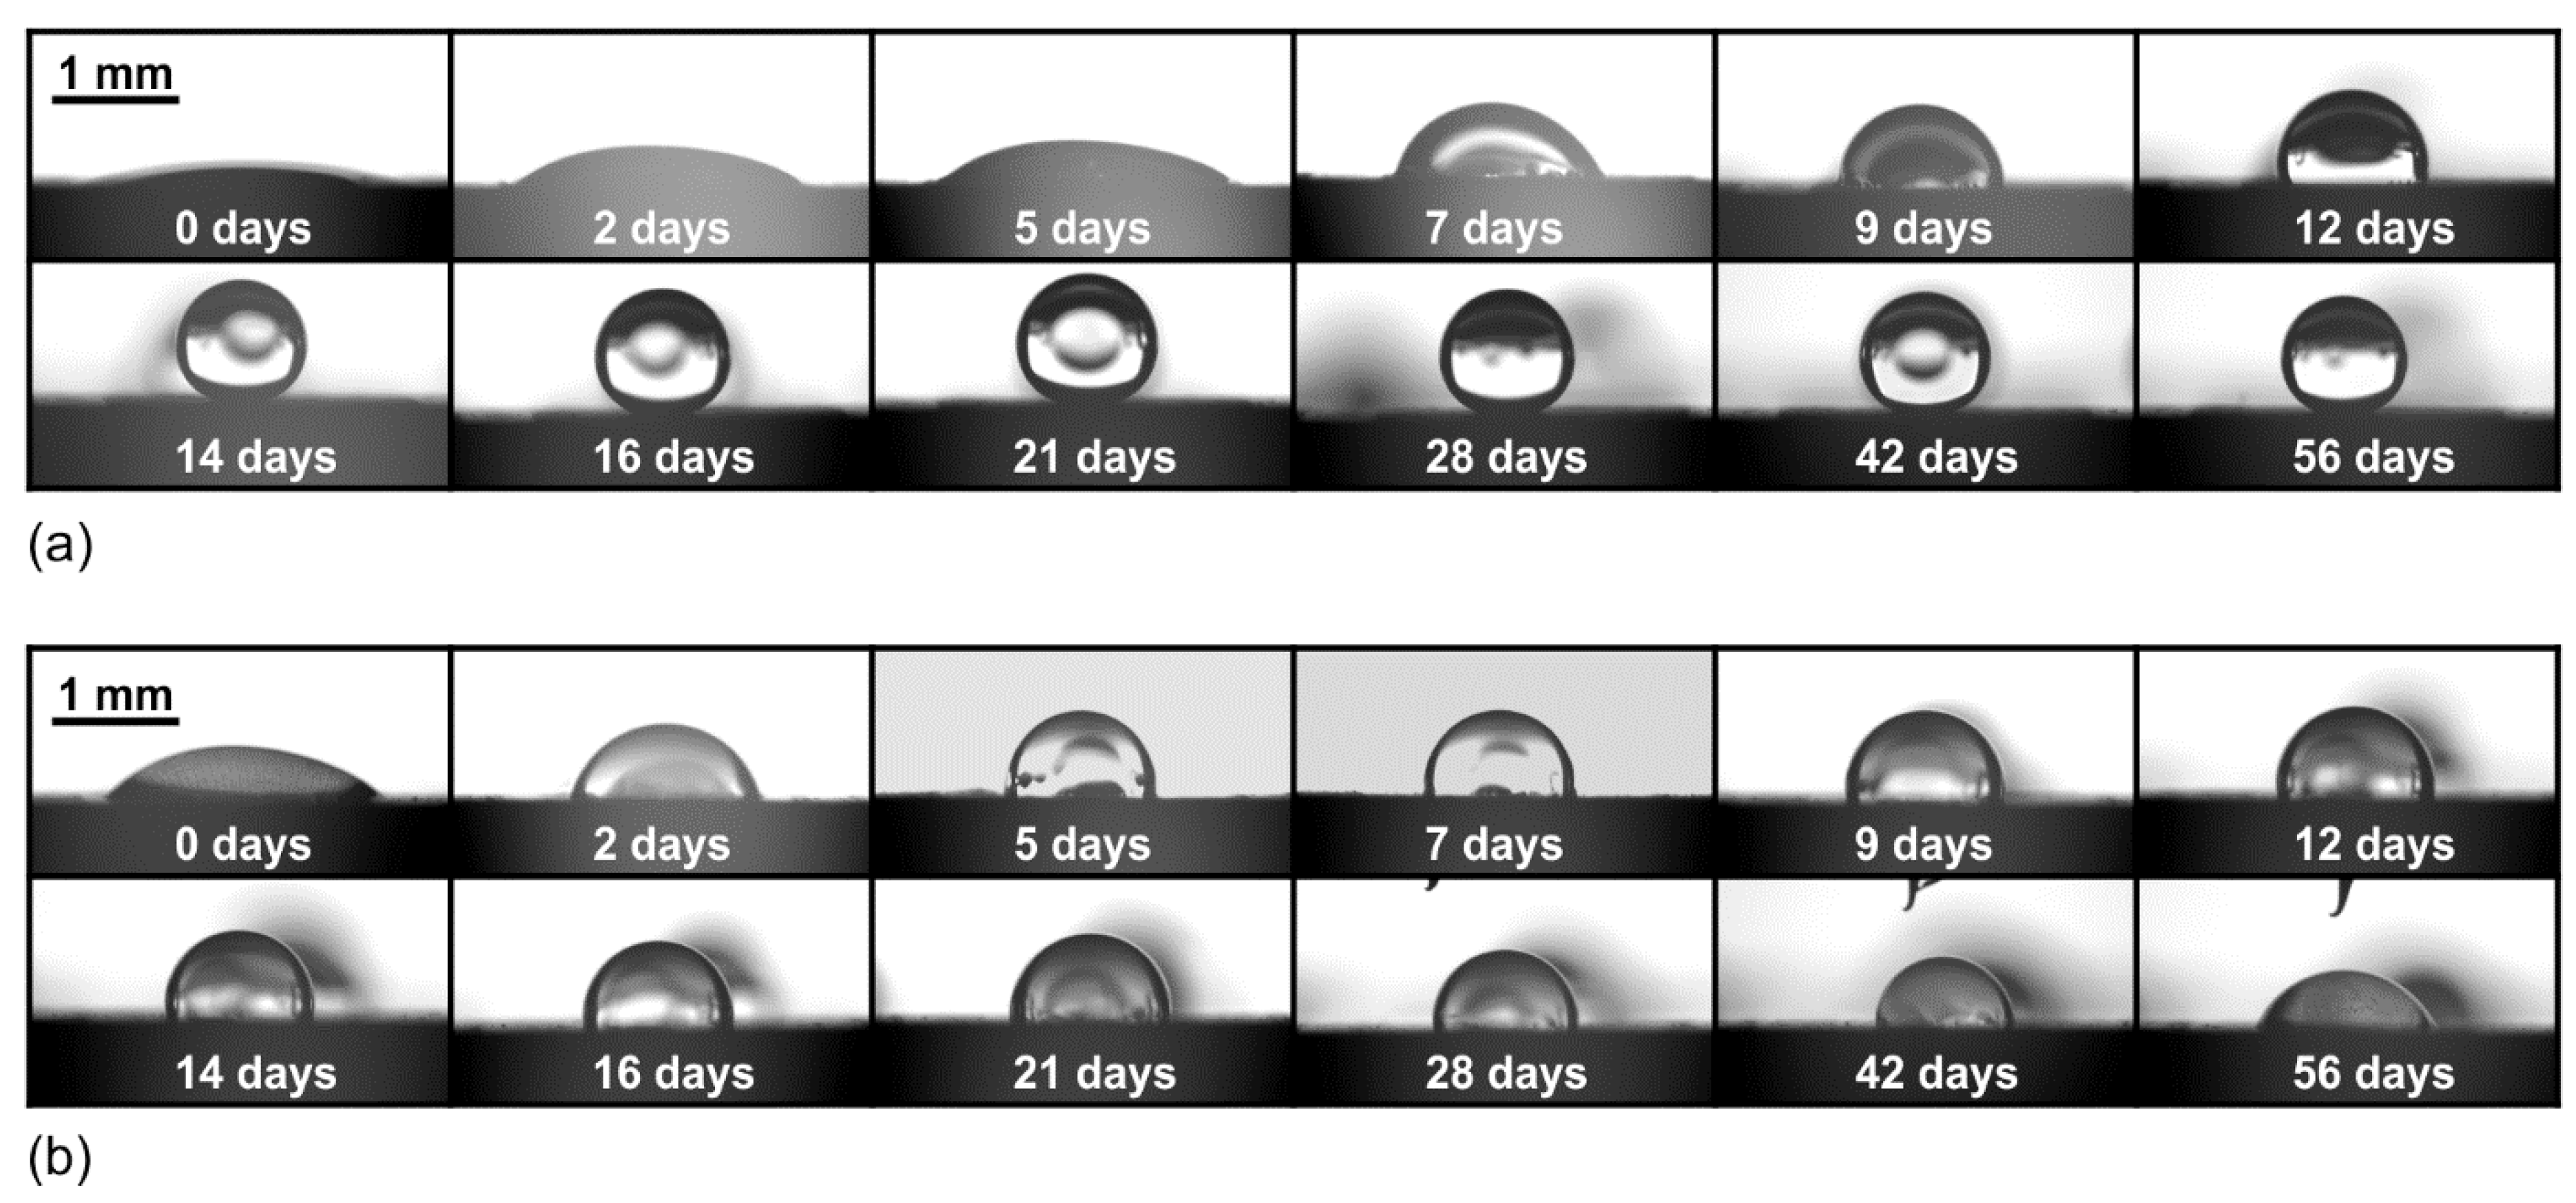
- the maximal contact angle, θmax which is defined as a static (apparent) contact angle achieved within the measured (short- or long-term) period;
- the time, tmax, defined as the time in which the maximal contact angle, θmax, is achieved;
- and the final contact angle θf, defined as the apparent contact angle, measured at the end of the evaluating period—as clearly demonstrated by Figure 6b, this is a very vague parameter/metric especially in short-term measurements that are presented and discussed by the majority of the published papers [12,13,14,15,25,33,34,37] reporting on the laser-induced wettability control.
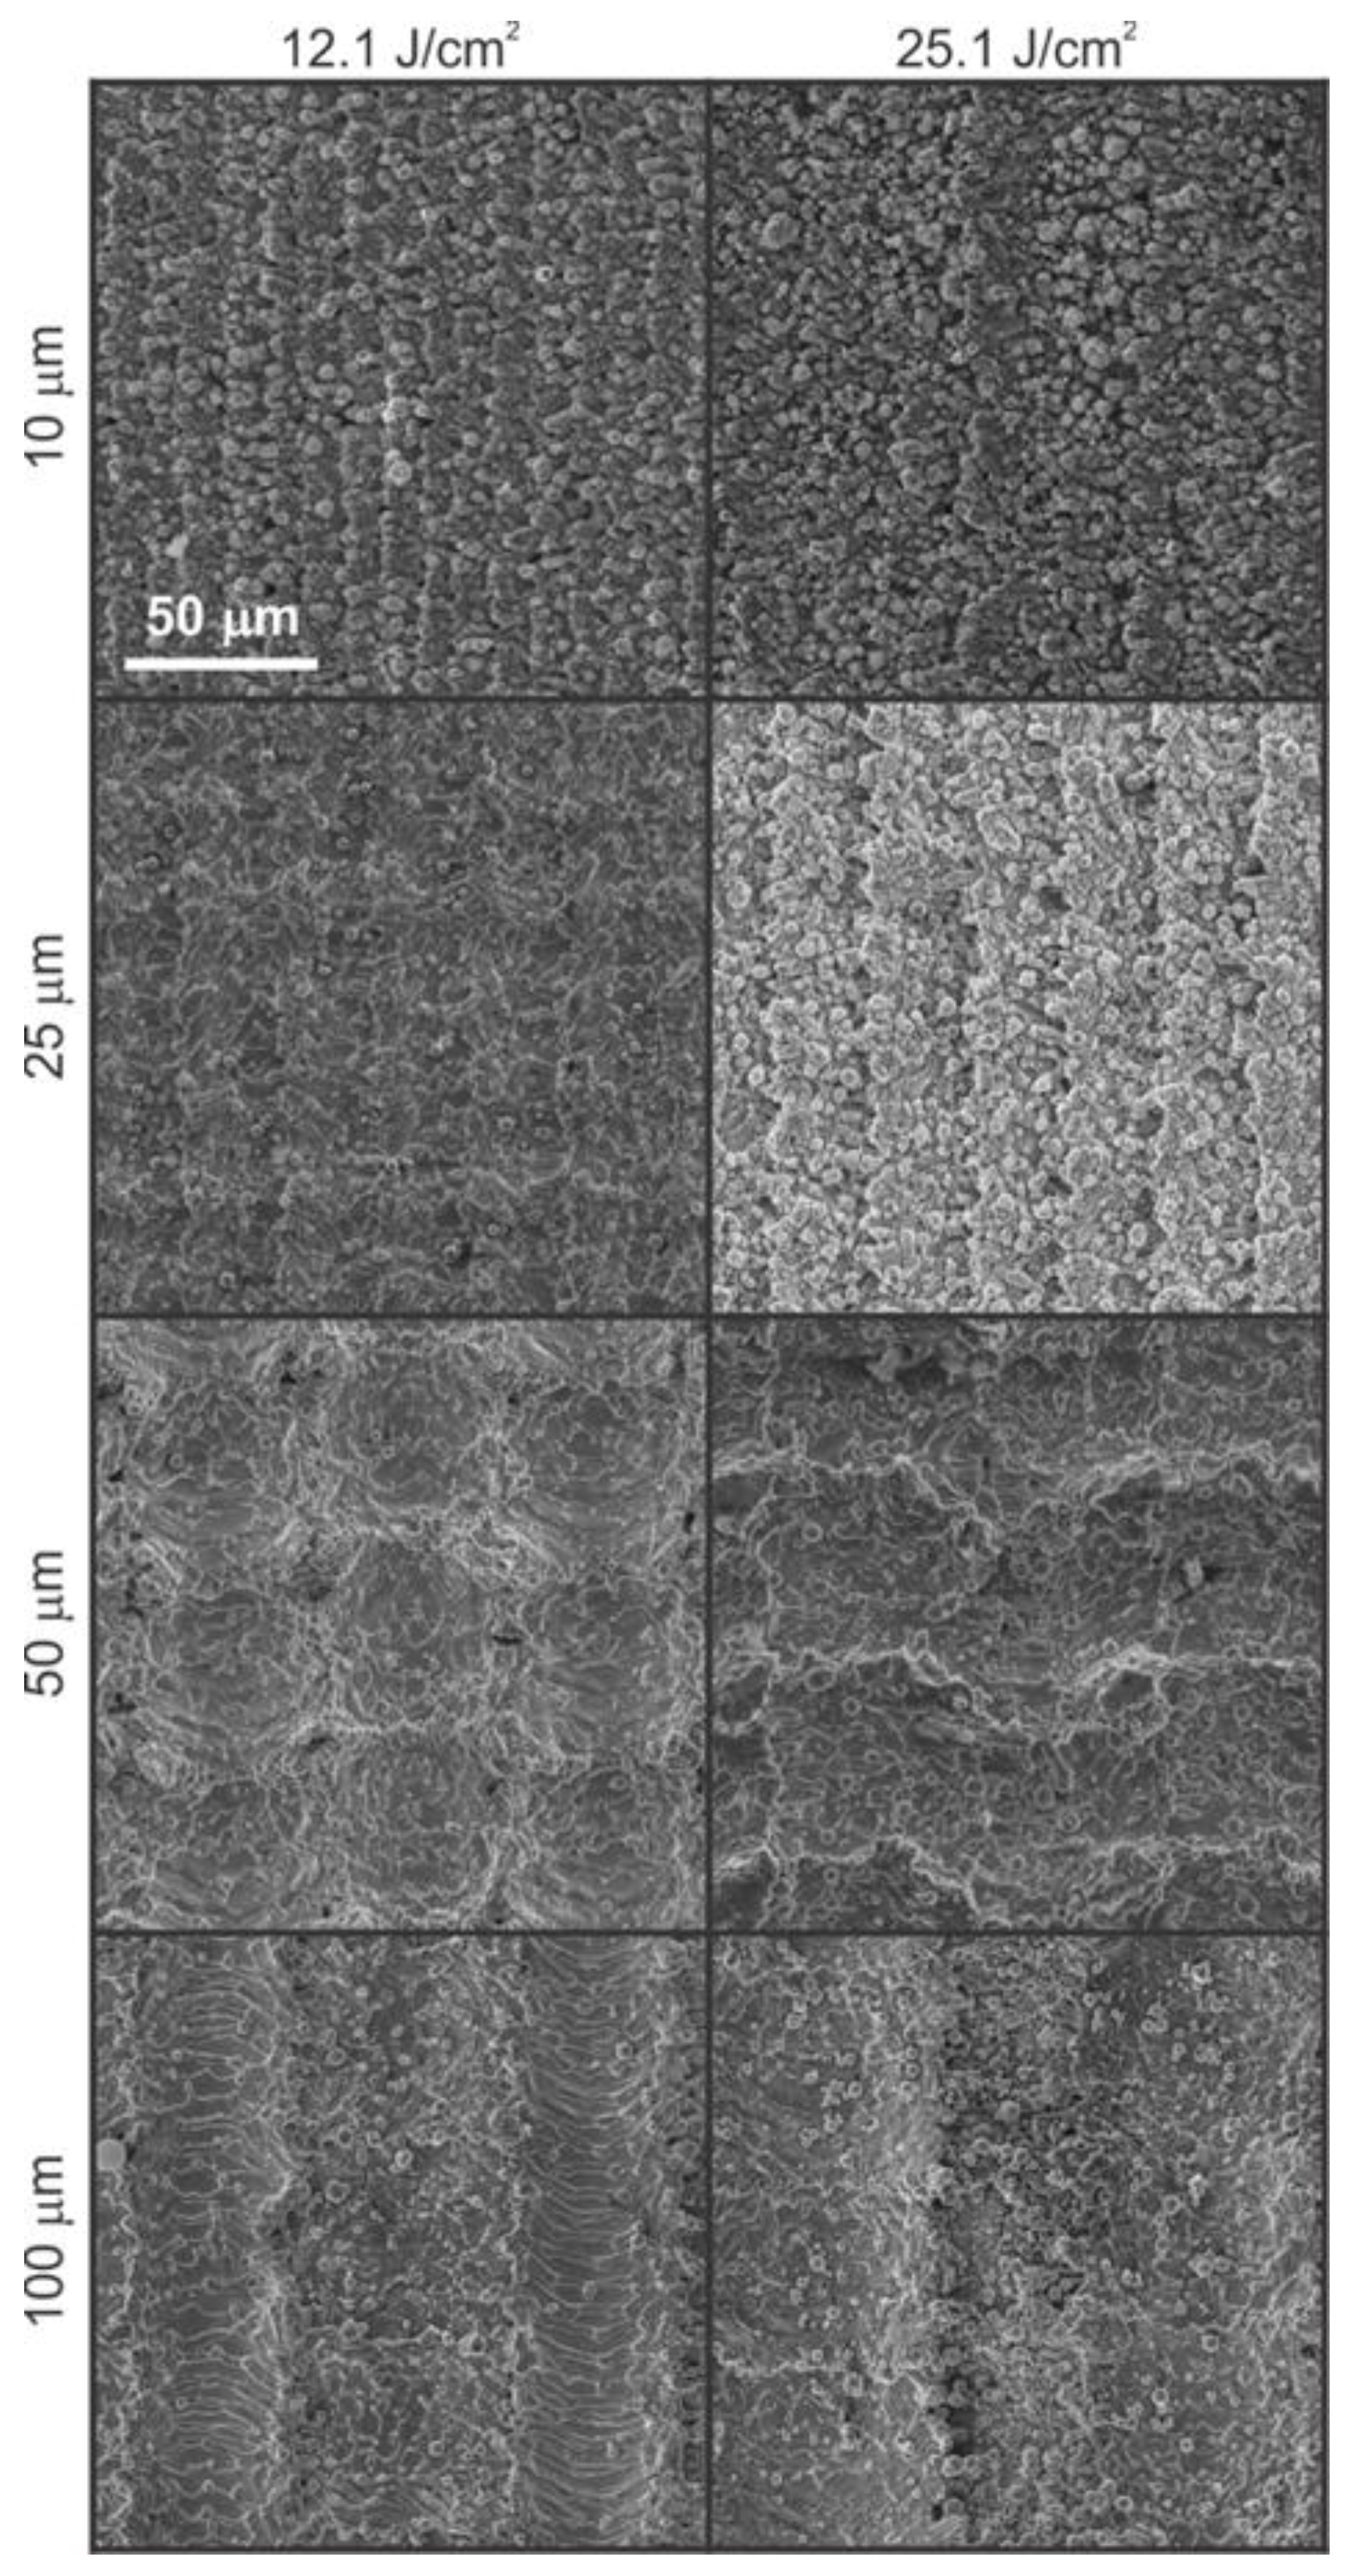
3.3. Influence of Scan Line Separation on Surface Wetting Properties
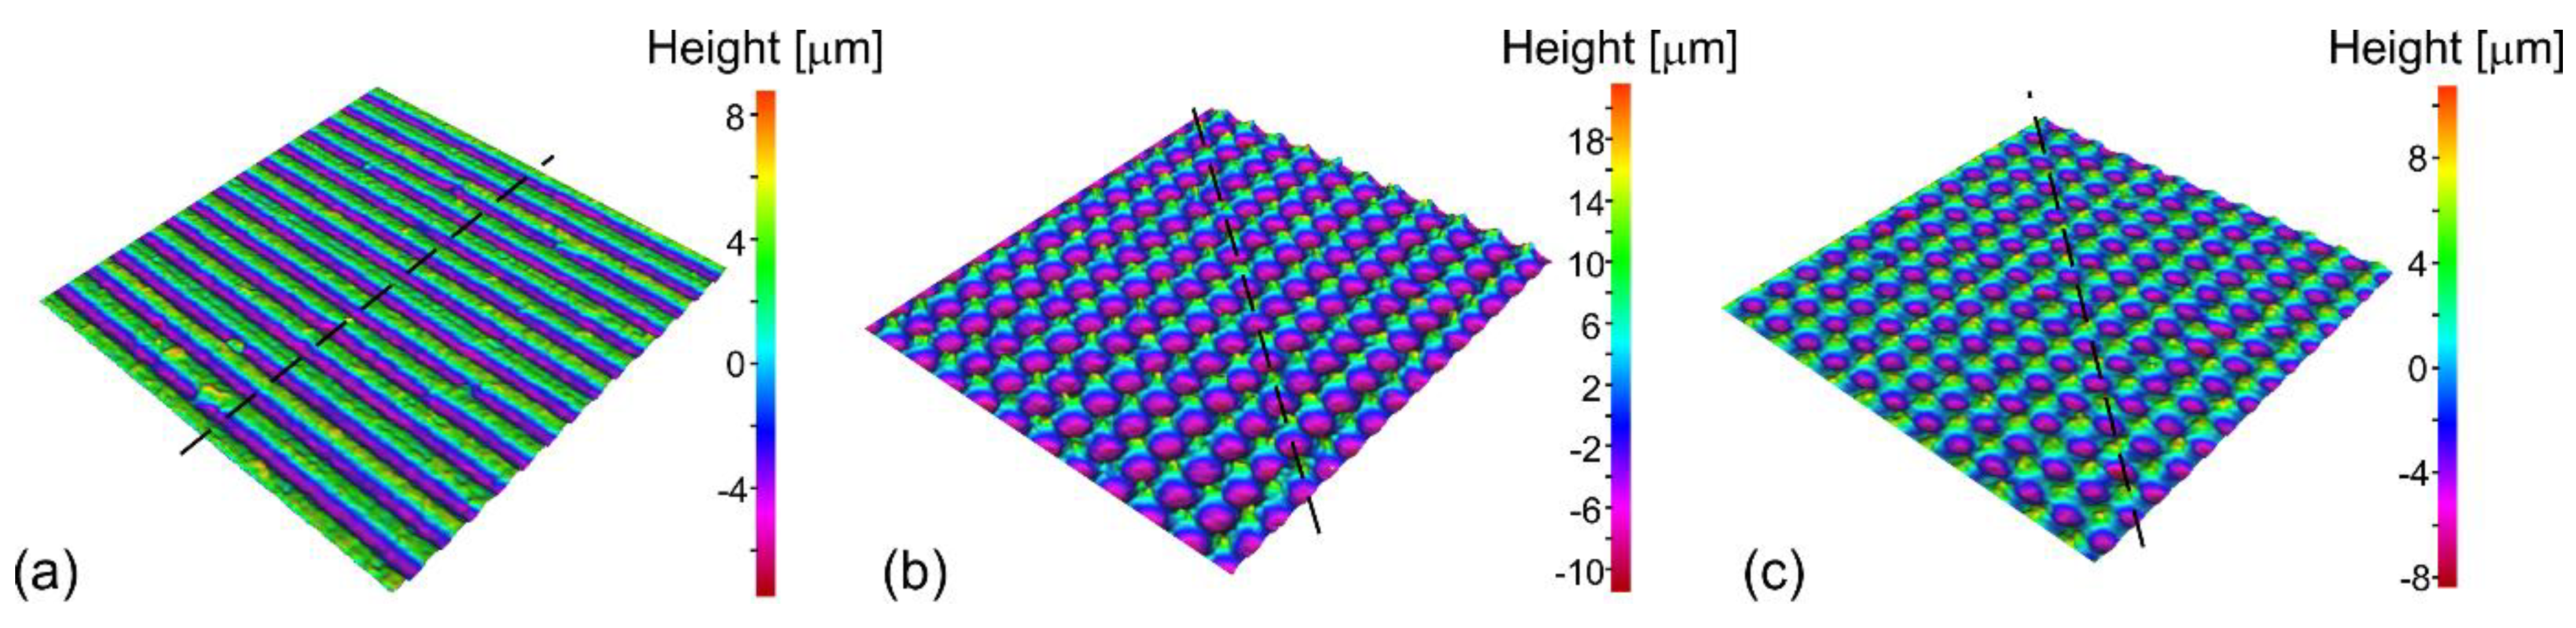
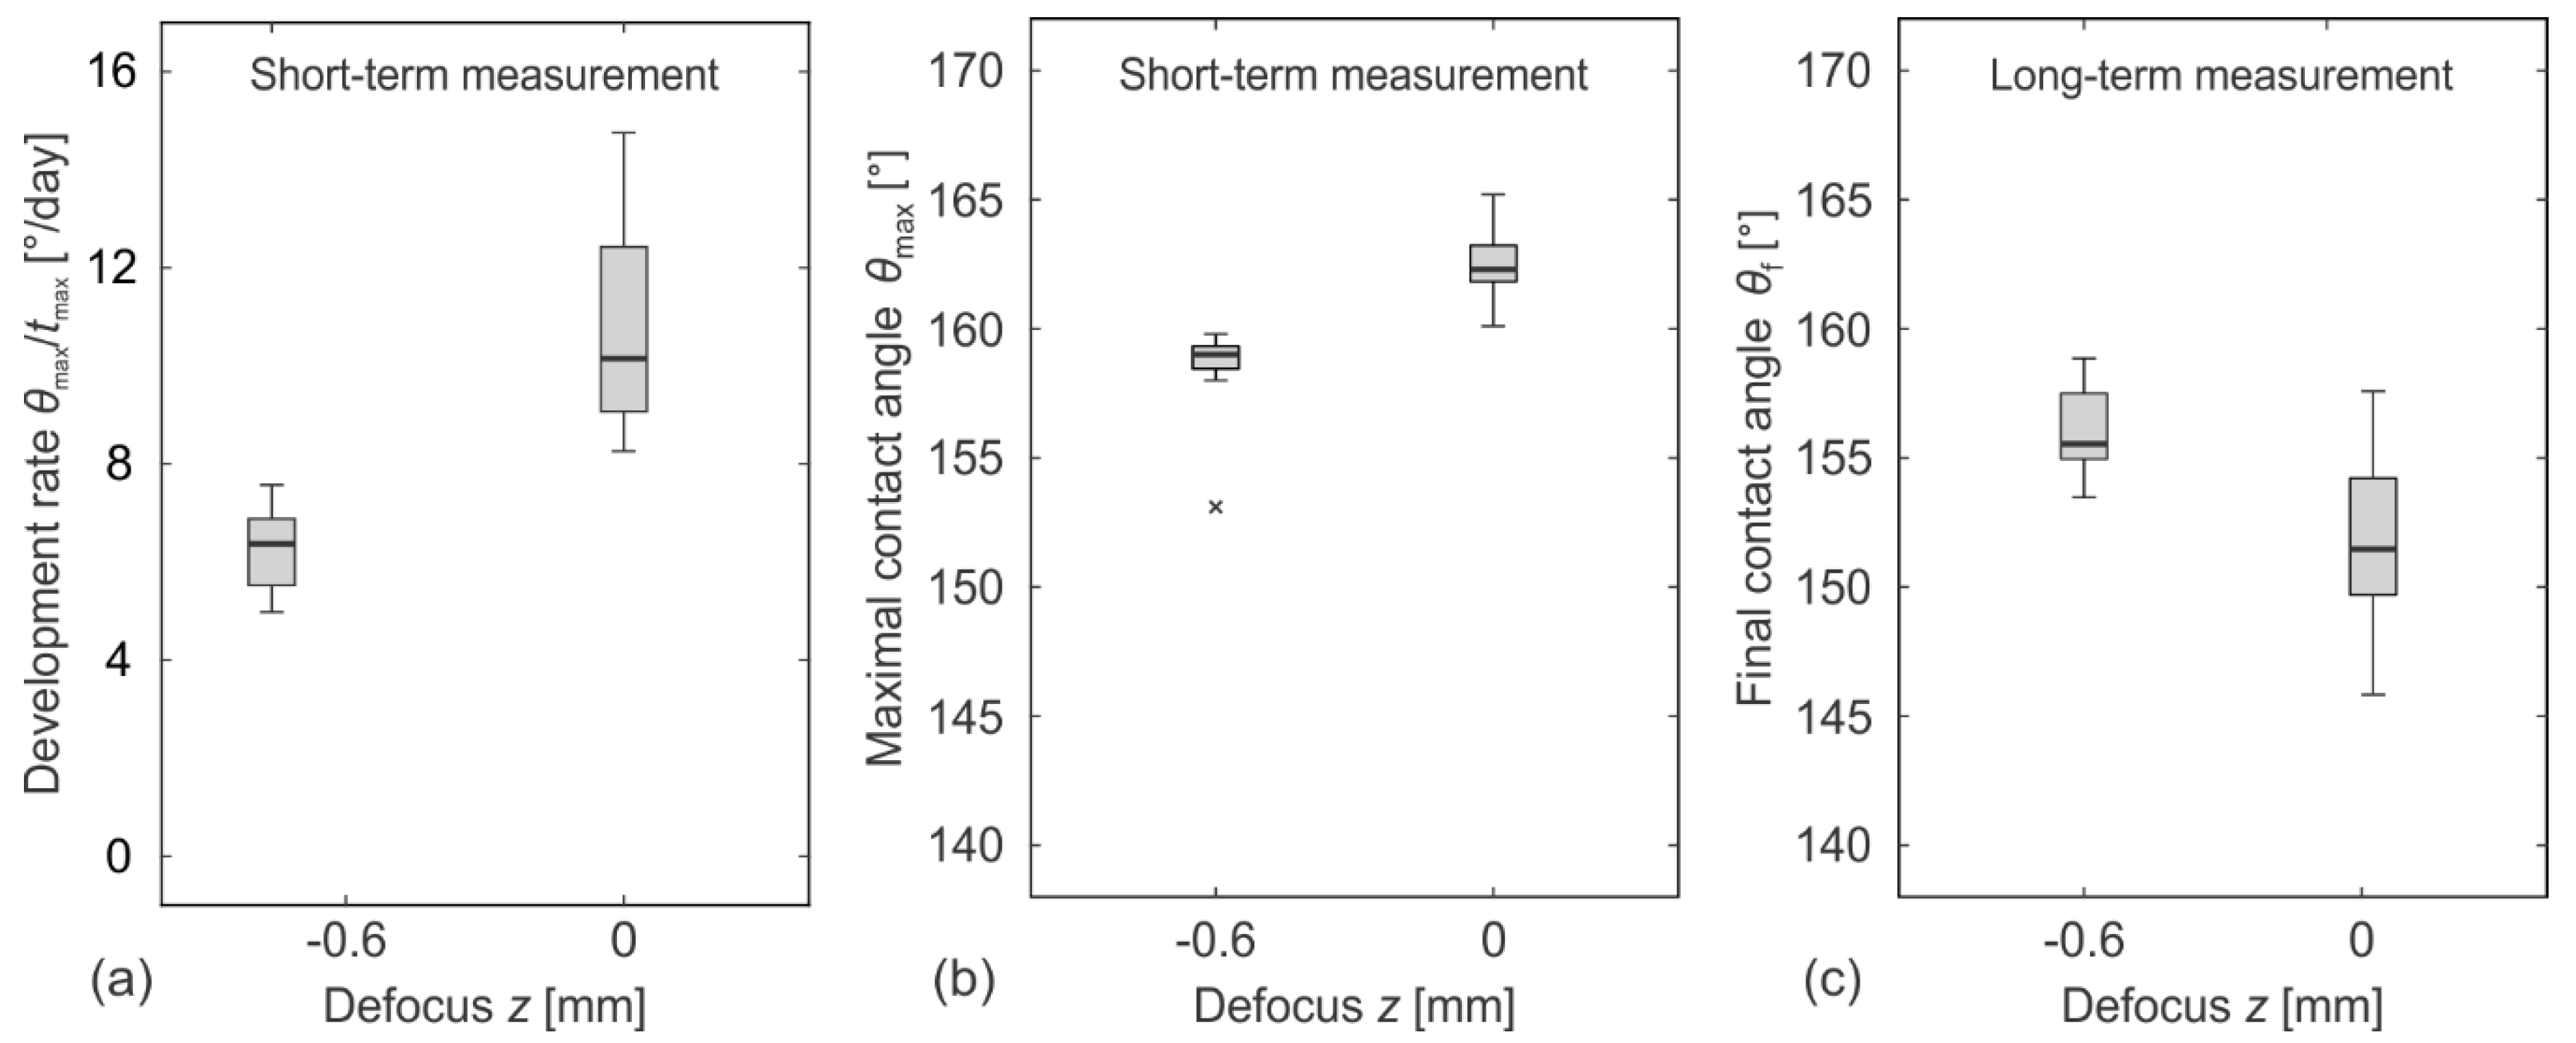
3.4. Influence of Focal Position on Surface Wetting Properties
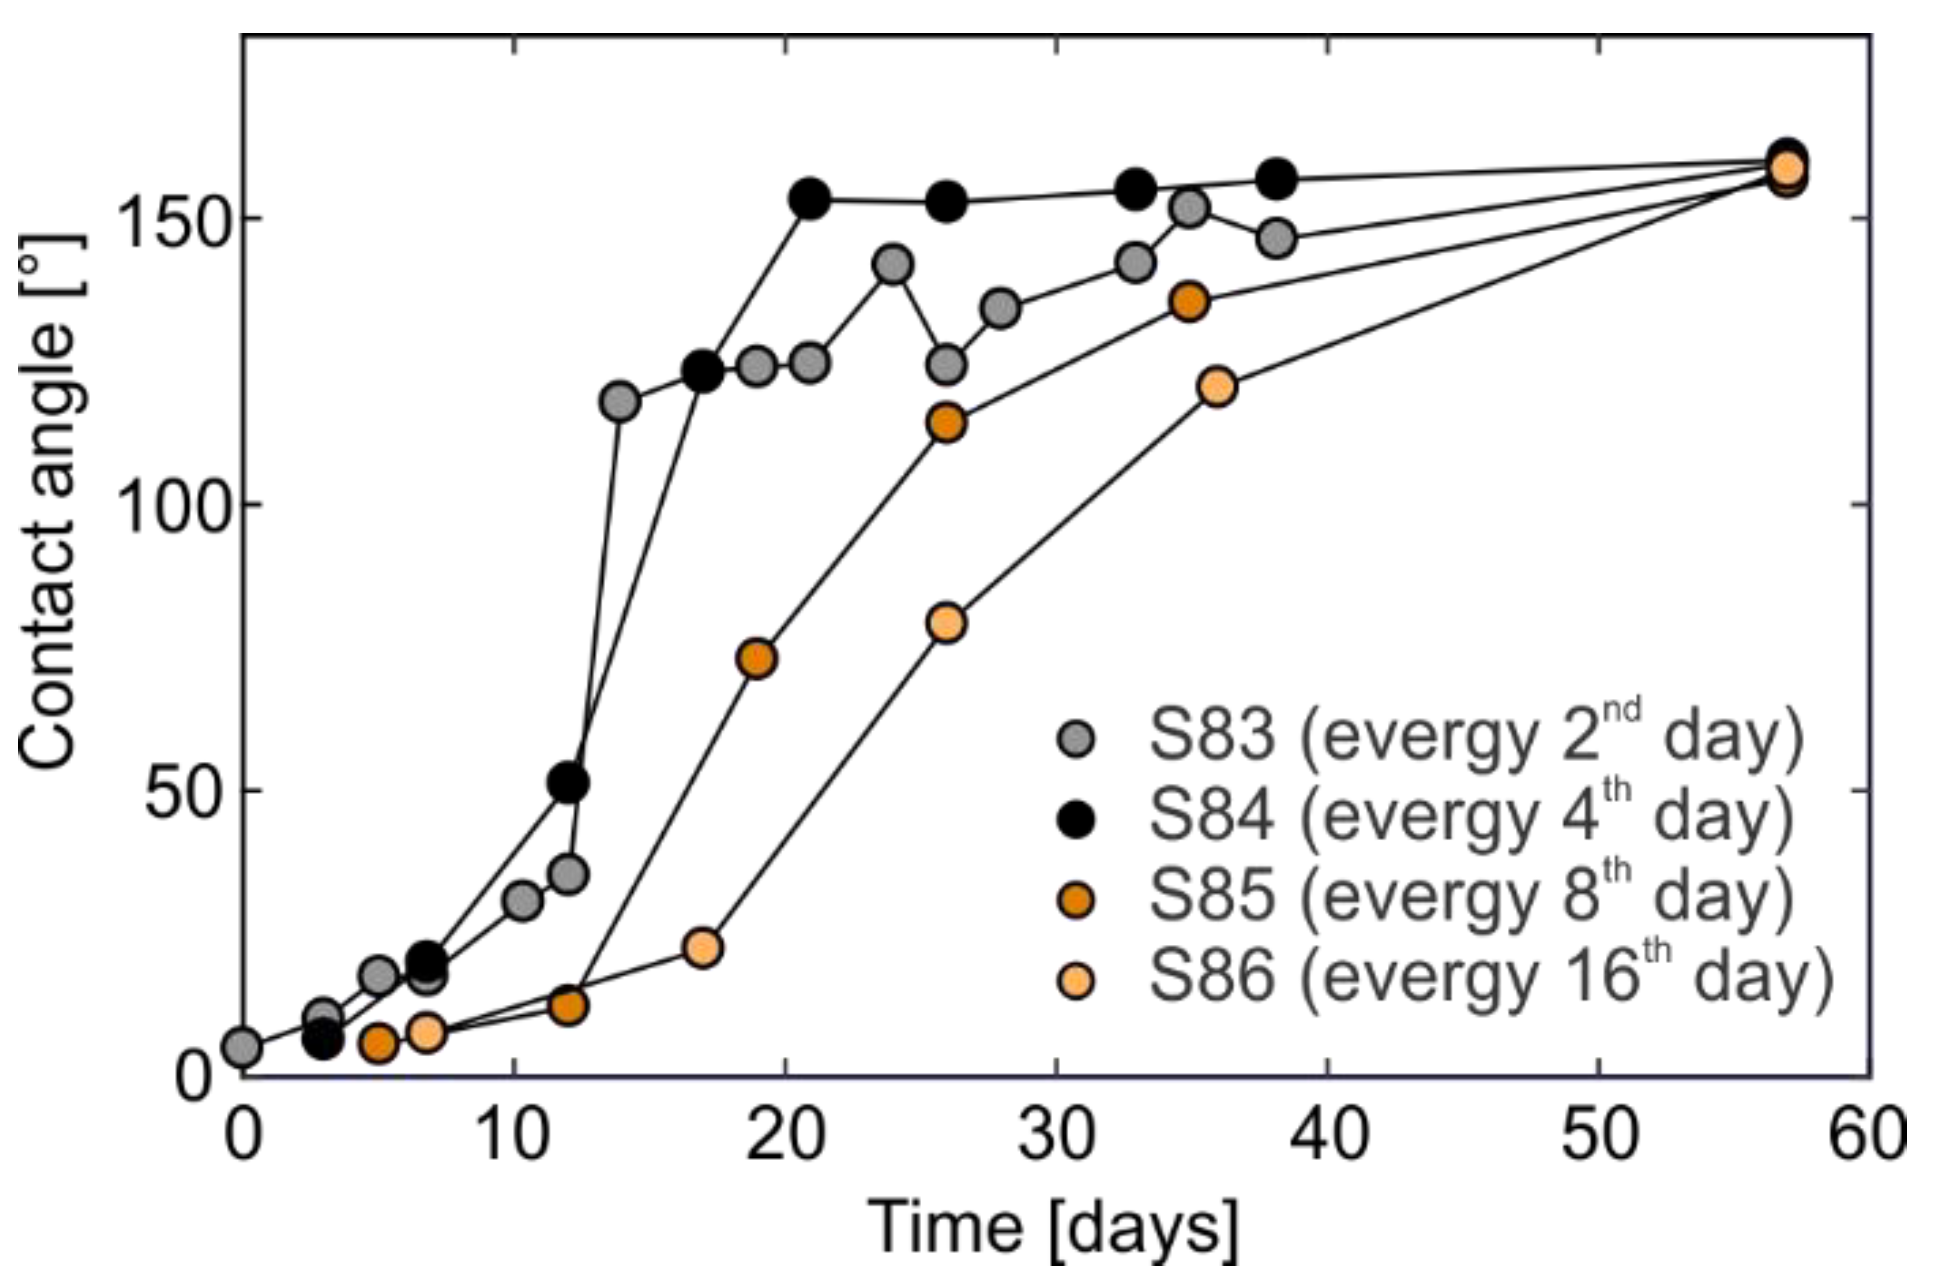
3.5. The Effect of Wetting Period on Hydrophobicity Development
4. Discussion
5. Conclusions
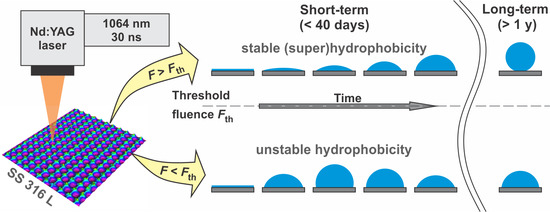
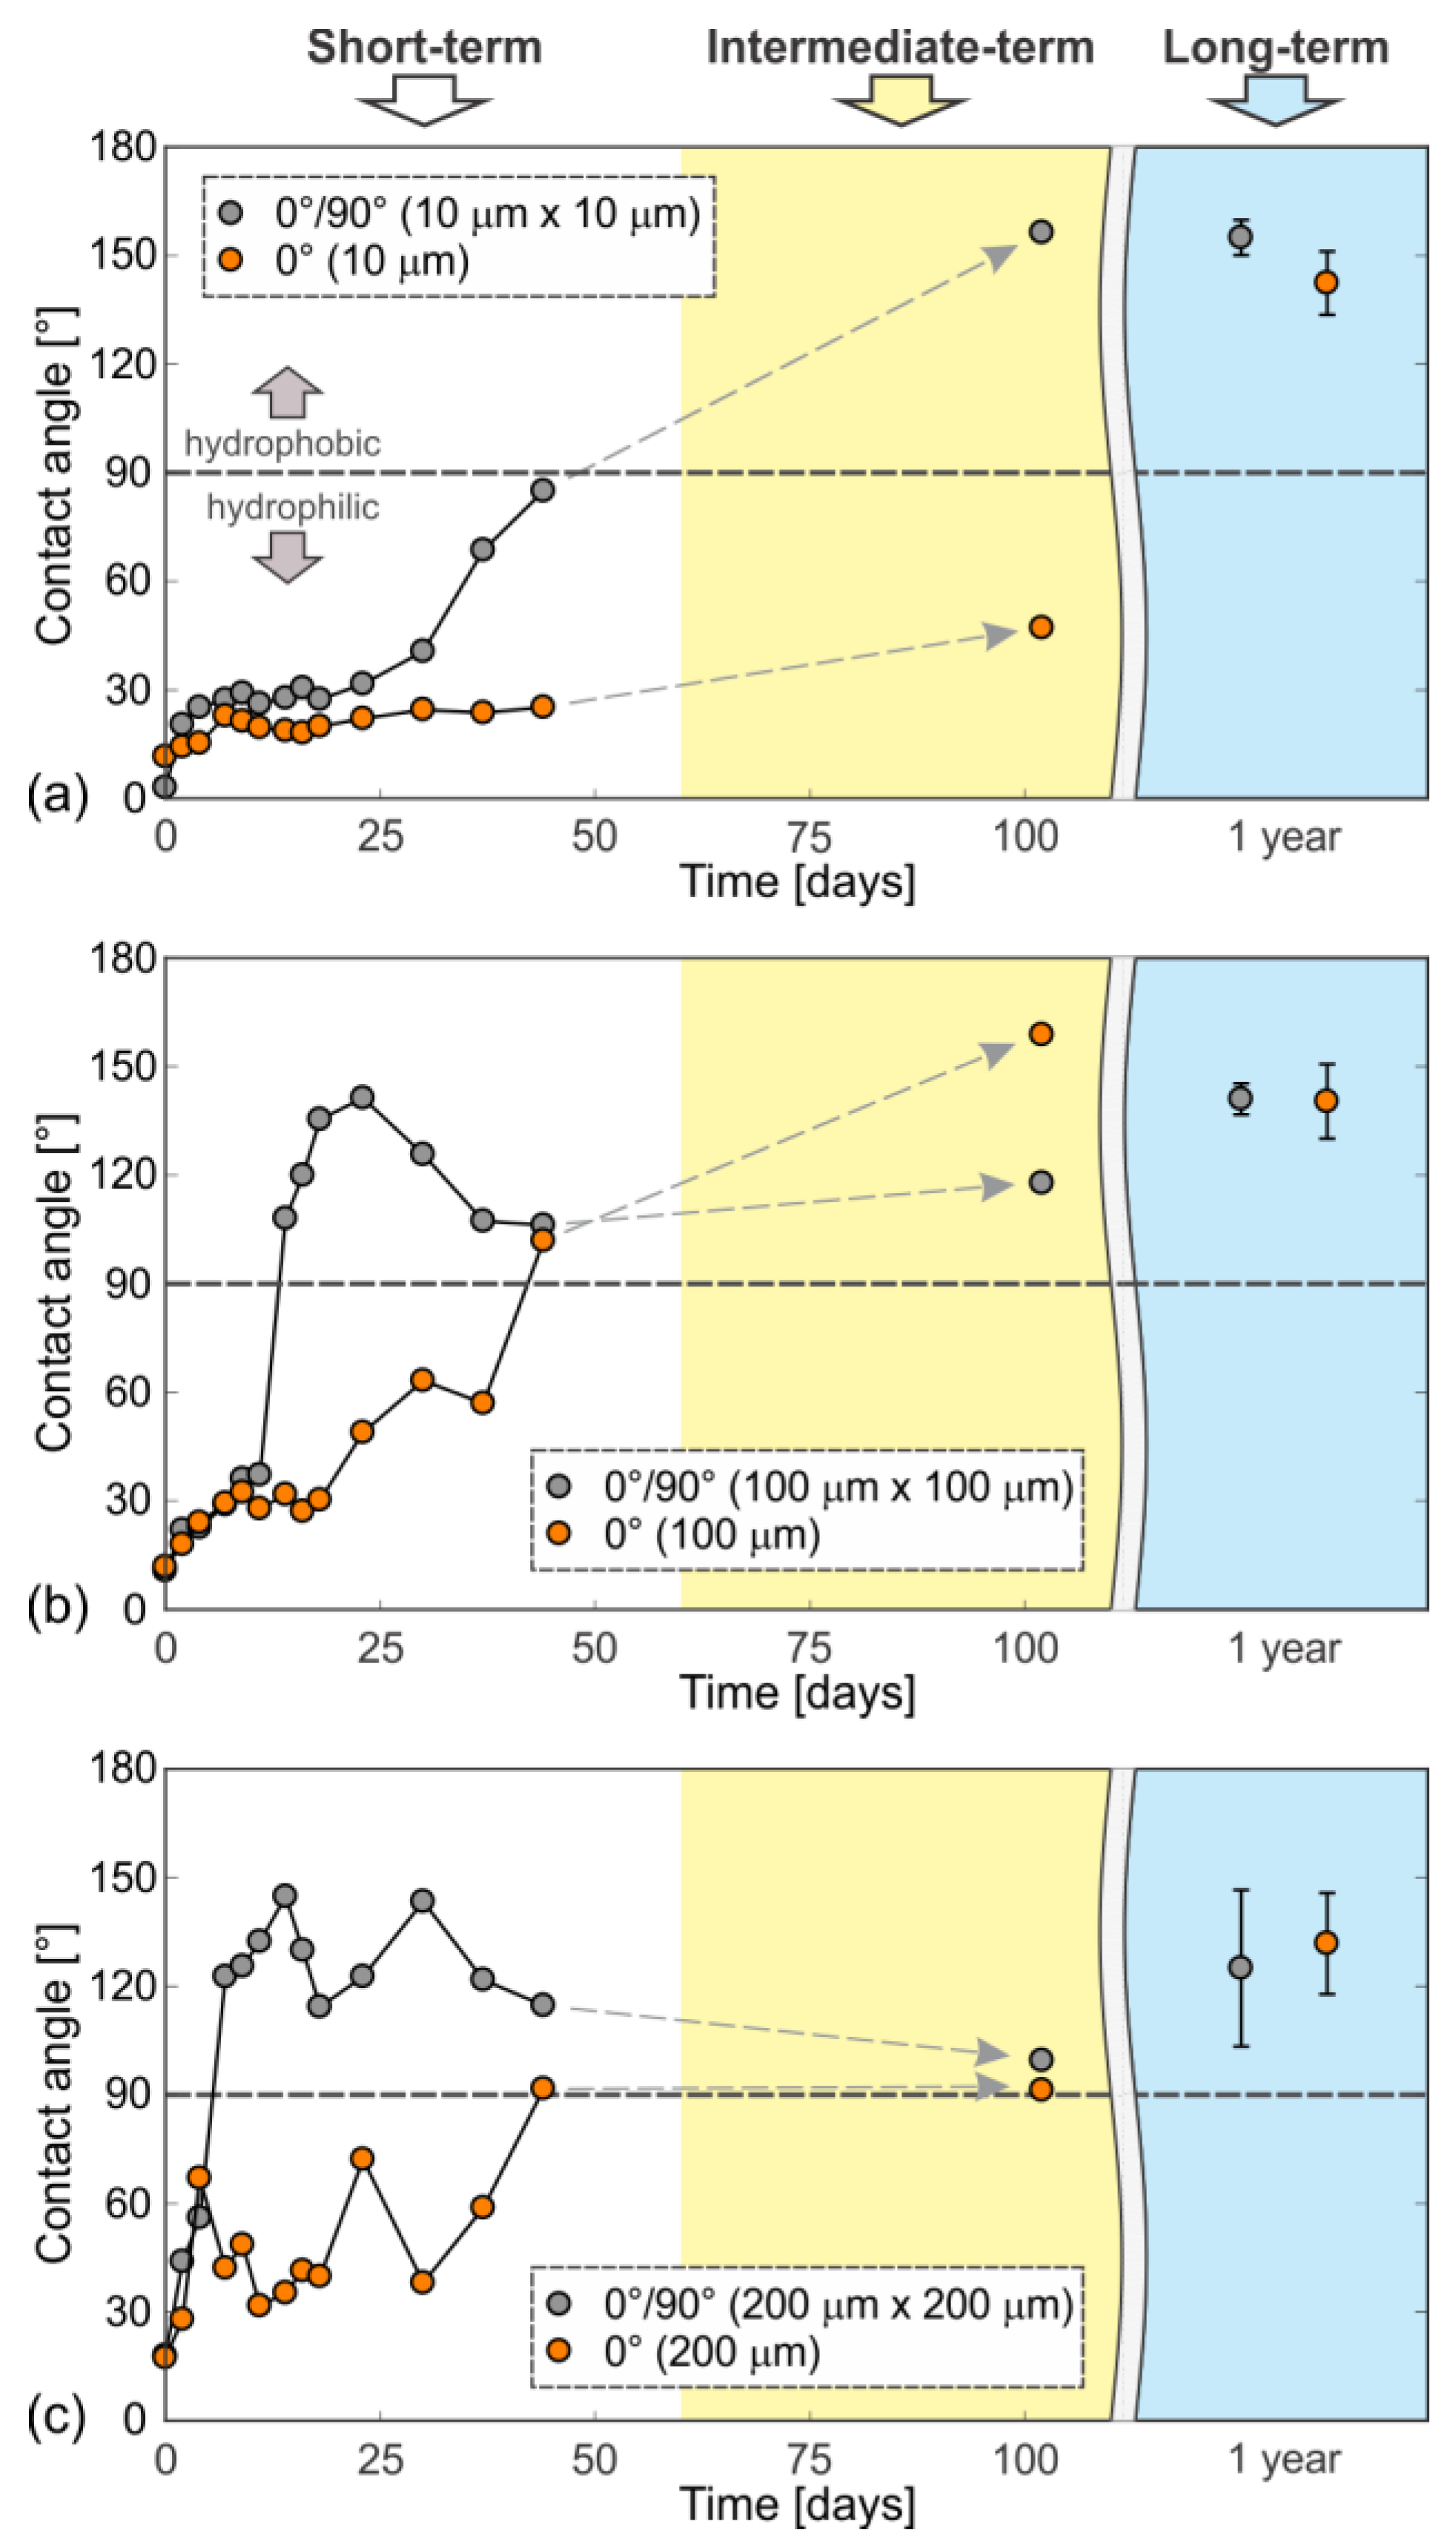
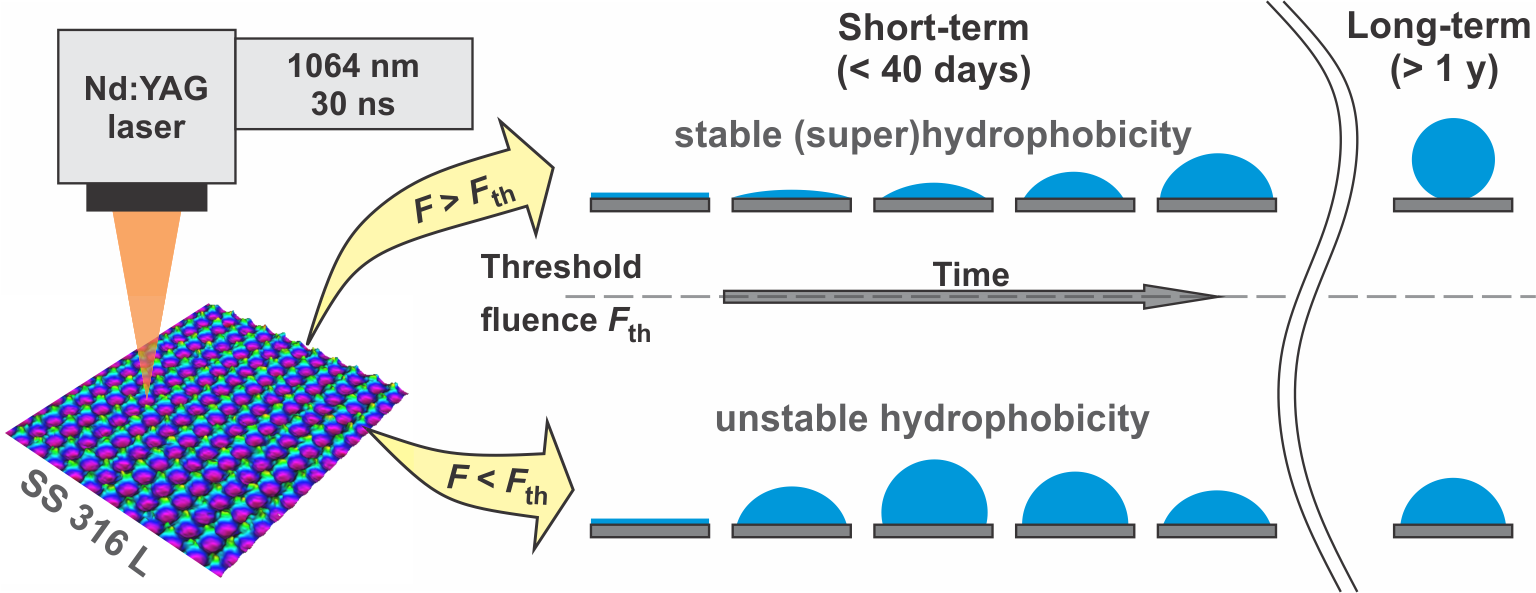
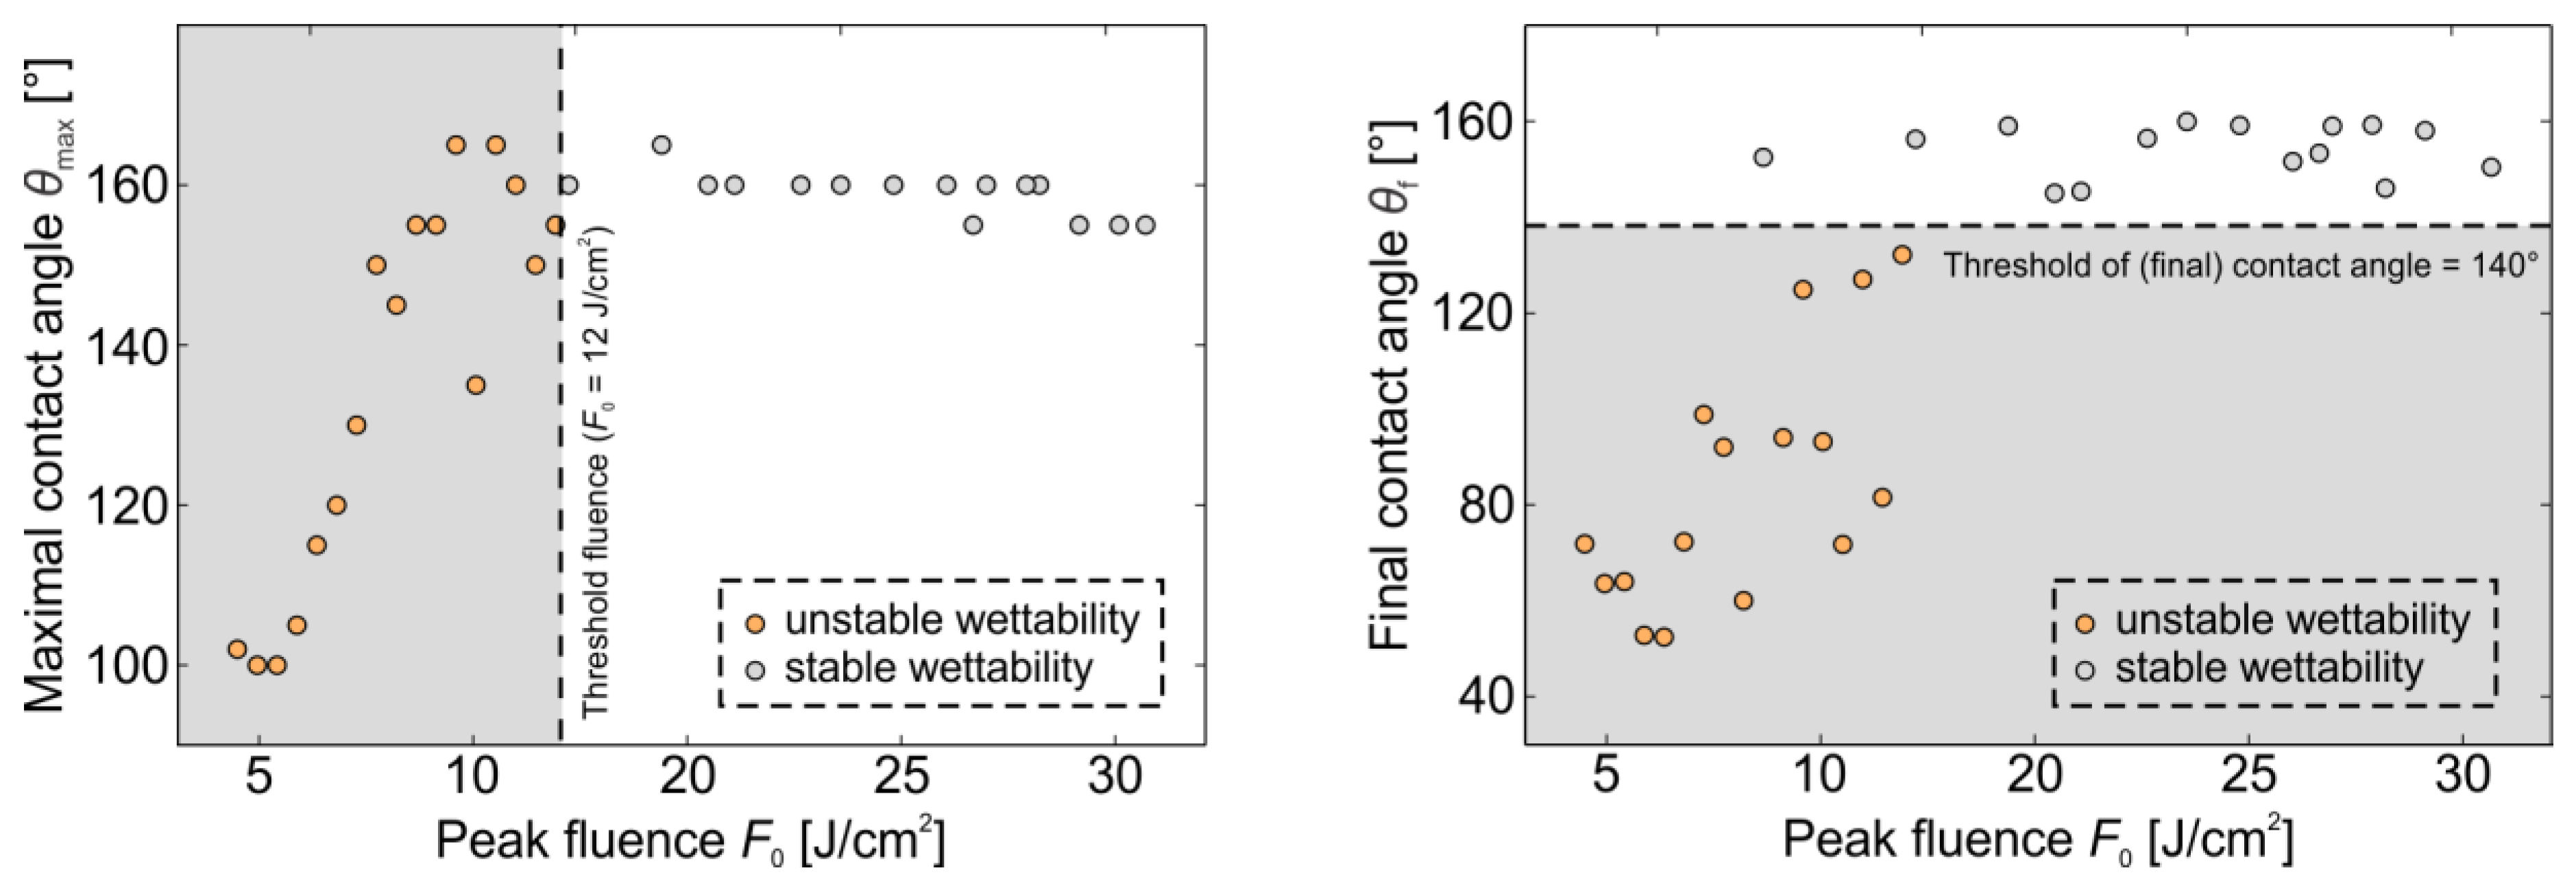
- Depending on laser fluence, the laser-textured surfaces can develop stable or unstable hydrophobicity; in our case, the stable conditions were achieved if the peak fluence exceeded the threshold fluence of F0 = 12 J cm−2. In this case, all final contact angles were above 140°. If the fluence was below this threshold, the surface first became hydrophobic and after achieving the maximal contact angle, its hydrophobicity decreased by time.
- The short-term evaluation (e.g., within only 2 months) that is presented by the majority of papers covering this topic, can lead to wrong conclusions, such as stable hydrophilicity for smaller scan line separations or appearance of the wettability gradients due to processing at different focal positions. Here, a long-term examination reveals that such surfaces tend to become hydrophobic after a long-enough period.
- The presented results indicate that a faster development of hydrophobicity immediately after the laser texturing usually leads to a lower final contact angle and vice versa, if this transition is really slow (as in our case of 10-μm scan line separation), larger contact angles or even superhydrophobic surfaces exhibiting the self-cleaning effect are expected when the transition is over and the stable conditions are achieved.
- The wetting period due to the measurements of the contact angle influences the hydrophilic-to-hydrophobic transition, but it appears to have no influence on the final wettability (the final contact angle), when stable conditions are achieved.
Supplementary Materials
Author Contributions
Funding
Acknowledgments
Conflicts of Interest
References
- Barthlott, W.; Neinhuis, C. Purity of the sacred lotus, or escape from contamination in biological surfaces. Planta 1997, 202, 1–8. [Google Scholar] [CrossRef]
- Muller, F.A.; Kunz, C.; Graf, S. Bio-Inspired Functional Surfaces Based on Laser-Induced Periodic Surface Structures. Materials 2016, 9. [Google Scholar] [CrossRef] [PubMed]
- Li, K.Q.; Zeng, X.R.; Li, H.Q.; Lai, X.J. A study on the fabrication of superhydrophobic iron surfaces by chemical etching and galvanic replacement methods and their anti-icing properties. Appl. Surf. Sci. 2015, 346, 458–463. [Google Scholar] [CrossRef]
- Tuteja, A.; Choi, W.; Ma, M.L.; Mabry, J.M.; Mazzella, S.A.; Rutledge, G.C.; McKinley, G.H.; Cohen, R.E. Designing superoleophobic surfaces. Science 2007, 318, 1618–1622. [Google Scholar] [CrossRef] [PubMed]
- Ishizaki, T.; Sasagawa, K.; Furukawa, T.; Kumagai, S.; Yamamoto, E.; Chiba, S.; Kamiyama, N.; Kiguchi, T. Effect of treatment temperature on surface wettability of methylcyclosiloxane layer formed by chemical vapor deposition. Appl. Surf. Sci. 2016, 379, 446–451. [Google Scholar] [CrossRef]
- Zhang, X.F.; Chen, R.J.; Liu, Y.H.; Hu, J.M. Electrochemically generated sol-gel films as inhibitor containers of superhydrophobic surfaces for the active corrosion protection of metals. J Mater. Chem. A 2016, 4, 649–656. [Google Scholar] [CrossRef]
- Kirner, S.V.; Hermens, U.; Mimidis, A.; Skoulas, E.; Florian, C.; Hischen, F.; Plamadeala, C.; Baumgartner, W.; Winands, K.; Mescheder, H.; et al. Mimicking bug-like surface structures and their fluid transport produced by ultrashort laser pulse irradiation of steel. Applied Physics A 2017, 123, 754. [Google Scholar] [CrossRef]
- Hermens, U.; Kirner, S.V.; Emonts, C.; Comanns, P.; Skoulas, E.; Mimidis, A.; Mescheder, H.; Winands, K.; Kruger, J.; Stratakis, E.; et al. Mimicking lizard-like surface structures upon ultrashort laser pulse irradiation of inorganic materials. Appl. Surf. Sci. 2017, 418, 499–507. [Google Scholar] [CrossRef]
- Bonse, J.; Kirner, S.; Griepentrog, M.; Spaltmann, D.; Krüger, J. Femtosecond Laser Texturing of Surfaces for Tribological Applications. Materials 2018, 11, 801. [Google Scholar] [CrossRef] [PubMed]
- Kasischke, M.; Maragkaki, S.; Volz, S.; Ostendorf, A.; Gurevich, E.L. Simultaneous nanopatterning and reduction of graphene oxide by femtosecond laser pulses. Appl. Surf. Sci. 2018, 445, 197–203. [Google Scholar] [CrossRef] [Green Version]
- Gregorčič, P.; Sedlaček, M.; Podgornik, B.; Reif, J. Formation of laser-induced periodic surface structures (LIPSS) on tool steel by multiple picosecond laser pulses of different polarizations. Appl. Surf. Sci. 2016, 387, 698–706. [Google Scholar] [CrossRef]
- Ta, D.V.; Dunn, A.; Wasley, T.J.; Kay, R.W.; Stringer, J.; Smith, P.J.; Connaughton, C.; Shephard, J.D. Nanosecond laser textured superhydrophobic metallic surfaces and their chemical sensing applications. Appl. Surf. Sci. 2015, 357, 248–254. [Google Scholar] [CrossRef]
- Ta, V.D.; Dunn, A.; Wasley, T.J.; Li, J.; Kay, R.W.; Stringer, J.; Smith, P.J.; Esenturk, E.; Connaughton, C.; Shephard, J.D. Laser textured superhydrophobic surfaces and their applications for homogeneous spot deposition. Appl. Surf. Sci. 2016, 365, 153–159. [Google Scholar] [CrossRef]
- Ta, V.D.; Dunn, A.; Wasley, T.J.; Li, J.; Kay, R.W.; Stringer, J.; Smith, P.J.; Esenturk, E.; Connaughton, C.; Shephard, J.D. Laser textured surface gradients. Appl. Surf. Sci. 2016, 371, 583–589. [Google Scholar] [CrossRef]
- Gregorčič, P.; Šetina-Batič, B.; Hočevar, M. Controlling the stainless steel surface wettability by nanosecond direct laser texturing at high fluences. Appl. Phys. A 2017, 123, 1–8. [Google Scholar] [CrossRef]
- Jiangyou, L.; Zhijian, H.; Peiyang, Z.; Xiaozhu, X.; Caixia, Z.; Wenjie, H.; Wei, H. Low-Cost Fabrication of Large-Area Broccoli-Like Multiscale Micro- and Nanostructures for Metallic Super-Hydrophobic Surfaces with Ultralow Water Adhesion and Superior Anti-Frost Ability. Adv. Mater. Interfaces 2018, 5, 1800353. [Google Scholar] [CrossRef]
- Pendurthi, A.; Movafaghi, S.; Wang, W.; Shadman, S.; Yalin, A.P.; Kota, A.K. Fabrication of Nanostructured Omniphobic and Superomniphobic Surfaces with Inexpensive CO2 Laser Engraver. Acs Appl. Mater. Interfaces 2017, 9, 25656–25661. [Google Scholar] [CrossRef] [PubMed]
- Lawrence, J.; Waugh, D.G. Laser Surface Engineering; Elsevier: Oxford, UK, 2015. [Google Scholar]
- Vorobyev, A.Y.; Guo, C.L. Direct femtosecond laser surface nano/microstructuring and its applications. Laser Photonics Rev. 2013, 7, 385–407. [Google Scholar] [CrossRef]
- Conradi, M.; Drnovšek, A.; Gregorčič, P. Wettability and friction control of a stainless steel surface by combining nanosecond laser texturing and adsorption of superhydrophobic nanosilica particles. Sci. Rep. 2018, 8, 7457. [Google Scholar] [CrossRef] [PubMed]
- Sedlaček, M.; Gregorčič, P.; Podgornik, B. Use of the Roughness Parameters Ssk and Sku to Control Friction—A Method for Designing Surface Texturing. Tribol. Trans. 2016, 1–7. [Google Scholar] [CrossRef]
- Bonse, J.; Koter, R.; Hartelt, M.; Spaltmann, D.; Pentzien, S.; Hohm, S.; Rosenfeld, A.; Kruger, J. Tribological performance of femtosecond laser-induced periodic surface structures on titanium and a high toughness bearing steel. Appl. Surf. Sci. 2015, 336, 21–27. [Google Scholar] [CrossRef]
- Simitzi, C.; Ranella, A.; Stratakis, E. Controlling the morphology and outgrowth of nerve and neuroglial cells: The effect of surface topography. Acta Biomaterialia 2017, 51, 21–52. [Google Scholar] [CrossRef] [PubMed] [Green Version]
- Donik, Č.; Kocijan, A.; Paulin, I.; Hočevar, M.; Gregorčič, P.; Godec, M. Improved biodegradability of Fe–Mn alloy after modification of surface chemistry and topography by a laser ablation. Appl. Surf. Sci. 2018, 453, 383–393. [Google Scholar] [CrossRef]
- Kietzig, A.M.; Hatzikiriakos, S.G.; Englezos, P. Patterned Superhydrophobic Metallic Surfaces. Langmuir 2009, 25, 4821–4827. [Google Scholar] [CrossRef] [PubMed]
- Zorba, V.; Stratakis, E.; Barberoglou, M.; Spanakis, E.; Tzanetakis, P.; Anastasiadis, S.H.; Fotakis, C. Biomimetic Artificial Surfaces Quantitatively Reproduce the Water Repellency of a Lotus Leaf. Adv. Mater. 2008, 20, 4049–4054. [Google Scholar] [CrossRef]
- Hsiao, E.; Barthel, A.J.; Kim, S.H. Effects of Nanoscale Surface Texturing on Self-Healing of Boundary Lubricant Film via Lateral Flow. Tribol. Lett. 2011, 44, 287–292. [Google Scholar] [CrossRef]
- Vorobyev, A.Y.; Guo, C.L. Multifunctional surfaces produced by femtosecond laser pulses. J. Appl. Phys. 2015, 117. [Google Scholar] [CrossRef] [Green Version]
- Guo, P.; Zheng, Y.M.; Wen, M.X.; Song, C.; Lin, Y.C.; Jiang, L. Icephobic/Anti-Icing Properties of Micro/Nanostructured Surfaces. Adv. Mater. 2012, 24, 2642–2648. [Google Scholar] [CrossRef] [PubMed]
- Ahmmed, K.M.T.; Patience, C.; Kietzig, A.M. Internal and External Flow over Laser-Textured Superhydrophobic Polytetrafluoroethylene (PTFE). Acs Appl. Mater. Inter. 2016, 8, 27411–27419. [Google Scholar] [CrossRef] [PubMed]
- Zupančič, M.; Može, M.; Gregorčič, P.; Golobič, I. Nanosecond laser texturing of uniformly and non-uniformly wettable micro structured metal surfaces for enhanced boiling heat transfer. Appl. Surf. Sci. 2017, 399, 480–490. [Google Scholar] [CrossRef]
- Gregorčič, P.; Zupančič, M.; Golobič, I. Scalable Surface Microstructuring by a Fiber Laser for Controlled Nucleate Boiling Performance of High- and Low-Surface-Tension Fluids. Sci. Rep. 2018, 8, 7461. [Google Scholar] [CrossRef] [PubMed]
- Bizi-bandoki, P.; Valette, S.; Audouard, E.; Benayoun, S. Time dependency of the hydrophilicity and hydrophobicity of metallic alloys subjected to femtosecond laser irradiations. Appl. Surf. Sci. 2013, 273, 399–407. [Google Scholar] [CrossRef]
- Trdan, U.; Hočevar, M.; Gregorčič, P. Transition from superhydrophilic to superhydrophobic state of laser textured stainless steel surface and its effect on corrosion resistance. Corros. Sci. 2017, 123, 21–26. [Google Scholar] [CrossRef]
- Gabzdyl, J. Fibre lasers make their mark. Nature Photonics 2008, 2, 21–23. [Google Scholar] [CrossRef]
- Baddoo, N.R. Stainless steel in construction: A review of research, applications, challenges and opportunities. J. Constr. Steel Res. 2008, 64, 1199–1206. [Google Scholar] [CrossRef]
- Yang, Z.; Tian, Y.L.; Yang, C.J.; Wang, F.J.; Liu, X.P. Modification of wetting property of Inconel 718 surface by nanosecond laser texturing. Appl. Surf. Sci. 2017, 414, 313–324. [Google Scholar] [CrossRef] [Green Version]
- Sarkar, A.; Kietzig, A.M. General equation of wettability: A tool to calculate the contact angle for a rough surface. Chem. Phys. Lett. 2013, 574, 106–111. [Google Scholar] [CrossRef]
- McHale, G.; Shirtcliffe, N.J.; Newton, M.I. Super-hydrophobic and super-wetting surfaces: Analytical potential? Analyst 2004, 129, 284–287. [Google Scholar] [CrossRef]
- Marmur, A.; Della Volpe, C.; Siboni, S.; Amirfazli, A.; Drelich, J.W. Contact angles and wettability: towards common and accurate terminology. Surf. Innov. 2017, 5, 3–8. [Google Scholar] [CrossRef] [Green Version]
- Wang, S.; Jiang, L. Definition of superhydrophobic states. Adv. Mater. 2007, 19, 3423–3424. [Google Scholar] [CrossRef]
- Genzer, J.; Efimenko, K. Recent developments in superhydrophobic surfaces and their relevance to marine fouling: a review. Biofouling 2006, 22, 339–360. [Google Scholar] [CrossRef] [PubMed]
- Chang, F.M.; Cheng, S.L.; Hong, S.J.; Sheng, Y.J.; Tsao, H.K. Superhydrophilicity to superhydrophobicity transition of CuO nanowire films. Appl. Phys. Lett. 2010, 96. [Google Scholar] [CrossRef]
- Long, J.Y.; Zhong, M.L.; Fan, P.X.; Gong, D.W.; Zhang, H.J. Wettability conversion of ultrafast laser structured copper surface. J. Laser Appl. 2015, 27. [Google Scholar] [CrossRef] [Green Version]


| Δx, Δy (μm) | Sa (μm) | |
|---|---|---|
| F0= 12.1 J cm−2 | F0= 25.1 J cm−2 | |
| 10 | 0.85 | 1.47 |
| 25 | 1.13 | 1.70 |
| 50 | 4.54 | 5.40 |
| 100 | 1.71 | 4.02 |
© 2018 by the authors. Licensee MDPI, Basel, Switzerland. This article is an open access article distributed under the terms and conditions of the Creative Commons Attribution (CC BY) license (http://creativecommons.org/licenses/by/4.0/).
Share and Cite
Gregorčič, P.; Conradi, M.; Hribar, L.; Hočevar, M. Long-Term Influence of Laser-Processing Parameters on (Super)hydrophobicity Development and Stability of Stainless-Steel Surfaces. Materials 2018, 11, 2240. https://doi.org/10.3390/ma11112240
Gregorčič P, Conradi M, Hribar L, Hočevar M. Long-Term Influence of Laser-Processing Parameters on (Super)hydrophobicity Development and Stability of Stainless-Steel Surfaces. Materials. 2018; 11(11):2240. https://doi.org/10.3390/ma11112240
Chicago/Turabian StyleGregorčič, Peter, Marjetka Conradi, Luka Hribar, and Matej Hočevar. 2018. "Long-Term Influence of Laser-Processing Parameters on (Super)hydrophobicity Development and Stability of Stainless-Steel Surfaces" Materials 11, no. 11: 2240. https://doi.org/10.3390/ma11112240
APA StyleGregorčič, P., Conradi, M., Hribar, L., & Hočevar, M. (2018). Long-Term Influence of Laser-Processing Parameters on (Super)hydrophobicity Development and Stability of Stainless-Steel Surfaces. Materials, 11(11), 2240. https://doi.org/10.3390/ma11112240