3.1. Results for Young’s Modulus
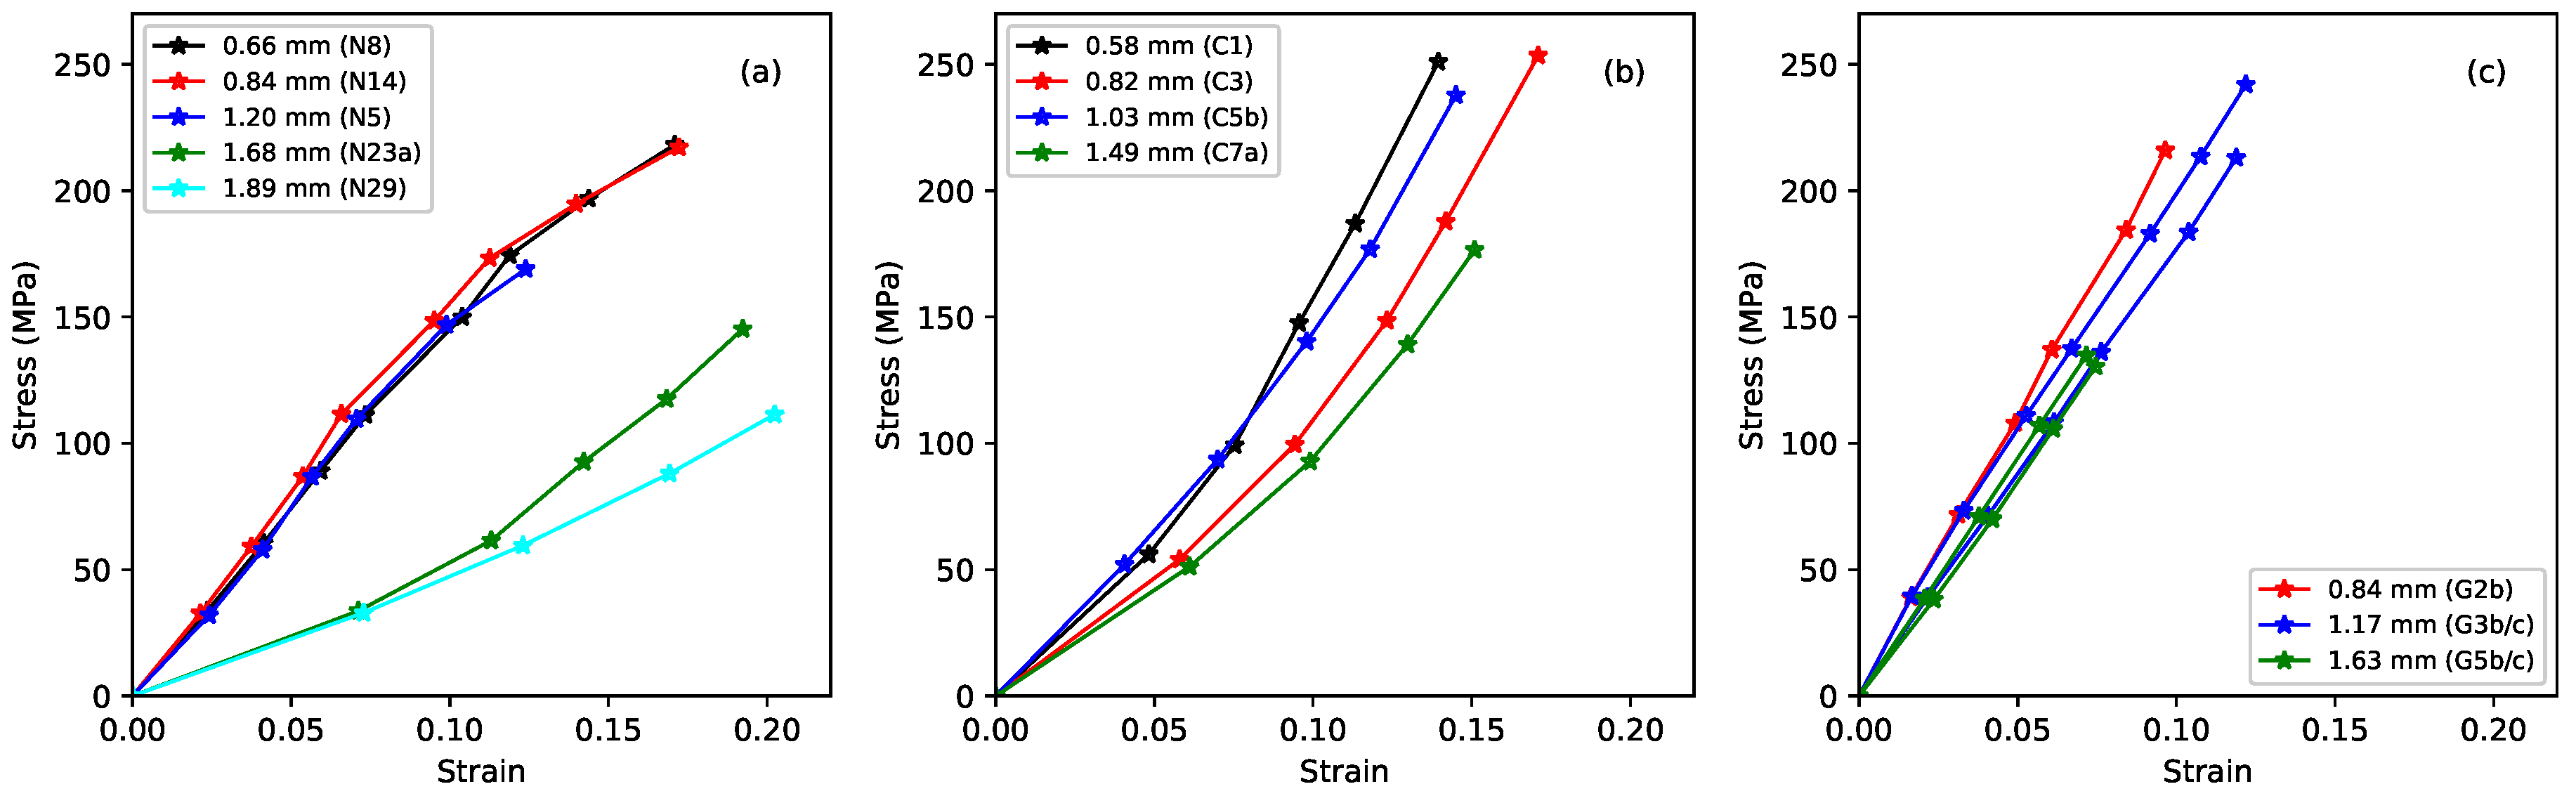
Figure 1 shows the long-term relation between the measured stress and strain. The layout of this figure will be followed in many subsequent comparative plots: the leftmost plot reproduces earlier results for rectified nylon strings; the centre plot shows the fluorocarbon strings; and the rightmost plot shows the gut strings. Identical axis scaling is used for all three subplots to facilitate direct comparisons between the three string types. Each plotted point here represents the state of a string, at the base temperature of 20
C, when it had settled at the chosen stress level (using the creep-monitoring approach described in [
1]). The slopes of the curves define the ‘slow’ Young’s modulus
. This quantity includes a contribution from the creep extension, accumulated over a period of several weeks.
As previously reported, the nylon strings split into two distinct groups, corresponding to a difference in their densities (see
Table 1). This presumably points to a difference in their chemical make-up; however, the strings were purchased through a normal retail outlet, and it has not proven possible to track down the detailed chemical formulation. The stiffness of the thinner, lower-density nylon strings fell as the strain increased; while the stiffness of the thicker, higher-density strings increased. The fluorocarbon strings showed similar behaviour to the thicker, higher-density nylon strings, albeit with consistently higher stiffness. While the fluorocarbon responses extended to higher stress levels than the corresponding nylon strings, they tended to break at lower overall strain levels. There was no obvious distinction between the behaviour of the monofilament and wound strings. The responses for the gut strings showed a similar overall stiffness to the fluorocarbon strings, but were strikingly linear with very similar gradients (fitting lines through the origin to each of the gut responses gave
values in excess of 0.999 in every case, while fitting a single line to the data for all five gut string sections resulted in a combined
value of 0.992). This is in clear contrast to the curvatures shown by the synthetic materials.
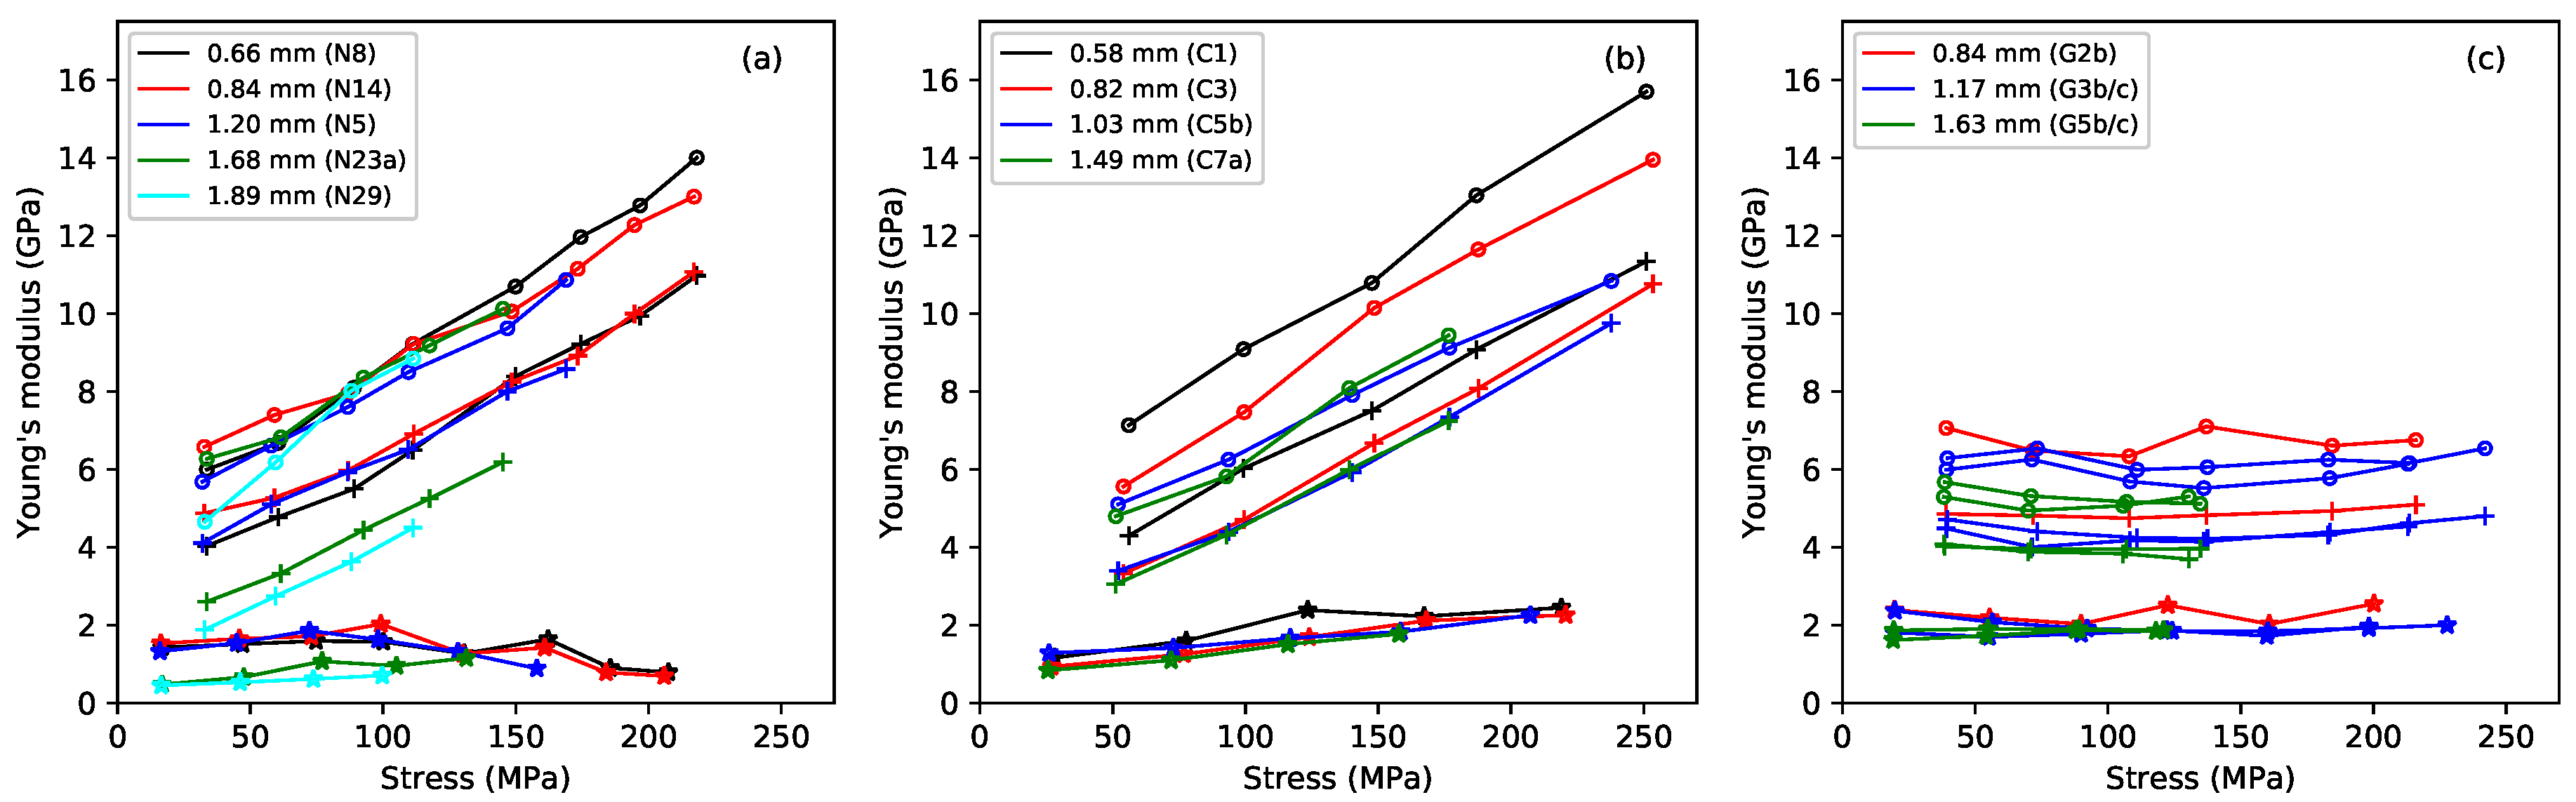
Figure 2 shows the base-temperature Young’s modulus plotted against the applied stress, for the three different measurement methods: the slow modulus
calculated from the slopes of the lines in
Figure 1; the modulus
measured using a tension-modulation cycle with a period of around 30 min; and the modulus
calculated from the string bending stiffness [
1] and thus based on stress-strain variations with a millisecond time scale. For any given string (indicated by colour in the plot),
had the lowest value;
came next, and the modulus
was highest. This pattern is familiar: the Young’s modulus of a viscoelastic material generally increases as the time scale of the measurement method reduces, or equivalently as the frequency increases [
6,
14]. The slow deformation described here as “creep” only plays a major role in
, because the measurements of
and
were too fast for this creep to have much effect.
The fluorocarbon strings showed behaviour in many ways similar to that of the nylon strings, but with some slight differences. The
responses rose steadily with the applied stress, in accordance with the stress-strain results of
Figure 1, and at a somewhat faster rate than the higher-density group of nylon strings (strings N23a and N29 in
Figure 2a). The
and
responses rose in a very similar linear fashion as the stress was increased, and with much the same range of values and gradients as the nylon strings. As might be expected from the differences in their construction, and in contrast to the fairly small spread in the
responses, the two wound fluorocarbon strings gave distinctly lower
responses, compared to the monofilament strings. Over-wrapped string construction, whether with metal wire or, as here, with the same material as the core, is used deliberately to reduce the bending stiffness of thicker and heavier strings.
The gut strings showed very different behaviour to the synthetic materials. Although the same trend
was seen, all three measures of Young’s modulus remained remarkably constant as the applied stress, and hence strain, was increased. In the case of the thinner strings (G2b, G3b, G3c), this remained true even up to the point where the string broke. One consequence of this difference in behaviour is that, at their intended operating points, gut strings will often have a lower bending stiffness than the equivalent nylon or fluorocarbon strings, potentially leading to lower levels of inharmonicity in the string overtones [
12]. The Young’s modulus for natural gut instrument strings is generally reported to be about 5.5–6.5 GPa [
4], but it would seem that the situation is more complicated than this. This range of values is closest to the observed values of the Young’s modulus obtained from the bending stiffness, perhaps indicating that the published values were obtained using a similar high-frequency measurement technique.
The behaviour seen in
Figure 2 suggests that, contrary to what one might have guessed, the gut strings can be characterised much more simply than the synthetic strings. Gut appears to behave as a linear viscoelastic material over the entire stress range of these tests. The Young’s modulus varies with frequency, but it does not exhibit the strain hardening, or more properly “strain stiffening”, shown by both nylon and fluorocarbon strings. This stiffening implies that the microstructure is being significantly and progressively modified by the imposed strain. The previous study [
1] suggested a mechanism: the change might correspond to progressive straightening of the nylon molecules, from an initially random state in the polymer melt. The behaviour could be similar in both nylon and fluorocarbon strings, explaining why their
and
responses have such similar gradients (about 40 in both cases).
The structure of gut strings is different in two distinct ways, one microscopic and one macroscopic. Firstly, the structural component of gut is collagen. Collagen molecules consist of a triple helix, whose structure is well understood [
15,
16]. The biological process of growing gut fibres will presumably result in well-ordered chains, so there may not be the same scope as with the synthetic materials for additional alignment as a result of strain once the string is under tension. Secondly, the gut strings have a wound construction without a central core, and this will presumably influence the stress-strain behaviour. Some of the fluorocarbon strings also had a wound construction, but with a central core that may have dominated their responses to changes in the applied stress and strain, making them behave more like the monofilament strings in this respect.
There is another consequence of the more complicated behaviour of the synthetic strings, compared to the gut strings. The increase in the faster measures of Young’s modulus ( and ) with the applied stress should correspond to a falling off in the elastic stretching; while the relatively constant levels of suggested that the proportion of creep deformation was increasing. The synthetic strings seem to become more susceptible to creep at higher stresses, perhaps because the cross-links between polymer molecules are more readily overcome. No comparable mechanism seems to operate in the gut strings. It would appear that the gut and synthetic strings were behaving very differently in terms of how both their “elastic” and “plastic” stretching varied with the applied stress. It seems possible that this different behaviour might have some influence on a player’s sense of the “feel” of strings.
The previous study showed that the spread in the results from the nylon strings could be matched quite well by fitting a linear function in both the applied stress and bulk density. However, given the much higher density of the fluorocarbon strings the same density term cannot be used for this material, and the spread of densities among the tested fluorocarbon strings was too small to justify further exploration at this stage.
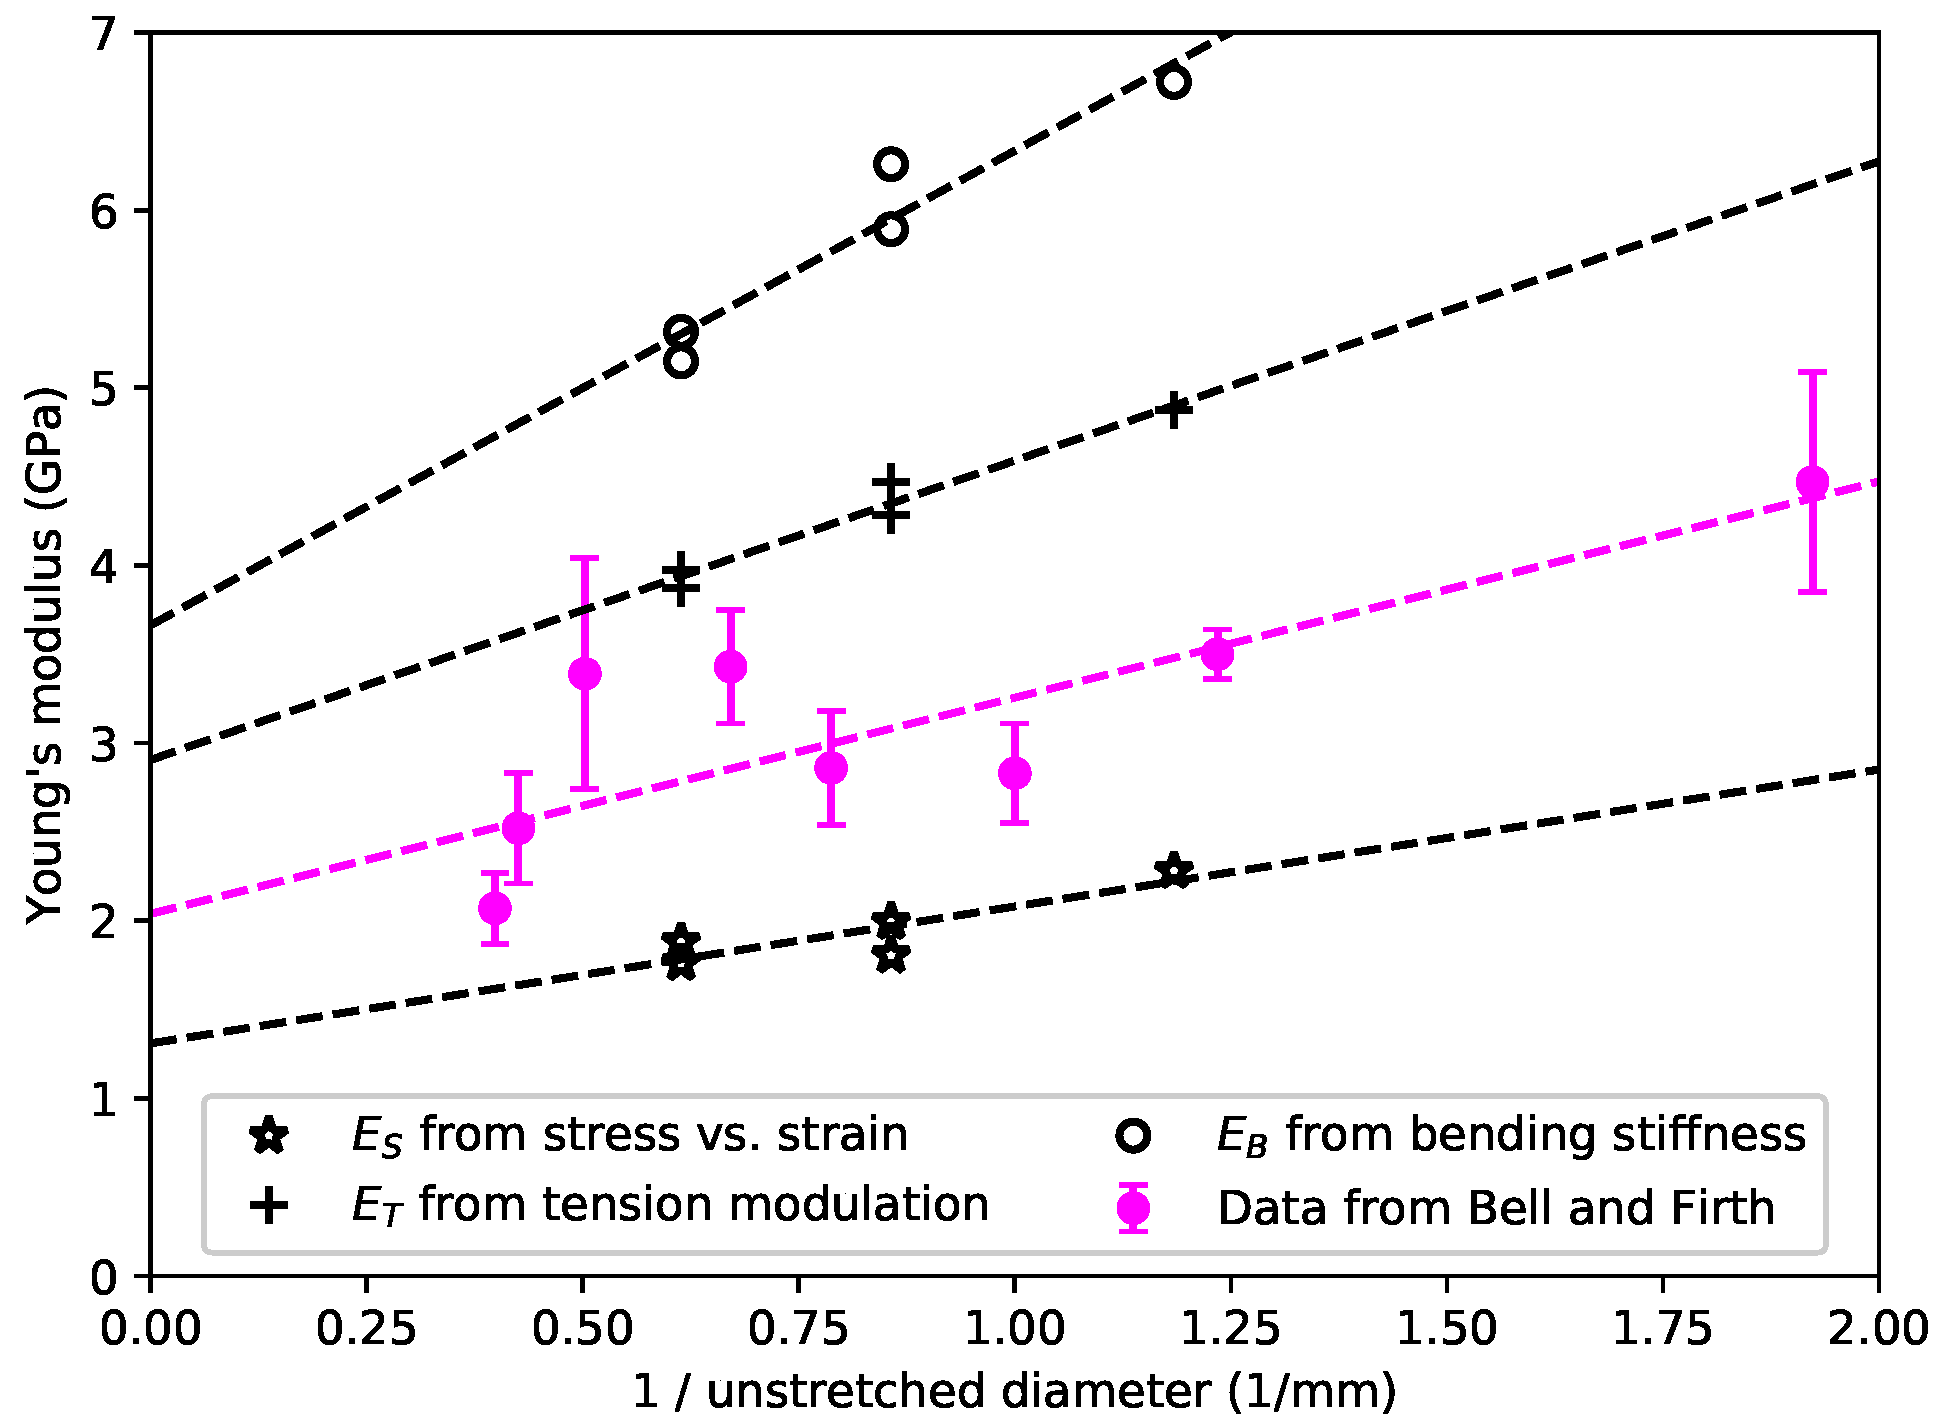
Unlike the nylon strings, no obvious dependence on the string density was observed with the gut strings, but there did appear to be a correlation between all three measures of Young’s modulus and the inverse of the string diameter or cross-sectional area.
Figure 3 shows the average Young’s modulus values from
Figure 2c, plotted against the inverse of the diameter of the unstretched strings. The equivalent data from the study made by Bell and Firth [
7] are also shown for comparison: they appeared to show a similar variation with the string diameter and/or cross-section. Their values lay between the
and
values obtained in this study, as would perhaps be expected from the way in which Bell and Firth conducted their measurements. Their methodology was similar to the
measurements here, based on stress-strain tests, but conducted over a much shorter time scale so that the effective stiffness was pushed towards the
values. Studies currently under way to explore the effects of varying the string twist ratio suggest that the behaviour shown in
Figure 3 may actually be due to different gauge strings being twisted to different extents during manufacture.
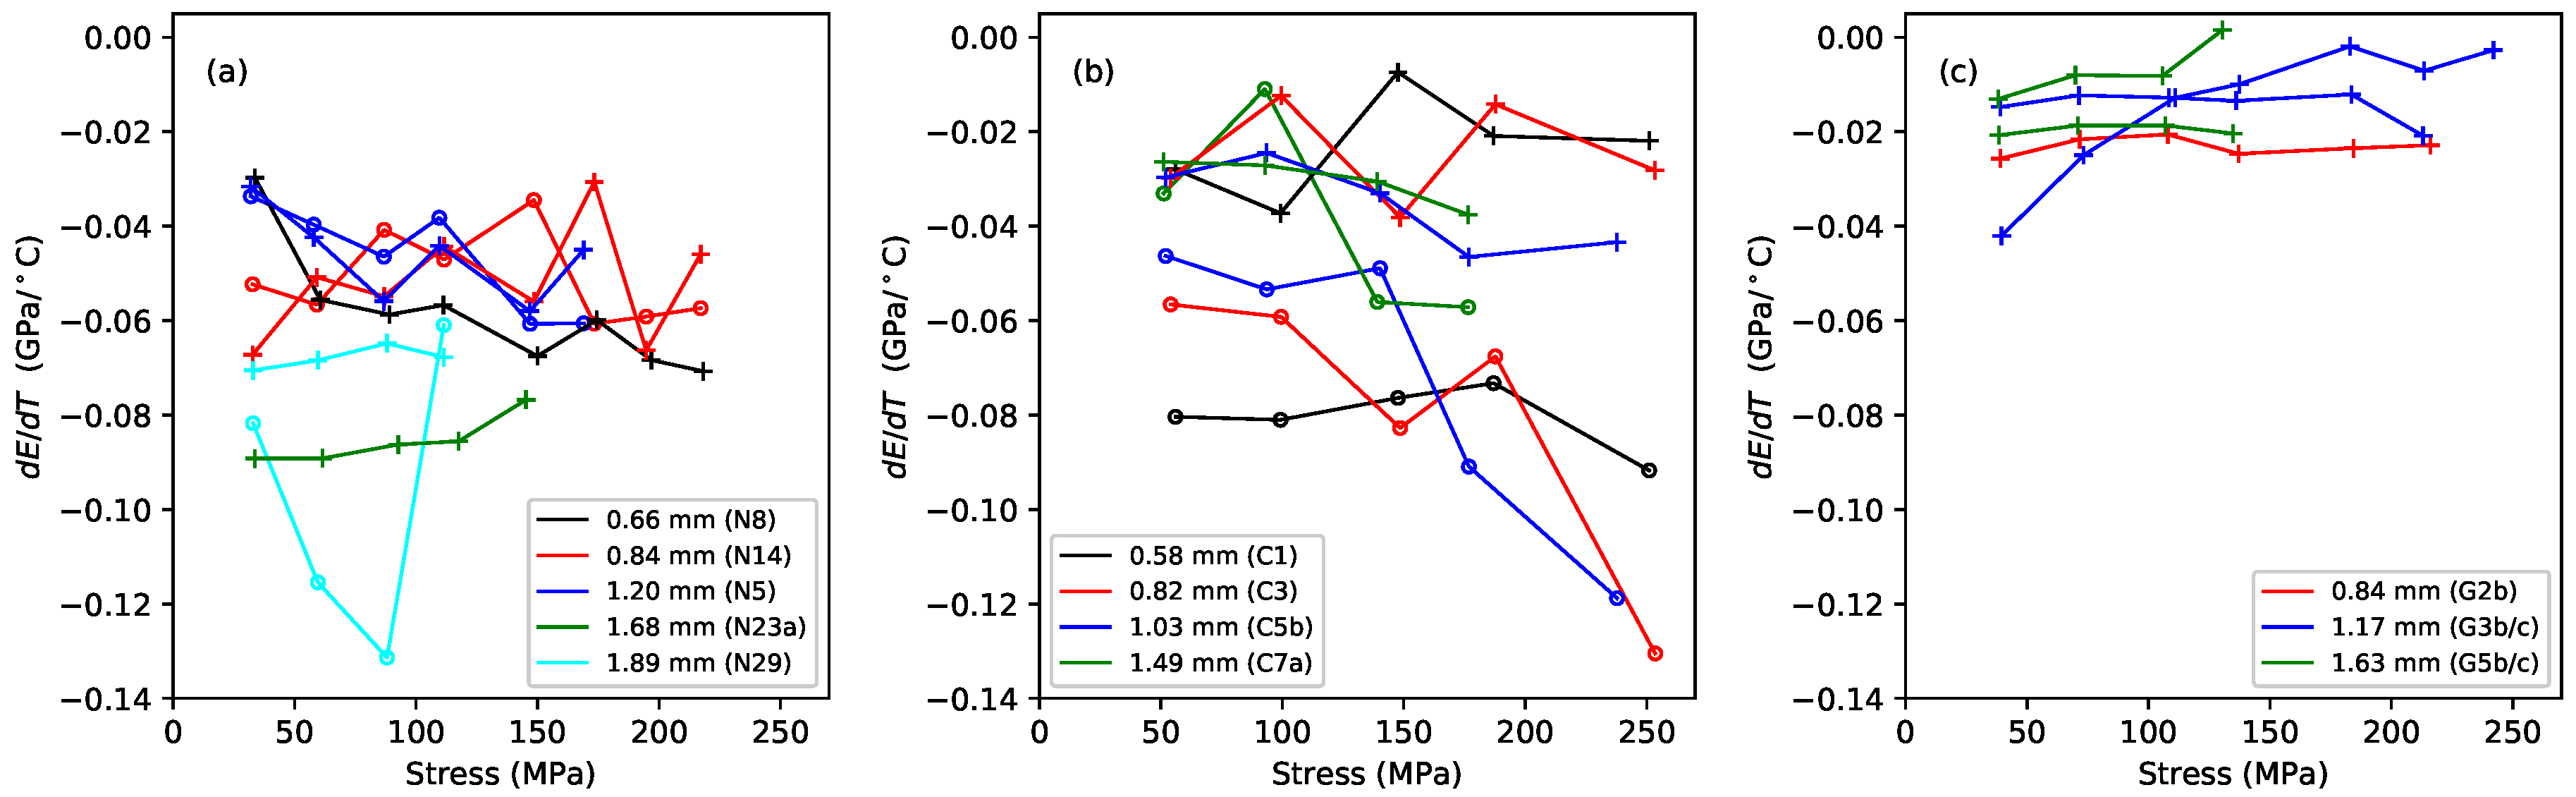
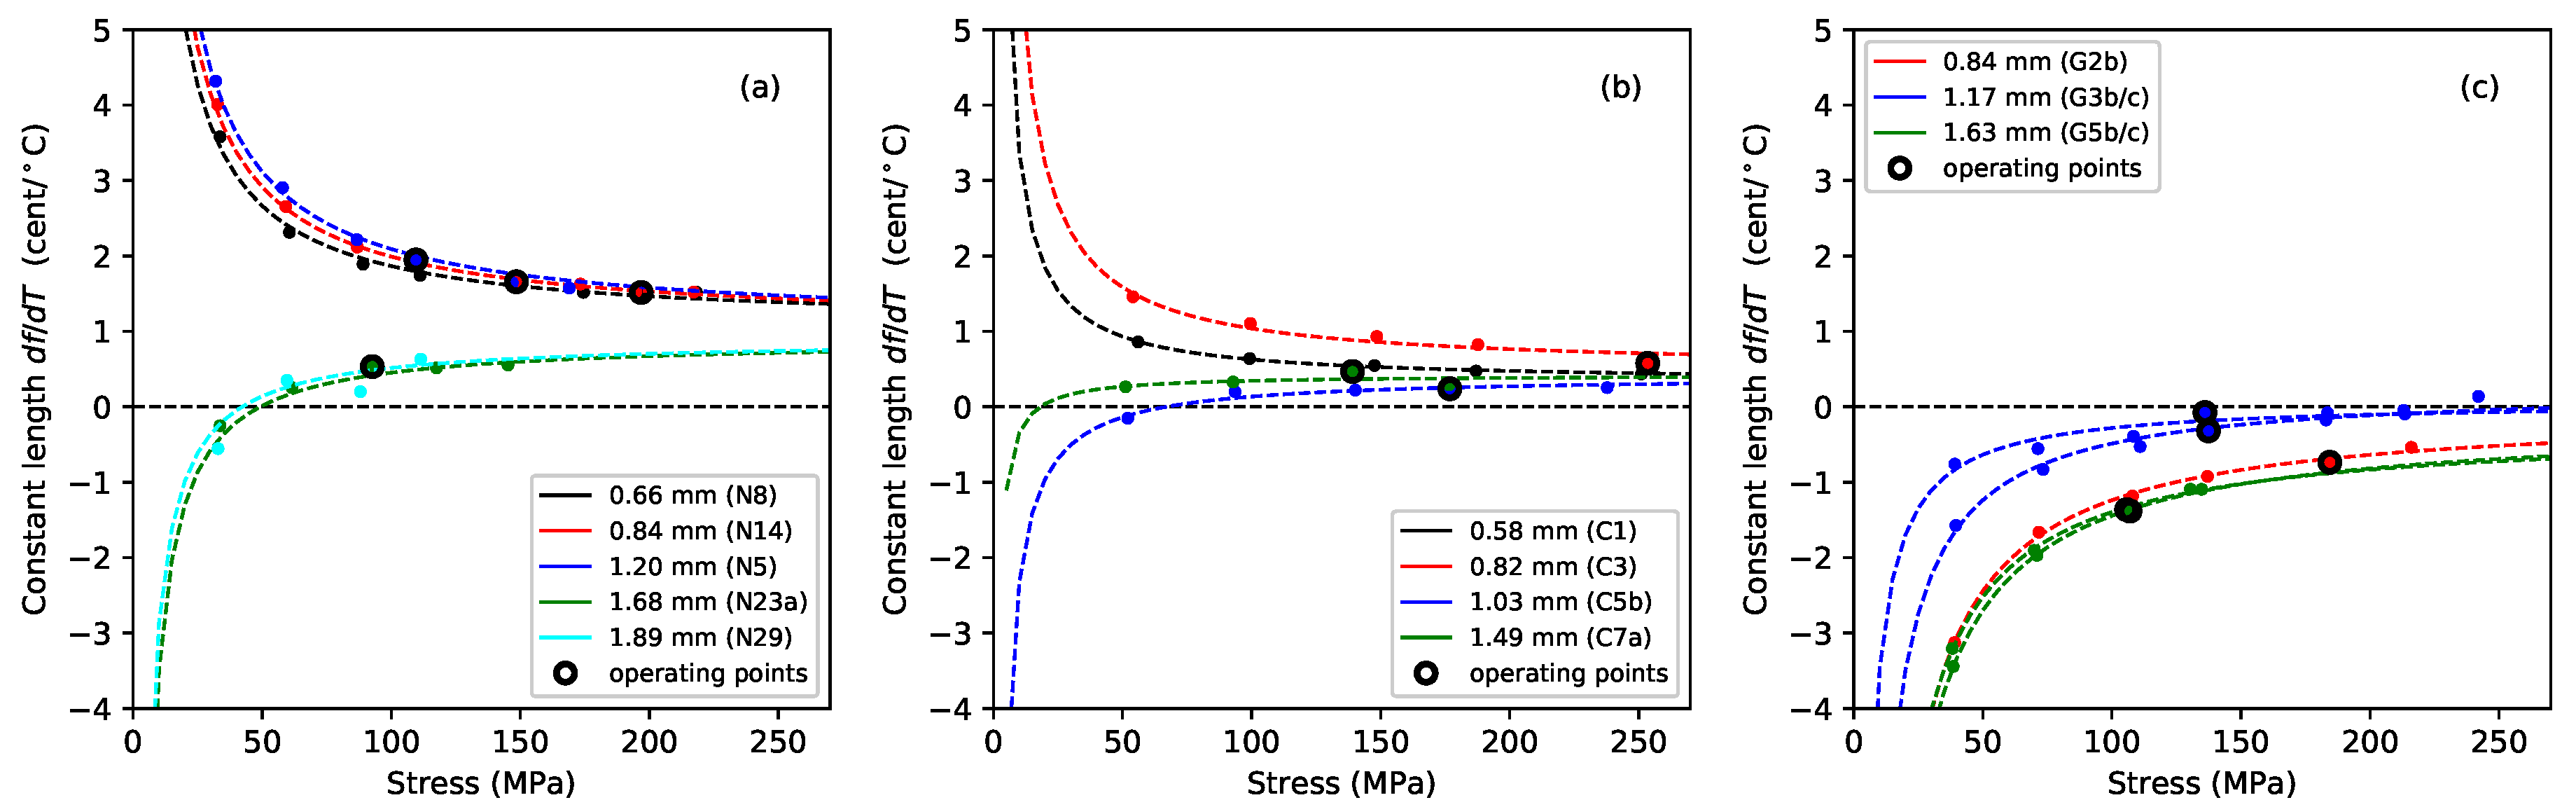
Figure 4 shows the gradients, plotted against the applied stress, of lines fitted to the Young’s modulus versus temperature responses, for the Young’s modulus values obtained using tension modulation (+) and from the string bending stiffness (o). For the latter, data were only obtained for the nylon strings tested after the automated bending stiffness analysis capability had been added to the test rig control program [
1]. As explained in
Section 2, this approach did not give good results for the gut strings, so only the thermal sensitivity in the
values is shown for these strings. The noise level apparent in these results was much higher than in previous plots, as a result of the accumulated inaccuracies implicit in the estimation of this gradient. This noise would, of course, be reduced if a larger number of strings of each type could be tested, but this was not practical given the length of time occupied by each individual test sequence, as explained earlier. Nevertheless, some general trends can be seen with a moderate degree of confidence. In very nearly every case, the values are negative: the Young’s modulus fell as the temperature increased, making the string easier to stretch.
For each of the three materials, the thermal sensitivity in appeared to remain at a fairly consistent level as the stress was varied. There was some inconsistency between the results for one of the G3 string sections (G3b) and all other tested strings, including another section of that same string (G3c). The somewhat anomalous behaviour of string G3b, which may have been due to some material inconsistency somewhere along its length, was part of the motivation for repeating the tests with strings G3c and G5c; along with the desire simply to gather more data. It is interesting that, other than the anomalous behaviour of string G3b, the gut results showed a much lower degree of variation than either of the synthetic materials.
The results for the Young’s modulus derived from the string bending stiffness, , were less clear. For nylon, the thermal sensitivity again appeared to remain fairly constant as the stress was varied, although string N29 was something of an outlier. For the fluorocarbon strings, however, the thermal sensitivity appeared to become increasingly negative as the stress was increased.
3.2. Results for Density and Tension
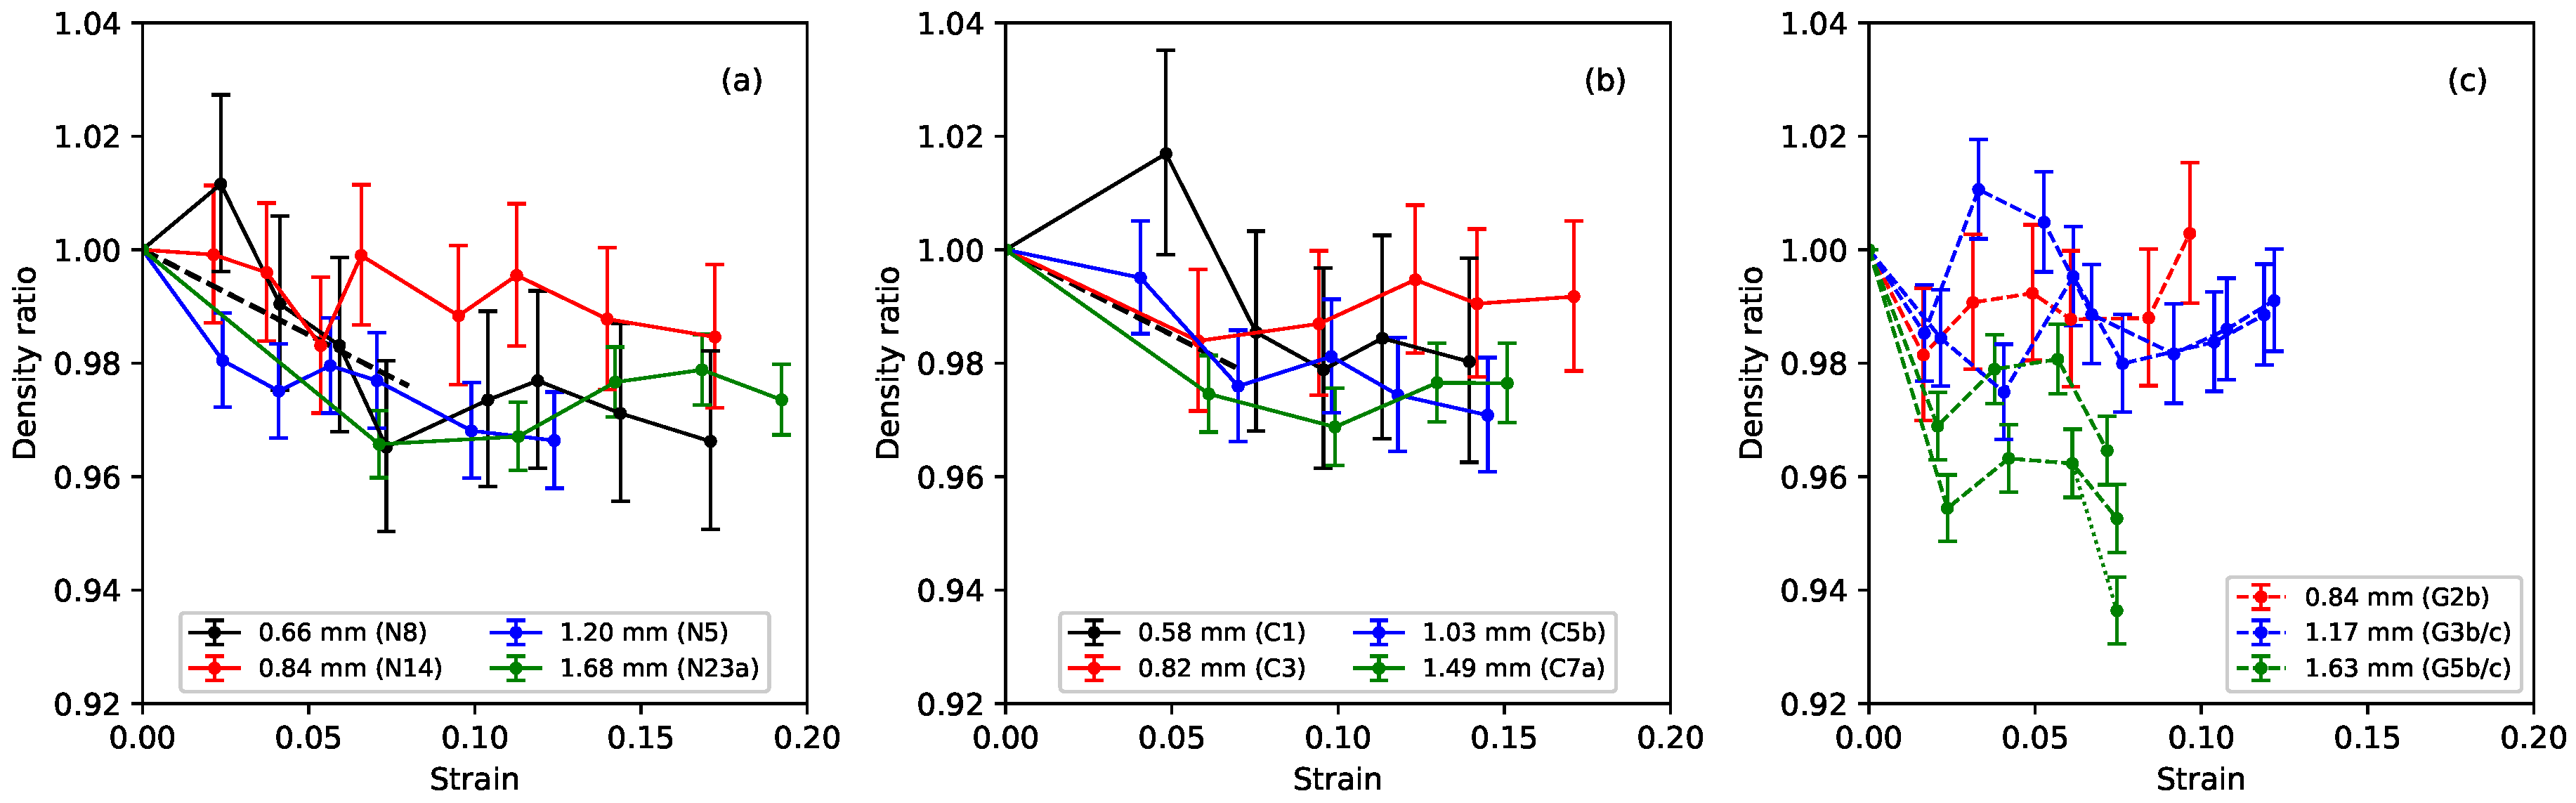
Figure 5 shows the ratio of the measured bulk density of the stretched strings to their unstretched bulk density, plotted against the strain. The stretched density values here were calculated from the linear density at a base temperature of 20
C, obtained from the constant-length tests, and the string diameter, which was measured using a manual micrometer with a resolution of 0.01 mm. With the string mounted in the test rig, the diameter could only be measured in a few places, and could therefore not be determined as accurately as when the string was first measured prior to testing (when multiple measurements were taken to reduce the measurement error and take better account of any variations along the string length). The error bars in
Figure 5 show the range in the density ratio values that could be expected given an error range of ±0.005 mm in the measured string diameter. In this case, although the results were very noisy, there was a very clear expectation of the general pattern based on theory and previous tests in other contexts where elasticity and plasticity were both present: at low strain, density is expected to decrease with a slope determined by Poisson’s ratio (shown as black dashed lines in
Figure 5a,b). At larger strain, when plastic deformation takes over, the normal expectation would be volume-conserving deformation leading to roughly constant density. As observed in the previous study [
1], the results for nylon, reproduced in
Figure 5a, were entirely consistent with this behaviour.
The fluorocarbon strings showed very similar behaviour to the nylon strings, with the density ratio falling initially as expected for small values of strain, before settling to a more or less constant level: notice the very narrow range on the vertical axes in the plots (the nylon string N29 from the previous study was something of an outlier with a larger fall in its density ratio to about 0.92 [
1], and so has not been included here). The results for the gut strings were more varied, but, overall, it would appear that the string densities again fell slightly on initial stretching (more so in the case of the thickest string sections, G5b and G5c, than for the others) and then, within the accuracy of these measurements, remained essentially constant as the strings were stretched further. It also appears that the initial density reduction proceeded more quickly with the gut strings, but stopped at a lower strain level than with the nylon and fluorocarbon strings in some cases.
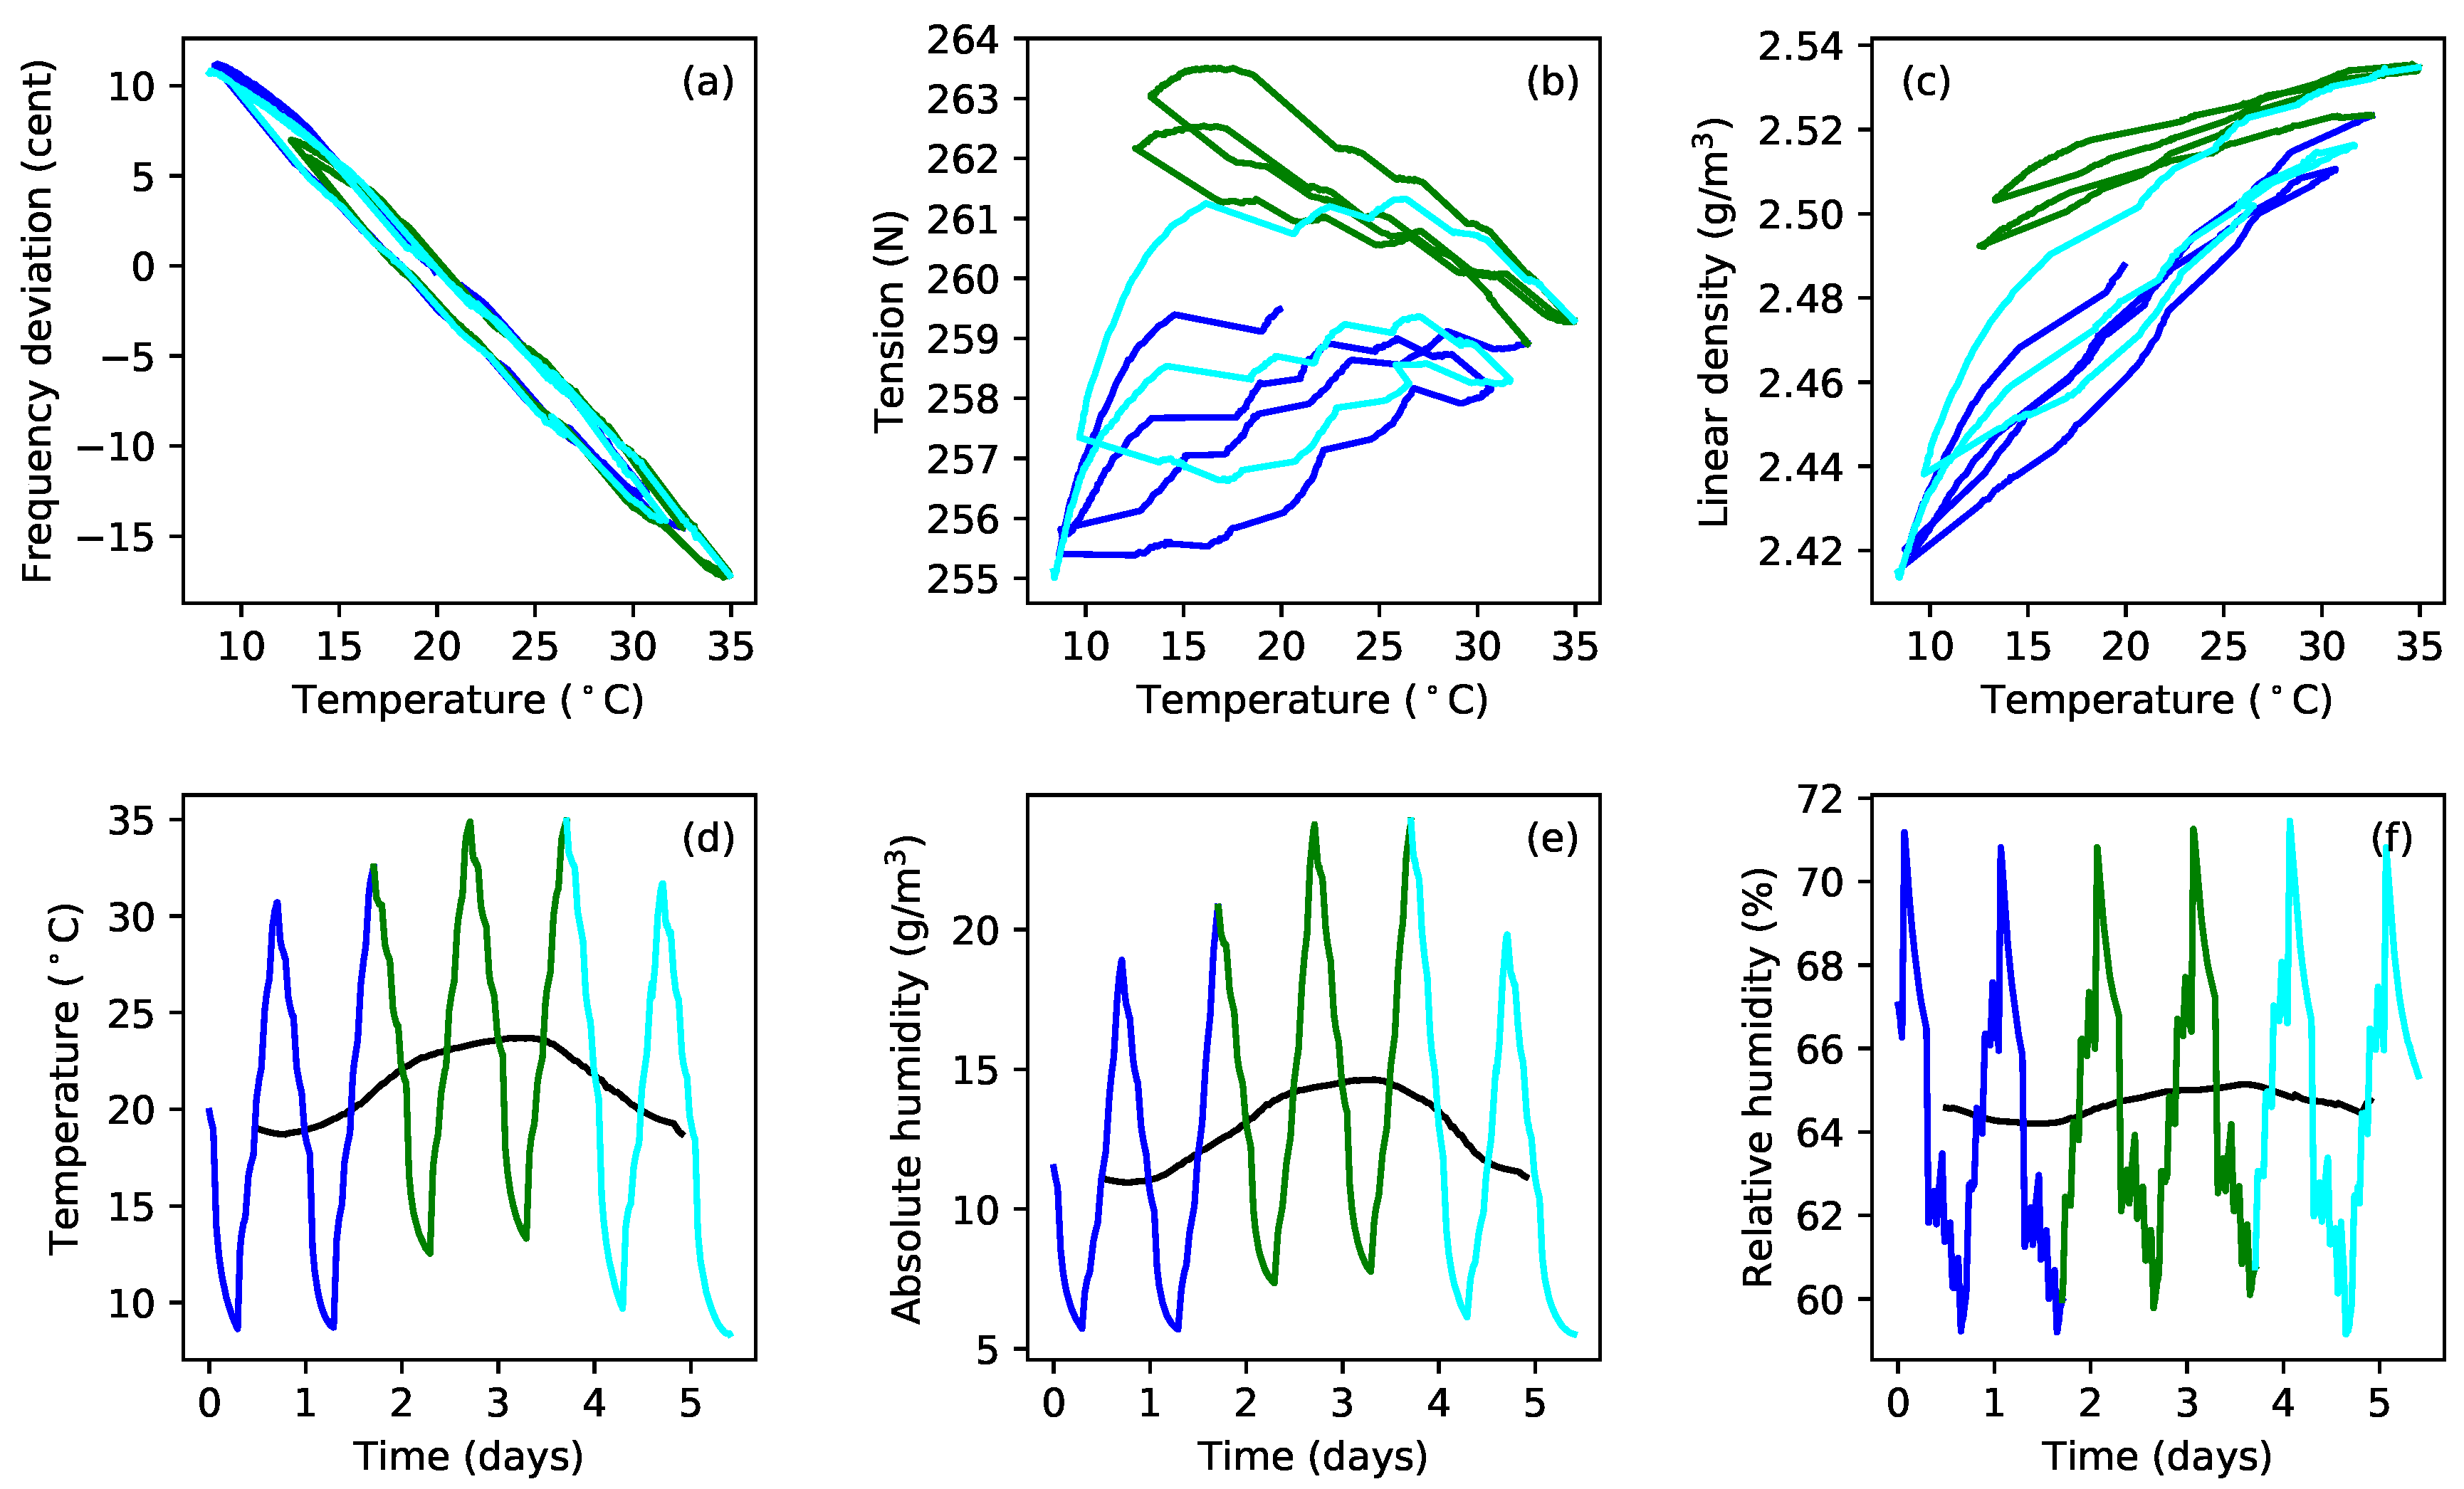
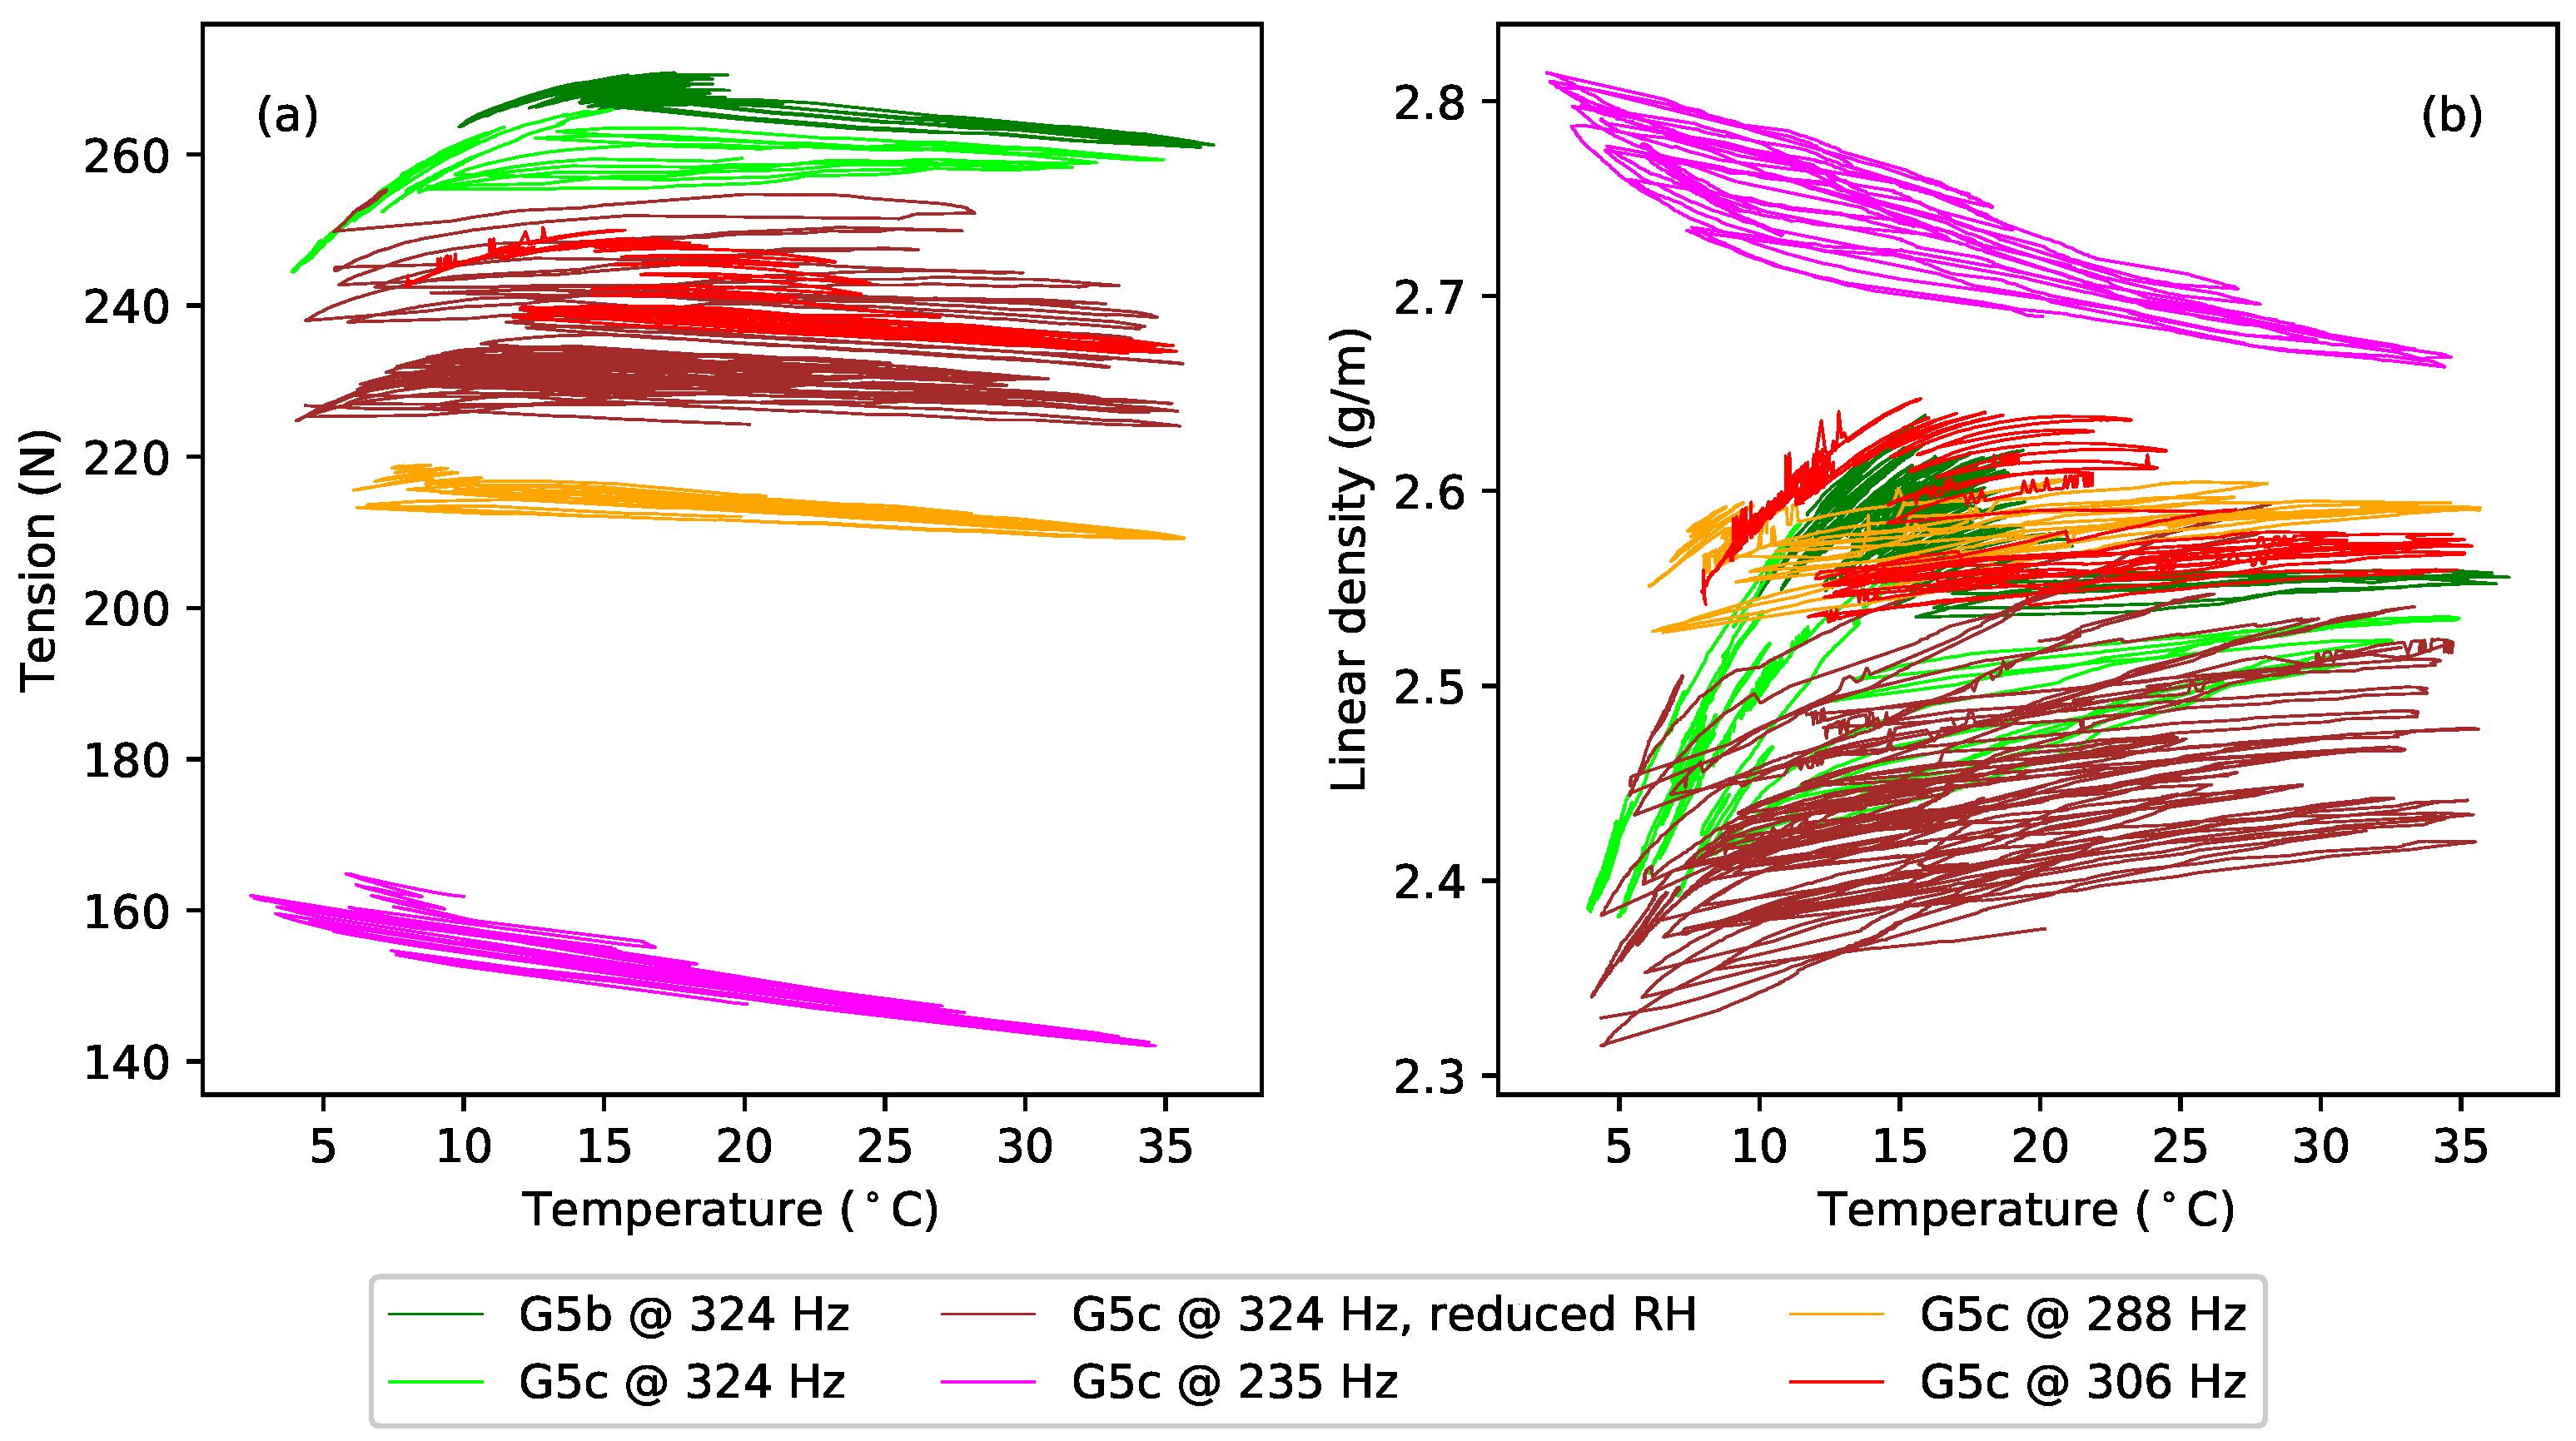
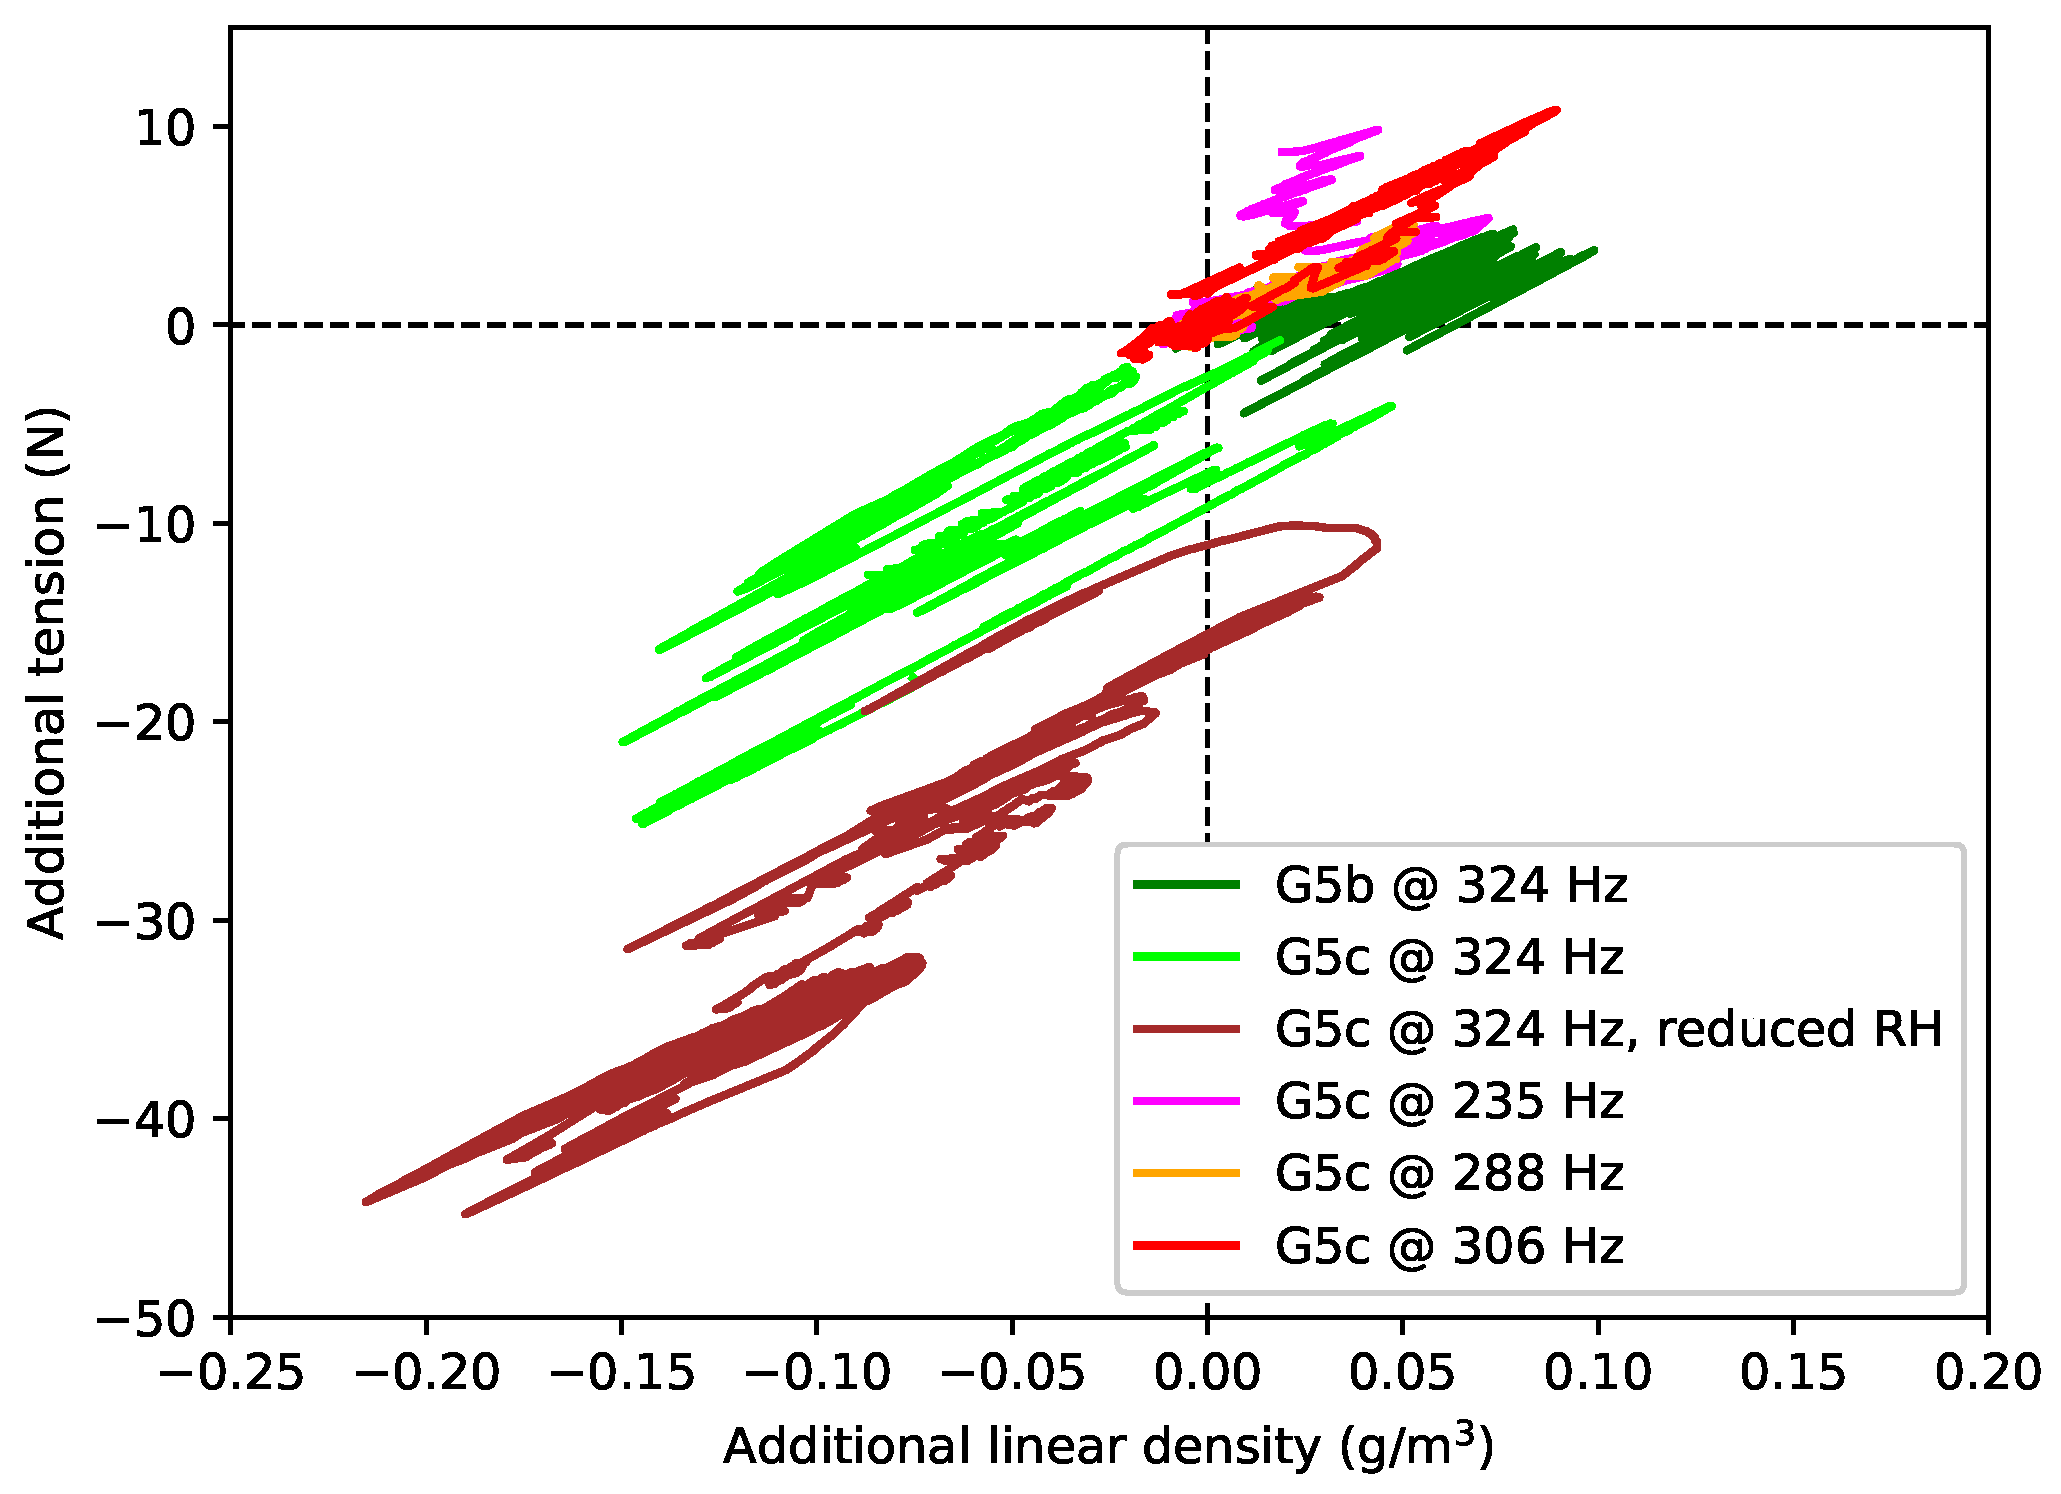
A general comment that will come as no surprise to players is that the gut strings were found to be noticeably sensitive to changes in the ambient humidity levels, while the nylon and fluorocarbon strings were largely unaffected. These changes directly affected the linear density, and hence bulk density, values obtained. The successive data points for each of the gut strings were typically recorded two to three weeks apart, so the results contained a contribution from changes in the prevailing weather conditions. The dotted fork at the end of one of the green lines (for string G5c) in
Figure 5c gives a particularly clear example: the string behaviour changed significantly over the course of just a few days during a single test (see
Section 4). Dashed lines, rather than solid lines, have been used in this and other plots of the gut results to alert the reader to potential uncertainty where it is expected that such changes in the ambient conditions could have made a significant impact.
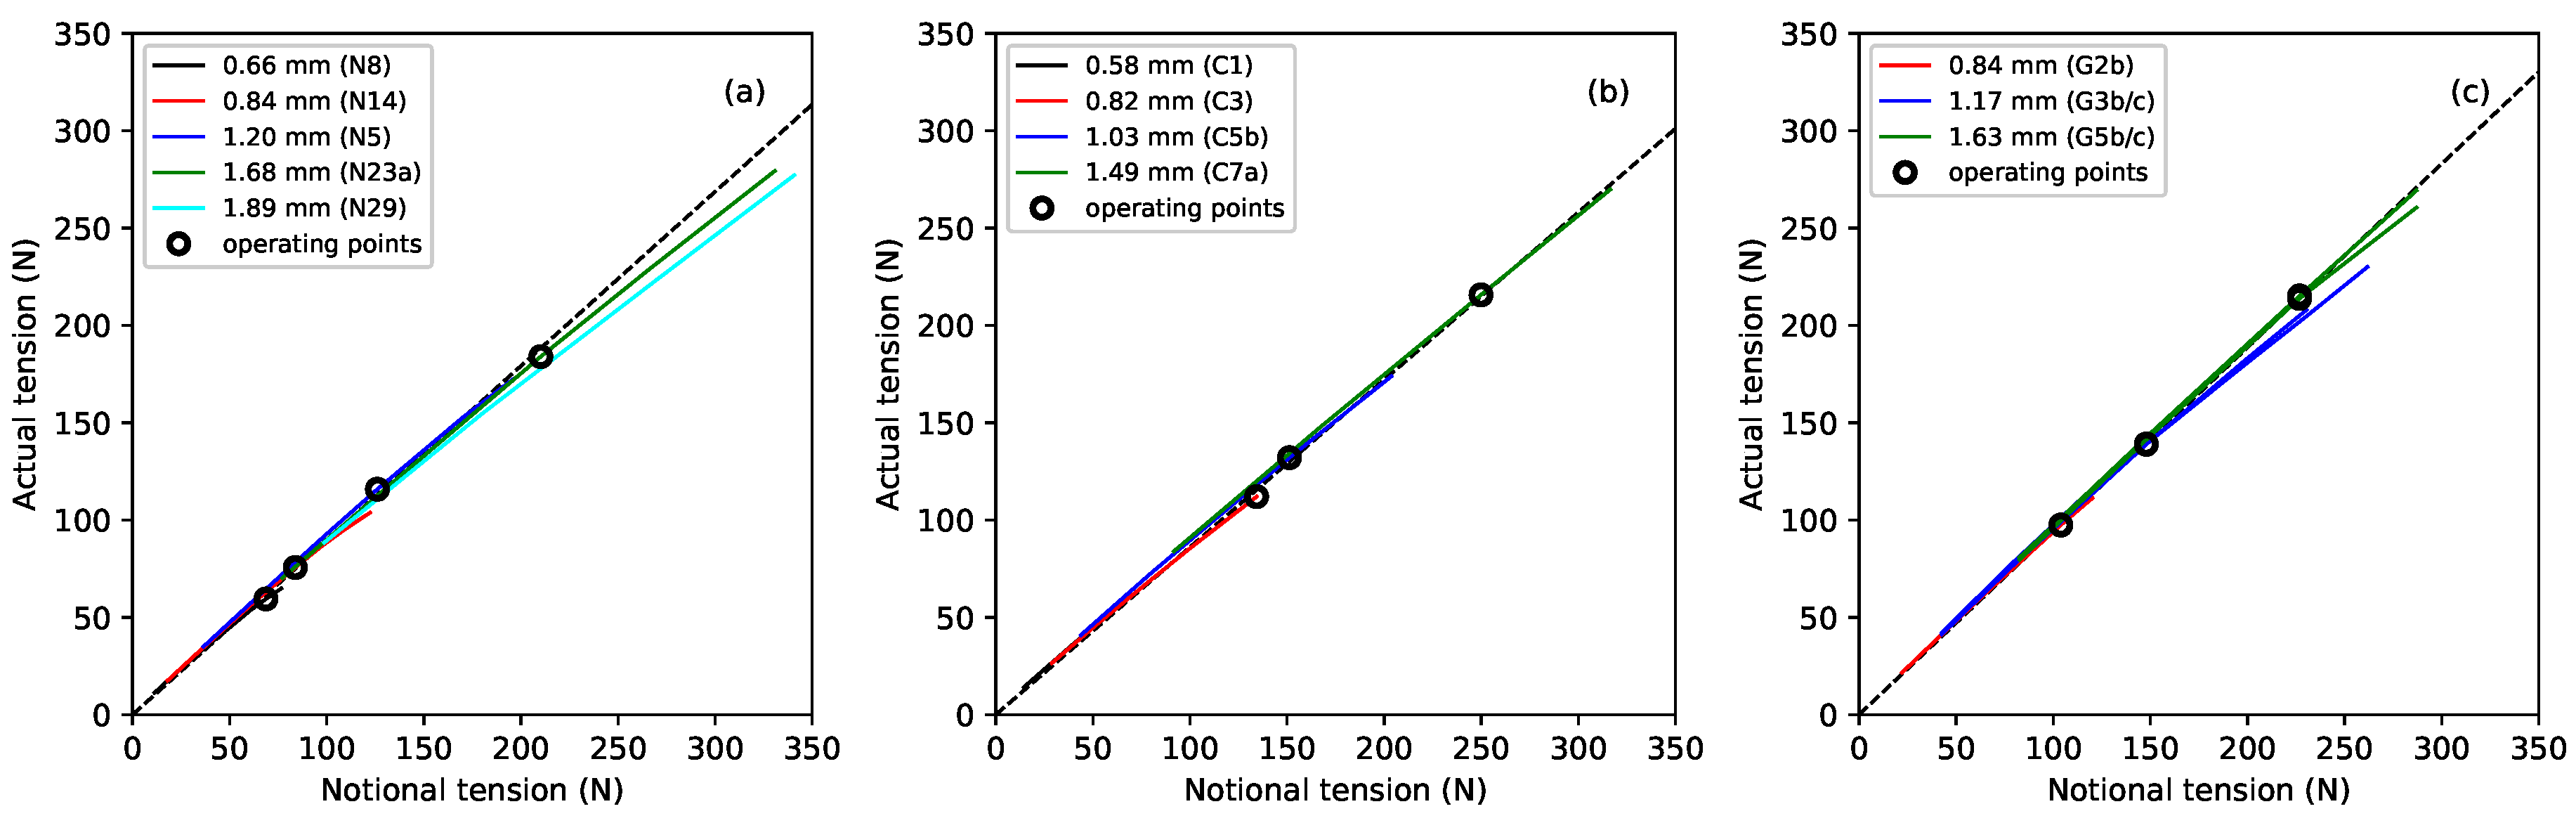
As a string is brought up to tension, to tune it to the required frequency, its linear density will necessarily be reduced (as string mass is removed from the vibrating section). From the density ratio results above, there will also be a corresponding reduction in the string diameter. Without detailed knowledge of the stretching behaviour of the string, including both the elastic and plastic (creep) stretching, it is difficult to predict the working tension once the string has finished creeping.
Figure 6 shows the measured tension
of the different strings, at the base temperature of 20
C, plotted against the notional tension
calculated from Equation (
1) using the unstretched linear density. It can be seen that the actual tension fell further below the notional values as the tension increased (due to the progressive reduction in linear density). Linear regression analysis was used to fit lines through the operating points, shown as black circles, for each material. The lines were constrained to go through the origin and gave a very good fit (
) in all three cases. The gradient of the fitted line for the fluorocarbon strings, at 0.860, was lower than that previously obtained for the nylon strings (0.896), while the gradient for the gut strings was somewhat higher at 0.943. This suggests that, as a rule of thumb, the working tension of a musical string, on the harp at least, will be about 10% lower than the notional value (obtained from the unstretched linear density) for nylon, 14% lower for fluorocarbon, but only 6% lower for gut.
3.3. Results for Thermal Tuning Sensitivity
Tuning deviations are conveniently expressed in cents (¢), there being 1200 ¢ in an octave [
17]:
where
f and
are the actual and desired frequencies, respectively.
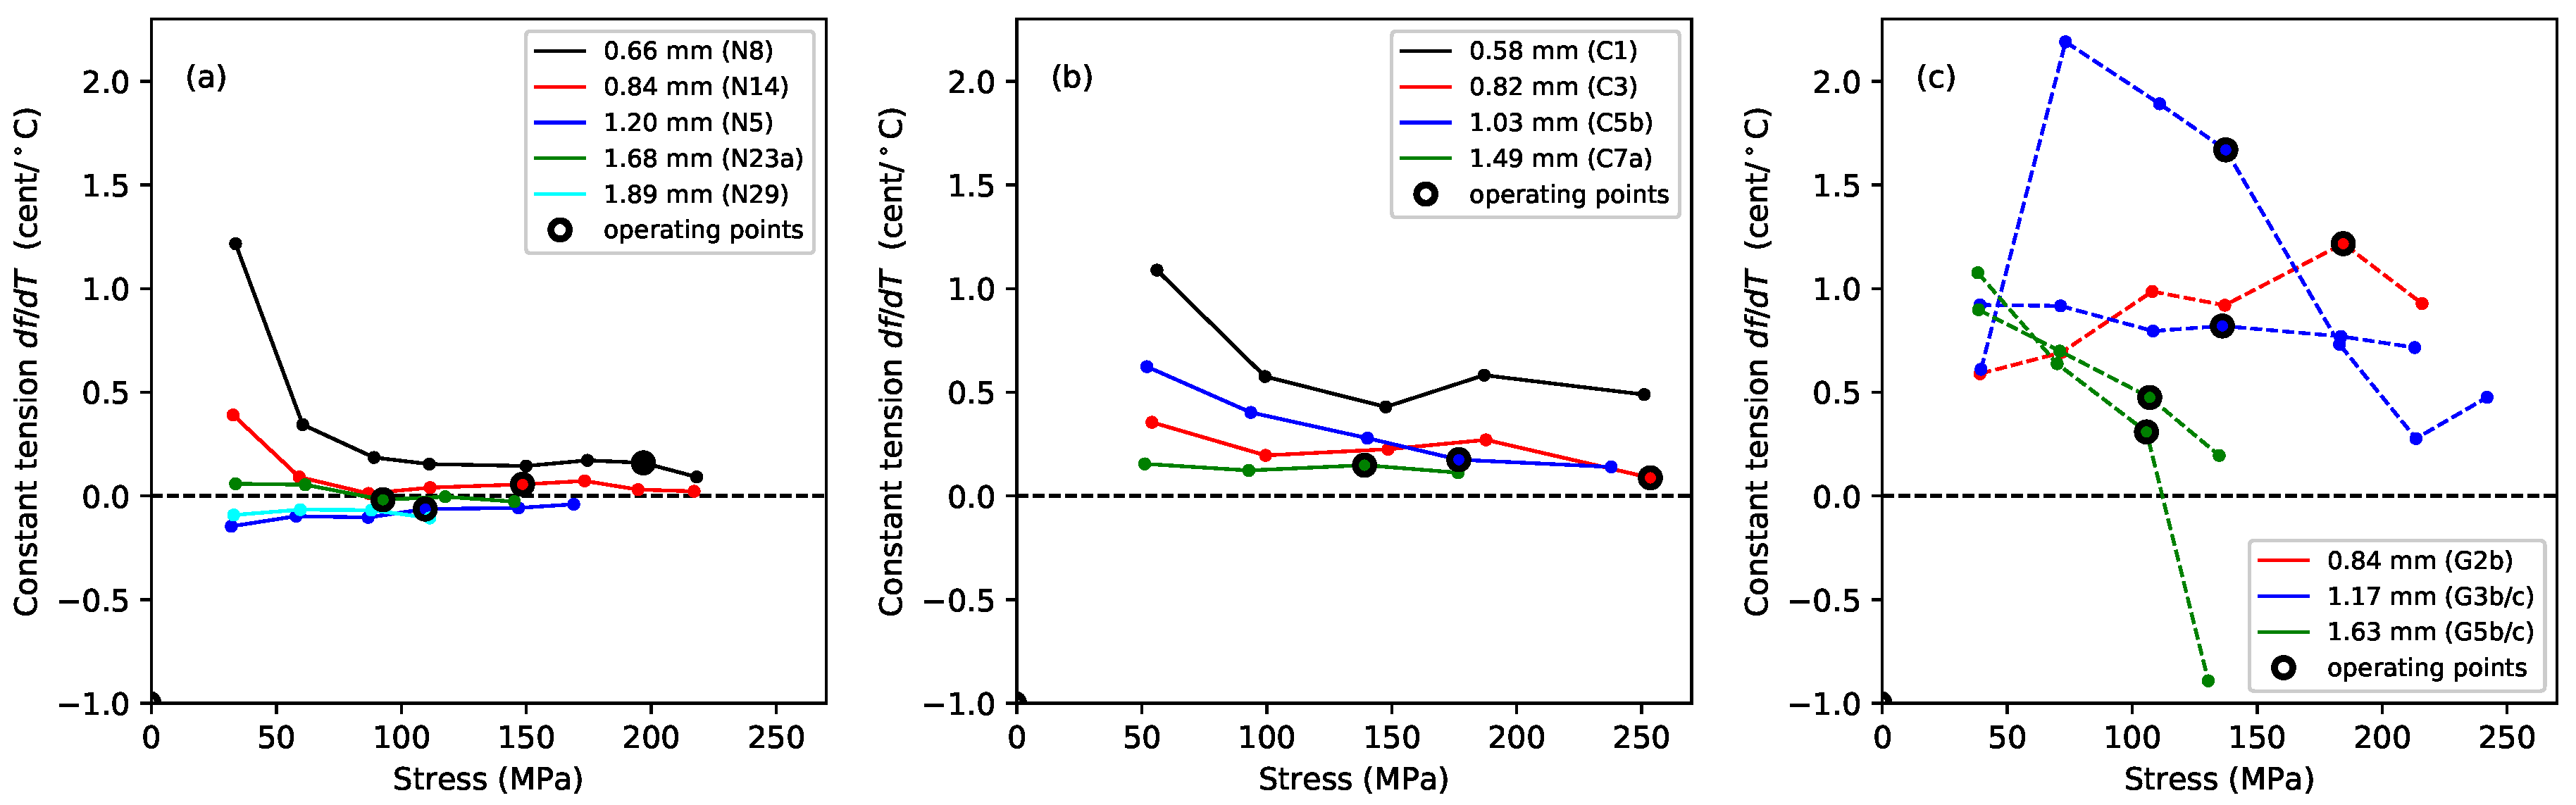
Figure 7 shows the thermal tuning sensitivity, in
C, for strings held at constant length with no tuning adjustments. All three materials showed a strong correlation between the tuning sensitivity and the inverse of the applied stress. The previous study of nylon strings [
1] found that the thermal tuning sensitivity could be fitted rather well by an expression in the inverse of the stress and the inverse of the tension. The lower-density group of nylon strings consistently went sharp as the temperature rose, and their tuning sensitivity fell as the stress was increased. In contrast, the higher density nylon strings showed a tendency to go flat at low stress levels, but sharp at higher stress levels. Different regression fits were therefore required for the two groups of strings. The dashed lines in
Figure 7a were plotted using these fitted expressions.
The fluorocarbon strings showed a similar pattern of behaviour to the nylon strings, but this time the distinction was between the monofilament strings, which consistently went sharp as the temperature rose, and the wound strings, which generally went sharp, but showed a tendency to go flat at low stress levels. The gut strings, however, nearly always went flat as the temperature was increased. For both nylon and fluorocarbon, the variation in behaviour with string diameter suggests that where a thin and thick string are used alongside each other, there is the possibility that one may go sharp as the other goes flat. Such behaviour has been directly observed on an octave pair of strings on a lute, strung with a wound fluorocarbon string alongside a thinner monofilament nylon string.
The degree of thermal tuning sensitivity of the gut and nylon strings was broadly similar, varying at rates of up to about 2
C at their intended operating points. The thermal tuning sensitivity of the fluorocarbon strings was somewhat lower at less than 1
C. It is generally accepted that the minimum perceptible change in pitch of a musical note is around 3 ¢, though this varies with the pitch and complexity of the sound [
18]. Hence, even a modest change in temperature could be expected to lead to noticeable changes in the string pitch in many cases. This phenomenon, familiar to harpists, was the original motivation for this study, in the hope of being able to design a tuning compensator to offset the problem [
19].
There was insufficient data to attempt a multiple regression analysis for the fluorocarbon and gut strings, similar to that undertaken for the nylon strings, so the dashed lines in
Figure 7b,c were plotted using a separate linear regression analysis for each string, with the inverse of the applied stress as the explanatory variable. The fits for strings C1, C3, and C5b were fairly good with
values of 0.99, 0.93, and 0.92, respectively. The fit for string C7a was not so good however, with a low
value of just 0.28. The fits for the gut strings were particularly good for the thinnest and thickest strings (G2b, G5b, G5c) with
in each case, while the intermediate string sections, G3b and G3c, showed
values of 0.97 and 0.87, respectively. There was also a high degree of consistency between the results for the thinnest string (G2) and the two sections of the thickest string (G5), despite string G5 being approximately twice the diameter of G2, and with the tests being run in three different years (
Table 1). In contrast, the results for the two sections of string G3 were not particularly consistent, either with each other or with the rest of the group. It would appear that gut strings operating at higher stress levels (corresponding to the higher notes on the harp) should display lower thermal tuning sensitivities. In practice, though, other variations in the string, as exemplified here by string G3, may be more significant in determining the relative performance of the strings.
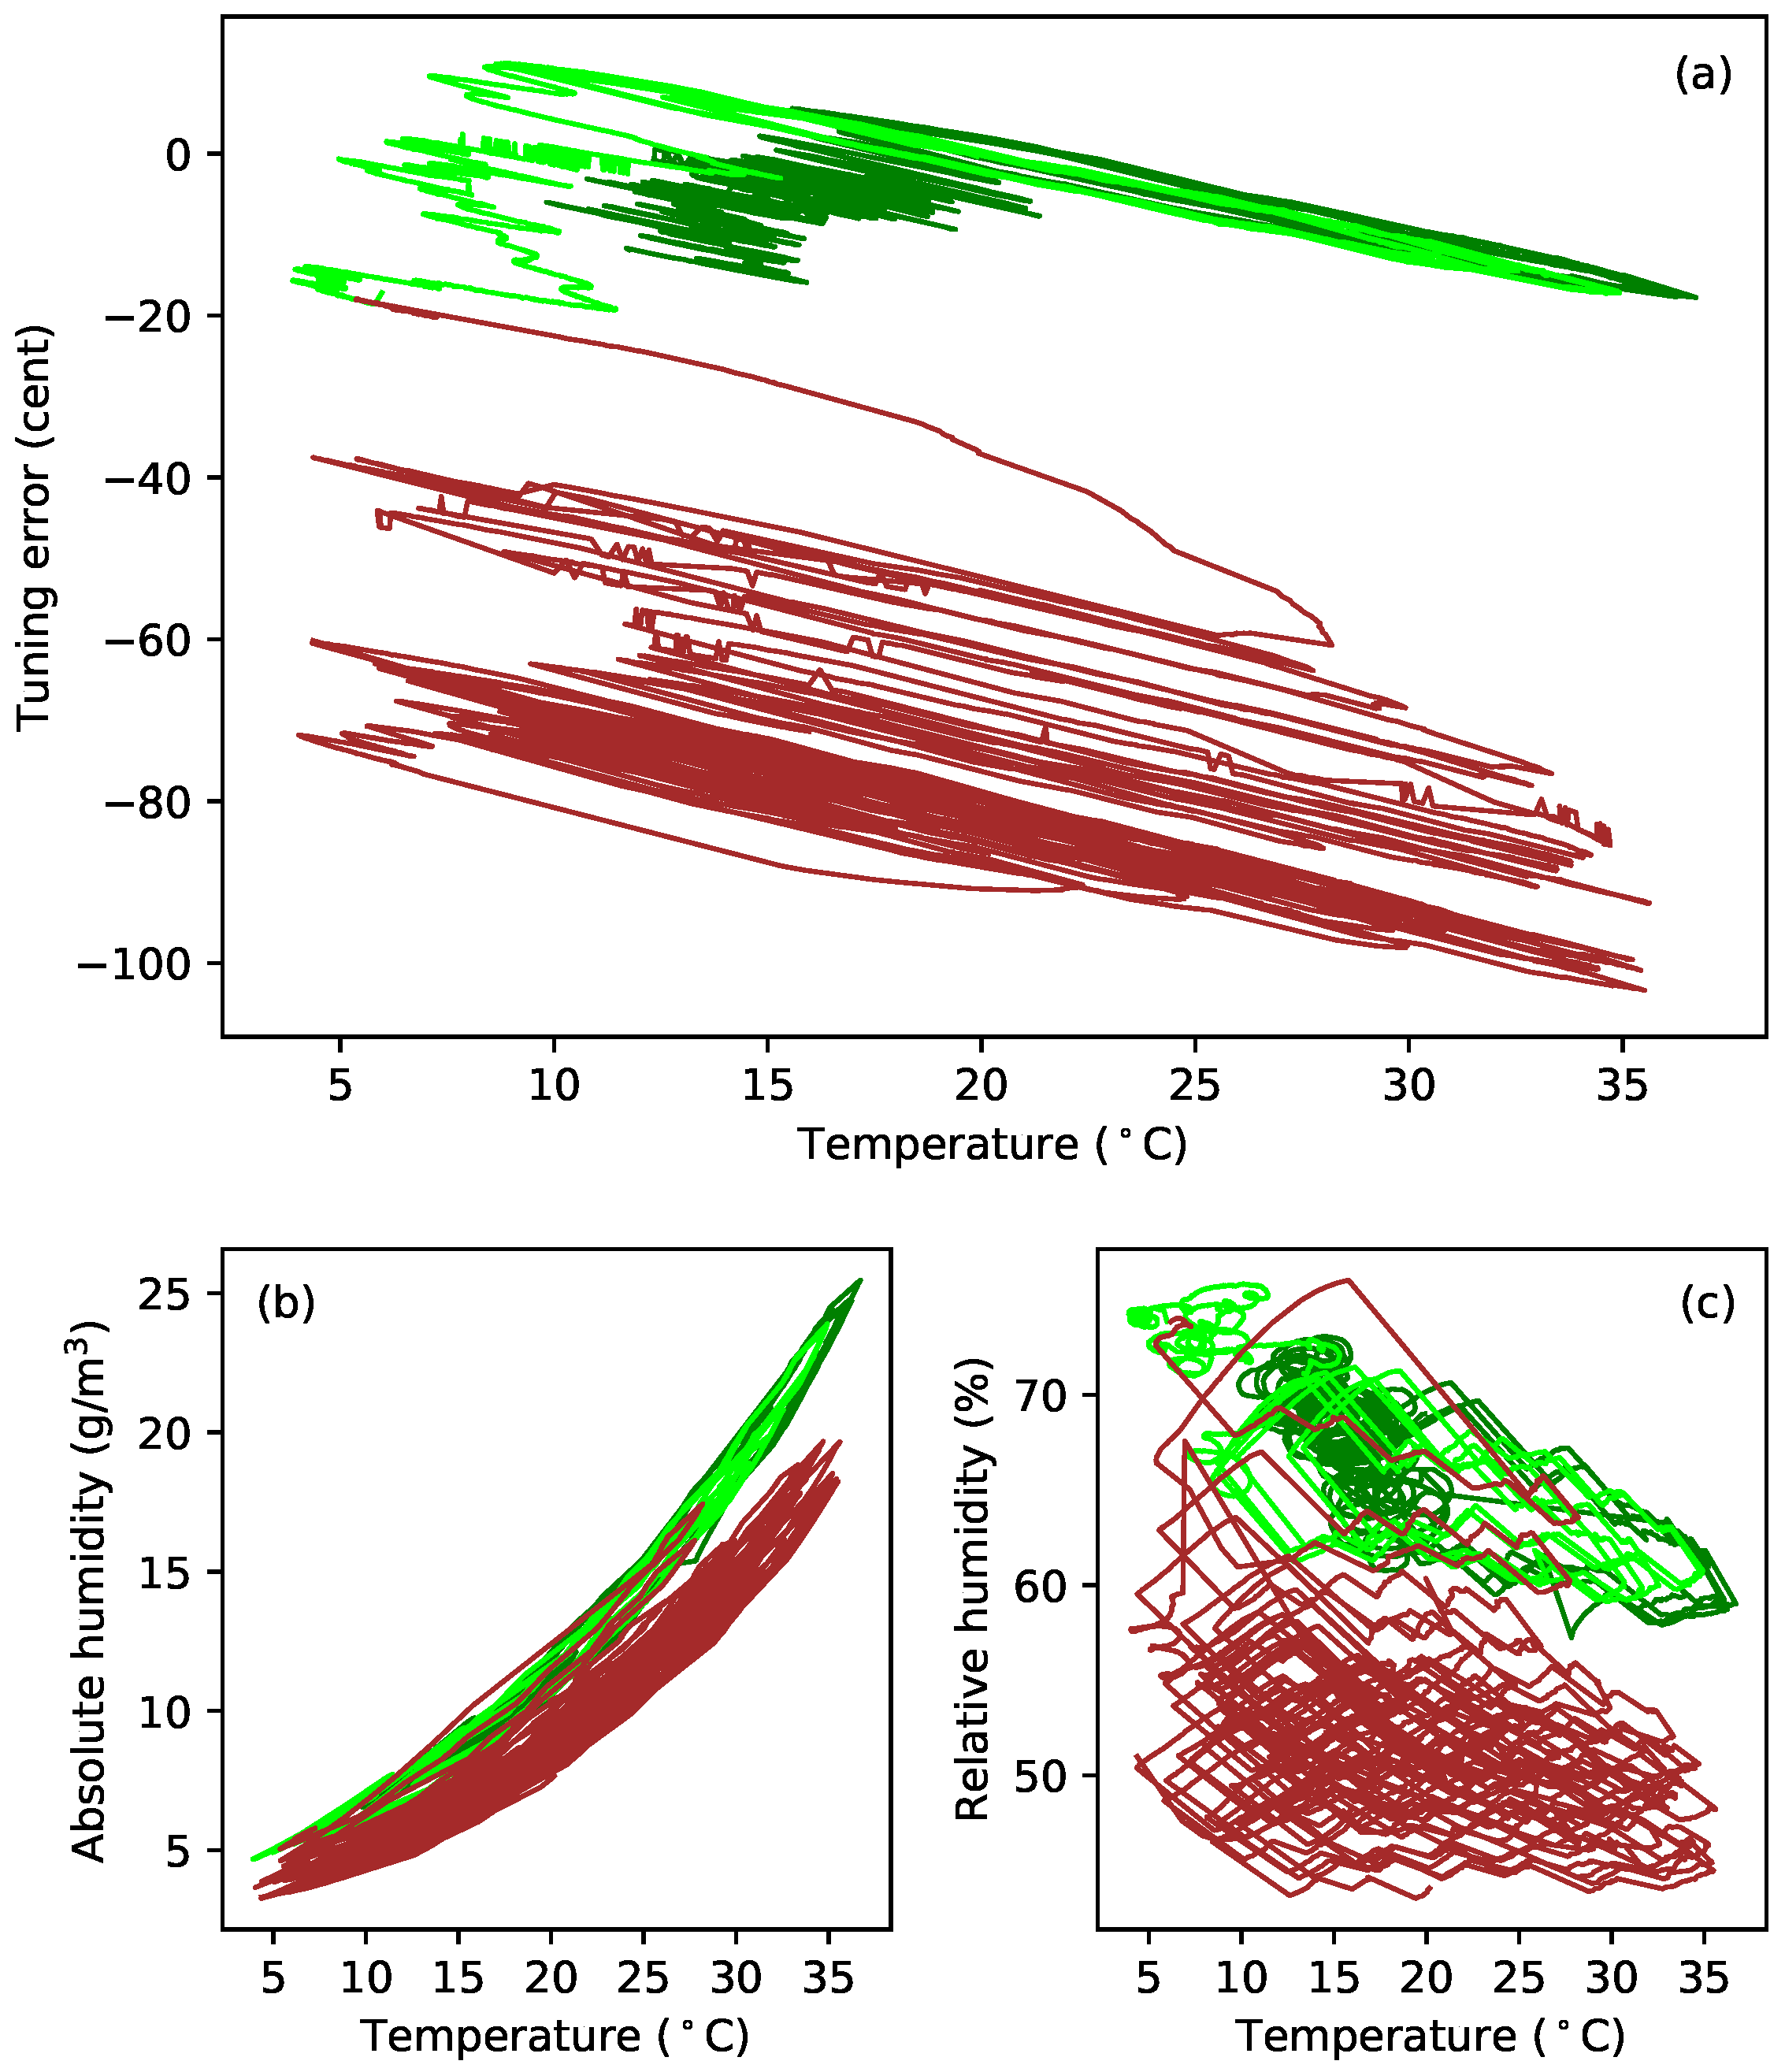
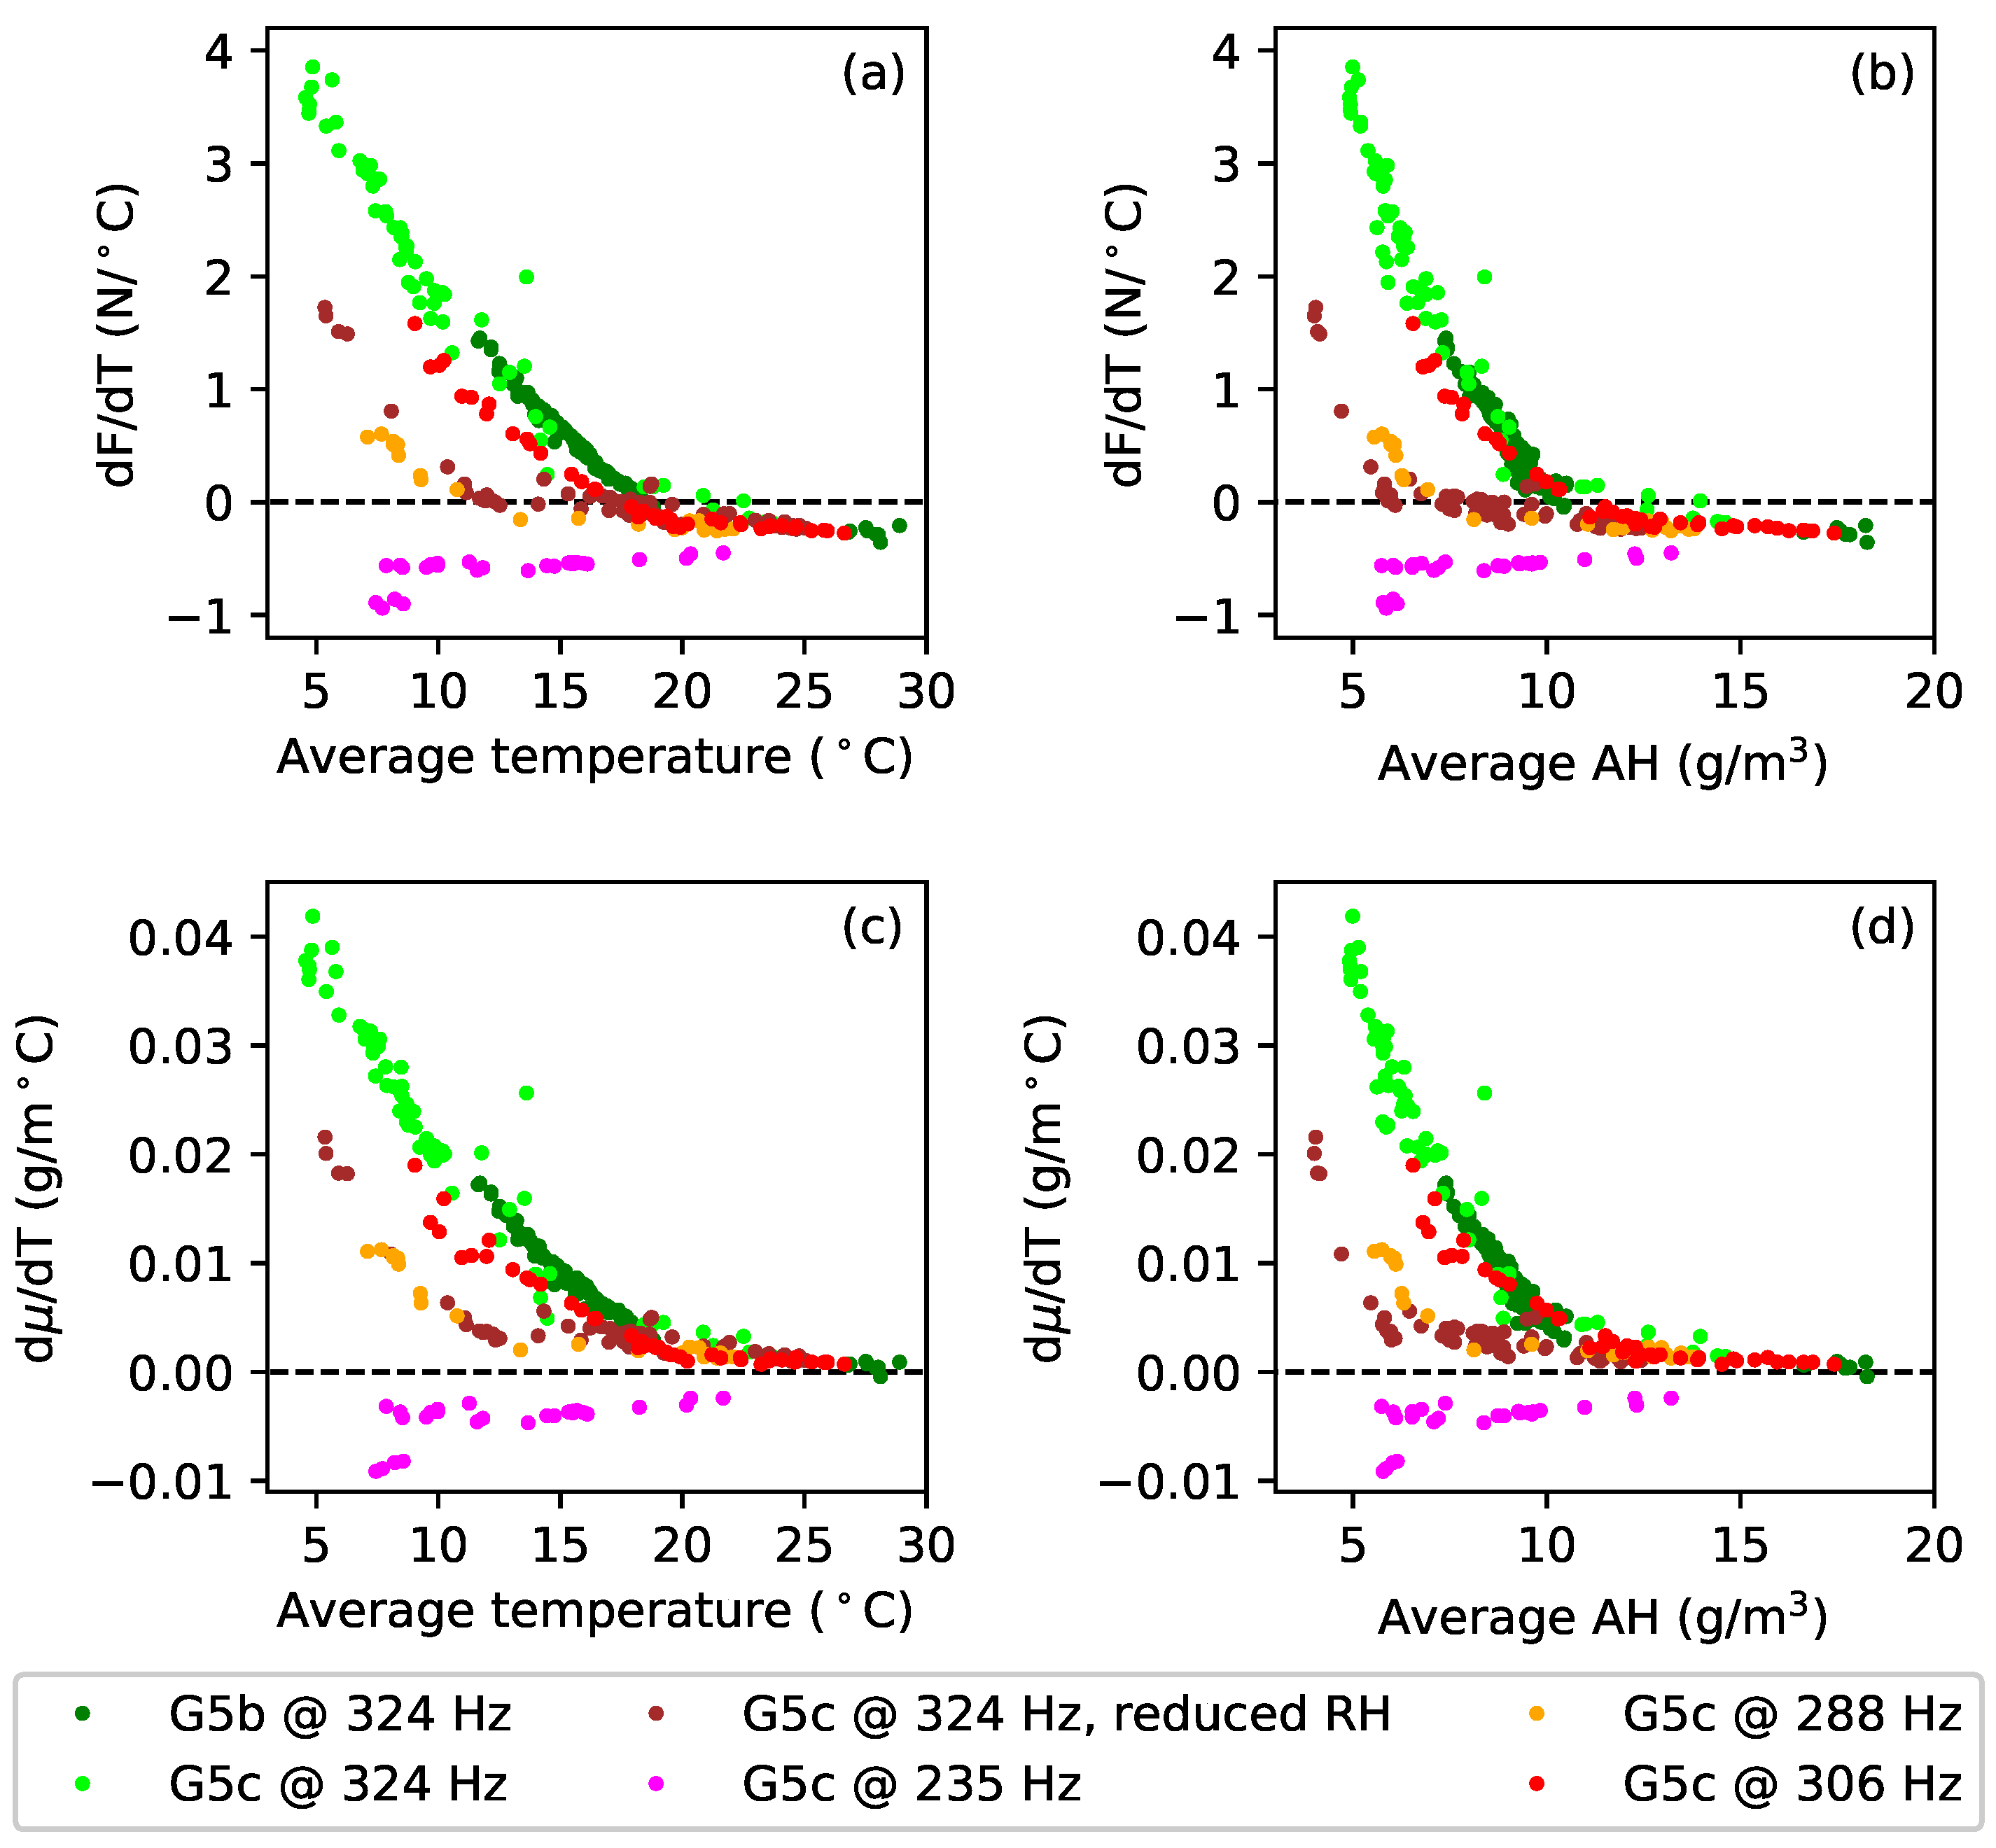
Figure 8a plots the tuning error (in cents) against temperature during extended tests with gut strings G5b and G5c. After running the constant-length tests at the last target frequency (324 Hz; see
Table 1), the heating was switched off, and the behaviour of these strings was simply monitored as the ambient temperature and humidity levels varied (
Figure 8b,c). In the case of string G5c, the water reservoir, for maintaining the humidity levels in the test chamber, was subsequently removed, and the heating restarted, resulting in the brown sections of the responses for this string. The reasons for doing this are explained below (
Section 4), but the feature to note here is that the gradients of the tuning error versus temperature responses remained remarkably constant despite significant changes in the overall temperature and humidity levels. This seems to be somewhat at odds with the general sensitivity of gut strings to environmental changes, explored in more detail in
Section 4.
Figure 9 shows the thermal tuning sensitivity when the strings were maintained at constant tension. The thermal variation in the string linear density was now the dominant influence. Note that holding the tension constant reduced the sensitivity to tension-related thermal effects significantly, but it did not remove them entirely: as the temperature rose and the string relaxed or contracted (see below), it had to be wound onto or off the winding shaft to compensate, thereby contributing additional changes to the linear density.
The thermal tuning sensitivities of the nylon strings were greatly reduced compared to the constant-length results seen in
Figure 7a, with the sensitivities at the string operating points all smaller than 0.5
C and often less than 0.3
C; albeit with the thinner strings going slightly sharp as the temperature rose, while the thicker strings went slightly flat. The improvement was not as dramatic for the fluorocarbon strings, especially not for string C1, but all the fluorocarbon strings now consistently went sharp as the temperature rose. The overall form of the responses from the fluorocarbon strings was similar to that for the nylon strings, with the tuning sensitivity initially falling as the applied stress was increased and then settling at a more or less constant level.
In contrast to both kinds of synthetic string, the behaviour of the gut strings in this test was much more erratic. The gut strings now generally went sharp as the temperature was increased, but, rather than improving the tuning stability, holding the strings at constant tension actually made things worse in some cases. In striking contrast with the results from the constant-length tests shown in
Figure 7c, the gut string responses shown in
Figure 9c are neither smooth, nor particularly consistent between the different strings. The results for the two sections of string G5 were somewhat consistent with each other, but the results for the two sections of string G3 were very different. Given that changes in the linear density were now the dominant effect, and recalling the earlier remarks regarding sensitivity to changes in the prevailing weather conditions, these gut responses have again been plotted with dashed lines as a warning against taking the erratic curves at face value.
3.4. Variations in Tension and Linear Density
In accordance with Equations (
1) and (
2), the thermal tuning sensitivity, around a base temperature
, of a string held at constant length would be expected to be:
where
, and
and
are respectively the string tension and linear density at
. For convenience, the thermal variations in the string tension and linear density will be separated, and denoted
and
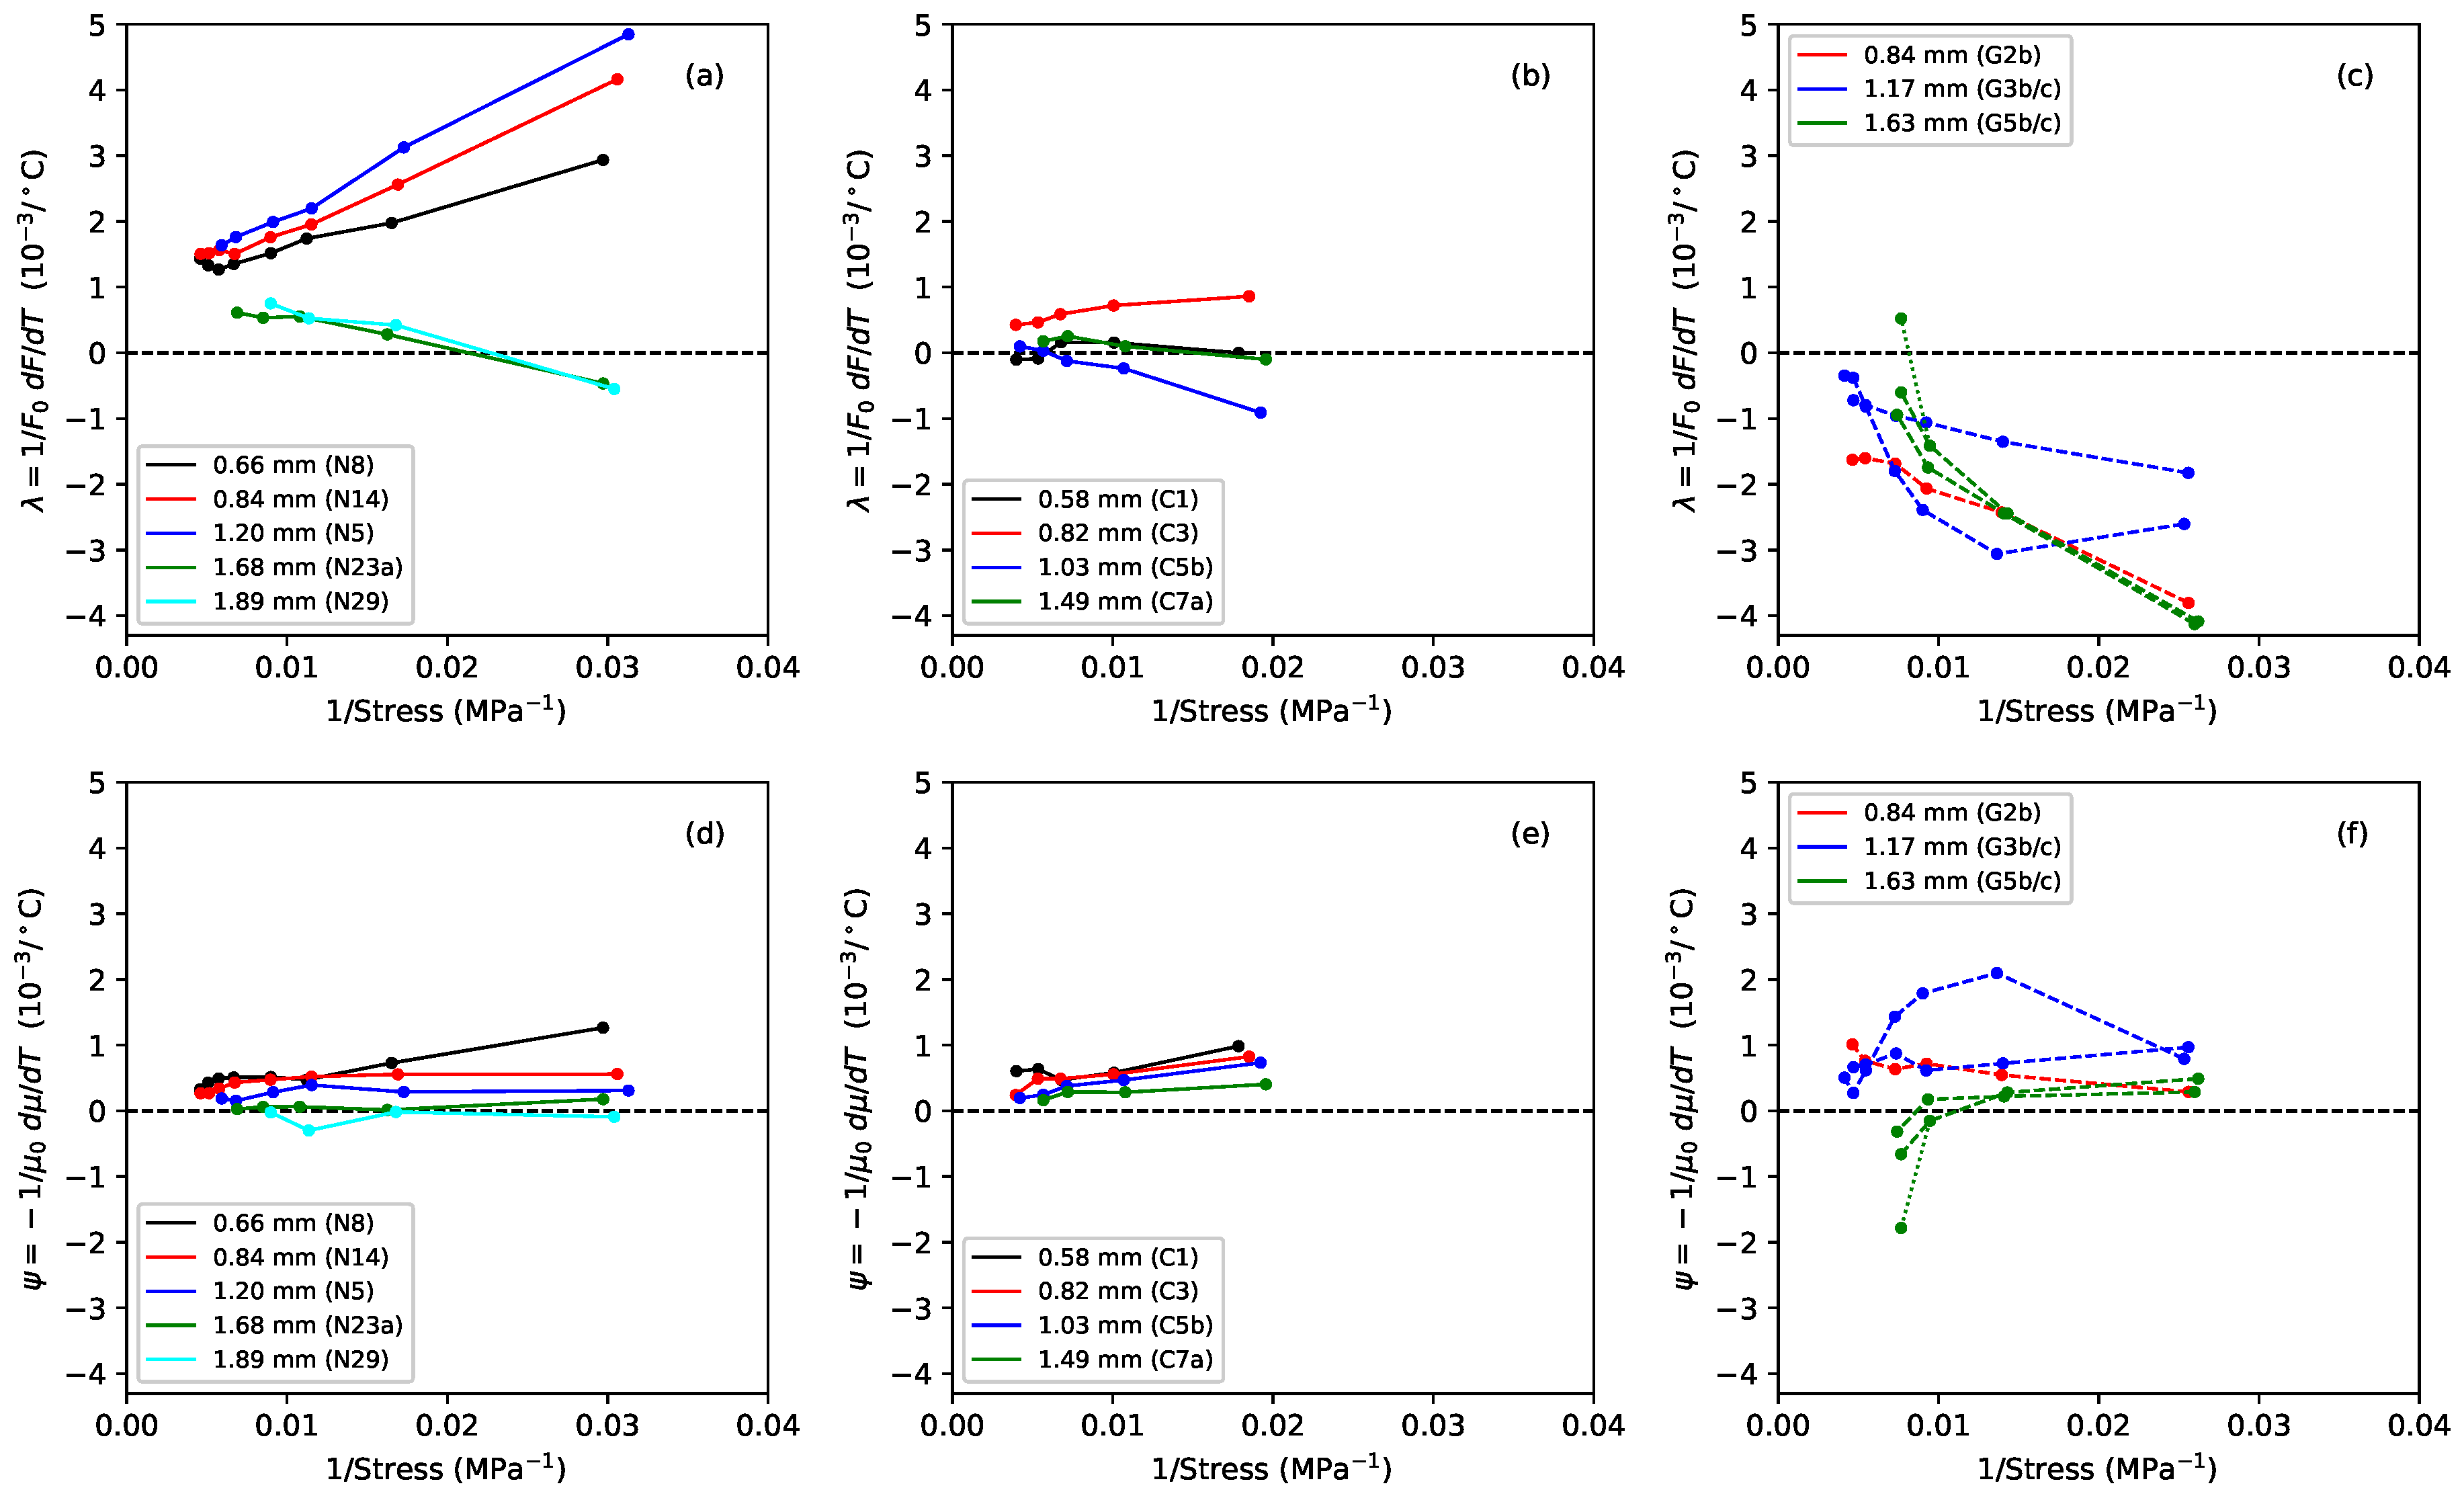
respectively:
Figure 10 shows the measured values of both quantities for the tests when the strings were held at constant length with no tuning adjustments. The thermal tension sensitivity values
were obtained by fitting lines to the tension versus temperature responses. The corresponding values for
were similarly obtained from the linear density responses, the latter being calculated from the directly measured string frequency and tension responses [
1]. Adding these two sets of values together, and scaling by
K, gives the thermal tuning sensitivity responses shown in
Figure 7.
The behaviour seen in
Figure 8a for the G5b and G5c gut strings requires either that both
and
remain largely constant, for a given applied stress, or that any change in one is offset by a corresponding change in the other. Similarly, the behaviour seen in
Figure 7 for all three string materials would require either that both
and
change linearly with the inverse of the applied stress or that any more complex change in one is offset by a corresponding change in the other. The responses in
Figure 10 have been plotted against the inverse of the applied stress to explore this question.
For the nylon strings, both and did appear to vary fairly linearly with the inverse of the stress, with the thermal tension sensitivity generally being the dominant term. It can clearly be seen how minimising the tension sensitivity, by holding the string at constant tension, will greatly reduce the overall thermal tuning sensitivity of a rectified nylon string. For the fluorocarbon strings, both and again appeared to vary fairly linearly with the inverse of the stress, but now the contributions from the and terms were more evenly matched. This explains why minimising the effects of the thermal tension variations did not provide such a marked improvement in the tuning sensitivity as it did for the nylon strings. It is interesting to note that the thermal sensitivity in the linear density is of a very similar magnitude for both the nylon and fluorocarbon strings, with both materials losing mass (presumably through drying out) as the temperature increased. The main difference in the thermal behaviour of these two materials comes from their thermal tension sensitivity .
In contrast, the and responses for the gut strings did not vary linearly, or even particularly smoothly, with the inverse of the applied stress, which strongly suggests that the thermal variations in the string tension and linear density must be coupled in some way. The values for were generally, but not always, positive, indicating that in most cases the strings were again losing mass as the temperature rose. String G3b again showed a much higher degree of variation in its behaviour than the other section of the same string, or the thinner and thicker strings.
The reduction in linear density with an increase in temperature for all three materials, in most cases, would on its own tend to make the strings go sharp. For the nylon and gut strings, the thermal tension variation
was generally the more dominant term, with the sign of this term largely determining whether the overall behaviour of the unadjusted string (held at constant length) was to go sharp or flat with changes in temperature. For nylon and fluorocarbon strings, the thermal variation in the string tension will be determined by changes in its stiffness and its unstretched length, with these effects being governed in turn by changes in the Young’s modulus and the coefficient of linear thermal expansion (CLTE). On this basis, a simple analysis [
1] provided a means of estimating the CLTE from the observed thermal sensitivities in the string tension and Young’s modulus.
Figure 11 shows the CLTE values obtained in this way for the nylon and fluorocarbon strings, plotted against the applied stress. In every case the CLTE was negative, indicating that the strings were trying to contract longitudinally as they were heated. This is an entropic effect [
20], which would tend to increase the tension and make the strings go sharp. The CLTE values for the fluorocarbon strings were fairly similar to those obtained from the lower-density group of nylon strings, with no particular distinction between the wound and monofilament strings.
For gut strings, a third tension variation effect needs to be taken into account: as the humidity increases, the string fibres absorb moisture (increasing the linear density) and expand radially. It is believed that this expansion, within the twisted structure of the string, can in turn cause an increase in the string tension [
21]. This effect could be expected to vary with the twist ratio and could provide a plausible explanation for the apparent coupling between changes in the string linear density and tension. This effect does not, however, appear to have been tested directly, and it is conceivable that some other mechanism may cause the longitudinal tension to change as the gut fibres absorb and release moisture.
If it could be assumed that the longitudinal CLTE and variations in the string’s Young’s modulus were not affected by changes in humidity, then it might be possible to estimate the CLTE by introducing an additional term, proportional to
, into the expression given for
in the previous study of nylon strings [
1]. Following such a route suggests that the longitudinal CLTE of the gut strings tested here was generally negative, as for the nylon and fluorocarbon strings, and with an approximately similar magnitude. This should properly be regarded as speculation, however, since the data were not clear enough to provide conclusive support for such an assumption.
For the nylon and fluorocarbon strings, the overall tension response to an increase in temperature will depend on the balance between the reduction in the Young’s modulus (
Figure 4) and the contraction from the CLTE. These effects work against each other and tend to be fairly evenly matched [
1]. For the nylon strings, the thermal contraction was usually the dominant effect, causing the strings to tighten and go sharp as the temperature was increased; while for the fluorocarbon strings, the balance varied from string to string.
For the gut strings, in nearly every case tested, the tension of the strings held at constant length fell as the temperature rose; the opposite behaviour to that seen for the nylon strings. The thermal tension sensitivities of the two materials were of about the same magnitude, but with opposite signs. If the speculation regarding the negative sign of the longitudinal CLTE for the gut strings is correct, then the reduction in the Young’s modulus must have been the more significant effect, causing the strings to relax and go flat.
The
response plots in the top row of
Figure 10 illustrate rather nicely how the balance between the various thermal tension effects varies across the different string materials. However, it should be noted (for all three materials) that if the temperature were to be increased too far, the string would be likely to start creeping again, causing it to go flat.


