Non-Isothermal Oxidation Behavior and Mechanism of a High Temperature Near-α Titanium Alloy

 ,
,
Abstract
:1. Introduction
2. Experimental
2.1. Non-Isothermal Oxidation Experiment
2.2. Microstructural Characterization
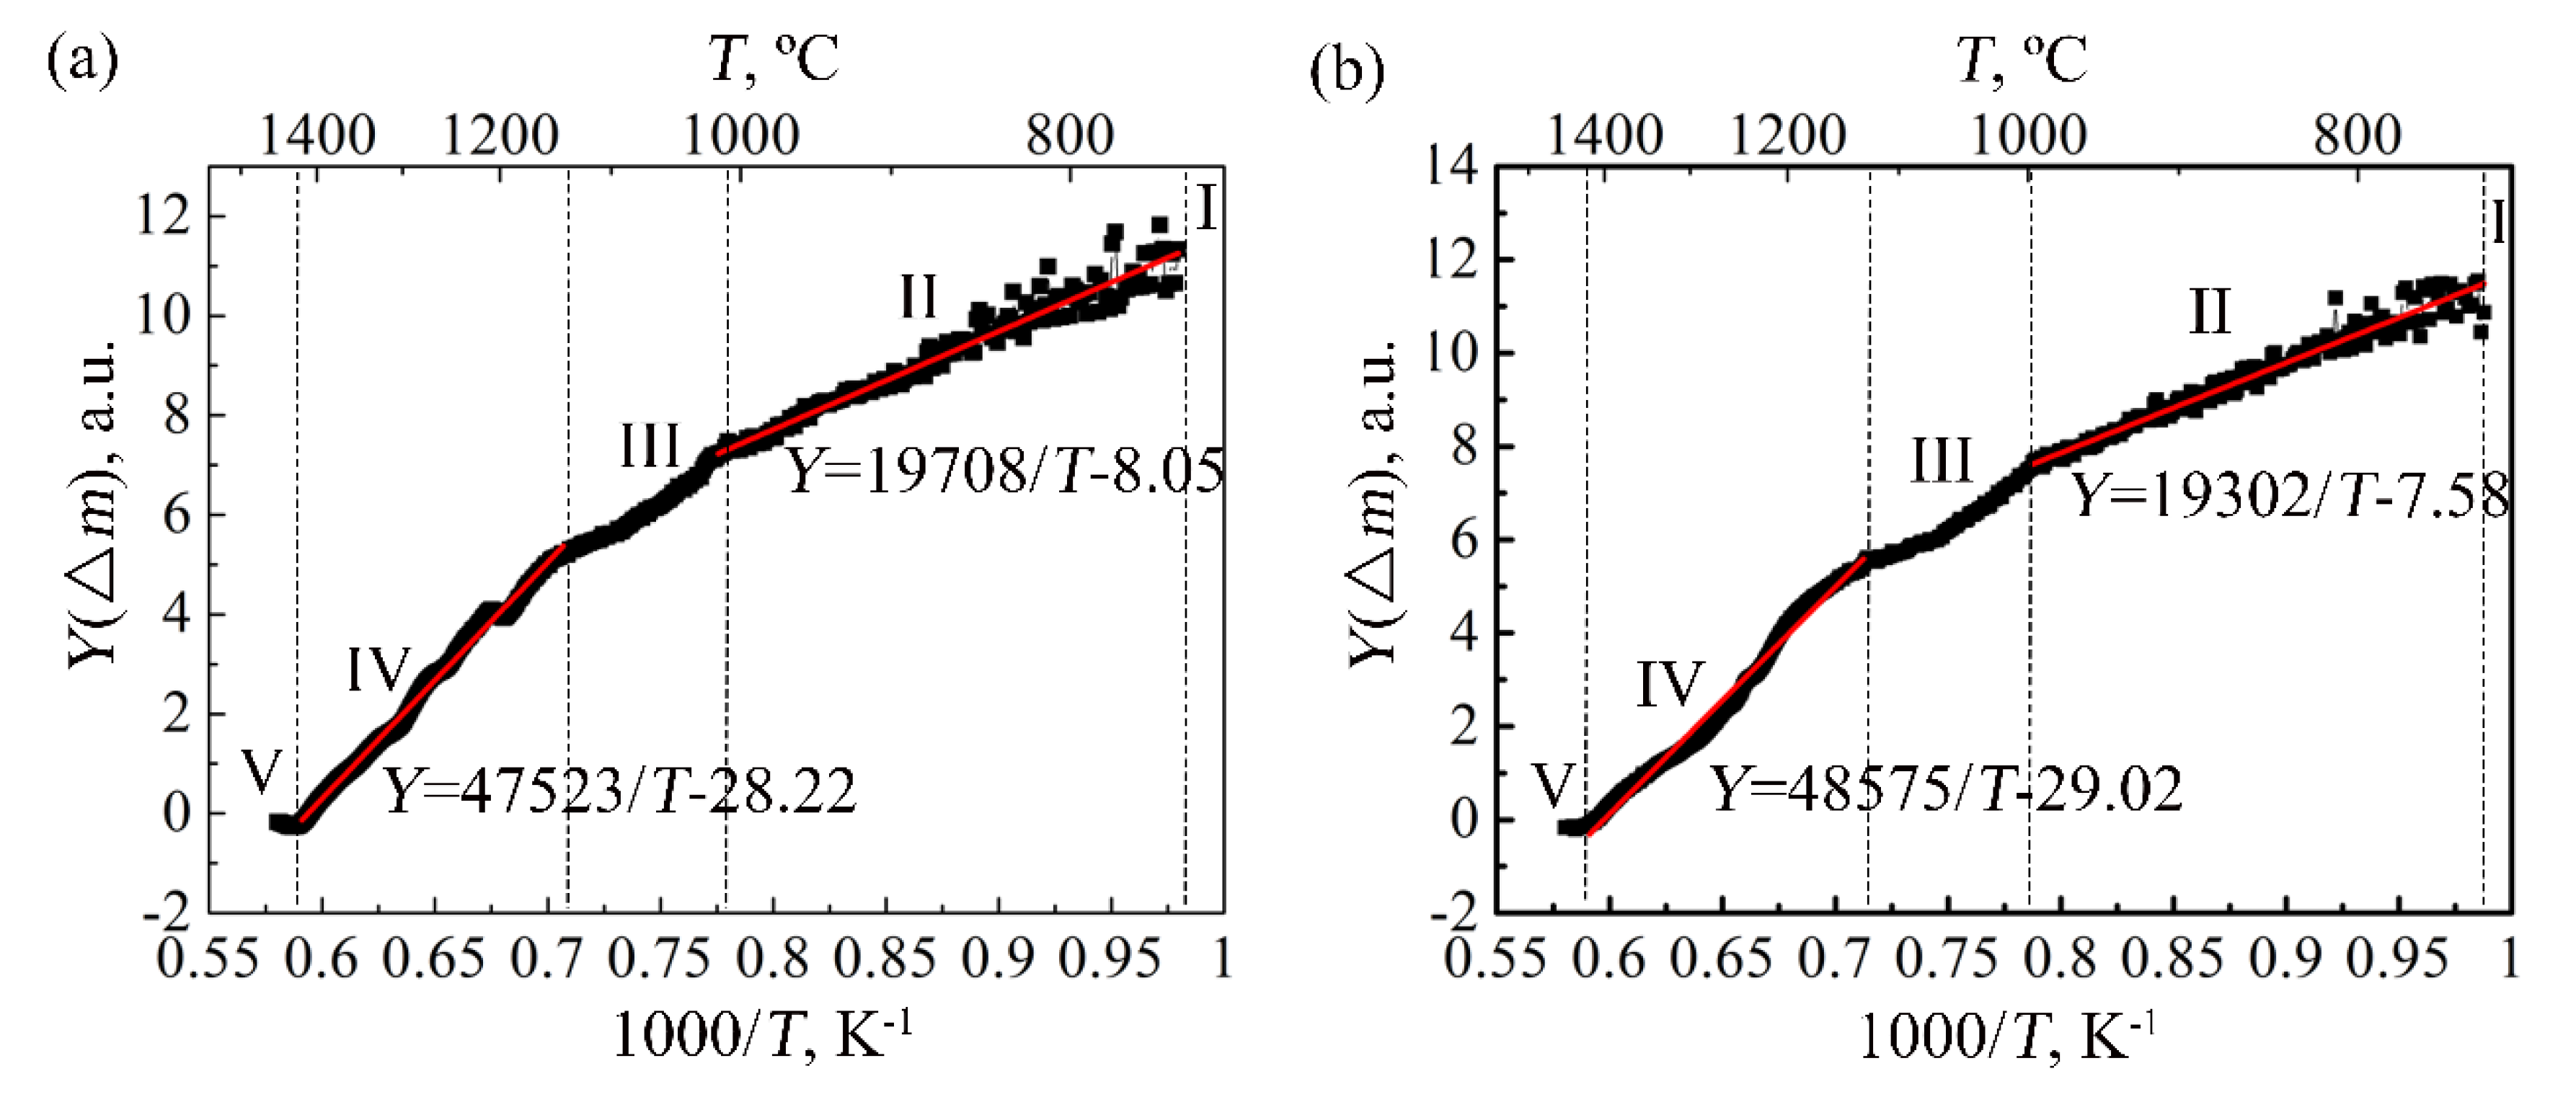
3. Calculation of Oxidation Activation Energy
4. Results
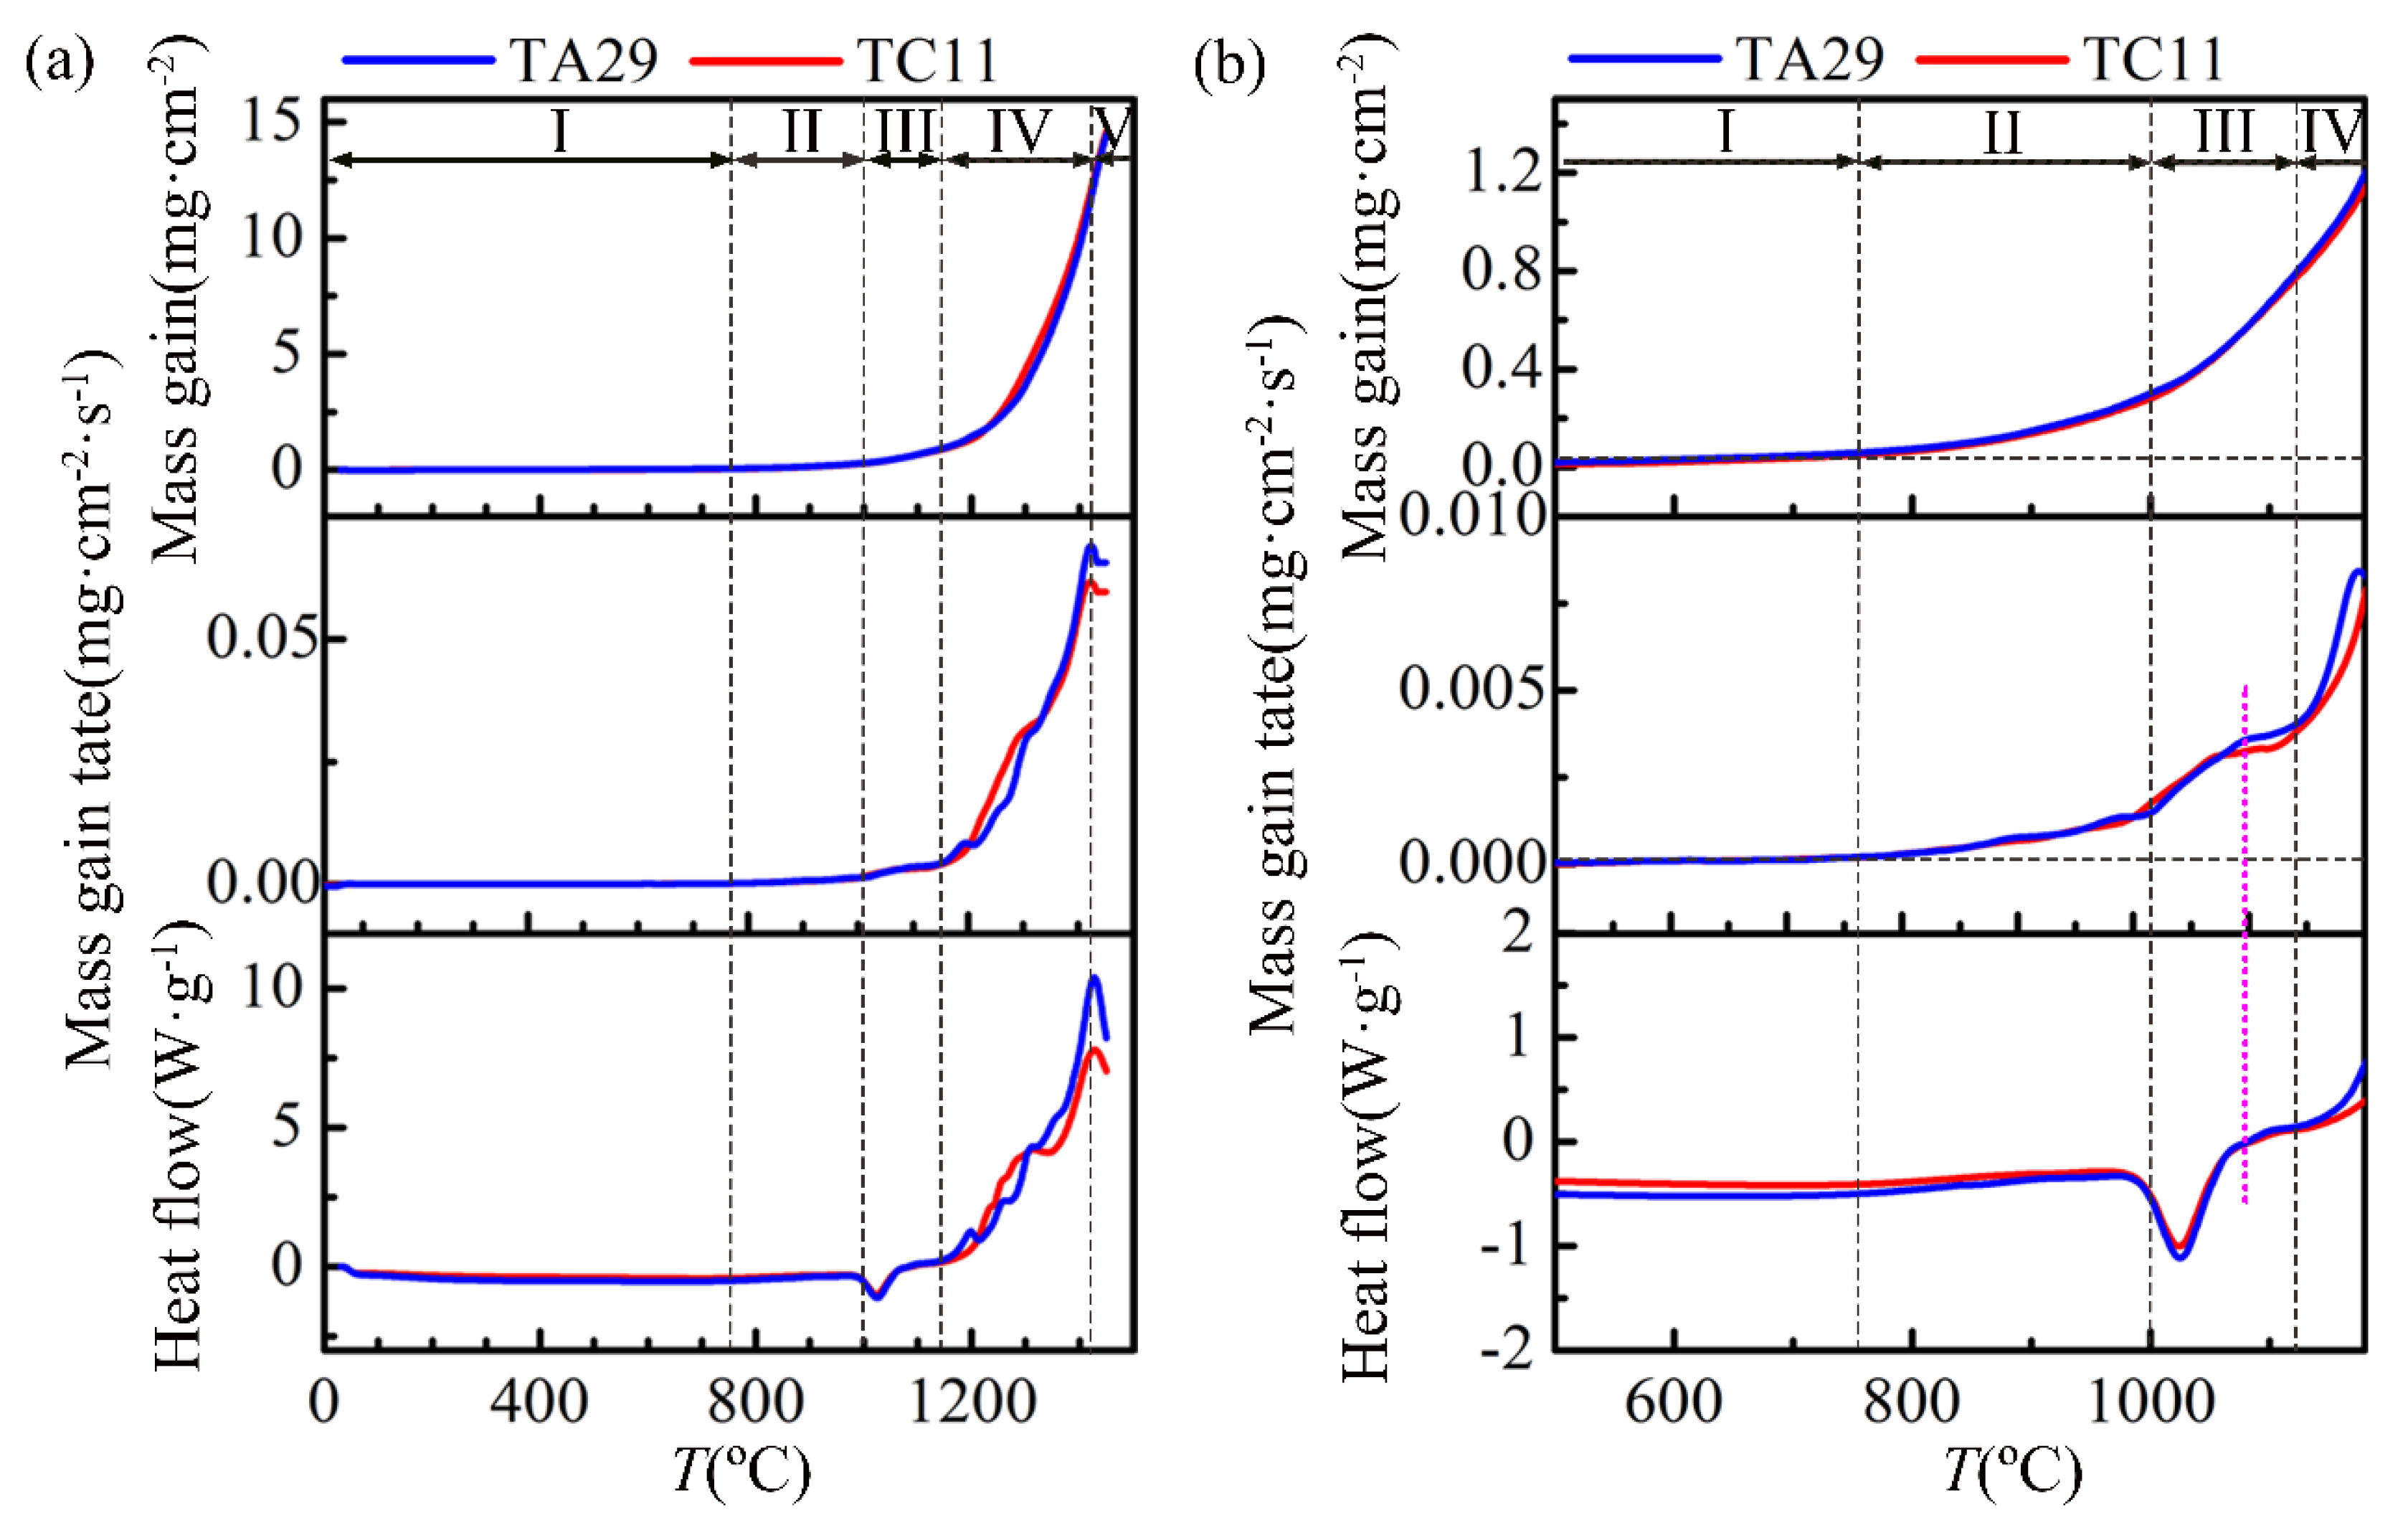
4.1. Non-Isothermal Oxidation Mass-Gain Curve
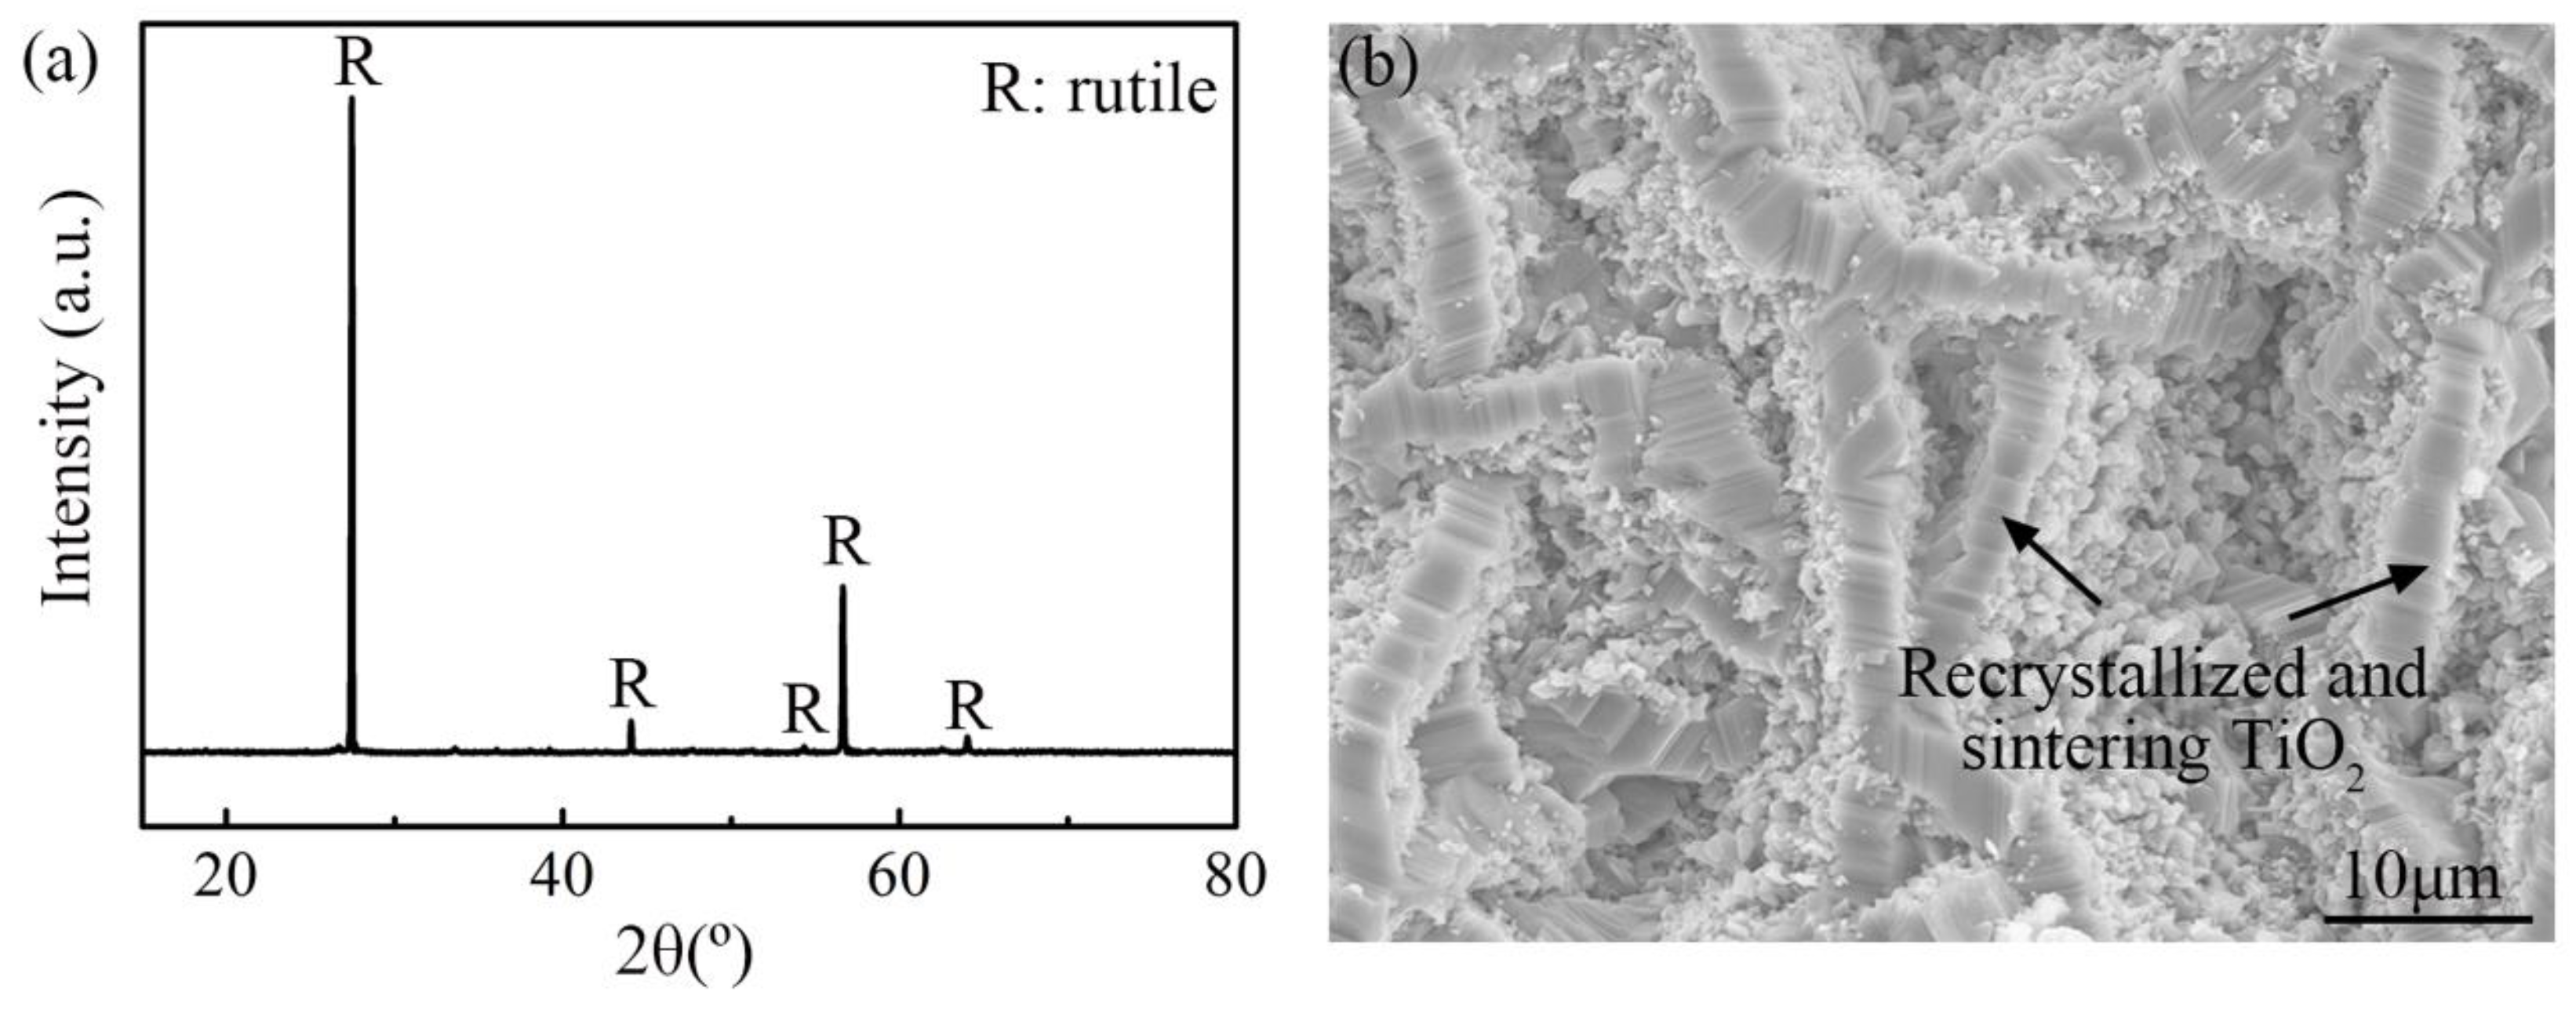
4.2. Morphology of Oxide Scale
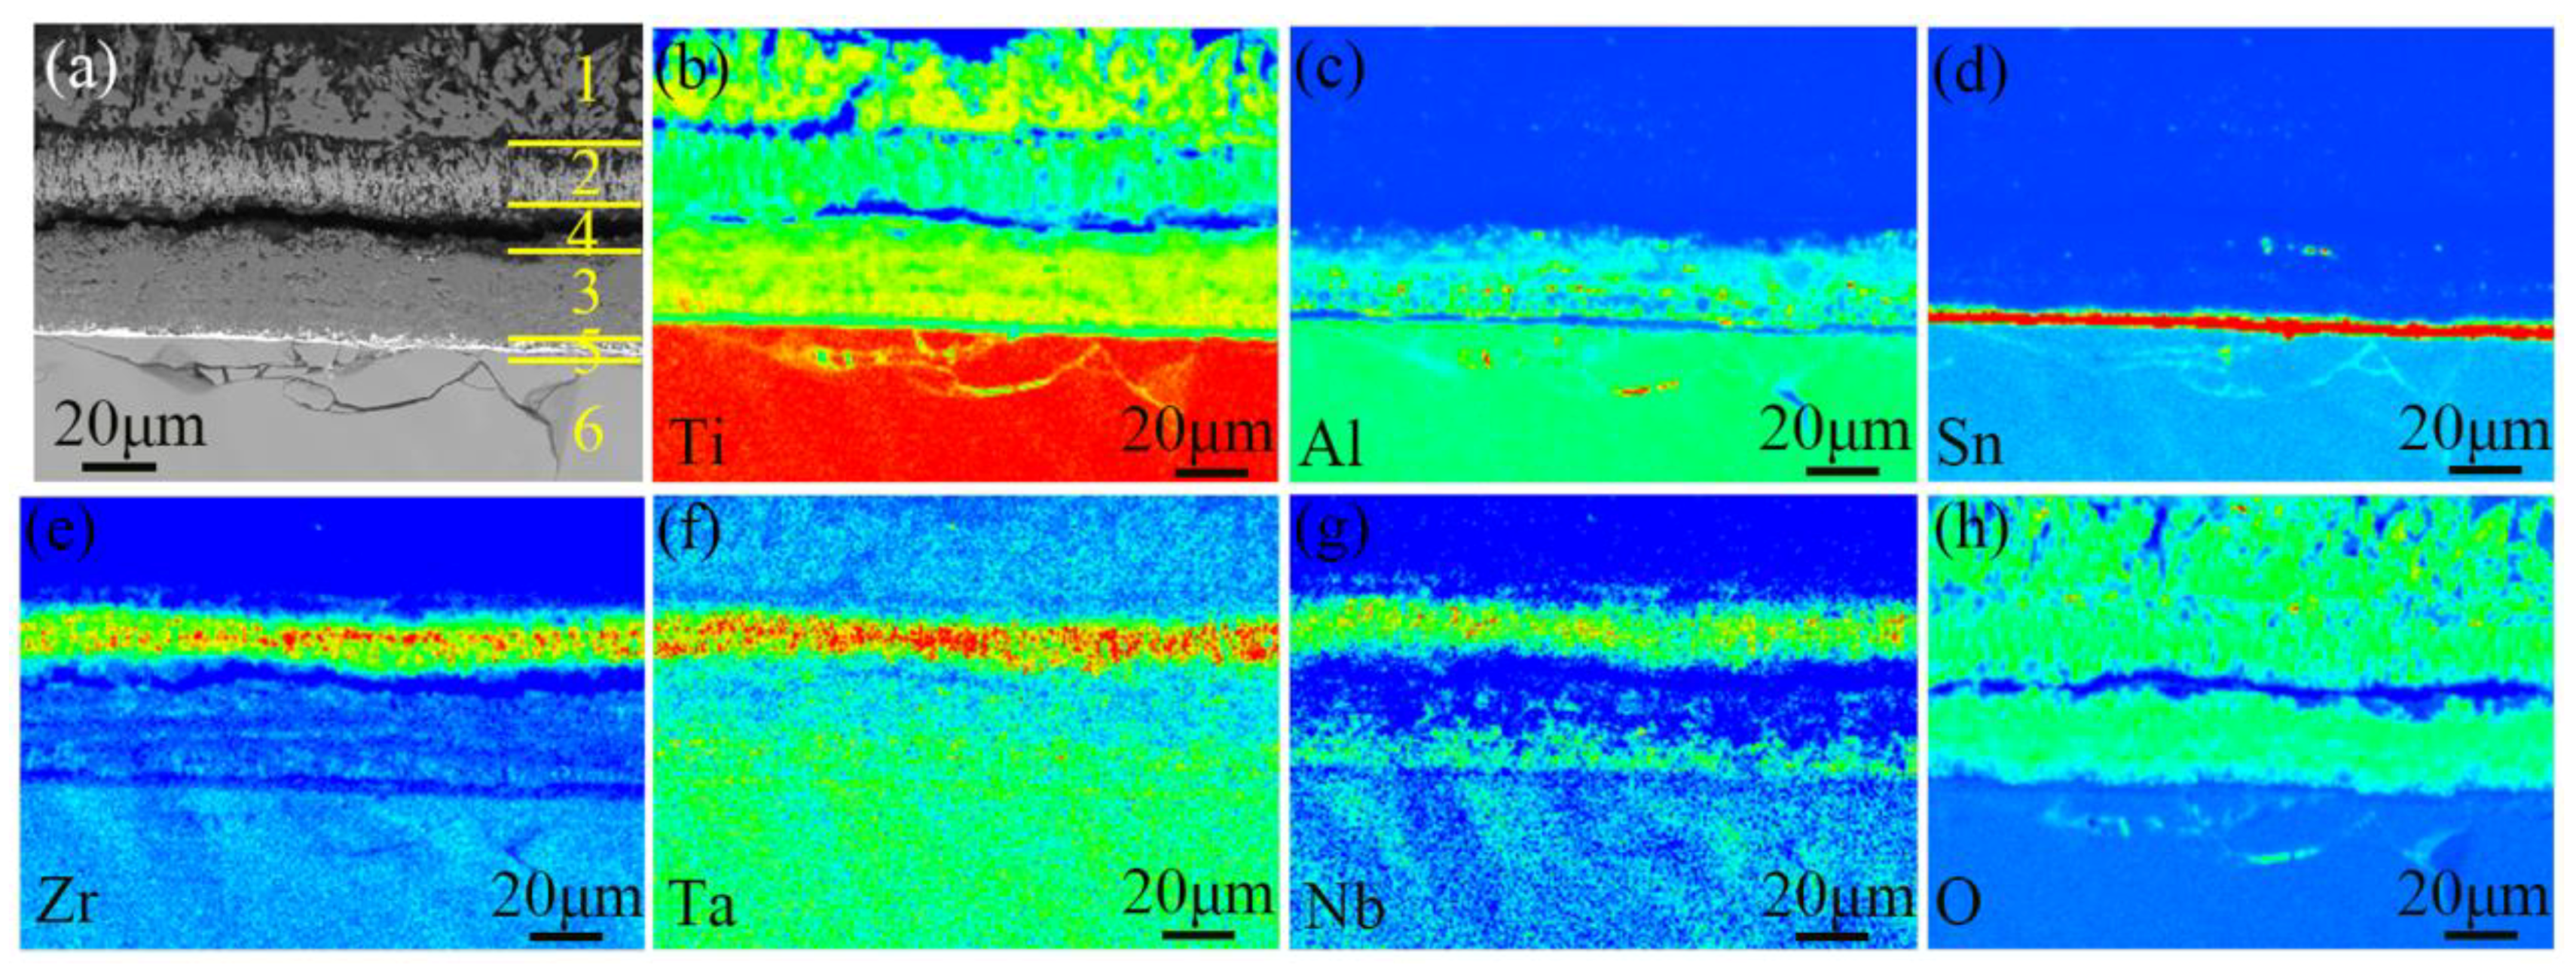
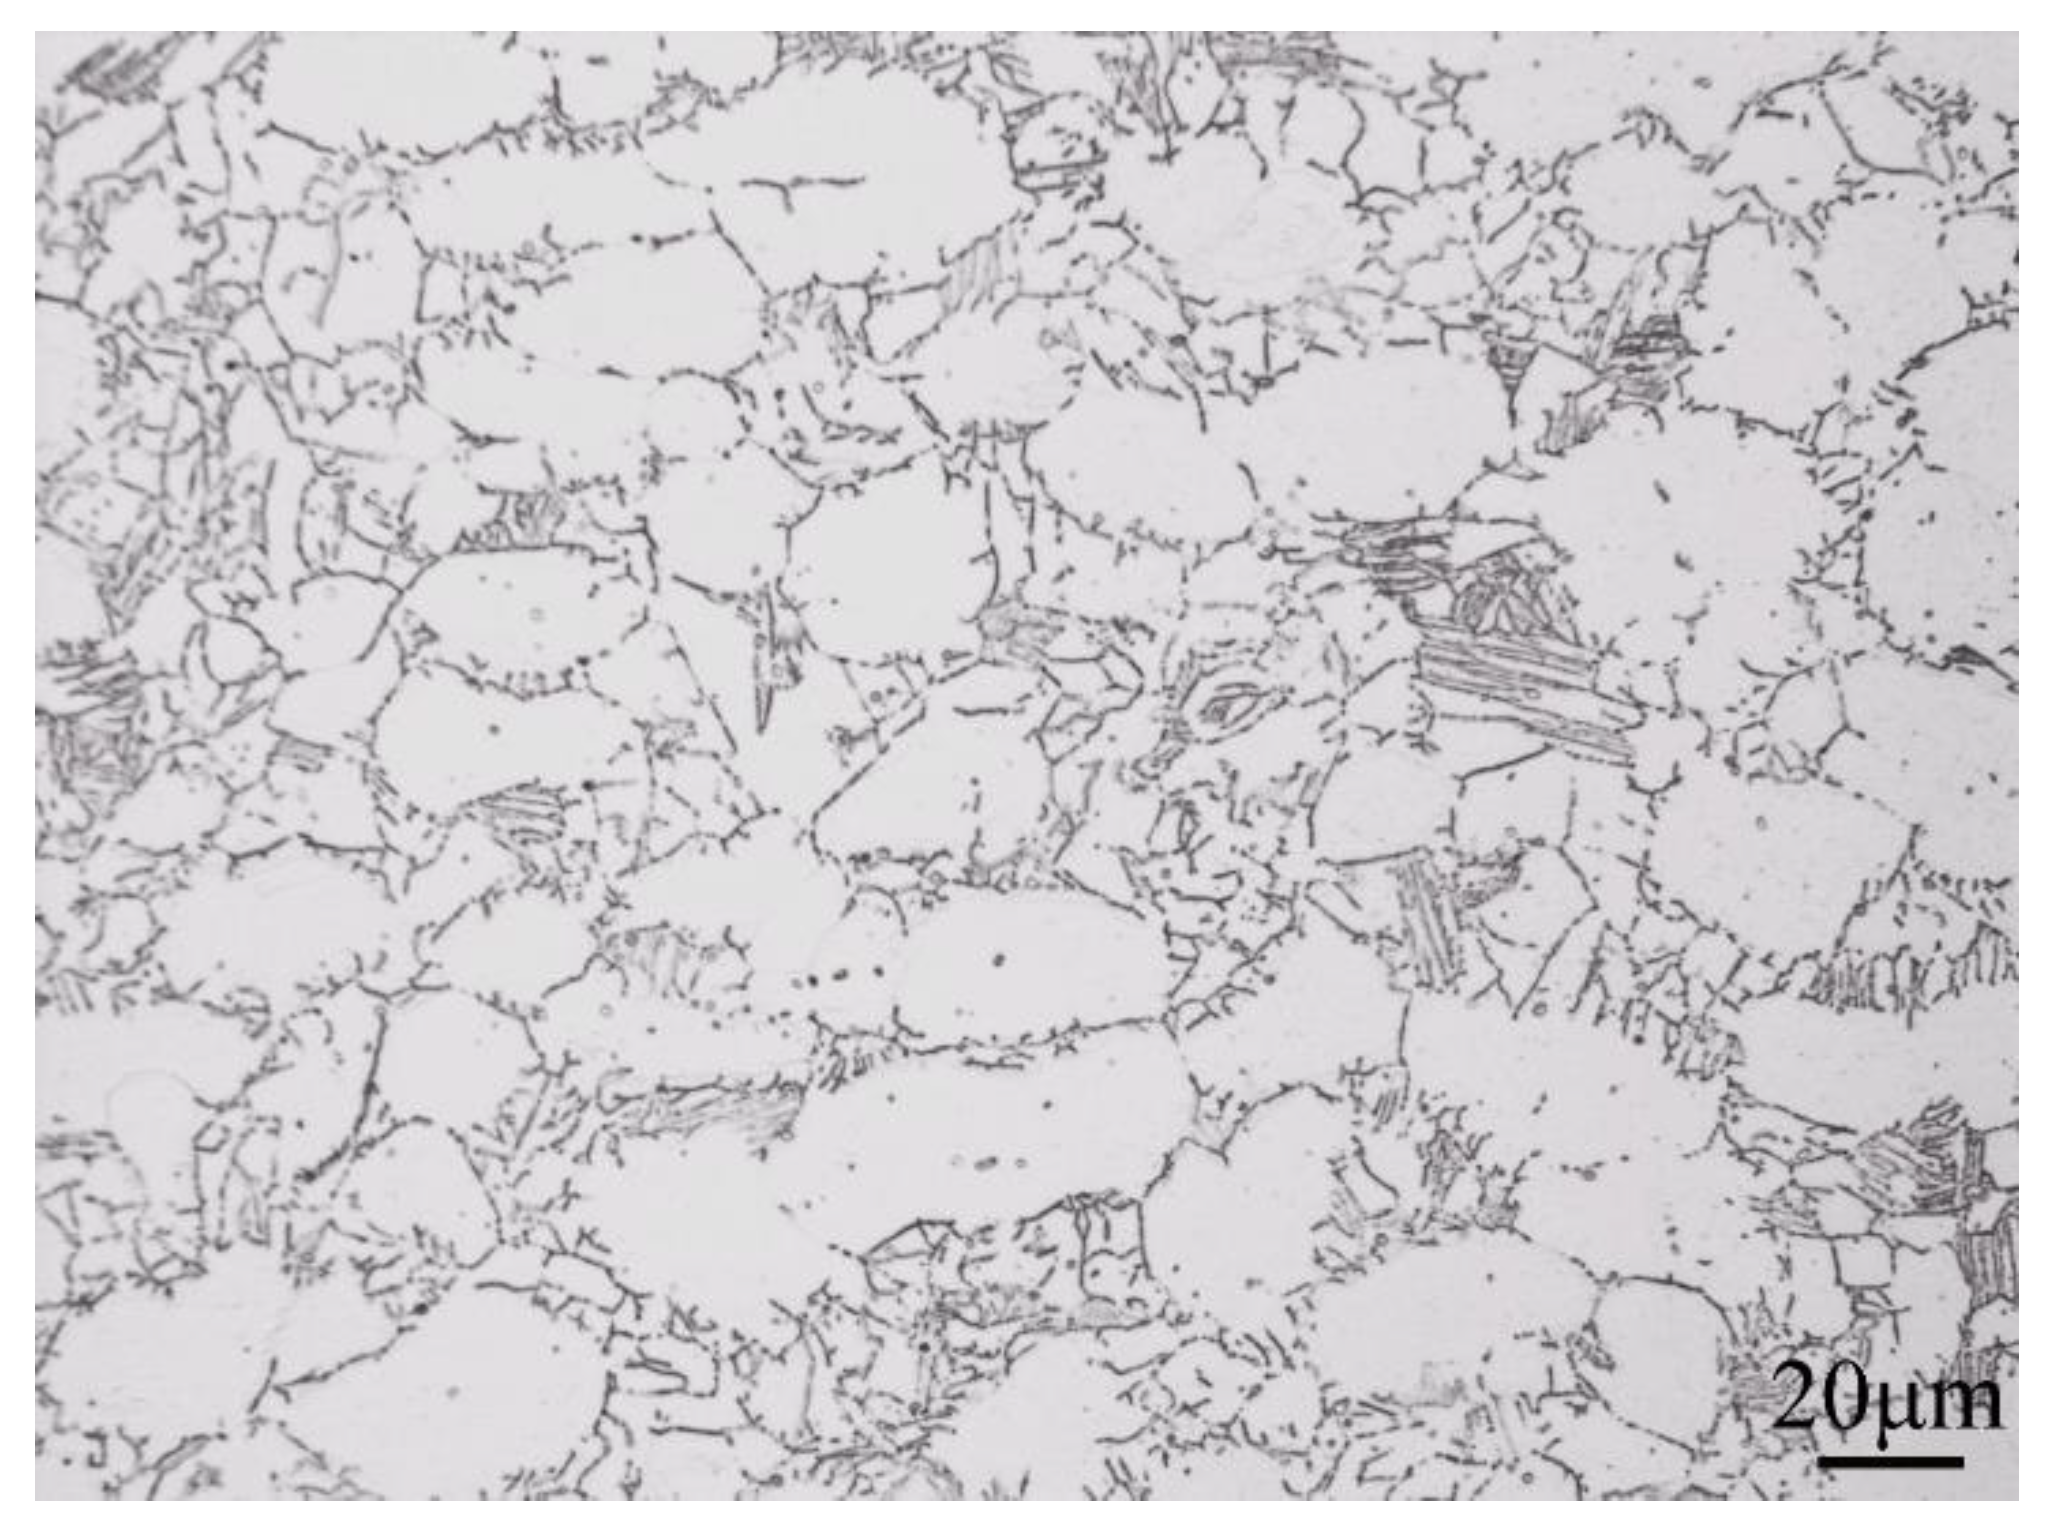
4.3. Morphology of Substrate
5. Discussion
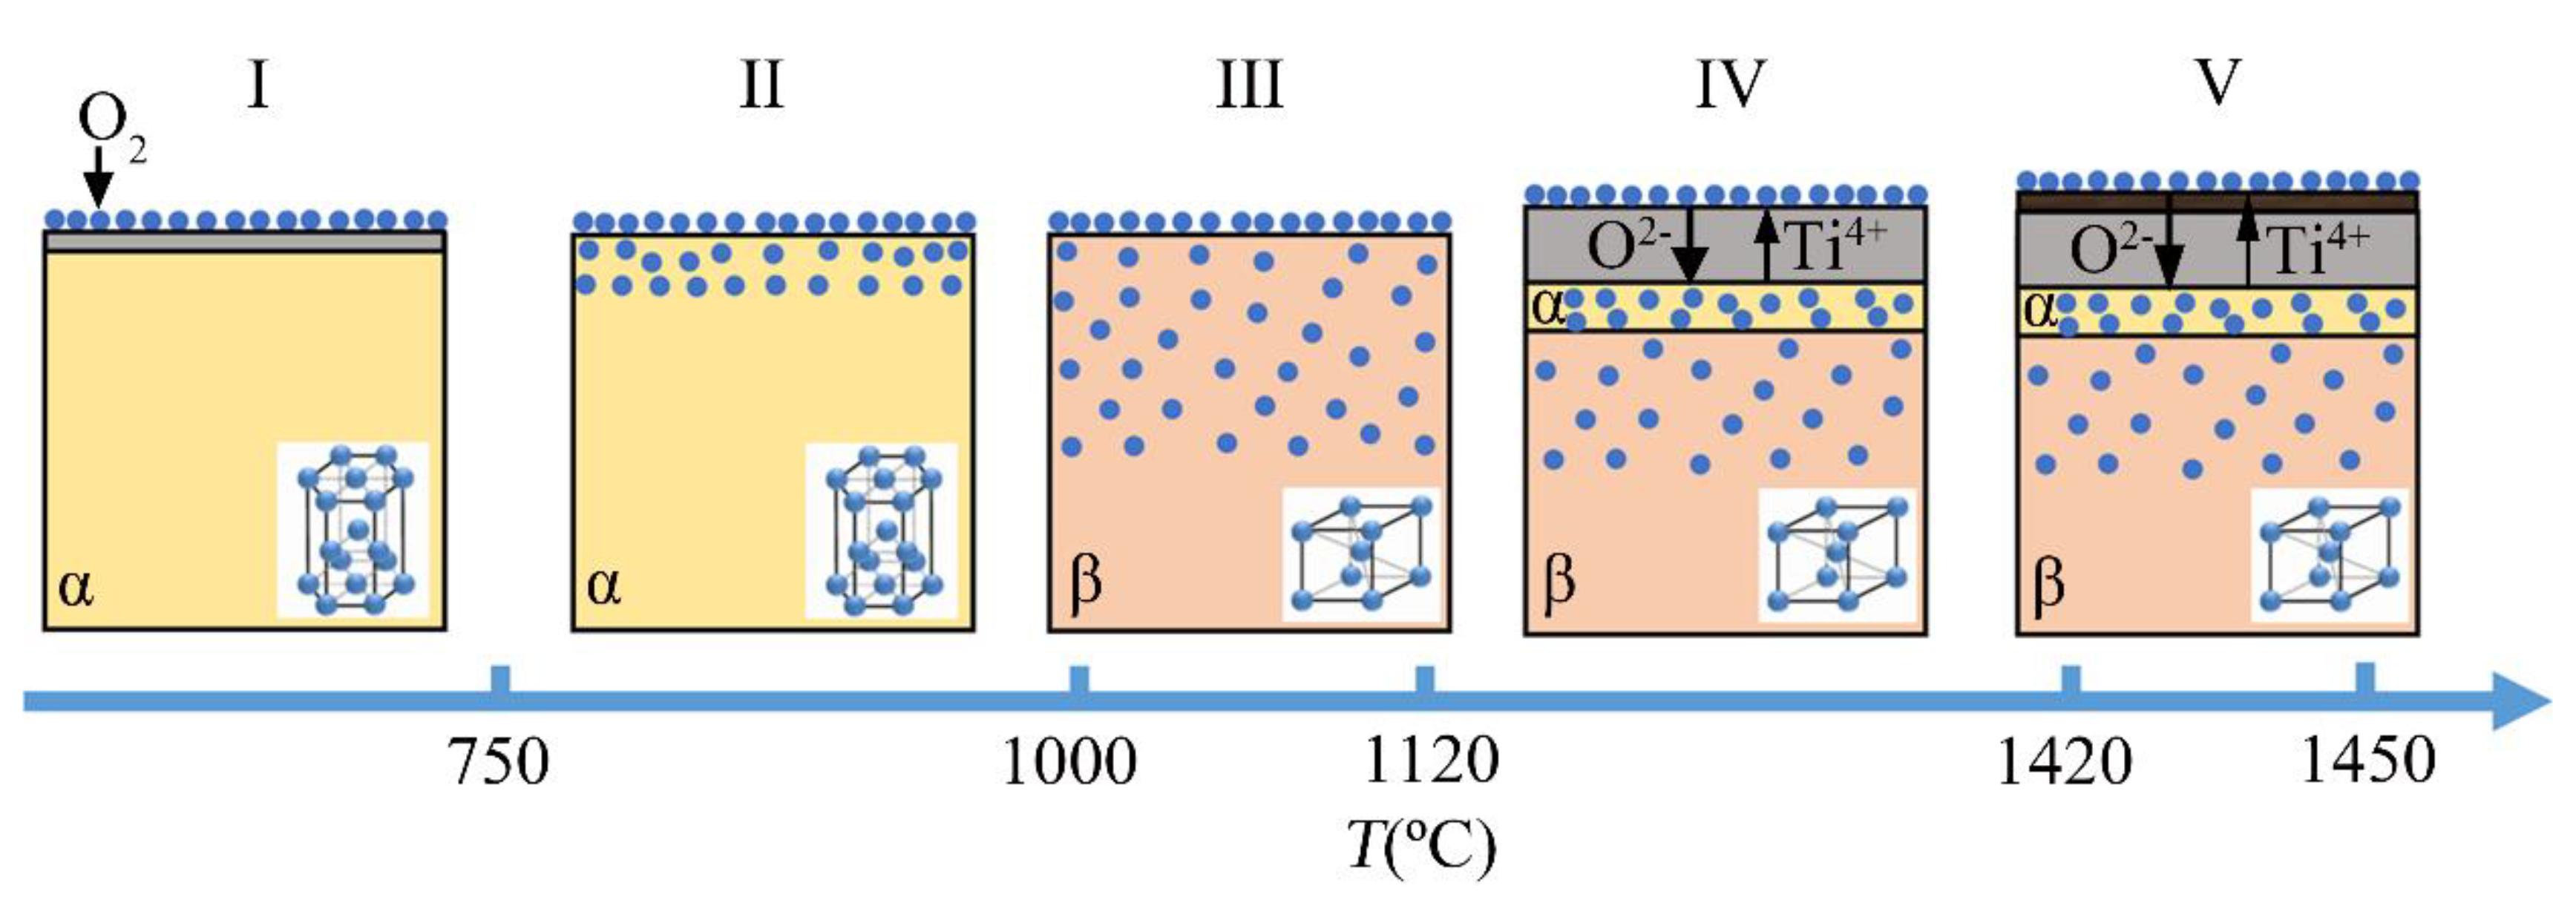
5.1. Stage I
5.2. Stage II
5.3. Stage III
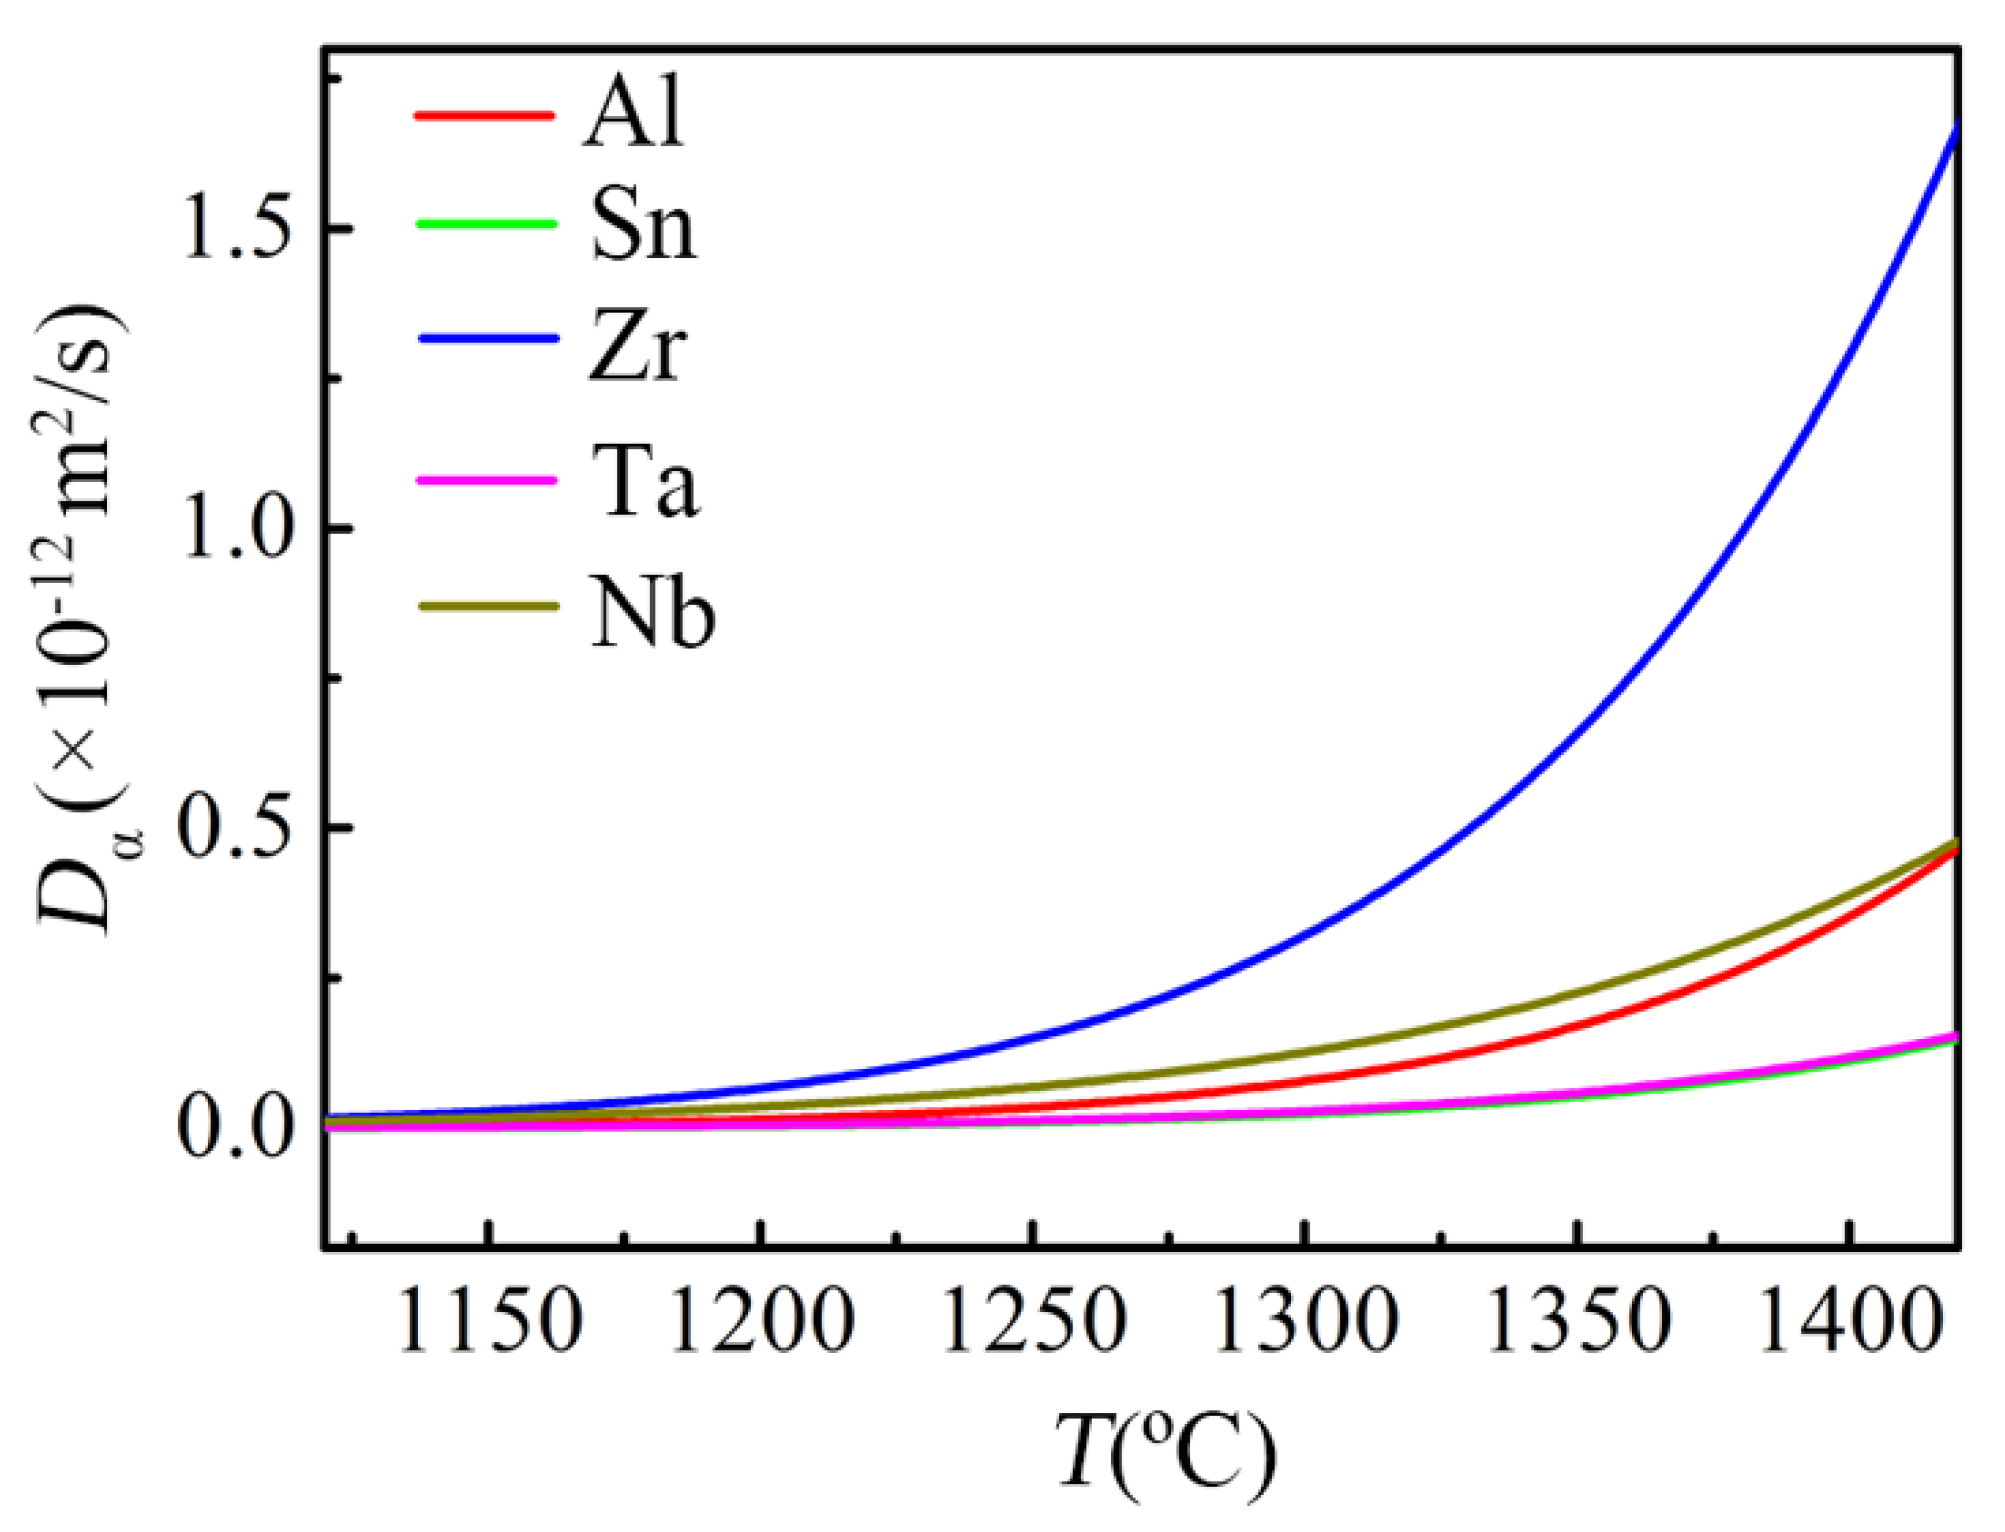
5.4. Stage IV
5.5. Stage V
6. Conclusions
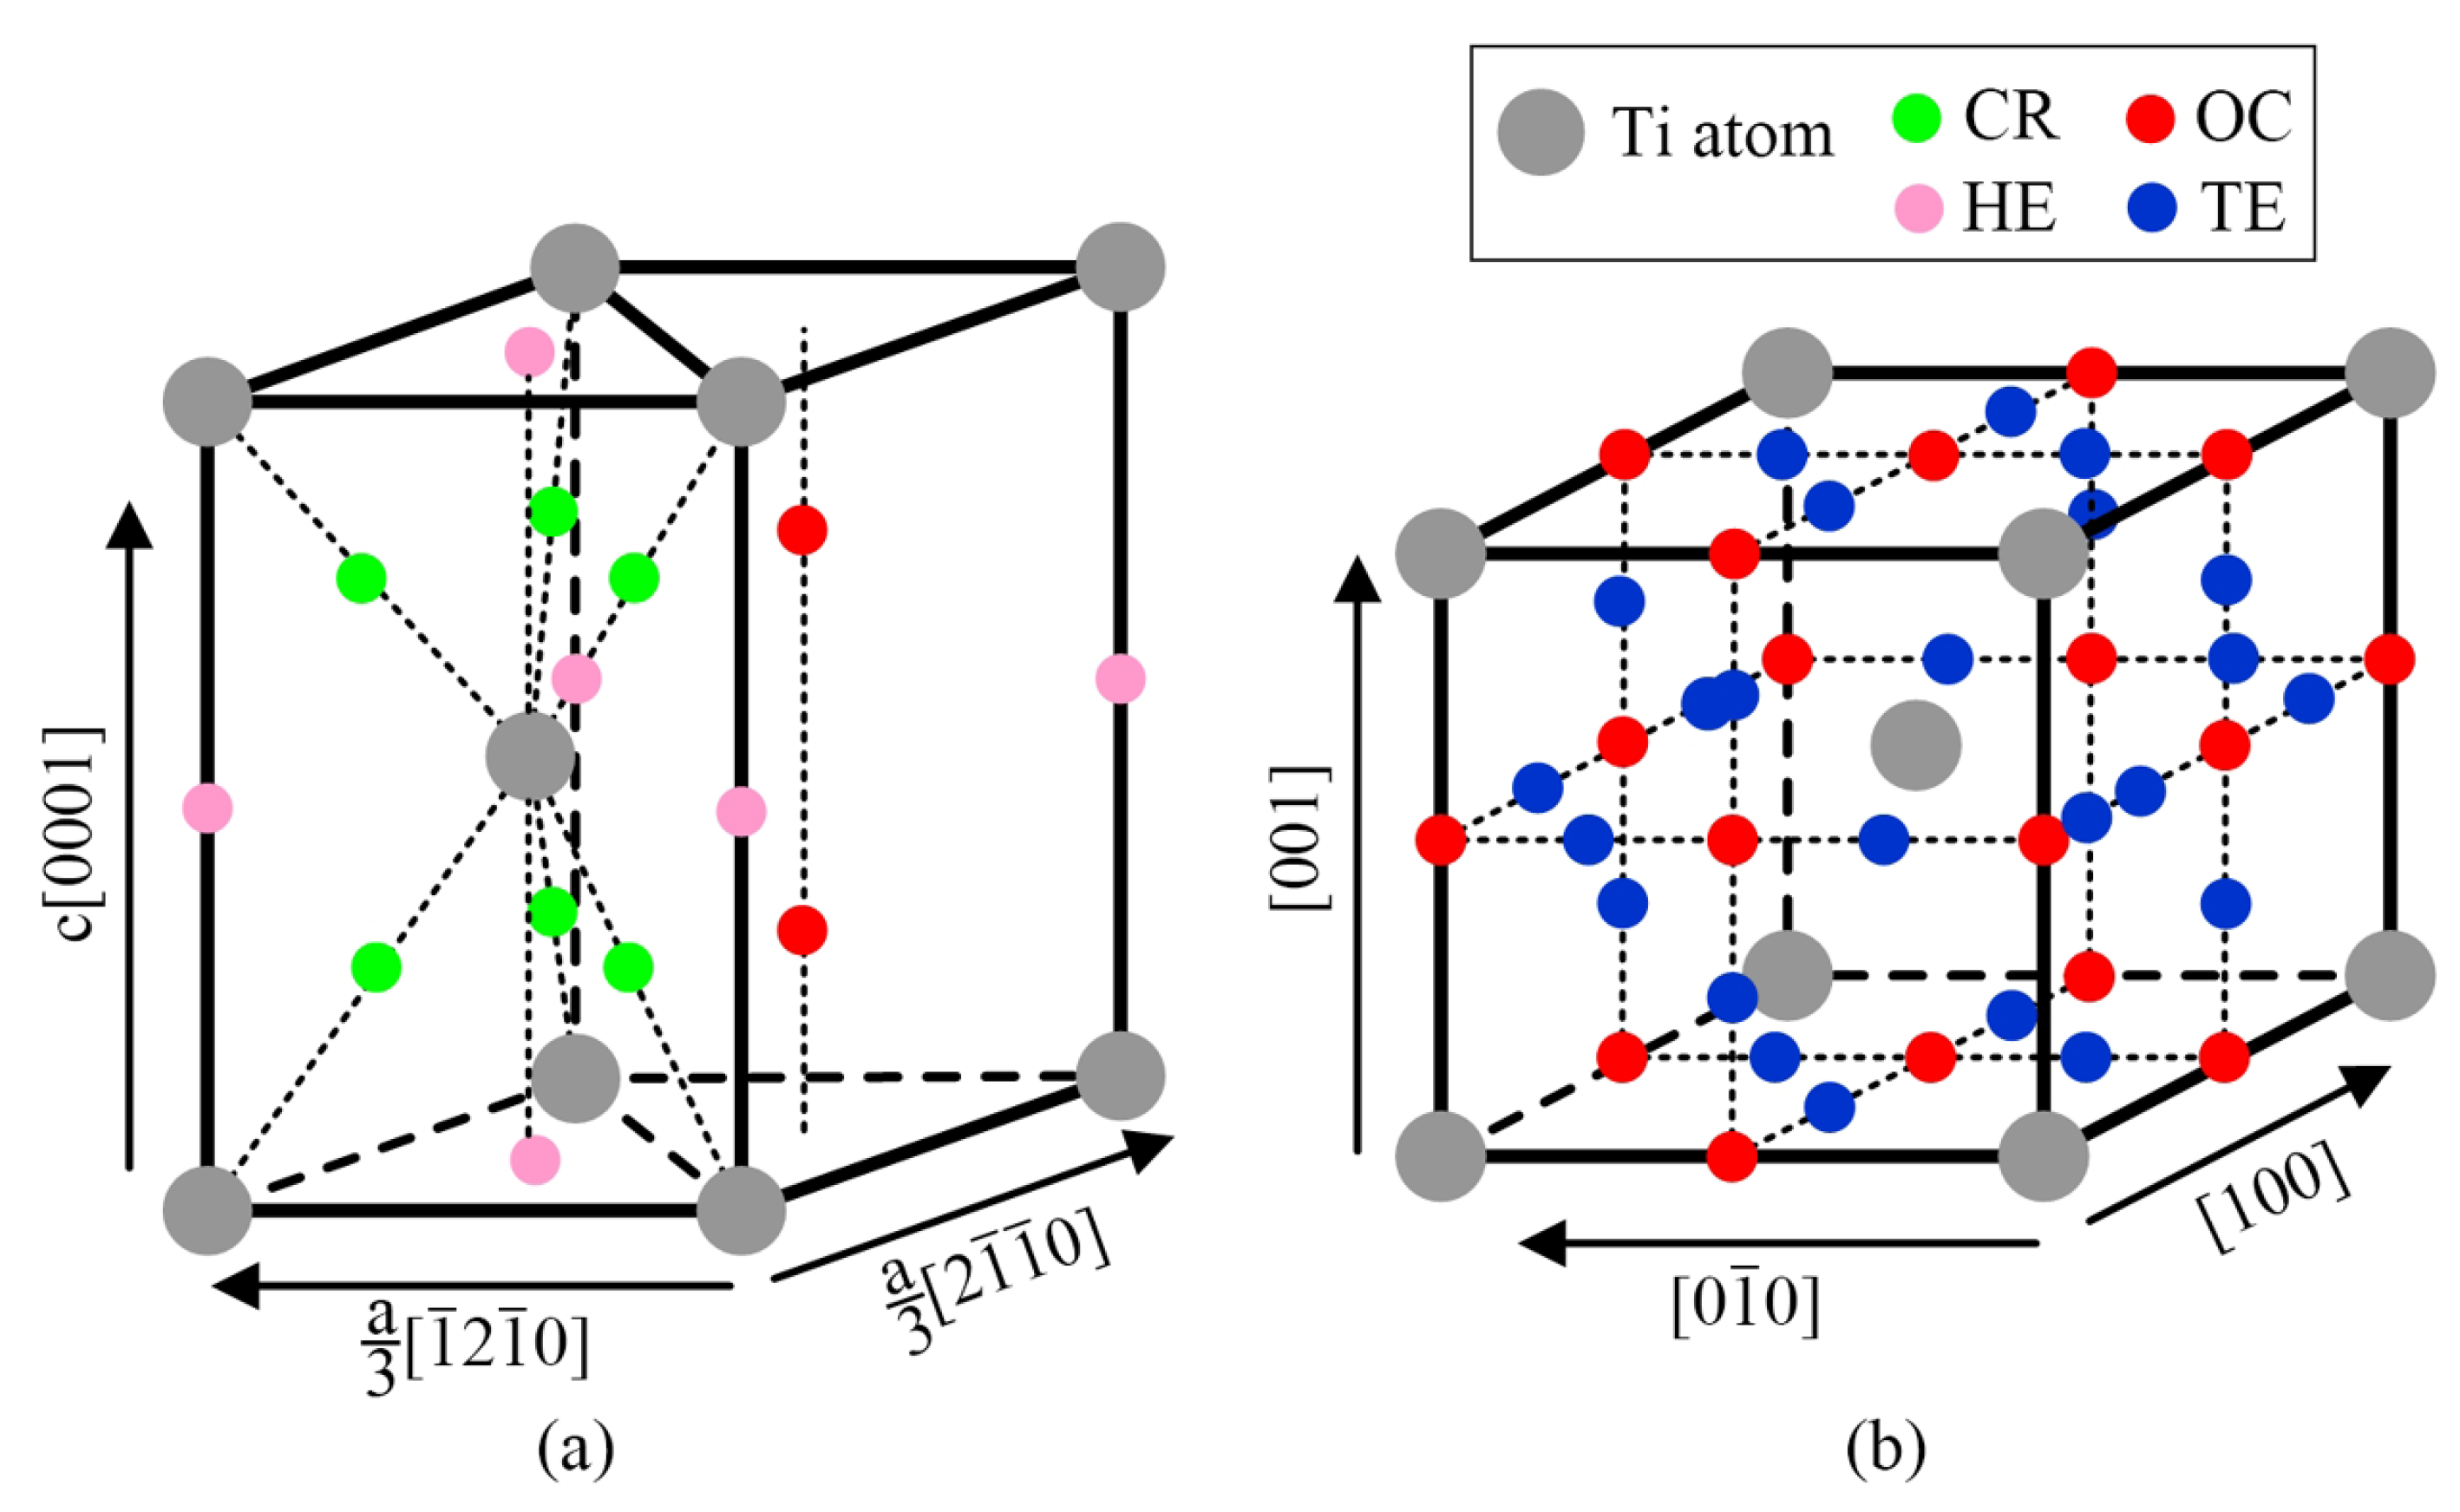
- The oxide scale on TA29 titanium alloy after non-isothermal oxidation is a three-layer structure of TiO2. The outer layer is coarse recrystallized and sintering structure without doping elements, while the intermediate layer is Zr, Nb, Ta-rich TiO2 structure, the inner layer is fine Al-rich TiO2 structure, and Sn is segregated at the oxide-substrate interface. The distribution of the alloying elements in the oxide scale is related to their diffusion rates in the subsurface α case.
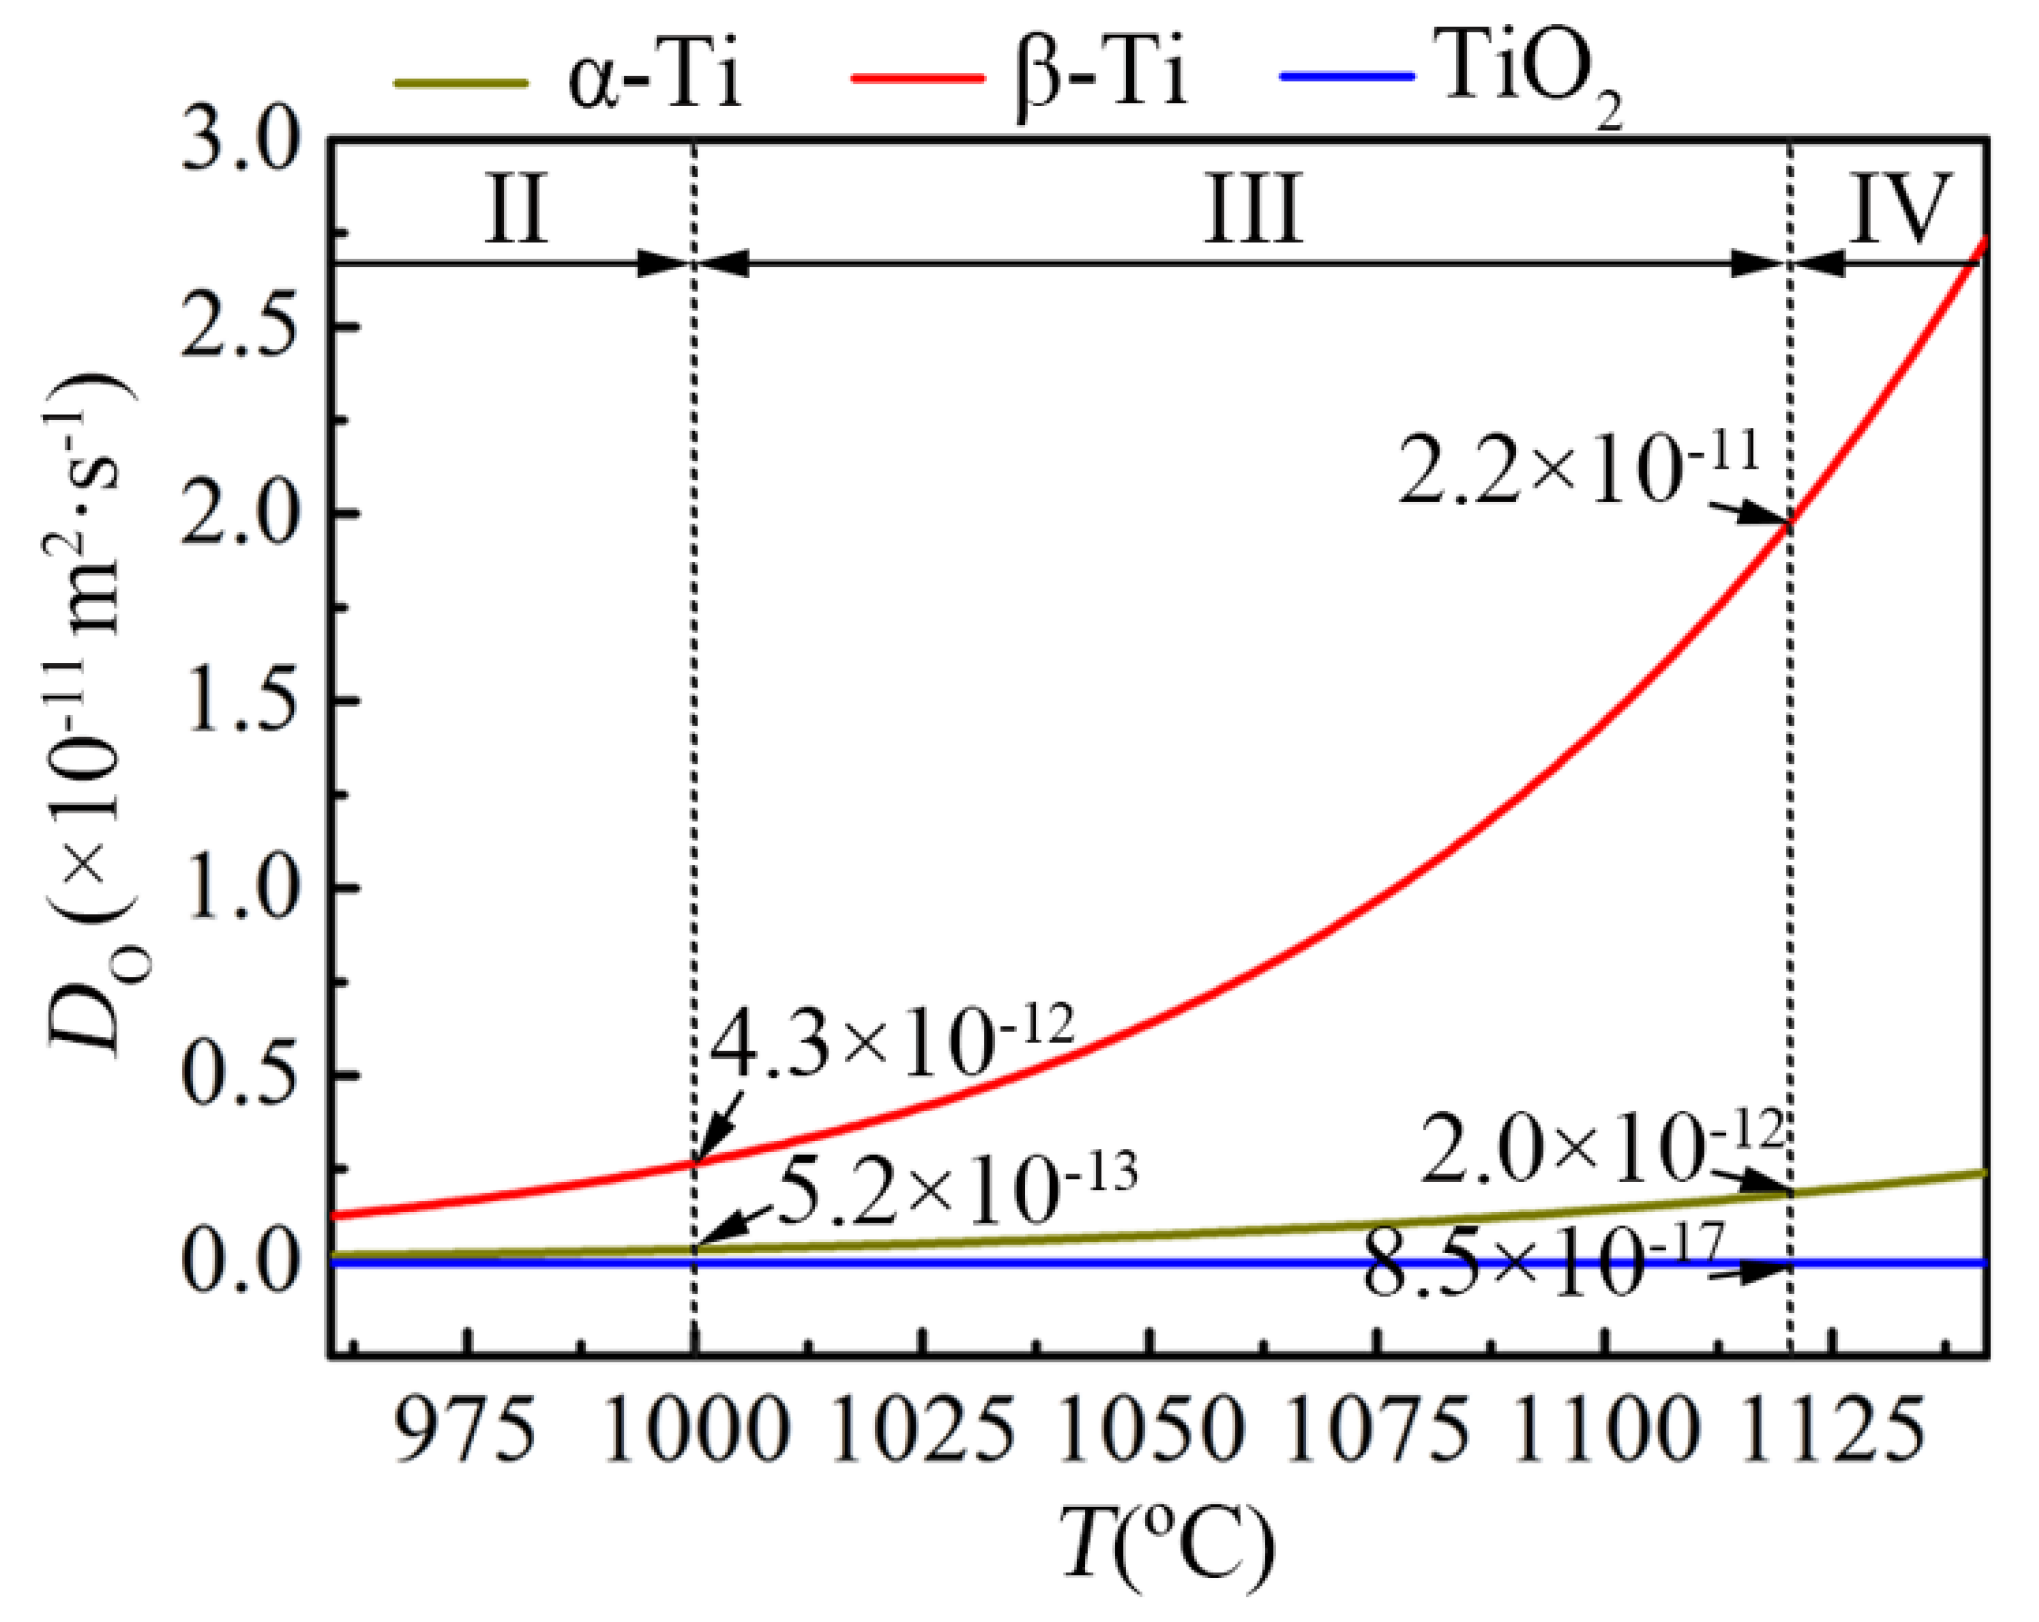
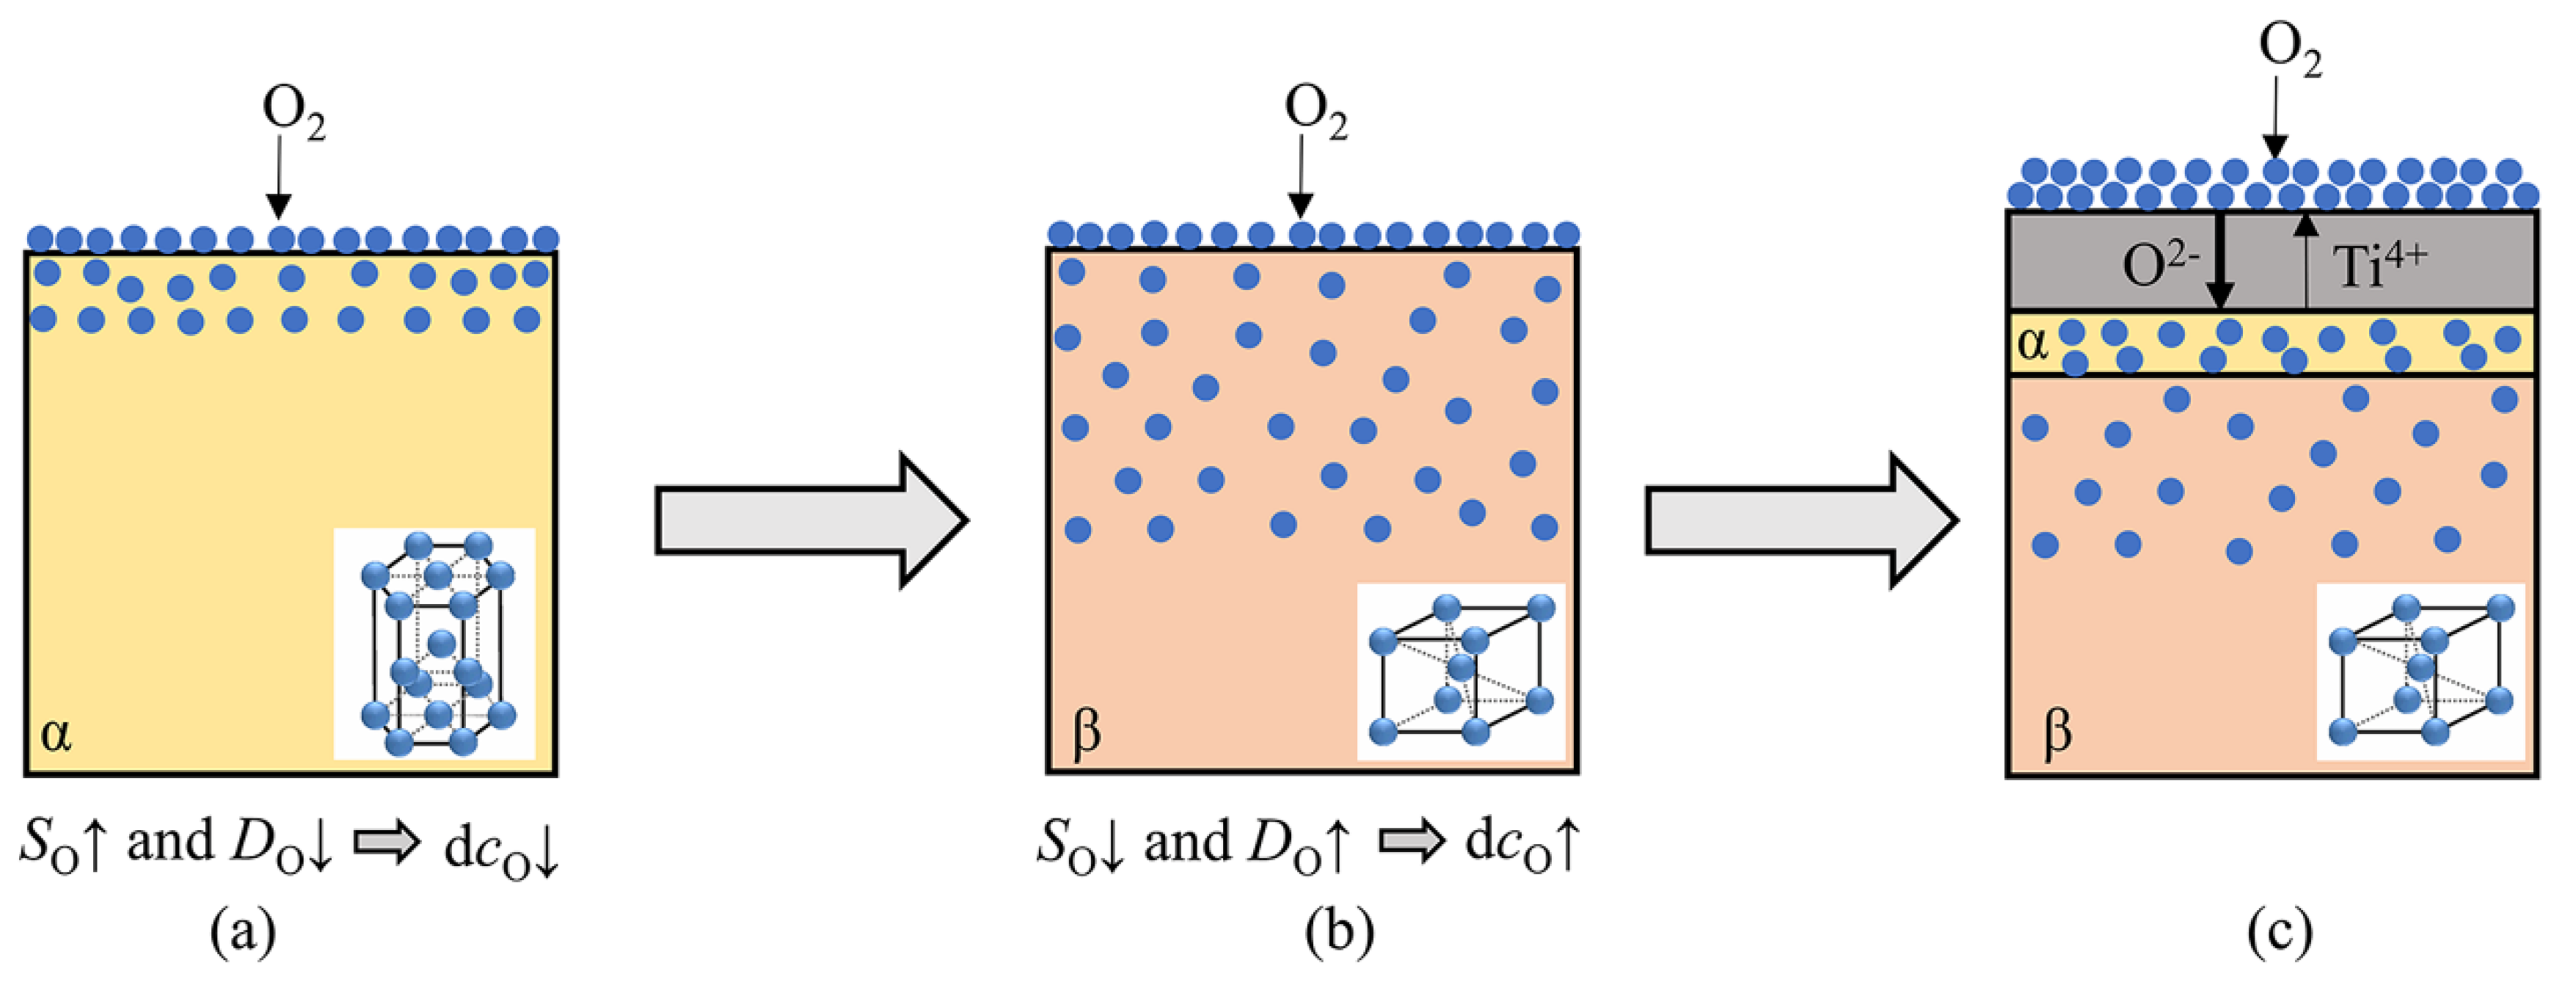
- The non-isothermal oxidation process of TA29 titanium alloy can be divided into five stages, including no oxidation, slow oxidation, accelerated oxidation, severe oxidation and decelerated oxidation, the oxidation mechanisms of which are as follows: Oxygen barrier effect of a thin compact oxide film on the titanium alloy; oxygen dissolution in the alloy; lattice transformation of α→β promoting the dissolution and diffusion of oxygen; formation of TiO2 scale; the occurrence of recrystallization and sintering in the outer oxide layer inhibiting the diffusion of reacting species.
- In the oxidation stage dominated by oxygen dissolution, lattice transformation of the alloy obviously promotes the oxidation rate; as for the alloying elements, Zr has little effect on the oxidation rate, while Nb, Ta, Al and Sn modestly reduce the oxidation rate at this stage.
- In the oxidation stage dominated by oxide formation, the lattice transformation in the subsurface layer of the alloy has little effect on the oxidation behavior; as for the alloying elements, Zr has little effect on the oxidation rate, Nb and Ta reduce the oxidation rate of the alloy, while a small amount of Al increase the oxidation rate and Sn deteriorates the oxidation resistance.
Author Contributions
Funding
Conflicts of Interest
References
- Leyens, C.; Peters, M. Titanium and Titanium Alloys: Fundamentals and Applications; Wiley-VCH GmbH & Co. KGaA: Weinheim, Germany, 2003. [Google Scholar]
- Peters, M.; Kumpfert, J.; Ward, C.H.; Leyens, C. Titanium alloys for aerospace applications. Adv. Eng. Mater. 2003, 5, 419–427. [Google Scholar] [CrossRef]
- Cai, J.M.; Mi, G.B.; Gao, F.; Huang, H.; Cao, J.X.; Huang, X.; Cao, C.X. Research and development of some advanced high temperature titanium alloys for aero-engine. J. Mater. Eng. 2016, 44, 1–10. [Google Scholar]
- Cai, J.M.; Tian, F.; Liu, D.; Li, J.; Mi, G.B.; Ye, J.Q. Research progress in manufacturing technology of 600 °C high temperature titanium alloy dual property blisk forging. J. Mater. Eng. 2018, 46, 36–43. [Google Scholar]
- Wang, Q.J.; Liu, J.R.; Yang, R. High temperature titanium alloys: Status and perspective. J. Aeronaut. Mater. 2014, 34, 1–26. [Google Scholar]
- Dai, J.J.; Zhu, J.Y.; Chen, C.Z.; Weng, F. High temperature oxidation behavior and research status of modifications on improving high temperature oxidation resistance of titanium alloys and titanium aluminides: A review. J. Alloys Compd. 2016, 685, 784–798. [Google Scholar] [CrossRef]
- Jia, W.J.; Zeng, W.D.; Zhang, X.M.; Zhou, Y.G.; Liu, J.R.; Wang, Q.J. Oxidation behavior and effect of oxidation on tensile properties of Ti60 alloy. J. Mater. Sci. 2011, 46, 1351–1358. [Google Scholar] [CrossRef]
- Xiao, W.L.; Murakami, H.; Ping, D.H.; Yamabe-Mitarai, Y. Microstructure and oxidation behaviors of near-α Ti-6.5Al-4Sn-4Zr-0.5Mo-based alloys with Ir addition. J. Mater. Sci. 2013, 48, 3363–3369. [Google Scholar] [CrossRef]
- Zhang, S.Z.; Zhou, B.; Liu, N.; Chen, L.Q. Effects of microstructure and rare-earth constituent on the oxidation behavior of Ti-5.6Al-4.8Sn-2Zr-1Mo-0.35Si-0.7Nd titanium alloy. Oxid. Met. 2014, 81, 373–382. [Google Scholar] [CrossRef]
- Gaddam, R.; Sefer, B.; Pederson, R.; Antti, M.-L. Oxidation and alpha-case formation in Ti-6Al-2Sn-4Zr-2Mo alloy. Mater. Charact. 2015, 99, 166–174. [Google Scholar] [CrossRef]
- Strobridge, T.R.; Moulder, J.C.; Clark, A.F. Titanium Combustion in Turbine Engine; Reports FAA-RD-79-51, NBSIR 79-1616; US National Bureau of Standards: Washington, DC, USA, 1979.
- Mi, G.B.; Cao, C.X.; Huang, X.; Cao, J.X.; Wang, B.; Sui, N. Non-isothermal oxidation characteristic and fireproof property prediction of Ti-V-Cr type fireproof titanium alloy. J. Mater. Eng. 2016, 44, 1–10. [Google Scholar]
- Schulz, O.; Eisenreich, N.; Kelzenberg, S.; Schuppler, H.; Neutz, J.; Kondratenko, E. Non-isothermal and isothermal kinetics of high temperature oxidation of micrometer-sized titanium particles in air. Thermochim. Acta 2011, 517, 98–104. [Google Scholar] [CrossRef]
- Muravyev, N.V.; Monogarov, K.A.; Zhigach, A.N.; Kuskov, M.L.; Fomenkov, I.V.; Pivkina, A.N. Exploring enhanced reactivity of nanosized titanium toward oxidation. Combust. Flame 2018, 191, 109–115. [Google Scholar] [CrossRef]
- Mi, G.B.; Huang, X.S.; Li, P.J.; Cao, J.X.; Huang, X.; Cao, C.X. Non-isothermal oxidation and ignition prediction of Ti-Cr alloys. Trans. Nonferrous Metal. Soc. 2012, 22, 2409–2415. [Google Scholar] [CrossRef]
- Kofstad, P.; Hauffe, K.; Kjollesdal, H. Investigation on the oxidation mechanism of titanium. Acta Chem. Scand. 1958, 12, 239–266. [Google Scholar] [CrossRef]
- Kofstad, P.; Anderson, P.; Krudtaa, O. Oxidation of titanium in the temperature range 800–1200 °C. J. Less Common Met. 1961, 3, 89–97. [Google Scholar] [CrossRef]
- Trunov, M.A.; Schoenitz, M.; Dreizin, E. Effect of polymorphic phase transformations in alumina layer on ignition of aluminium particles. Combust. Theor. Model. 2006, 10, 603–623. [Google Scholar] [CrossRef]
- Becker, S.; Rahmel, A.; Schorr, M.; Schütze, M. Mechanism of isothermal oxidation of the intermetallic TiAl and of TiAl alloys. Oxid. Met. 1992, 38, 425–464. [Google Scholar] [CrossRef]
- Kofstad, P. High-temperature oxidation of titanium. J. Less Common Met. 1967, 12, 449–464. [Google Scholar] [CrossRef]
- Collaboration: Authors and editors of the volumes III/17G-41D. Titanium oxide (TiO2): Thermodynamic parameters of phase transformation. In Non-Tetrahedrally Bonded Binary Compounds II. Landolt-Börnstein-Group III Condensed Matter (Numerical Data and Functional Relationships in Science and Technology); Madelung, O., Rössler, U., Schulz, M., Eds.; Springer: Berlin/Heidelberg, Germany, 2000; Volume 41D. [Google Scholar] [CrossRef]
- Schmid, E.E.; MSIT. The Ti-Al Binary System. 1991. Available online: https://materials.springer.com/msi/phase-diagram/docs/sm_msi_r_10_010909_01_full_LnkDia0 (accessed on 2 September 2017).
- Huang, X.; Zhu, Z.S.; Wang, H.H. Advanced Aeronautical Titanium Alloys and Applications; National Defense Industry Press: Beijing, China, 2012. [Google Scholar]
- Liu, Z.; Welsch, G. Literature survey on diffusivities of oxygen, aluminum, and vanadium in alpha titanium, beta titanium, and in rutile. Metall. Trans. A 1988, 19, 1121–1125. [Google Scholar] [CrossRef]
- Wu, H.H.; Trinkle, D.R. Solute effect on oxygen diffusion in α-titanium. J. Appl. Phys. 2013, 113, 223504. [Google Scholar] [CrossRef]
- Scotti, L.; Mottura, A. Interstitial diffusion of O, N, and C in α-Ti from first-principles: Analytical model and kinetic Monte Carlo simulations. J. Chem. Phys. 2016, 144, 084701. [Google Scholar] [CrossRef] [PubMed] [Green Version]
- Wu, H.H.; Trinkle, D.R. Direct diffusion through interpenetrating networks: Oxygen in titanium. Phys. Rev. Lett. 2011, 107, 045504. [Google Scholar] [CrossRef] [PubMed]
- Li, R.H.; Zhang, P.B.; Li, X.Q.; Zhang, C.; Zhao, J.J. First-principles study of the behavior of O, N and C impurities in vanadium solids. J. Nucl. Mater. 2013, 435, 71–76. [Google Scholar] [CrossRef]
- Shang, S.L.; Fang, H.Z.; Wang, J.; Guo, C.P.; Wang, Y.; Jablonski, P.D.; Du, Y.; Liu, Z.K. Vacancy mechanism of oxygen diffusivity in bcc Fe: A first-principles study. Corros. Sci. 2014, 83, 94–102. [Google Scholar] [CrossRef]
- Rosa, C.J. Oxygen diffusion in alpha and beta titanium in the temperature range of 932 to 1142 °C. Metall. Trans. 1970, 1, 2517–2522. [Google Scholar]
- Kitashima, T.; Kawamura, T. Prediction of oxidation behavior of near-α titanium alloys. Scr. Mater. 2016, 124, 56–58. [Google Scholar] [CrossRef]
- Villars, P. (Ed.) Al-O-Ti Vertical Section of Ternary Phase Diagram. PAULING FILE. In Inorganic Solid Phases, SpringerMaterials (Online Database); Springer: Heidelberg, Germany; Available online: https://materials.springer.com/isp/phase-diagram/docs/c_0204408 (accessed on 15 April 2018).
- Villars, P. (Ed.) O-Sn-Ti Vertical Section of Ternary Phase Diagram. PAULING FILE. In Inorganic Solid Phases, SpringerMaterials (Online Database); Springer: Heidelberg, Germany; Available online: https://materials.springer.com/isp/phase-diagram/docs/c_0205425 (accessed on 15 April 2018).
- Villars, P. (Ed.) O-Ti-Zr Vertical Section of Ternary Phase Diagram. PAULING FILE. In Inorganic Solid Phases, SpringerMaterials (Online Database); Springer: Heidelberg, Germany; Available online: https://materials.springer.com/isp/phase-diagram/docs/c_0210443 (accessed on 15 April 2018).
- Villars, P. (Ed.) Nb-O-Ti Vertical Section of Ternary Phase Diagram. PAULING FILE. In Inorganic Solid Phases, SpringerMaterials (Online Database); Springer: Heidelberg, Germany; Available online: https://materials.springer.com/isp/phase-diagram/docs/c_0206806 (accessed on 15 April 2018).
- Perez, R.A.; Nakajima, H.; Dyment, F. Diffusion in α-Ti and Zr. Mater. Trans. 2003, 44, 2–13. [Google Scholar] [CrossRef] [Green Version]
- Xu, W.W.; Shang, S.L.; Zhou, B.C.; Wang, Y.; Liu, X.J.; Wang, C.P.; Liu, Z.K. Ti-X (X = Al, V, Nb, Ta, Mo, Zr, and Sn) Impurity Diffusion Coefficients from First-Principles Calculations. 2016. Available online: https://materialsdata.nist.gov/handle/11256/619 (accessed on 3 March 2016).
- Kenina, E.M.; Kornilov, I.I.; Vavilova, V.V. Effect of oxygen on the scale resistance of titanium-tin alloys. Met. Sci. Heat. Treat. 1972, 14, 396–398. [Google Scholar] [CrossRef]
- Kitashima, T.; Yamabe-Mitarai, Y.; Iwasaki, S.; Kuroda, S. Effects of Ga and Sn additions on the creep strength and oxidation resistance of near-α Ti alloys. Metall. Mater. Trans. A 2016, 47, 6394–6403. [Google Scholar] [CrossRef]
- Yang, Y.; Kitashima, T.; Hara, T.; Hara, Y.; Yamabe-Mitarai, Y.; Hagiwara, M.; Iwasaki, S. Effects of Ga, Sn addition and microstructure on oxidation behavior of near-α Ti alloy. Oxid. Met. 2017, 88, 583–598. [Google Scholar] [CrossRef]


| Transition Pathway | Energy Barrier (eV) | Migration Frequency (THz) | ||
|---|---|---|---|---|
| Ref. [26] | Ref. [27] | Ref. [26] | Ref. [27] | |
| OC→OC | 3.85 | 3.25 | 13.67 | 11.76 |
| OC→HE | 2.061 | 2.04 | 12.24 | 10.33 |
| OC→CR | 1.883 | 2.16 | 27.92 | 16.84 |
| HE→OC | 0.833 | 0.85 | 10.45 | 5.58 |
| HE→CR | 0.676 | 0.94 | 5.7 | 10.27 |
| CR→OC | 0.575 | 0.28 | 11.19 | 12.21 |
| CR→HE | 0.596 | 0.24 | 3.6 | 13.81 |
| Alloying Element | Solubility in TiO2 at 1120~1420 °C (at.%) | Diffusion in α-Ti at 600~827 °C [36] (m2∙s−1) |
|---|---|---|
| Al | 0.2~0.4 [32] | 6.6 × 10⁻³exp(−329000/RT) |
| Sn | 3.6~12.2 [33] | 4 × 10⁻³exp(−338000/RT) |
| Zr | 1.0~3.0 [34] | 4 × 10⁻³exp(−304000/RT) |
| Nb | 4.6~5.9 [35] | 1.835 × 10⁻⁵exp(−29565/T) [37] |
| Ta | Unknown | 1 × 10⁻³exp(−318000/RT) |
© 2018 by the authors. Licensee MDPI, Basel, Switzerland. This article is an open access article distributed under the terms and conditions of the Creative Commons Attribution (CC BY) license (http://creativecommons.org/licenses/by/4.0/).
Share and Cite
Ouyang, P.; Mi, G.; Li, P.; He, L.; Cao, J.; Huang, X. Non-Isothermal Oxidation Behavior and Mechanism of a High Temperature Near-α Titanium Alloy. Materials 2018, 11, 2141. https://doi.org/10.3390/ma11112141
Ouyang P, Mi G, Li P, He L, Cao J, Huang X. Non-Isothermal Oxidation Behavior and Mechanism of a High Temperature Near-α Titanium Alloy. Materials. 2018; 11(11):2141. https://doi.org/10.3390/ma11112141
Chicago/Turabian StyleOuyang, Peixuan, Guangbao Mi, Peijie Li, Liangju He, Jingxia Cao, and Xu Huang. 2018. "Non-Isothermal Oxidation Behavior and Mechanism of a High Temperature Near-α Titanium Alloy" Materials 11, no. 11: 2141. https://doi.org/10.3390/ma11112141
APA StyleOuyang, P., Mi, G., Li, P., He, L., Cao, J., & Huang, X. (2018). Non-Isothermal Oxidation Behavior and Mechanism of a High Temperature Near-α Titanium Alloy. Materials, 11(11), 2141. https://doi.org/10.3390/ma11112141