Article

Forced Magnetostrictions and Magnetizations of Ni2+xMnGa1−x at Its Curie Temperature

1
Department of Mechanical and System Engineering, Faculty of Science and Technology, Ryukoku University, Otsu, Shiga 520-2194, Japan
2
Institute for Materials Research, Tohoku University, Oarai, Ibaraki 311-1313, Japan
3
Kurume Institute of Technology, Kurume, Fukuoka 830-0052, Japan
4
Center for Advanced High Magnetic Field Science, Graduate School of Science, Osaka University, 1-1 Machikaneyama, Toyonaka, Osaka 560-0043, Japan
5
Research Institute for Engineering and Technology, Tohoku Gakuin University, Tagajo, Miyagi 985-8537, Japan
*
Author to whom correspondence should be addressed.
Materials 2018, 11(11), 2115; https://doi.org/10.3390/ma11112115
Submission received: 16 September 2018 / Revised: 21 October 2018 / Accepted: 25 October 2018 / Published: 28 October 2018
(This article belongs to the Special Issue Fundamental Science and Applications of Highly Functional Alloys)

Abstract

:
Experimental investigations into the field dependence of magnetization and the relationship between magnetization and magnetostriction in Ni2+xMnGa1−x (x = 0.00, 0.02, 0.04) alloy ferromagnets were performed following the self-consistent renormalization (SCR) spin fluctuation theory of itinerant ferromagnetism. In this study, we investigated the magnetization of and magnetostriction on Ni2+xMnGa1−x (x = 0.02, 0.04) to check whether these relations held when the ratio of Ni to Ga and, the valence electron concentration per atom, e/a were varied. When the ratio of Ni to Ga was varied, e/a increased with increasing x. The magnetization results for x = 0.02 (e/a = 7.535) and 0.04 (e/a = 7.570) suggest that the critical index δ of HMδ is around 5.0 at the Curie temperature TC, which is the critical temperature of the ferromagnetic–paramagnetic transition. This result confirms Takahashi’s spin fluctuation theory and the experimental results of Ni2MnGa. The spontaneous magnetization pS slightly decreased with increasing x. For x = 0.00, the spin fluctuation parameter in k-space (momentum space; TA) and that in energy space (T0) were obtained. The relationship between peff/pS and TC/T0 can also be explained by Takahashi’s theory, where peff indicates the effective magnetic moments. We created a generalized Rhodes-Wohlfarth plot of peff/pS versus TC/T0 for other ferromagnets. The plot indicates that the relationship between peff/pS and T0/TC follows Takahashi’s theory. We also measured the magnetostriction for Ni2+xMnGa1−x (x = 0.02, 0.04). As a result, at TC, the plot of the magnetostriction (ΔL/L) versus M4 shows proportionality and crosses the origin. These magnetization and magnetostriction results were analyzed in terms of Takahashi’s SCR spin fluctuation theory. We investigated the magnetostriction at the premartensite phase, which is the precursor state to the martensitic transition. In Ni2MnGa system alloys, the maximum value of magnetostriction is almost proportional to the e/a.

1. Introduction

Spin fluctuation theories have advanced the attempts to elucidate the physical principles of the itinerant electron system [1,2,3,4,5]. According to the self-consistent renormalization (SCR) spin fluctuation theory [1], the external magnetic field H is proportional to the third power of the magnetization M3 at the Curie temperature TC. This relation was derived by only considering the transverse modes of the thermal spin fluctuations with respect to the direction of the static and uniform magnetic moment [6,7]. Takahashi proposed SCR theory according to zero-point spin fluctuations, which assimilate both the transverse and the longitudinal components of the fluctuations [3,4,5,8]. An outstanding characteristic of this theory is the magnetization at TC. This theory proposed by Takahashi indicates that H is proportional to M5 at TC.
The thermo-dynamical relationship between the magnetization M and the external magnetic field H can be expressed by the equation:
H = F M = a ( T ) M + b ( T ) M 3 + c ( T ) M 5 +
where F indicates the spin fluctuation free energy. This appears as Equation (2.59) in Takahashi [8].
As TTC, the magnetic susceptibility χ ( T ) comes infinite. Therefore,
lim T T C a ( T ) = lim T T C H M = lim T T C 1 χ = 0
Then, the first expansion coefficient at TC is a(TC) = 0.
According to the Rhodes-Wohlfarth theory [9], the third expansion coefficient b(T) in Equation (1) remains finite at T = TC. Therefore, the following formula is satisfied at TC:
H = b ( T C ) M 3 + c ( T C ) M 5 +
Under the Takahashi theory, b(T) vanishes at TC, as shown in Equation (3.51) in Takahashi [8].
As a result, the M dependence of the magnetic fields H can be explained by the equation:
H = c ( T C ) M 5
In Equation (4), higher terms are ignored because their magnitudes are smaller than that of the third term. In conclusion, an HM5 relation was obtained.
MnSi [3], CoS2 [10], FexCo1−xSi [11], and Ni [12] follow the relationship provided in Equation (4). The Heusler isotropic ferromagnetic alloy Ni2MnGa also follows this relation in a cubic austenite phase [12]. For Ni2MnGa, the critical index δ of HMδ at TC is δ 4.70 ± 0.5 [12,13].
Takahashi proposed that magnetostriction can be observed due to the itinerant spin fluctuations around TC [8] because the magnetostriction is calculated from the spin fluctuation free energy. The relationship between the magnetostriction and the magnetization at TC [8] in Equation (6.101) was explained using the formula
ω h ( σ , t C ) ω 0 = K × A ( 0 , t C ) × σ 4 σ 0 4
where tC is a relative Curie temperature; σ and σ0 are the magnetization in a magnetic field and the spontaneous magnetization, respectively; ω0 is the nonmagnetic volume contribution; wh(σ, tC) is the relative magnetic volume-striction at TC; K has a constant value in an isothermal state; and A(0, tC) indicates the amplitude of the thermal spin fluctuations at TC. Equation (5) indicates that the magnetostriction is proportional to M4 at TC. Kittel mentioned that the volume strain ΔV/V is three times the value of ΔL/L [14]. Accordingly, volume magnetostriction (ΔV/V) discussions were applied to the results of the magnetostriction ΔL/L in this experimental study.
For quondam research, an investigation into MnSi, which is famed for its weak itinerant magnetism, was completed [15]. The magnetostriction ΔL/L versus the square of the magnetization M2 was analyzed. Around TC = 30 K, the plot strayed from linearity. Takahashi proposed that around TC, the magnetostriction is not proportional to the square of the magnetization. ΔL/L is proportional to M4 through the origin at T = 29 K around TC [8]. In a previous study, we investigated the magnetostriction property of a polycrystalline Ni2MnGa alloy using the self-consistent renormalization (SCR) theory of itinerant ferromagnets [13]. The magnetostriction was found to be proportional to the fourth power of magnetization. At the Curie temperature, magnetostriction crossed the point of origin. These results are in line with Takahashi’s spin fluctuation theory. In this study, we investigated Ni2+xMnGa1−x (x = 0.02, 0.04) alloys and studied the effect of varying alloy composition (ratio of Ni and Ga atoms) on magnetostriction. We found that the valence electron concentration per atom, i.e., the ratio e/a, increases with increasing x. The e/a values were 7.50, 7.535, and 7.570 for x = 0.00, 0.02, and 0.04, respectively. The spin fluctuation parameter in wave number space (momentum space) TA and that in energy space T0 were obtained from the results of the magnetization measurement. We discuss the relation between peff/pS and TC/T0 compared with that shown in other itinerant ferromagnets by means of a generalized Rhodes-Wohlfarth plot [8]. We also investigated the e/a dependences of the maximum magnetostriction around the premartensitic–austenitic transition for Ni2MnGa-type alloys. Researchers have studied the correlation between magnetostriction and the valence electron concentration e/a, which is related to the energy of the electron system [16,17,18]. In our prior study, we measured the properties of Ni2Mn1−xCrxGa [16]. In these alloys, the e/a was smaller than 7.50, which is the value for Ni2MnGa. In this study, we measured Ni2+xMnGa1−x (x = 0.02, 0.04) alloys for which the e/a is larger than 7.50 and investigated the e/a dependence of the maximum magnetostriction in the premartensite phase.
Rizal et al. investigated the magnetic property of nanostructured Fe-Co alloys [19]. At room temperature, a strong correlation was found between the saturated magnetization and the lattice constant of the Fe-Co alloy. For Ni2MnGa-type Heusler alloys, the correlations between e/a and the magnetization (magnetic moment) or magnetostriction have been the subject of several investigations undertaken by varying alloy composition. Accordingly, in this article, we focused on the e/a dependences of the magnetostrictions.

2. Materials and Methods

The polycrystalline samples of Ni2+xMnGa1−x (x = 0.00, 0.02, 0.04) were prepared by arc melting the constituent elements—4N Ni, 3N Mn, and 6N Ga—several times in an Ar atmosphere. Each ingot was melted several times in order to ensure good homogeneity. The products from the arc melting process were sealed in an evacuated silica tube and solution heat-treatments were applied at 1123 K for three days. After these treatments, the sample was quenched in water. The measurement of permeability was performed in alternating current (AC) magnetic fields with a frequency of 73 Hz and a maximum field of ±10 Oe. The AC magnetic fields were measured using a gaussmeter 410 (Lakeshore Cryotronix Inc., Westerville, OH, USA). The sample size chosen for the experimental investigations was 3.0 × 3.0 × 4.0 mm. The magnetostriction was measured by means of a strain gauge [13]. The magnetostriction ΔL/L was measured parallel to the external magnetic field H—the same approach used in the experimental investigation of MnSi [15]. A helium-free superconducting magnet at the Center for Advanced High Magnetic Field Science, Osaka University, Japan was used for the magnetostriction measurements up to 5 T.
The magnetization measurements were performed using a solenoid-type pulsed-field magnet at Ryukoku University, Japan [13]. The absolute value of the magnetization was calibrated with the use of a sample of pure Ni of the same size. The same bulk sample was used in the permeability, magnetization, and magnetostriction measurements in order to compare the results. The data for magnetostriction and magnetization were the results of measurements with increasing magnetic fields beginning with a zero field.
We also used a water-cooled magnet in a steady field up to 1.6 T, which was installed in Ryukoku University, and studied the magnetostriction in order to investigate the temperature dependence of the magnetostriction around the premartensite phase.

3. Results and Discussions

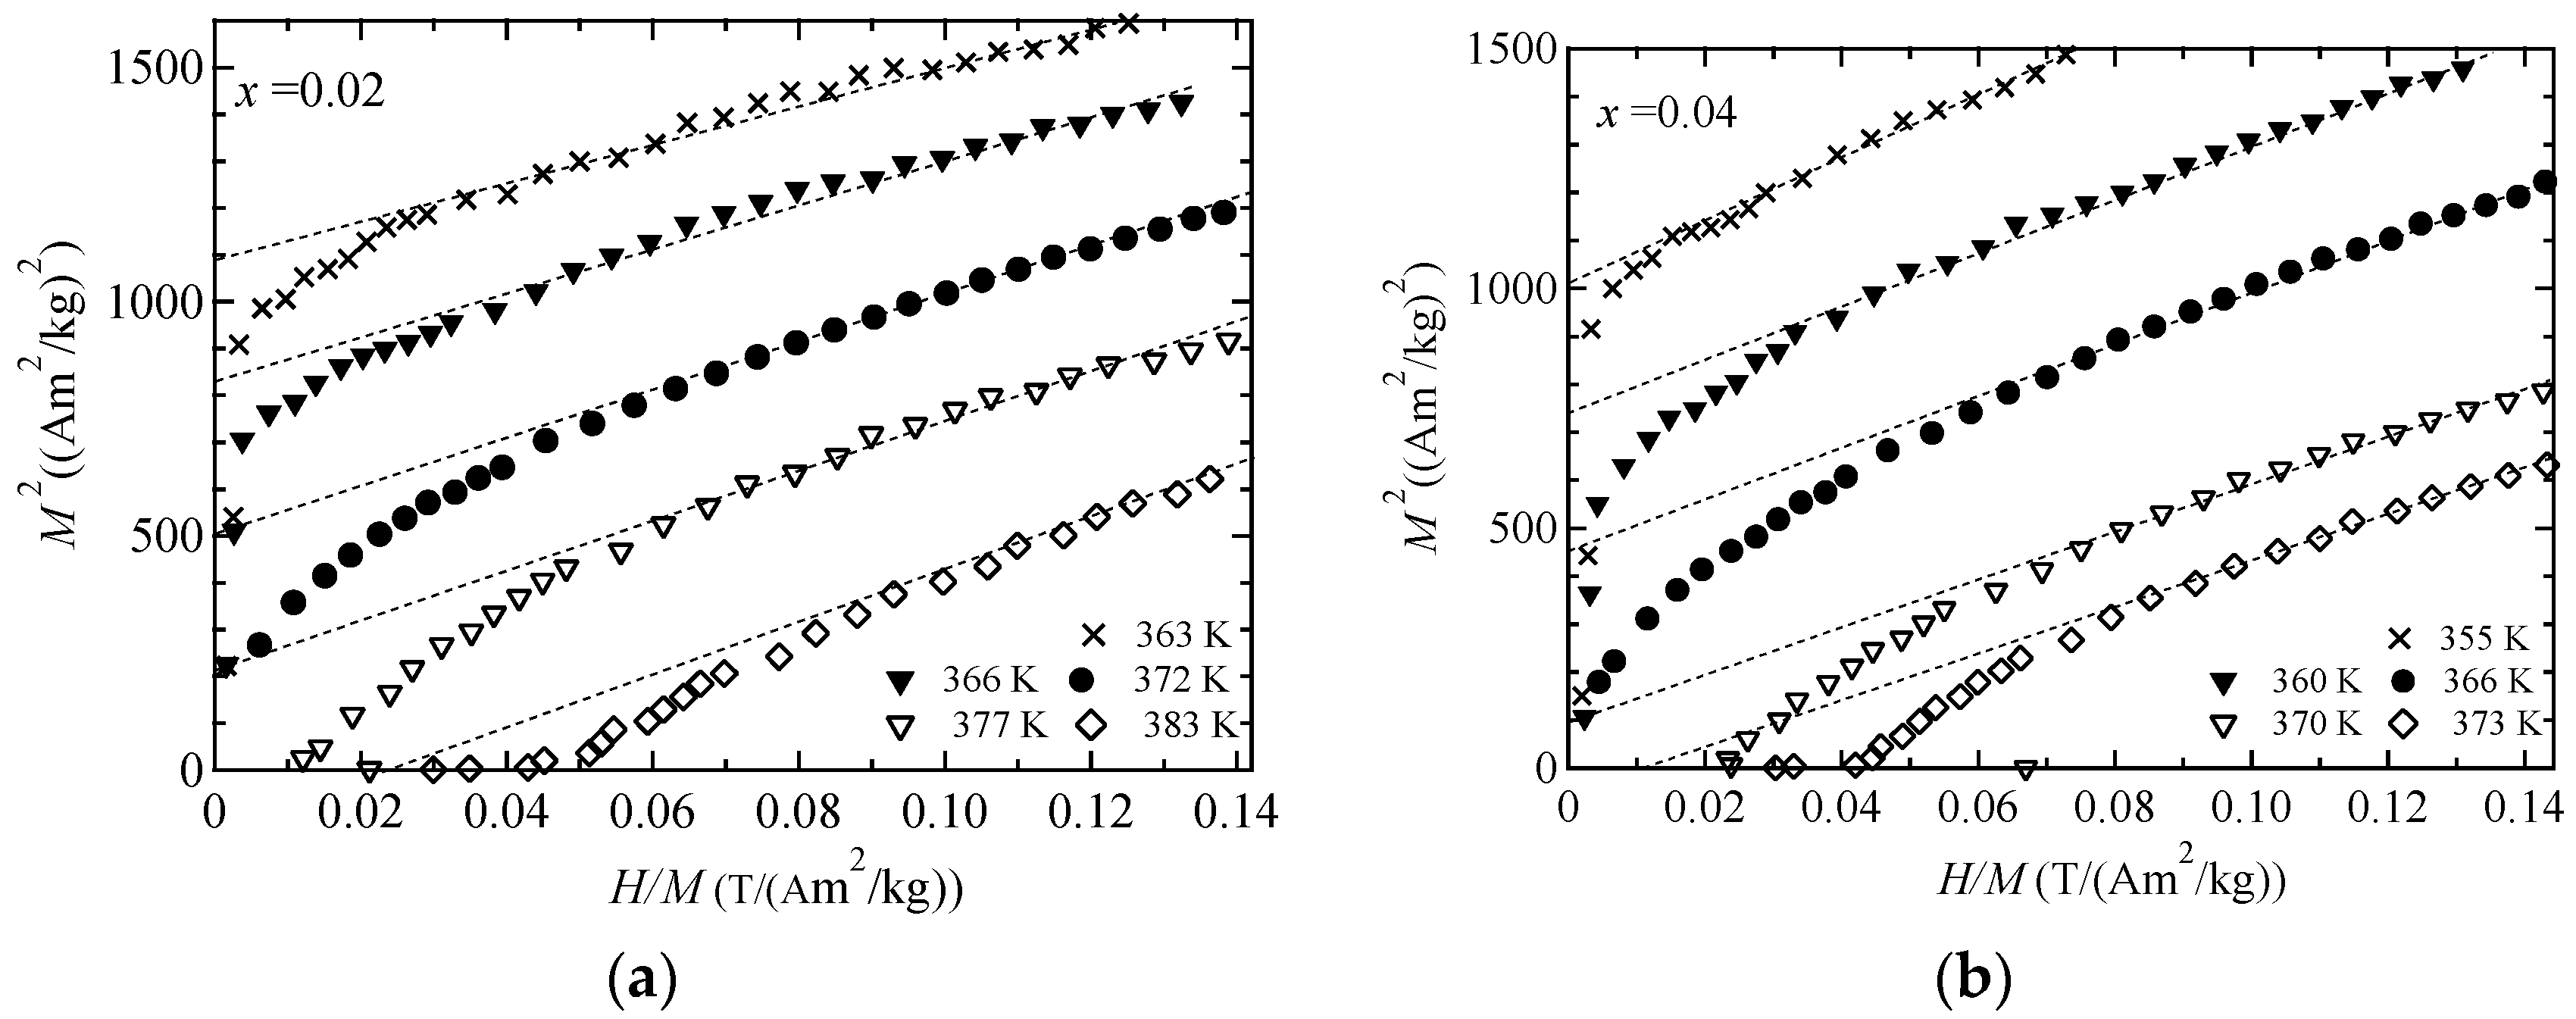
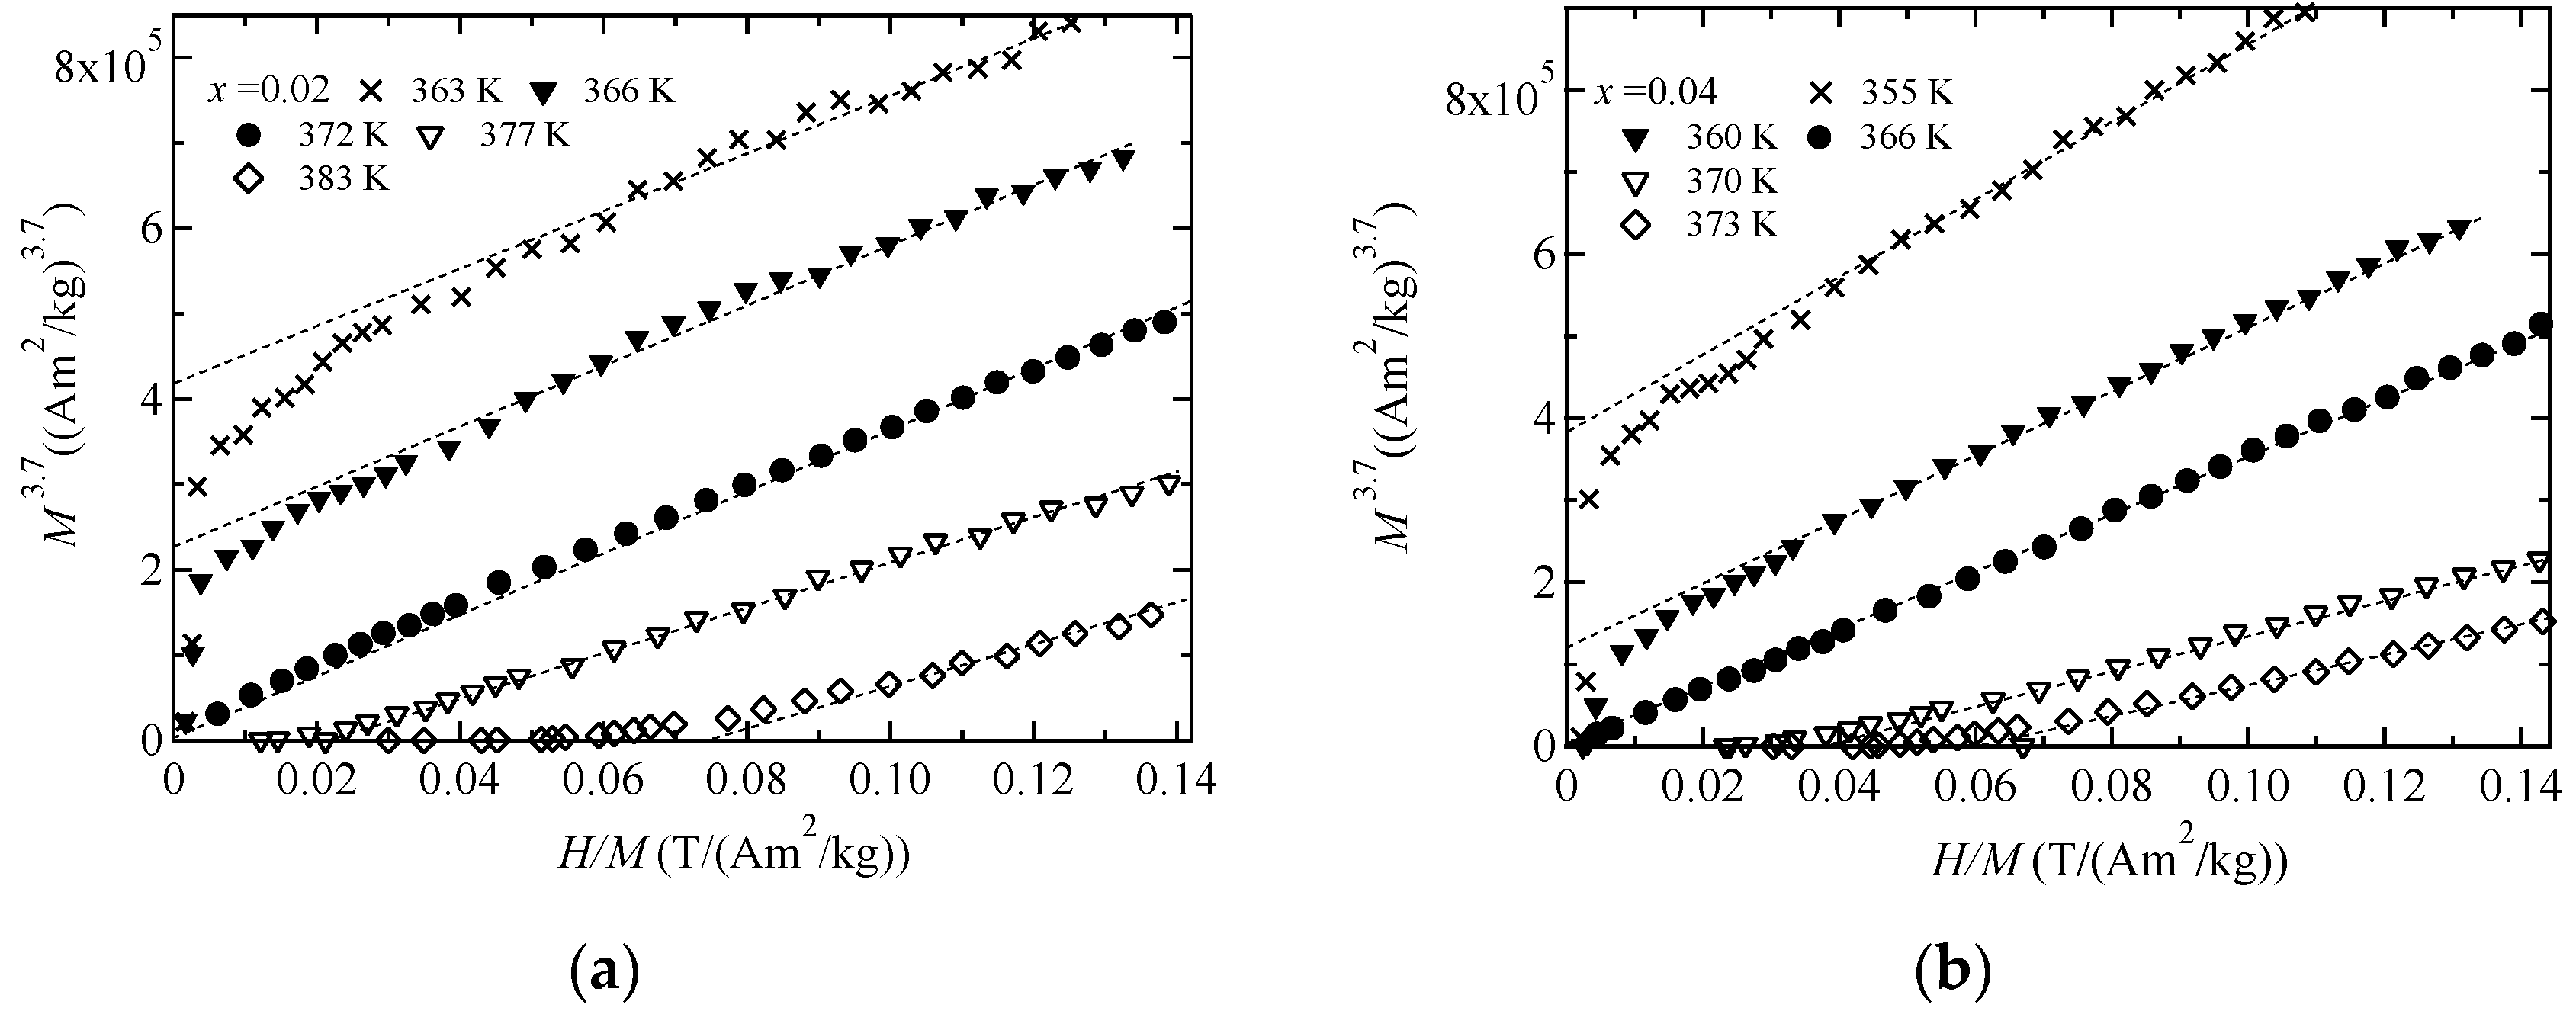
3.1. Magnetic Field Dependence of the Magnetization

For the Ni2MnGa alloy, martensitic transitions occurred at the temperature TMS of 195 K [16]. The alloy Ni2MnGa also has a premartensite phase. This is a precursor (intermediate) state to the martensitic transition. In the premartensite phase, the alloy has a 3M modulated structure [20]. The austenitic–premartensitic transition occurs at the premartensitic temperature TP of 260 K. Above TP, a cubic L21 type austenite phase is realized. The Curie temperature TC is 375 K, which is much higher than TMS and TP. The ferromagnetic–paramagnetic transition at TC occurs in the cubic austenite phase, and the magnetic anisotropy constant K1 in the austenite phase is 1/10 smaller than that in the martensite phase. The K1 value at 150 K in the martensite phase was of the magnitude 4.0 × 10⁶ erg/cm3, and K1 at 293 K in the austenite phase was 0.30 × 10⁶ erg/cm3 [16]. The magnitude of K1 of Ni2MnGa in the austenite phase is comparable to that of Fe. Therefore, Ni2MnGa was decided to be an isotropic ferromagnet in the austenite phase. The value of TM for Ni2+xMnGa1x increased with increasing Ni concentration x. The value of TP also increased with increasing x for x ≤ 0.04. Above TP = 265 K for x = 0.02 and 275 K for x = 0.04, a cubic L21 type austenite phase is realized. Figure 1 plots the permeability μ for x = 0.02 (Figure 1a) and x = 0.04 (Figure 1b) during heating in a zero external magnetic field. The derivative of μ with respect to temperature, /dT, is also shown in Figure 1. The TC could not be defined from the μ-T curve because the divergence derived from Equation (2) was not found. Therefore the TC was defined as a temperature where the absolute value of the gradient of the μ-T curve, /dT is maximum. The Curie temperatures TC were found to be 372 K and 366 K for x = 0.02 and 0.04, respectively, as obtained from the peaks of /dT in Figure 1.
We measured the magnetization of Ni2+xMnGa1−x around TC for the purpose of ascertaining the critical index δ of Mδ−1 versus H/M. We plotted figures of Mδ−1 versus H/M for δ = 3.0, 4.7, and 5.0; these are shown in Figure 2, Figure 3 and Figure 4, respectively. The result for δ = 3 is comparable to Moriya’s theory [1], that for δ = 5 is comparable to Takahashi’s theory [8], and that for δ = 4.7 is comparable to the former result [12]. Mδ−1 versus H/M with δ = 4.7 in Figure 3 and δ = 5.0 in Figure 4 show good linearity through the origin at TC, denoted by the filled circles. The results suggest that for x = 0.02 and 0.04, the critical index δ is 4.7–5.0, which conforms to Takahashi’s theory [8] and the result found for Ni2MnGa [12,13]. These relations held when the ratio of Ni to Ga and e/a were varied. HM5 behavior was also observed for MnSi [21] and Fe [22]. Therefore, Takahashi’s theory was again shown to be acceptable for use in analyzing magnetization in terms of itinerant electron ferromagnetism in Ni2MnGa system alloys.

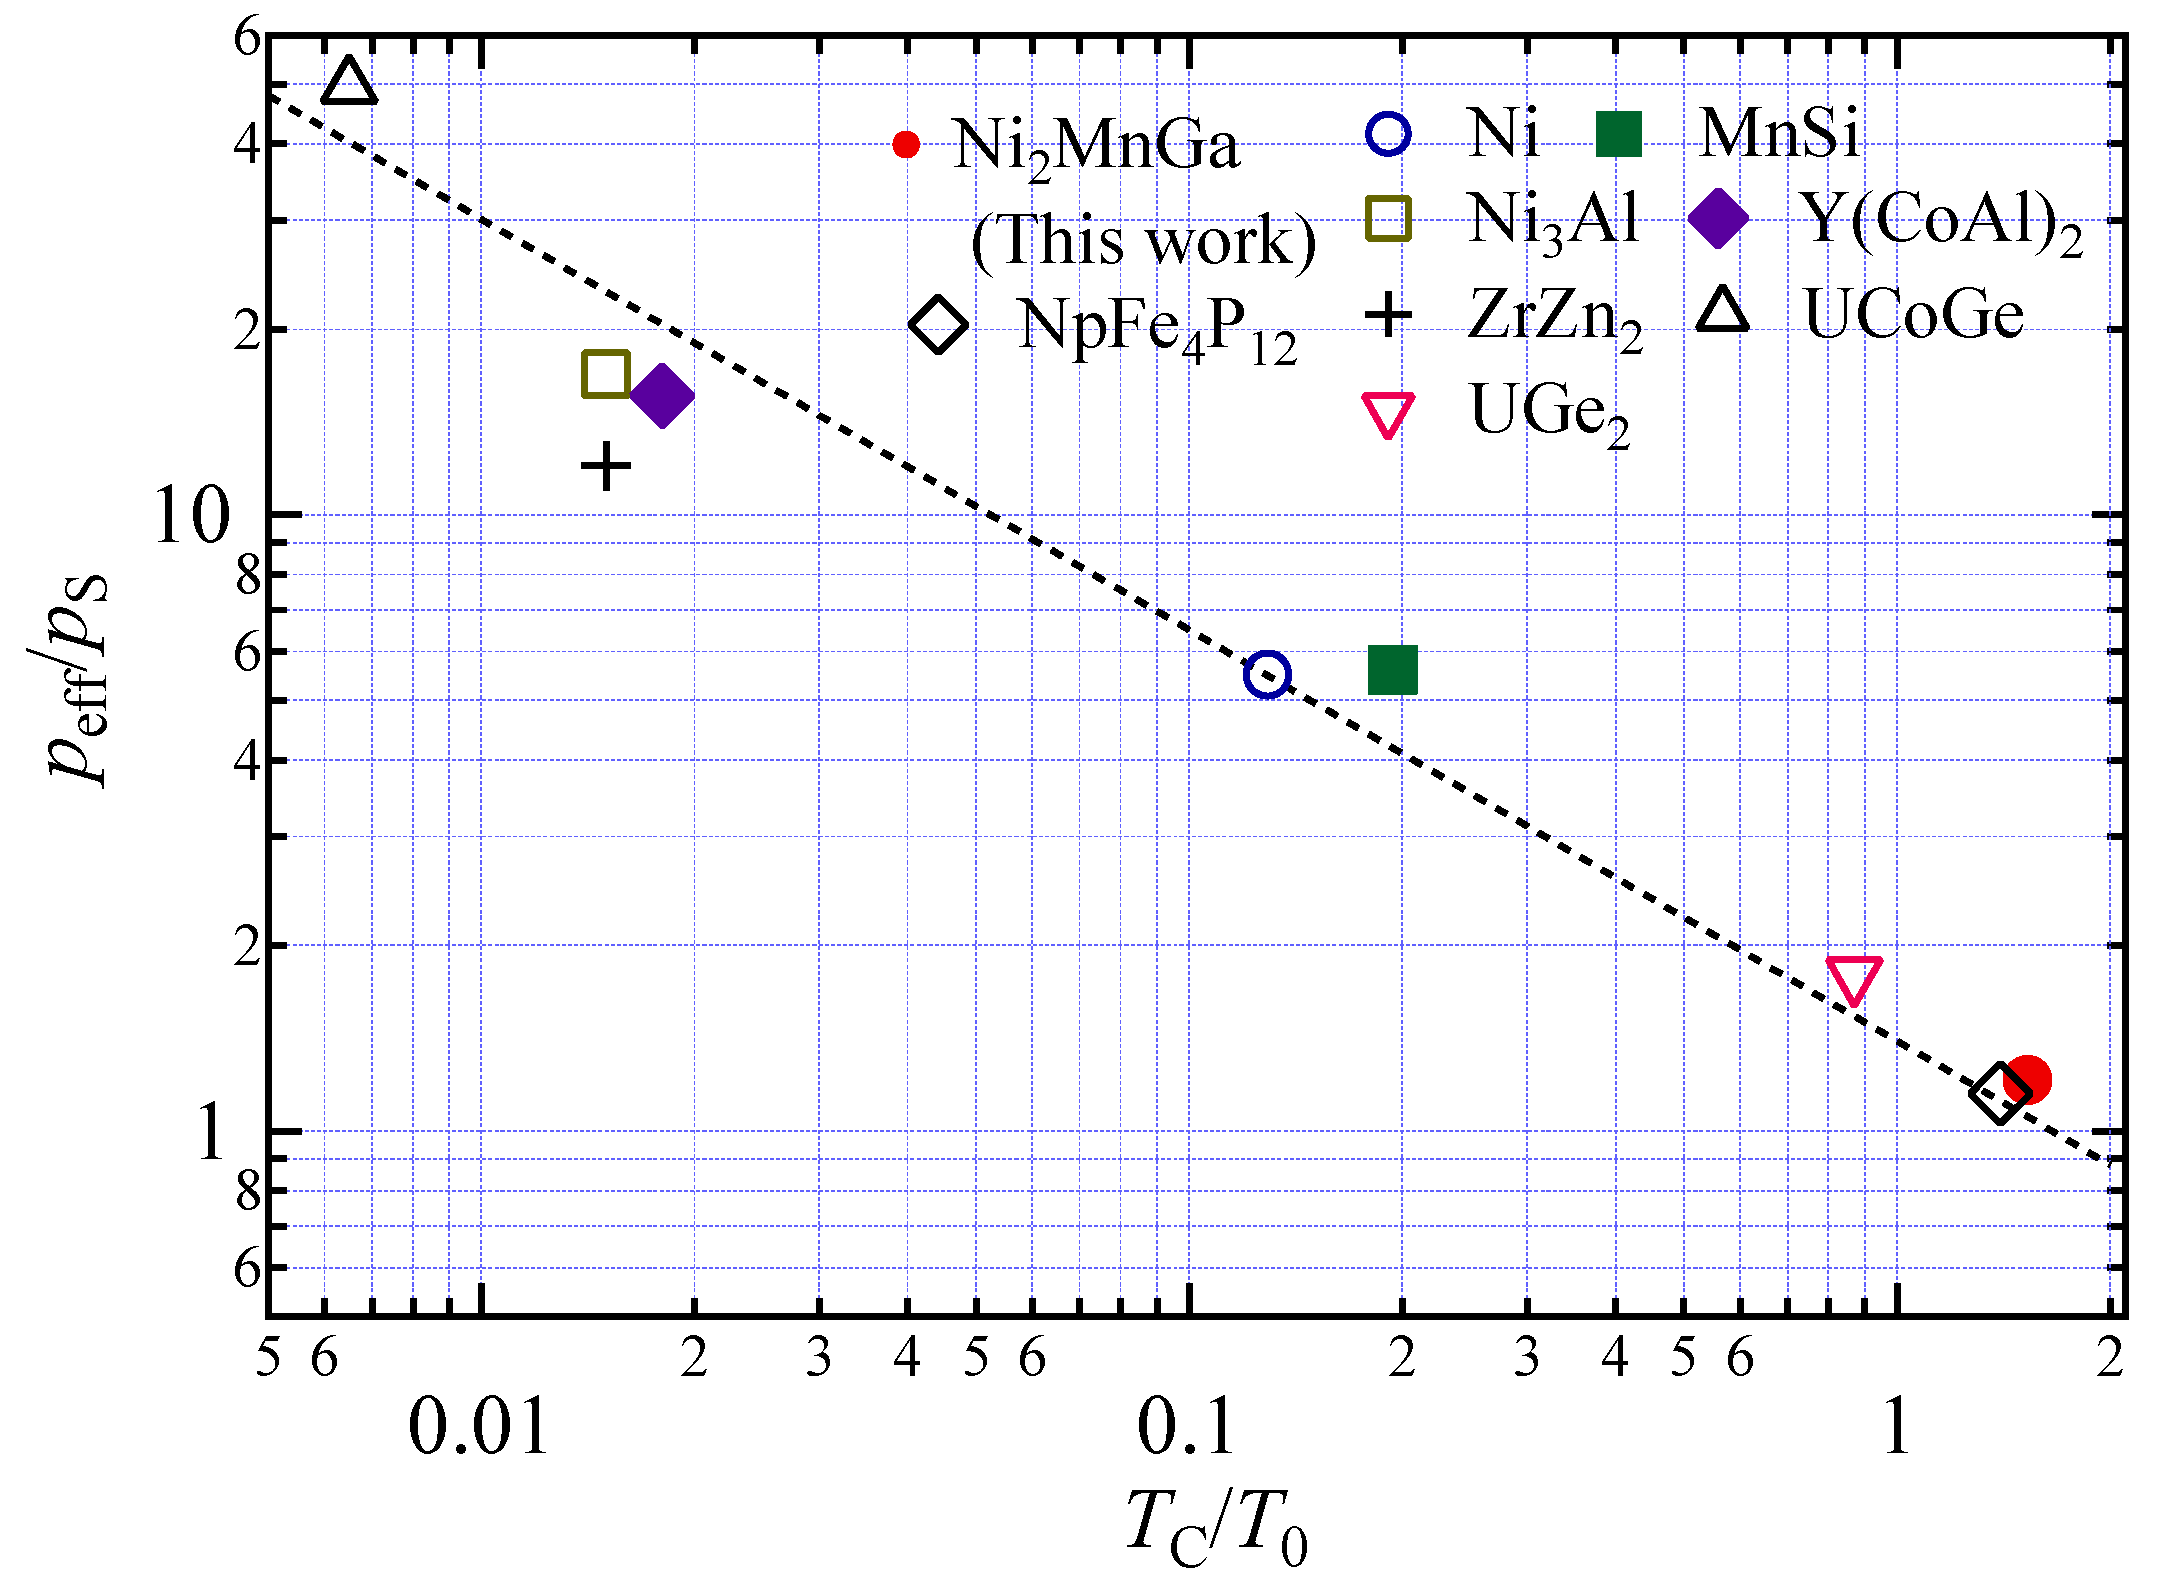
3.2. Basic Magnetic and Itinerant Spin Fluctuation Parameters and Generalized Rhodes–Wohlfarth Plot

In this subsection, we obtain the basic and spin fluctuation parameters and discuss itinerant magnetism by means of a generalized Rhodes-Wohlfarth plot of peff/pS versus TC/T0.
The induced magnetization M [8] (Equation (3.61)) is written as:
( M M S ) 4 = 1.20 × 10 6 × T C 2 T A 3 × H M
where MS = N0pSμB represents a spontaneous magnetization in a ground state; N0 is a molecular number; pS = gS, where g is the Landé’s g-factor and S is spin angular momentum; and TA is the spin fluctuation parameter in wave number space (momentum space). TA was obtained when experimental values were inserted into Equation (6), where the magnetic field H is in units of kOe and the magnetization M is in units of Am2/kg, which is equal to emu/g.
The spontaneous magnetic moment pS (μB) is expressed as:
p S 2 = 20 T 0 T A × C 4 3 × ( T C T 0 ) 4 3 C 4 3 = 1.006089
where T0 is the width of the spin fluctuation spectrum in the energy scale. This appears as Equation (3.61) in Takahashi [8].
From Equation (7), T0 can be obtained using the formula:
T 0 = 8147.2 × T C 4 T A 3 × p S 6
Table 1 provides the measured spontaneous magnetic moment pS and the characteristic temperatures TC, calculated TA, and T0 for Ni2+xMnGa1x. As for Ni2MnGa, the measured pS of 3.93 μB is comparable to the theoretical band calculation result at the experimental lattice constant of the L21 cubic austenite phase, pS, at 3.94 μB [23]. With increasing Ni fraction, the pS value decreased. This behavior appears for Ni2+xMn1xGa [24] and NixFe1x Invar alloys [25]. T0 increased with increasing x. This is presumably because, in Equation (8), the right side varies with the sixth power of pS, so T0 varies even when TA does not change.
Takahashi also derived a formula [8], shown in Equation (3.47), for the relationship between pS, TC, T0, and the effective magnetic moment peff as follows:
p e f f p S 1.4 × ( T 0 T C ) 2 3
As for Ni2MnGa, peff is 4.75 [24,26]. Equation (9) can be rewritten as:
k m = ( p e f f p S ) × ( T C T 0 ) 2 3
When km is 1.4, Equation (10) is equal to Equation (9). For Ni2MnGa, a value of 1.61 for km was obtained by substituting pS, TC, and T0 from Table 1 and peff of 4.75 into Equation (10) [26]. The values of km for notable atoms, alloys, and compounds are Ni 1.41 [12], MnSi 1.88 [21], Ni3Al 1.06 [27], Y(Co0.85Al0.15)2 1.08 [28], ZrZn2 0.74 [29], UCoGe 1.74 [8], and UGe2 1.61 [8]; these were calculated from the values listed in Table 2. Actinide 5f compound NpFe4P12 was also analyzed using the Takahashi theory and a km value of 1.44 was found [30]. Table 2 provides the km values and the magnetic moments and characteristic temperatures relating to spin fluctuation. Figure 5 is a plot of log(peff/pS) versus log(TC/T0) for Ni2MnGa, Ni, and notable alloys and compounds using the data in Table 2. The dotted line indicates the line of Equation (10) when km is 1.4. Figure 5 clearly shows that the relation between peff/pS and To/TC can be explained by Equation (9). In Figure 3.3. in Takahashi [8], UGe2 had the largest value of TC/T0. In Figure 5 of this article, we added Ni, Ni2MnGa, and NpFe4P12. The TC/T0 value of Ni2MnGa was almost the same as that of NpFe4P12. The magnetic alloys and compounds that were analyzed by means of Equation (9) under the Takahashi theory were magnets with TC values lower than room temperature. Notably, the ferromagnetic alloy Ni2MnGa, which has a TC higher than room temperature, can be explained by Figure 5 and Equation (6).
The notable point from Table 2 and Figure 5 is that the peff/pS value of Ni2MnGa is smaller than those of other alloys and compounds. The effective moment peff was calculated from the Curie constant, C = Nμeff2/3kB = Npeff2μB2/3kB = B2pC(pC + 2)/3kB. The term pC refers to the effective moment deduced from the Curie constant C. The spontaneous magnetic moment μ is pS (μB) at 0 K. The pc/pS was one for local moment ferromagnetism and was larger than one for itinerant ferromagnetism. For Ni2MnGa, peff was 4.75, as shown in Table 2; therefore, a pc value of 3.85 was obtained from the equation peff2 = pC(pC + 2). Then, the pC/pS value was 0.98. As a result, pC/pS was a little smaller than one. Webster et al. compared the magnetic moment obtained by saturation magnetization measurement, psat = 4.17 [26]. Then, psat/pS was 0.92. In this work, the magnetization of Ni2MnGa in the magnetic field of 5.0 T at 5 K was 4.10 μB/f.u. Therefore, psat/pS was 0.96. The Heusler compounds of CoMnSb and NiMnSb both possess the property of pC/pS < 1 [31]. Ott et al. proposed a simple molecular field model considering both local moments and spin-polarized itinerant electrons to explain pC/pS < 1 [31]. They introduced an enhanced temperature-independent Pauli susceptibility and explained that the Curie constant decreases if the interactions between local magnetic moments and holes is antiferromagnetic. Webster mentioned that in the paramagnetic phase, only the Mn atoms carry a magnetic moment [26]. It is supposed that in the paramagnetic phase, a large moment is induced by the electrons around the Mn atom at the Mn site. Conversely, at the Ni site, the spins fluctuate at high temperature in the paramagnetic phase. Therefore, it is supposed that the magnetic moment pc at high temperature in a paramagnetic phase is smaller than the spontaneous magnetization pS and the saturation moment psat at 5 K.

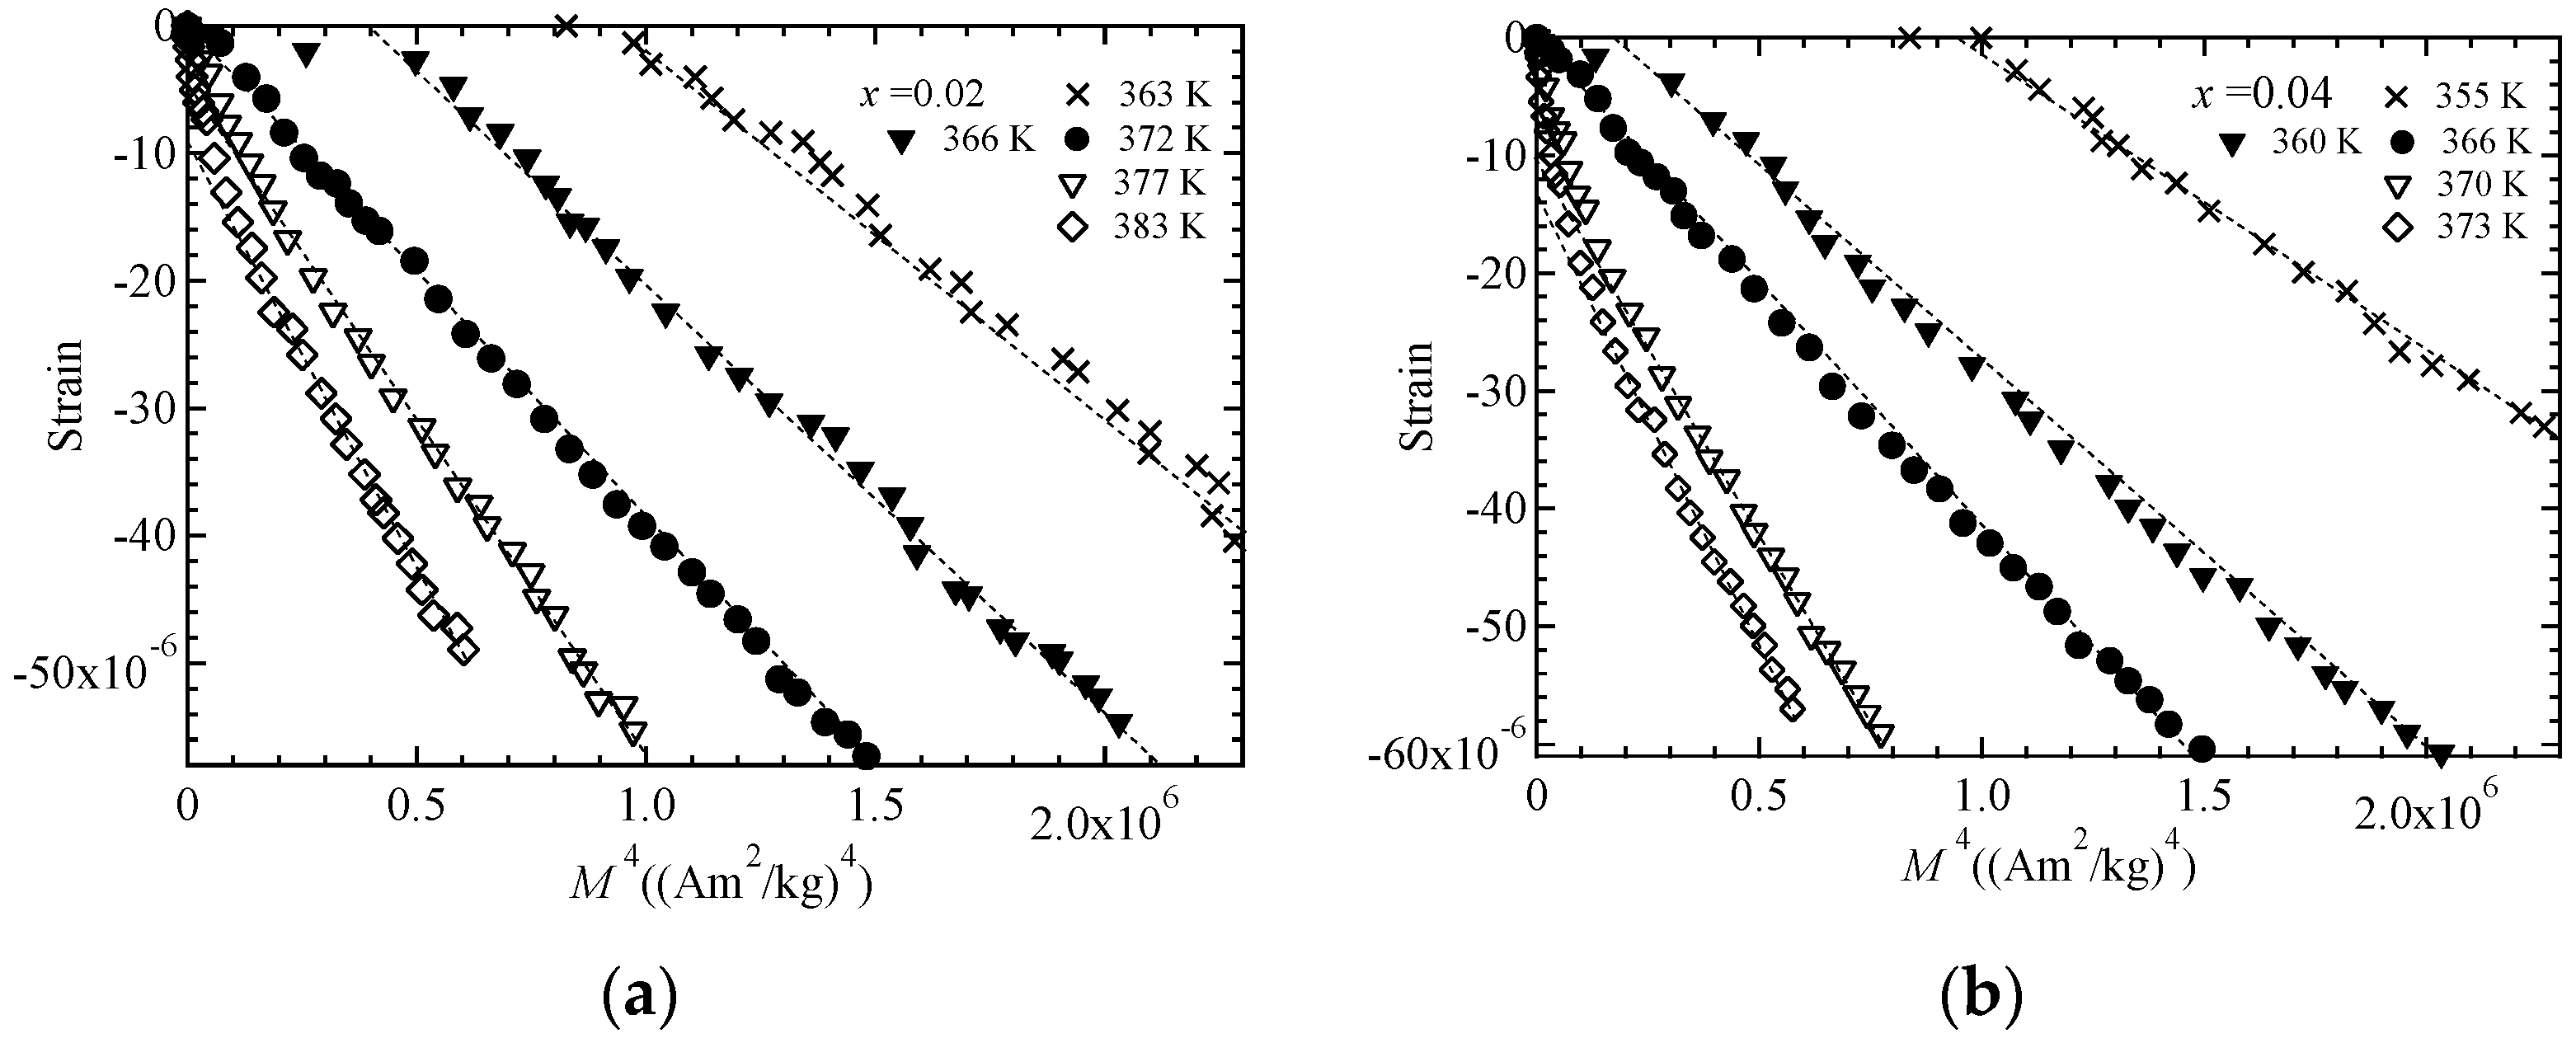
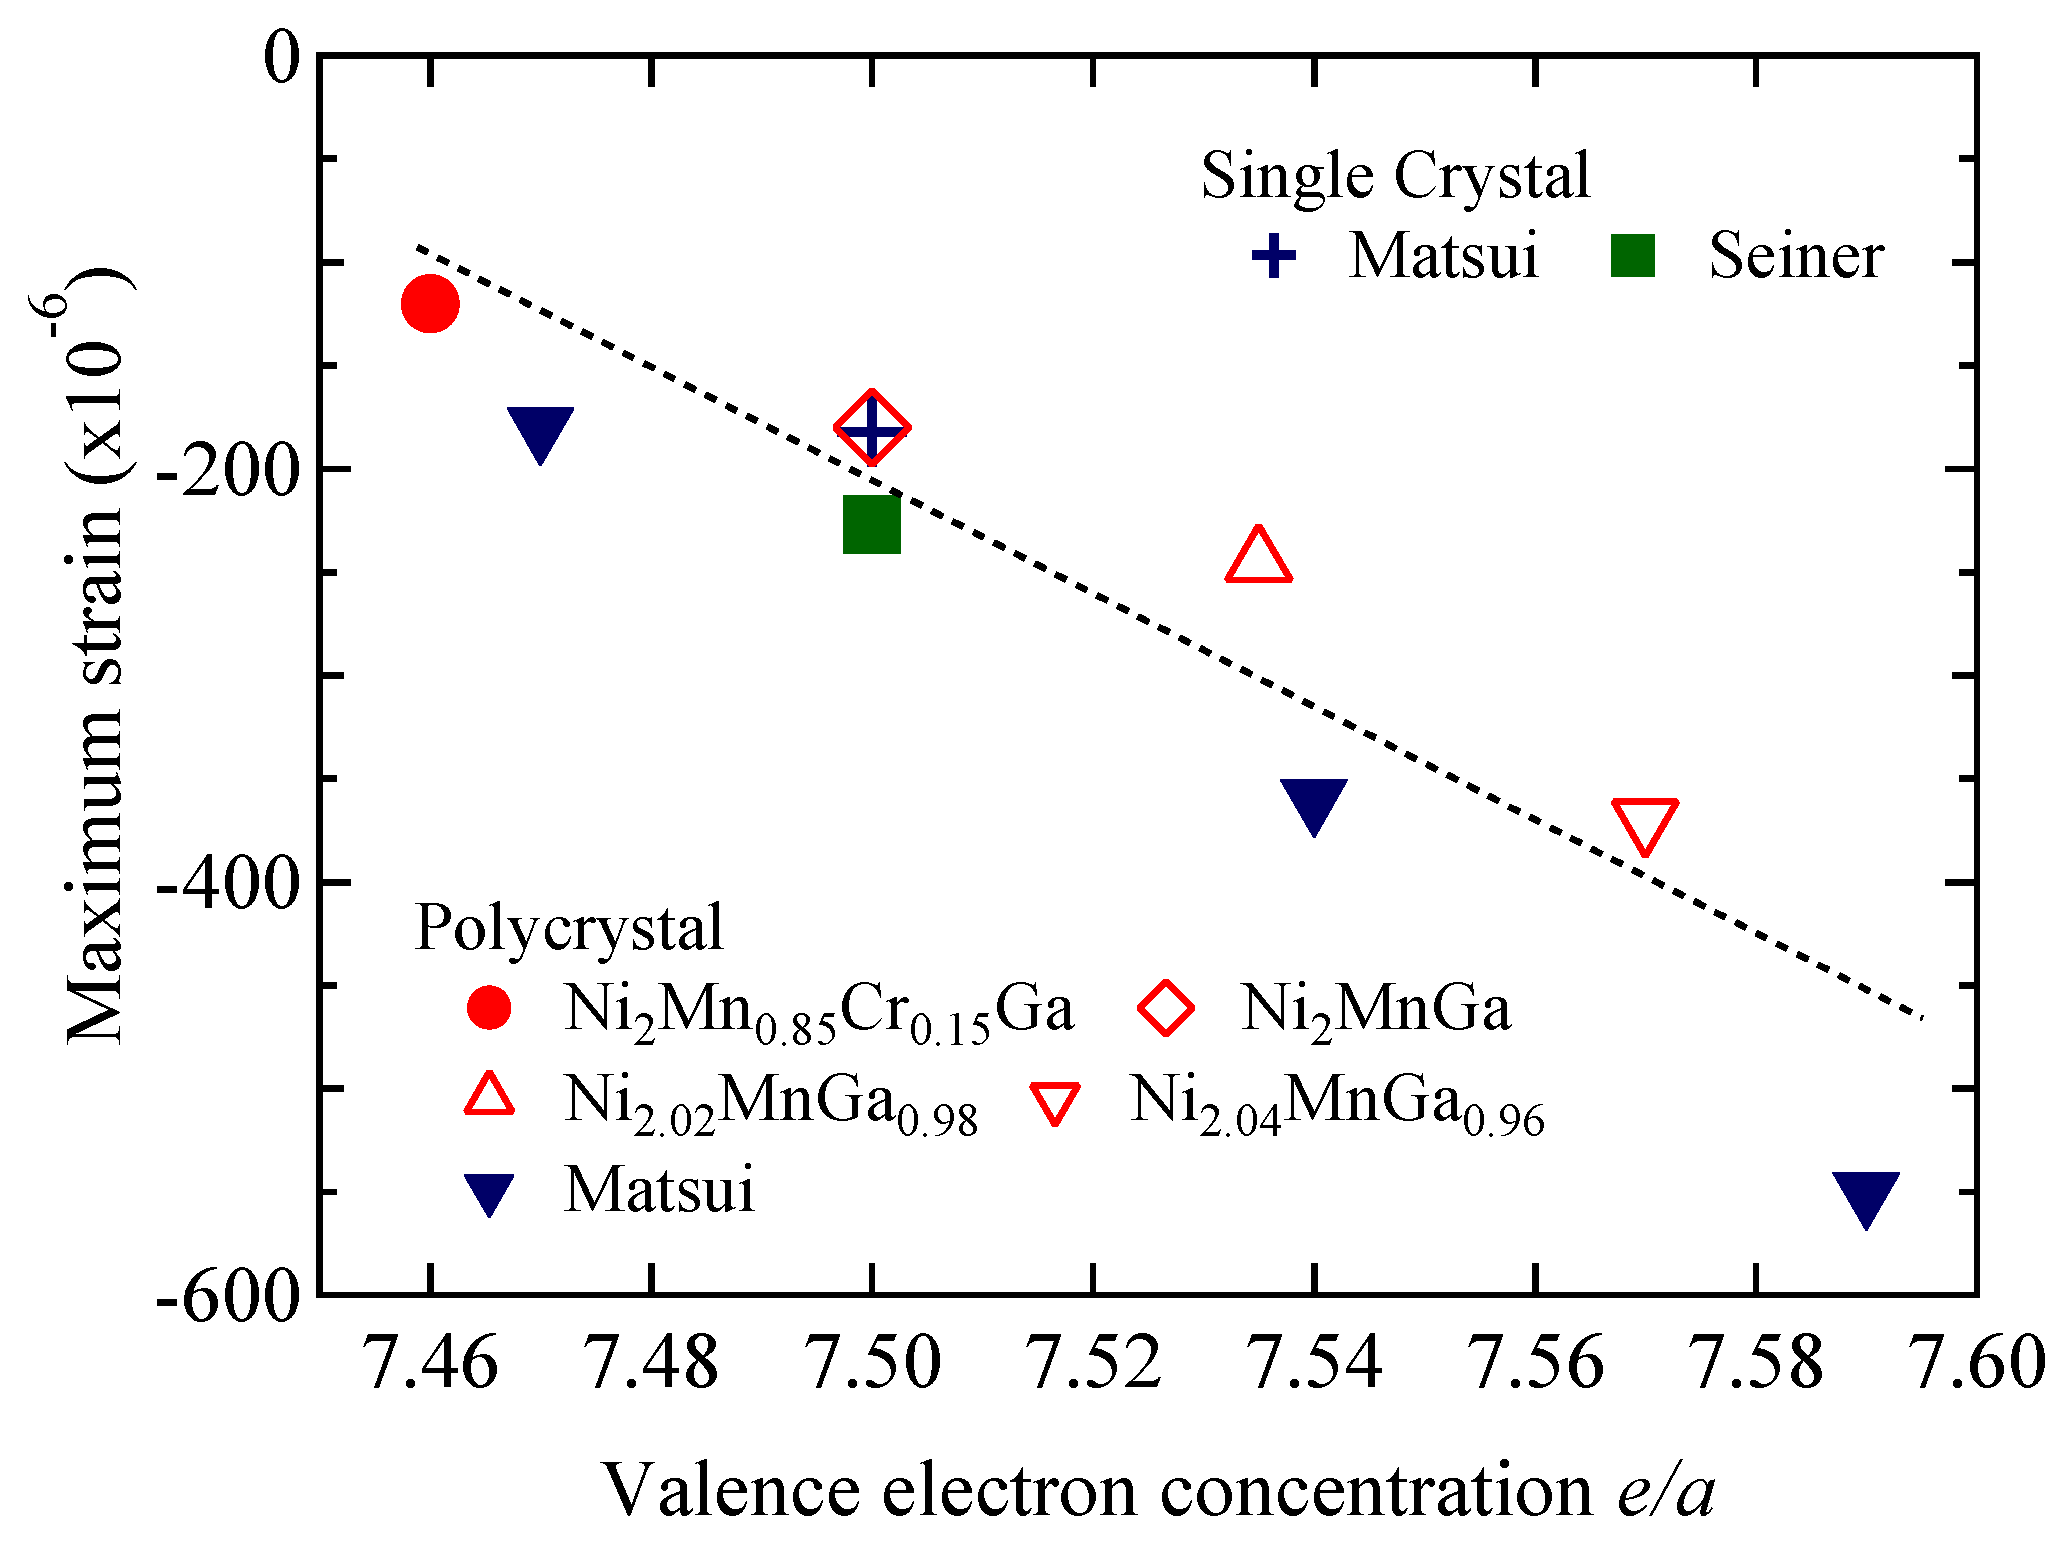
3.3. Magnetization and Temperature Dependences Force Magnetostrictions

We recorded magnetostriction measurements to conduct an investigation into the magnetization dependence of forced magnetostriction. In our earlier study, the magnetostriction of Ni2MnGa was found to be proportional to the M4 of the magnetization and clearly passed through the origin at TC [14]. In this study, we investigated Ni2+xMnGa1−x (x = 0.02, 0.04) to check whether these relations held when the ratio of Ni to Ga and e/a were varied. We plotted figures of magnetostriction ΔL/L versus Mδ for δ = 2.0 and 4.0. The result for δ = 2.0 indicates a relation under Moriya’s theory [1,15], and that for δ = 4.0 indicates a relation under Takahashi’s theory [8]. Figure 6 is a plot of magnetostriction ΔL/L versus M2 for x = 0.02 (Figure 6a) and x = 0.04 (Figure 6b). The dotted lines are fitted linear plots. For the magnetostriction at TC indicated by the filled circles, the M2 linearity behavior was only observed for large magnetostriction and large magnetization area. Moreover, the dotted straight lines did not pass through the origin. These behaviors are comparable to the results for MnSi [15] and our former result for Ni2MnGa [13]. We also investigated ΔL/L versus M4 dependence, as shown in Figure 7. The plot of ΔL/L versus M4 indicates good linearity passing through the origin at TC, as indicated by the filled circles for both samples. Table 3 provides the coefficients A and k of the fitted linear plots given by the equation ΔL/L = A + kMδ for δ = 2 or 4 at TC. The standard deviations of the linear fitted lines at TC for magnetostriction ΔL/L versus M2 and ΔL/L versus M4 are shown in Figure 6 and Figure 7, respectively, and are also listed in Table 3. The errors of the coefficient k were within ±2% for both values of δ. The proportions of the coefficient A and the magnetostriction at 5 T (ΔL/L ≃ −60 × 10−6), y0, were greater than 50% and less than 1.2% for δ = 2 and 4, respectively. This analysis indicates that the magnetostriction can be represented by the equation ΔL/L = kM4 at TC, as presented in Figure 7. As a result, the relation between magnetostriction and magnetization confirmed that the magnetostriction is proportional to the fourth power of the magnetization, as derived from Takahashi’s theory, even when the ratio of Ni to Ga and e/a were varied.
The magnetostrictions at 5 T were 50 × 10−6, 58 × 10−6, and 61 × 10−6 for x = 0.00, 0.02, and 0.04, respectively. With increasing x, the magnetostriction increased. In our former investigation of the magnetostriction of Ni2Mn1−xCrxGa (x ≤ 0.25), the magnitude of the magnetostriction increased when the premartensite transition temperature TP and TC were closer, as shown in Sakon et al. [16]. For Ni2+xMnGa1−x, the TP values were 258 K, 265 K, and 275 K for x = 0.00, 0.02, and 0.04, respectively. The TC values were 375 K, 372 K, and 366 K for x = 0.00, 0.02, and 0.04, respectively. With increasing x, the TP shifted to higher temperatures and the TC shifted to lower temperatures. We supposed that the magnetostriction of Ni2+xMnGa1−x has the same properties as that of Ni2Mn1−xCrxGa.
Finally, we discuss the e/a dependences of the maximum magnetostriction around the premartensitic–austenitic transition for Ni2MnGa-type alloys. Around the premartensitic transition temperature TP, large magnetostriction has been observed [16,17]. Detailed explanations of the premartensitic transition and premartensite phase have been previously presented [16,17,18]. In our former investigation [16], we examined the magnetostrictions for Ni2Mn1−xCrxGa (x = 0.00, e/a = 7.50; x = 0.15, e/a = 7.46) around TP and TM. With increasing x, TP and e/a decreased; accordingly, the maximum value of the magnetostriction decreased. We assumed that if e/a increases, TP and the magnetostriction increase. Matsui et al. experimentally investigated the Ni2MnGa-type alloys with e/a > 7.50 [17,18]. Among these alloys, Ni51.7Mn24.3Ga24.0 with TP = 285 K and e/a = 7.59 showed large magnetostriction with strain 550 × 10−6 [17,18]. In this study, we decided to increase the concentration of Ni and decrease that of Ga because the e/a values of Ni and Ga are 10 and 3, respectively, in order to increase the e/a value of alloys to be above 7.50. Therefore, we prepared Ni2+xMnGa1−x alloys with x = 0.02, producing e/a = 7.535, and x = 0.04, producing e/a = 7.570. Figure 8 shows the temperature dependencies of the magnetostriction at 1.6 T. The values were 250 × 10−6 and 380 × 10−6 for x = 0.02 and 0.04, respectively. Figure 9 shows the e/a dependences of the maximum magnetostriction for Ni2MnGa-type alloys. The maximum value of magnetostriction was almost proportional to the valence electron concentration per atom, e/a, and we also clarified the correlation between the magnetostriction and the e/a.
The softening of the lattice around TP was investigated using ultrasonic measurements [32,33]. Seiner et al. investigated the magnetostriction around TP for a single crystal of Ni2MnGa [33]. They suggested a model based on adaptive concept of premartensite, explaining the softening of c44 and apparent c′ stiffening prior to the martensitic transformation and discussed the magneto-elastic coupling effect by means of these magnetostriction, and ultrasonic measurements results under magnetic fields. This consideration only involves the softening of the elastic constant. Our experimental results indicate that the e/a and the magnetostriction are correlated and investigation by means of the itinerant electron magnetism is needed to better understand the fundamental origin of the magnetostriction. Future experimental and fundamental theoretical studies are needed to investigate the magneto-elastic coupling effect precisely, for example, with spectroscopy measurements for investigations of electron band structure and with itinerant electron magnetism theories.

4. Conclusions

Experimental investigations of the field dependence of magnetization and the relationship between magnetization and magnetostriction for Ni2+xMnGa1−x (x = 0.00, 0.02, 0.04) alloy ferromagnets were performed in accordance with the self-consistent renormalization (SCR) spin fluctuation theory of itinerant ferromagnetism. In this study, we investigated the magnetization of and the magnetostriction on Ni2+xMnGa1−x (x = 0.02, 0.04) to check whether these relations held when the ratio of Ni to Ga and e/a were varied. When the ratio of Ni to Ga varied, the valence electron concentration per atom, e/a, increased with increasing x. The magnetization results for x = 0.02 (e/a = 7.535) and 0.04 (e/a = 7.570) suggest that the critical index δ of HMδ is around 5.0 at the Curie temperature TC, which is the critical temperature of the ferromagnetic–paramagnetic transition. This result confirms Takahashi’s spin fluctuation theory and the experimental results obtained for Ni2MnGa. The spontaneous magnetization pS slightly decreased with increasing x. For x = 0.00, the obtained spin fluctuation parameter in k-space (momentum space) TA and that in energy space T0 were 563 K and 245 K, respectively. The relationship between peff/pS and TC/T0 can be explained by Takahashi’s theory, where peff indicates the effective magnetic moments. We produced a generalized Rhodes-Wohlfarth plot of peff/pS versus TC/T0 values including those of other ferromagnets. The plot indicates that the relation between peff/pS and T0/TC follows Takahashi’s theory. We also measured the magnetostriction for Ni2+xMnGa1−x (x = 0.02, 0.04). At TC, the plot of the magnetostriction ΔL/L versus M4 showed proportionality and crossed the origin. These magnetization and magnetostriction results were analyzed in the context of Takahashi’s SCR spin fluctuation theory. Further, we investigated the magnetostriction at the premartensite phase, which is the precursor state to the martensitic transition. In Ni2MnGa system alloys, the maximum value of magnetostriction is almost proportional to e/a.

Author Contributions

Sample preparation, D.L., F.H., G.O., T.E.; magnet system preparation, T.S., Y.H., Y.N., M.H.; investigation, T.S., T.E., Y.H., Y.N., M.H.; writing—original draft preparation, T.S, Y.H., T.E.; writing—review and editing, T.S., T.K.; supervision, T.K.

Funding

This research was founded by Visiting Researcher’s Program of the Institute for Solid State Physics, the University of Tokyo.

Acknowledgments

The authors thank Mitsuo Kataoka for helpful discussions. The authors also thank Mitsuo Okamoto and Fumihiko Morioka of Ryukoku University for helping to create the apparatus. This project is partly supported by the Ryukoku Extension Center (REC) at Ryukoku University. This research was carried out in part at the International Research Center for Nuclear Materials Science, Institute for Materials Research, Tohoku University. This research was also carried out at the Center for Advanced High Magnetic Field Science in Osaka University under the Visiting Researcher’s Program of the Institute for Solid State Physics, the University of Tokyo.

Conflicts of Interest

The authors declare no conflict of interest.

References

  1. Moriya, T. Spin Fluctuations in Itinerant Electron Magnetism; Springer: Berlin, Germany, 1985; ISBN 978-3-642-82499-9. [Google Scholar]
  2. Lonzarich, G.; Taillefer, G. Effect of spin fluctuations on the magnetic equation of state of ferromagnetic or nearly ferromagnetic metals. J. Phys. C Solid State Phys. 1985, 18. [Google Scholar] [CrossRef]
  3. Takahashi, Y. On the origin of the Curie Weiss law of the magnetic susceptibility in itinerant electron magnetism. J. Phys. Soc. Jpn. 1986, 55. [Google Scholar] [CrossRef]
  4. Takahashi, Y. Theoretical Development in Itinerant Electron Ferromagnetism. J. Phys. Conf. Ser. 2017. [Google Scholar] [CrossRef]
  5. Takahashi, Y.; Nakano, H. Magnetovolume Effect of Itinerant Electron Magnetism. J. Phys. Condens. Matter 2006, 18. [Google Scholar] [CrossRef]
  6. Moriya, T.; Kawabata, A. Effect of Spin Fluctuations on Itinerant Electron Ferromagnetism. J. Phys. Soc. Jpn. 1973, 34. [Google Scholar] [CrossRef]
  7. Moriya, T.; Kawabata, A. Effect of Spin Fluctuations on Itinerant Electron Ferromagnetism. II. J. Phys. Soc. Jpn. 1973, 35. [Google Scholar] [CrossRef]
  8. Takahashi, Y. Spin Fluctuation Theory of Itinerant Electron Magnetism; Springer: Berlin, Germany, 2013; ISBN 978-3-642-36666-6. [Google Scholar]
  9. Rhodes, P.; Wohlfarth, E.P. The effective Curie-Weiss constant of ferromagnetic metals and alloys. Proc. R. Soc. Lond. A 1963, 273. [Google Scholar] [CrossRef]
  10. Nishihara, H.; Harada, T.; Kanomata, T.; Wada, T. Magnetizationprocess near the Curie temperature of an itinerant ferromagnet CoS2. J. Phys. Conf. Ser. 2012, 400, 032068. [Google Scholar] [CrossRef]
  11. Shimizu, K.; Maruyama, H.; Yamazaki, H.; Watanabe, H. Effect of Spin Fluctuations on Magnetic Properties and Thermal Expansion in Pseudobinary System FexCo1−xSi. J. Phys. Soc. Jpn. 1990, 59. [Google Scholar] [CrossRef]
  12. Nishihara, H.; Komiyama, K.; Oguro, I.; Kanomata, T.; Chernenko, V. Magnetization processes near the Curie temperatures of the itinerant ferromagnets, Ni2MnGa and pure nickel. J. Alloys Compd. 2007, 442, 191–193. [Google Scholar] [CrossRef]
  13. Sakon, T.; Hayashi, Y.; Fujimoto, N.; Kanomata, T.; Nojiri, H.; Adachi, Y. Forced magnetostriction of ferromagnetic Heusler alloy Ni2MnGa at the Curie temperature. J. Appl. Phys. 2018, 123. [Google Scholar] [CrossRef]
  14. Kittel, C. Introduction of Solid State Physics, 8th ed.; John Wiley & Sons Inc.: Hoboken, NJ, USA, 2004; p. 75. ISBN 978-0-471-41526-8. [Google Scholar]
  15. Matsunaga, M.; Ishikawa, Y.; Nakajima, T. Magneto-volume effect in the weak itinerant ferromagnet MnSi. J. Phys. Soc. Jpn. 1982, 51. [Google Scholar] [CrossRef]
  16. Sakon, T.; Fujimoto, N.; Kanomata, T.; Adachi, Y. Magnetostriction of Ni2Mn1−xCrxGa Heusler alloys. Metals 2017, 7, 410. [Google Scholar] [CrossRef]
  17. Matsui, M.; Nakakura, T.; Murakami, D.; Asano, H. Super magnetostriction with mesophase transition of Ni2MnGa. Toyota Sci. Rep. 2010, 63, 27–36. [Google Scholar]
  18. Matsui, M.; Nakamura, T.; Murakami, D.; Yoshimura, S.; Asano, H. Effect of Super Magnetostriction on Magnetic Anisotropy of Ni2MnGa. Toyota Sci. Rep. 2011, 64, 1–11. [Google Scholar]
  19. Rizal, C.; Kolthammer, J.; Pokharel, R.K.; Choi, B.C. Magnetic properties of nanostructured Fe-Co alloys. J. Appl. Phys. 2013, 113. [Google Scholar] [CrossRef]
  20. Singh, S.; Bednarcik, J.; Barman, S.R.; Felsher, S.R.; Pandey, D. Premartensite to martensite transition and its implications for the origin of modulation in Ni2MnGa ferromagnetic shape-memory alloy. Phys. Rev. B 2015, 92. [Google Scholar] [CrossRef]
  21. Bloch, D.; Voiron, J.; Jaccarino, V.; Wernick, J.H. The high field-high pressure magnetic properties of MnSi. Phys. Lett. A 1975, 51, 259–261. [Google Scholar] [CrossRef]
  22. Hatta, S.; Chikazumi, S. Magnetization Process in High Magnetic Fields for Fe and Ni in Their Critical Regions. J. Phys. Soc. Jpn. 1977, 43, 822–830. [Google Scholar] [CrossRef]
  23. Tanaka, Y.; Ishida, S.; Asano, S. Band Calculation of Manganese Magnetic Moments in Ni2MnGa 14M Structure. Mater. Trans. JIM 2004, 45, 1060–1064. [Google Scholar] [CrossRef]
  24. Khovailo, V.V.; Novosad, V.; Takagi, T.; Filippov, D.A.; Levitin, R.Z.; Vasil’ev, A.N. Magnetic properties and magnetostructural phase transitions in Ni2+xMn1xGa shape memory alloys. Phys. Rev. B 2004, 70. [Google Scholar] [CrossRef]
  25. Ueda, U.; Takahashi, M. Structure and Magnetic Properties of Electrodeposited Fe-Ni Alloy Films. J. Phys. Soc. Jpn. 1980, 49, 477–483. [Google Scholar] [CrossRef]
  26. Webster, P.J.; Ziebeck, K.R.A.; Town, S.L.; Peak, M.S. Magnetic order and phase transformation in Ni2MnGa. Philos. Mag. B 1984, 49, 295–310. [Google Scholar] [CrossRef]
  27. De Boer, F.R.; Biesterbos, J.; Schinkel, C.J. Ferromagnetism in the intermetallic phase Ni3Al. Phys. Lett. A 1969, 24, 355–357. [Google Scholar] [CrossRef]
  28. Yoshimura, K.; Takigawa, M.; Takahashi, Y.; Yasuoka, H.; Nakamura, Y. NMR Study of Weakly Itinerant Ferromagnetic Y(Co1−xAlx)2. J. Phys. Soc. Jpn. 1987, 56, 1138–1155. [Google Scholar] [CrossRef]
  29. Ogawa, S. Electrical Resistivity of Weak Itinerant Ferromagnet ZrZn2. J. Phys. Soc. Jpn. 1976, 40, 1007–1009. [Google Scholar] [CrossRef]
  30. Aoki, D.; Haga, Y.; Homma, Y.; Sakai, H.; Ikeda, S.; Shiokawa, Y.; Yamamoto, E.; Nakamura, A.; Onuki, Y. First single crystal growth of the Transuranium filled-Skutterudite compound NpFe4P12 and its magnetic and electrical properties. J. Phys. Soc. Jpn. 2006, 75. [Google Scholar] [CrossRef]
  31. Otto, M.J.; van Woerden, R.A.M.; van der Valk, P.J.; Wijngaard, J.; van Bruggen, C.F.; Haas, C.; Buschow, K.H.J. Half-metallic ferromagnets. I. Structure and magnetic properties of NiMnSb and related inter-metallic compounds. J. Phys. Condens. Matter 1989, 1, 2341–2350. [Google Scholar] [CrossRef]
  32. Mejía, C.S.; Born, N.O.; Schiemer, J.A.; Felser, C.; Carpenter, M.A.; Nicklas, M. Strain and order-parameter coupling in Ni-Mn-Ga Heusler alloys from resonant ultrasound spectroscopy. Phys. Rev. B 2018, 97, 094410. [Google Scholar] [CrossRef] [Green Version]
  33. Seiner, H.; Kopecky, V.; Landa, M.; Heczko, O. Elasticity and magnetism of Ni2MnGa premartensitic tweed. Phys. Status Solidi B 2014, 251, 2097–2103. [Google Scholar] [CrossRef]
Figure 1. Plots of μ vs. T and /dT vs. T for (a) x = 0.02 and (b) x = 0.04.
Materials 11 02115 g001
Figure 2. The H/M dependences of M2 for (a) x = 0.02 and (b) x = 0.04. The dotted straight lines are included as a visual guide.
Materials 11 02115 g002
Figure 3. The H/M dependences of M3.7 for (a) x = 0.02 and (b) x = 0.04. The dotted straight lines are included as a visual guide.
Materials 11 02115 g003
Figure 4. The H/M dependences of M4 for (a) x = 0.02 and (b) x = 0.04. The dotted straight lines are included as a visual guide.
Materials 11 02115 g004
Figure 5. The generalized Rhodes-Wohlfarth plot (double logarithmic plot of peff/pS and TC/T0) for Ni2MnGa and other notable alloys and compounds. The dotted line indicates km = 1.4 as obtained from Equation (10).
Materials 11 02115 g005
Figure 6. The M2 dependence of magnetostriction for (a) x = 0.02 and (b) x = 0.04. The dotted straight lines are included as a visual guide.
Materials 11 02115 g006
Figure 7. The M4 dependence of magnetostriction for (a) x = 0.02 and (b) x = 0.04. The dotted straight lines are included as a visual guide.
Materials 11 02115 g007
Figure 8. The temperature dependencies of the magnetostriction for (a) x = 0.02 and (b) x = 0.04.
Materials 11 02115 g008
Figure 9. The e/a dependences of the maximum magnetostriction for Ni2MnGa-type alloys. Filled triangles: polycrystal, Matsui et al. [17,18]. Cross: single crystal, Matsui et al. [17]. Filled square: single crystal, Seiner et al. [33]. The dotted line is a fitted line.
Materials 11 02115 g009
Table 1. The spontaneous magnetic moment pS and the characteristic temperatures TC, TA, and T0 for Ni2+xMnGa1−x.
xpSB)TC (K)TA (K)T0 (K)
0.003.93375563245
0.023.79372566288
0.043.64366567345
Table 2. Basic magnetic parameters and km, as obtained from Equation (10).
TC (K)peffB)pSB)peff/pSTA (K)T0 (K)TC/T0kmReference
Ni2MnGa3754.75 *3.931.215632451.531.61This work, [26] *
Ni6233.30.65.51.76 × 1044.83 × 1030.1291.41[12]
MnSi302.20.45.32.08 × 1032310.131.88[21]
Ni3Al41.51.30.07517.33.09 × 1043.59 × 1030.0161.06[27]
Y(Co0.85Al0.15)2262.150.13815.60.7261.410.0181.08[28]
ZrZn2171.440.12128.83 × 1033210.0530.74[29]
UCoGe2.41.930.03949.55.92 × 1033620.00651.74[8]
UGe252.63.001.412.1344292.20.5711.61[8]
NpFe4P12231.551.351.1528516.41.401.44[30]
Table 3. The coefficients and standard deviations of the linear fitted plots obtained by means of the least squares method at TC for the magnetostriction ΔL/L by the equation ΔL/L = A + kMδ for δ = 2 or 4, as shown in Figure 5 and Figure 6, respectively. Both A and k are constants.
δ = 2δ = 4
x0.020.040.020.04
A3.60 × 10−51.65 × 10−73.29 × 10−5−7.06 × 10⁻⁷
Standard deviation of A±1.20 × 10⁻⁶
(3.3% of A)
±1.73 × 10⁻⁷
105% of A)
±1.04 × 10⁻⁶
(3.2% of A)
±2.72 × 10⁻⁷
(38% of A)
y0 = A/(Strain at 5 T)58%0.3%53%1.2%
k−7.62 × 10⁻⁸−3.93 × 10⁻¹¹−7.58 × 10⁻⁸−4.11 × 10⁻¹¹
Standard deviation of k±1.2 × 10⁻⁹
(1.5% of k)
±2.08 × 10⁻¹³
(0.5% of k)
±1.03 × 10⁻⁹
(1.4% of k)
±3.36 × 10⁻¹³
(0.8% of k)

