Studies on Mathematical Models of Wet Adhesion and Lifetime Prediction of Organic Coating/Steel by Grey System Theory


Abstract
:1. Introduction
2. Results
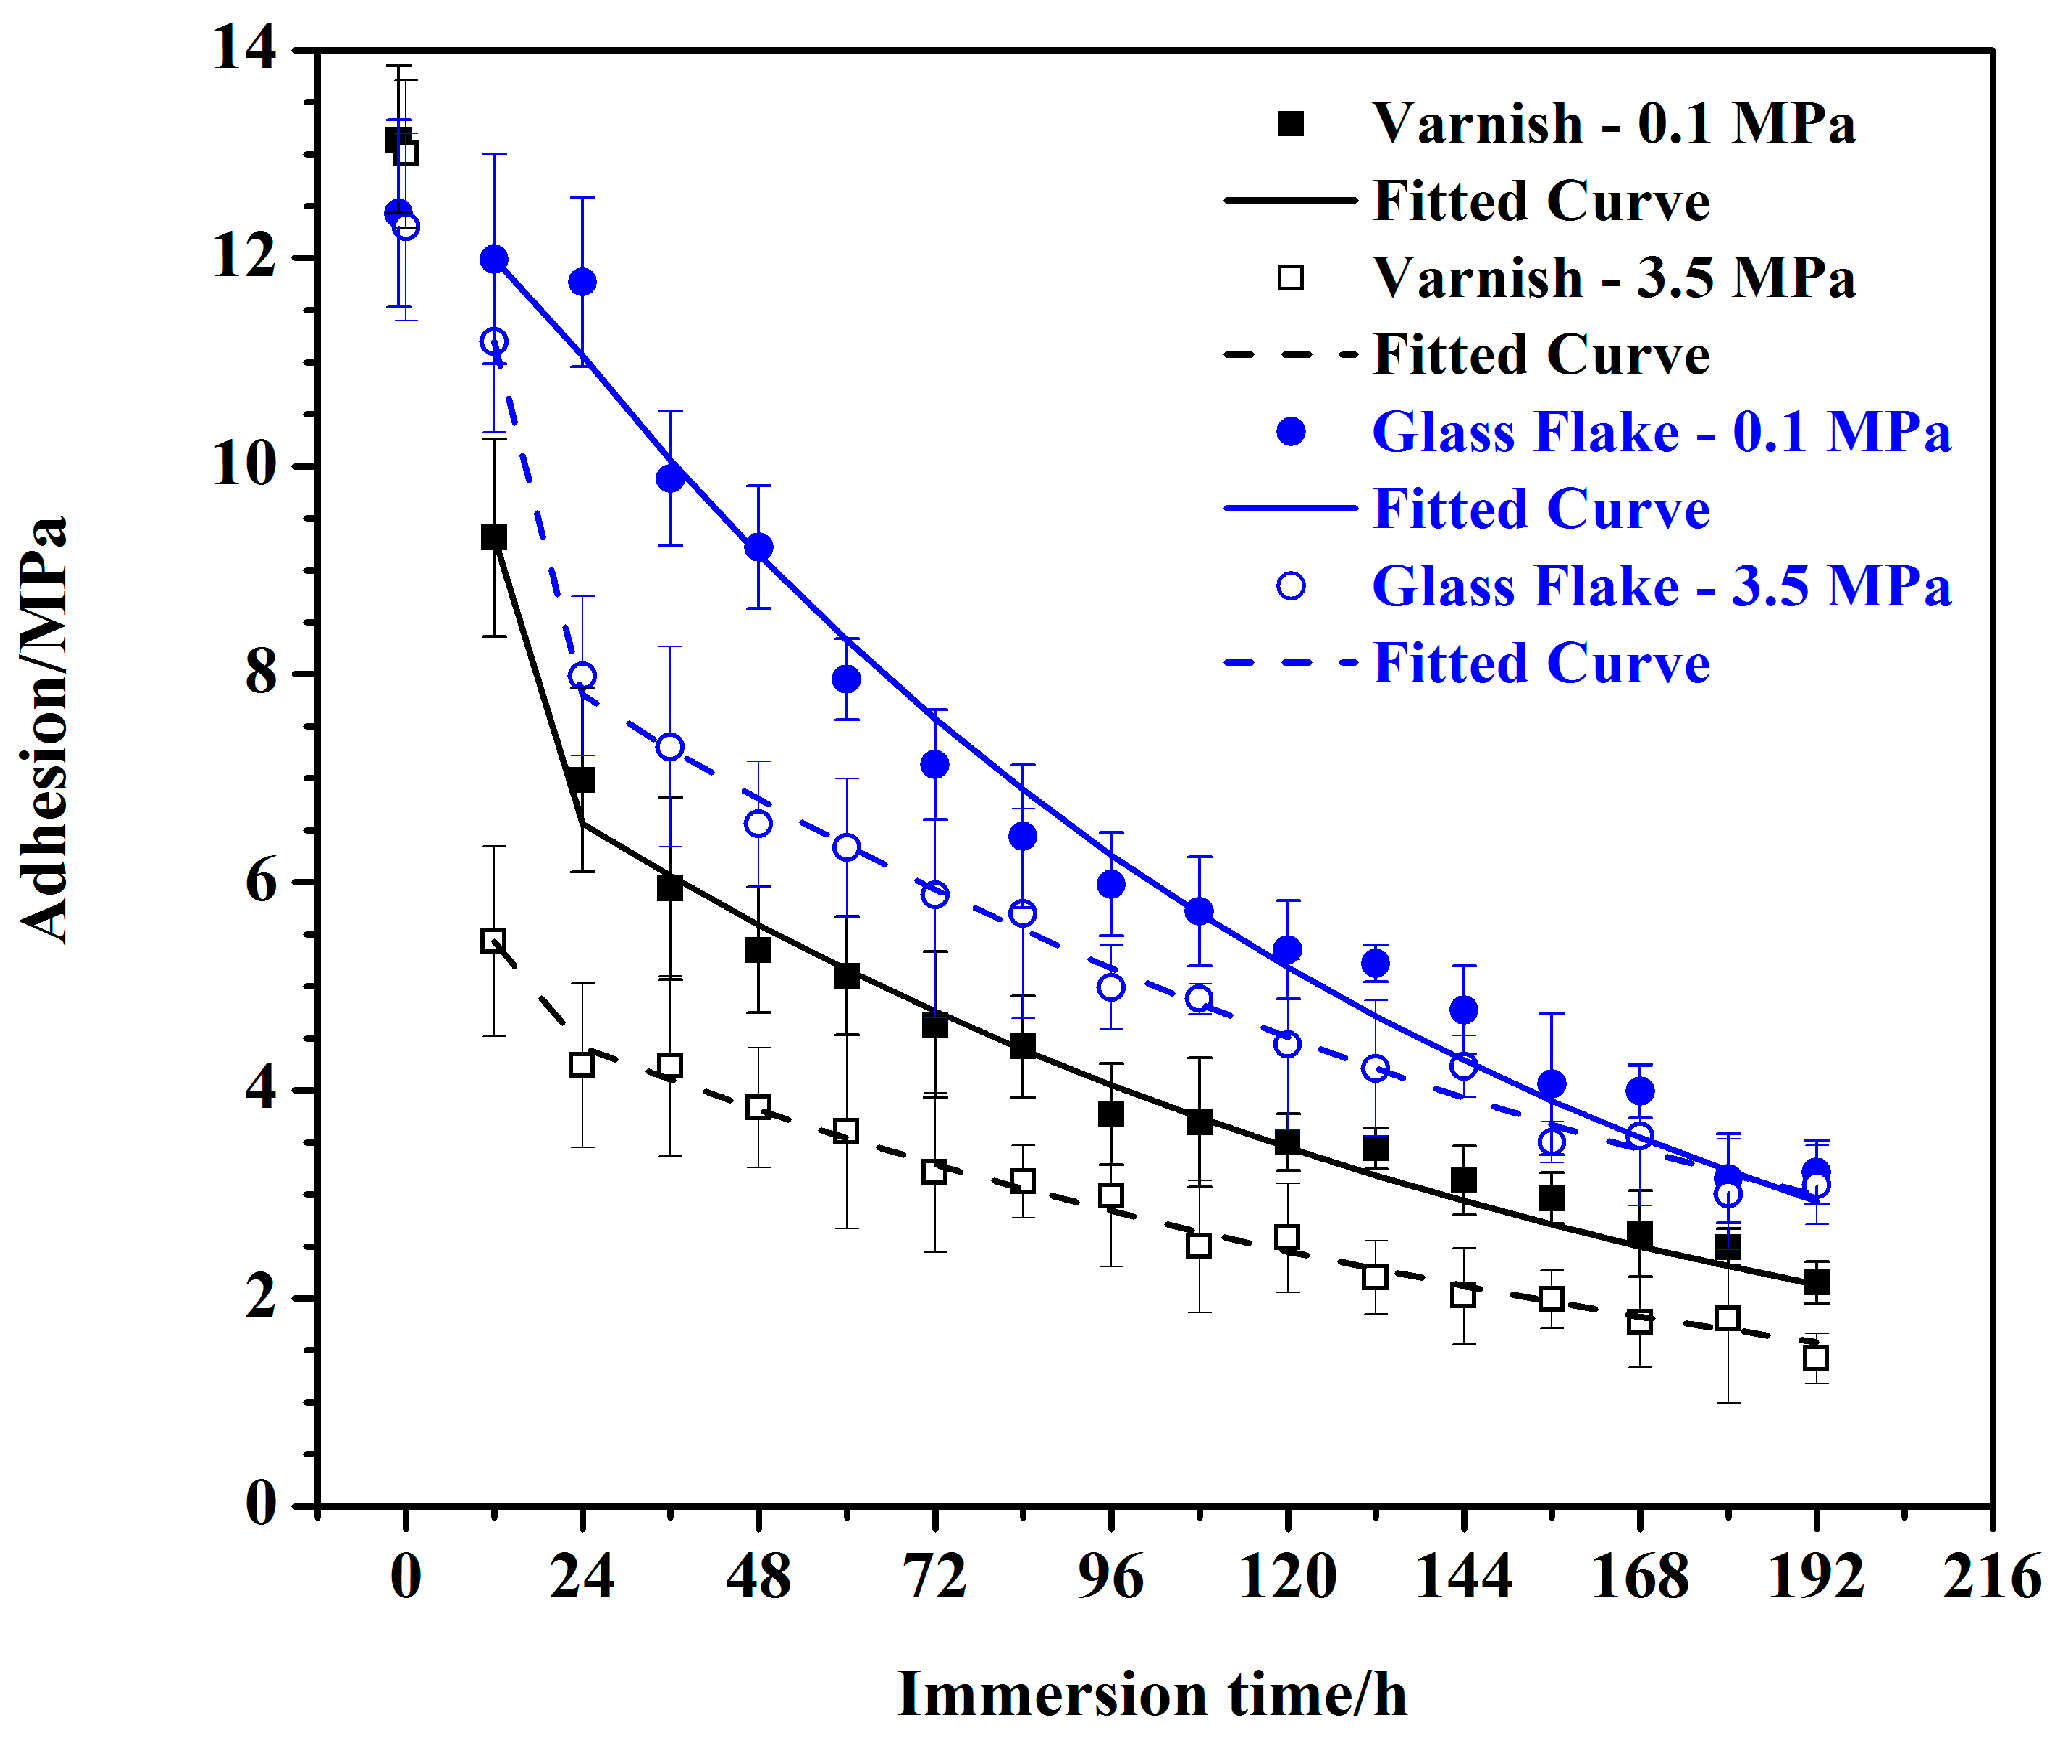
2.1. Adhesion Results of the Coating/Steel Systems
2.2. Establishment of the GM (1, 1) Models by GST
3. Discussion
3.1. Precision Assessments of the Models
3.2. Lifetime Prediction Based on GM (1, 1)
4. Materials and Methods
4.1. Sample Preparation
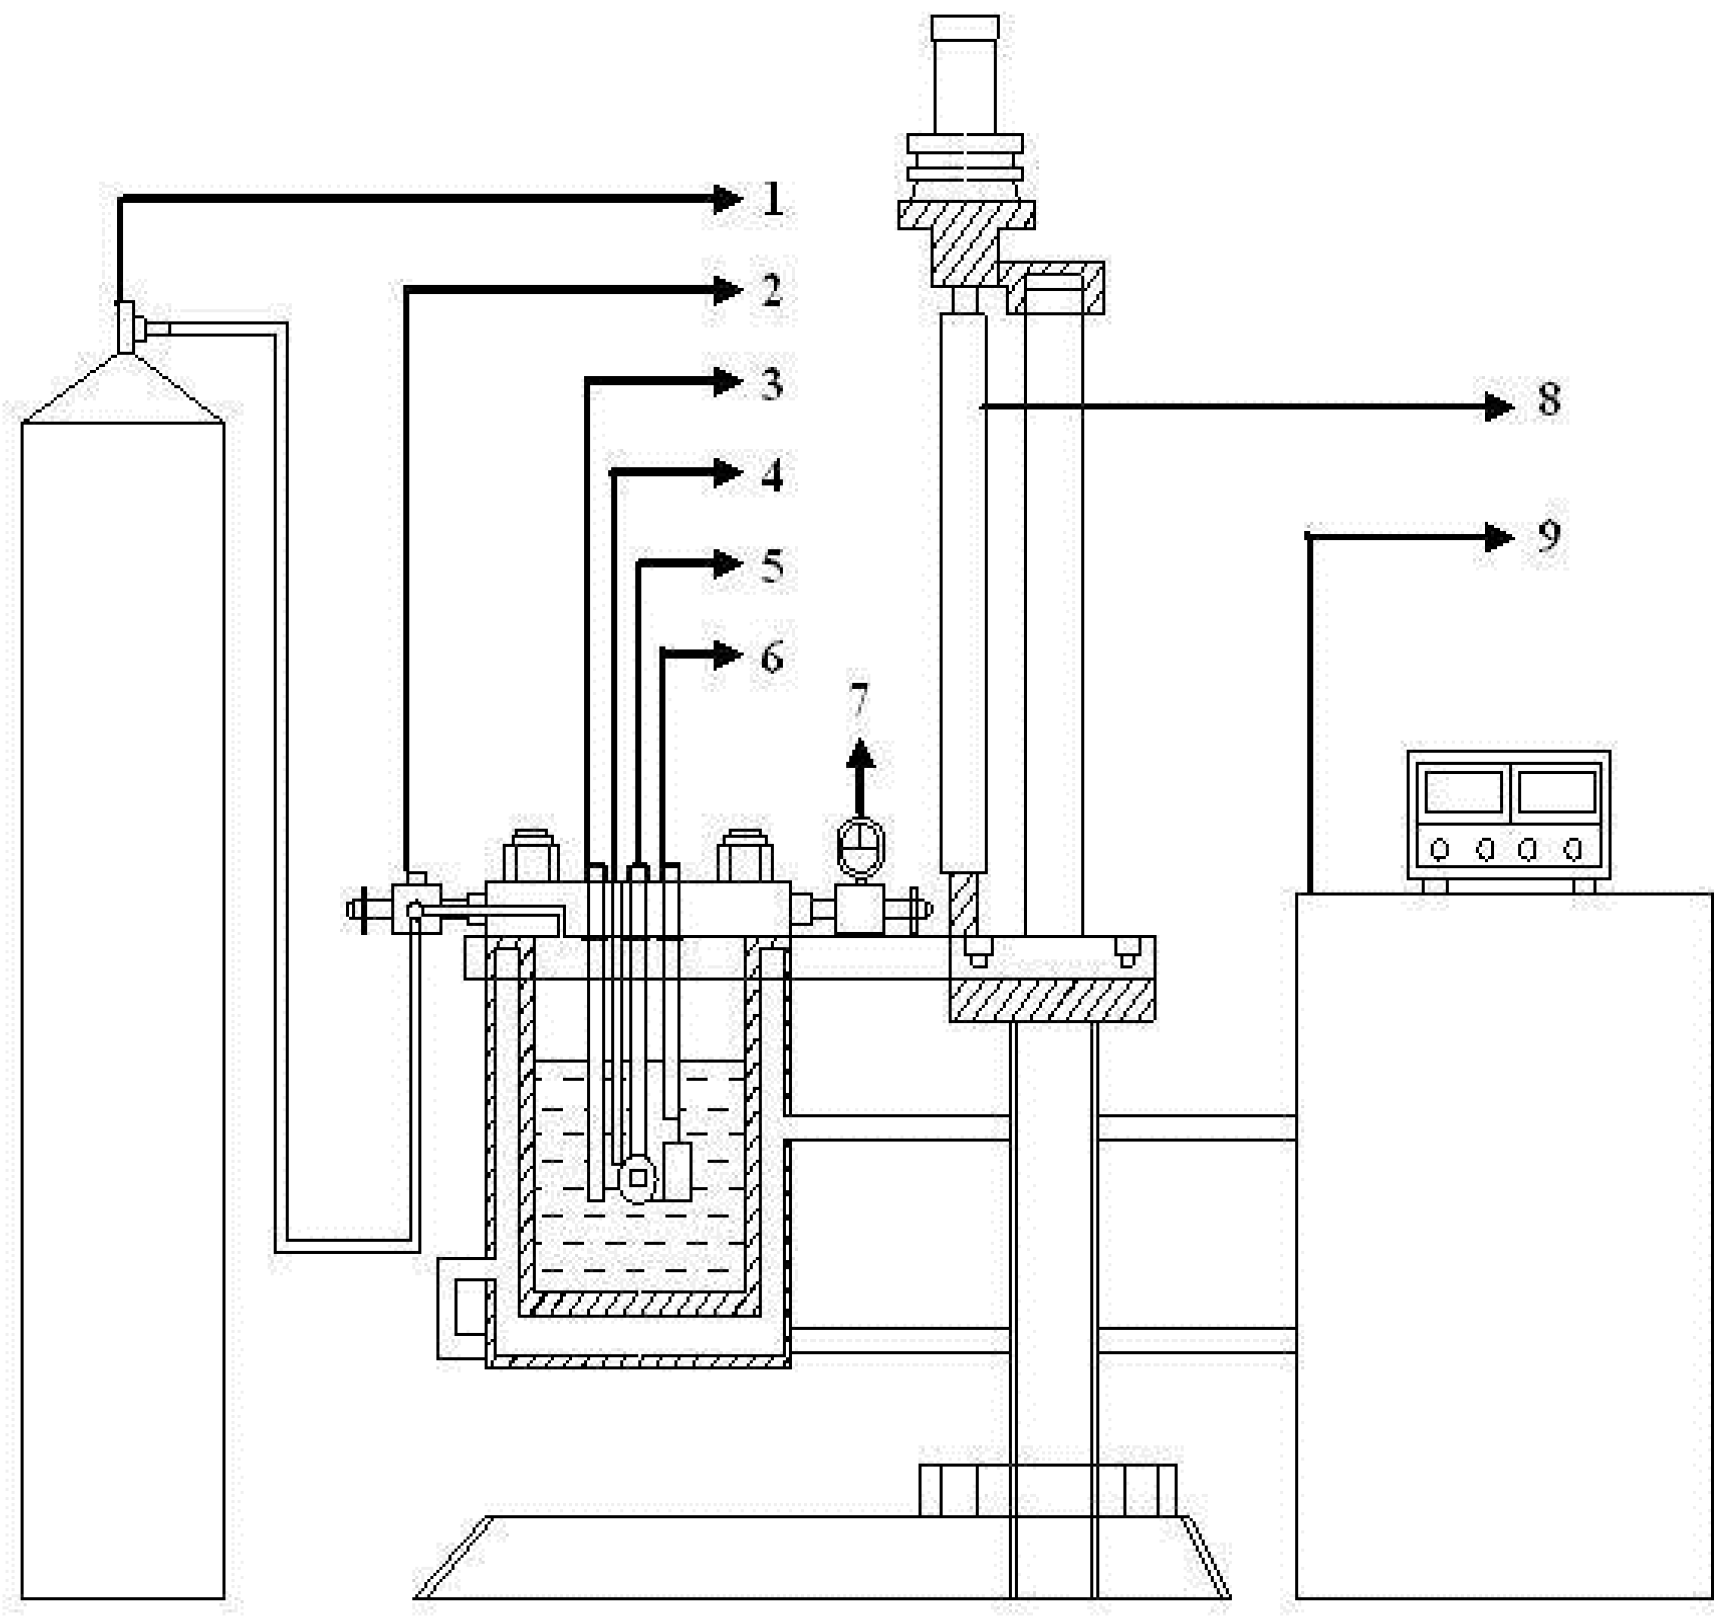
4.2. Experimental Setup
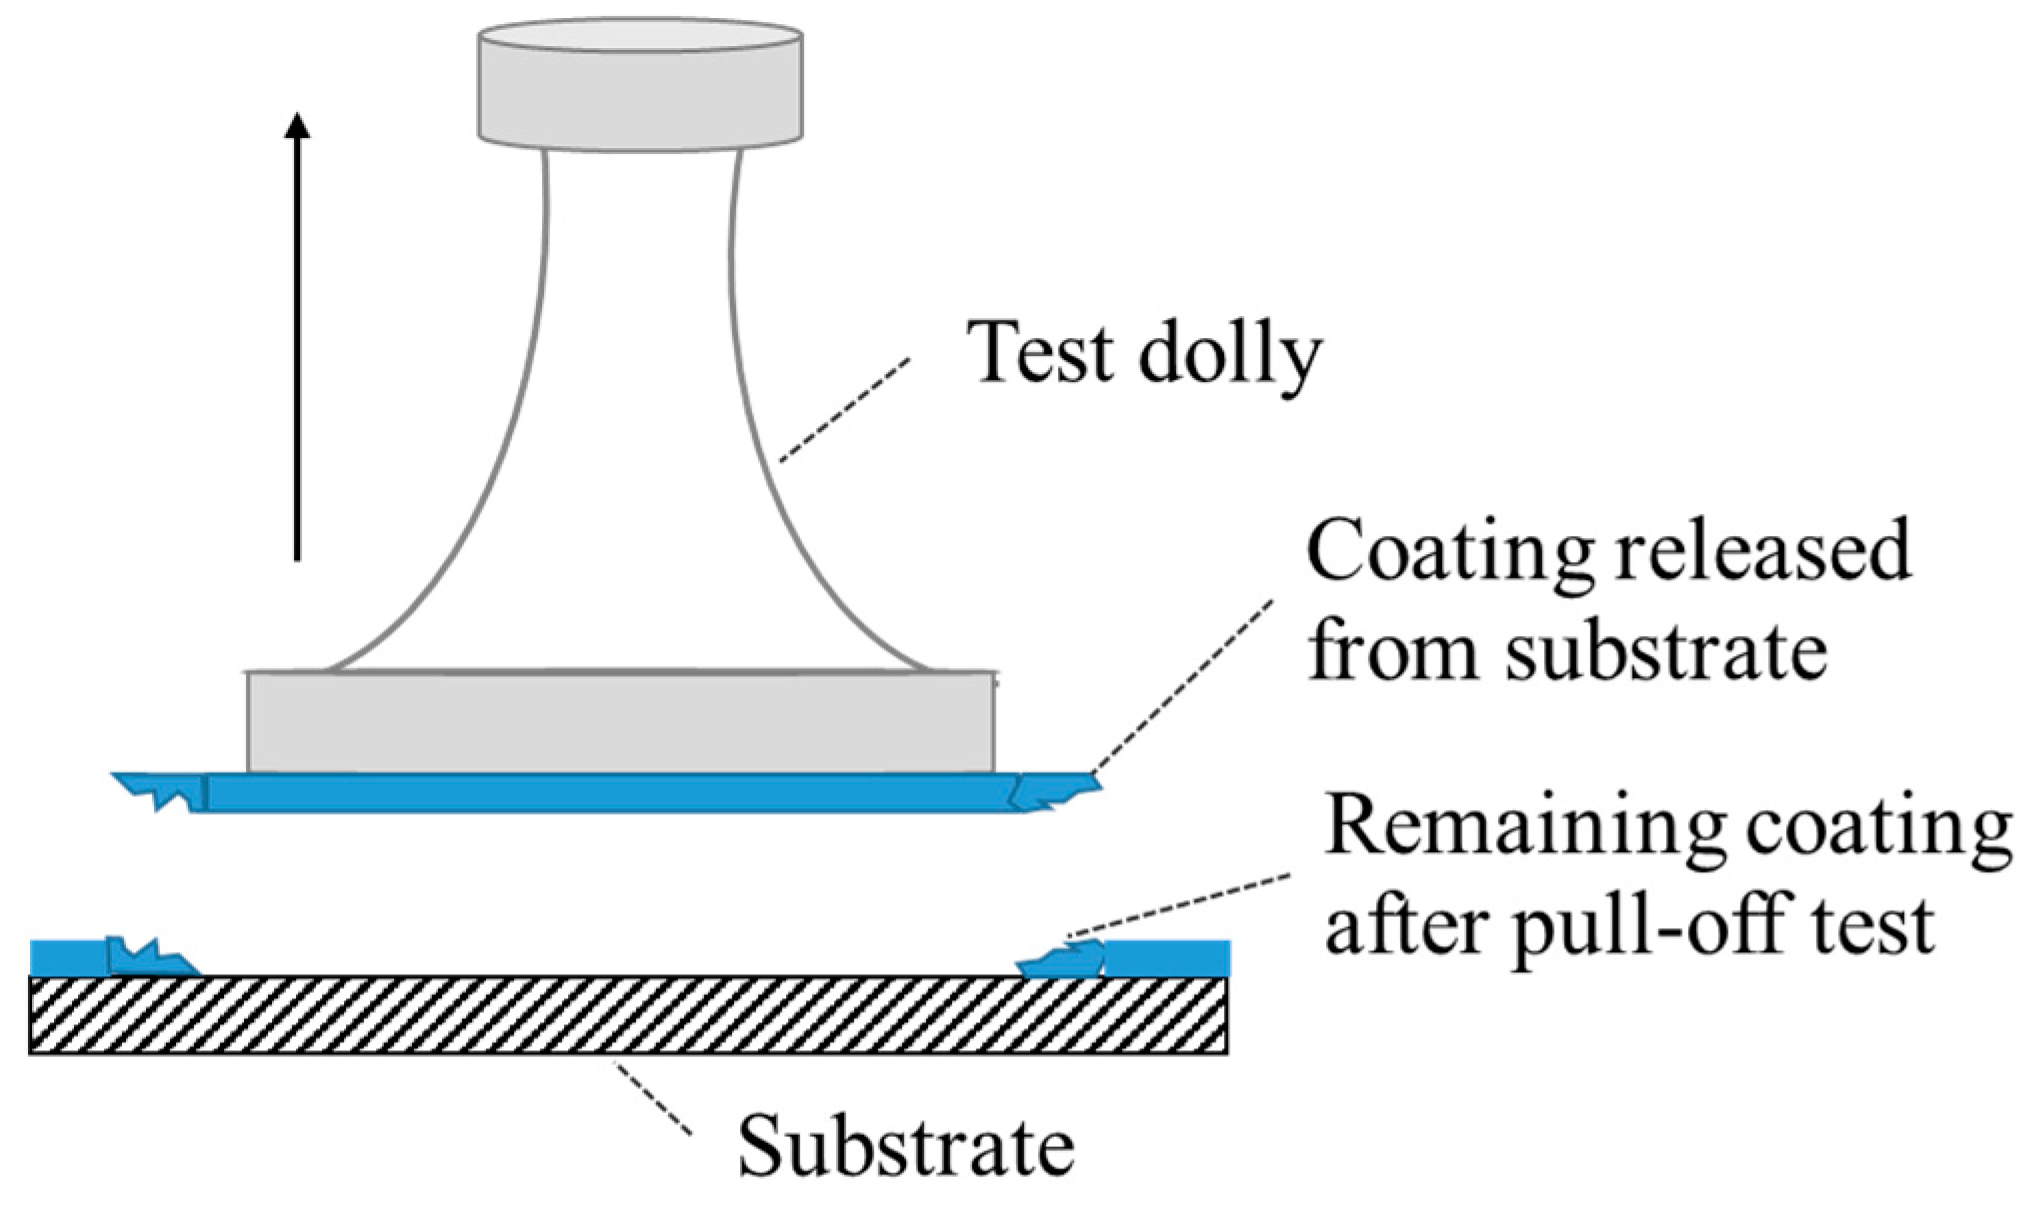
4.3. Wet Adhesion Test
5. Conclusions
Acknowledgments
Author Contributions
Conflicts of Interest
References
- Akbarinezhad, E.; Bahremandi, M.; Faridi, H.R.; Rezaei, F. Another approach for ranking and evaluating organic paint coatings via electrochemical impedance spectroscopy. Corros. Sci. 2009, 51, 356–363. [Google Scholar] [CrossRef]
- Wicks, Z.W.; Jones, F.N.; Pappas, S.P. Organic Coatings Science and Technology, 2nd ed.; John Wiley & Sons, Inc.: New York, NY, USA, 1999. [Google Scholar]
- Dobkowski, Z.; Rudnik, E. Lifetime prediction for polymers via the temperature of initial decomposition. J. Therm. Anal. Calorim. 1997, 48, 1393–1400. [Google Scholar] [CrossRef]
- Doherty, M.; Sykes, J.M. A quantitative study of blister growth on lacquered food cans by scanning acoustic microscopy. Corros. Sci. 2008, 50, 2755–2772. [Google Scholar] [CrossRef]
- Cmaitland, C.; Mayne, J.E. Factors affecting the electrolytic resistance of polymer films. Off. Digest. 1962, 34, 972–991. [Google Scholar]
- Bierwagen, G.; Tallman, D.; Li, J.P.; He, L.Y.; Jeffcoate, C. EIS studies of coated metals in accelerated exposure. Prog. Org. Coat. 2003, 46, 148–157. [Google Scholar] [CrossRef]
- Shevchuk, P.; Galapats, B.; Shevchuk, V. Mathematical modelling of aging and lifetime prediction of lacquer-paint coatings in sea water. Int. J. Eng. Sci. 2000, 38, 1869–1894. [Google Scholar] [CrossRef]
- Liu, L.; Cui, Y.; Li, Y.; Zhang, T.; Wang, F. Failure behavior of nano-SiO2 fillers epoxy coating under hydrostatic pressure. Electrochim. Acta 2012, 62, 42–50. [Google Scholar] [CrossRef]
- Liu, Y.; Wang, J.; Liu, L.; Li, Y.; Wang, F. Study of the failure mechanism of an epoxy coating system under high hydrostatic pressure. Corros. Sci. 2013, 74, 59–70. [Google Scholar] [CrossRef]
- Christophe, L.P.; Colette, L.; Nadine, P. Structure of waterborne coatings by electrochemical impedance spectroscopy and a thermostimulated current method: Influence of fillers. Prog. Org. Coat. 2000, 39, 167–175. [Google Scholar]
- Funke, W. Problems and progress in organic coatings science and technology. Prog. Org. Coat. 1997, 31, 5–9. [Google Scholar] [CrossRef]
- Arslanov, V.V.; Funke, W. The effect of water on the adhesion of organic coatings on aluminum. Prog. Org. Coat. 1988, 15, 355–363. [Google Scholar] [CrossRef]
- Zand, B.N.; Mahdavian, M. Corrosion and adhesion study of polyurethane coating on silane pretreated aluminum. Surf. Coat. Technol. 2009, 203, 1677–1681. [Google Scholar] [CrossRef]
- Singh, B.; Chang, L.W.; DiLeone, R.R.; Siesel, D.R. Novel wet adhesion monomers for use in latex paints. Prog. Org. Coat. 1998, 34, 214–219. [Google Scholar] [CrossRef]
- Negele, O.; Funke, W. Internal stress and wet adhesion of organic coatings. Prog. Org. Coat. 1996, 28, 285–289. [Google Scholar] [CrossRef]
- Nakamura, K.; Maruno, T.; Sasaki, S. Theory for the decay of the wet shear strength of adhesion and its application to metal/epoxy/ metal joints. Int. J. Adhes. Adhes. 1987, 7, 97–102. [Google Scholar] [CrossRef]
- Deng, J.L. Control problems of grey systems. Syst. Control Lett. 1982, 1, 288–294. [Google Scholar]
- Liu, W.L.; Chien, W.T.; Jiang, M.H.; Chen, W.J. Study of Nd:YAG laser annealing of electroless Ni–P film on spiegel-iron plate by Taguchi method and grey system theory. J. Alloy. Compd. 2010, 495, 97–103. [Google Scholar] [CrossRef]
- Huang, K.Y.; Jane, C.J. A hybrid model for stock market forecasting and portfolio selection based on ARX, grey system and RS theories. Expert Syst. Appl. 2009, 36, 5387–5392. [Google Scholar] [CrossRef]
- He, S.; Li, Y.; Wang, R.Z. A new approach to performance analysis of ejector refrigeration system using grey system theory. Appl. Therm. Eng. 2009, 29, 1592–1597. [Google Scholar] [CrossRef]
- Ma, F.Y.; Wang, W.H. Prediction of pitting corrosion behavior for stainless SUS 630 based on grey system theory. Mater. Lett. 2007, 61, 998–1001. [Google Scholar] [CrossRef]
- Trivedi, H.V.; Singh, J.K. Application of Grey System Theory in the development of a runoff prediction model. Biosyst. Eng. 2005, 92, 521–526. [Google Scholar] [CrossRef]
- W, X.M.; Chen, Z.K.; Yang, C.Z.; Chen, Y.M. Gray predicting theory and application of energy consumption of building heat-moisture system. Build. Environ. 1999, 34, 417–420. [Google Scholar]
- Chen, L.B.; Hontoir, Y.; Huang, D.X.; Zhang, J.; Morris, A.J. Combining first principles with black-box techniques for reaction systems. Control Eng. Pract. 2004, 12, 819–826. [Google Scholar] [CrossRef]
- Banerjee, I.; Pal, S.; Maiti, S. Computationally efficient black-box modeling for feasibility analysis. Comput. Chem. Eng. 2010, 34, 1515–1521. [Google Scholar] [CrossRef]
- Li, C.S.; Zhou, J.Z.; Li, Q.Q.; An, X.L.; Xiang, X.Q. A new T-S fuzzy-modeling approach to identify a boiler-turbine system. Expert Syst. Appl. 2010, 37, 2214–2221. [Google Scholar] [CrossRef]
- Liao, G.C.; Tsao, T.P. Using chaos search immune genetic and fuzzy system for short-term unit commitment algorithm. Int. J. Electr. Power Energy Syst. 2006, 28, 1–12. [Google Scholar] [CrossRef]
- Lisboa, P.J.; Taktak, A.F. The use of artificial neural networks in decision support in cancer: A systematic review. Neural Netw. 2006, 19, 408–415. [Google Scholar] [CrossRef] [PubMed]
- Vasudevan, M.; Rao, B.P.C.; Venkatraman, B.; Jayakumar, T.; Raj, B. Artificial neural network modelling for evaluating austenitic stainless steel and Zircaloy-2 welds. J. Mater. Process. Technol. 2005, 169, 396–400. [Google Scholar] [CrossRef]
- Eyercioglu, O.; Kanca, E.; Pala, M.; Ozbay, E. Prediction of martensite and austenite start temperatures of the Fe-based shape memory alloys by artificial neural networks. J. Mater. Process. Technol. 2008, 200, 146–152. [Google Scholar] [CrossRef]
- Kayacan, E.; Ulutas, B.; Kaynak, O. Grey system theory-based models in time series prediction. Expert Syst. Appl. 2010, 37, 1784–1789. [Google Scholar] [CrossRef]
- Paints and Varnishes-Determination of Film Thickness; ISO 2808; ISO: Geneva, Switzerland, 1997.
- Mackay, D.; Shiu, W.Y. A critical-review of henrys law constants for chemicals of environmental interest. J. Phys. Chem. Ref. Data 1981, 10, 1175–1199. [Google Scholar] [CrossRef]
- Standard Test Method for Pull-Off Strength of Coatings Using Portable Adhesion Testers; ASTM D 4541-02; ASTM International: West Conshohocken, PA, USA, 2002.


| Tg/°C | Before Immersion | 720 h–0.1 MPa | 720 h–3.5 MPa |
|---|---|---|---|
| Epoxy varnish coating | 84 | 72 | 63 |
| Epoxy glass flake coating | 97 | 88 | 82 |
| System | a | u | GM (1, 1) Formula |
|---|---|---|---|
| EV coating-0.1 MPa | 0.0804 | 7.5778 | 7.11exp[−6.7 × 10⁻³(t − 12)] |
| EV coating-3.5 MPa | 0.0734 | 4.9708 | 4.74exp[−6.1 × 10⁻³(t − 12)] |
| EGF coating-0.1 MPa | 0.0948 | 12.7330 | 12.16exp[−7.9 × 10⁻³(t − 12)] |
| EGF coating-3.5 MPa | 0.0685 | 8.8367 | 8.35exp[−5.7 × 10⁻³(t − 12)] |
| Immersion Time/h | EV-0.1 MPa | EV-3.5 MPa | EGF-0.1 MPa | EGF-3.5 MPa |
|---|---|---|---|---|
| 12 | 0.00 | 0.00 | 0.00 | 0.00 |
| 24 | 6.02 | −4.01 | 6.42 | 2.31 |
| 36 | −2.02 | 3.07 | −1.79 | 0.27 |
| 48 | −4.49 | 0.52 | 0.77 | −3.53 |
| 60 | −1.18 | 1.67 | −4.56 | −0.31 |
| 72 | −2.81 | −2.49 | −5.81 | −0.84 |
| 84 | 0.68 | 2.24 | −6.53 | 2.89 |
| 96 | −7.43 | 4.70 | −4.47 | −3.48 |
| 108 | −1.36 | −5.6 | 0.35 | 1.04 |
| 120 | 1.43 | 5.04 | 3.28 | −1.55 |
| 132 | 7.56 | −3.64 | 10.83 | 0.00 |
| 144 | 6.07 | −4.95 | 11.19 | 7.63 |
| 156 | 8.45 | 1.01 | 4.10 | −4.63 |
| 168 | 4.58 | −2.82 | 12.40 | 3.79 |
| 180 | 7.23 | 5.56 | −2.48 | −6.25 |
| 192 | 0.93 | −11.27 | 9.56 | 3.34 |
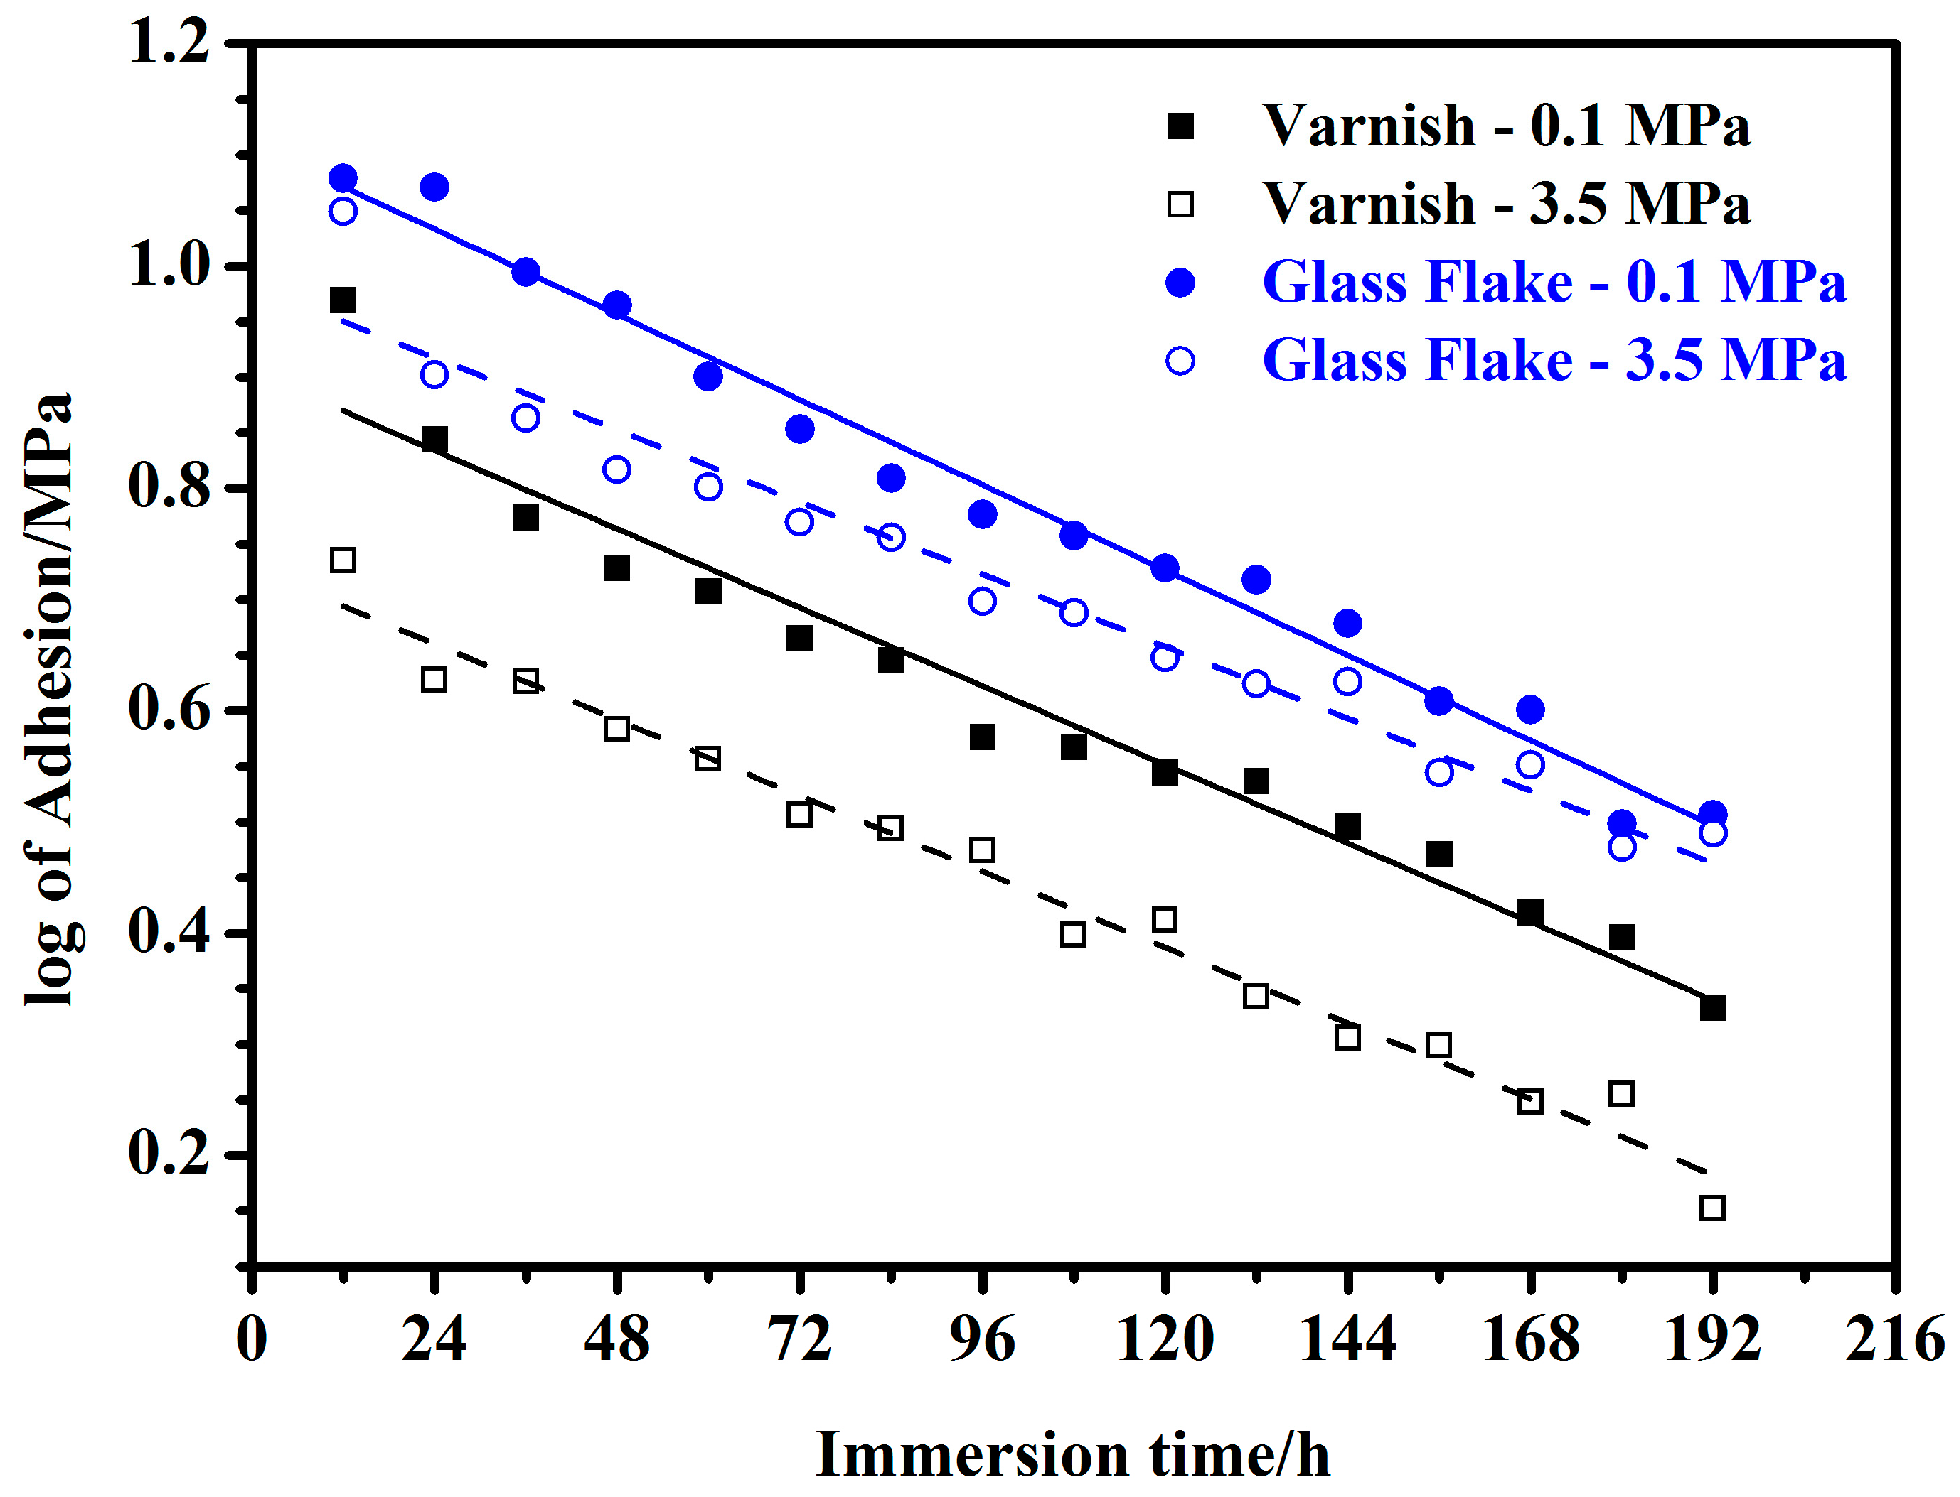
| System | GM (1, 1) Model | Log of Adhesion-t Fitting |
|---|---|---|
| EV-0.1 MPa | 0.0389 | 0.0567 |
| EV-3.5 MPa | 0.0366 | 0.0405 |
| EGF-0.1 MPa | 0.0528 | 0.0435 |
| EGF-3.5 MPa | 0.0262 | 0.0516 |
| Accuracy Grade | C | p |
|---|---|---|
| 1st (Excellent) | ≤0.35 | ≥0.95 |
| 2nd (Good) | 0.35 < C ≤ 0.50 | 0.95 > P ≥ 0.80 |
| 3rd (Reasonable) | 0.50 < C ≤ 0.65 | 0.80 > P ≥ 0.70 |
| 4th (Incorrect) | >0.65 | <0.70 |
| System | EV-0.1 MPa | EV-3.5 MPa | ||
|---|---|---|---|---|
| Critical wet adhesion/MPa | 1.1 | 0.5 | 1.1 | 0.5 |
| Actual lifetime/h | 290 | 407 | 253 | 377 |
| Predicted value of GM (1, 1)/h | 291 | 408 | 251 | 380 |
| Predicted value of log-linear fitting/h | 293 | 410 | 242 | 362 |
© 2017 by the authors. Licensee MDPI, Basel, Switzerland. This article is an open access article distributed under the terms and conditions of the Creative Commons Attribution (CC BY) license (http://creativecommons.org/licenses/by/4.0/).
Share and Cite
Meng, F.; Liu, Y.; Liu, L.; Li, Y.; Wang, F. Studies on Mathematical Models of Wet Adhesion and Lifetime Prediction of Organic Coating/Steel by Grey System Theory. Materials 2017, 10, 715. https://doi.org/10.3390/ma10070715
Meng F, Liu Y, Liu L, Li Y, Wang F. Studies on Mathematical Models of Wet Adhesion and Lifetime Prediction of Organic Coating/Steel by Grey System Theory. Materials. 2017; 10(7):715. https://doi.org/10.3390/ma10070715
Chicago/Turabian StyleMeng, Fandi, Ying Liu, Li Liu, Ying Li, and Fuhui Wang. 2017. "Studies on Mathematical Models of Wet Adhesion and Lifetime Prediction of Organic Coating/Steel by Grey System Theory" Materials 10, no. 7: 715. https://doi.org/10.3390/ma10070715
APA StyleMeng, F., Liu, Y., Liu, L., Li, Y., & Wang, F. (2017). Studies on Mathematical Models of Wet Adhesion and Lifetime Prediction of Organic Coating/Steel by Grey System Theory. Materials, 10(7), 715. https://doi.org/10.3390/ma10070715