
Bearing Fault Detection Based on Empirical Wavelet Transform and Correlated Kurtosis by Acoustic Emission

Abstract
:1. Introduction
2. Introduction to the Theory
2.1. Empirical Wavelet Transform
2.2. Correlated Kurtosis
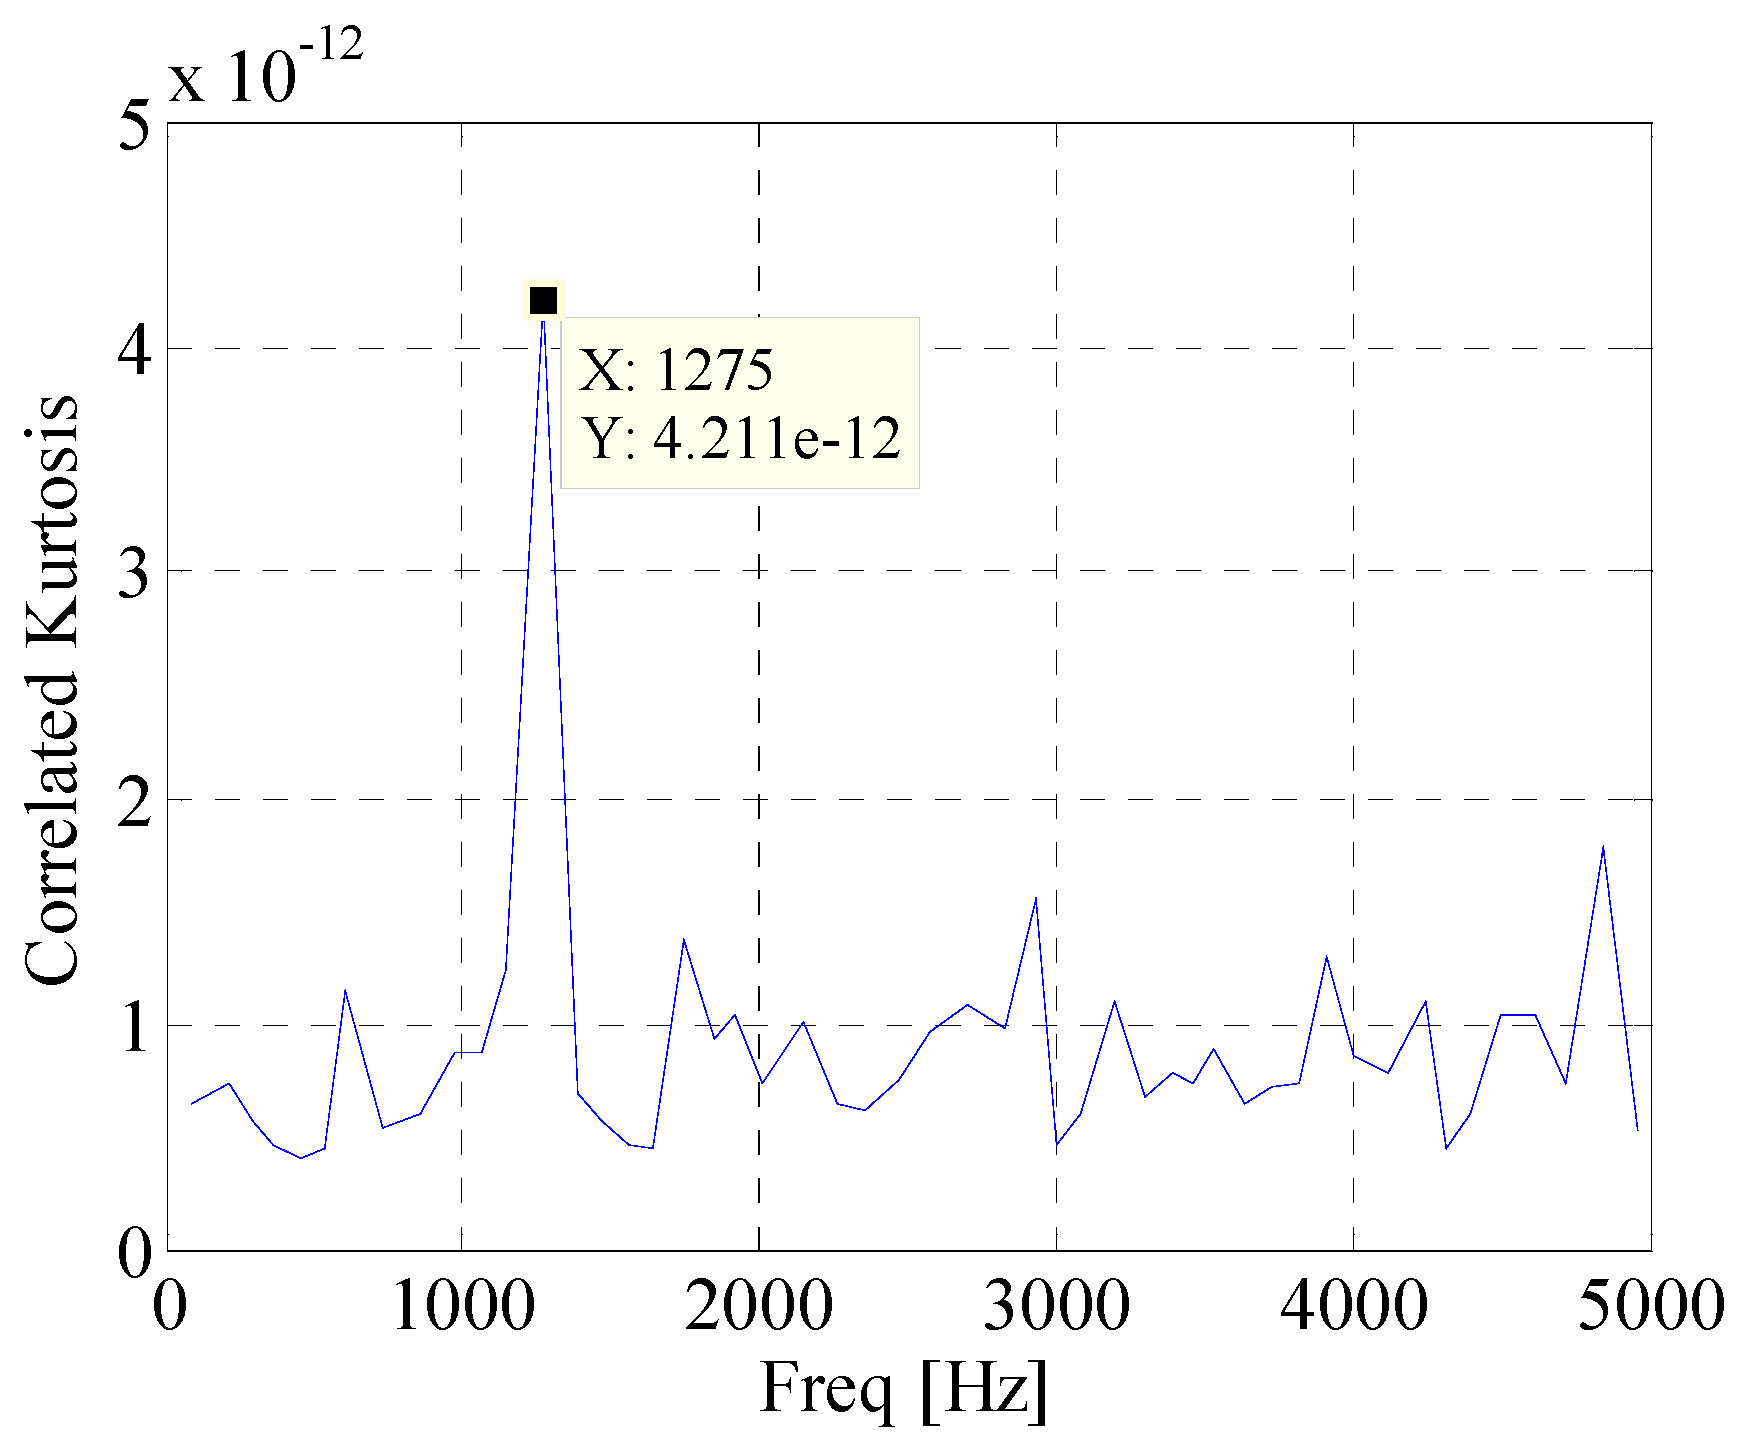
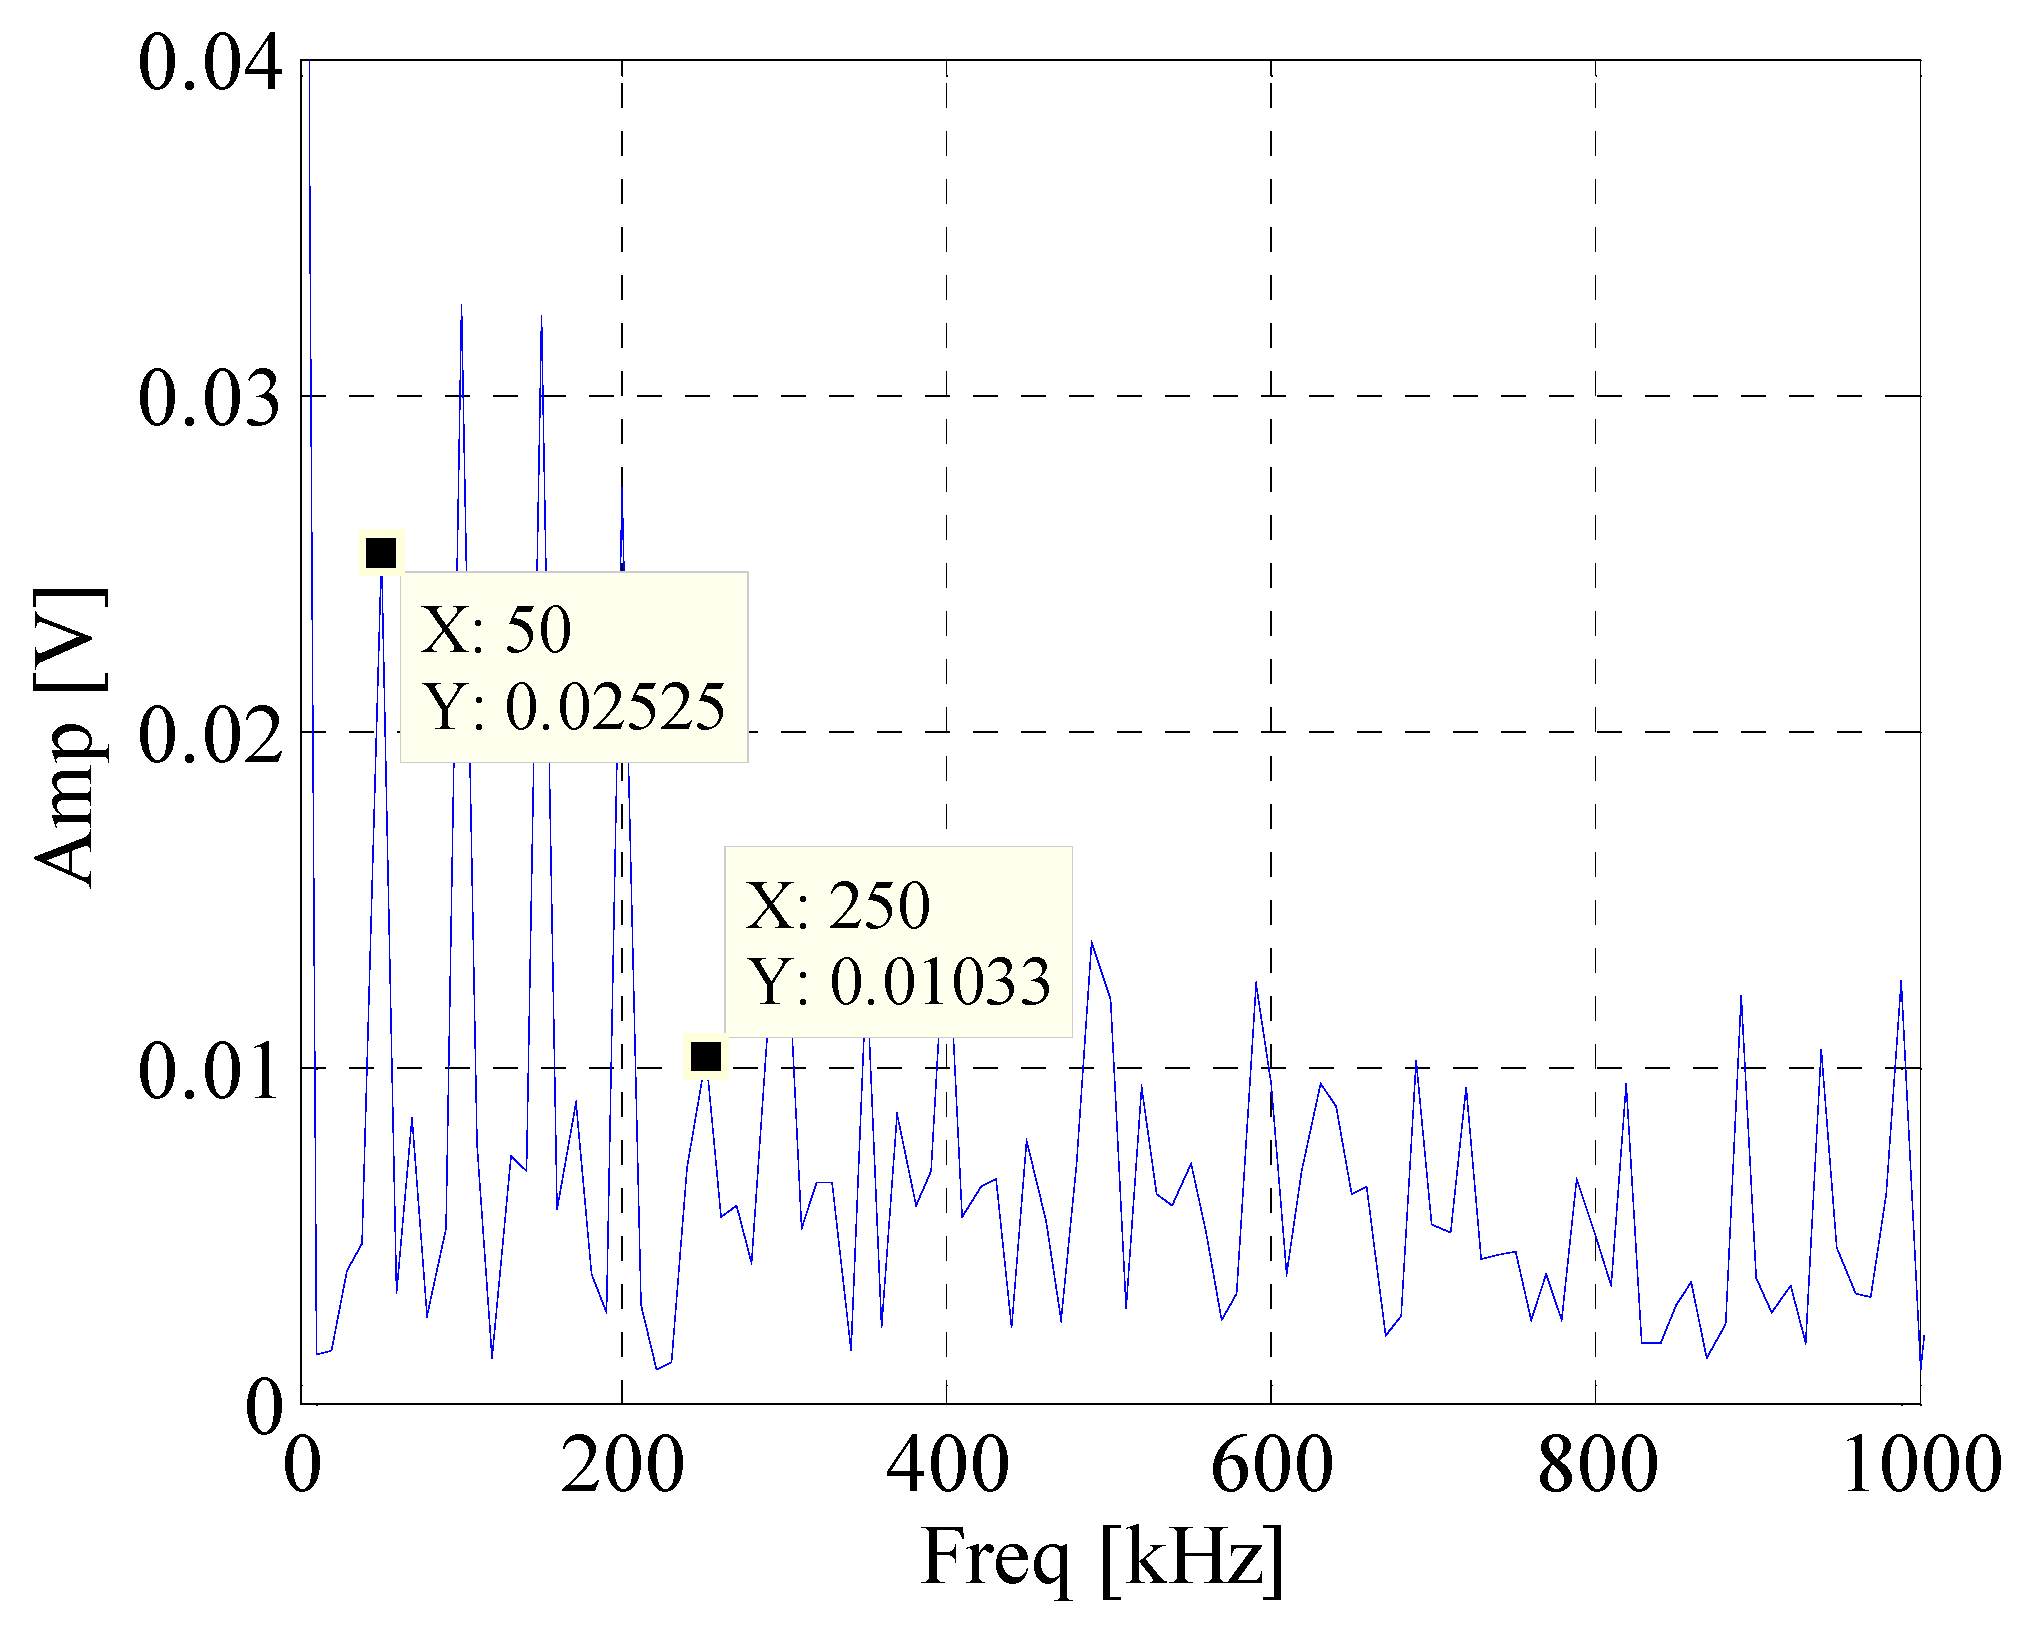
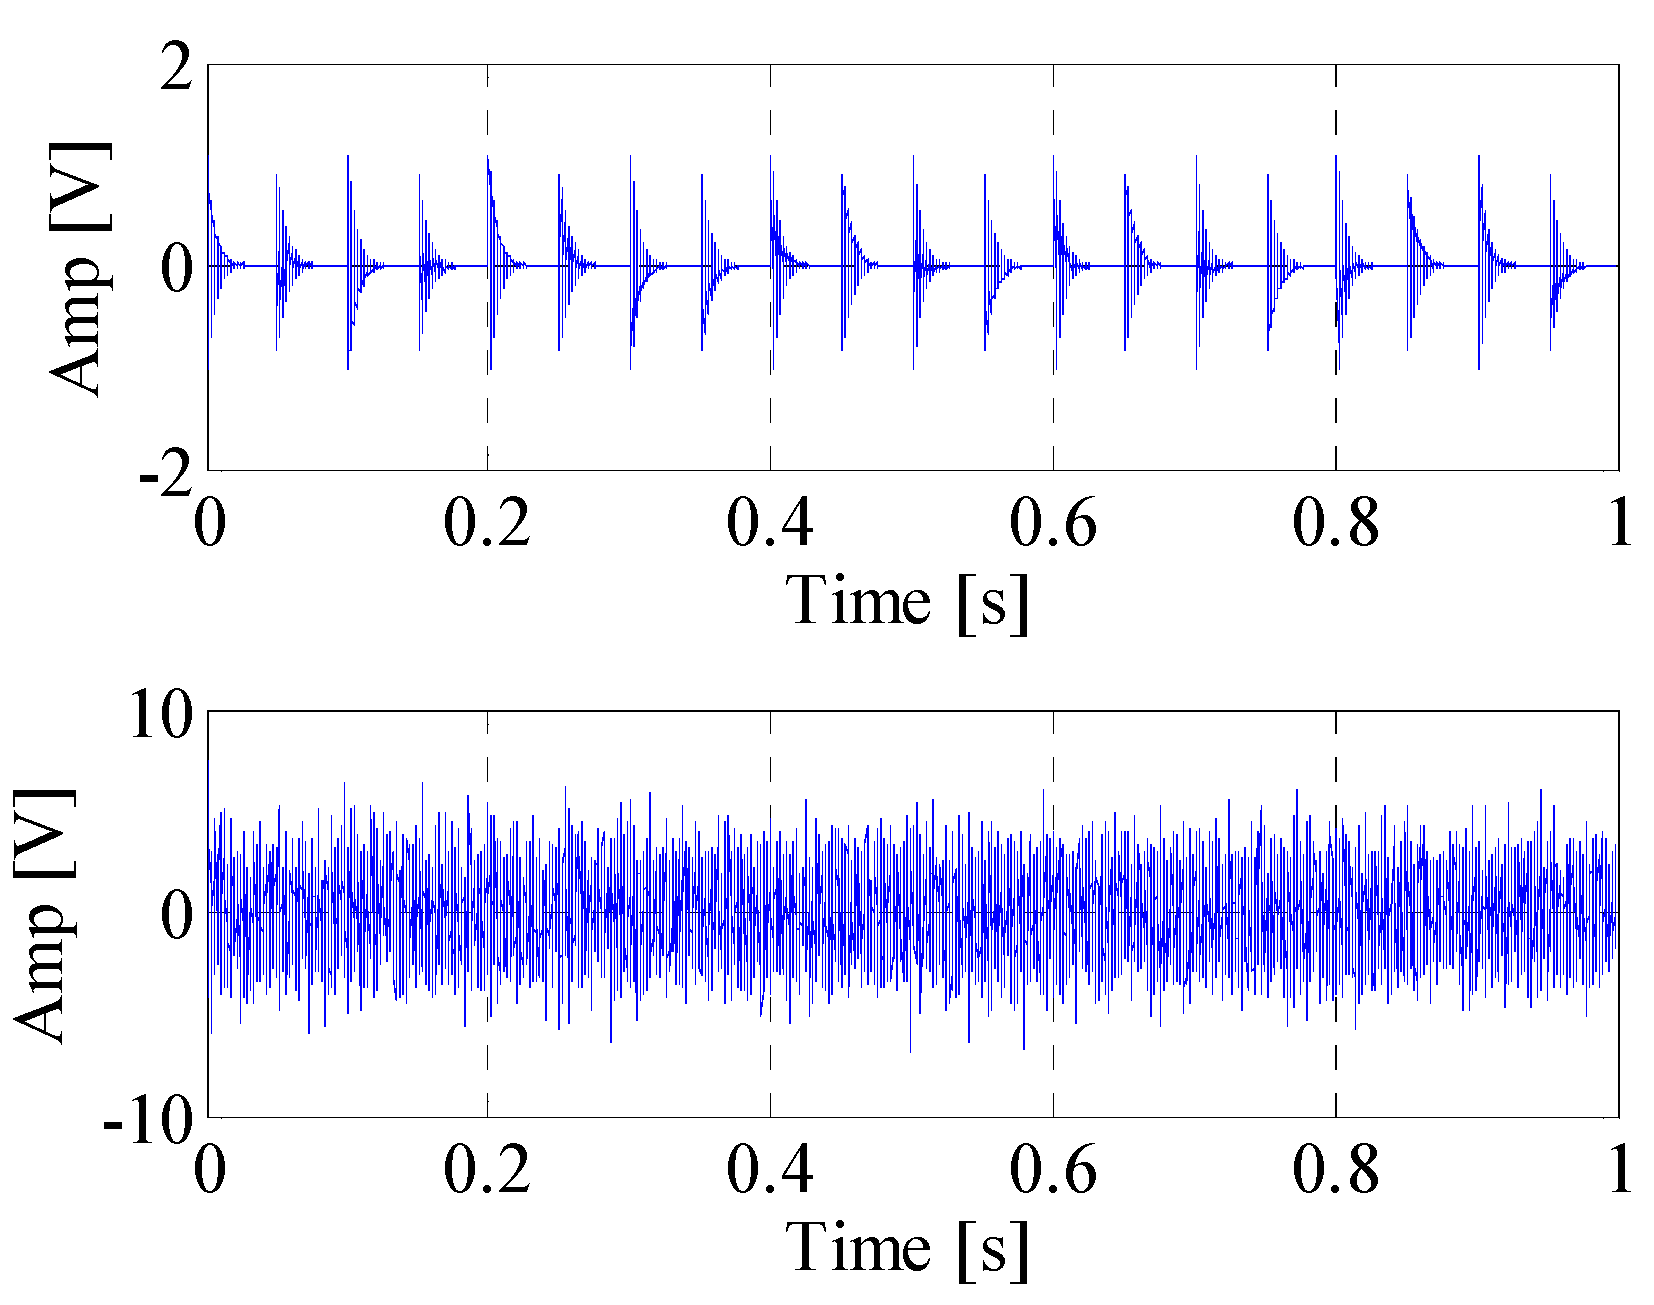
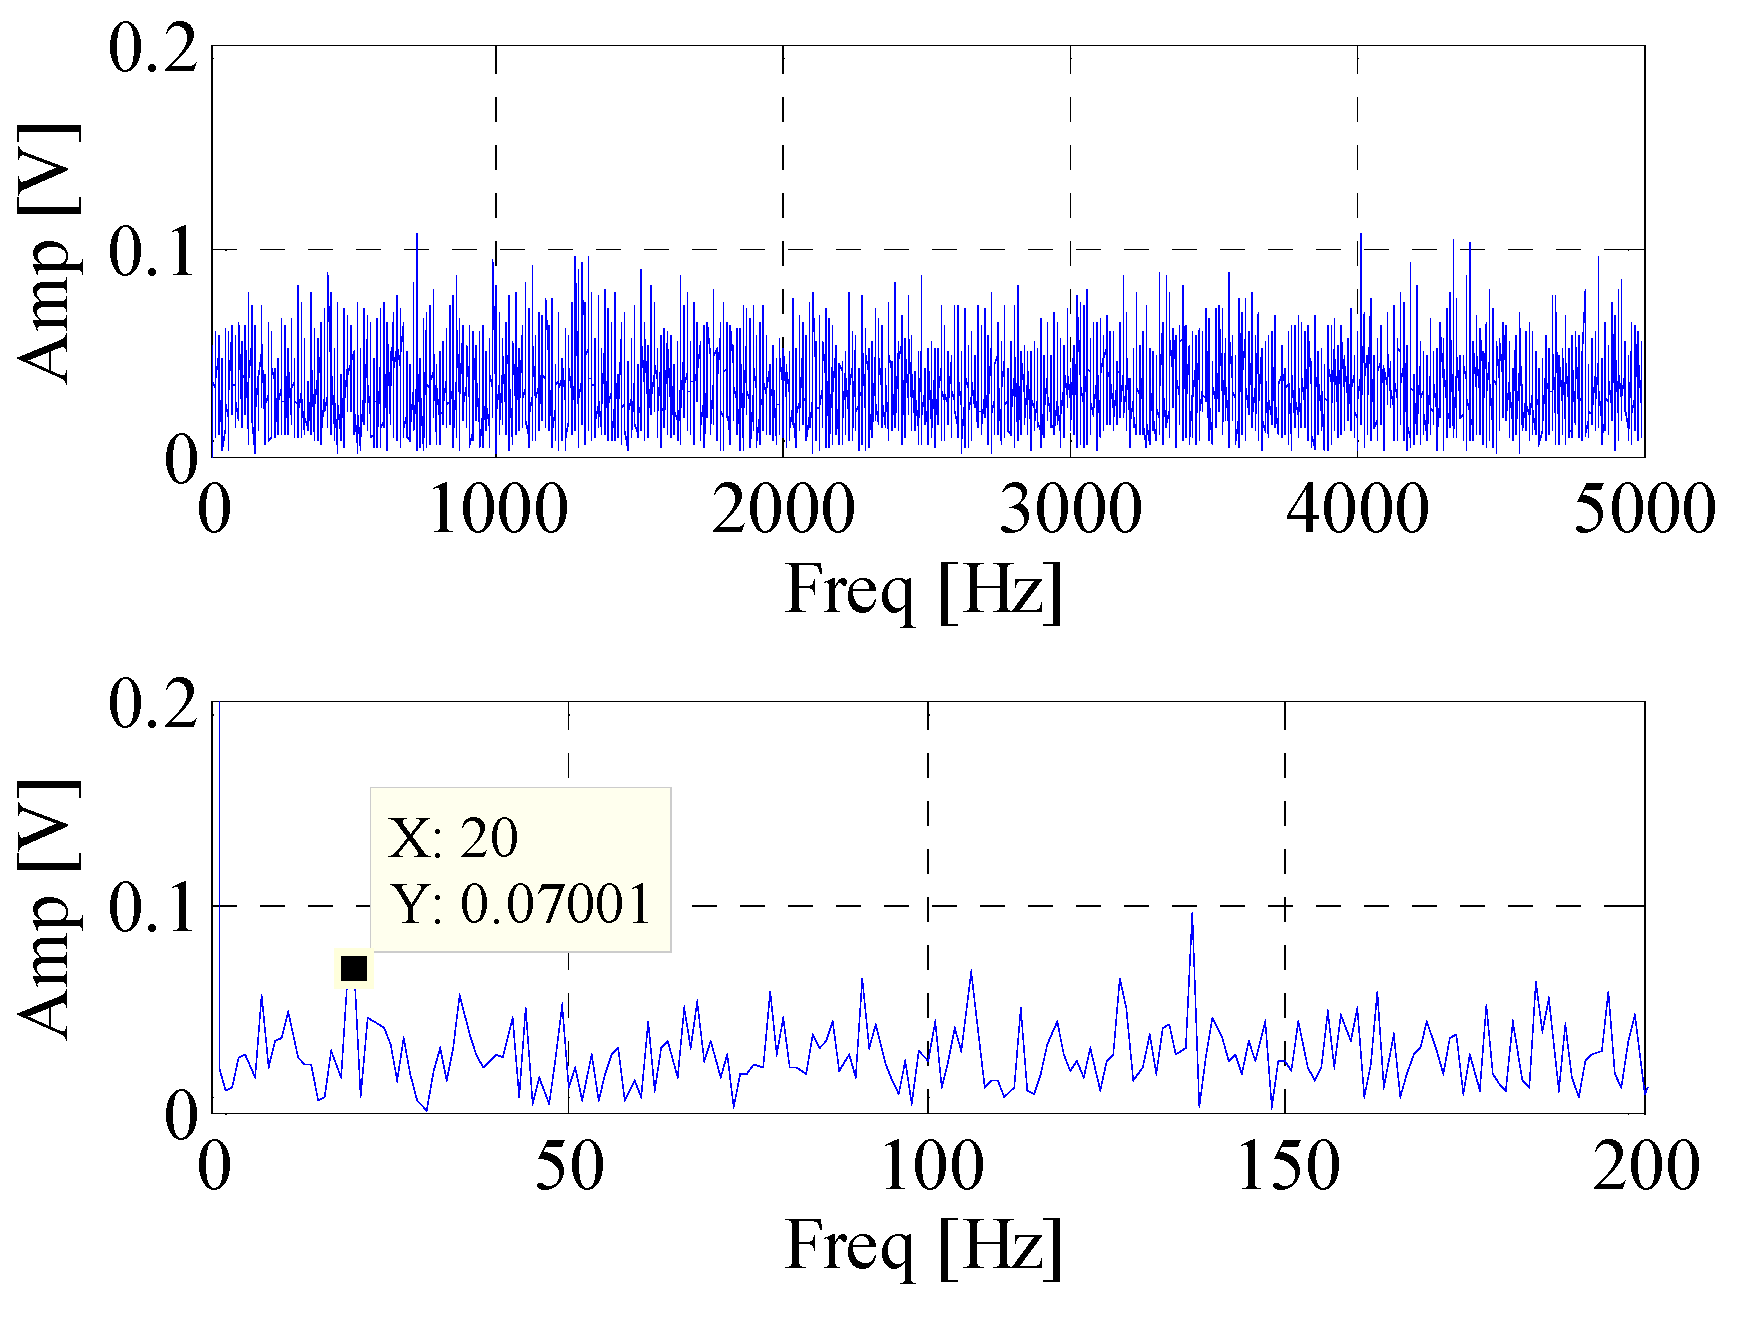
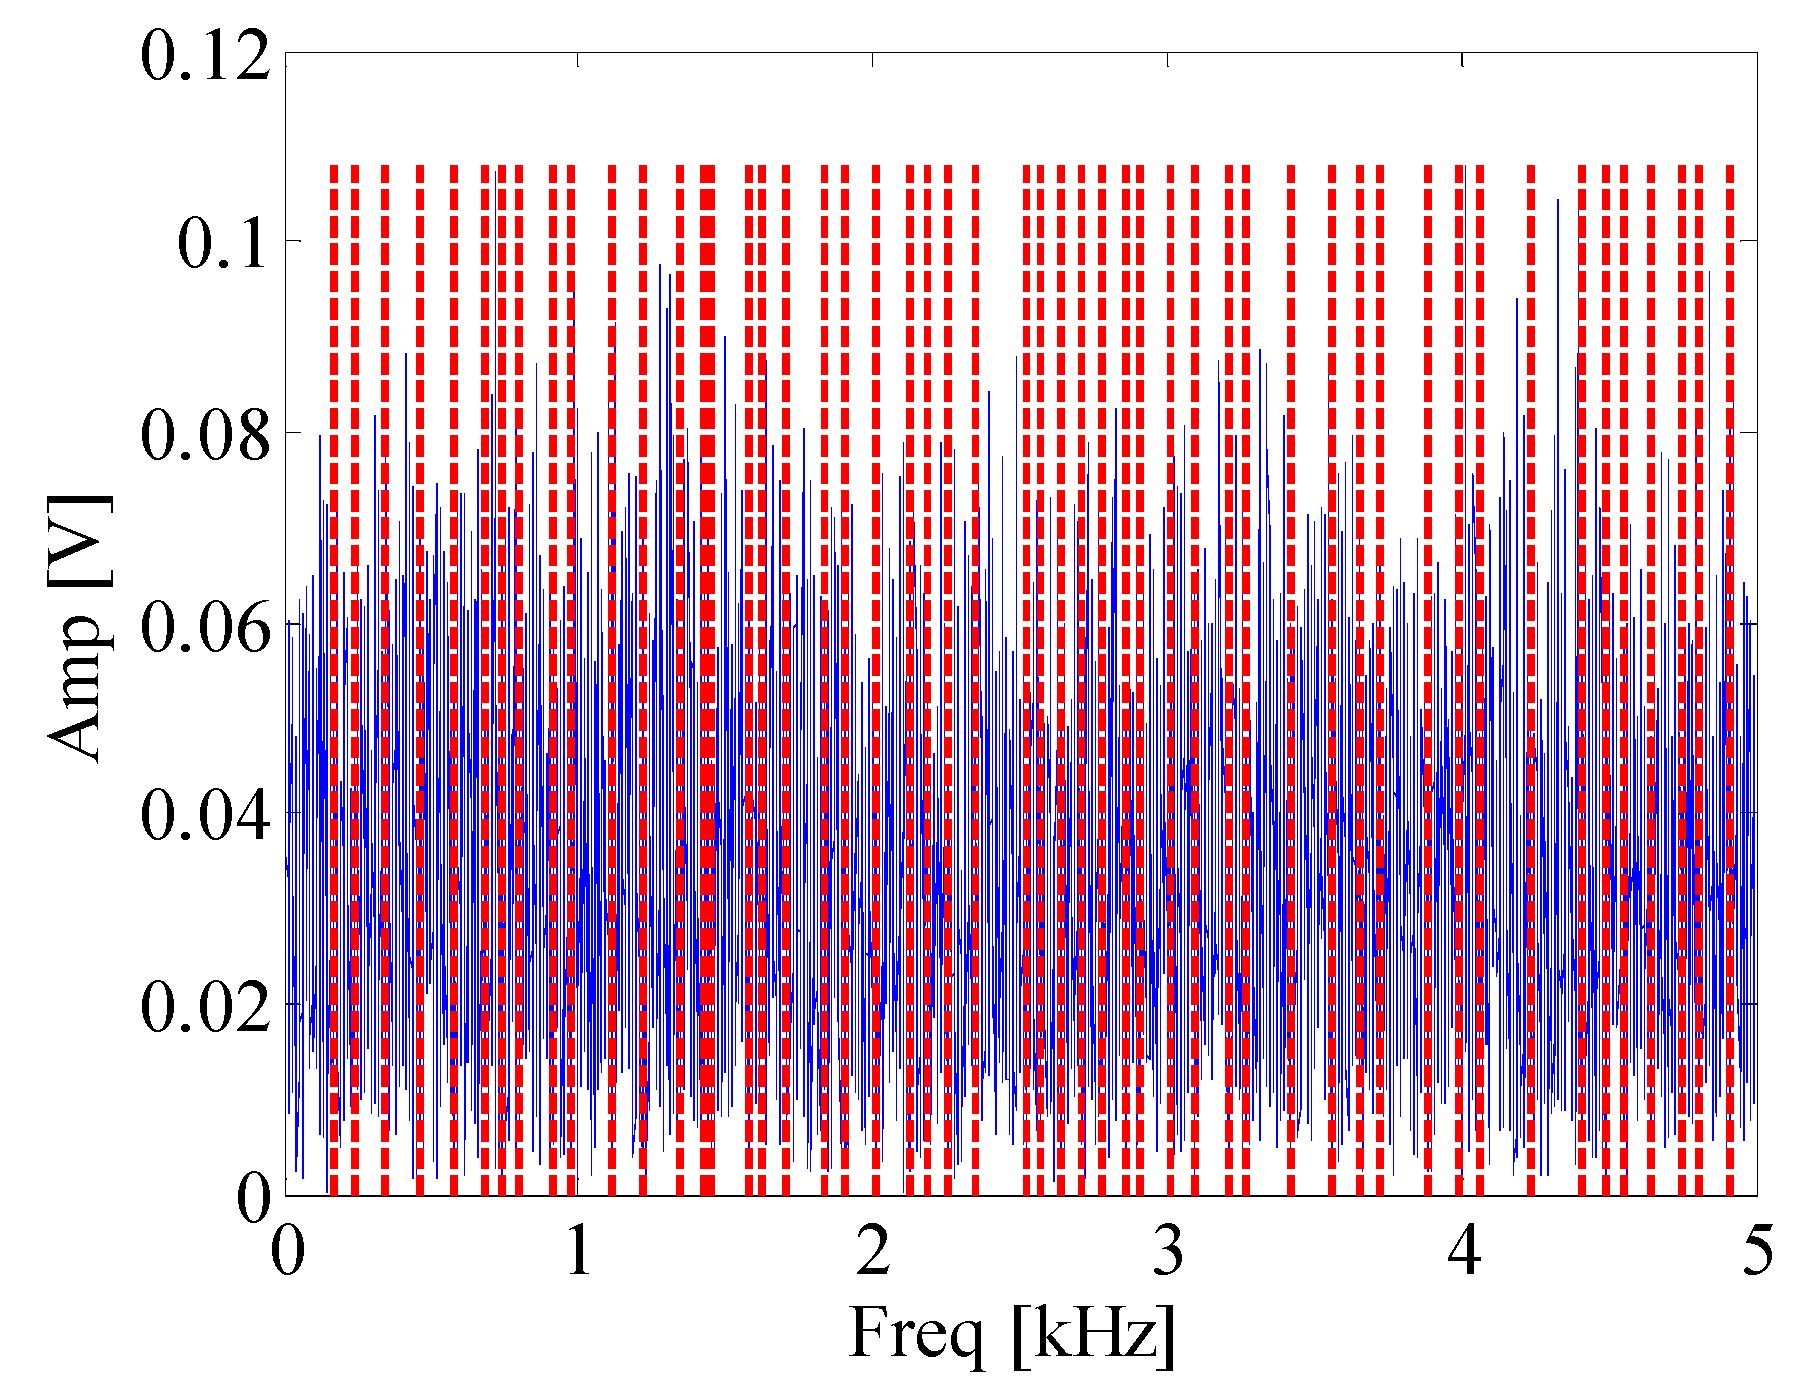
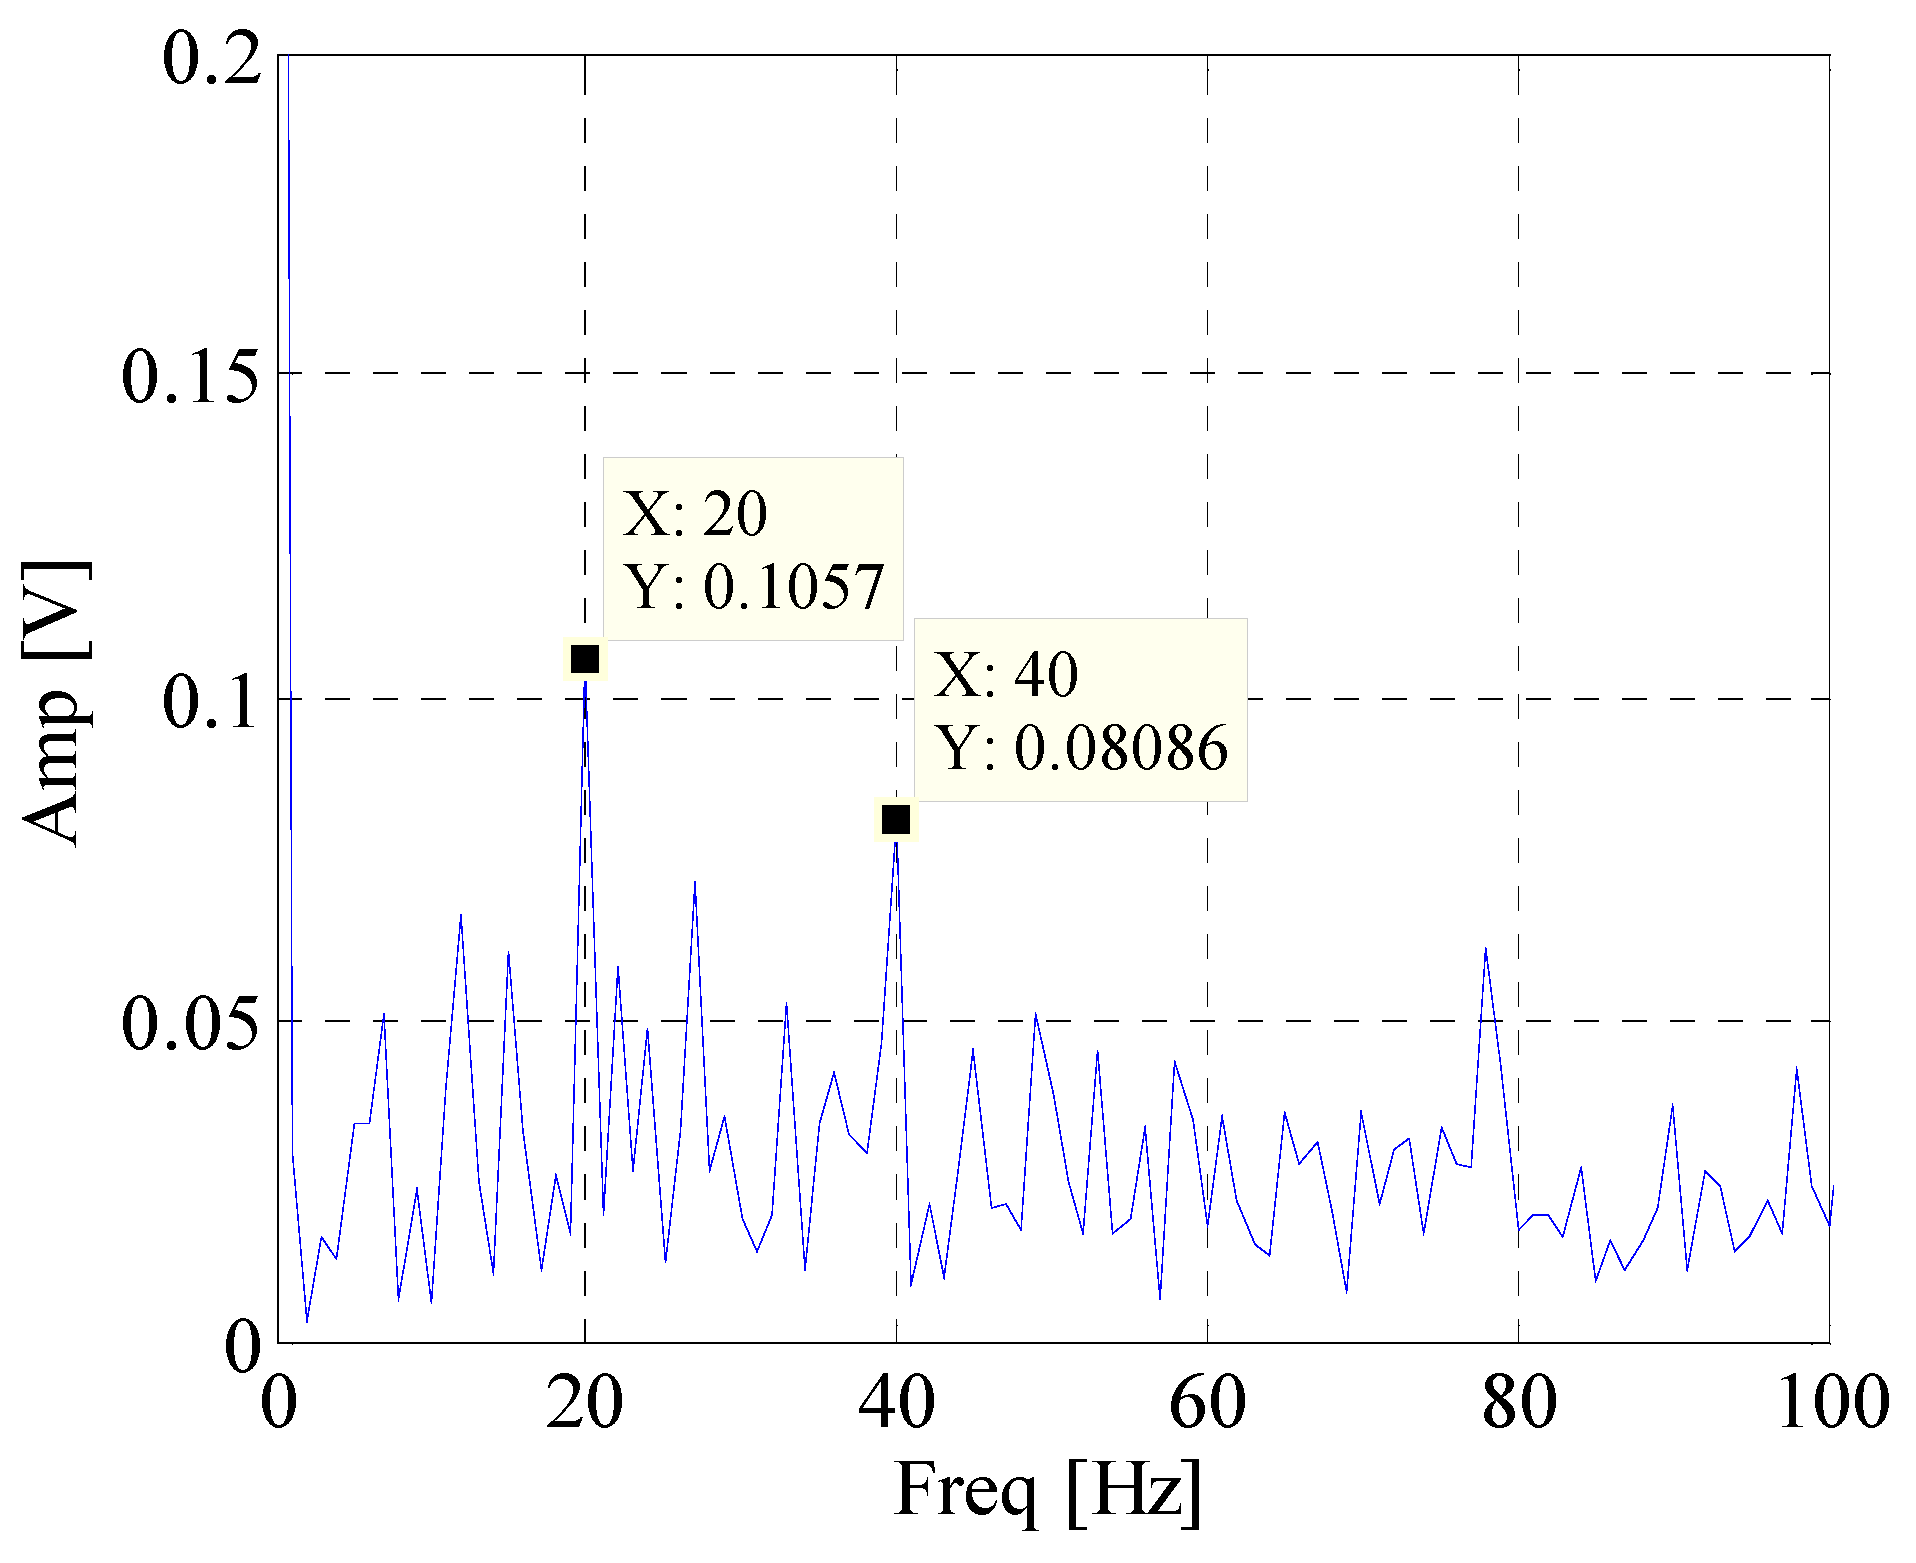
3. Simulation Verification
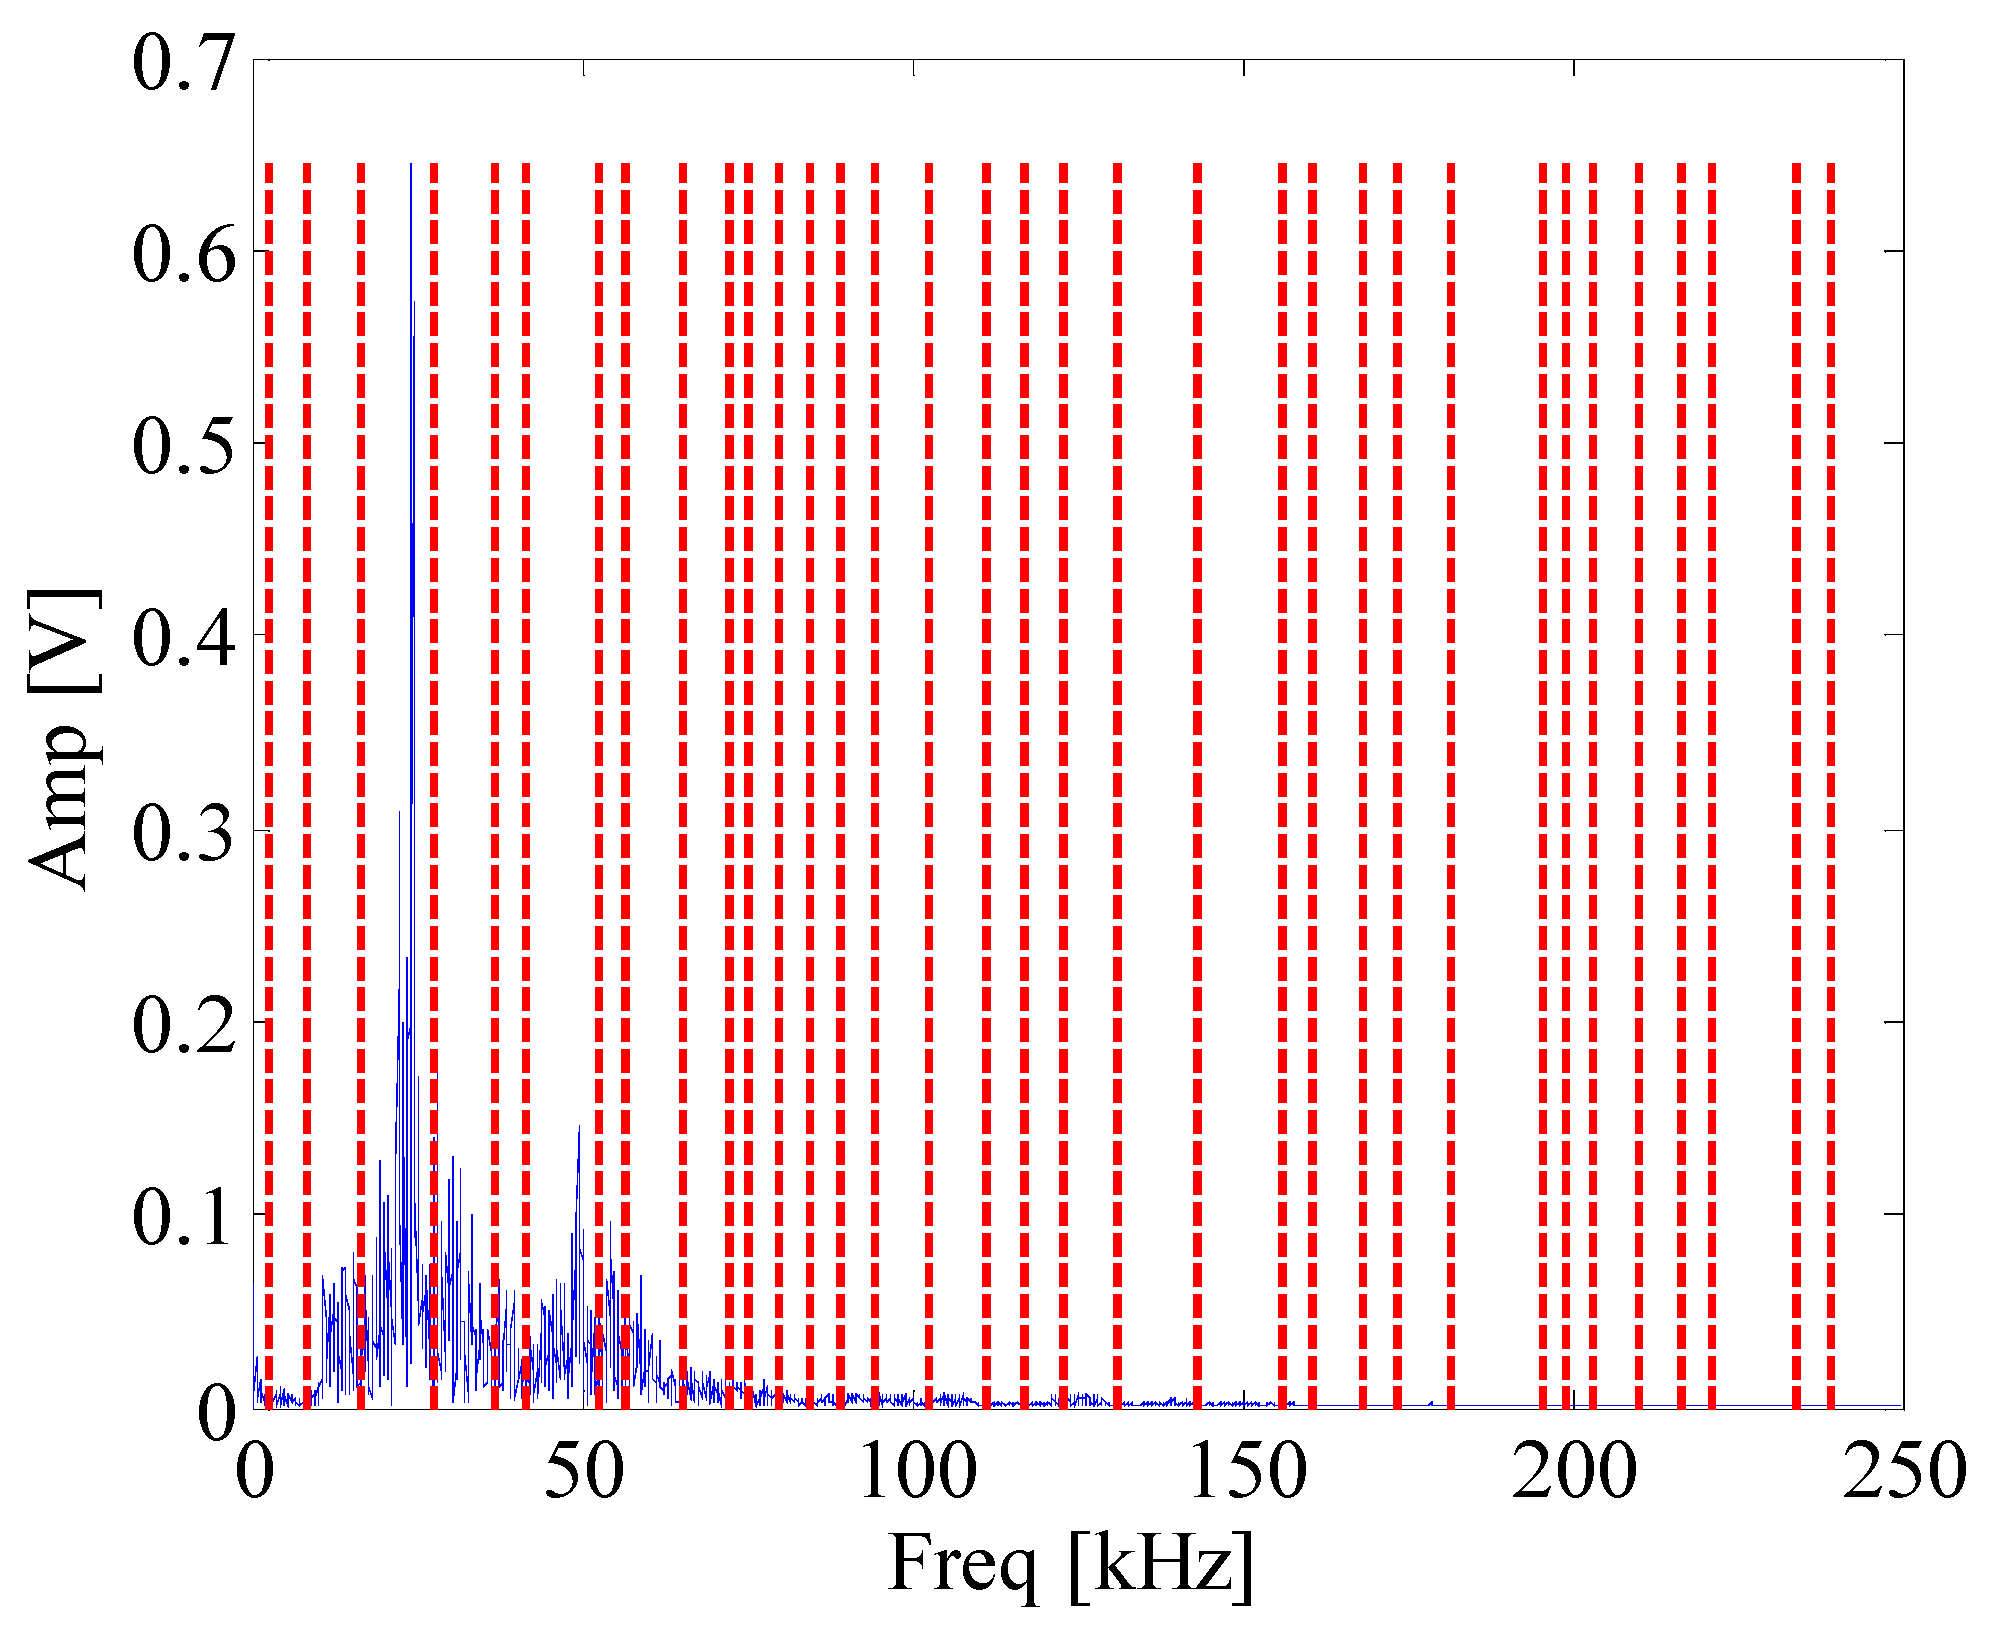
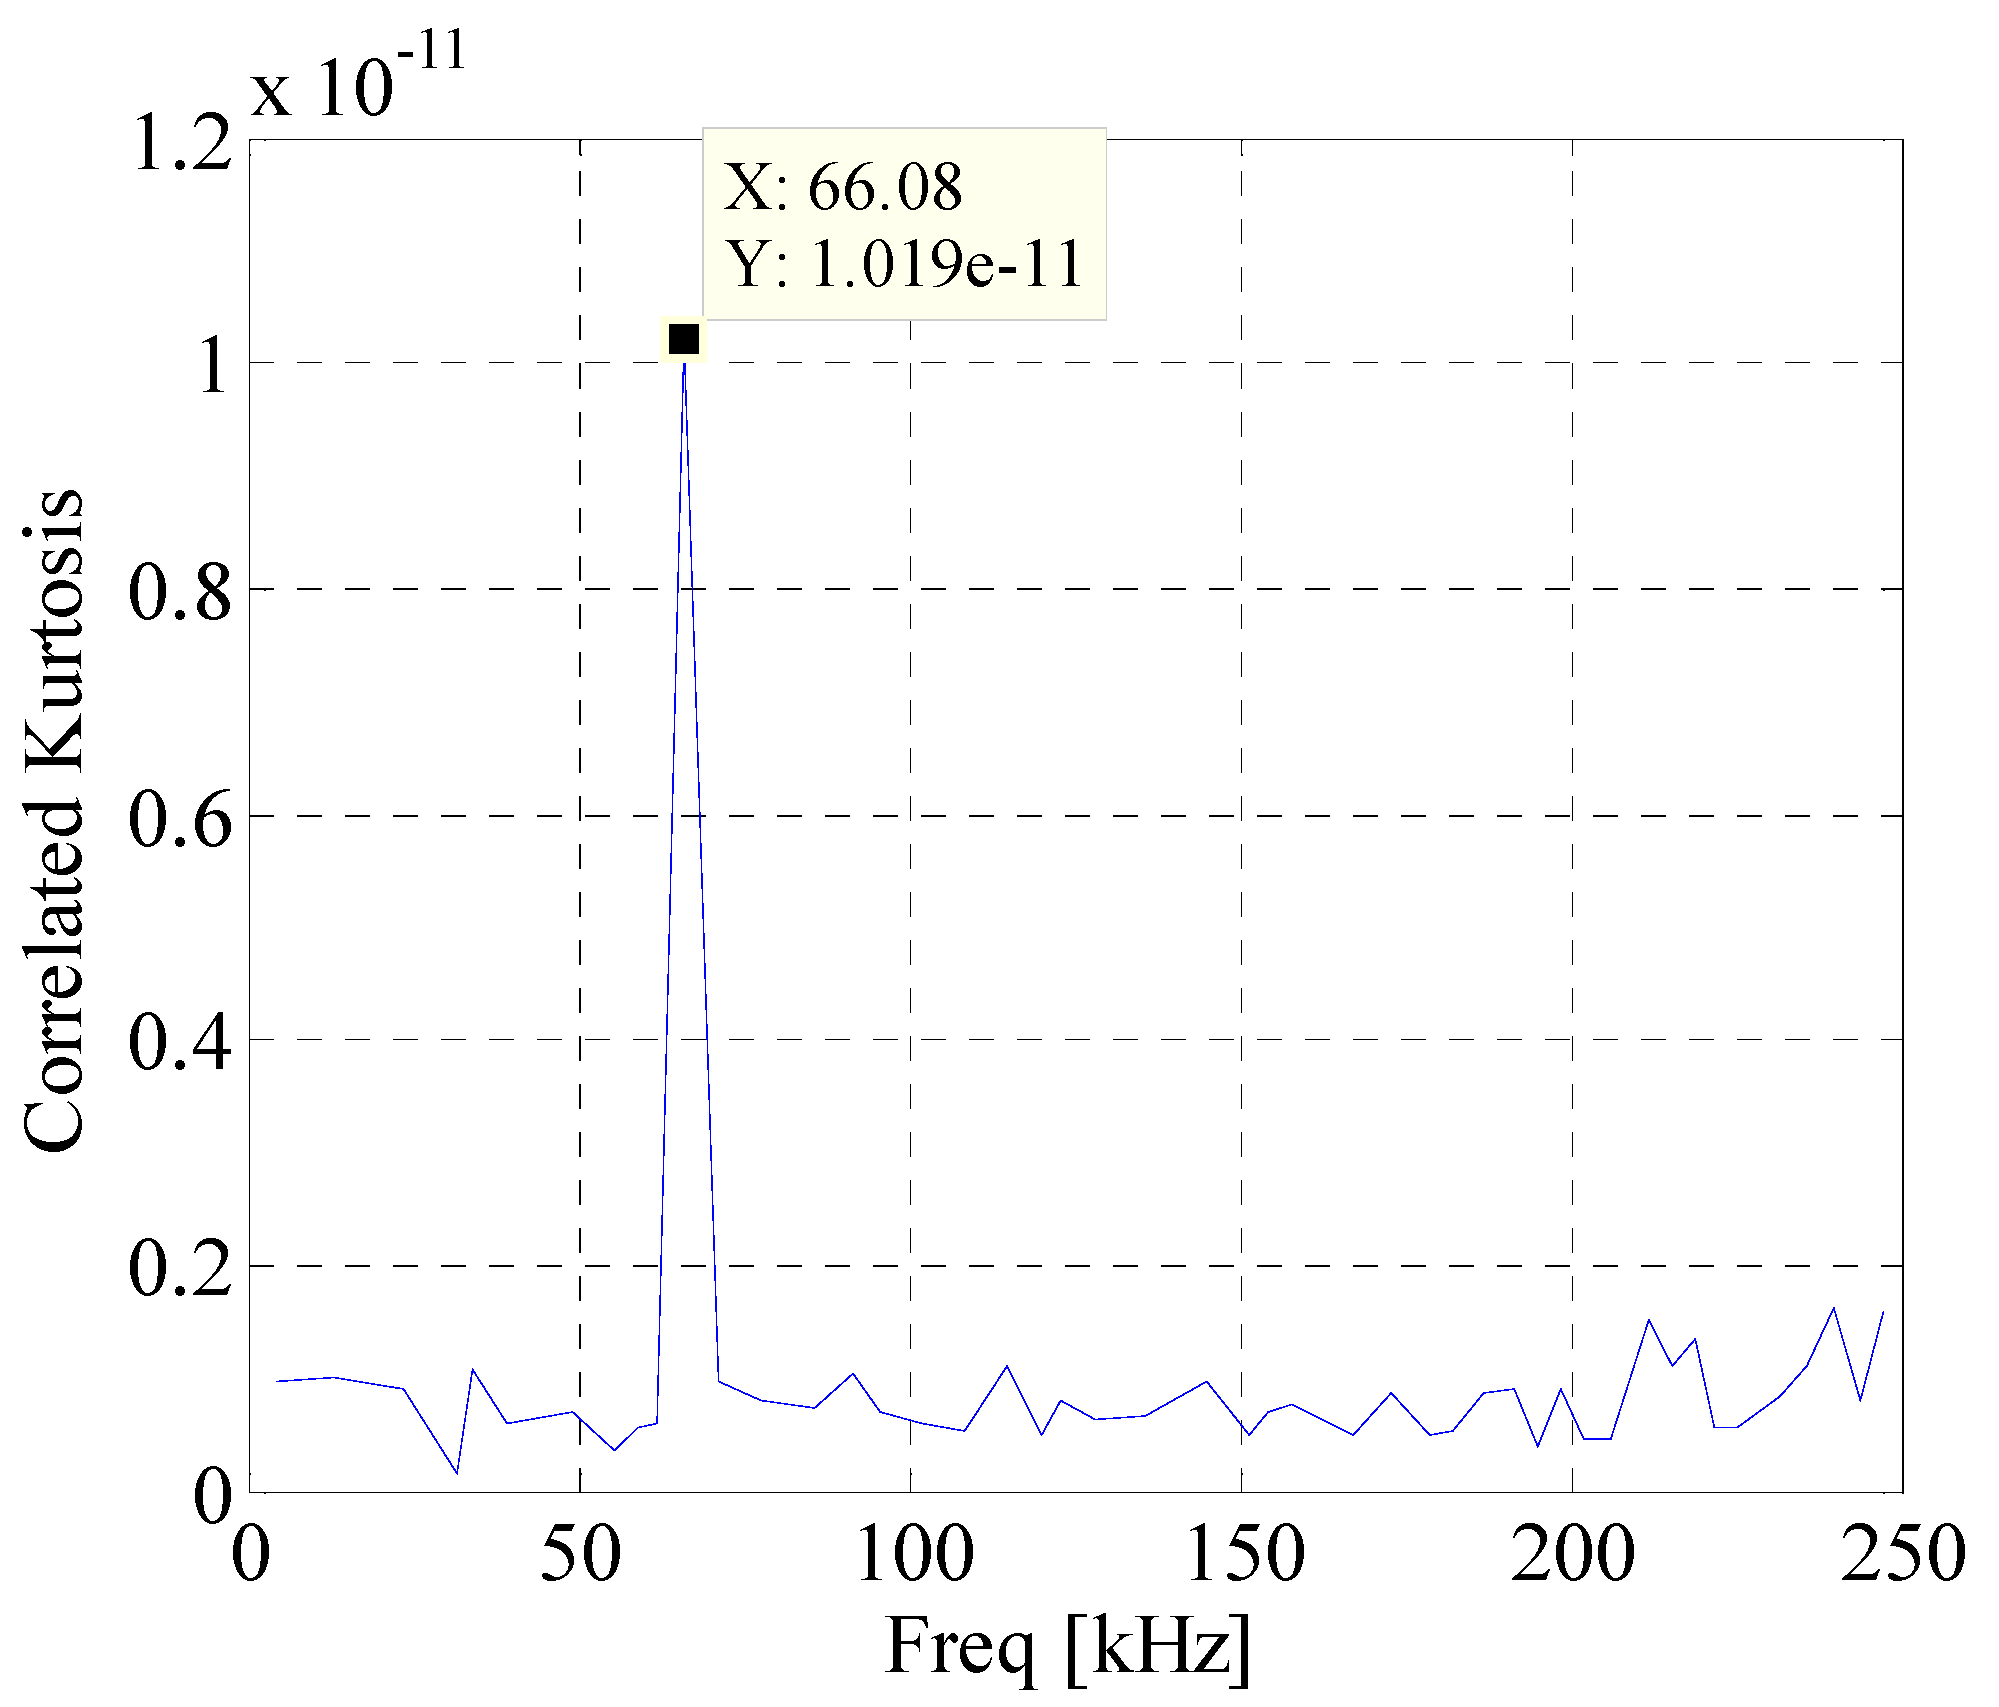
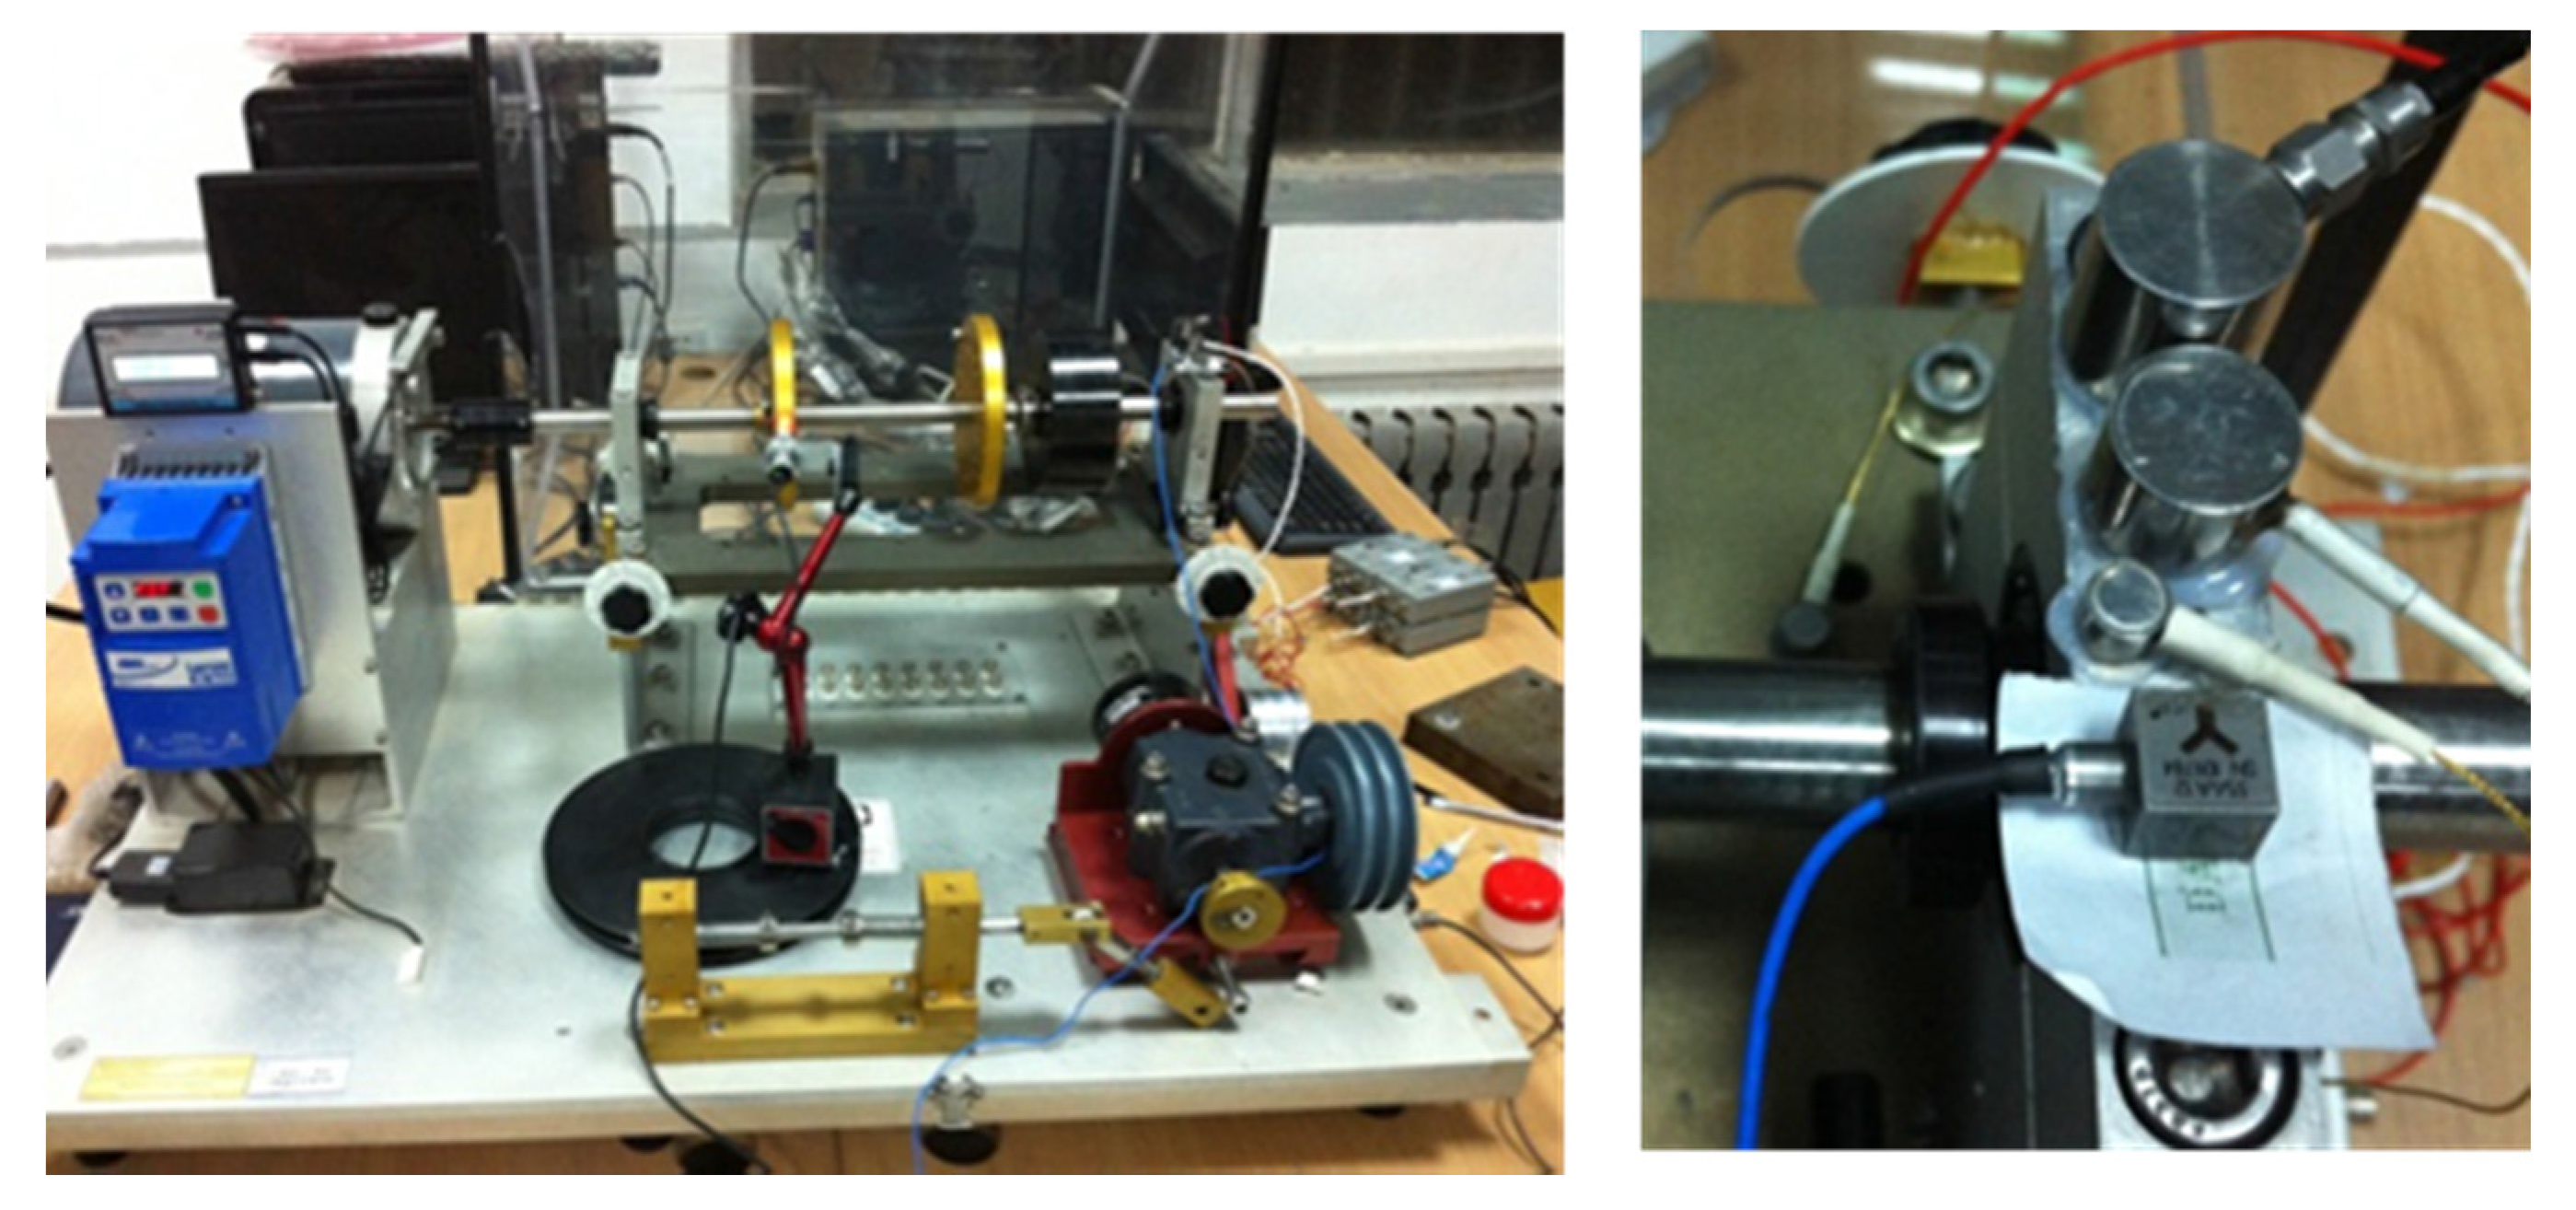
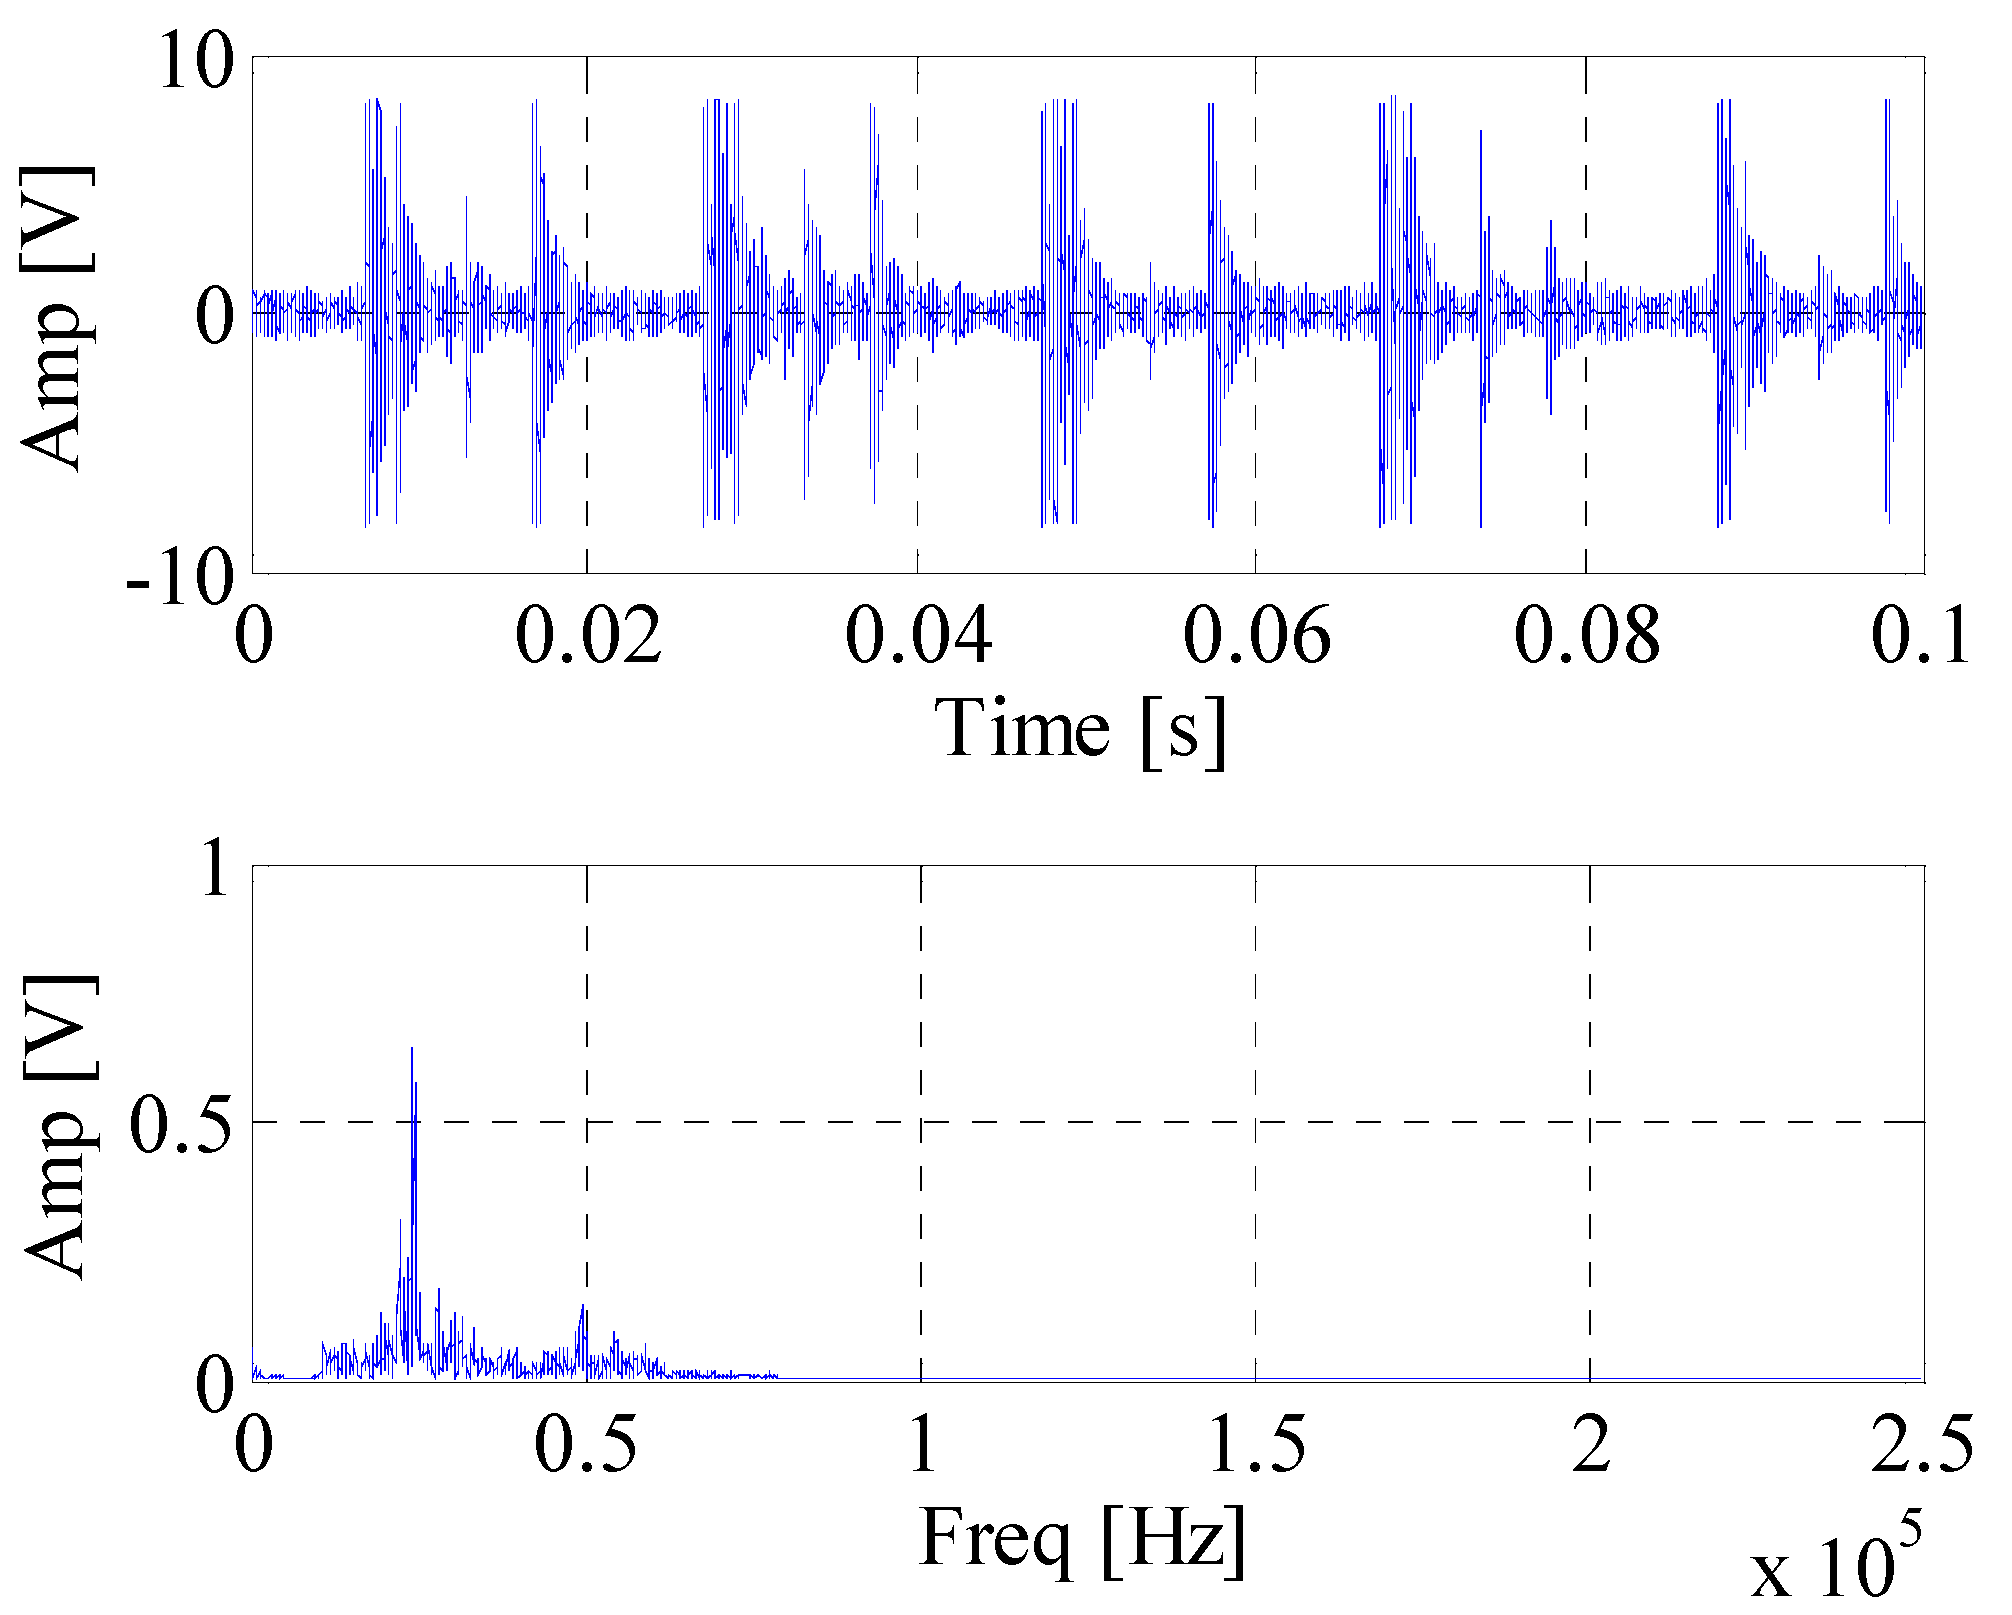
4. Experimental Verification
5. Conclusions
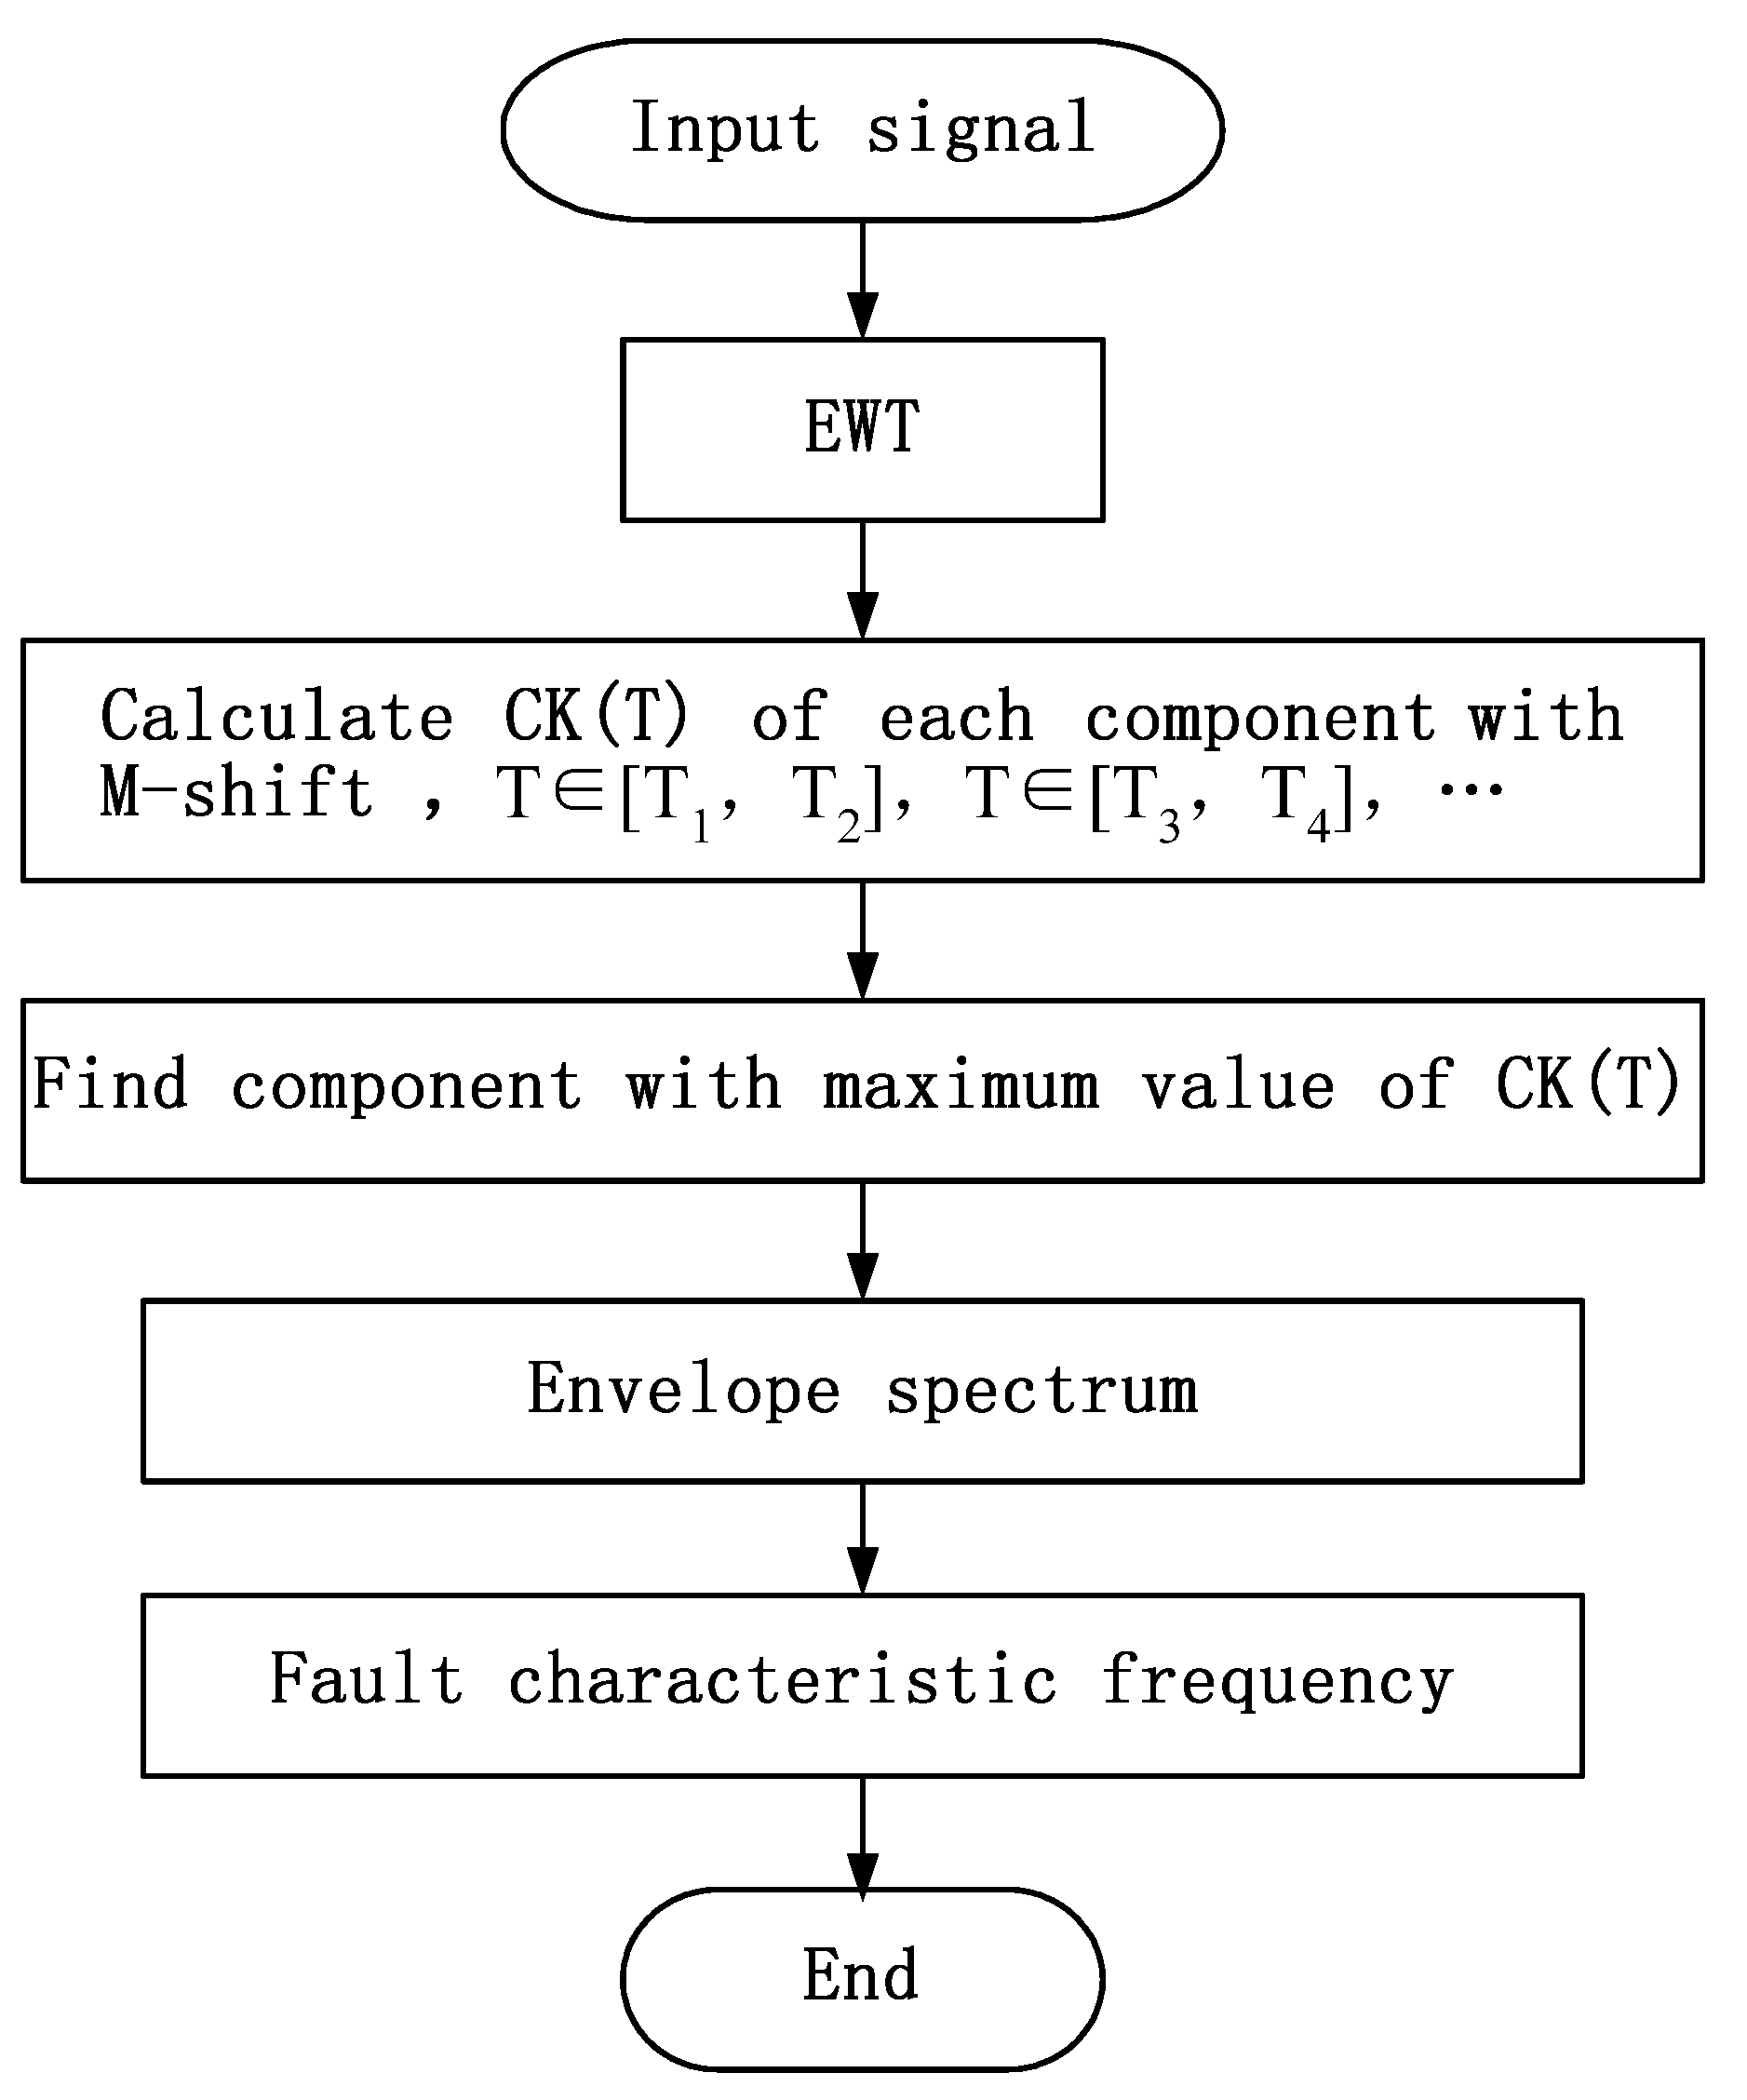
- With the right time interval T, the resonant frequency of the rolling bearing system can be obtained by calculating the CK value.
- Weak fault features can be identified by the proposed method under low SNR conditions.
Acknowledgments
Author Contributions
Conflicts of Interest
References
- Hecke, B.E.V. Development of Novel Acoustic Emission Based Methodology and Tools for Bearing Fault Diagnostics. Ph.D. Thesis, University of Illinois, Chicago, IL, USA, 2015. [Google Scholar]
- Cao, H.R.; Fan, F.; Zhou, K.; He, Z.J. Wheel-bearing fault diagnosis of trains using empirical wavelet transform. Measurement 2016, 82, 439–449. [Google Scholar] [CrossRef]
- Mba, D.; Rao, R. Development of Acoustic Emission technology for the condition monitoring and diagnosis of rotating machines: bearings, pumps, gearboxes, engines and rotating structures. Shock Vib. Dig. 2006, 38, 3–16. [Google Scholar] [CrossRef]
- Tandon, N.; Choudhury, A. A review of vibration and acoustic measurement methods for the detection of defects in rolling element bearings. Tribol. Int. 1999, 32, 469–480. [Google Scholar] [CrossRef]
- Al-Balushi, K.R.; Addali, A.; Charnley, B.; Mba, D. Energy Index technique for detection of Acoustic Emissions associated with incipient bearing failures. Appl. Acoust. 2010, 71, 812–821. [Google Scholar] [CrossRef]
- Balerston, H.L. The detection of incipient failure in bearings. Mater. Eval. 1969, 27, 121–128. [Google Scholar]
- Yoshioka, T.; Korenaga, A.; Mano, H.; Yamamoto, T. Diagnosis of rolling bearing by measuring time interval of Acoustic Emission generation. J. Tribol. 1999, 121, 468–472. [Google Scholar] [CrossRef]
- Morhain, A.; Mba, D. Bearing Defect Diagnosis and Acoustic Emission. Proc. Inst. Mech. Eng. Part J: J. Eng. Tribol. 2003, 217, 272–275. [Google Scholar] [CrossRef]
- Al-Ghamd, A.M.; Mba, D. A comparative experimental study on the use of acoustic emission and vibration analysis for bearing defect identification and estimation of defect size. Mech. Syst. Signal Process. 2006, 20, 1537–1571. [Google Scholar] [CrossRef]
- Eftekharnejad, B.; Carrasco, M.R.; Charnley, B.; Mba, D. The application of spectral kurtosis on Acoustic Emission and vibrations from a defective bearing. Mech. Syst. Signal Process. 2011, 25, 266–284. [Google Scholar] [CrossRef]
- Kilundu, B.; Chiementin, X.; Duez, J.; Mba, D. Cyclostationarity of Acoustic Emissions (AE) for monitoring bearing defects. Mech. Syst. Signal Process. 2011, 25, 2061–2072. [Google Scholar] [CrossRef]
- Pandya, D.H.; Upadhyay, S.H.; Harsha, S.P. Fault diagnosis of rolling element bearing with intrinsic mode function of acoustic emission data using APF-KNN. Expert Syst. Appl. 2013, 40, 4137–4145. [Google Scholar] [CrossRef]
- Žvokelj, M.; Zupan, S.; Prebil, I. EEMD-based multiscale ICA method for slewing bearing fault detection and diagnosis. J. Sound Vib. 2016, 370, 394–423. [Google Scholar] [CrossRef]
- Hemmati, F.; Orfali, W.; Gadala, M.S. Roller bearing acoustic signature extraction by wavelet packet transform, applications in fault detection and size estimation. Appl. Acoust. 2016, 104, 101–118. [Google Scholar] [CrossRef]
- Kedadouche, M.; Thomas, M.; Tahan, A. Empirical Mode Decomposition combined with Empirical Wavelets for extracting bearing frequencies in a noisy environment and early detection of defects. In Advances in Condition Monitoring of Machinery in Non-Stationary Operations; Springer: Lyon, France, 2014; pp. 151–165. [Google Scholar]
- Gilles, J. Empirical Wavelet Transform. IEEE Trans. Signal Process. 2013, 61, 3999–4002. [Google Scholar]
- Pan, J.; Chen, J.L.; Zi, Y.Y.; Li, Y.M.; He, Z.J. Mono-component feature extraction for mechanical fault diagnosis using modified empirical wavelet transform via data-driven adaptive Fourier spectrum segment. Mech. Syst. Signal Process. 2016, 72–73, 160–183. [Google Scholar] [CrossRef]
- McDonald, G.L.; Zhao, Q.; Zuo, M.J. Maximum correlated Kurtosis deconvolution and application on gear tooth chip fault detection. Mech. Syst. Signal Process. 2012, 33, 237–255. [Google Scholar] [CrossRef]
- McFadden, P.D.; Smith, J.D. Model for the vibration produced by a single point defect in a rolling element bearing. J. Sound Vib. 1984, 96, 69–82. [Google Scholar] [CrossRef]
- Randall, R.B.; Antoni, J. Rolling element bearing diagnostics—A tutorial. Mech. Syst. Signal Process. 2011, 25, 485–520. [Google Scholar] [CrossRef]


| Parameters | Range |
|---|---|
| Operating Frequency Range | 125–750 KHz |
| Resonant Frequency | 300 KHz |
| Temperature Range | −65–177 °C |
| Rotation Speed/rpm | BPFO/Hz | BPFI/Hz | BSF/Hz |
|---|---|---|---|
| 3000 | 152.4 | 247.5 | 99.6 |
© 2017 by the authors. Licensee MDPI, Basel, Switzerland. This article is an open access article distributed under the terms and conditions of the Creative Commons Attribution (CC BY) license (http://creativecommons.org/licenses/by/4.0/).
Share and Cite
Gao, Z.; Lin, J.; Wang, X.; Xu, X. Bearing Fault Detection Based on Empirical Wavelet Transform and Correlated Kurtosis by Acoustic Emission. Materials 2017, 10, 571. https://doi.org/10.3390/ma10060571
Gao Z, Lin J, Wang X, Xu X. Bearing Fault Detection Based on Empirical Wavelet Transform and Correlated Kurtosis by Acoustic Emission. Materials. 2017; 10(6):571. https://doi.org/10.3390/ma10060571
Chicago/Turabian StyleGao, Zheyu, Jing Lin, Xiufeng Wang, and Xiaoqiang Xu. 2017. "Bearing Fault Detection Based on Empirical Wavelet Transform and Correlated Kurtosis by Acoustic Emission" Materials 10, no. 6: 571. https://doi.org/10.3390/ma10060571
APA StyleGao, Z., Lin, J., Wang, X., & Xu, X. (2017). Bearing Fault Detection Based on Empirical Wavelet Transform and Correlated Kurtosis by Acoustic Emission. Materials, 10(6), 571. https://doi.org/10.3390/ma10060571