1. Introduction
Titanium alloys are commonly used in aerospace engineering due to their high strength, low density, good mechanical properties and excellent heat and corrosion resistance. As the breakthrough product among
/
titanium alloys, the Ti-6Al-4V alloy occupies the most part of the market of aerospace components [
1]. In recent years, the
titanium alloys have emerged to replace Ti-6Al-4V in some of aerospace components owing to their excellent comprehensive performance [
1,
2]. According to the morphology and the distribution of the
phase associated with different heat treatment procedures, there are two commonly used microstructures of the
titanium alloys, namely fully lamellar and bimodal, respectively [
3]. The literature focussed on the morphology of the
phase showed that the preparation route of the high ultimate tensile strength for the lamellar alloy is more convenient than that for the bimodal alloy [
4]. A typical processing sequence for the lamellar
alloys contains a series of four steps, namely the homogenization (step I), the deformation (step II), the recrystallization (step III) and the annealing plus the aging treatment (step IV), where the first three steps are operated in the
phase field and the final step is normally done in the
+
phase field [
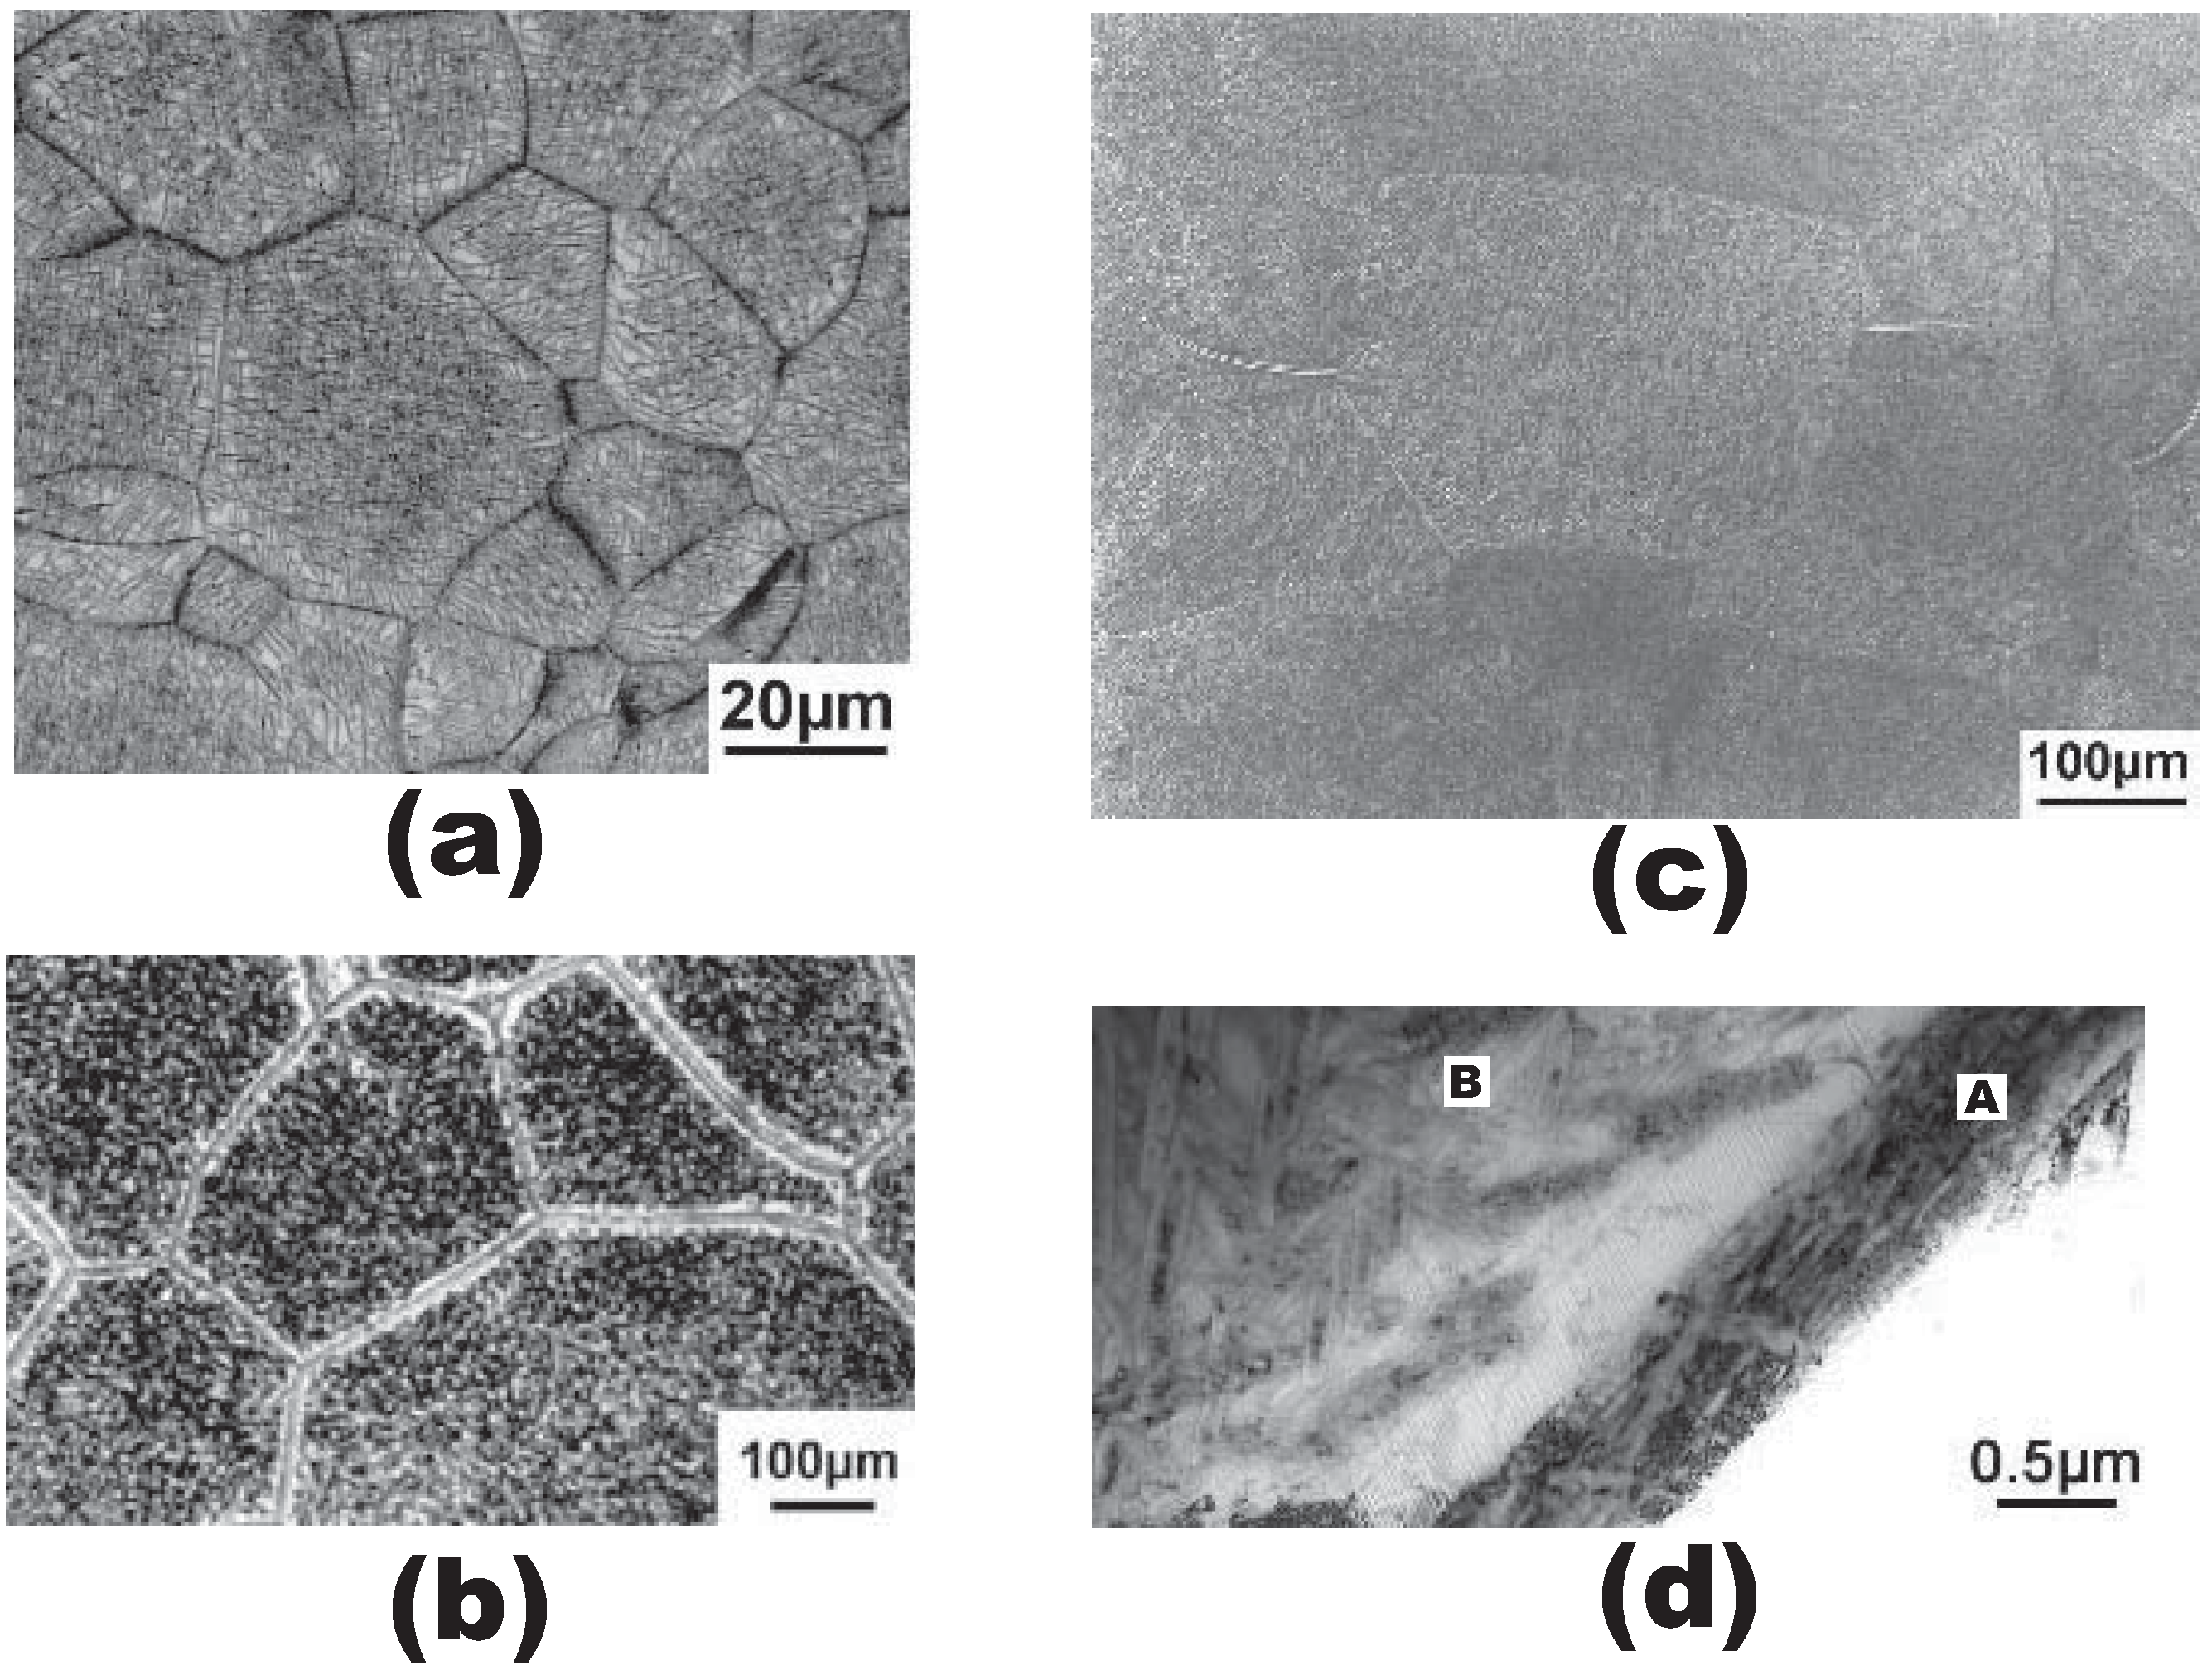
1]. After the heat treatment, the representative structure of the lamellar
alloy consists of the continuous thin
phase layer surrounding the hard grain interior, which is composed of the nanoscale
phase laths inside the prior
grain [
1,
3,
4], as shown in
Figure 1. Due to the preferential plastic deformation along the continuous
layer and the grain boundary regions are softer than the precipitation hardened grain interiors [
1], intergranular ductile fracture is easy to happen [
3]. Since the fracture toughness of the
titanium alloys is highly related to intergranular fracture [
1,
3] and the fracture toughness is one of the key design criteria of the failure-resistant components in aerospace engineering, it is necessary to investigate the intergranular crack propagation behavior of the lamellar
titanium alloys.
Prior efforts at modeling intergranular fracture of polycrystalline metals have shown that ductility and fracture toughness depends on the material response of the grain interiors, the intergranular failure properties of the grain boundary regions, the distribution of the grain size and orientation [
5,
6,
7,
8,
9,
10,
11,
12]. One common approach is to simulate the intergranular separation of grain boundaries according to the cohesive interface models [
8,
9,
10,
11,
12] and the stress–strain behavior of the grain interiors can be described by using the anisotropic elastic theory [
11,
12], the isotropic Von Mises plasticity [
8,
9] or the crystal plasticity theory [
8,
9,
10] depending on whether the effects of the plasticity and the orientation of grains are considered. Although the cohesive interface models are helpful to understand the failure mechanisms associated with low ductility or fracture toughness at meso-scale, they are more suitable in simulating the brittle intergranular fracture [
8,
10] or the cleavage fracture [
12,
13] of polycrystalline materials. In the
titanium alloys, the intergranular crack initiation sites are commonly considered to be caused by the difference in elastic-plastic deformation between grains [
1,
3]. Fractographic examinations have also shown that the intergranular fracture of the
titanium alloy occurs on the grain boundary through nucleation of voids, void growth and coalescence [
3]. The intergranular failure caused by this micro-mechanism can be well described by the Gurson–Tvergaard–Needleman (GTN) model according to void volume fraction together with the first and the second stress invariants [
14,
15]. Based on the assumption that damage evolution is determined by cooperation of plastic deformation and high stress triaxiality, the GTN model was extensively used in simulating the gradually degraded yield surface of ductile materials [
15,
16]; however, few investigations on intergranular ductile fracture have been performed based on this model [
7].
For the two-phase titanium alloys including the
alloys, quantitative tilt fractography analysis has been performed to calculate the angular deviation between the loading direction and the initiation facet normal corresponding to intergranular fracture, which reveals that both normal and shear force components of facets are necessary to initiate a crack [
3]. Therefore, the deformation process of the grain boundary layer involves the significant variations of stress states; however, it has already be recognized that the GTN model has no ability to simulate fracture at low stress triaxiality [
15,
17]. In order to encompass a wider scope of stress triaxiality, the original GTN model has been extended by taking into account the effects of the third stress invariant. Some additional parameters are introduced, which set the rate of damage evolution in shear [
17,
18,
19]. These extended models capture the macroscopic experimental observations of various metal alloys in the shear dominated stress states with low stress triaxiality.
Motivated by the issues outlined above, the intergranular ductile fracture of the
titanium alloys will be investigated based on a extended GTN model that considers both the normal fracture due to the internal necking of neighboring voids and the shear fracture associated with the void shearing mechanism. The paper is structured as follows. In
Section 2, the extended GTN model in terms of low stress triaxiality is reviewed and the corresponding numerical algorithm is introduced. In
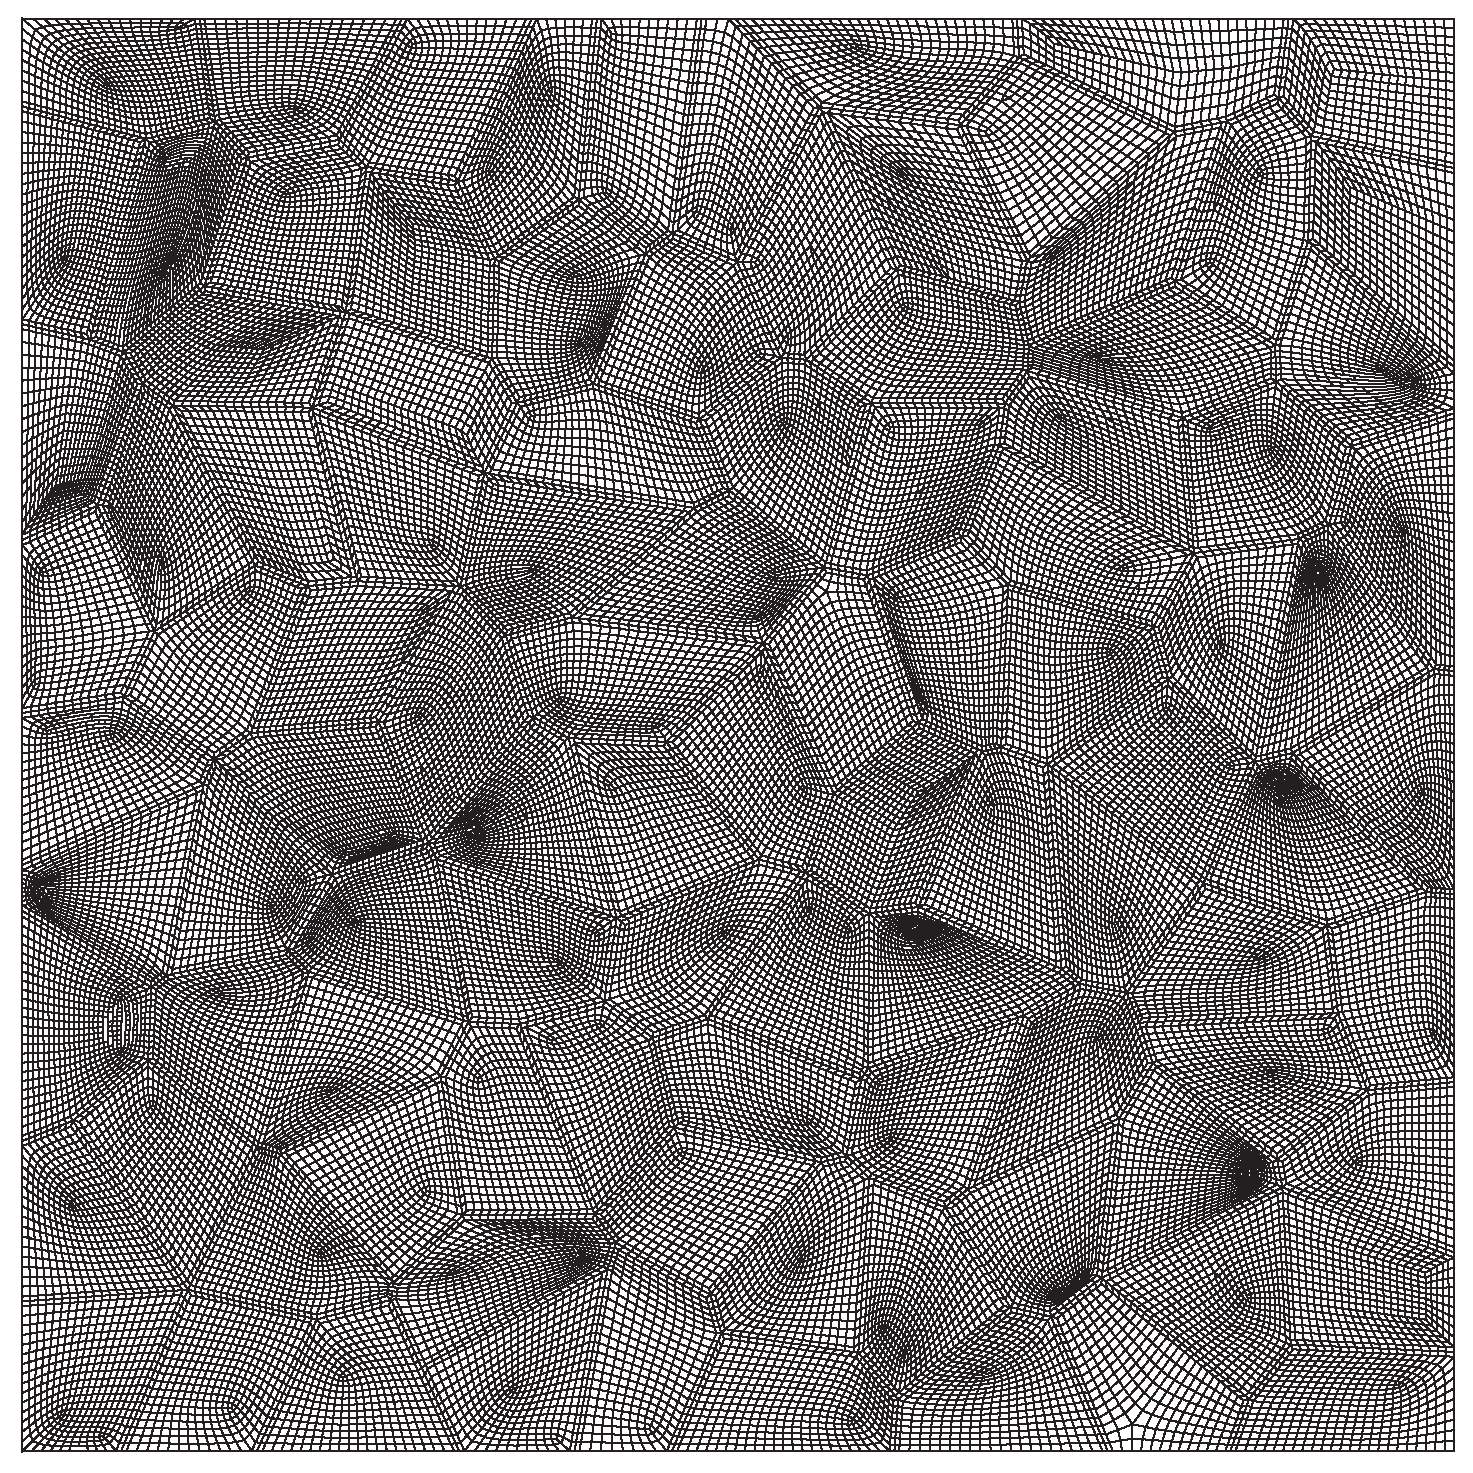
Section 3, the finite-element polycrystal model of the lamellar Ti-5Al-5V-5Mo-3Cr (Ti-5553) alloy with the random grain geometry is generated from the Voronoi tessellation at first. Then, the stress–strain responses of both the grain boundary
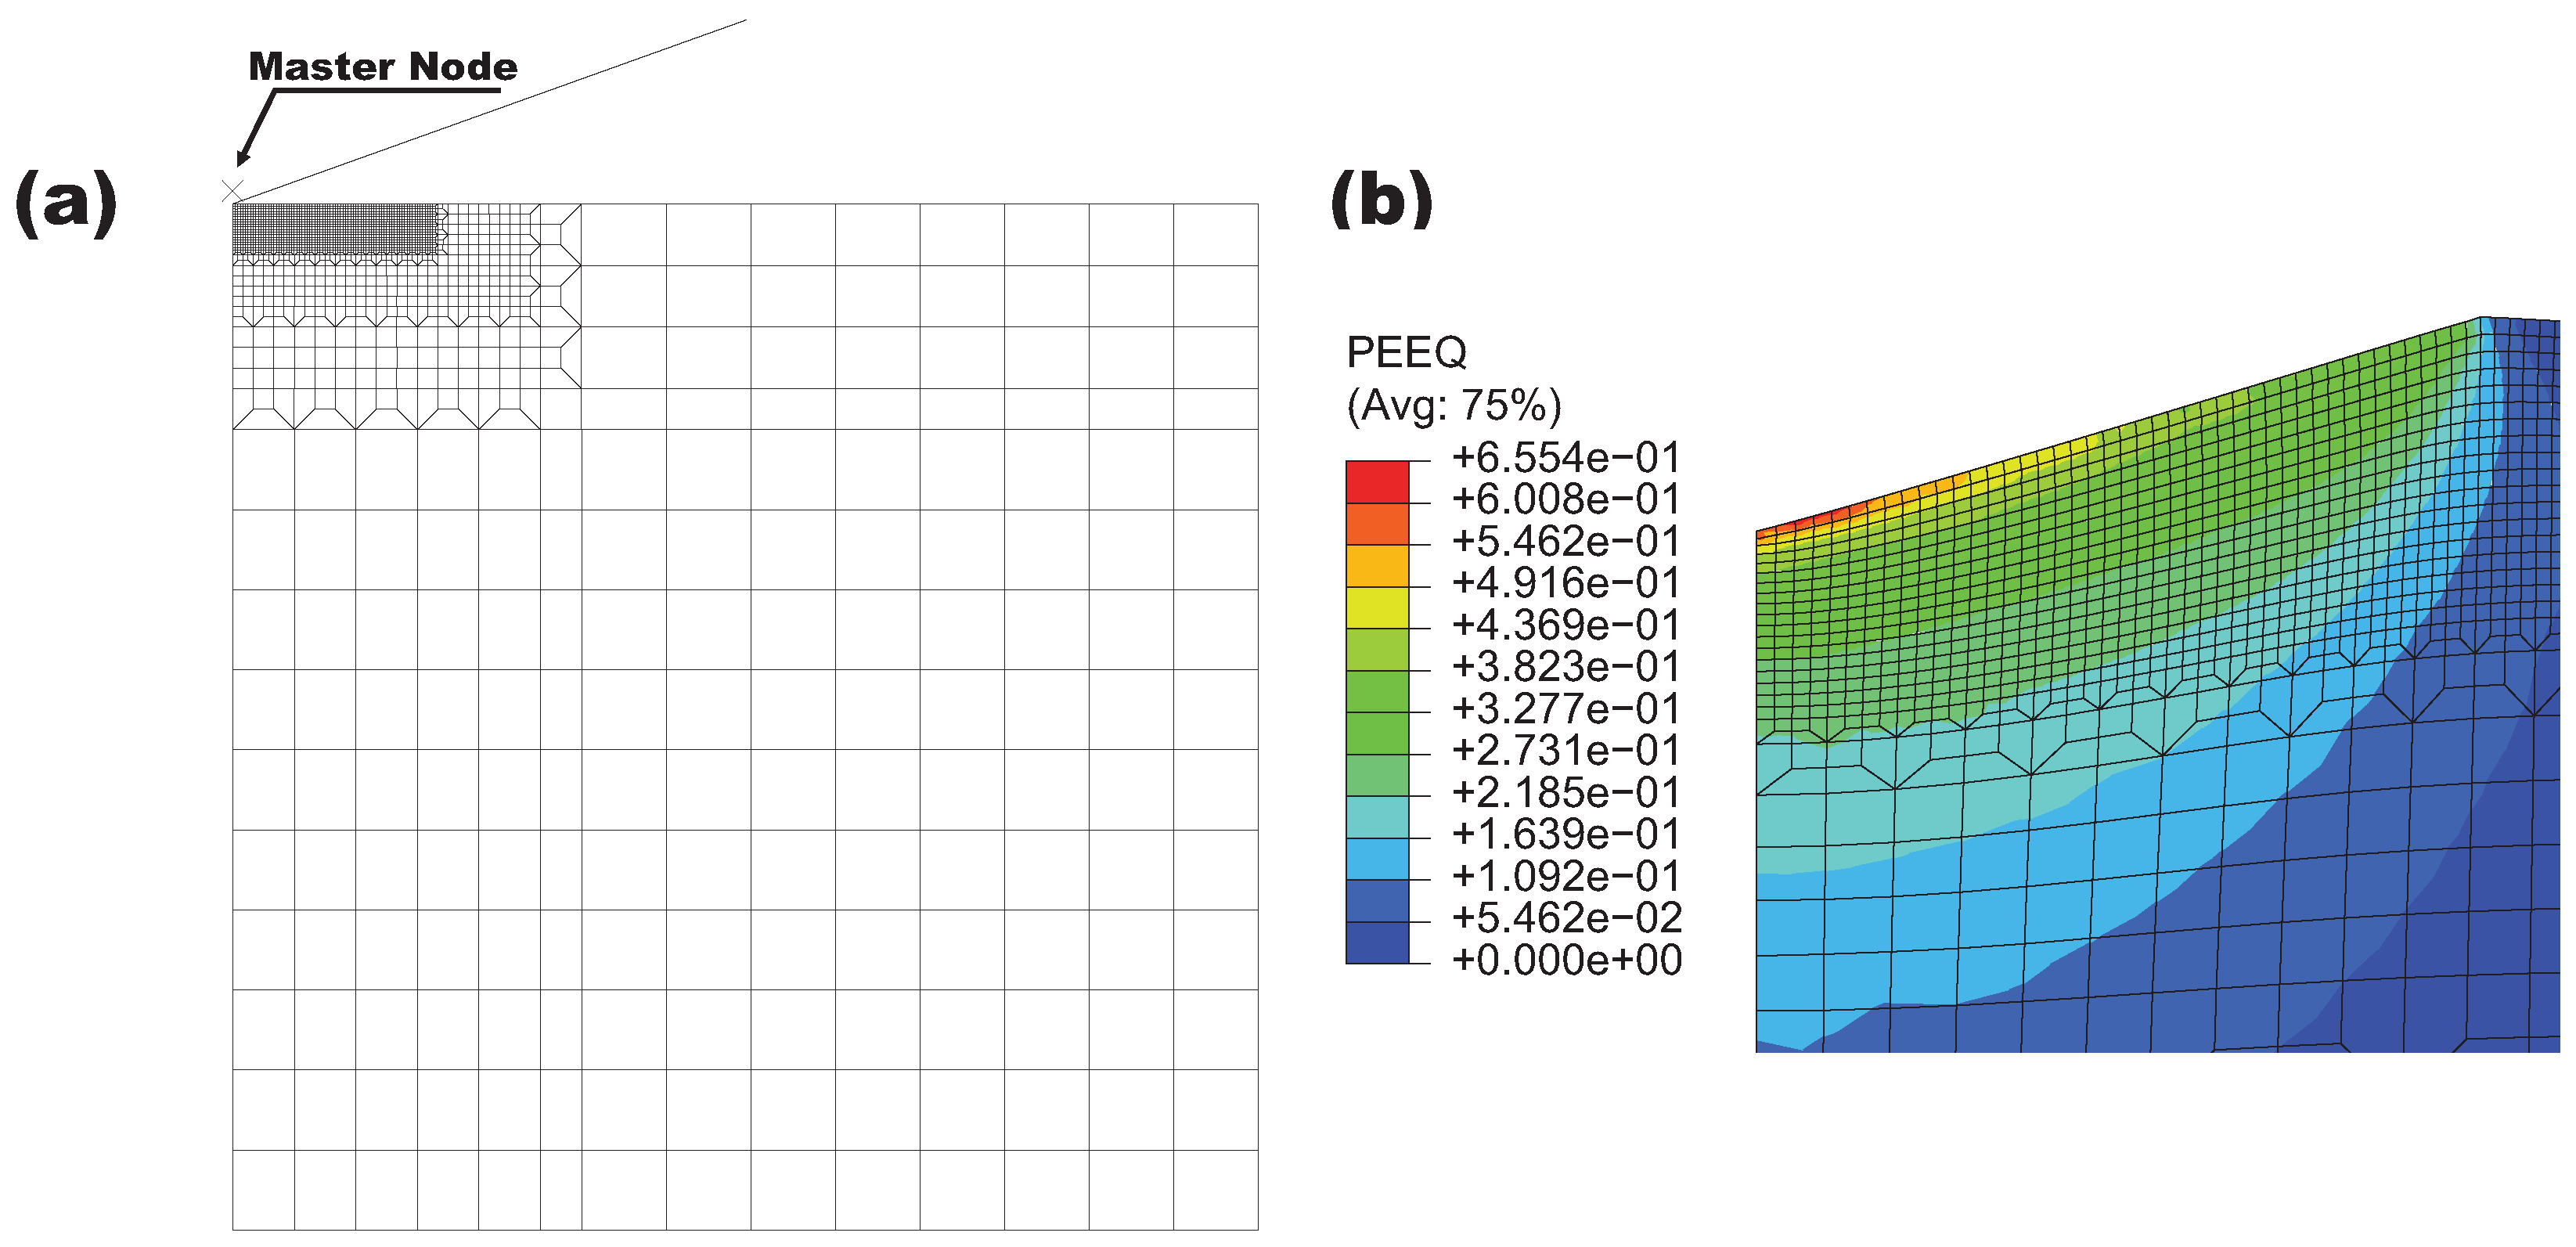
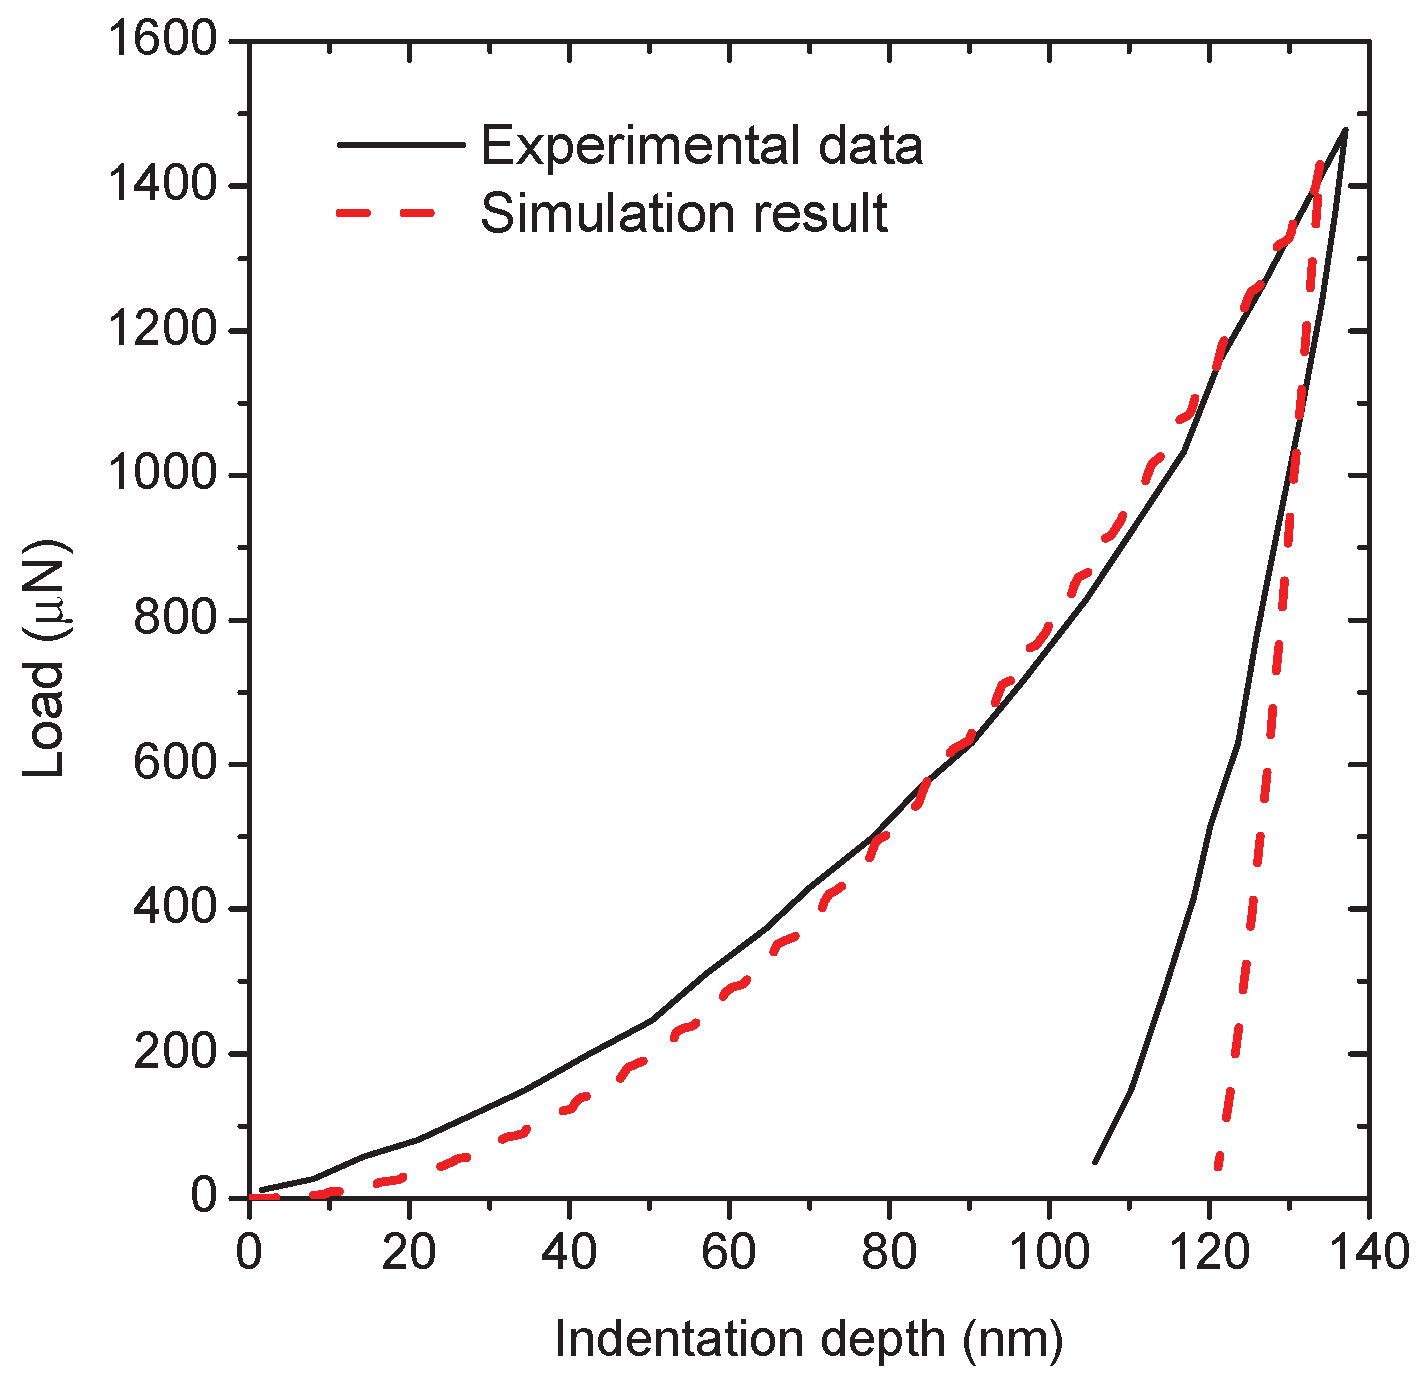
layer and the grain interiors are determined according to the nanoindentation and the uni-axial tensile tests available in the literature, and finally show the representative simulations of the damage evolution under both tensile and shear loading. In
Section 4, a notched Ti-5553 specimen is used to simulate the intergranular crack propagation process. The effects of void shearing of the grain boundary
layer and the elastic-plastic response of the grain interiors on the fracture toughness of Ti-5553 are discussed in detail. Meanwhile, the crack propagation process for two different model parameters are compared to reveal the effects of void shearing. The conclusions are summarized in
Section 5.
2. Constitutive Modeling
By considering void growth and the internal necking between two adjacent voids, the original GTN model was developed to describe the gradually degraded yield surface depending explicitly upon the void volume fraction
f of ductile materials [
15,
16]. The yield function of the model is given below:
where the constants
and
were introduced by Tvergaard and Needleman to improve the predictive ability of the Gurson model [
14,
20].
refers to the yield stress of the matrix material, in which
is the initial yield stress and
R is the hardening function associated with the equivalent plastic strain
.
denotes the Von Mises stress and
is the mean stress. The deviatoric stress
, where
is the macroscopic Cauchy stress tensor and
is the second order identity tensor. The ratio
is the stress triaxiality that cooperates with plastic deformation to promote void growth.
is the equivalent value of the void volume fraction
f. By introducing the critical void volume fraction
at the onset of void coalescence,
is of the bi-linear form as
where
is the acceleration factor for void growth after coalescence.
indicates the void volume fraction at fracture and
. By taking into account the void shearing mechanism [
17], the evolution equation for
f is defined by
without void nucleation, where
is the macroscopic plastic strain rate tensor. The material constant
is introduced to represent the damage evolution rate in pure shear state.
is the shear stress invariant used to quantify the stress state during the damage process.
is denoted as
where
lies between 0 and 1,
for the tensile stress state and
for the pure shear stress state plus an arbitrary mean stress. The operator det(
) stands for the determinant of the deviatoric stress tensor
. It needs to be emphasized that
f in Equation (
3) can not be considered as the void volume fraction any more in the extended model, it defines the damage counter similar to the damage variable in the continuum damage mechanics theory [
15,
17]. The second term in Equation (
3) introduces the material softening due to void deformation and reorientation. The onset of fracture is predicted when
f reaches
and the material is considered to fracture.
The constitutive equation of materials based on Hooke’s law can be written in an incremental form from time
t to
t +
as
where
G is the shear modulus and
is the Lame constant. Since the elastic increment strain
, Equation (
5) can be written in its predictor–corrector form in the framework of the backward Euler method [
21] as
where
is the total strain increment and
is the plastic strain increment.
denotes the elastic predictor which can be alternatively written as
where the deviatoric elastic predictor and the predictor of means stress are defined by
The quantity
represents the deviator of strain and
K is the elastic bulk modulus. The yield function and the flow rule are given by
with
Eliminating the plastic multiplier
in above equations, the following constraint equation is obtained,
The stress tensor at time
can be determined by
The combination of Equations (
6) and (
10) results in
Since
and
are coaxial in the deviatoric stress space according to Equation (
14),
can be determined through the elastic predictor as
Projecting Equation (
14) to
and
, then the following equations can be derived in comparison with Equation (
13):
By assuming that the equivalent plastic work principle is always satisfied, the relationship between the equivalent plastic strain
of the matrix and the macroscopic plastic strain is given by
Finally, all the corresponding equations for the extended GTN model are summarized as follows:
The above system of nonlinear equations for the unknowns
,
,
,
and
f are solved by means of the Newton–Raphson method [
22]. The integration algorithm of the extended GTN model has been implemented into the commercial code ABAQUS according to the user subroutine UMAT (user-defined material) [
23].
4. Intergranular Crack Propagation
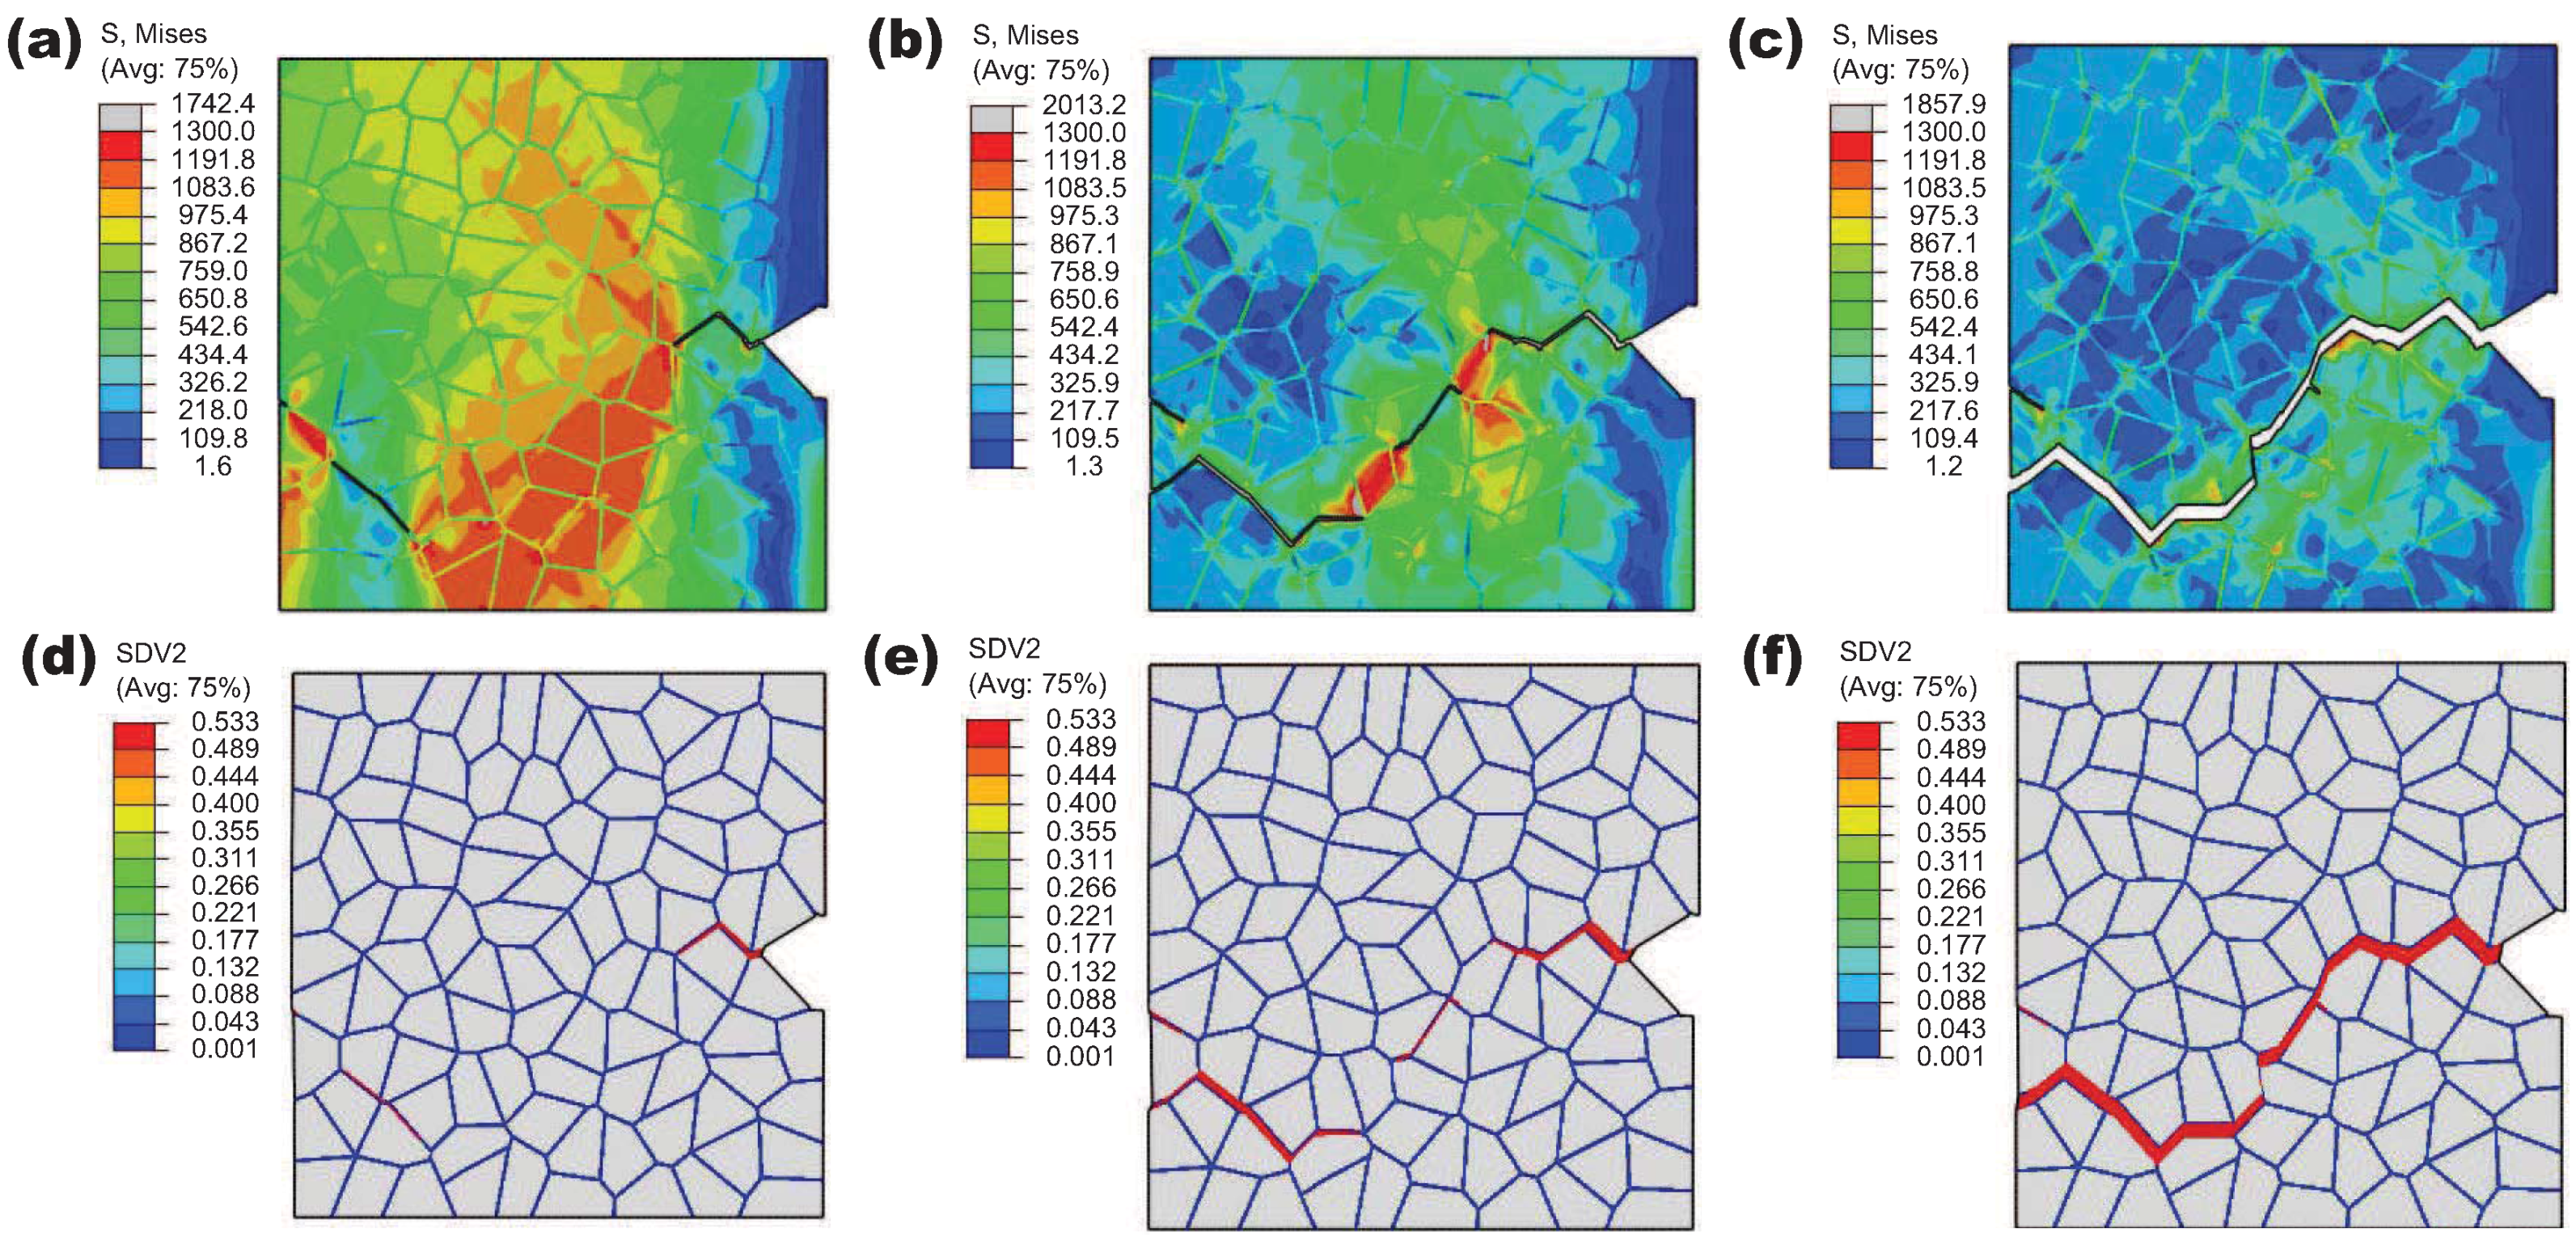
After the model verification, the intergranular ductile crack propagation is simulated according to the determined material parameters. A notched specimen is created simply by removing one grain at the right boundary of the RVE, and the boundary conditions are the same as those for the uni-axial tension simulation. The calculation results for the distribution of the von Mises stress and the damage field evolution are displayed in
Figure 9. The contour maps of the damage variable characterize crack propagation. There are several crack initiation sites, and two of them have the same positions as those in the uni-axial tension (see
Figure 9a). With the further loading, the crack initiated from the notch-tip propagates into the bulk of material and merges with other cracks to form one main crack that crosses the polycrystalline aggregate. As shown in the von Mises maps, the high local stress concentrations happen ahead of the current crack-tips during crack propagation, and the local unloading occurs in the wake of the advancing crack-tips. Crack branching has also been observed at some triple points of the model; however, these crack branches stop to grow after propagating a very short distance (see
Figure 9c).
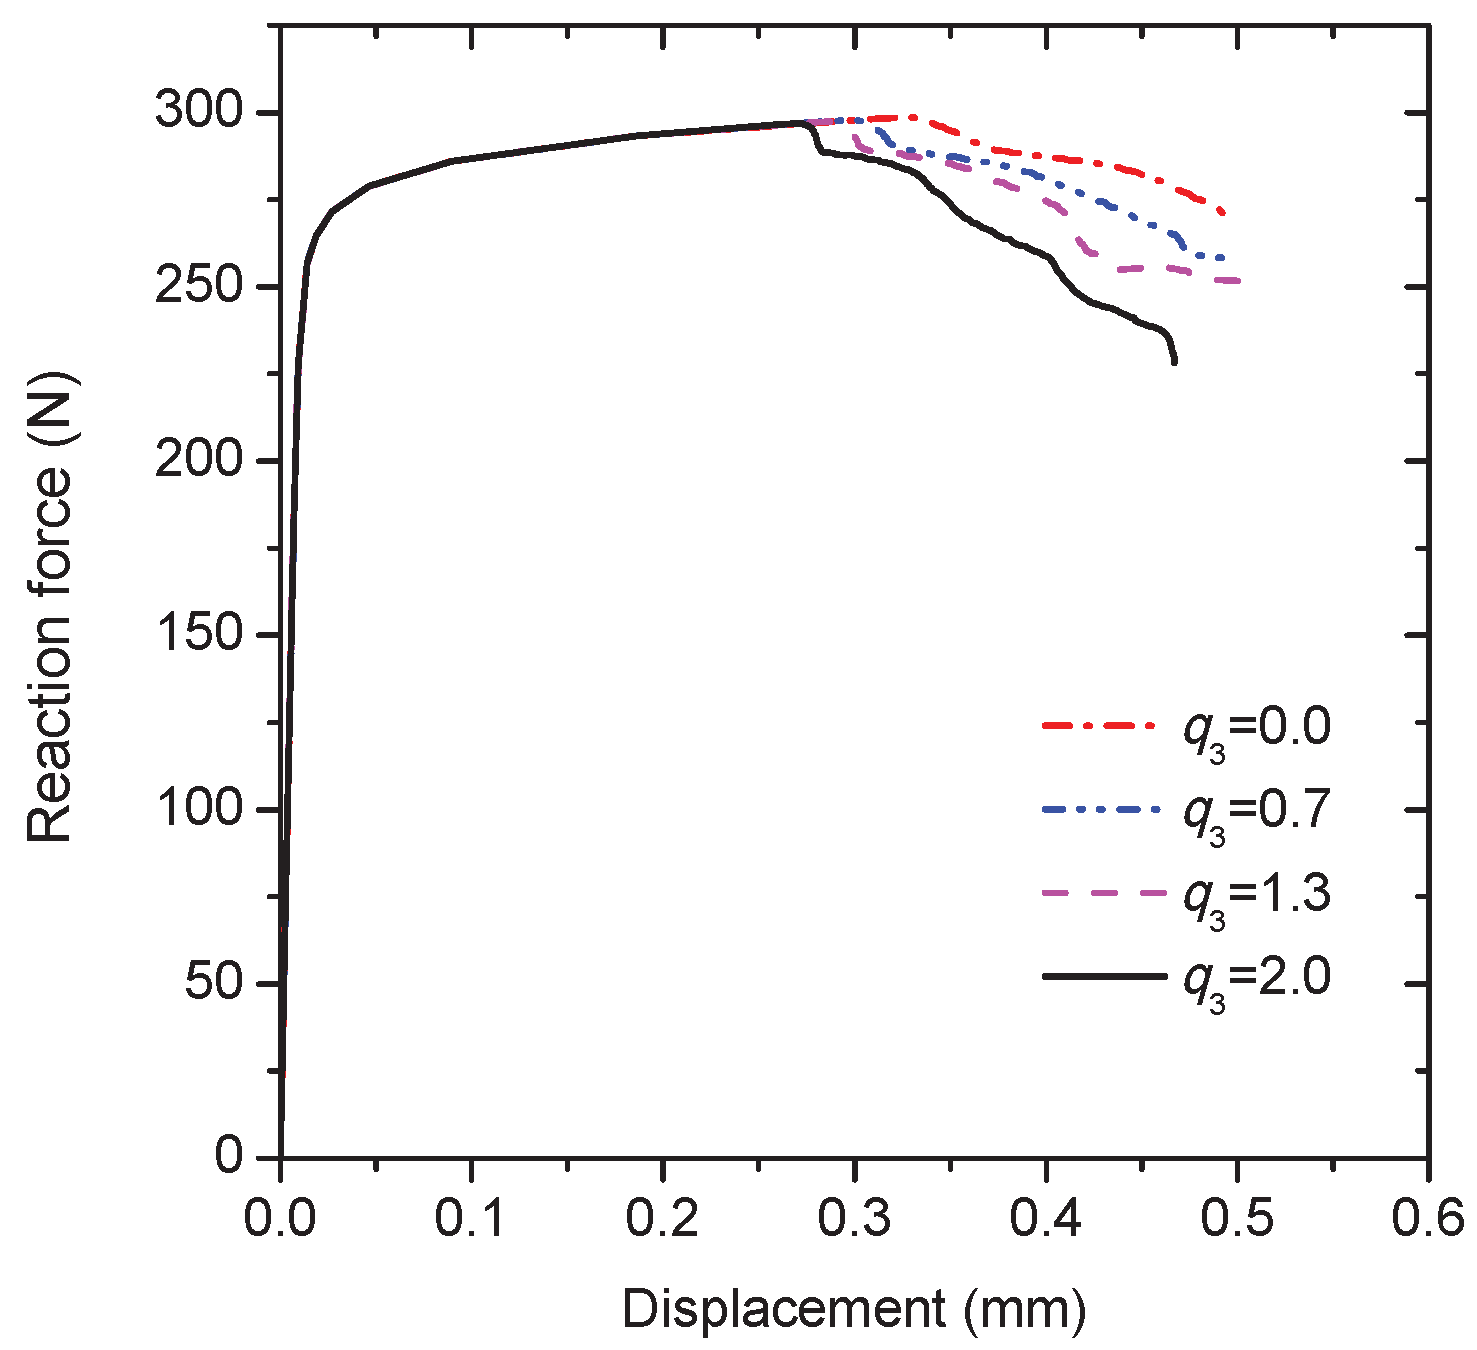
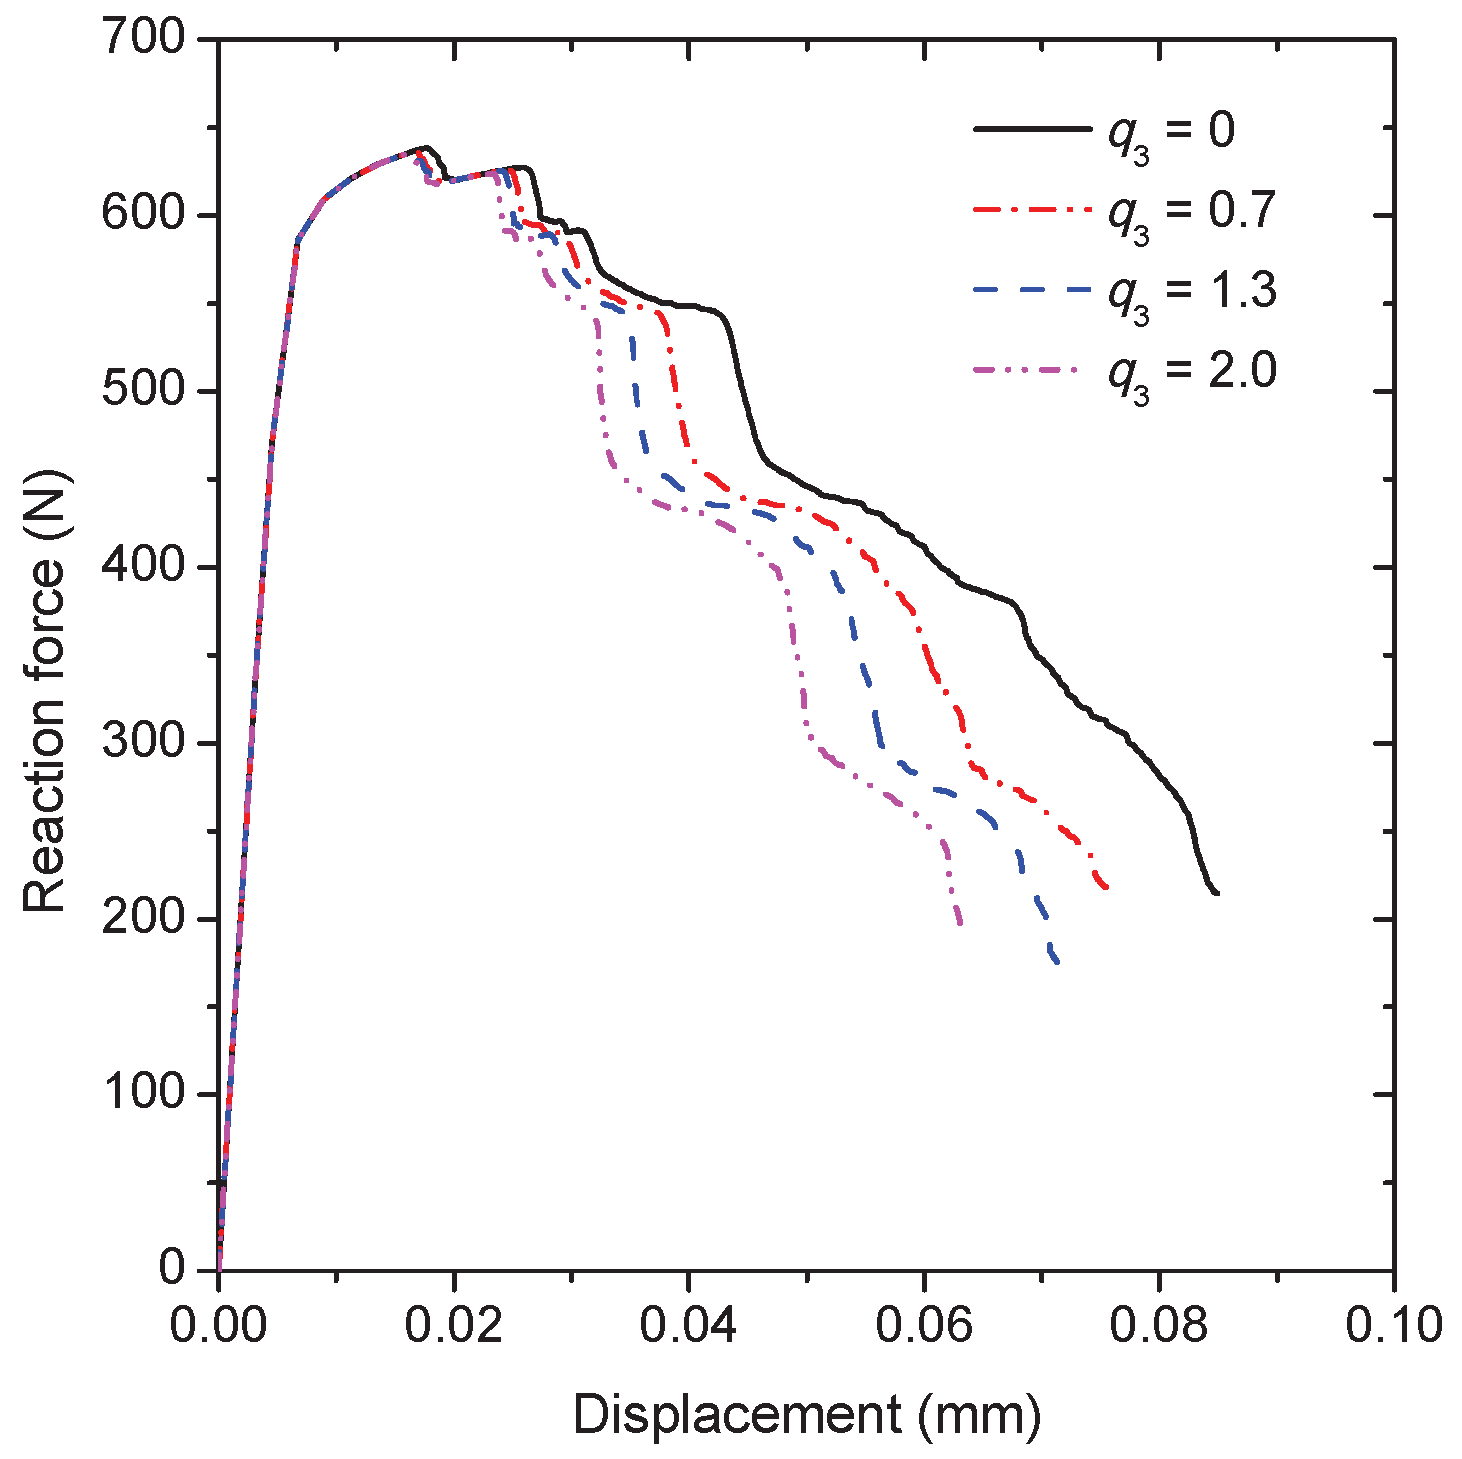
Since changing the parameter
results in a variation in the growth rate of voids, and a change of the strain at which fracture occurs [
17], the effects of the void shearing mechanism on the intergranular crack propagation are considered by varying the value of
. The macroscopic load-displacement curves are compared for the different values of
as plotted in
Figure 10. As deformation progresses, the peak load is reached, and then the external load decreases due to the crack initiation at the notch-tip. However, there is no sudden drop of load after the crack initiation, instead there is a load plateau associated with the initial stage of crack propagation. The length of the load plateau for
= 2.0 is shorter than other cases due to the faster void shearing process. Meanwhile, although the external load for
= 2.0 drops more quickly during the subsequent deformation, the crack propagation path is exactly the same as other cases (see, e.g.,
Figure 9).
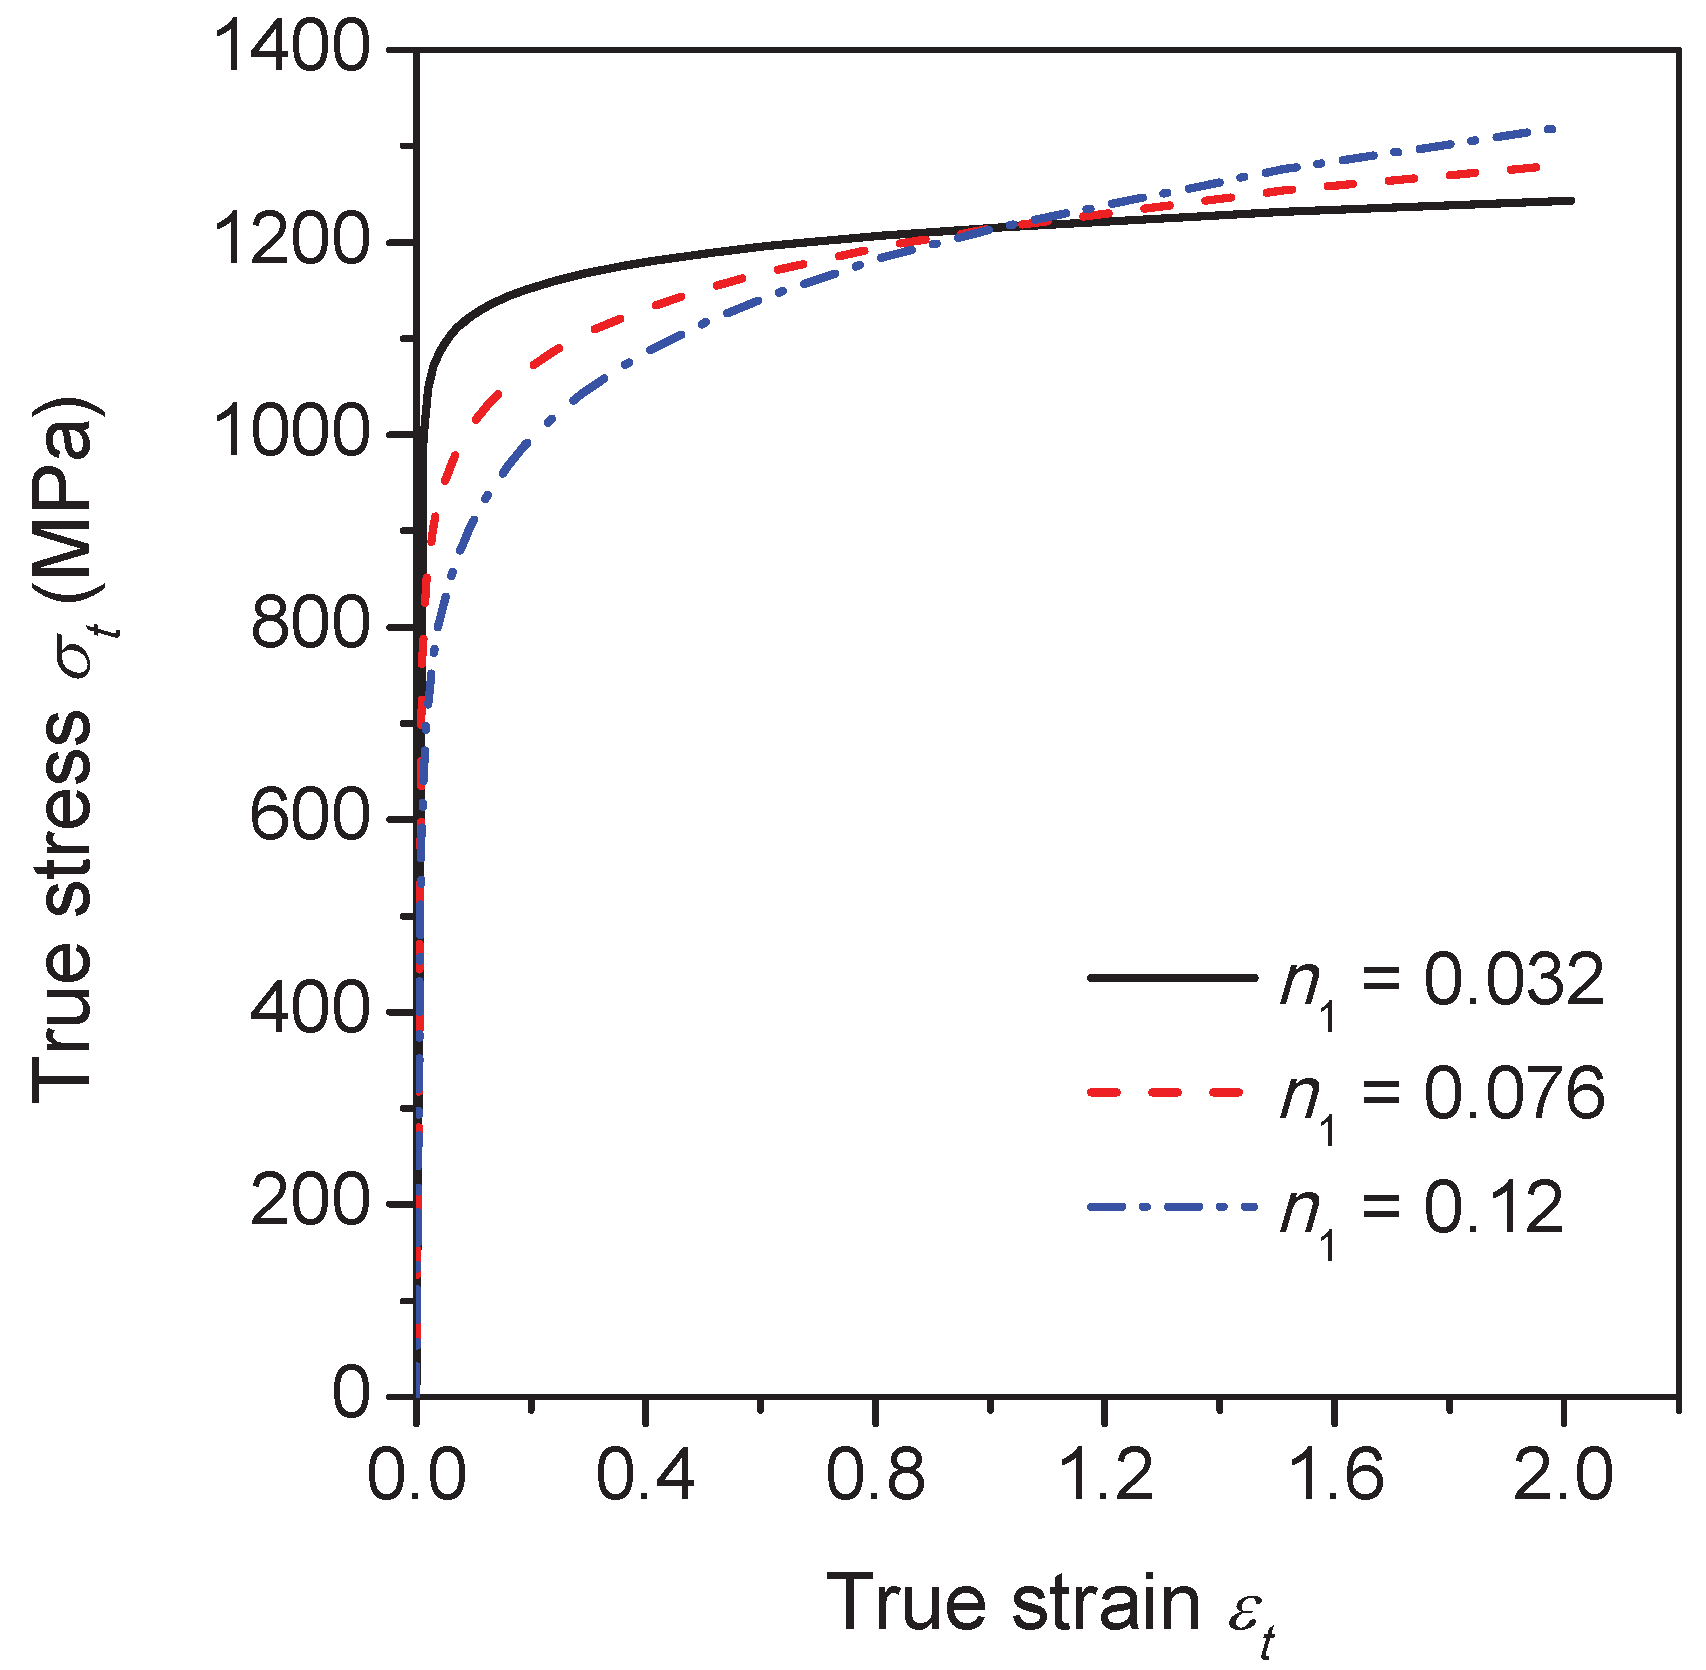
In order to explore the influence of the flow properties of the grain interiors on the intergranular crack propagation behavior, three different flow curves are considered by varying the strain hardening exponent
in Equation (
20), namely,
is 0.032, 0.076 and 0.12, as illustrated in
Figure 11. During calculations, the flow properties of the grain boundary
phase layer are fixed and
= 0.7. The yield stress of the grain interiors
can be derived by substituting
= 0.2% into Equation (
20). The ratio between
and the yield stress of the grain boundary
phase layer
equals 1.3, 1.0 and 0.8 for each
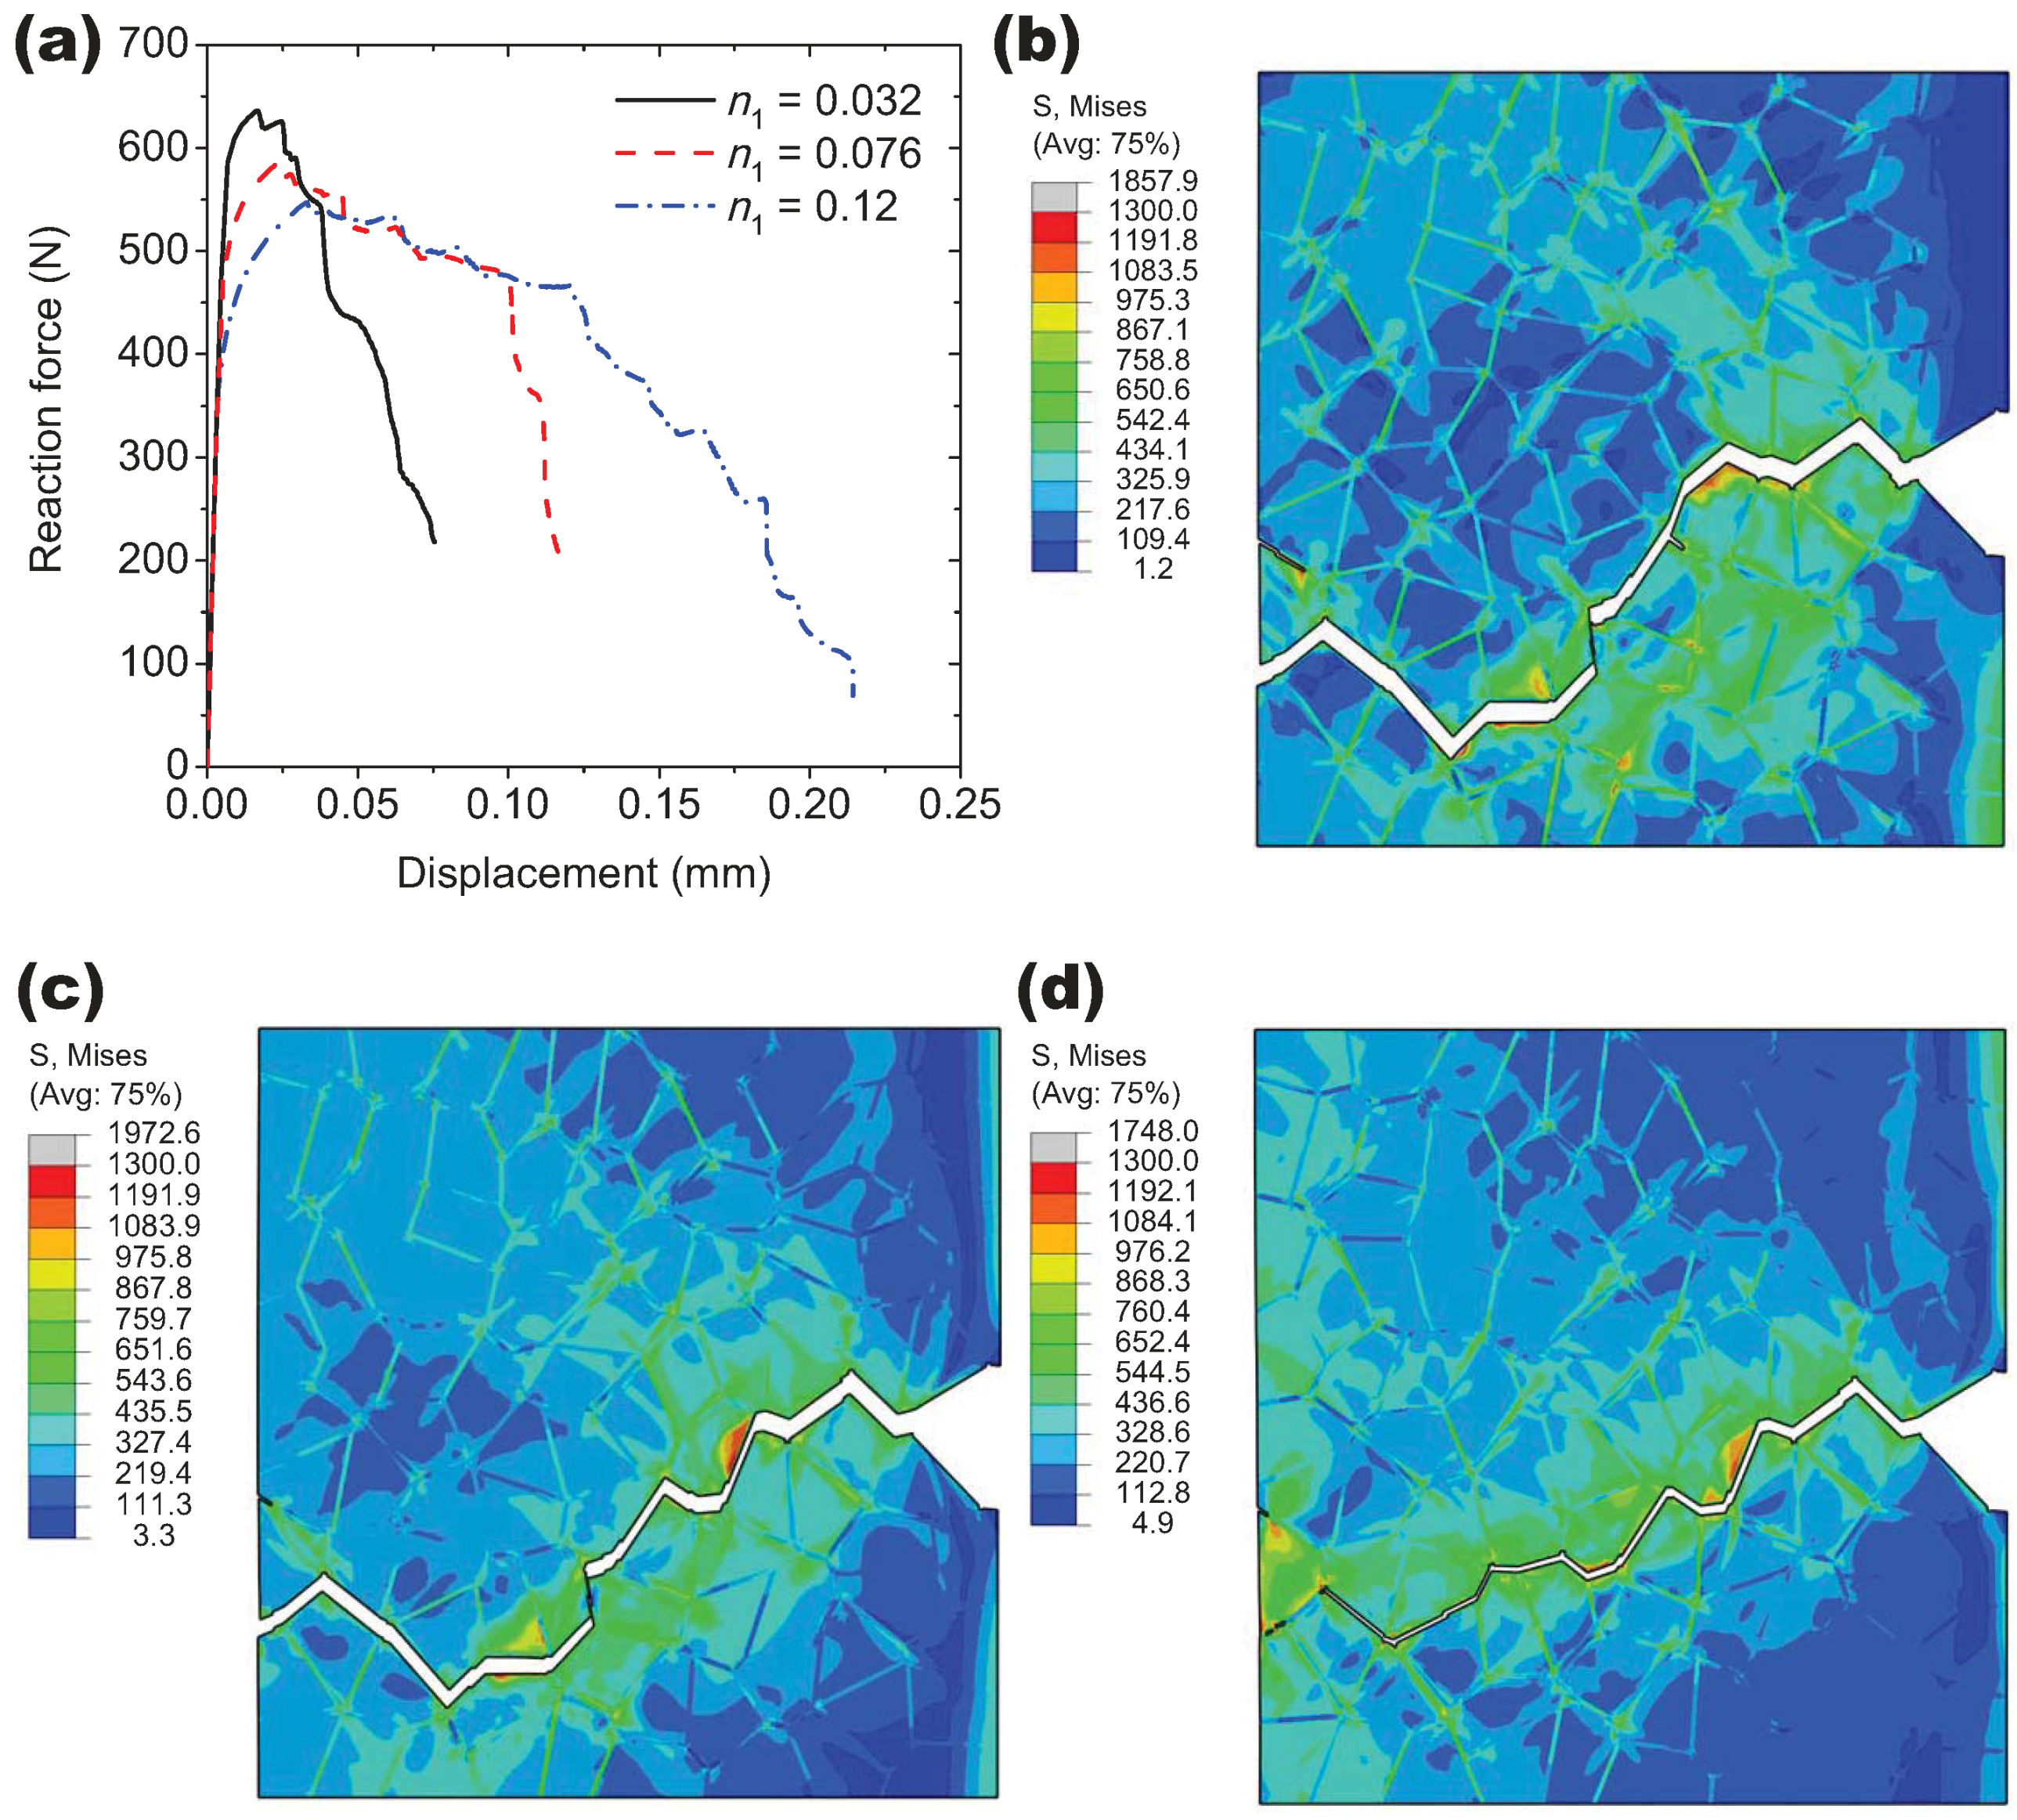
approximately. The simulation results for
= 0.076 and 0.12 together with the former result of
= 0.032 are compared in
Figure 12. Based on the macroscopic load-displacement curves as shown in
Figure 12a, the material softening occurs firstly at
= 0.032 associated with the fastest crack initiation process, which indicates that the decrement of the strain hardening exponent of the grain interiors can promote the formation of the intergranular crack. It also can be seen that the peak load for
= 0.032 is higher than the other two cases due to the higher ratio of
. Since there is only one propagating crack that exists as shown in
Figure 12d, the external load drops slower at
= 0.12 in comparison with other two cases corresponding to the multiple crack propagation (see, e.g.,
Figure 9).
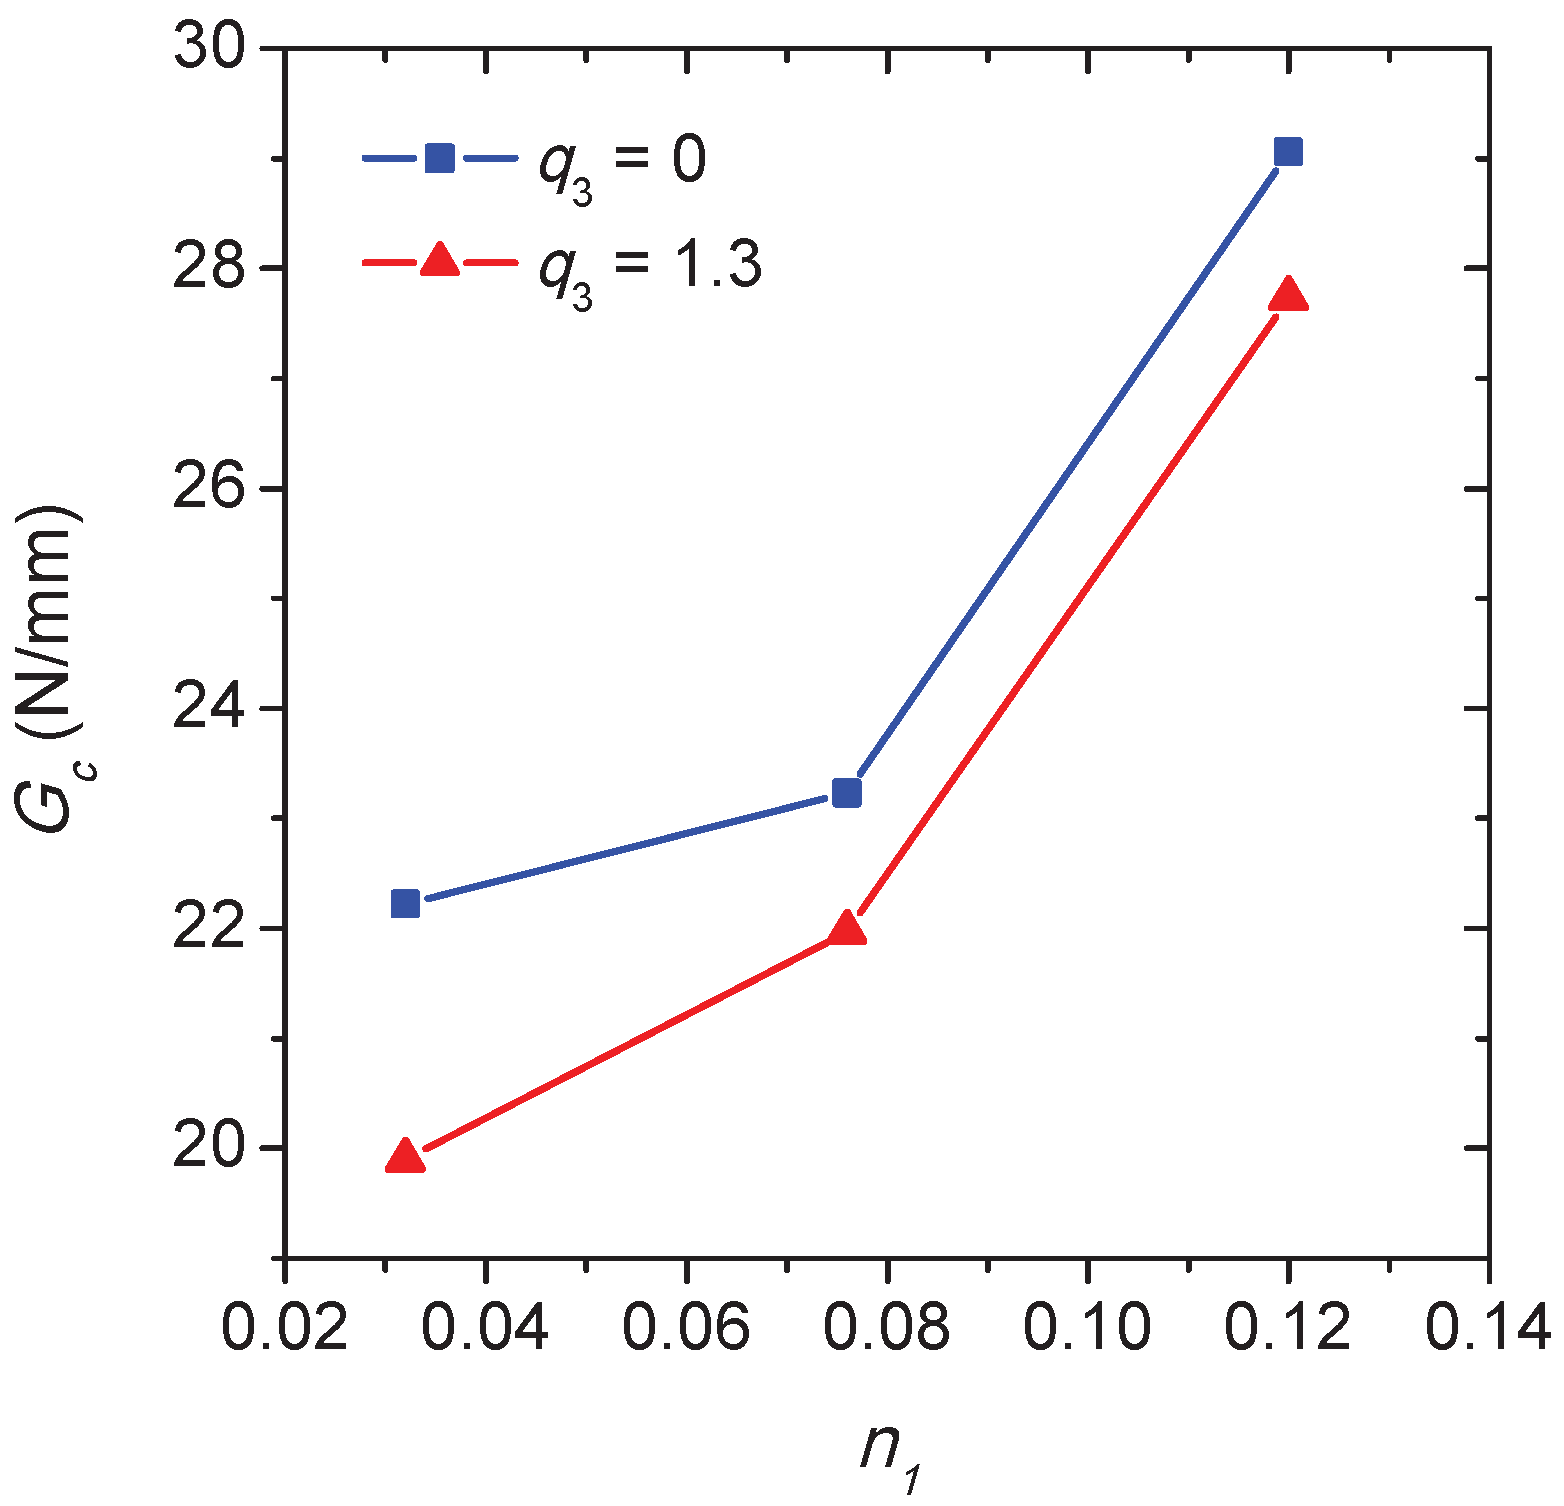
As mentioned, the intergranular fracture properties depend on the hardening ability of the grain interiors, the fracture toughness of Ti-5553 is estimated for the different strain hardening exponents. Since the plastic zone near the crack initiation site is constrained geometrically to the near region of grain boundary, the energy release rate
G, which is valid in the small scale yielding, is adopted in this study. According to Irwin’s crack closure integral, the released energy
G for a crack propagates from the length
a to
a +
is identical to the energy required to close the crack of length
. This idea has been realized according to the virtual crack closure technique (VCCT) [
35] as the following:
where
is the crack propagation length and
B is the thickness of the crack surface. As depicted in
Figure 13,
and
are the nodal forces of node
i at the crack-tip along
x and
y directions,
and
are the relative nodal displacements corresponding to the crack sliding and opening of the upper and lower crack surface at node
i-1 along
x and
y directions, respectively. The total energy release rate
G is the sum of
associated with the opening mode and
associated with the sliding mode. This technique has been implemented into ABAQUS according to the user defined element interface (UEL) [
23] based on the algorithm introduced in Ref. [
35].
Since fracture toughness is generally determined at the onset of crack propagation under the plane strain condition [
36], the applied displacement corresponding to the crack length
a = 0.02 mm is used to determine the critical energy release rate
. At this moment, there is only one crack that propagates for each
. The procedure for calculating
is similar to that for the previous notch simulation, and the only difference is that the user elements are pre-defined along the crack propagation path according to the former numerical results. In order to examine the influence of the void shearing mechanism on fracture toughness, two different values of
are considered to determine the released energy as shown in
Figure 14, where
G =
+
. Since
can be negligible compared with
at
a = 0.02 mm, the stress intensity factor for the opening mode can be derived based on
=
and
=
for the plane strain condition. Assume that the Young’s modulus
E = 120 GPa for the polycrystal according to the macroscopic stress–strain response as shown in
Figure 5, and the Poisson’s ratio
= 0.33, then the fracture toughness
= 60.7 MPa
for
= 1.3 and
= 0.12 approximately. This value is in agreement with the general fracture toughness found in the literature [
1,
37] for the Ti-5553 alloy with lamellar structure. In
Figure 14, the variation of critical energy release rate
as a function of the hardening exponent
is plotted for two different values of
. In both cases, an increase of
associated with a decrease of the ratio
can result in the higher fracture toughness. Meanwhile, the fracture toughness of Ti-5553 decreases with the increase of
at a given
. Since the modifications of the yield stress or the strain hardening behavior of the grain interiors can be controlled by changing the size or the morphology of the intragranular
precipitate [
37], the simulations indicate that the heat treatment associated with the improvement of the strain hardening can be performed to resist the intergranular fracture of the lamellar
alloys.
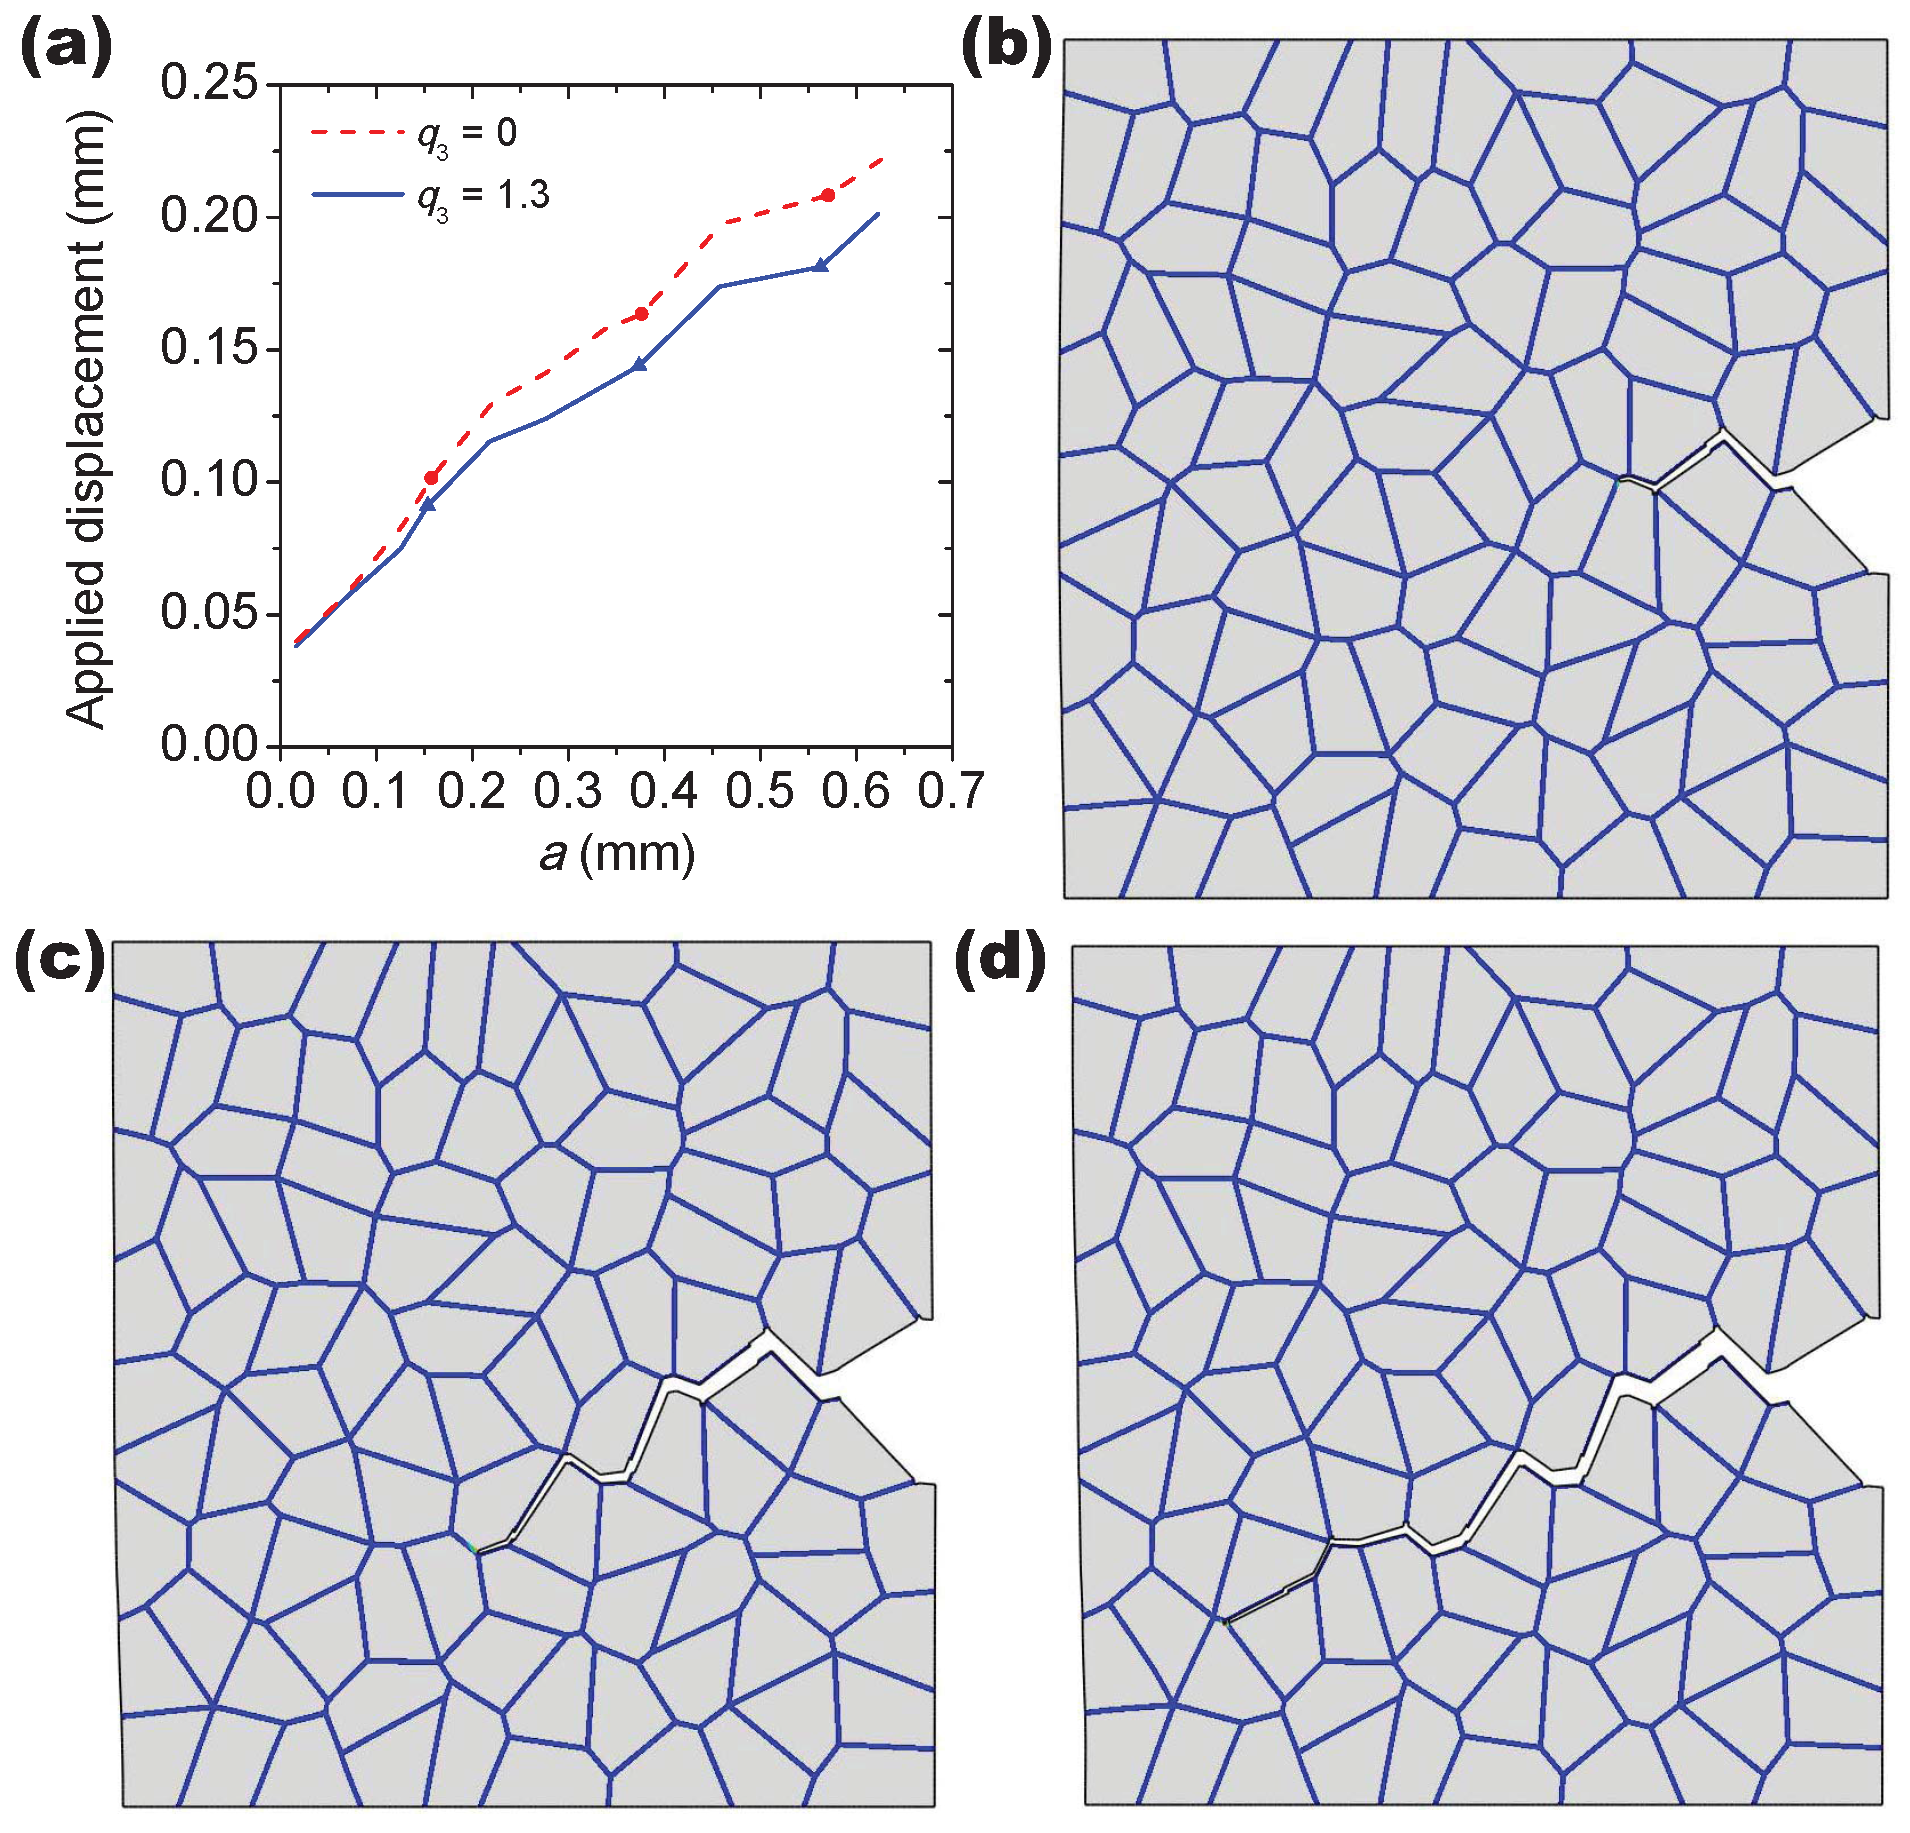
In
Figure 15, the effect of void shearing on the crack propagation process is conducted for the hardening exponent
= 0.12, unlike the other two cases of
= 0.032 and 0.076, and only one predominant crack propagates in this case during deformation. As shown in
Figure 14a, the applied displacement continuously increases with the crack length
a, where the three points on each curve correspond to those moments of the crack propagation as displayed in
Figure 15b–d. The sharp point on the curves indicates that the intergranular crack meets a triple point during propagation (see, e.g.,
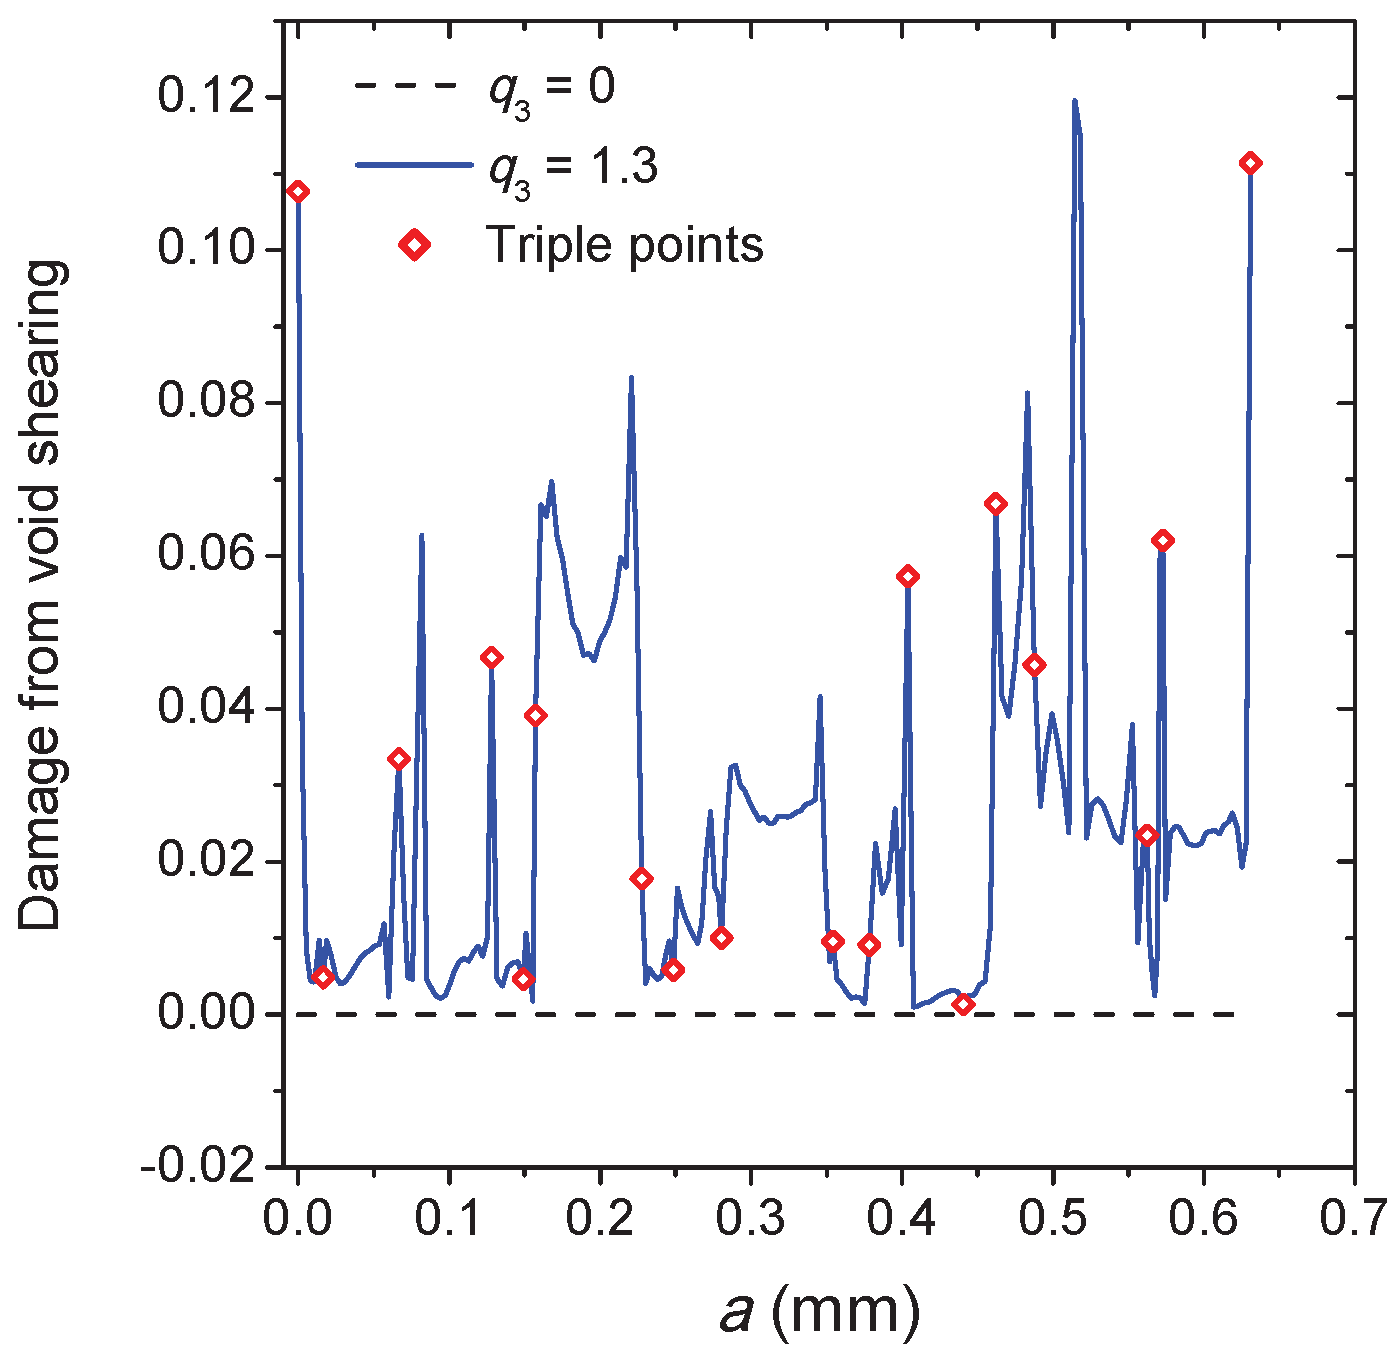
Figure 15d). The damage accumulation caused by void shearing along the crack propagation path is shown in
Figure 16. Depending on the stress field and the grain morphology, the damage associated with
= 1.3 fluctuates significantly during crack propagation, and most of the peaks and valleys are located at the triple points. As expected, the presence of the void shearing mechanism strongly affects the intergranular crack propagation, and the increment of
promotes the process of intergranular fracture.


