Figure 1.
SEM micrographs of the silica nanoparticle dispersion with a 0.75 PHR (part of SiO2 per hundred parts of resin) content, employing the sol-gel in situ technique: (a) Tetraethyl orthosilicate (TEOS) precursor; (b) 3-glycidoxipropyltrimethoxysilane (GPTMS) precursor.
Figure 1.
SEM micrographs of the silica nanoparticle dispersion with a 0.75 PHR (part of SiO2 per hundred parts of resin) content, employing the sol-gel in situ technique: (a) Tetraethyl orthosilicate (TEOS) precursor; (b) 3-glycidoxipropyltrimethoxysilane (GPTMS) precursor.
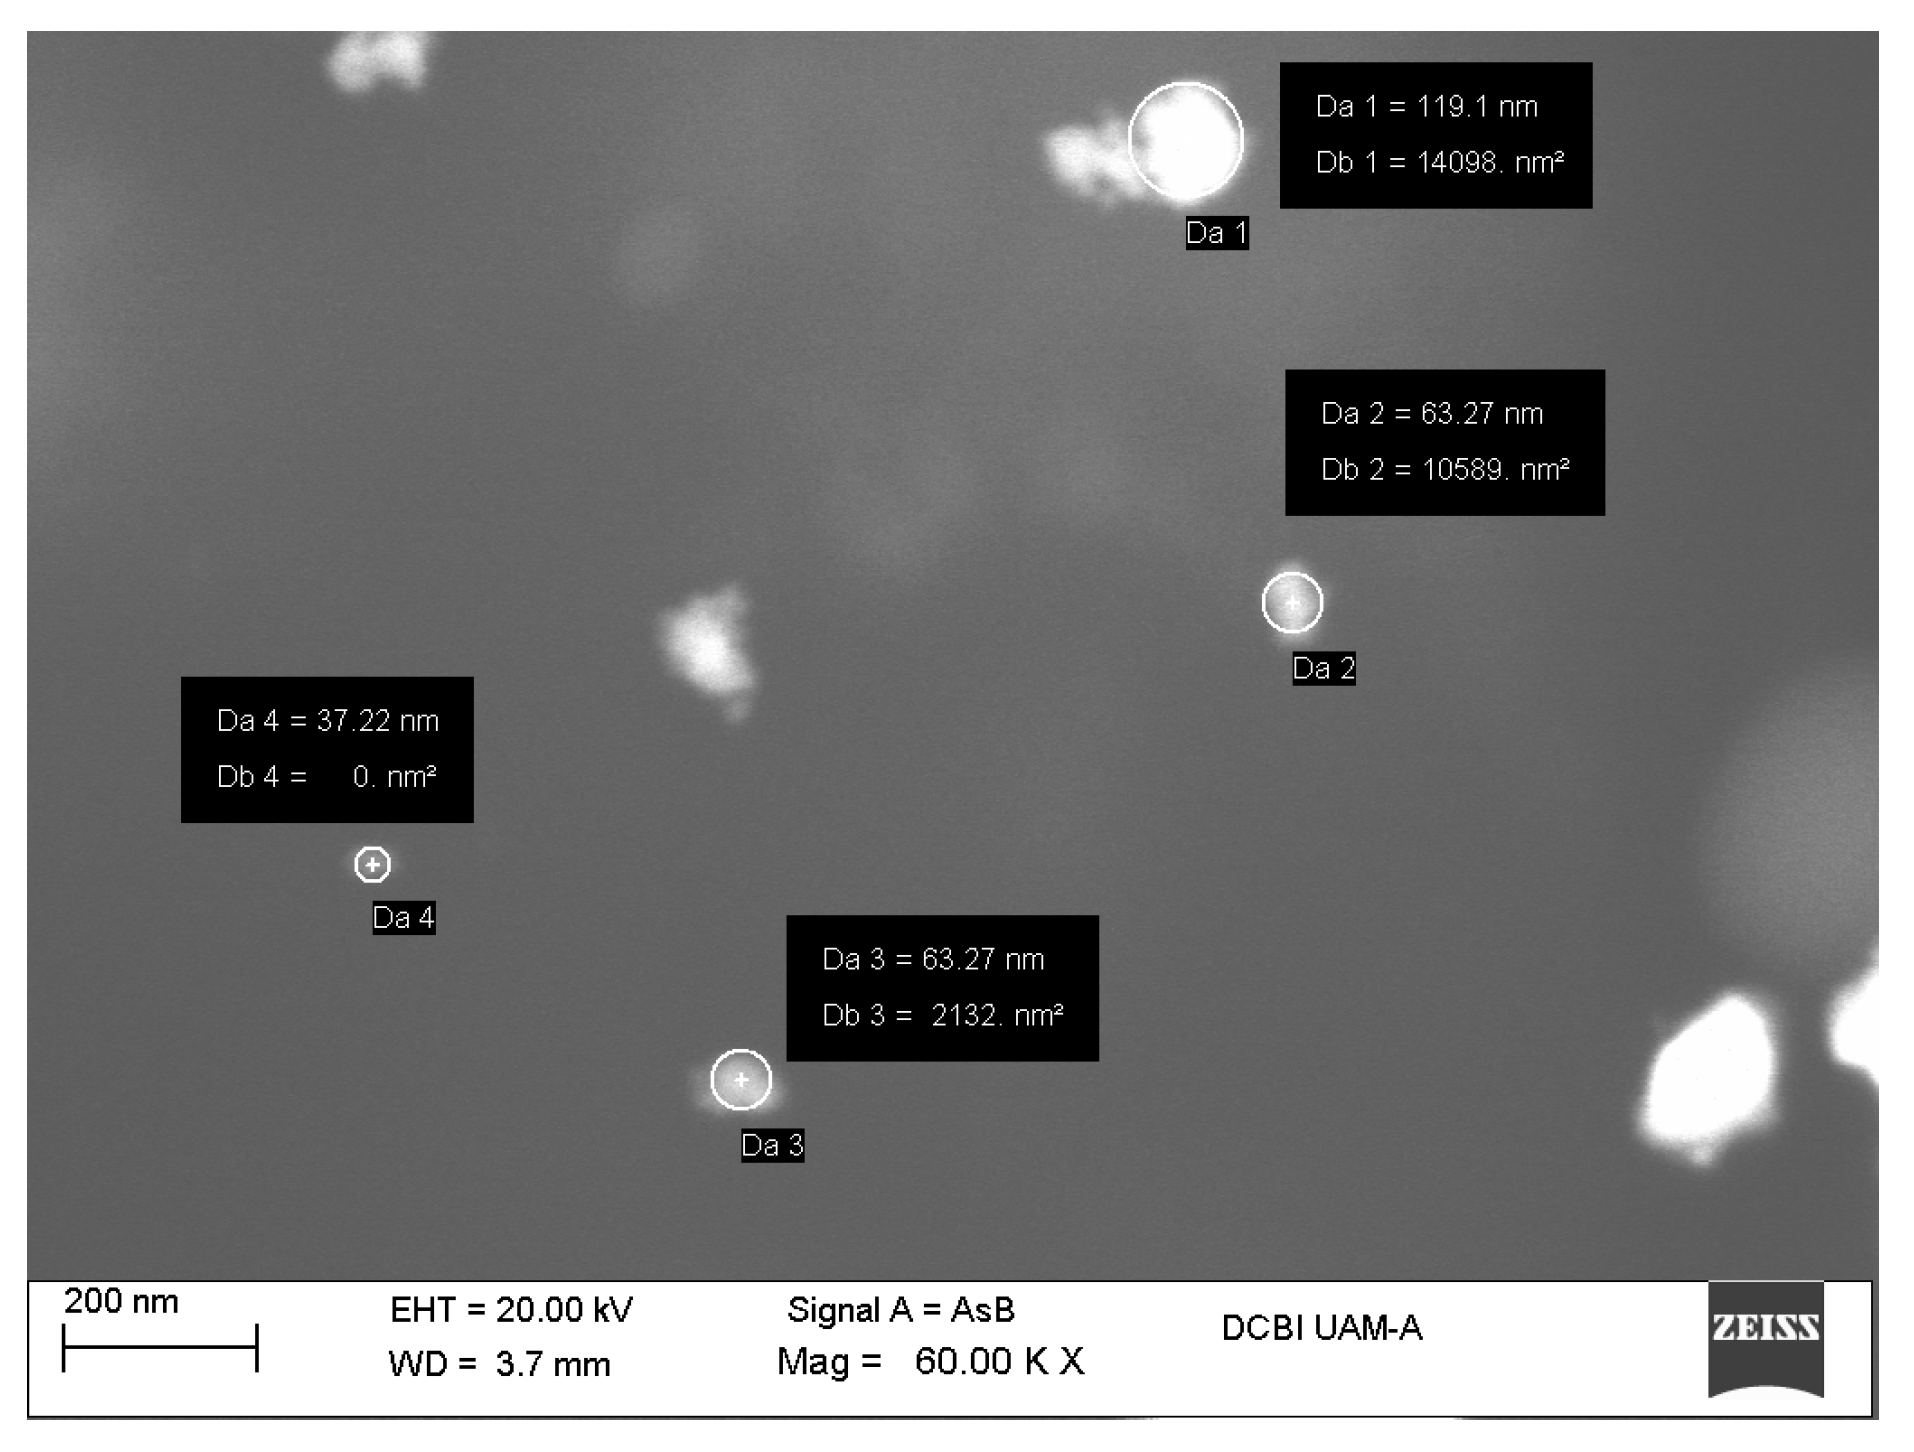
Figure 2.
SEM micrographs of zirconia nanoparticles synthesized employing the sol-gel technique.
Figure 2.
SEM micrographs of zirconia nanoparticles synthesized employing the sol-gel technique.
Figure 3.
(a) Zirconia nanoparticles size distribution; (b) Raw correlation coefficient.
Figure 3.
(a) Zirconia nanoparticles size distribution; (b) Raw correlation coefficient.
Figure 4.
Viscosity of the epoxy-sílica matrix synthesized in situ varying the content of different inorganic precursors: (a,b) TEOS precursor; (c,d) GPTMS precursor.
Figure 4.
Viscosity of the epoxy-sílica matrix synthesized in situ varying the content of different inorganic precursors: (a,b) TEOS precursor; (c,d) GPTMS precursor.
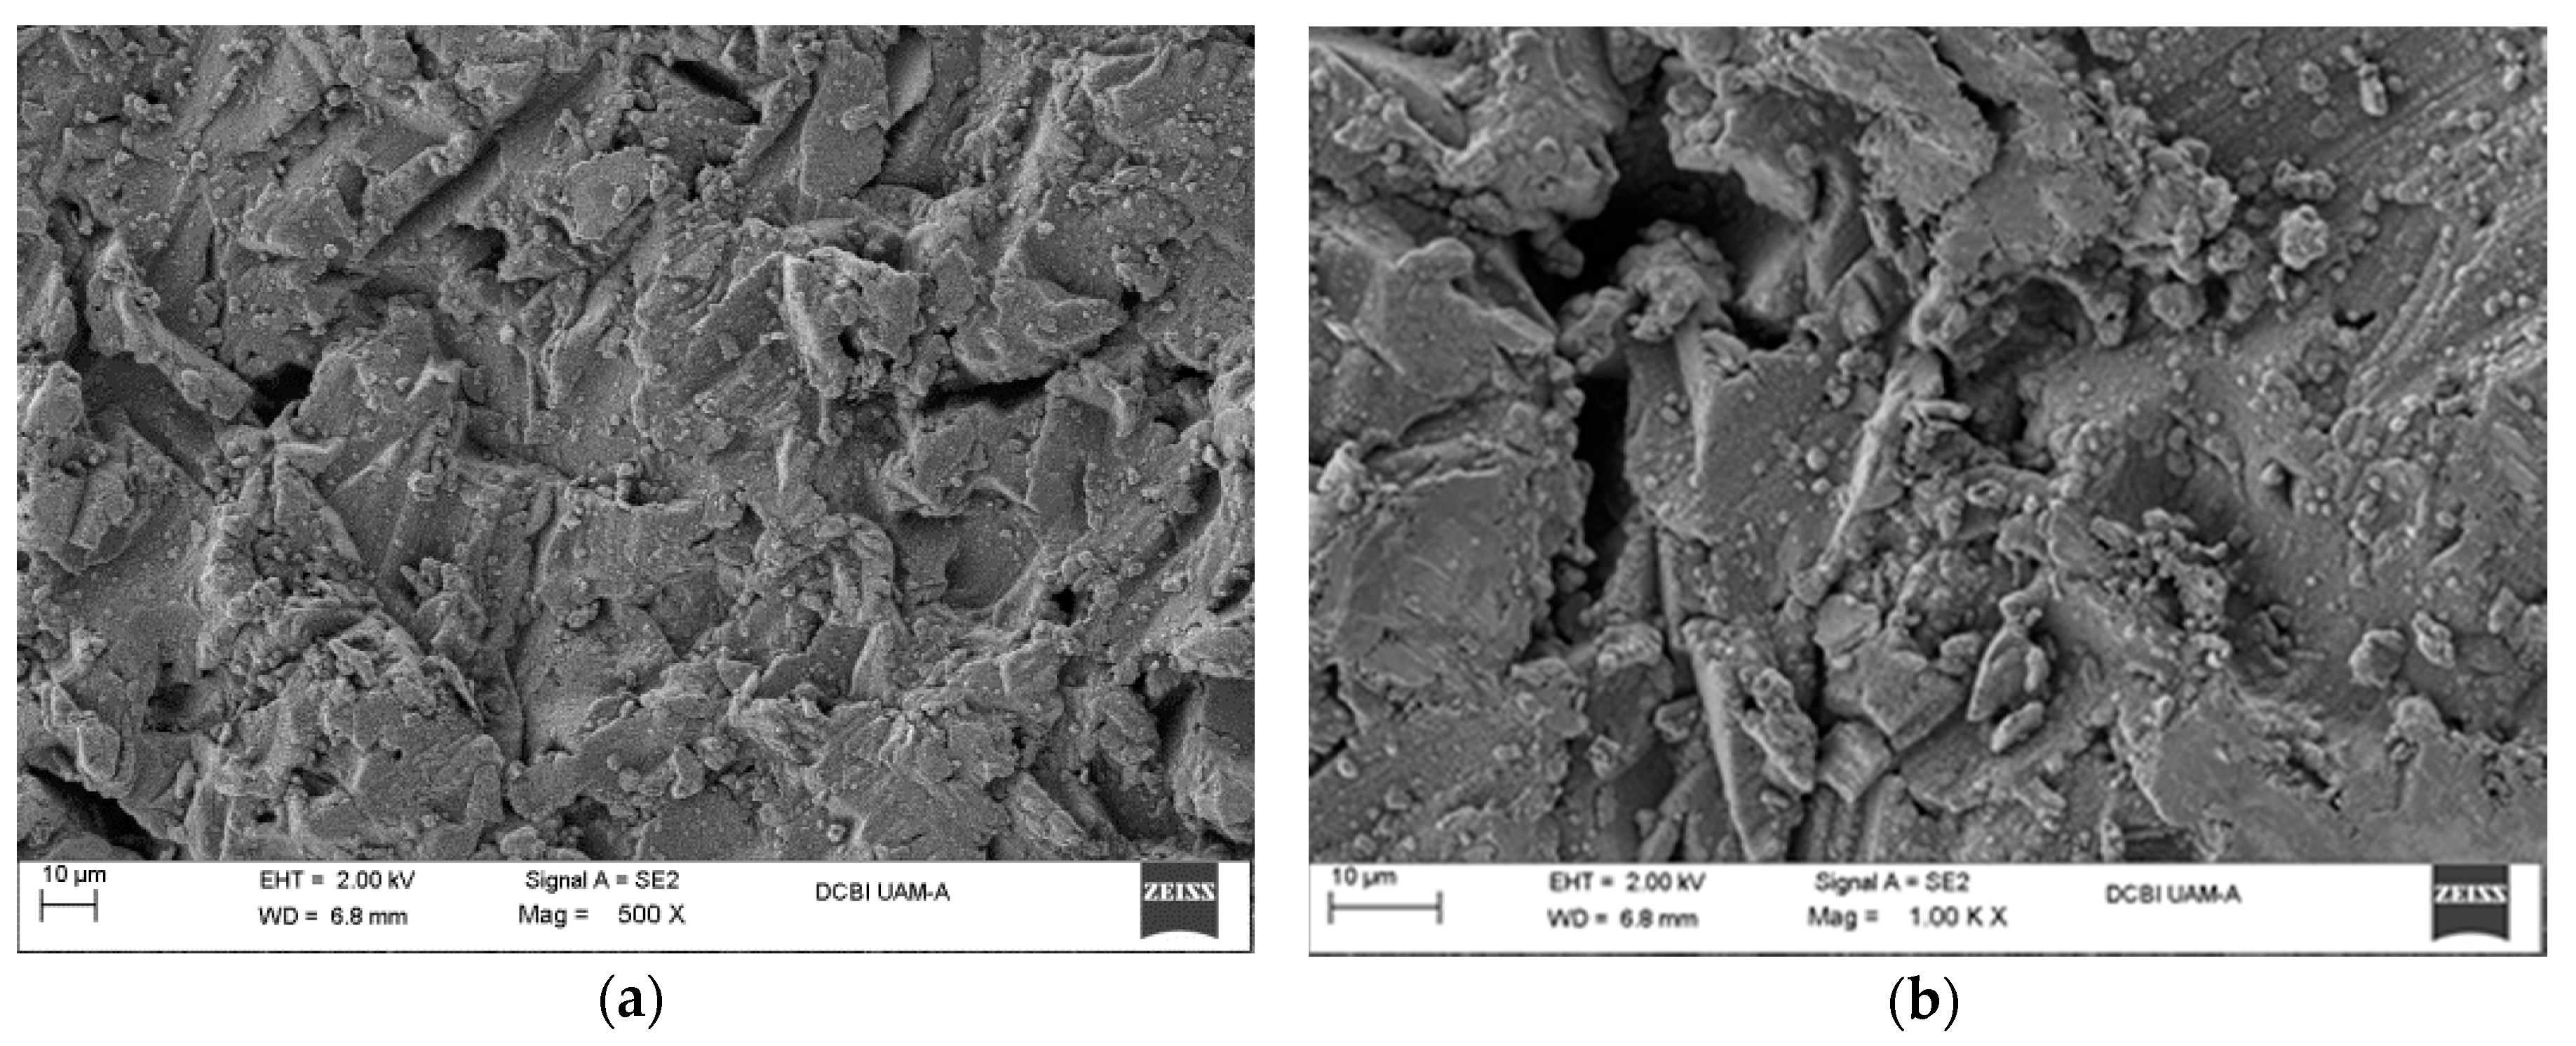
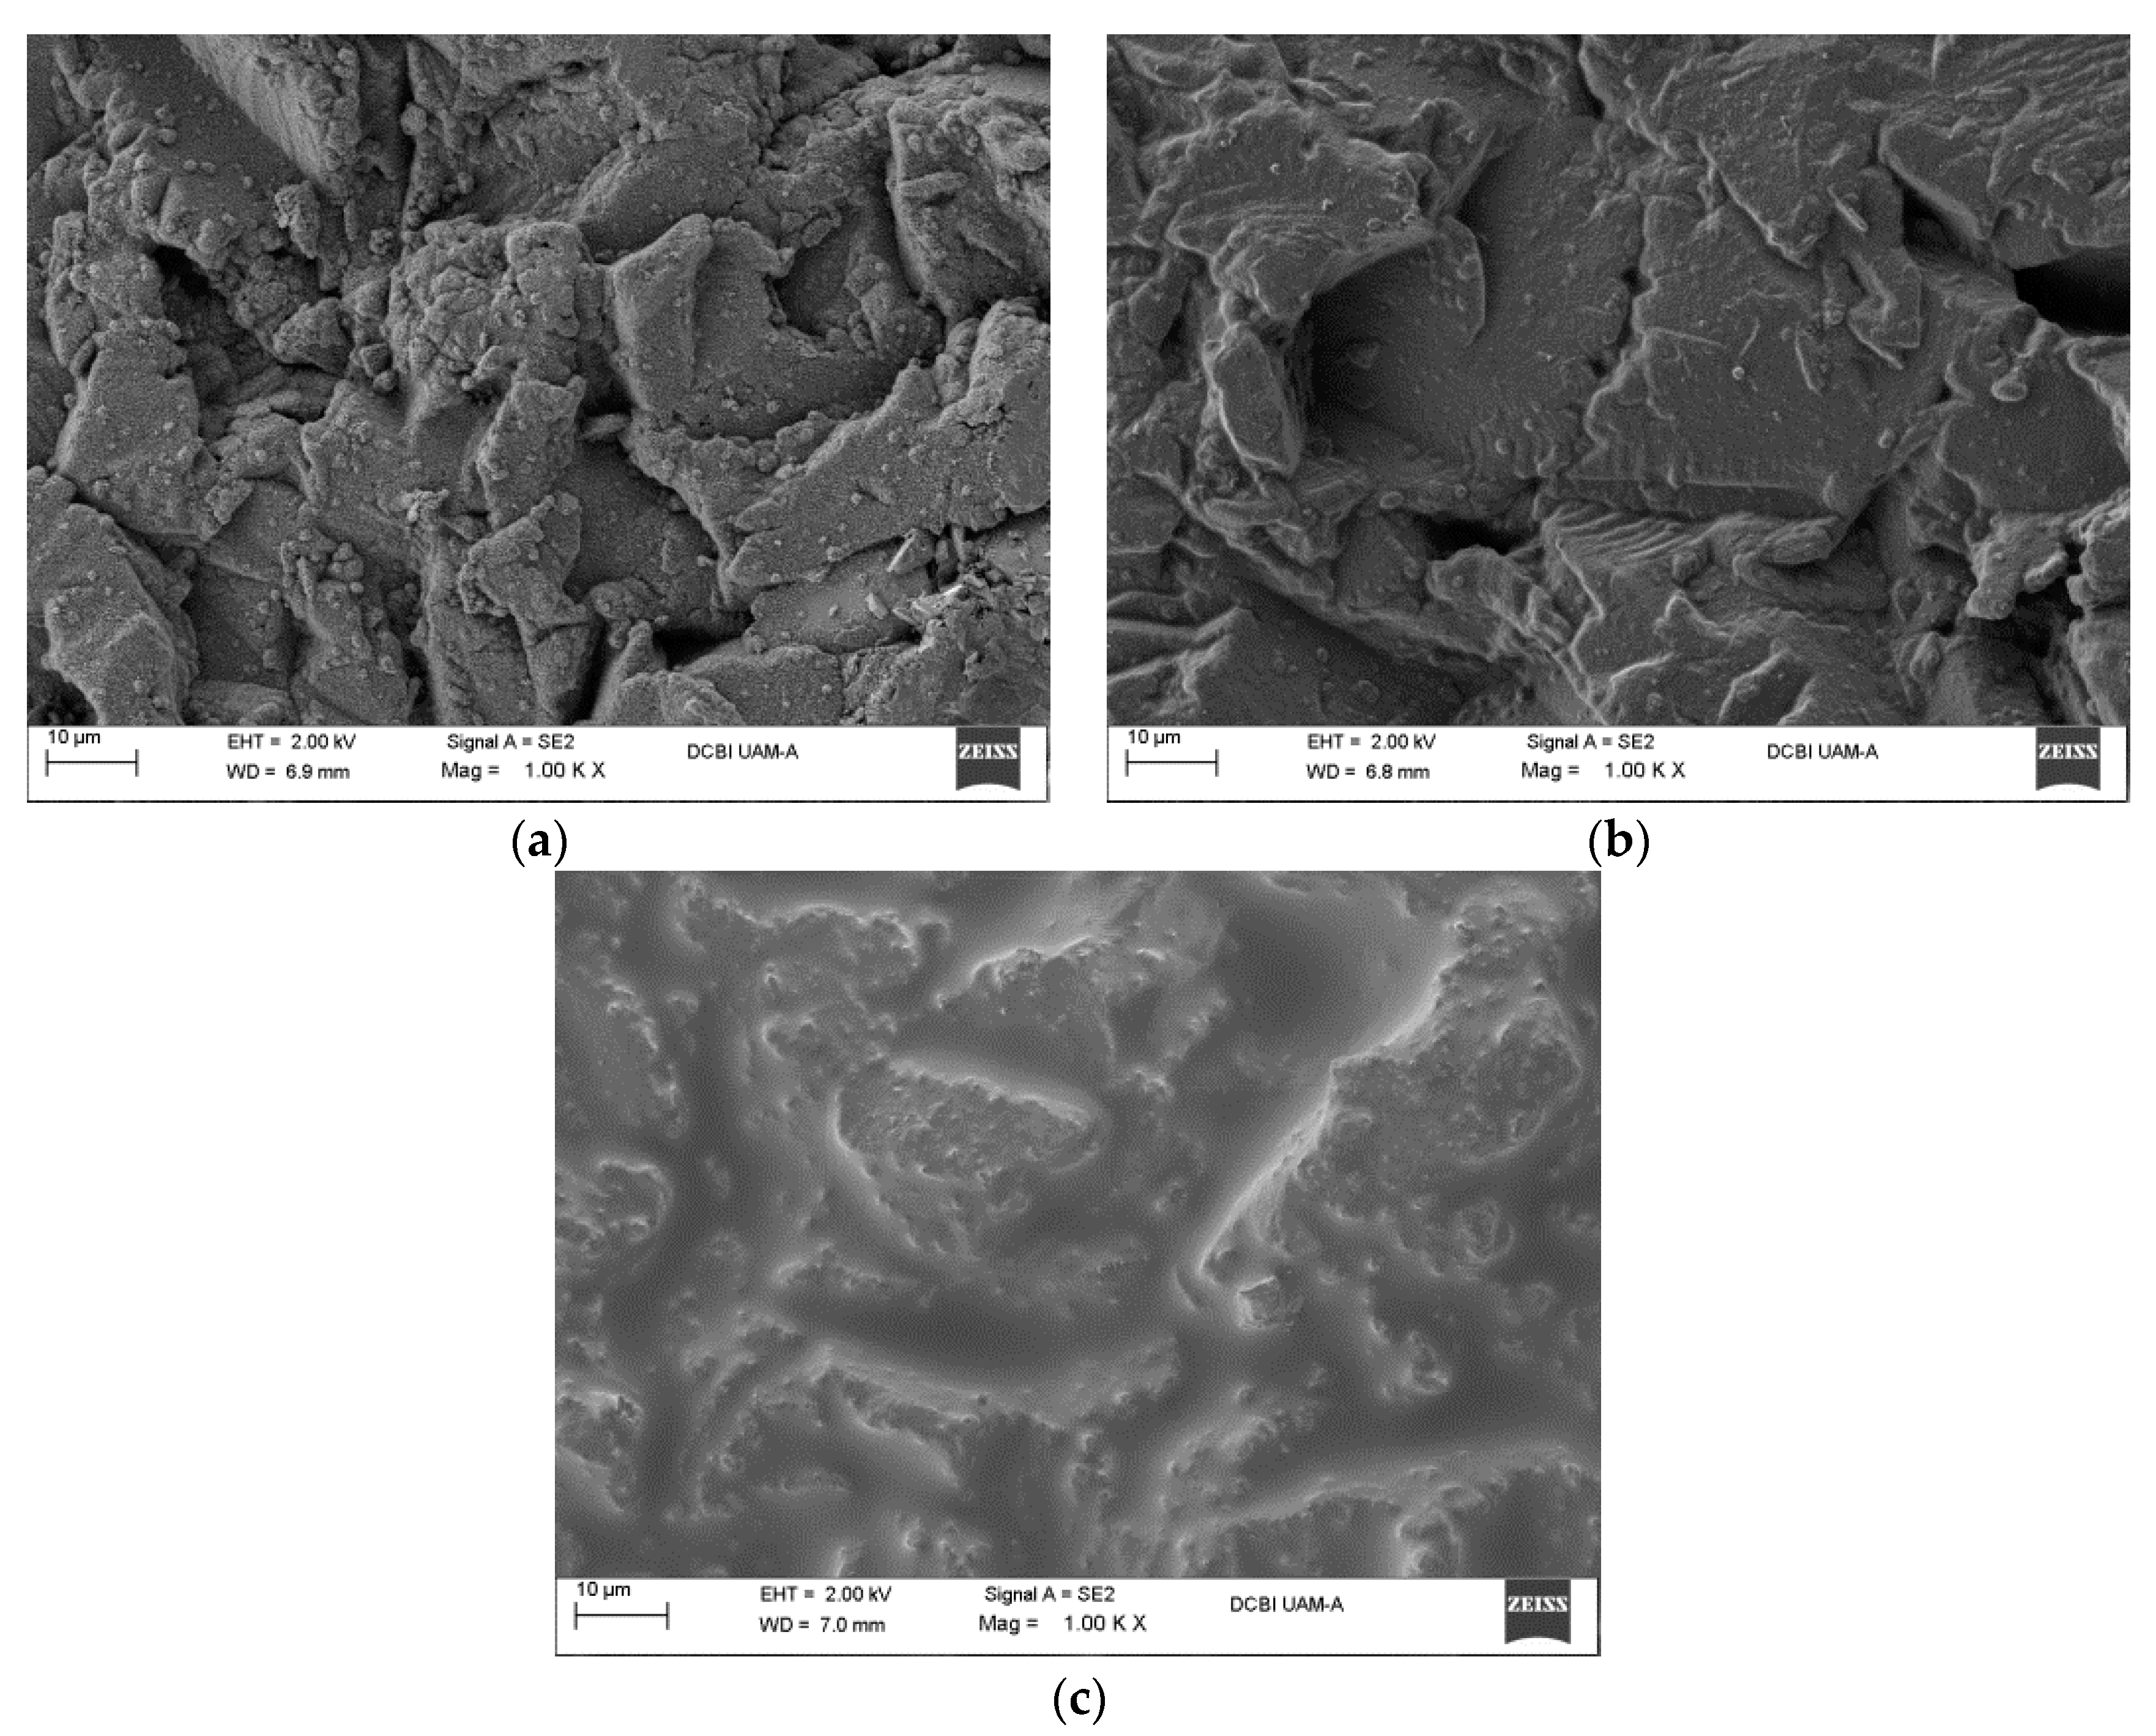
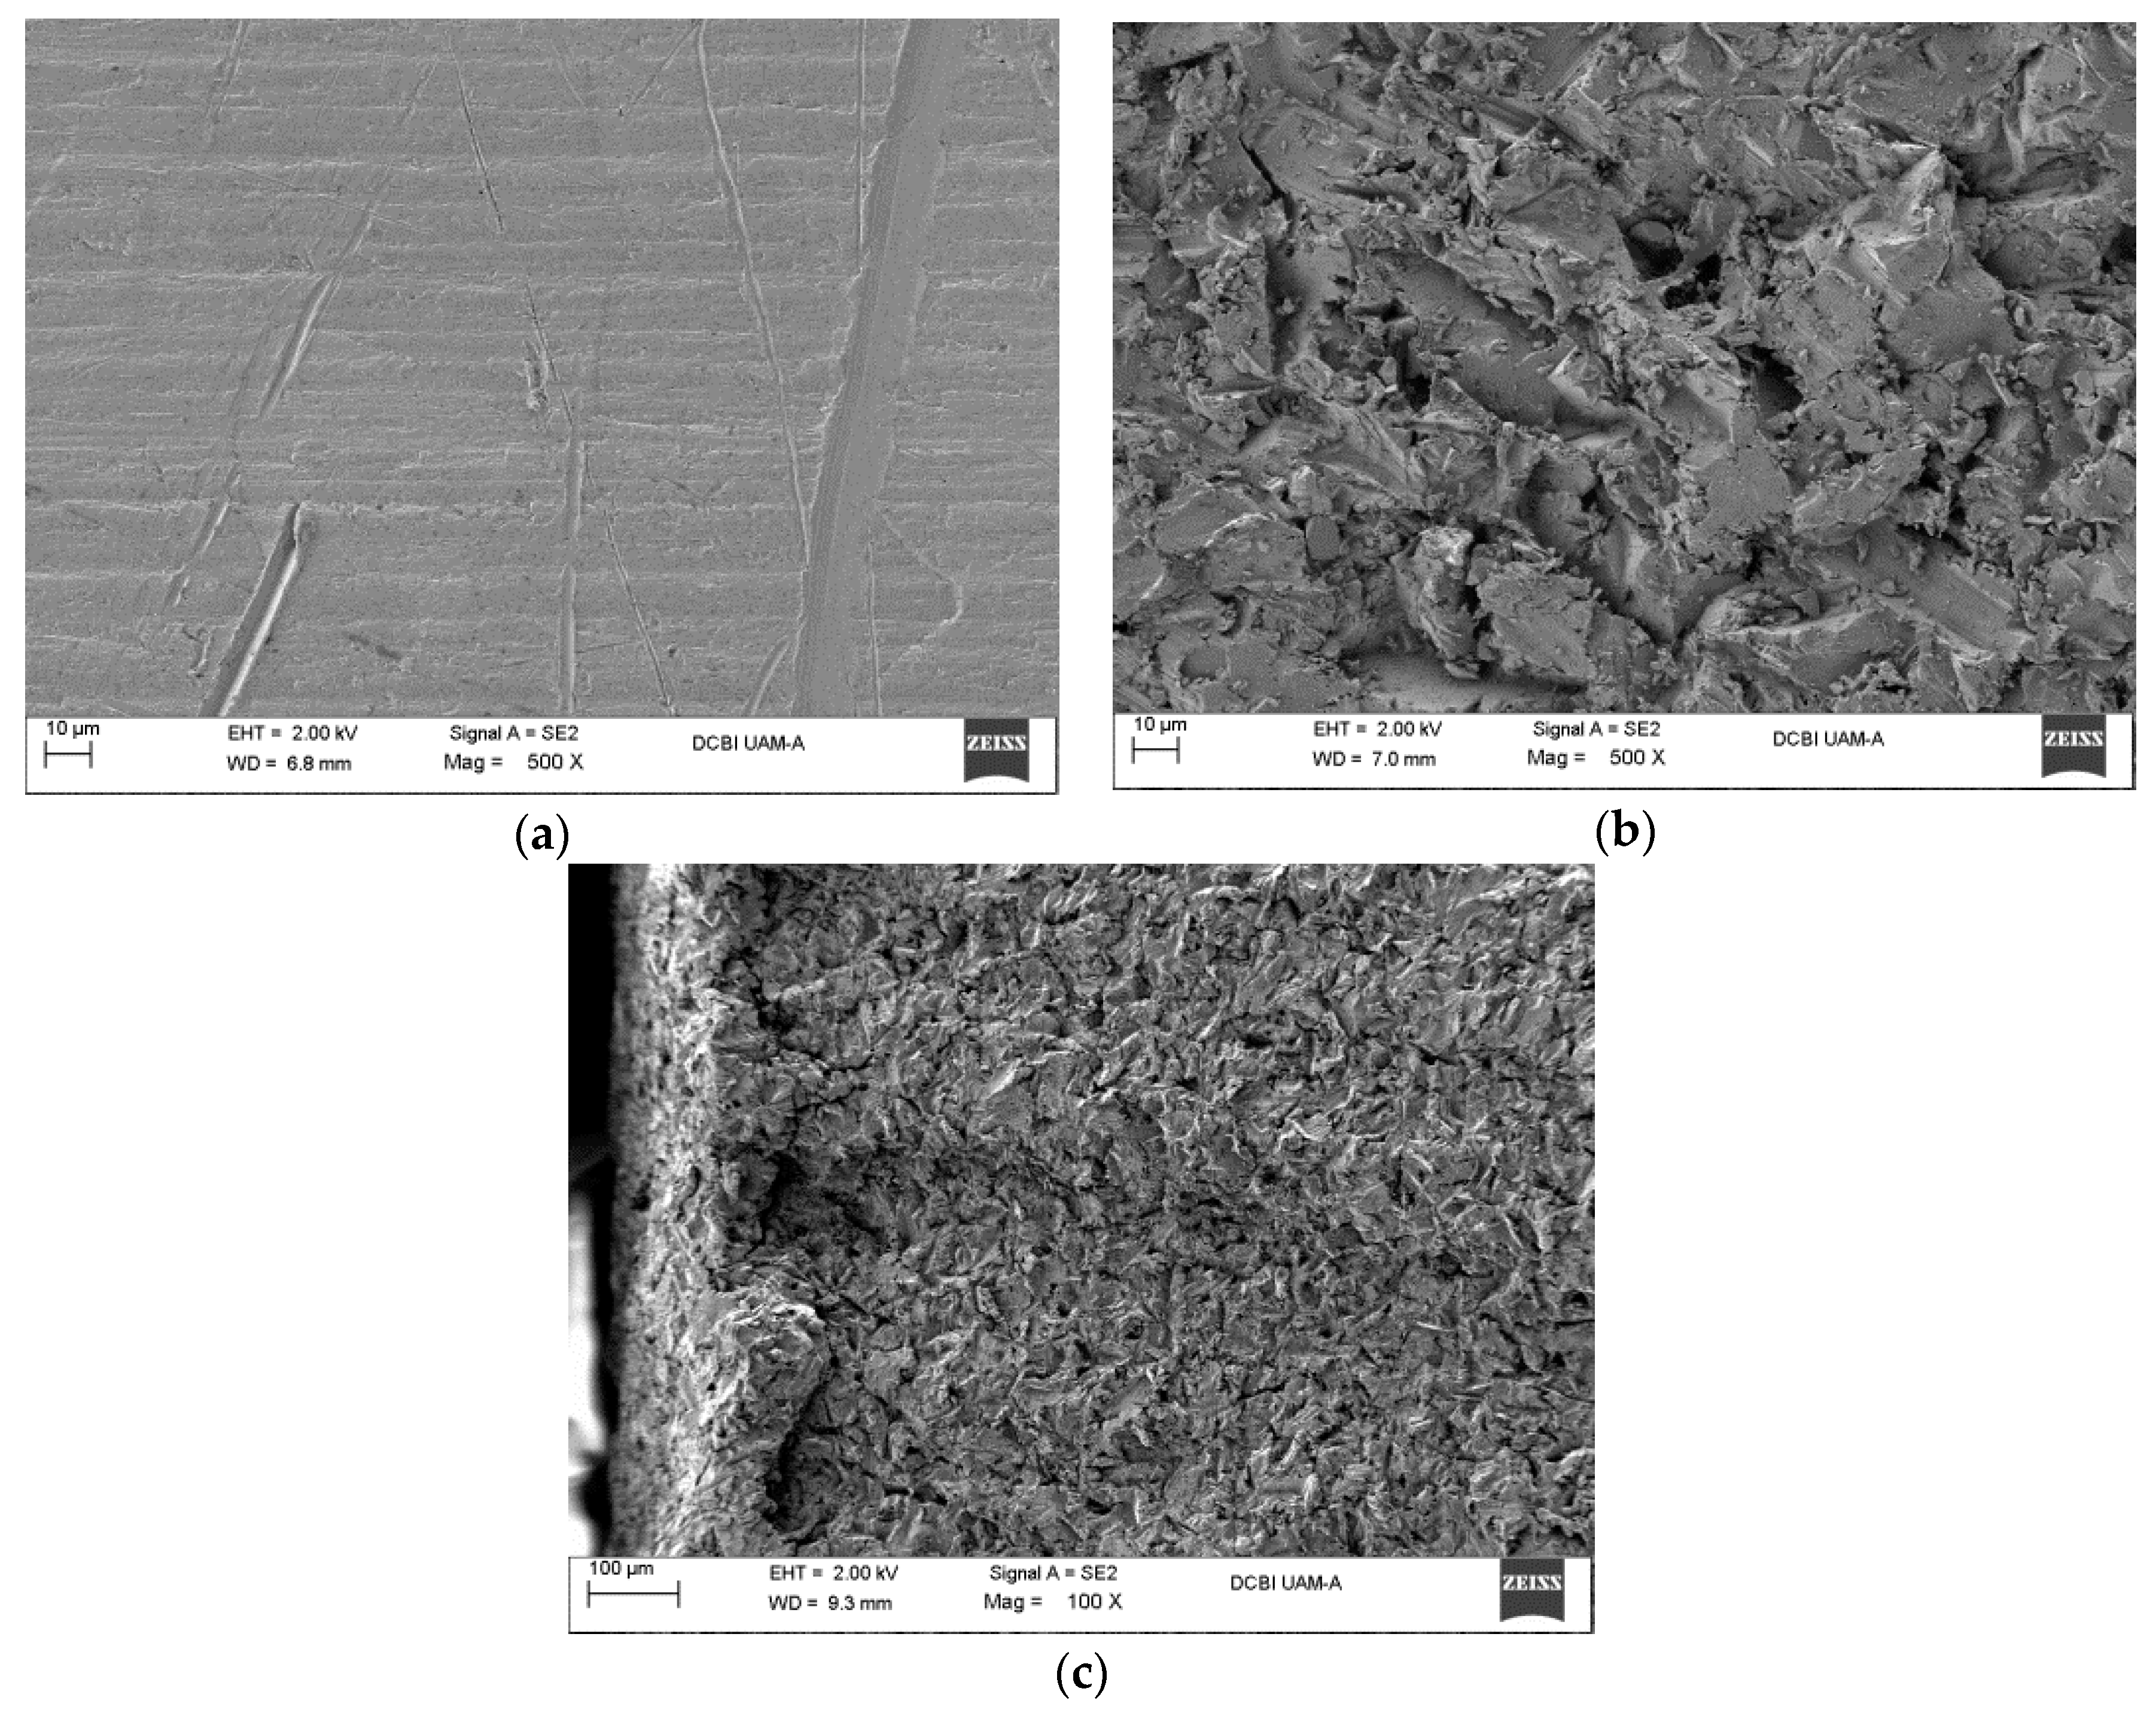
Figure 5.
Surface topological features of sandblasted aluminum surfaces: (a) Top view of a commercial aluminum at 500×; (b) Top view of a commercial aluminum with sandblasting at 500×; (c) Lateral view of sandblasting at 100×.
Figure 5.
Surface topological features of sandblasted aluminum surfaces: (a) Top view of a commercial aluminum at 500×; (b) Top view of a commercial aluminum with sandblasting at 500×; (c) Lateral view of sandblasting at 100×.
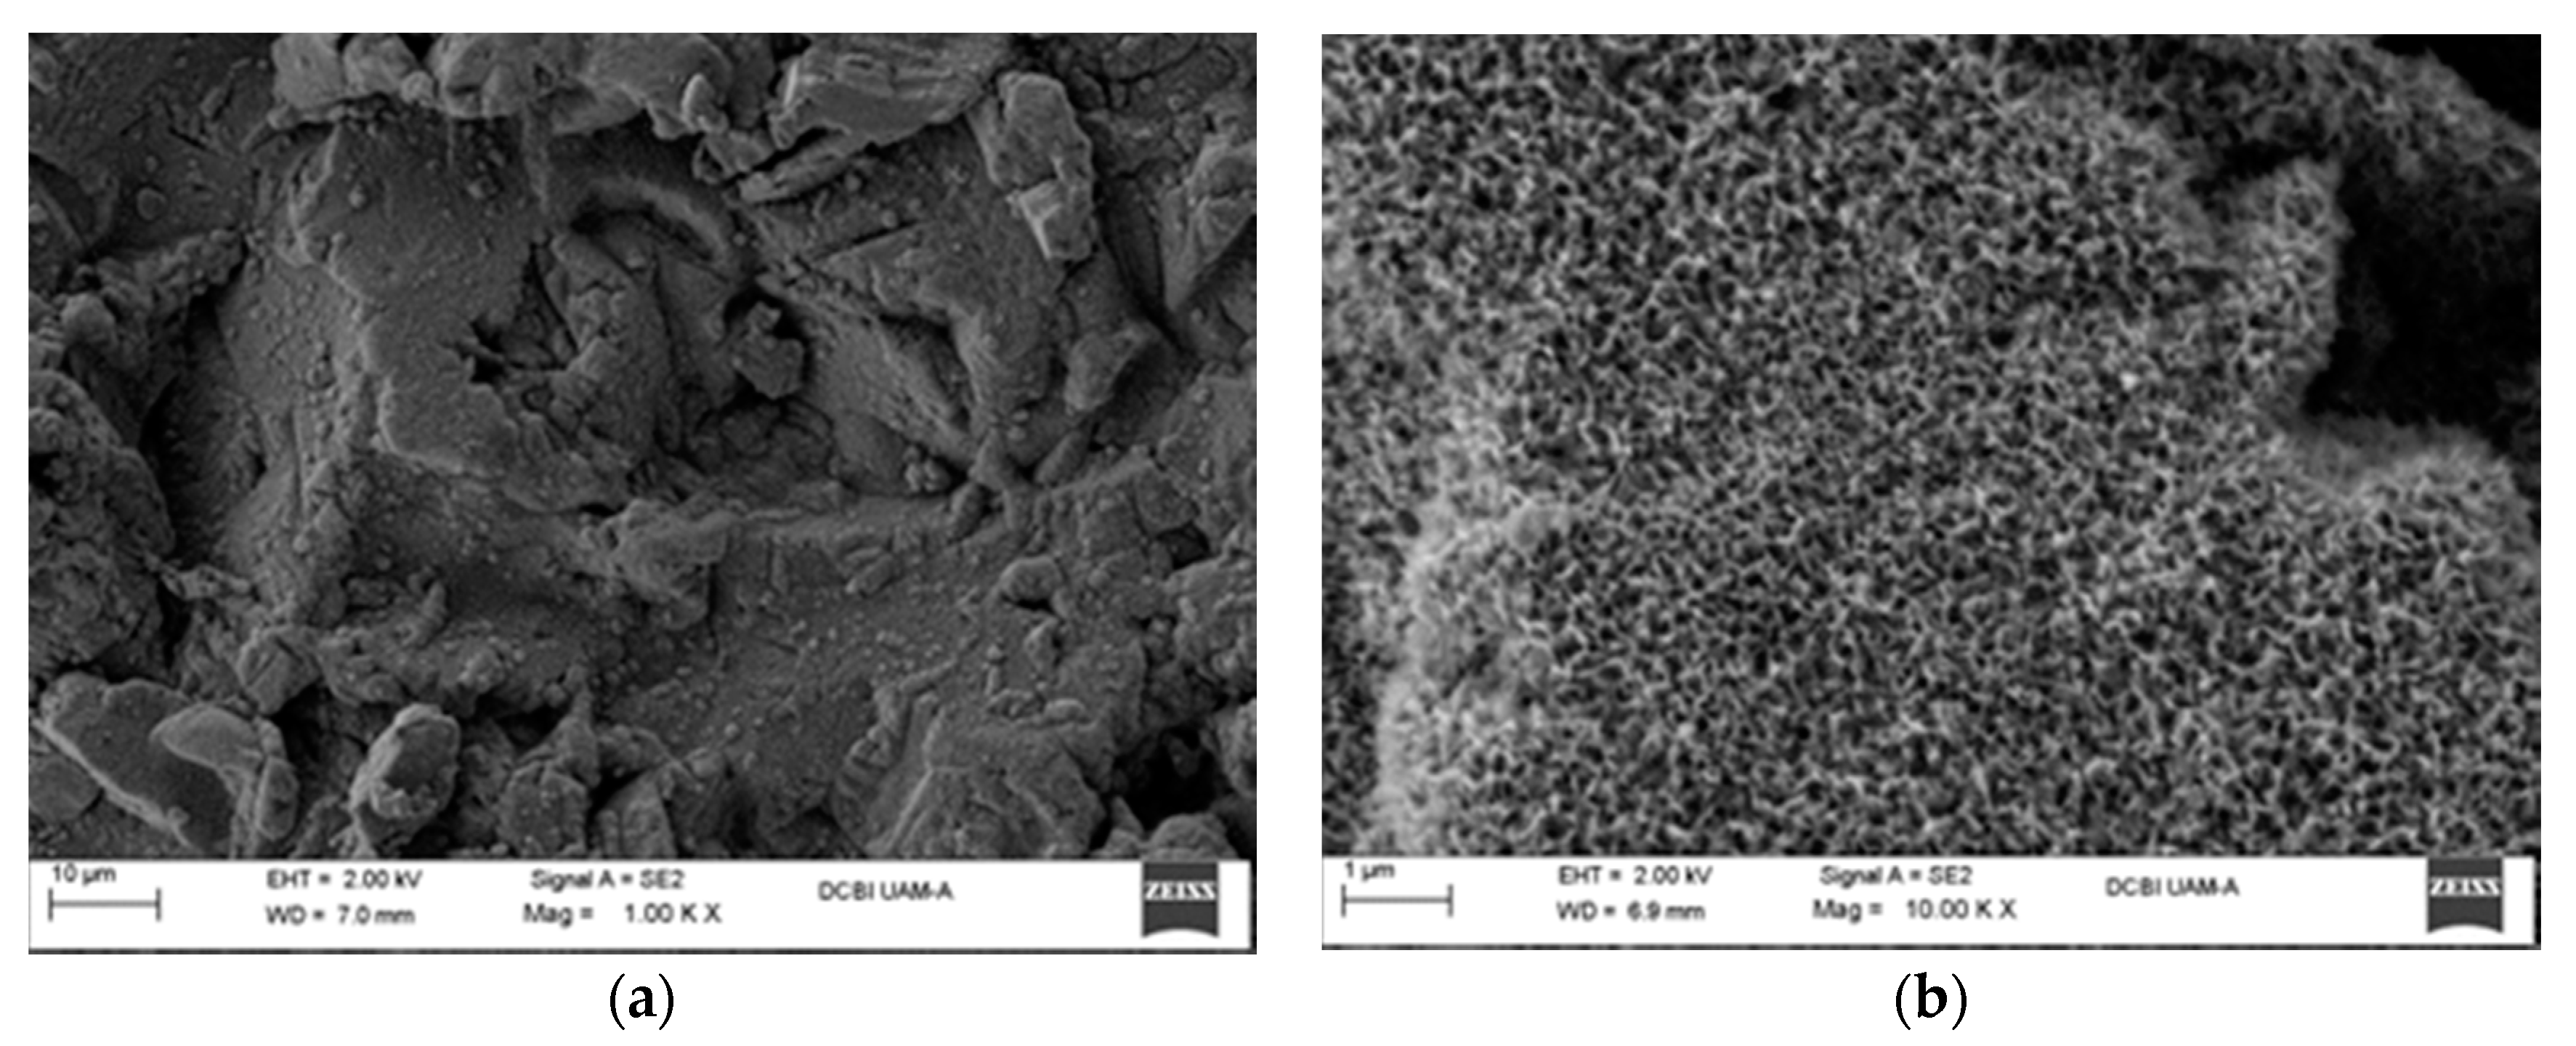
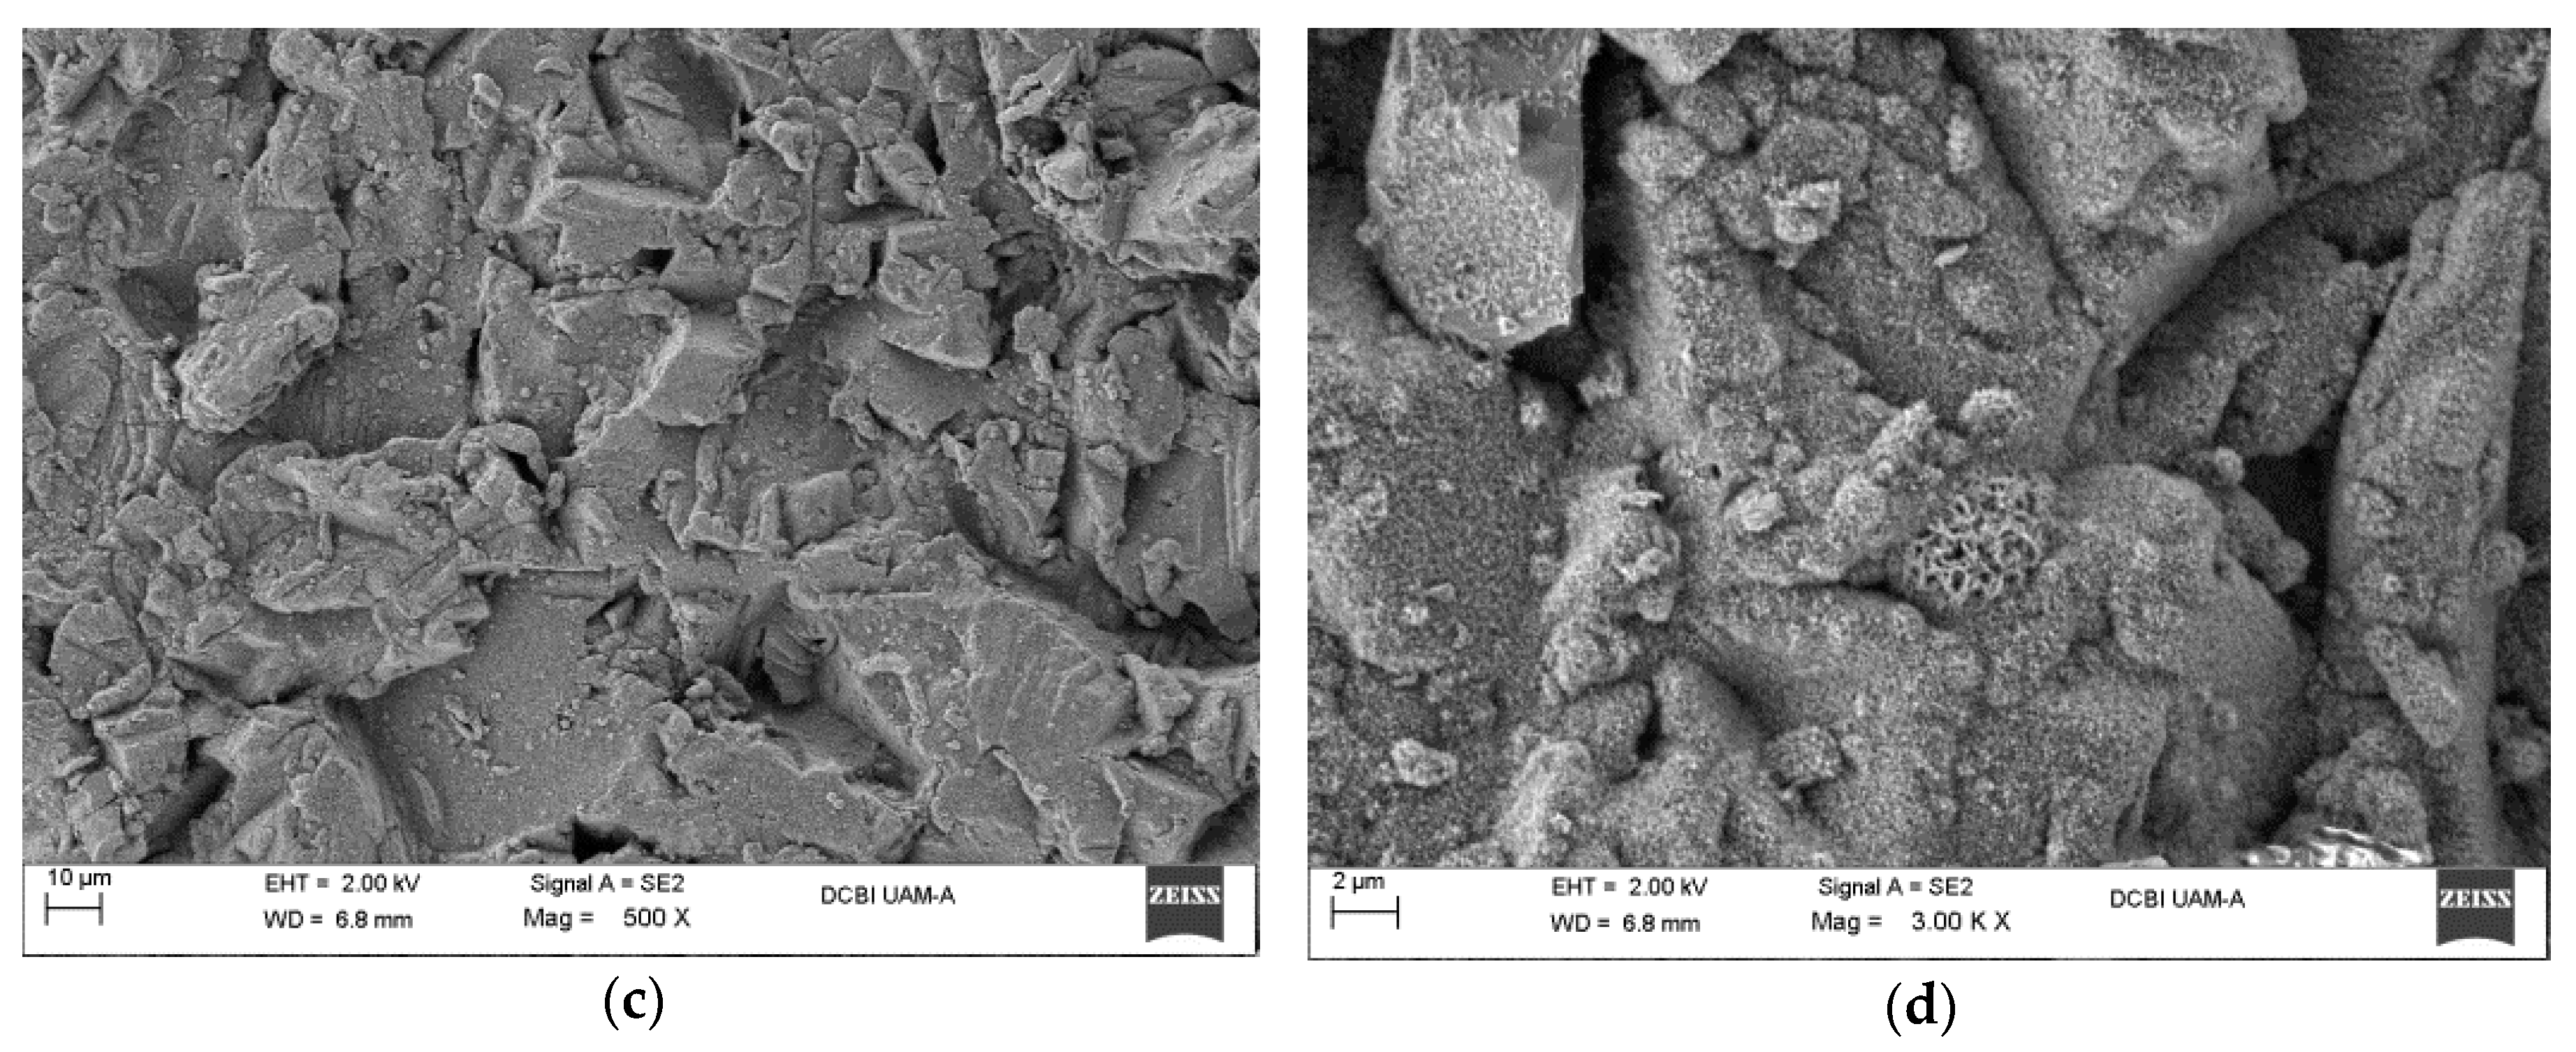
Figure 6.
SEM micrographs of aluminum specimens after immersion treatment in water at 85 °C for 20 min, at different magnifications: (a) 500×; (b) 1 K×, and 60 min treatment; (c) 500×; (d) 3 K×.
Figure 6.
SEM micrographs of aluminum specimens after immersion treatment in water at 85 °C for 20 min, at different magnifications: (a) 500×; (b) 1 K×, and 60 min treatment; (c) 500×; (d) 3 K×.
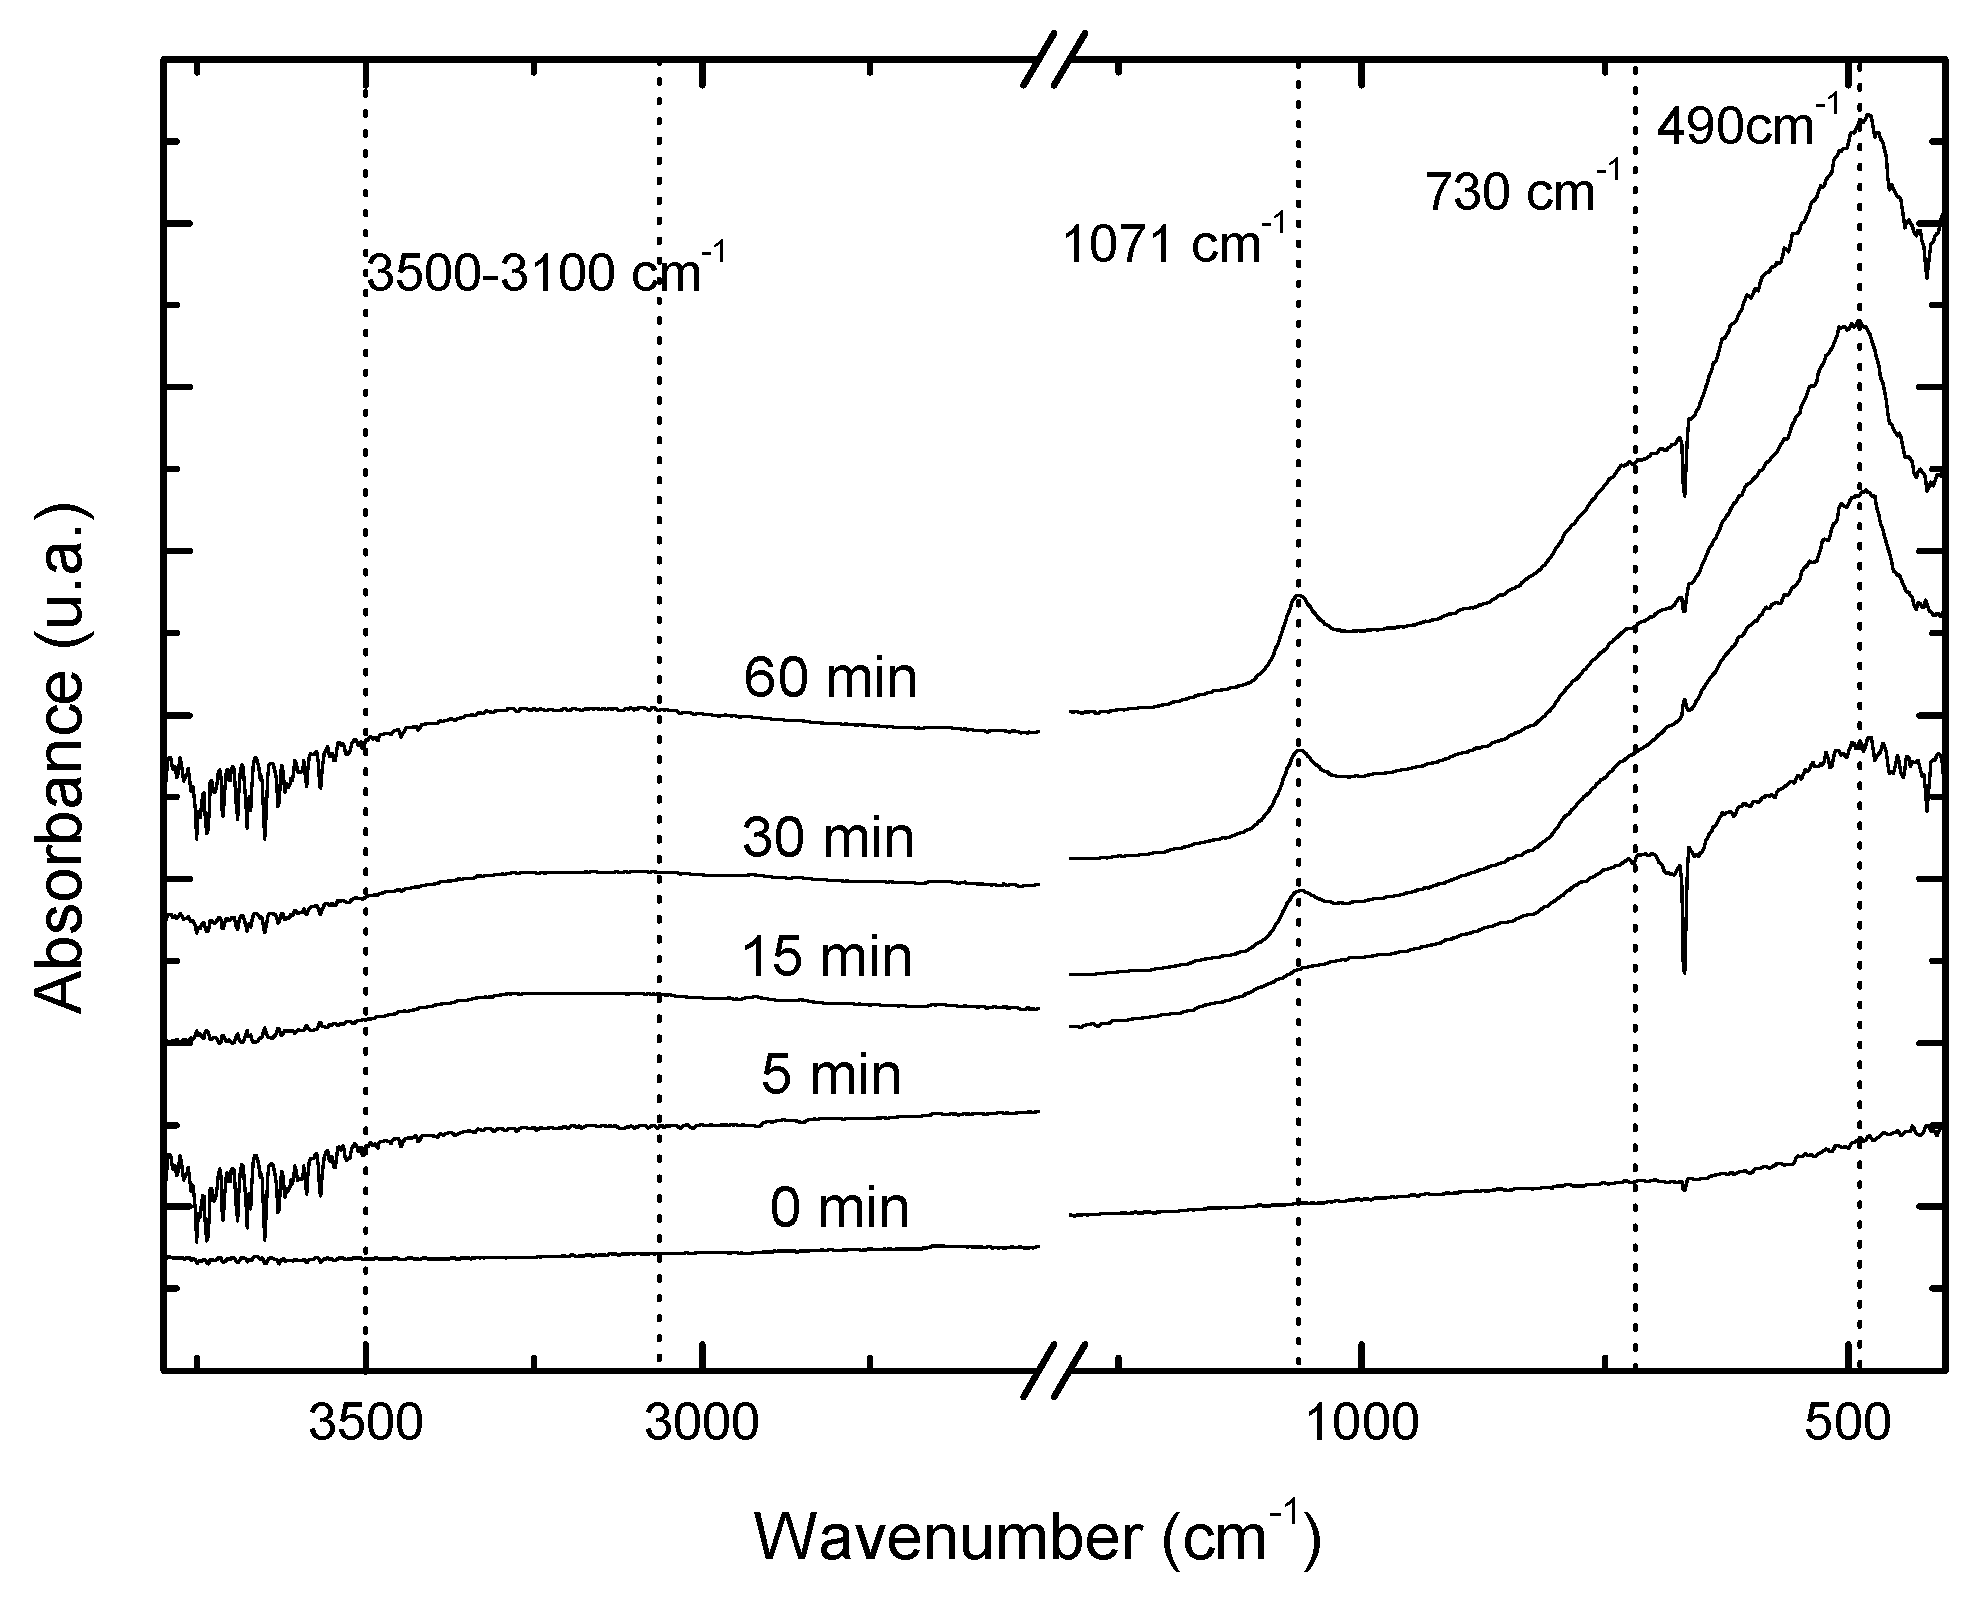
Figure 7.
Fourier transform infrared spectroscopy (FTIR) of the film produced on aluminum immersed in water at 85 °C as a function of time.
Figure 7.
Fourier transform infrared spectroscopy (FTIR) of the film produced on aluminum immersed in water at 85 °C as a function of time.
Figure 8.
SEM micrographs of aluminum specimens after immersion in 3% hydrolyzed GPTMS solution at 25 °C, at 1 K×, (a) 10 min; (b) 20 min; (c) 60 min.
Figure 8.
SEM micrographs of aluminum specimens after immersion in 3% hydrolyzed GPTMS solution at 25 °C, at 1 K×, (a) 10 min; (b) 20 min; (c) 60 min.
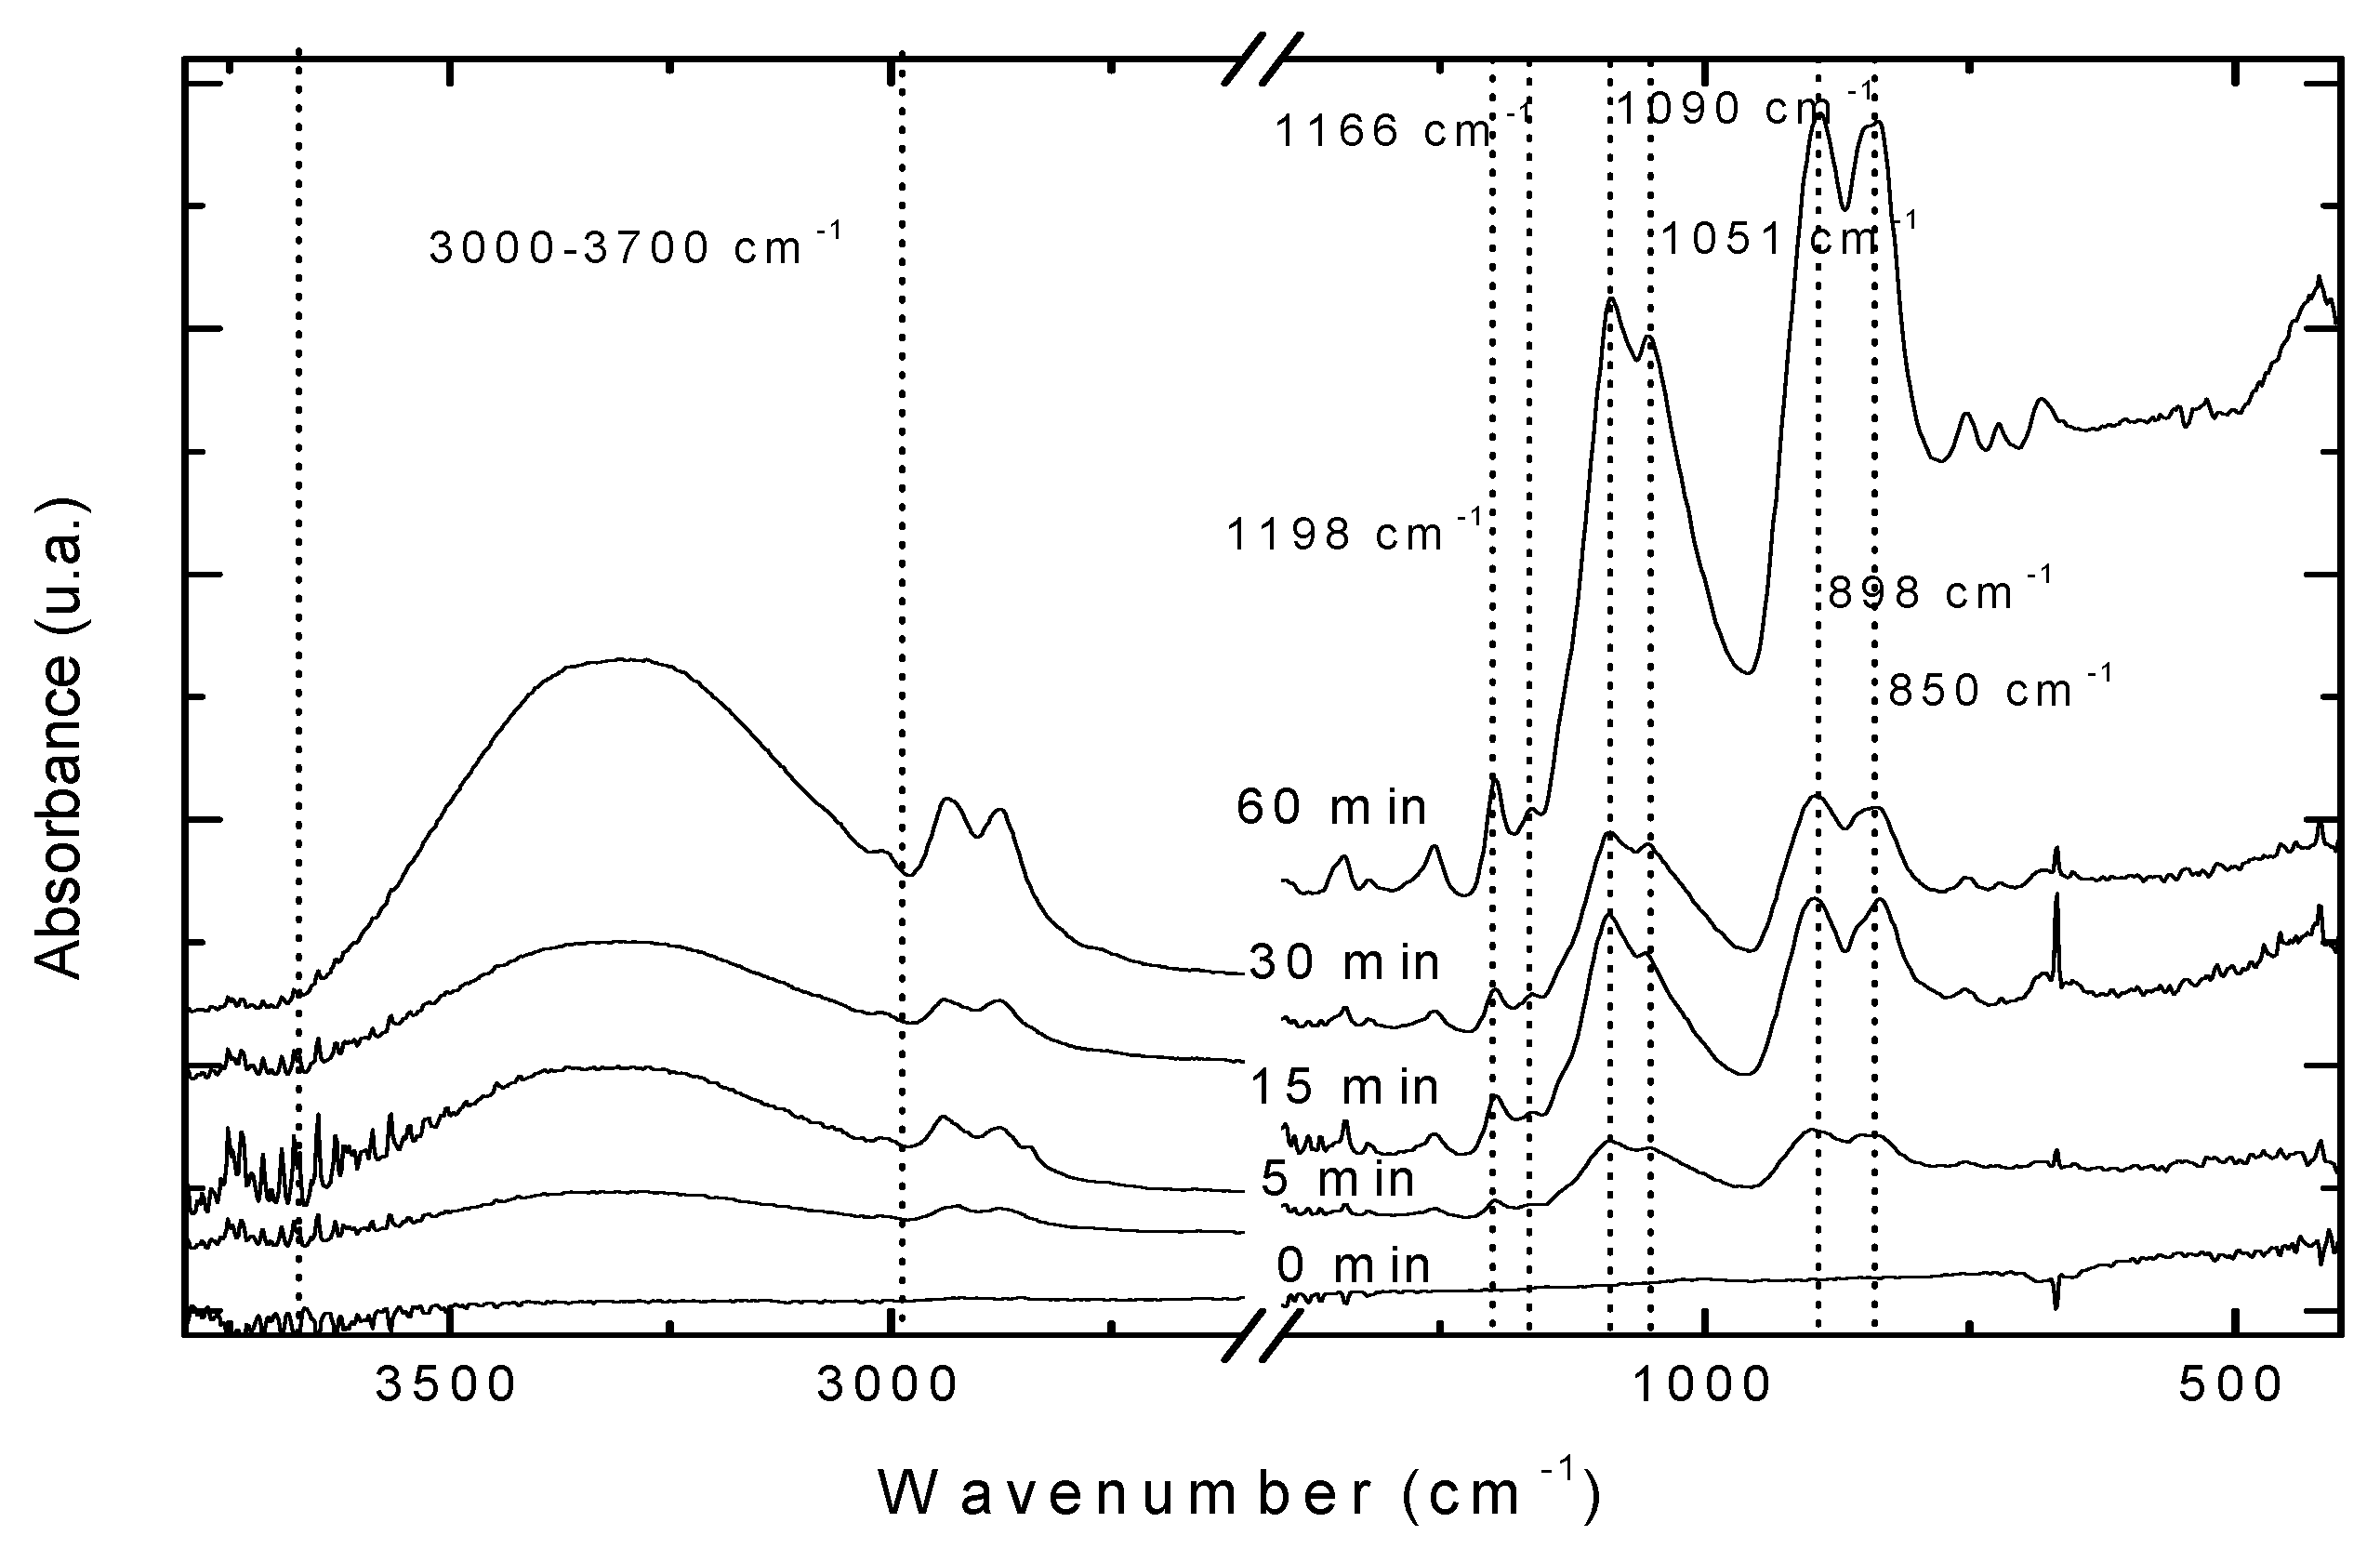
Figure 9.
FTIR of the film produced on aluminum specimen silanized with 3% GPTMS at different times.
Figure 9.
FTIR of the film produced on aluminum specimen silanized with 3% GPTMS at different times.
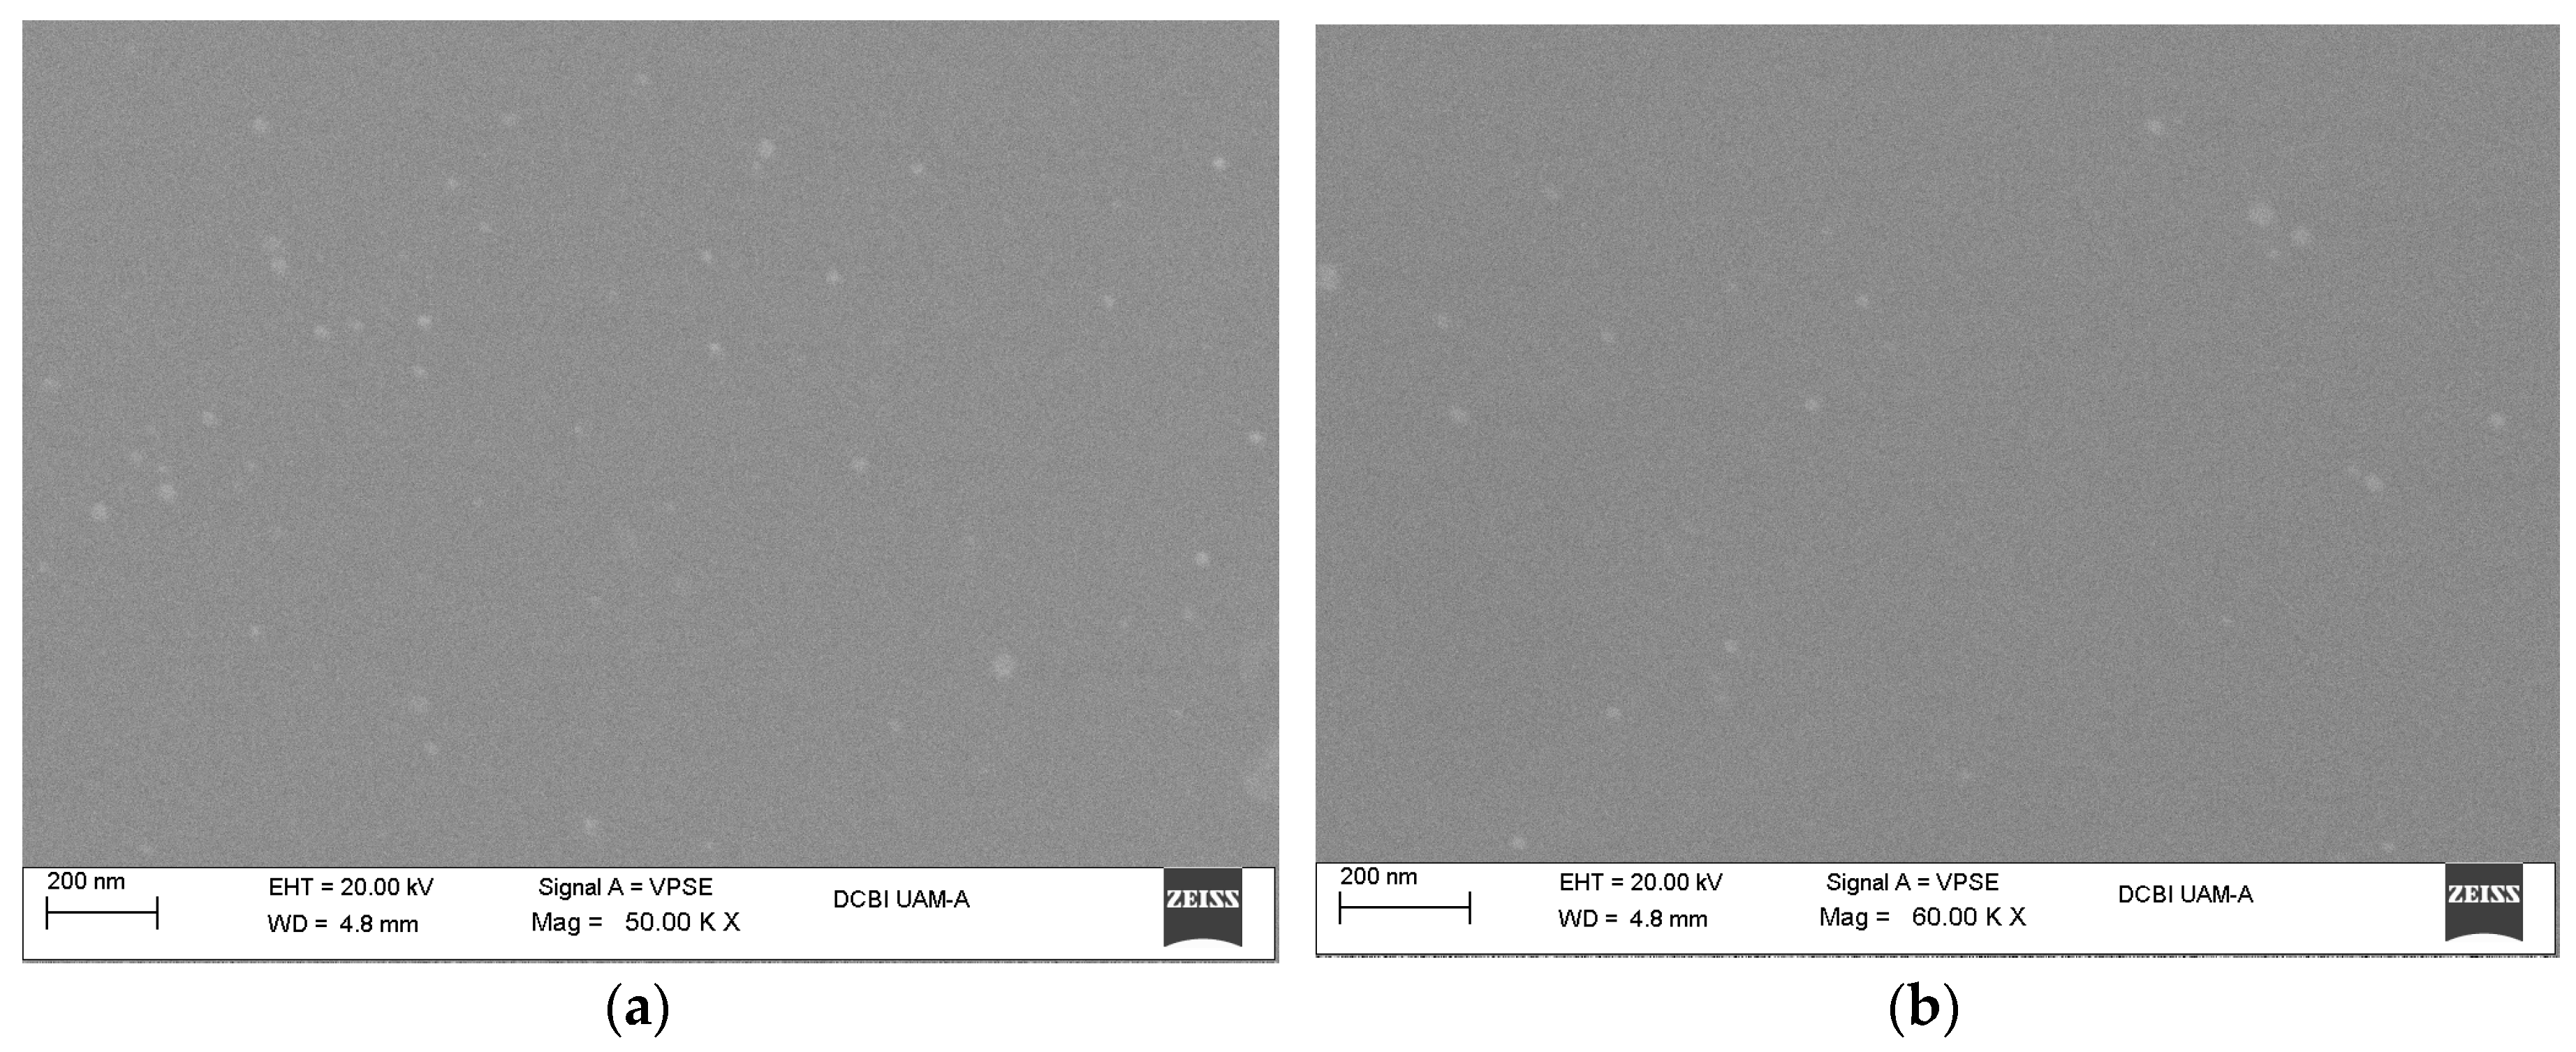
Figure 10.
SEM micrographs of aluminum specimens dried for 60 min at 100 °C, (a) 1 K×; (b) 10 K×.
Figure 10.
SEM micrographs of aluminum specimens dried for 60 min at 100 °C, (a) 1 K×; (b) 10 K×.
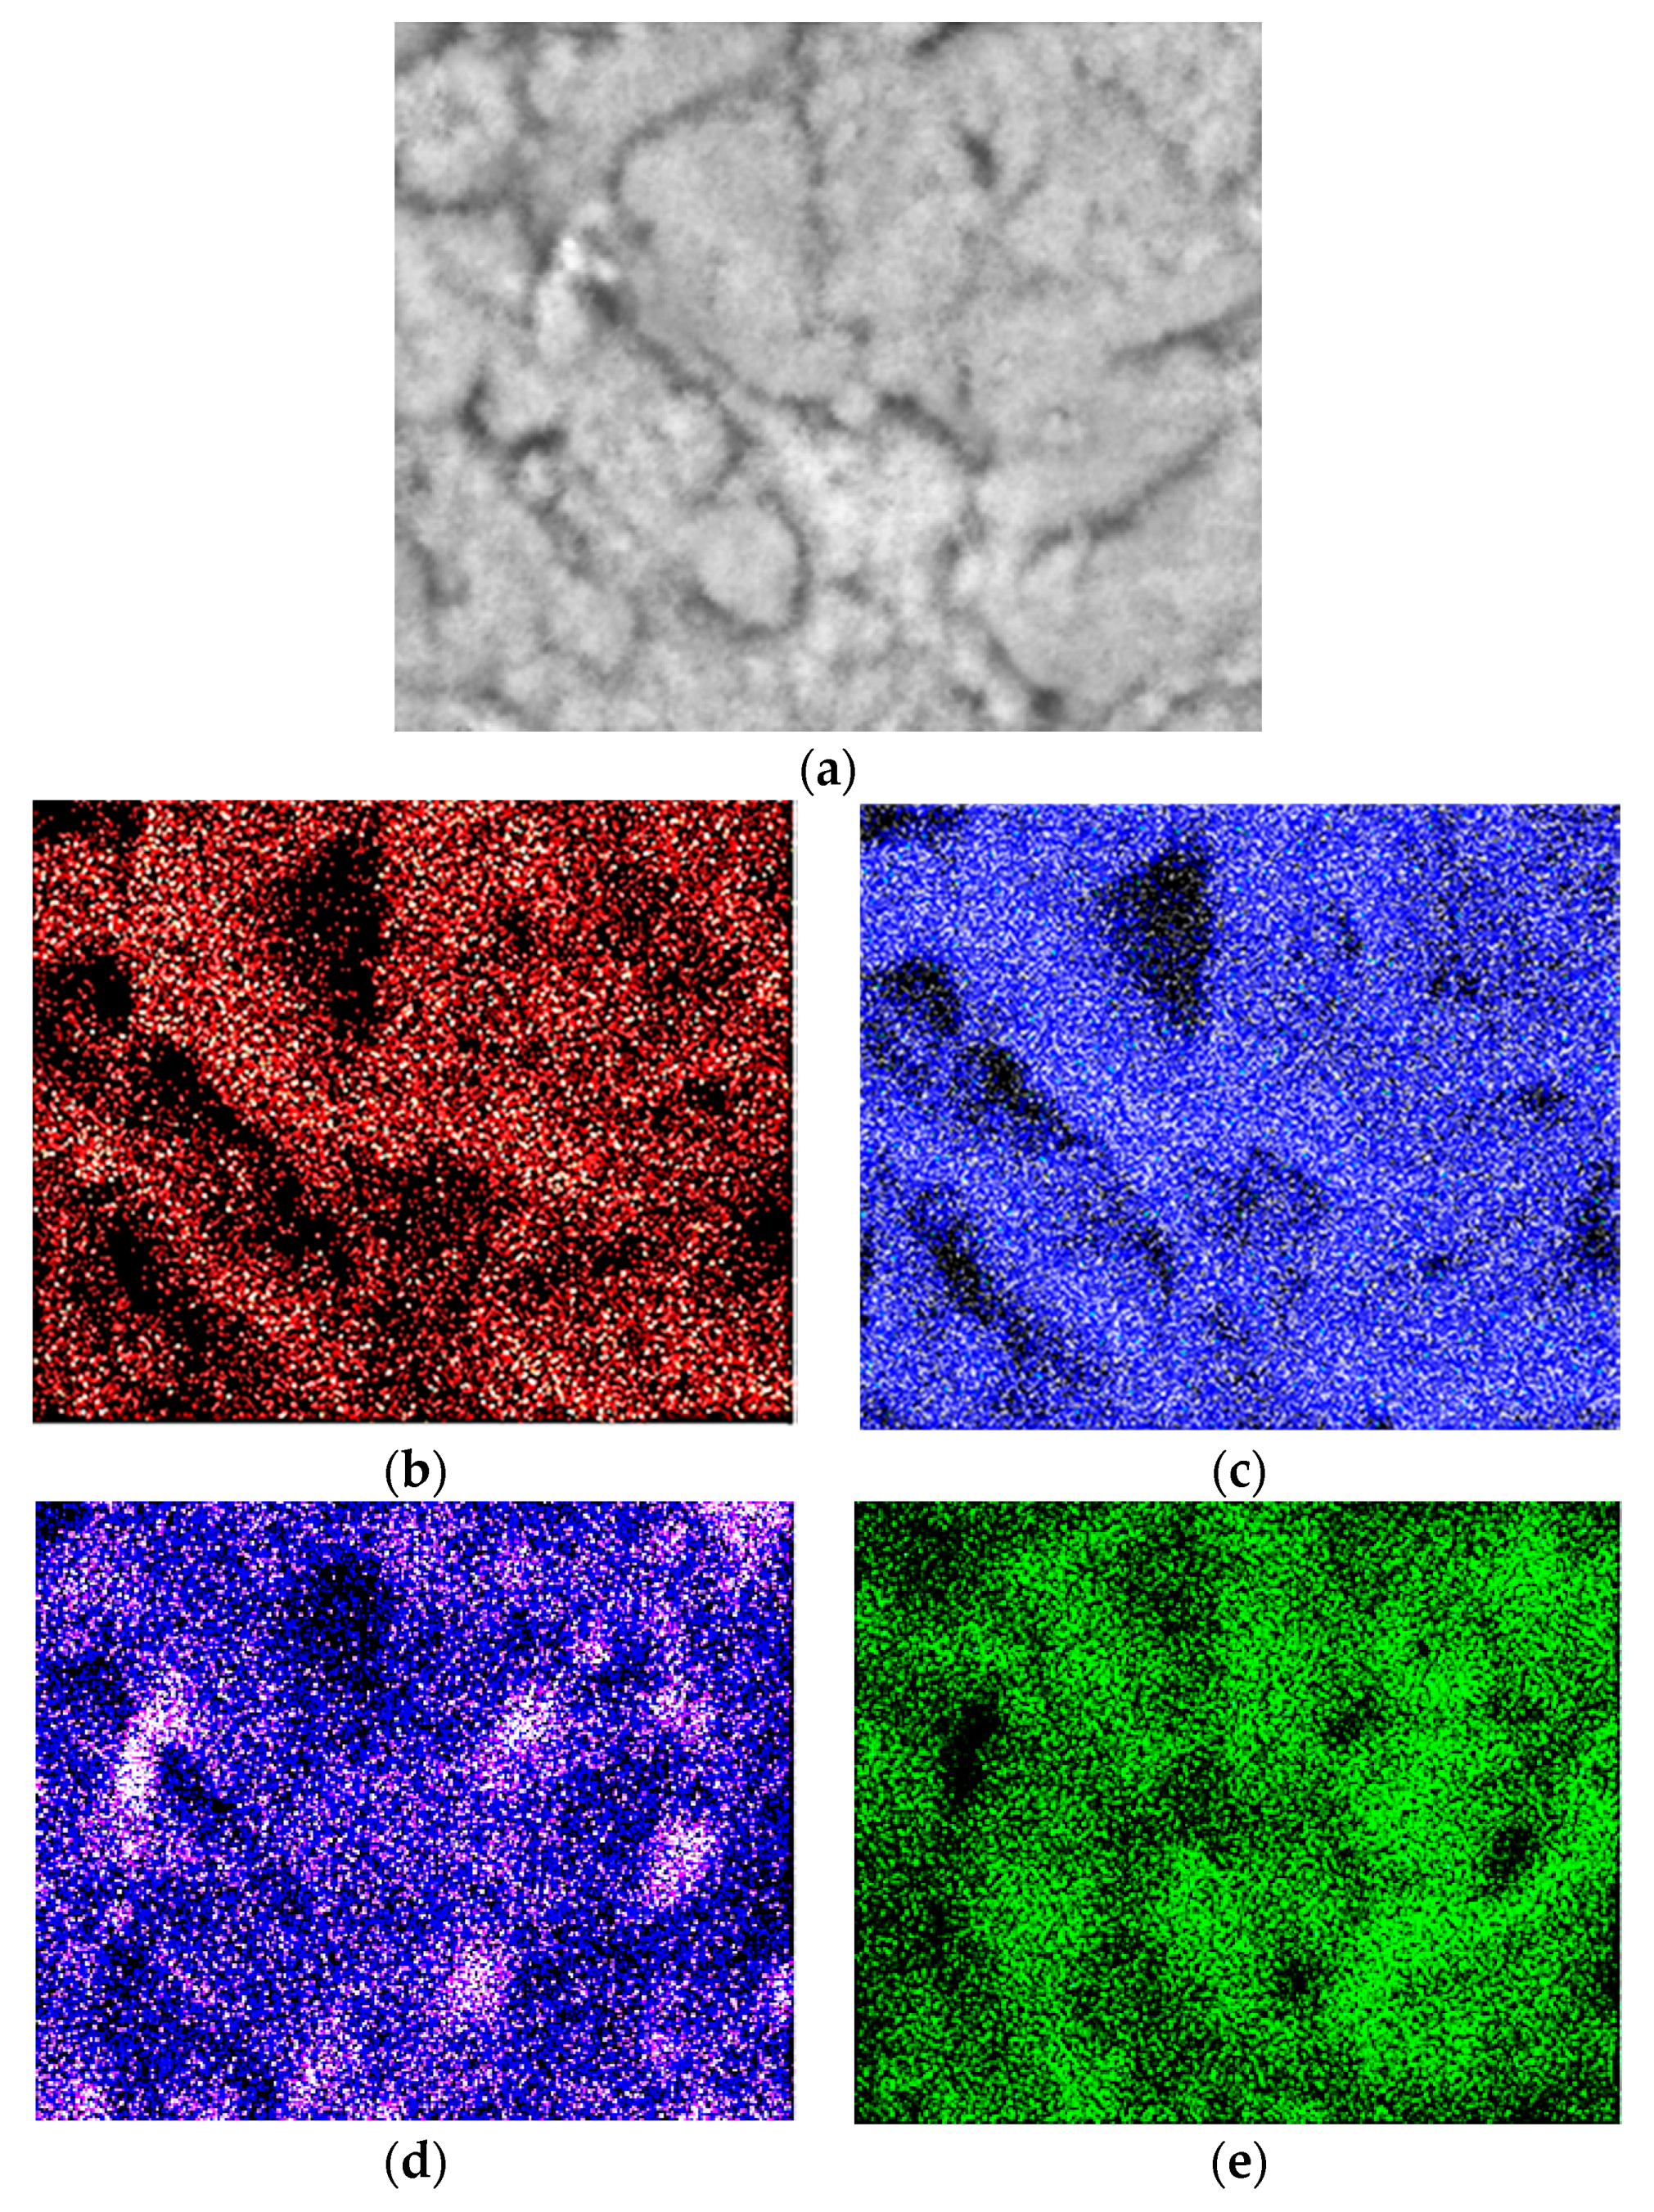
Figure 11.
(a) SEM micrograph of aluminum specimen dried for 60 min at 100 °C, at 5 K×; (b) EDS mapping of C; (c) EDS mapping of O; (d) EDS mapping of Si; (e) EDS mapping of Al.
Figure 11.
(a) SEM micrograph of aluminum specimen dried for 60 min at 100 °C, at 5 K×; (b) EDS mapping of C; (c) EDS mapping of O; (d) EDS mapping of Si; (e) EDS mapping of Al.
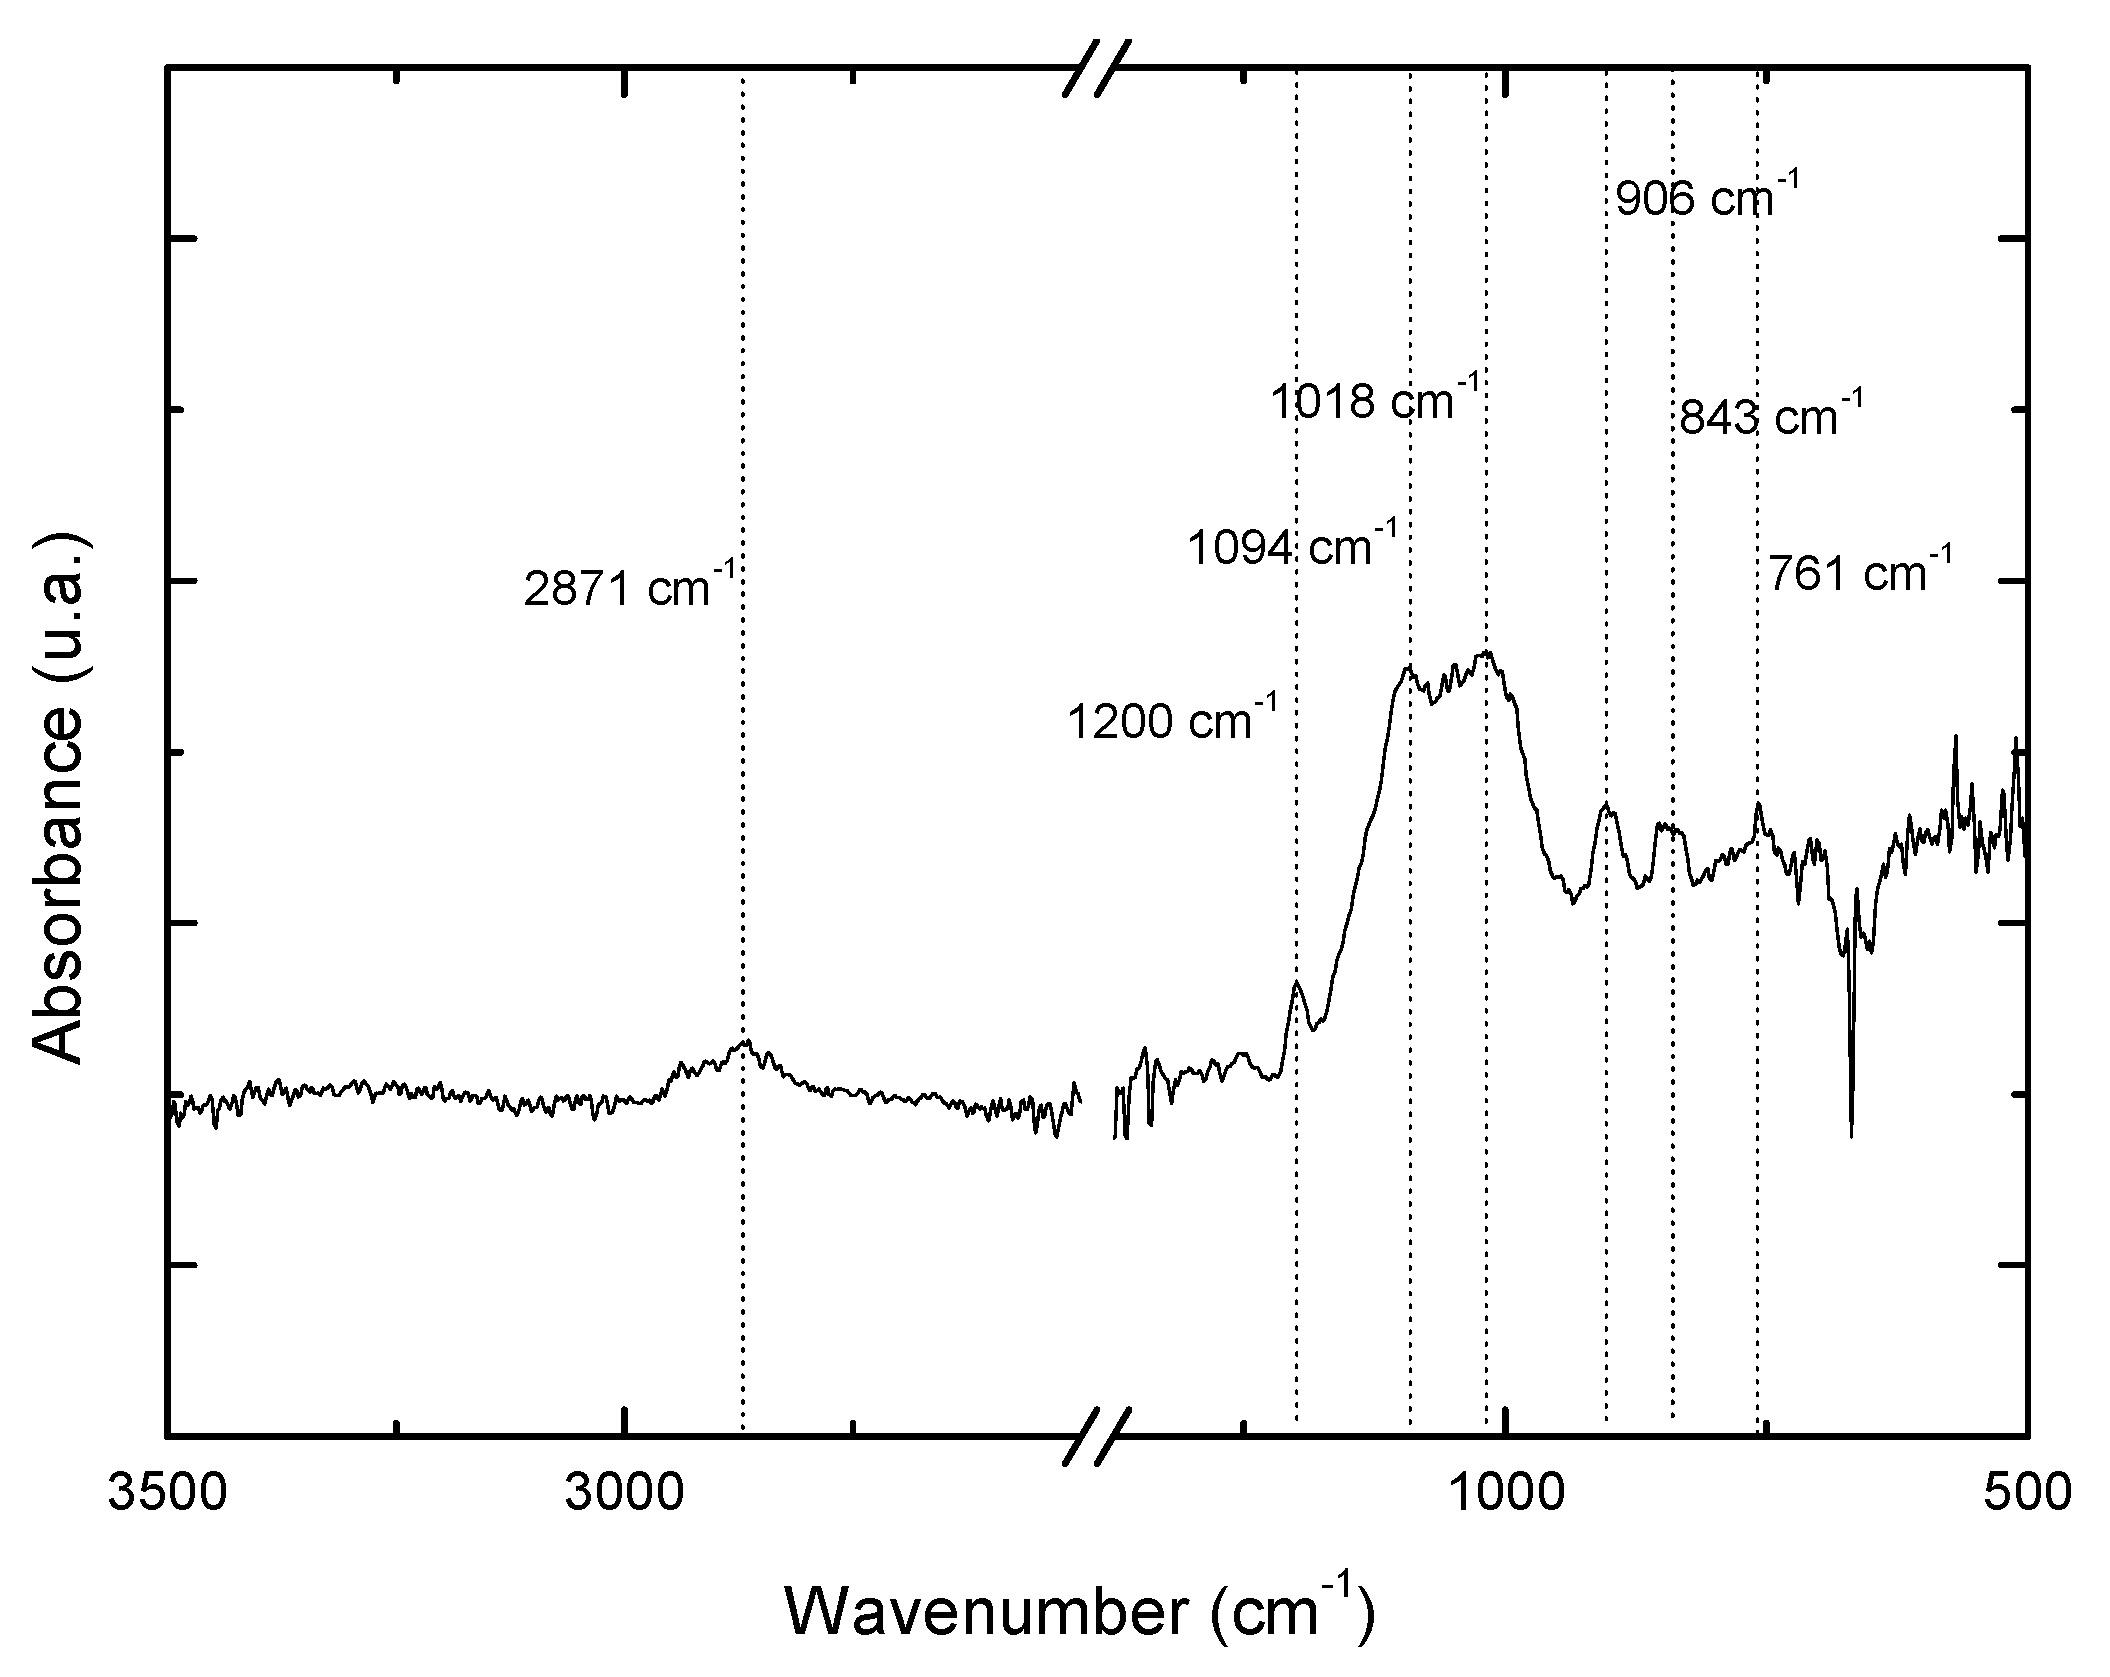
Figure 12.
FTIR of the film produced on the aluminum specimen silanized with 3% GPTMS after drying.
Figure 12.
FTIR of the film produced on the aluminum specimen silanized with 3% GPTMS after drying.
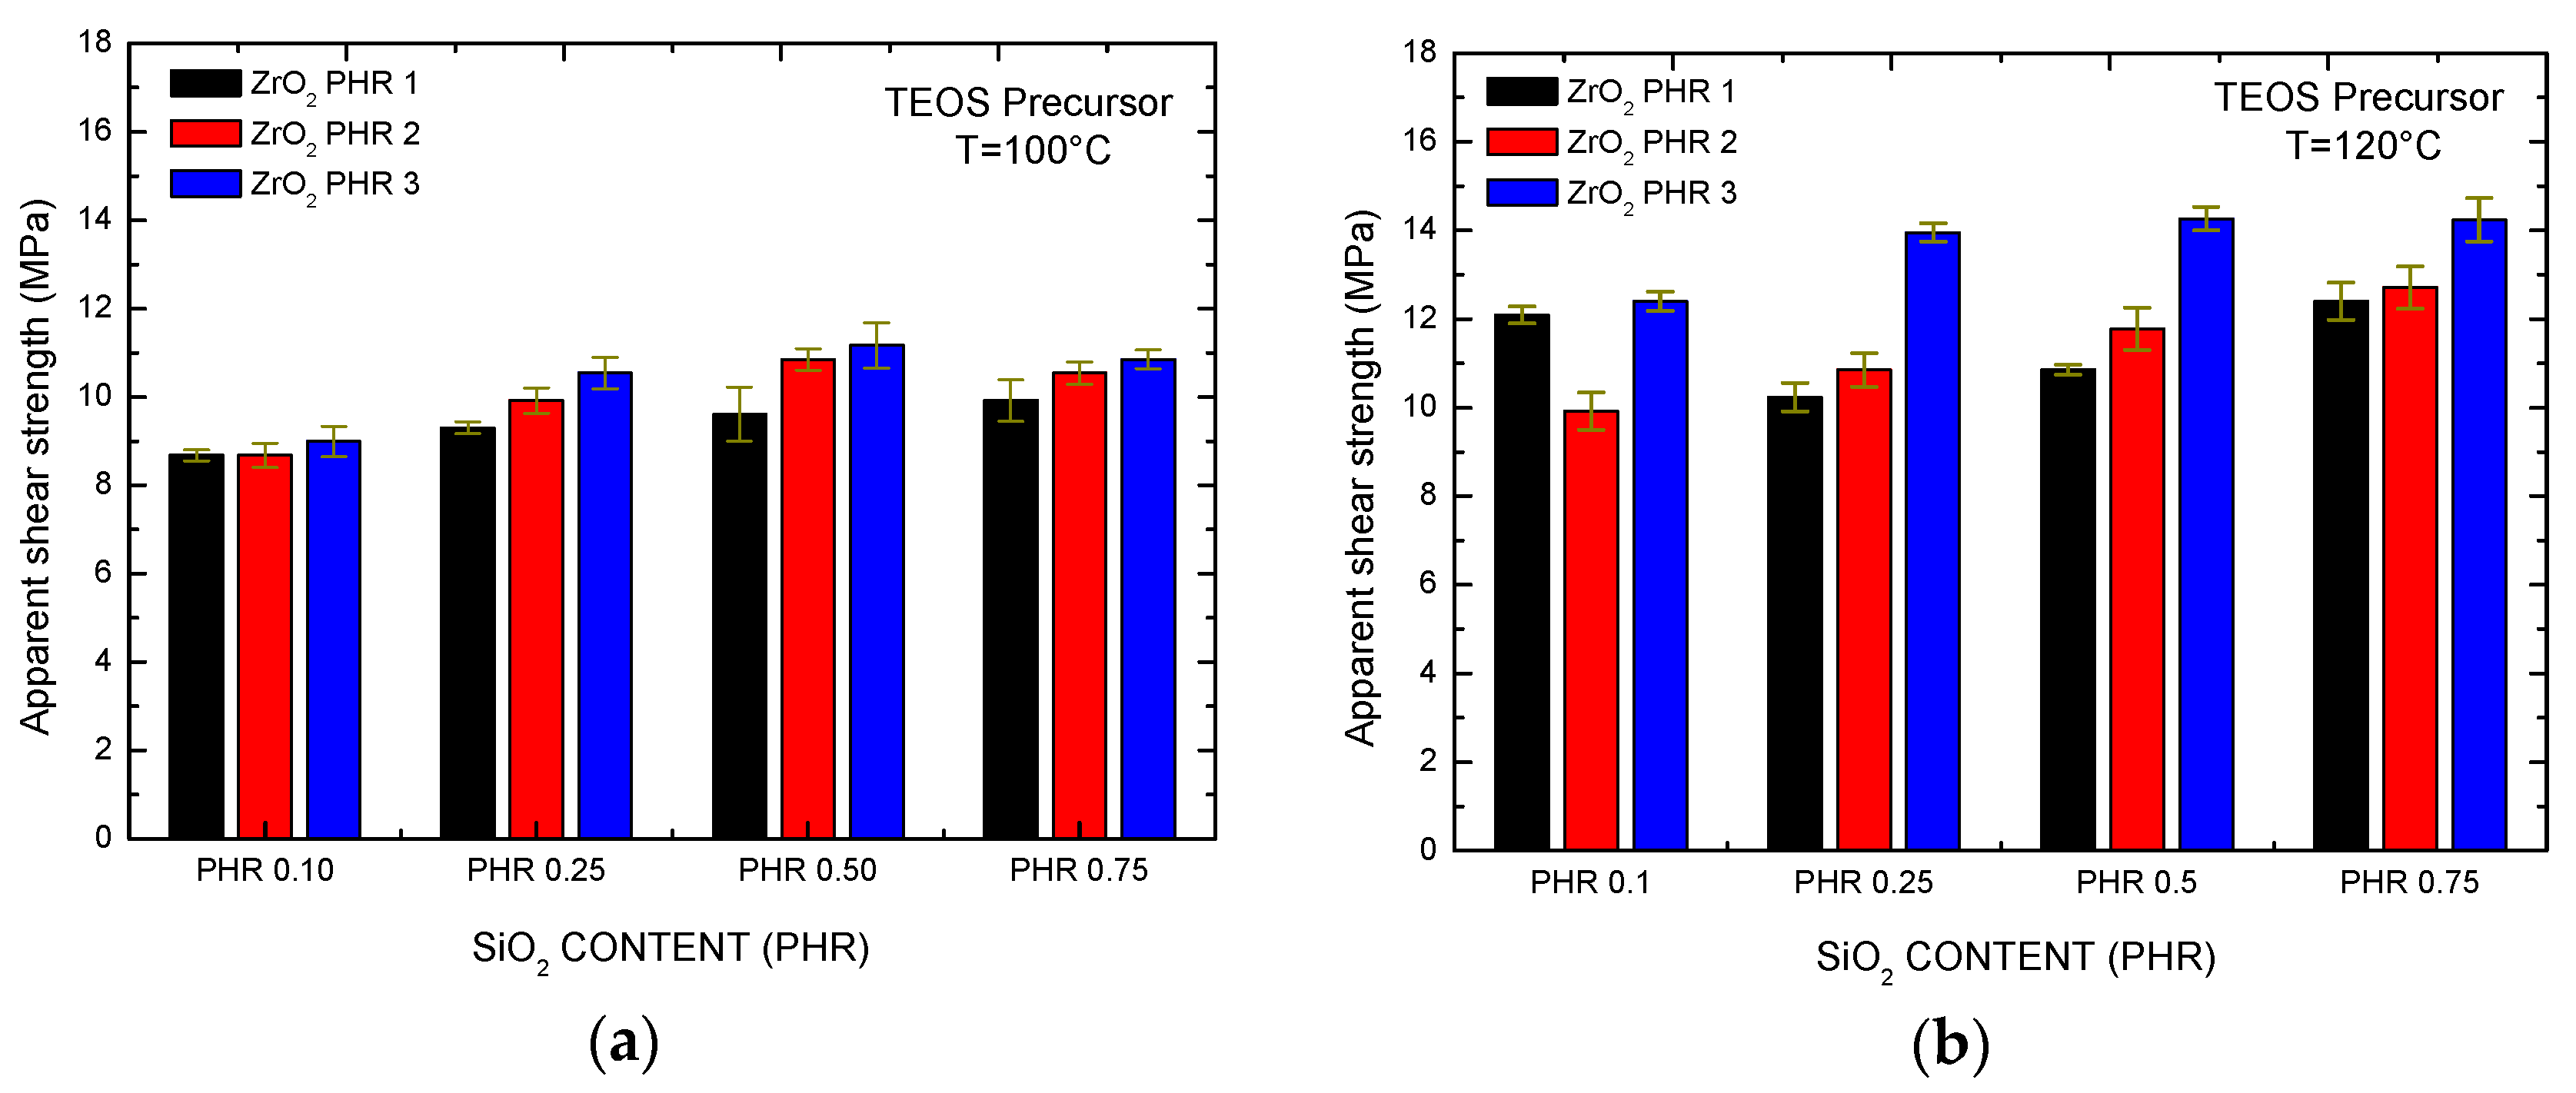
Figure 13.
Apparent shear strength of epoxy-SiO2-ZrO2 adhesives using TEOS as a precursor at different temperatures: (a) T = 100 °C; (b) T = 120 °C.
Figure 13.
Apparent shear strength of epoxy-SiO2-ZrO2 adhesives using TEOS as a precursor at different temperatures: (a) T = 100 °C; (b) T = 120 °C.
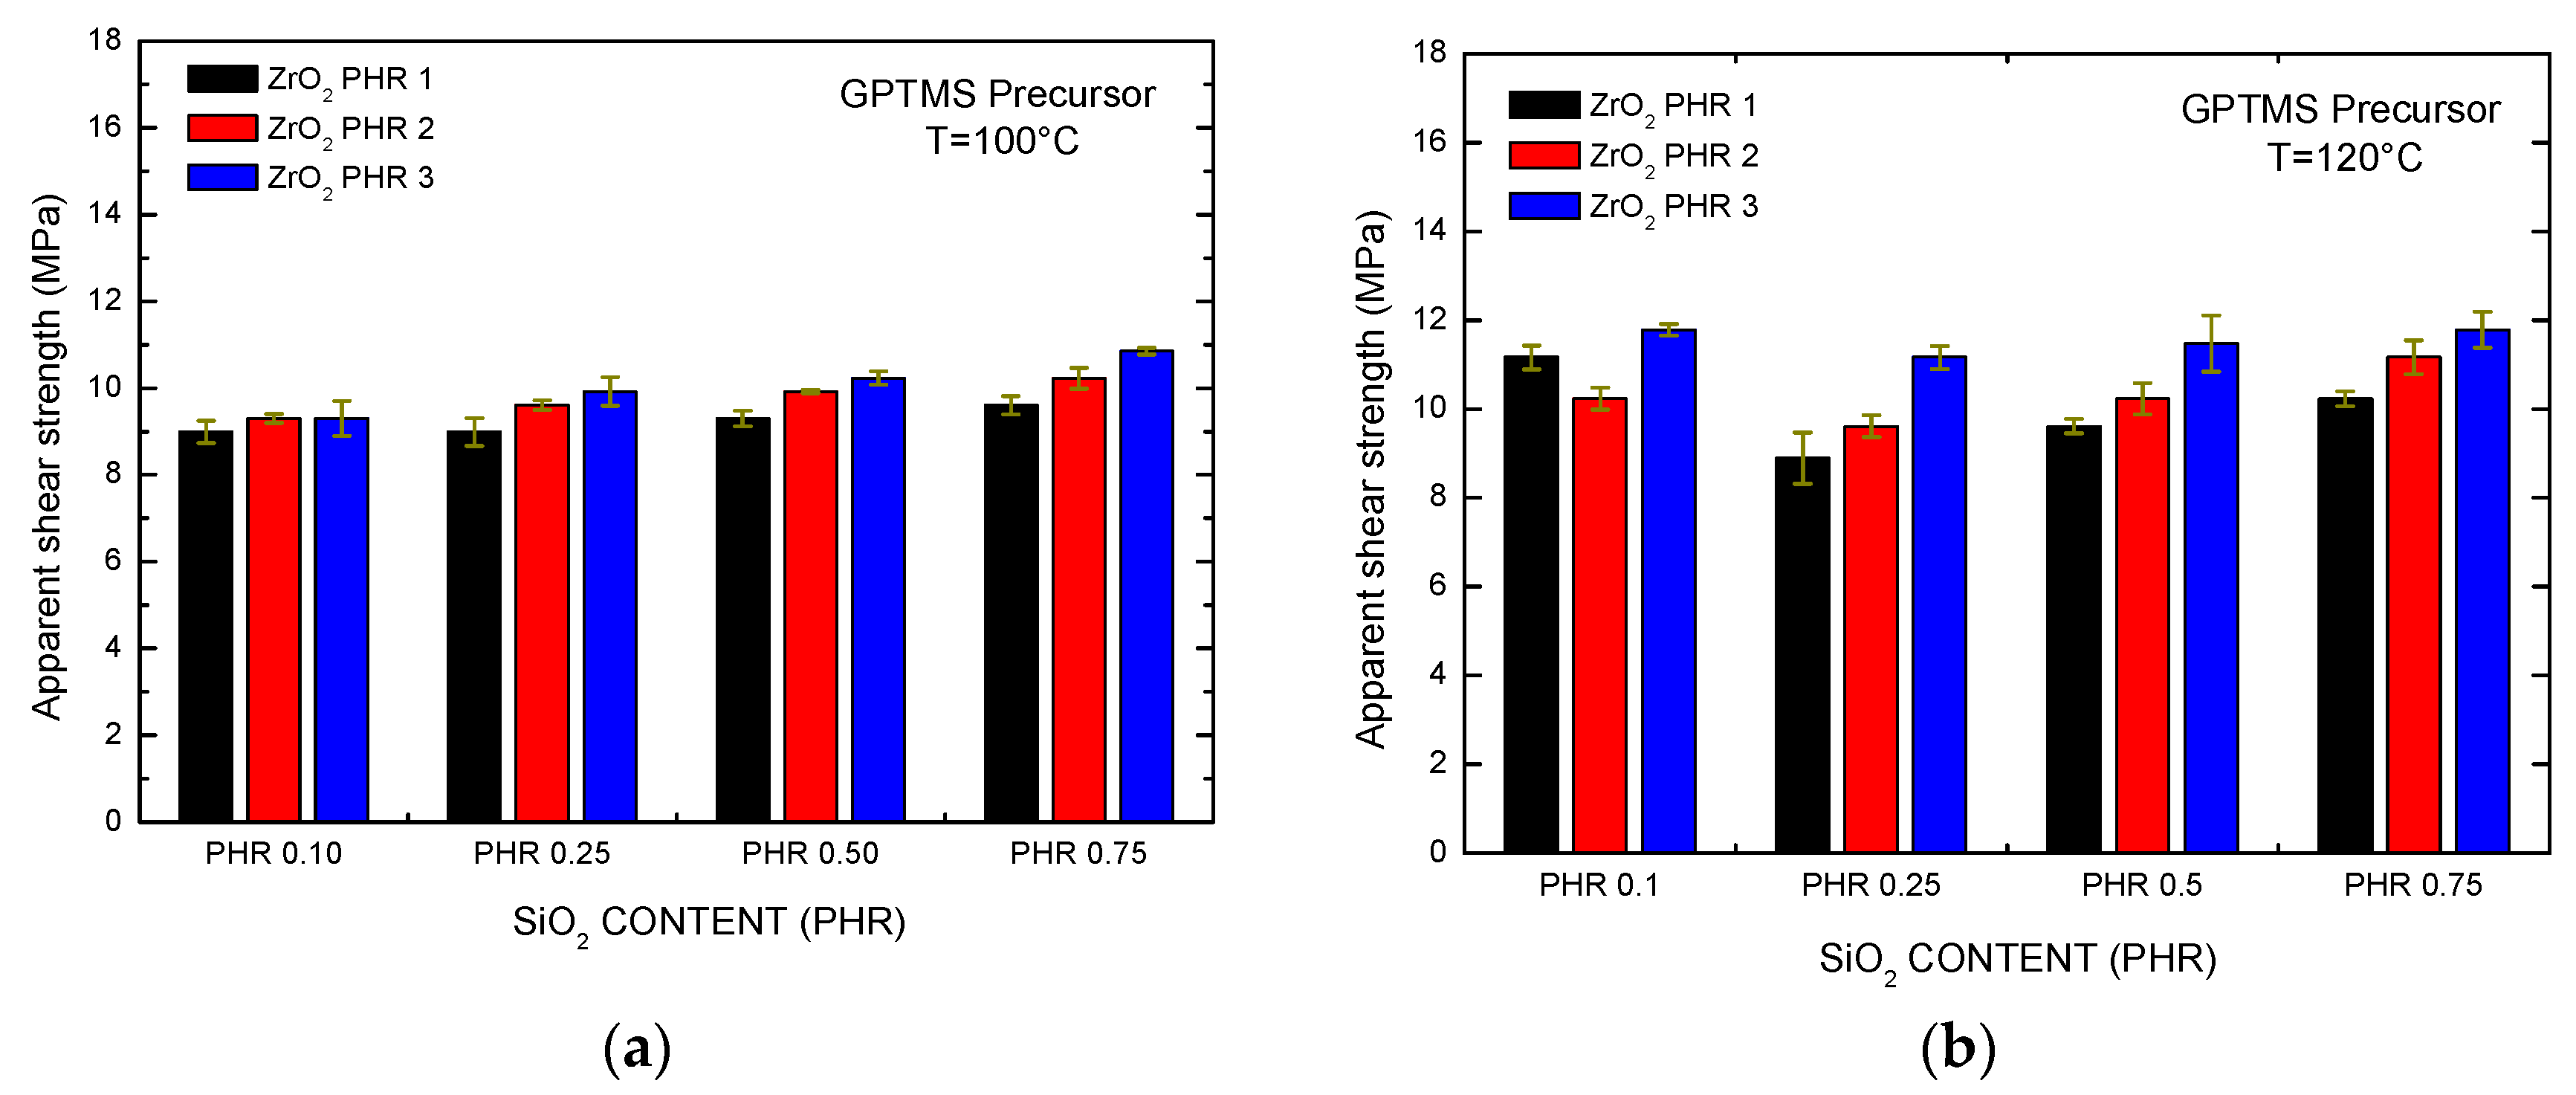
Figure 14.
Apparent shear strength of epoxy-SiO2-ZrO2 adhesives using the GPTMS precursor at different temperatures: (a) T = 100 °C; (b) T = 120 °C.
Figure 14.
Apparent shear strength of epoxy-SiO2-ZrO2 adhesives using the GPTMS precursor at different temperatures: (a) T = 100 °C; (b) T = 120 °C.
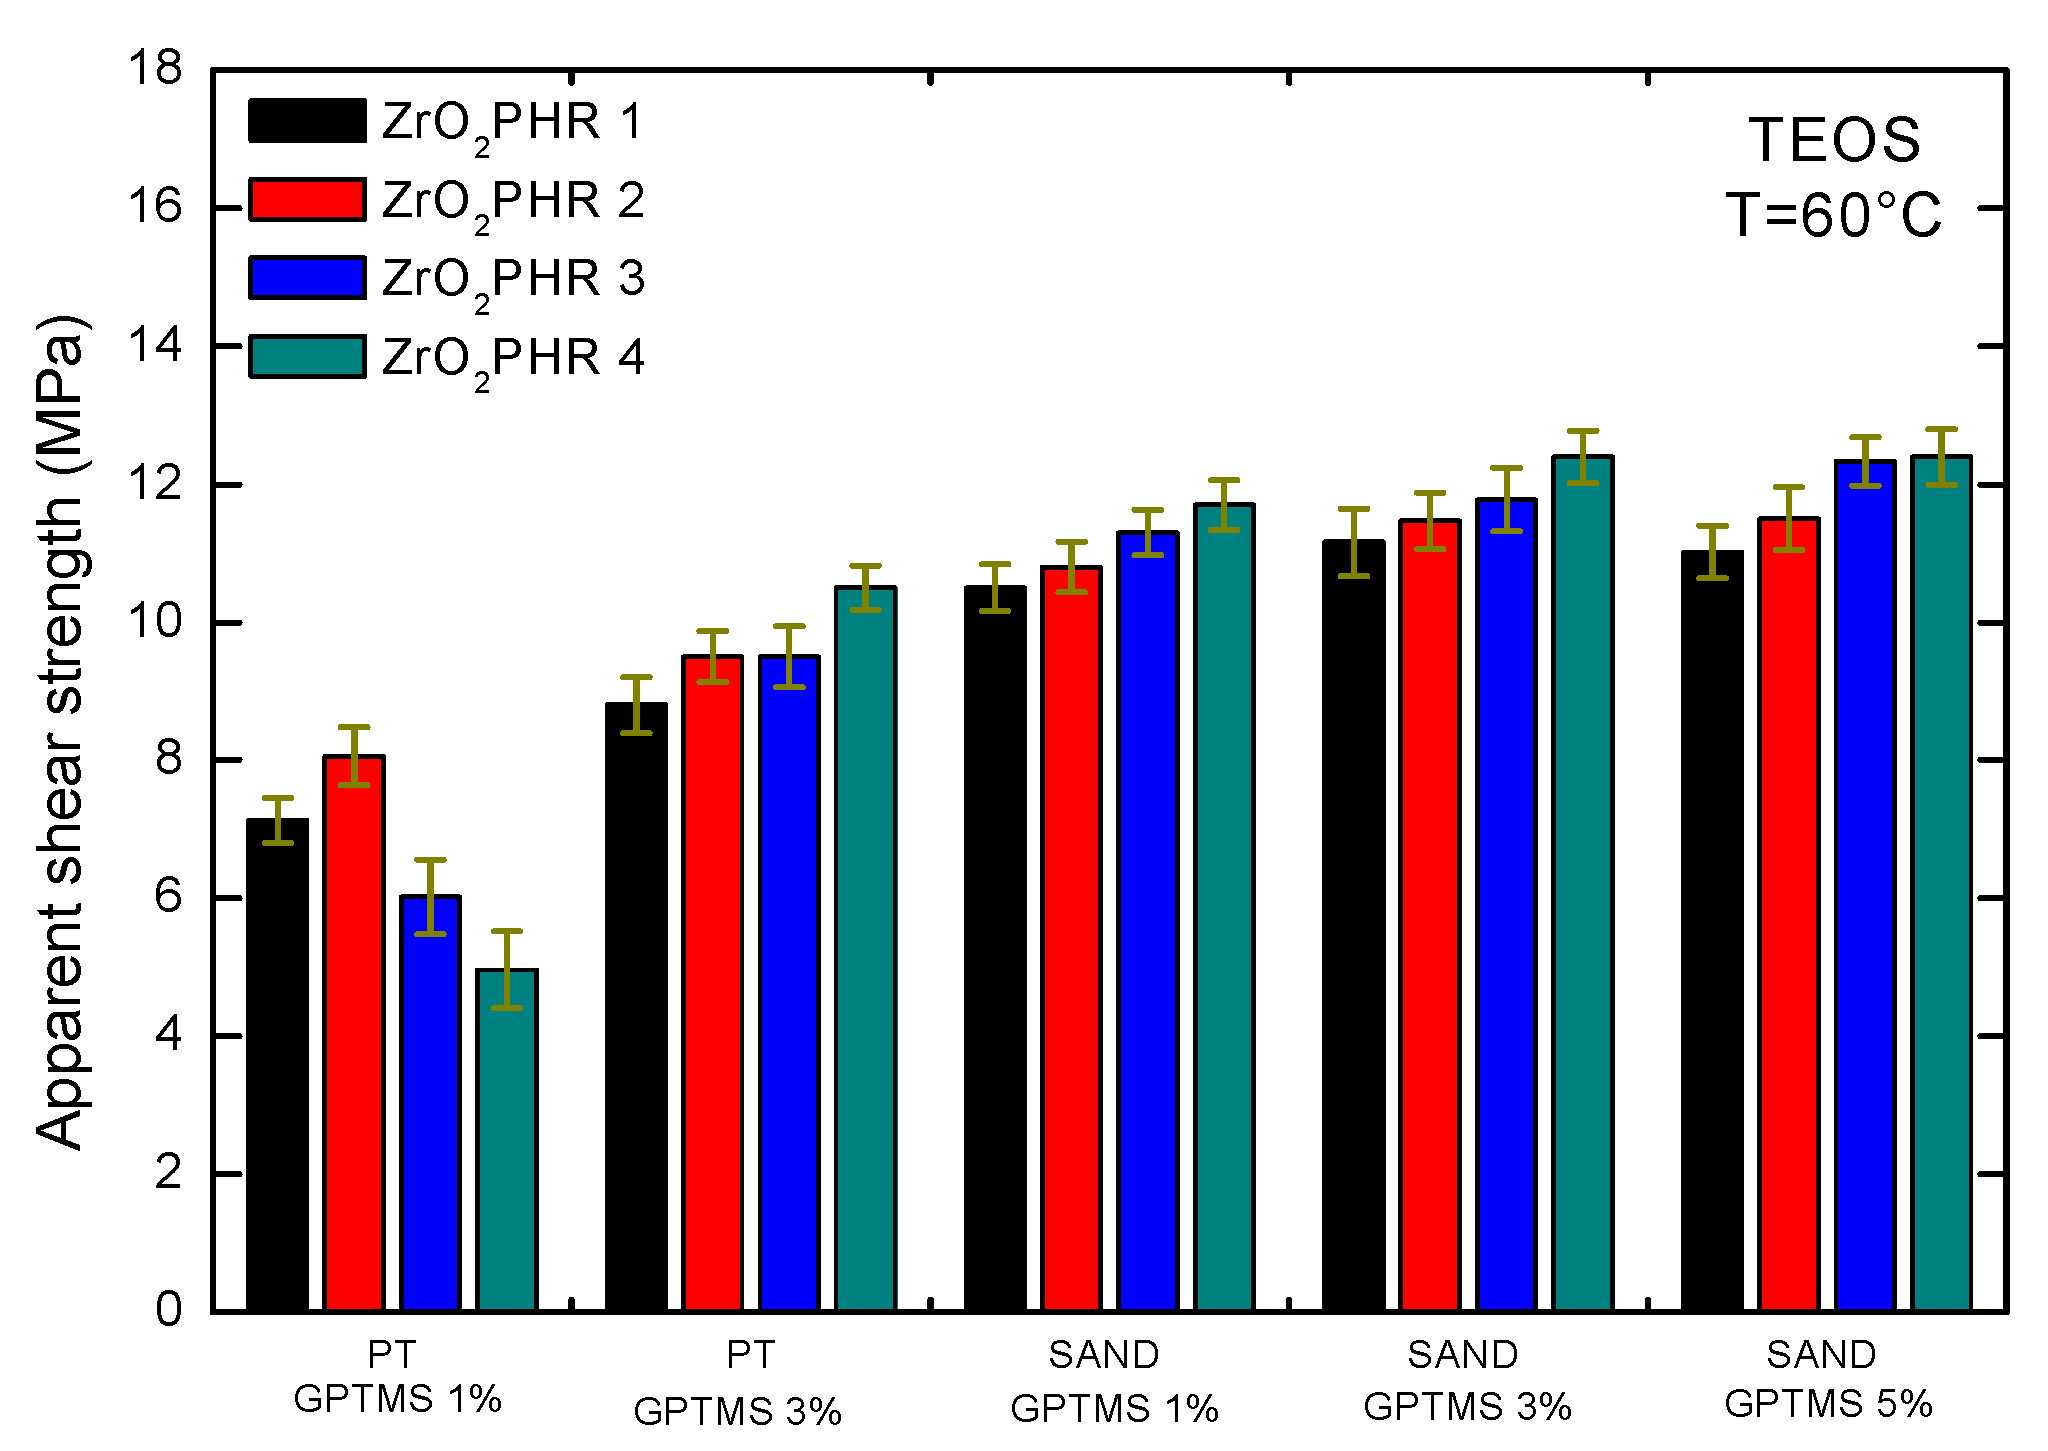
Figure 15.
Apparent shear strength for epoxy-silica-zirconia adhesives with TEOS and GPTMS precursors at different temperatures: (a) T = 60 °C; (b) T = 100 °C; (c) T = 120 °C.
Figure 15.
Apparent shear strength for epoxy-silica-zirconia adhesives with TEOS and GPTMS precursors at different temperatures: (a) T = 60 °C; (b) T = 100 °C; (c) T = 120 °C.
Figure 16.
Apparent shear strength with different surface treatments of aluminum specimens.
Figure 16.
Apparent shear strength with different surface treatments of aluminum specimens.
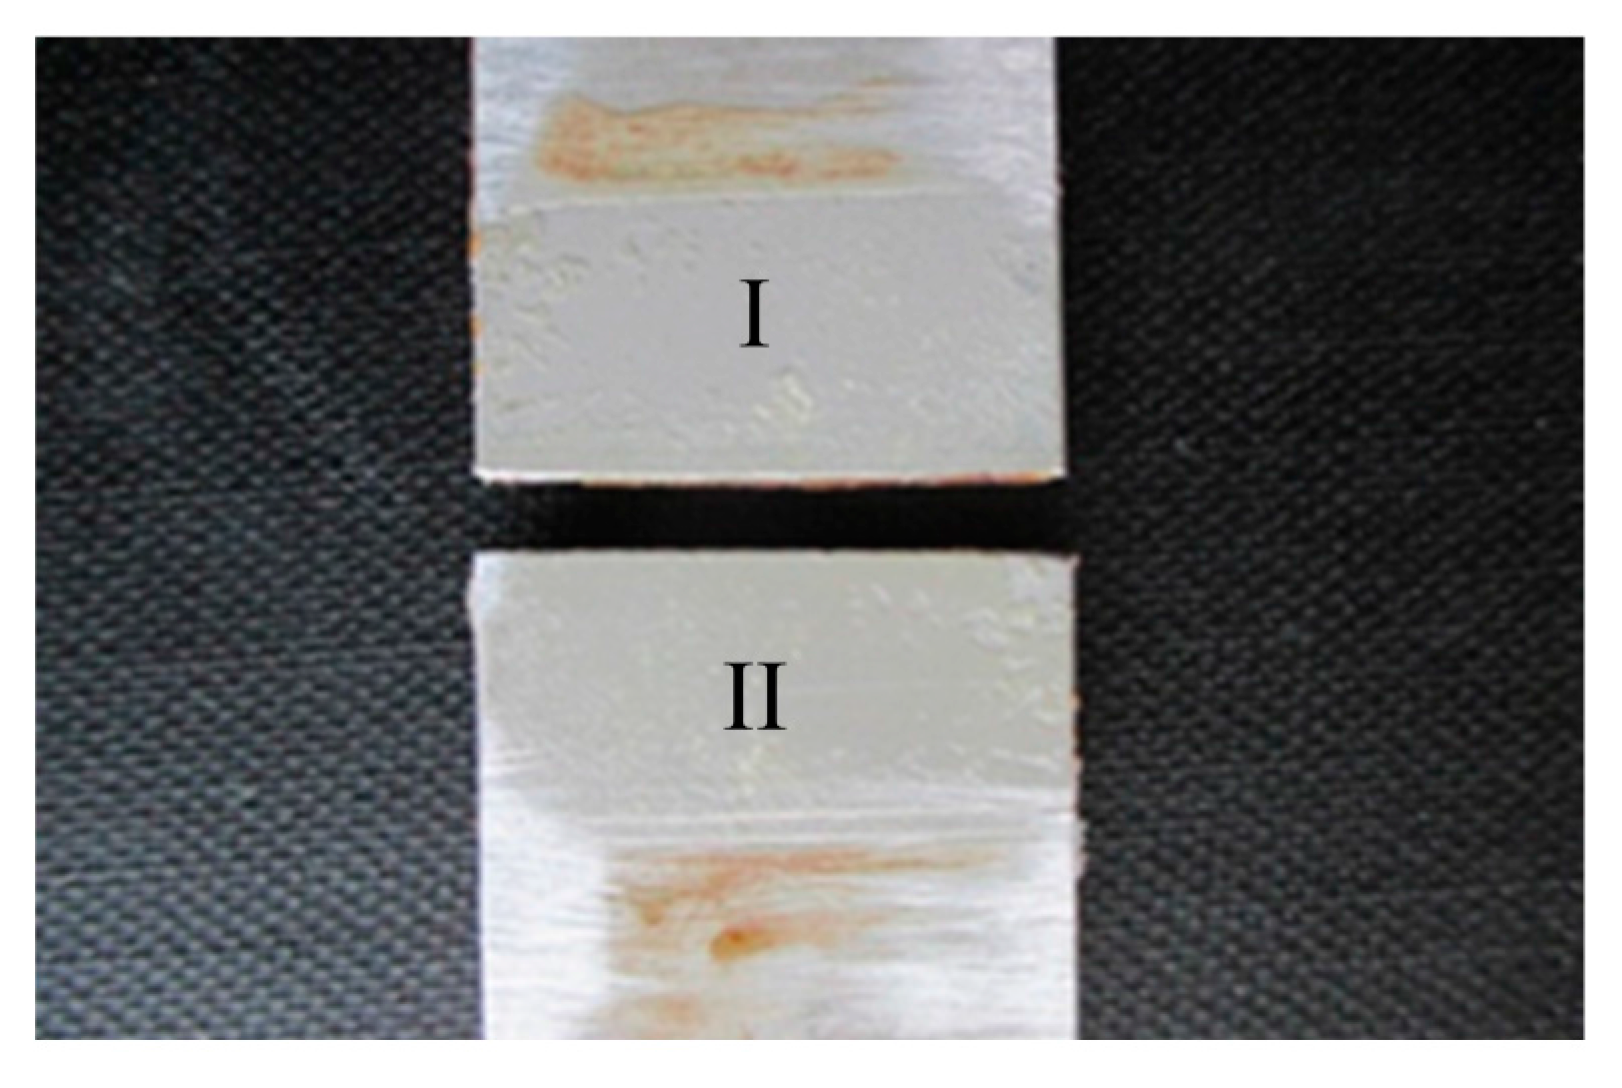
Figure 17.
Aluminum–aluminum specimens after the shear strength test. (Specimen I and specimen II).
Figure 17.
Aluminum–aluminum specimens after the shear strength test. (Specimen I and specimen II).
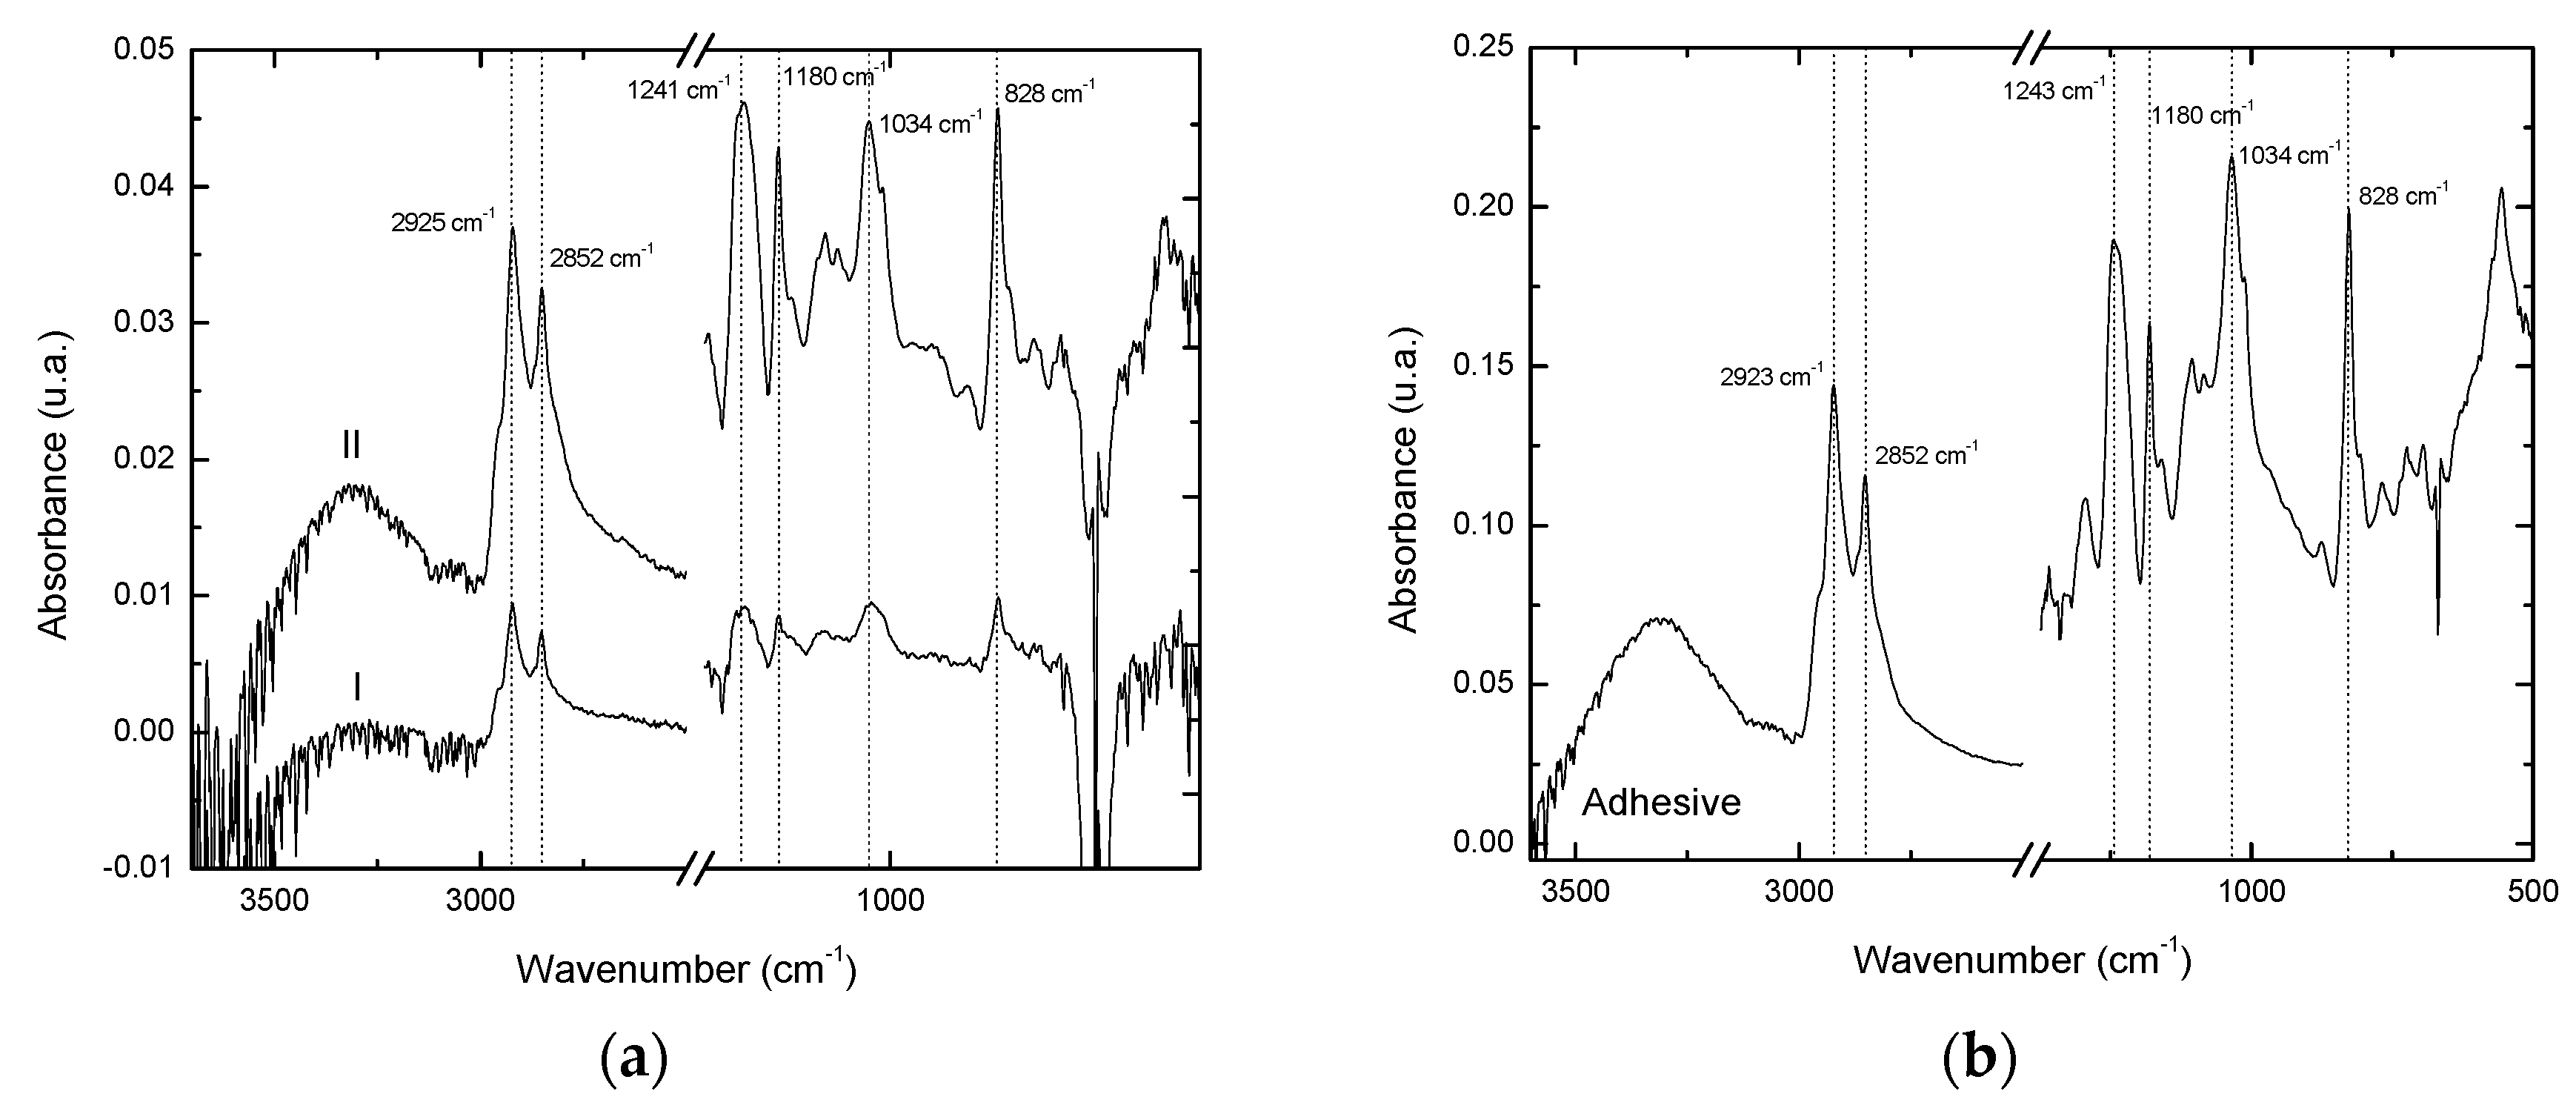
Figure 18.
FTIR spectra: (a) From both faces I and II of the adhesive bond after the shear strength test; (b) From the cured hybrid adhesive.
Figure 18.
FTIR spectra: (a) From both faces I and II of the adhesive bond after the shear strength test; (b) From the cured hybrid adhesive.
Figure 19.
(a,b) SEM micrographs of the hybrid material, show the deformation of the organic matrix due to the energy dissipation at 50 K×.
Figure 19.
(a,b) SEM micrographs of the hybrid material, show the deformation of the organic matrix due to the energy dissipation at 50 K×.
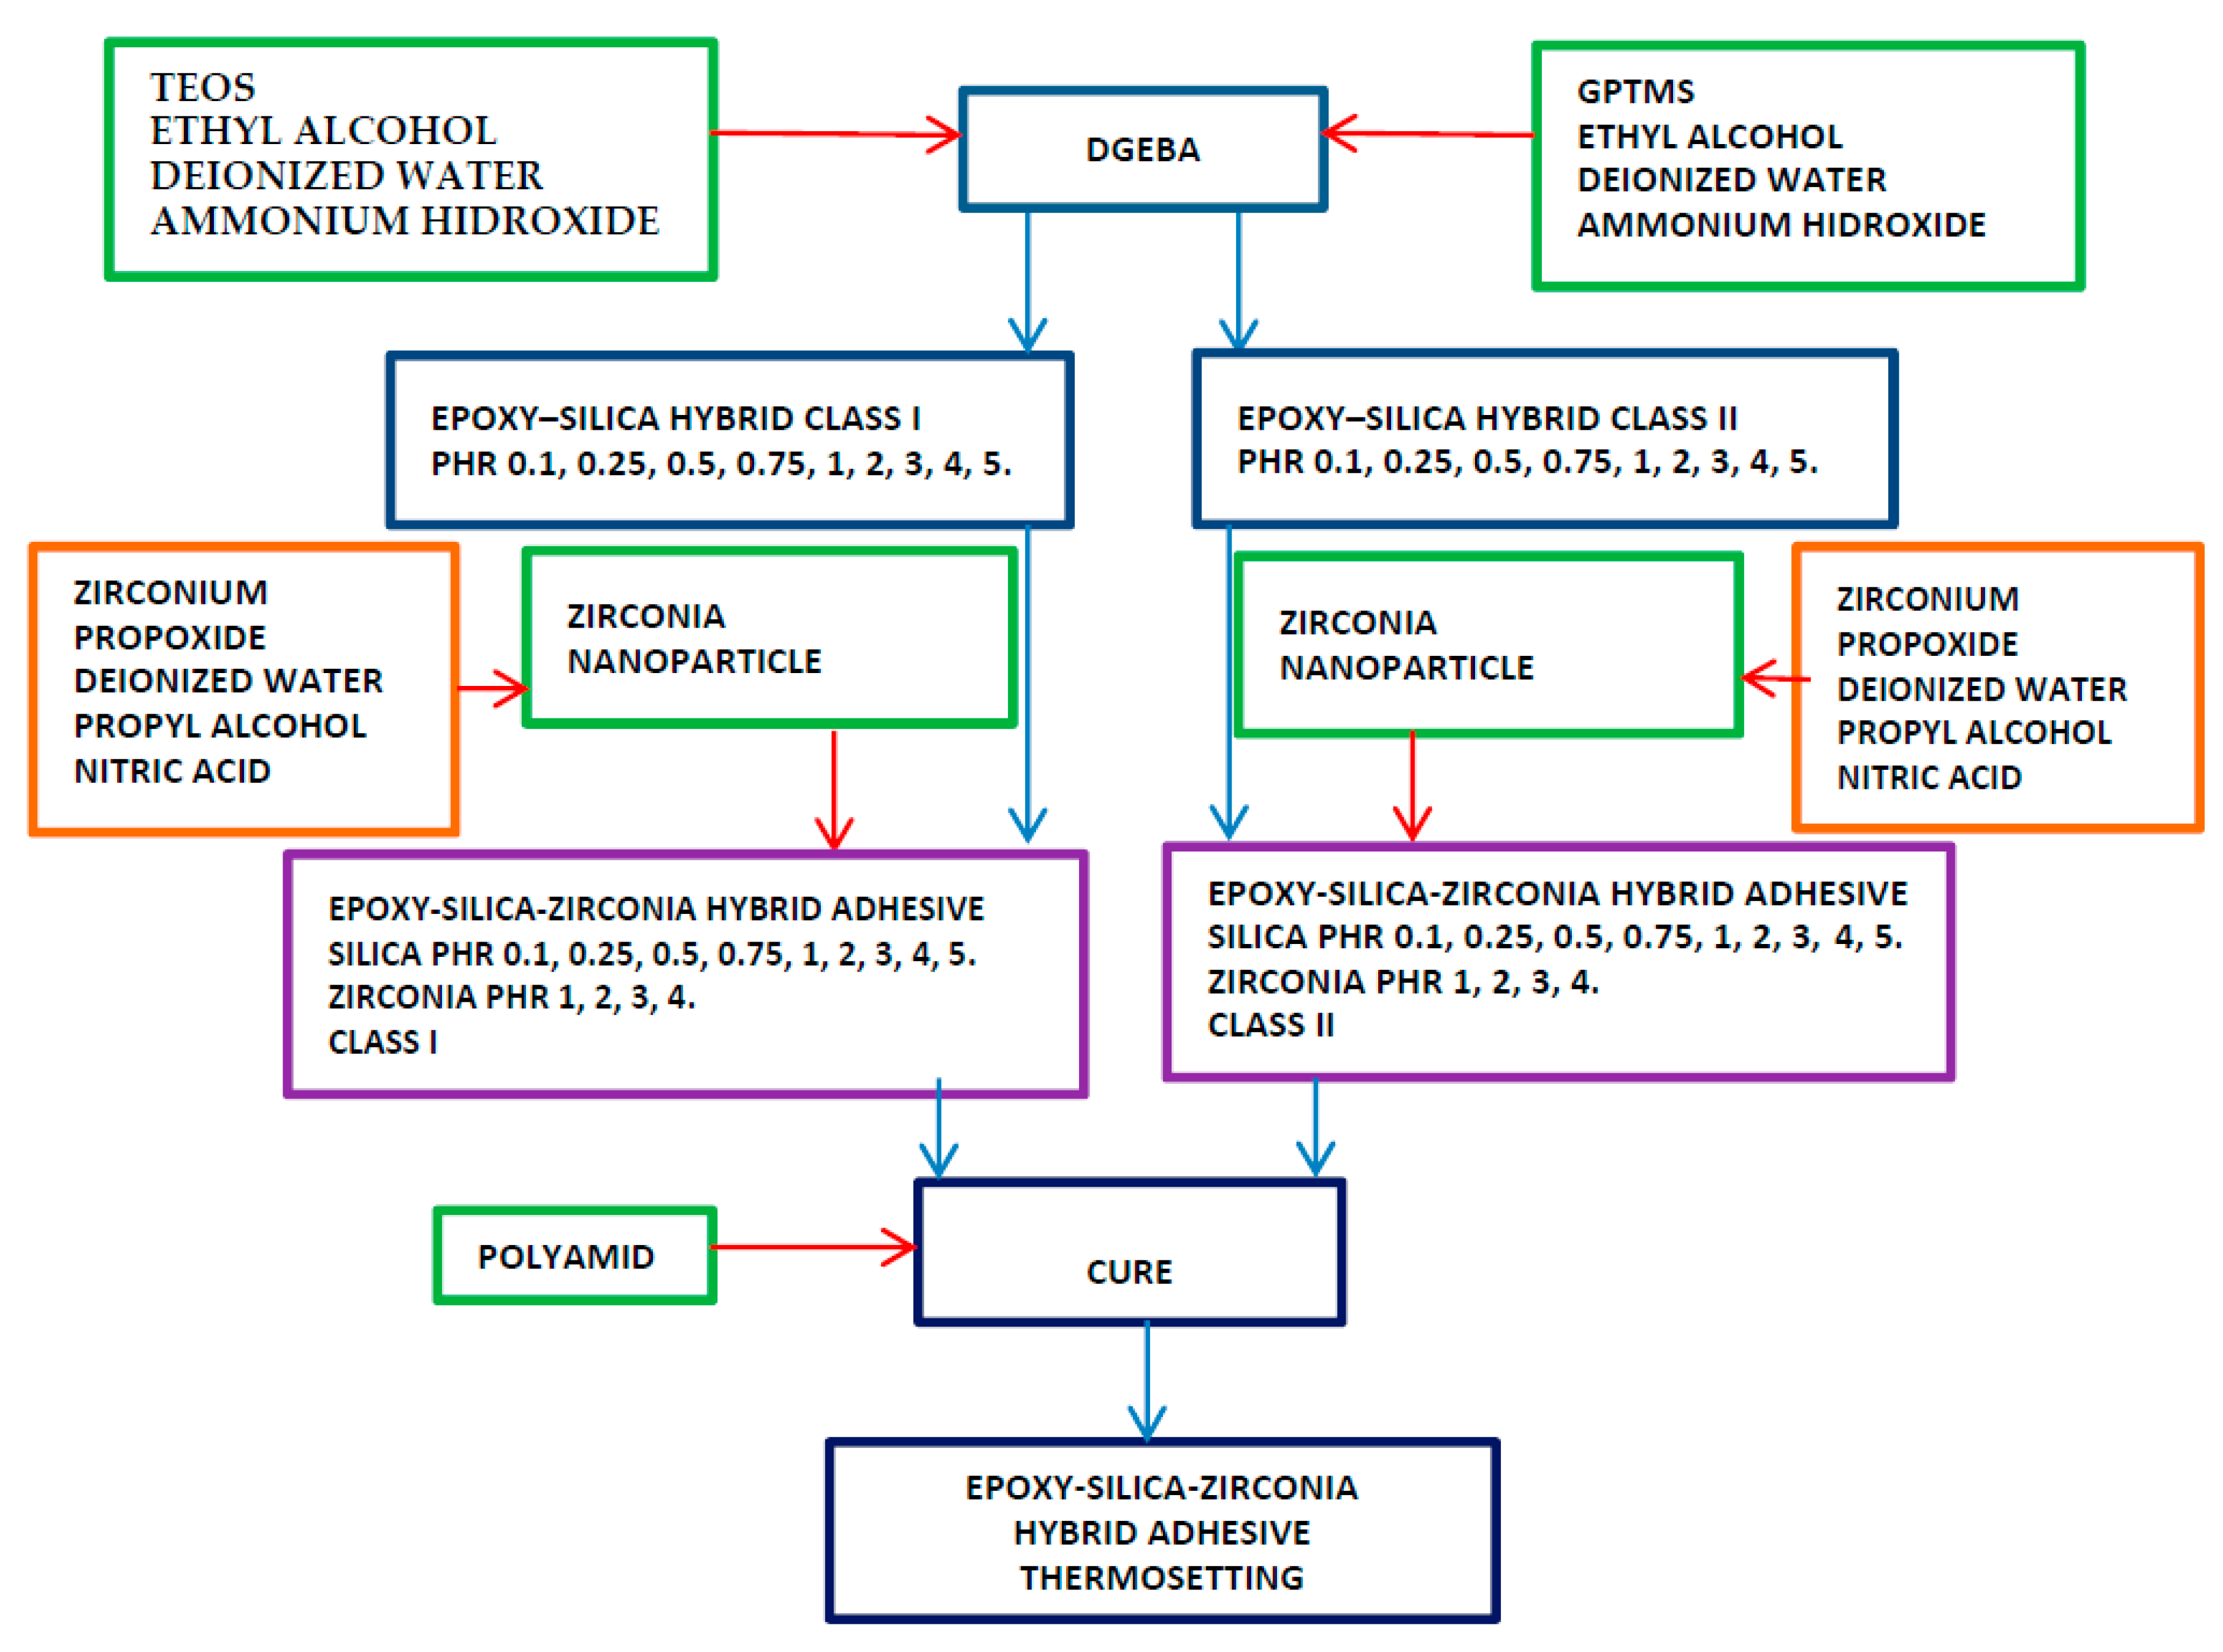
Scheme 1.
Methodology for the synthesis of the epoxy-silica-zirconia hybrid adhesive.
Scheme 1.
Methodology for the synthesis of the epoxy-silica-zirconia hybrid adhesive.
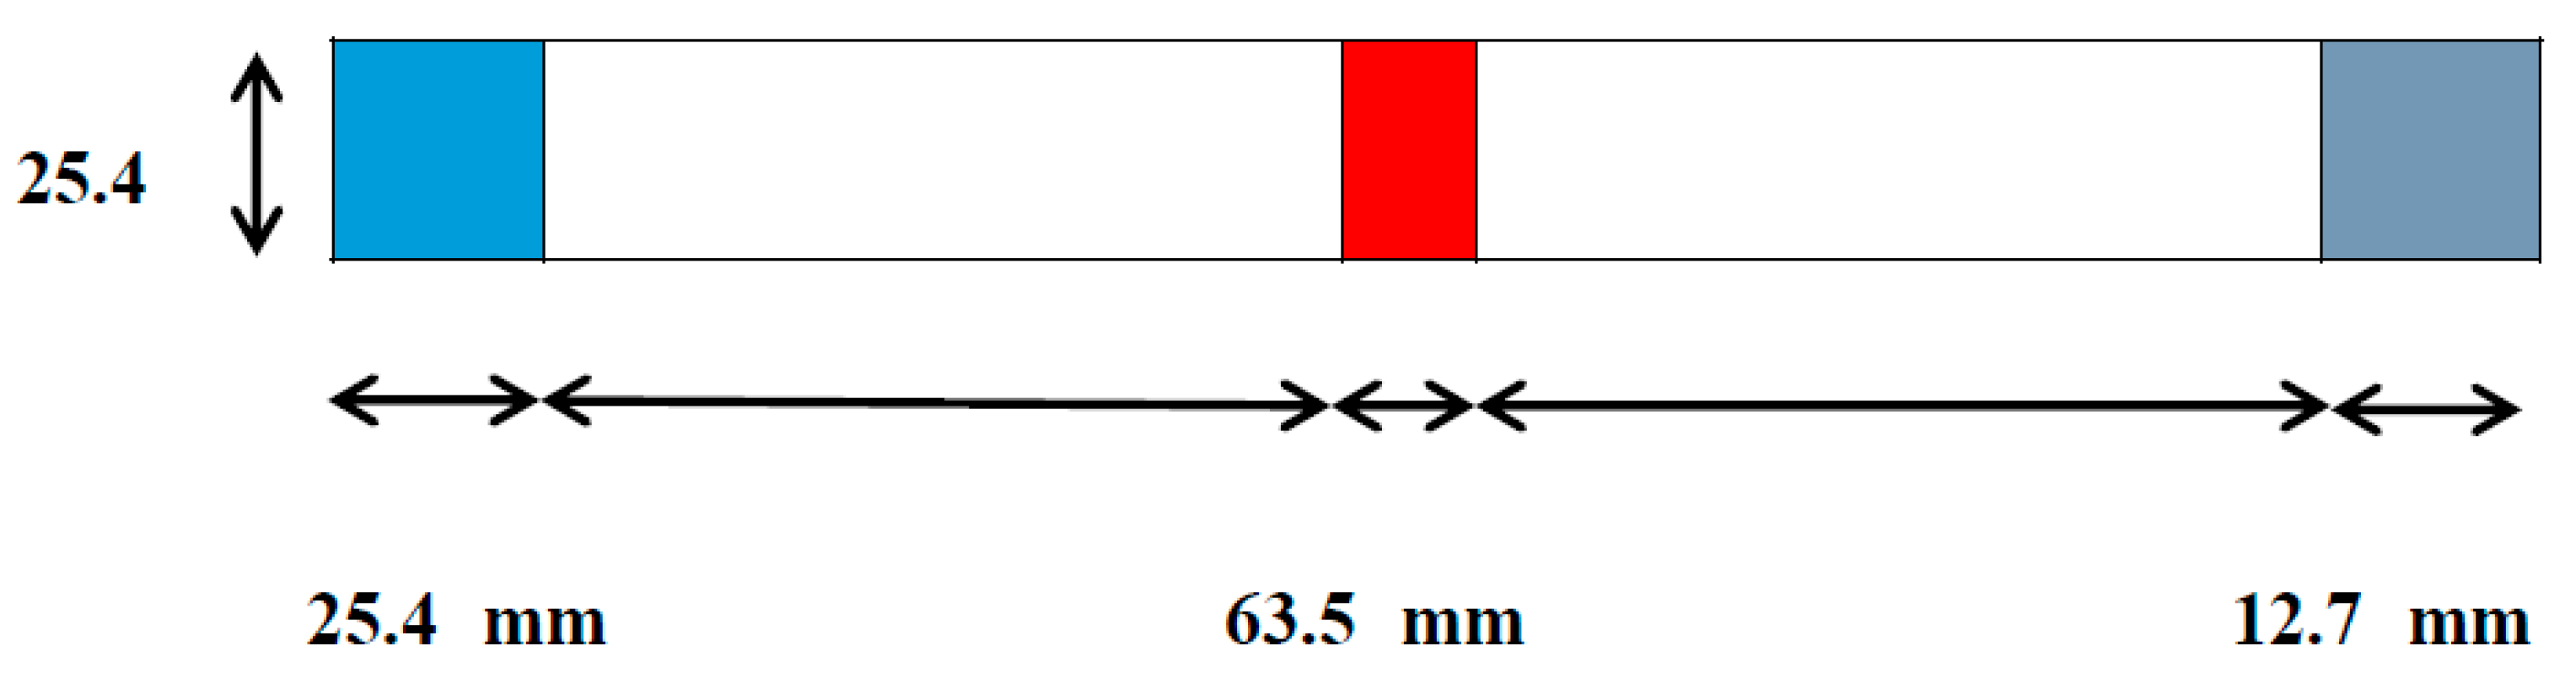
Figure 20.
Aluminum specimen of ASTM STANDARD D1002-05.
Figure 20.
Aluminum specimen of ASTM STANDARD D1002-05.
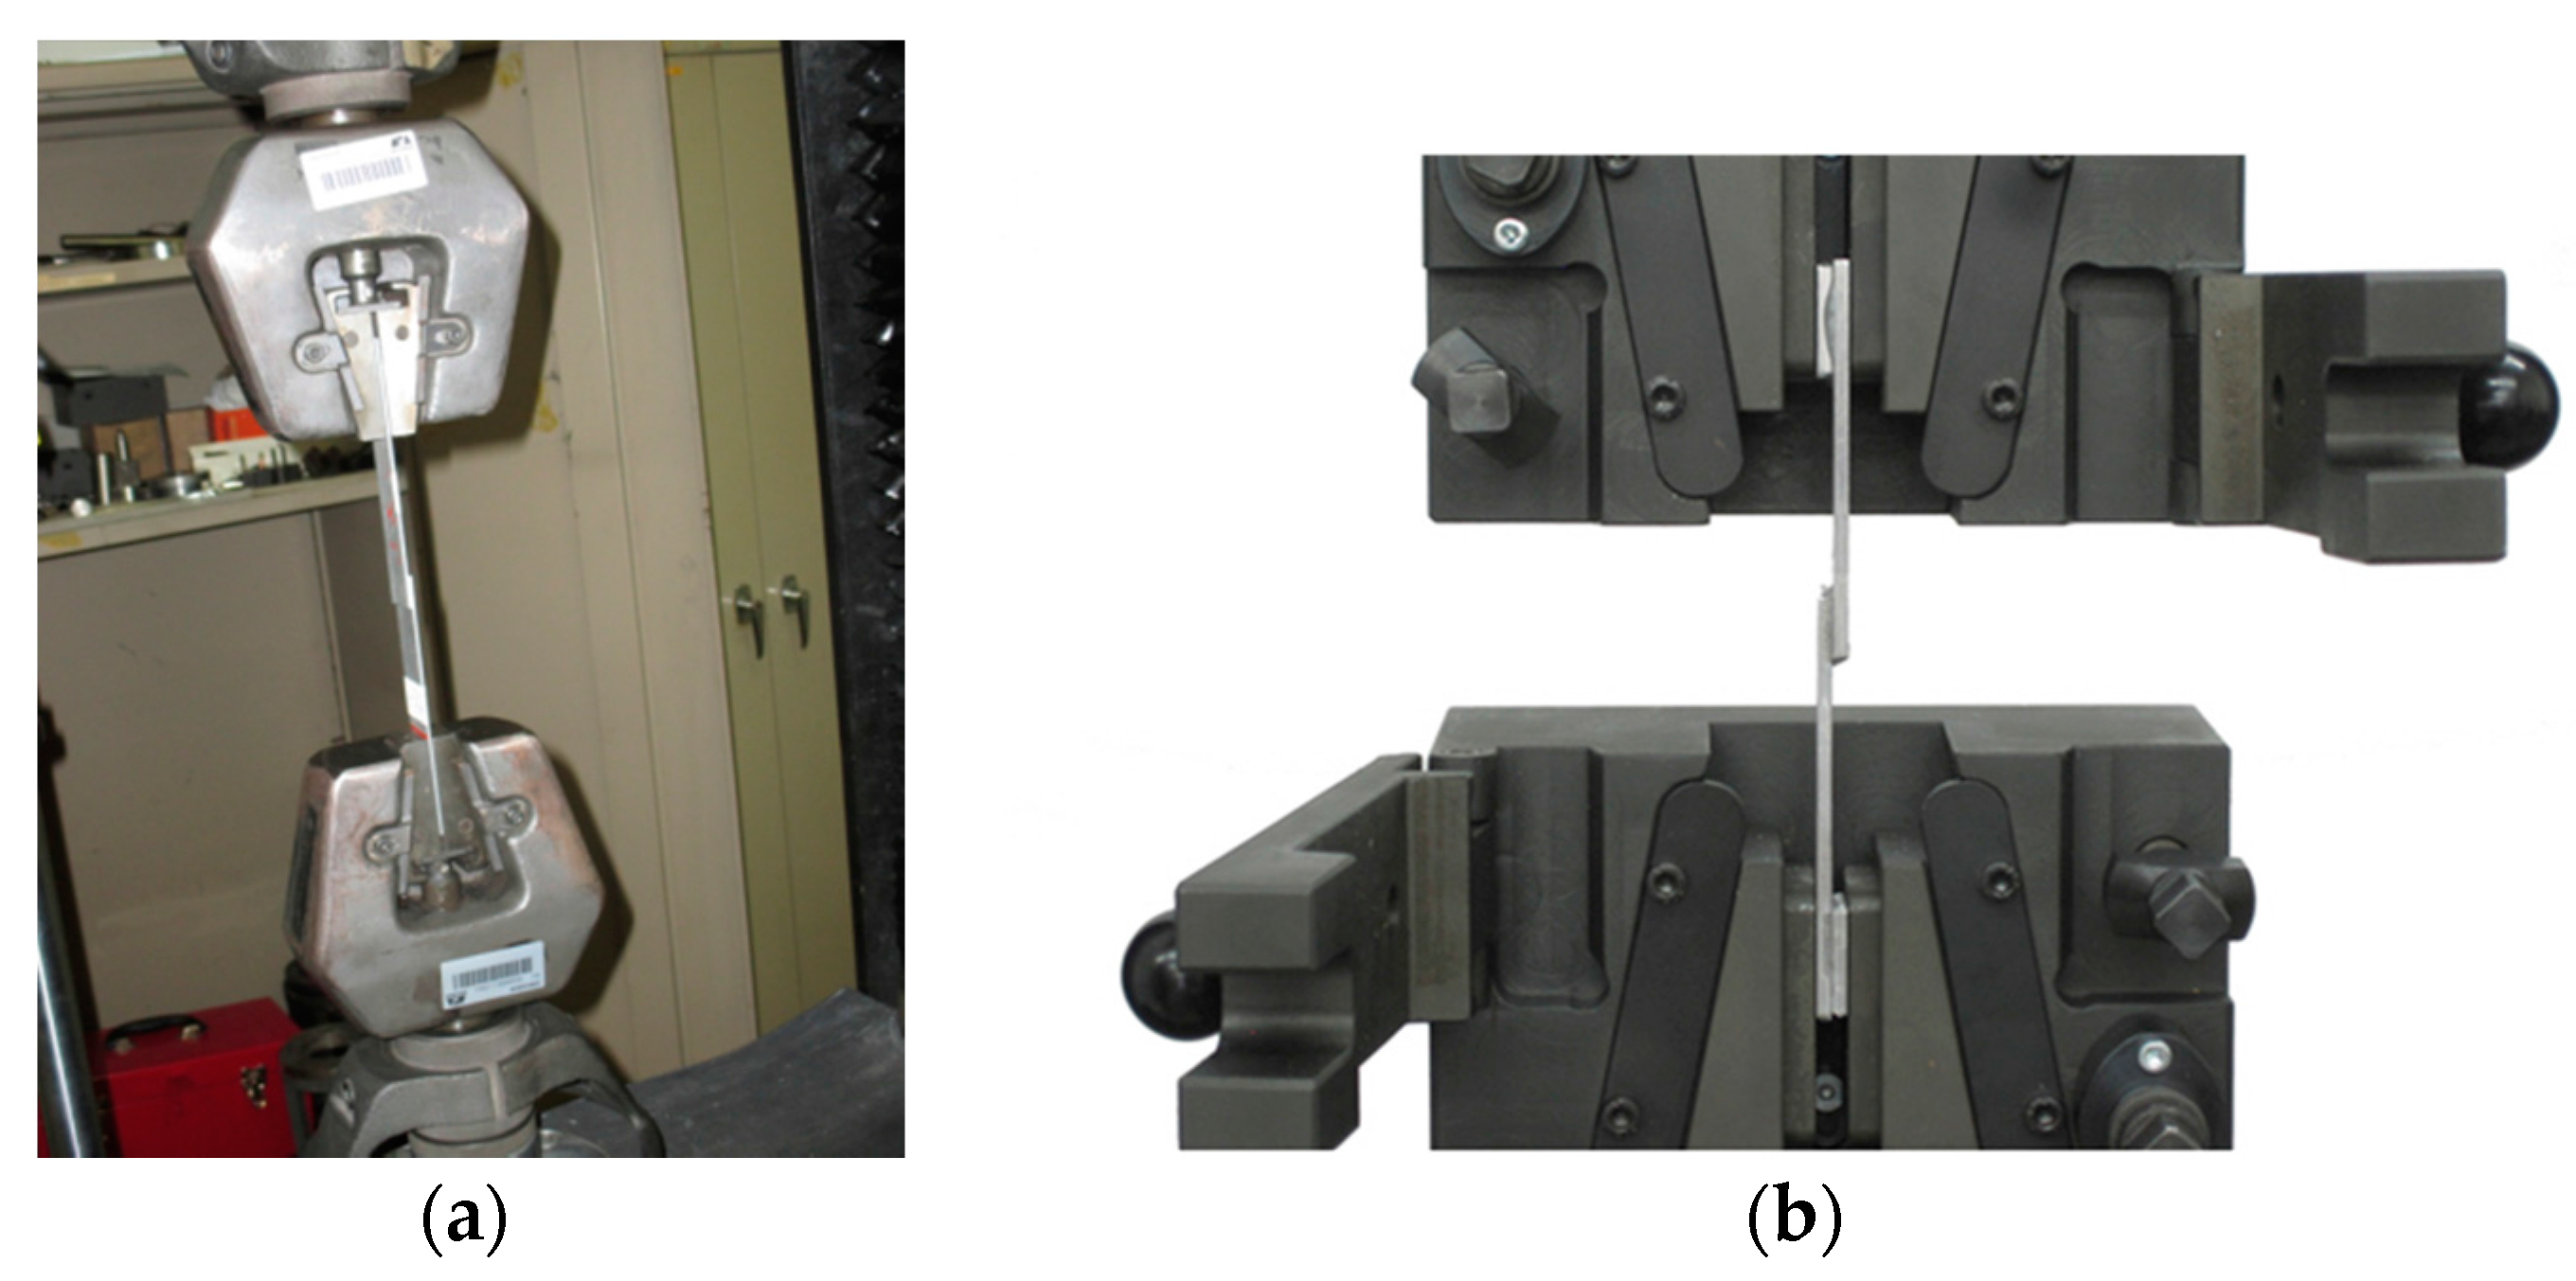
Figure 21.
(a) Photograph of grips employed and set up of the Instron model 1125; (b) Cross section of the supplier’s grips.
Figure 21.
(a) Photograph of grips employed and set up of the Instron model 1125; (b) Cross section of the supplier’s grips.
Table 1.
EDS analysis of the commercial and sandblasting aluminum substrate surfaces.
Table 1.
EDS analysis of the commercial and sandblasting aluminum substrate surfaces.
| Aluminum Specimen Type | Wt % O | Wt % Al | Wt % C | Wt % Si | Wt % Other |
|---|
| Commercial aluminum | 6.90 | 68.76 | 22.97 | 0.44 | 0.93 |
| Sandblasted aluminum | 5.71 | 76.15 | 8.73 | 8.57 | 0.59 |
Table 2.
Weight increase of the pseudoboehmite layer after increasing immersion times in water at 85 °C.
Table 2.
Weight increase of the pseudoboehmite layer after increasing immersion times in water at 85 °C.
| Immersion Time (min) | Final Weight (g) | Weight Increase % |
|---|
| 5 | 0.1316 | 0.1522 |
| 15 | 0.1317 | 0.2432 |
| 30 | 0.1322 | 0.6088 |
| 60 | 0.1325 | 0.8371 |
Table 3.
EDS analysis of the aluminum substrate surface treated with hot water.
Table 3.
EDS analysis of the aluminum substrate surface treated with hot water.
| Immersion Time (min) | Wt % O | Wt % Al | Wt % C | Wt % Si | Wt % Other |
|---|
| 0 | 5.71 | 76.40 | 8.73 | 8.57 | 0.59 |
| 20 | 16.23 | 70.03 | 7.48 | 4.8 | 1.46 |
| 60 | 24.82 | 62.58 | 6.80 | 4.60 | 1.20 |
Table 4.
Weight increase of aluminum specimens after immersion in hydrolyzed 3% GPTMS at pH 5 and 25 °C.
Table 4.
Weight increase of aluminum specimens after immersion in hydrolyzed 3% GPTMS at pH 5 and 25 °C.
| Immersion Time in GPTMS (min) | Final Weight (g) | Weight Increase % |
|---|
| 5 | 0.2912 | 0.5177 |
| 15 | 0.2914 | 0.5868 |
| 30 | 0.2915 | 0.6213 |
| 60 | 0.2917 | 0.6903 |
Table 5.
EDS analysis of the aluminum substrate surface.
Table 5.
EDS analysis of the aluminum substrate surface.
| Immersion Time (min) | Wt % O | Wt % Al | Wt % C | Wt % Si | Wt % Other |
|---|
| 0 | 16.23 | 70.03 | 7.48 | 4.80 | 1.46 |
| 20 | 11.30 | 58.42 | 18.30 | 11.18 | 0.80 |
| 60 | 12.38 | 50.28 | 20.20 | 16.40 | 0.74 |
Table 6.
EDS analysis of aluminum specimen after the drying process.
Table 6.
EDS analysis of aluminum specimen after the drying process.
| Aluminum Specimen | Wt % O | Wt % Al | Wt % C | Wt % Si | Wt % Other |
|---|
| Before drying | 11.30 | 58.42 | 18.30 | 11.18 | 0.80 |
| After drying | 17.38 | 47.50 | 19.00 | 15.06 | 1.06 |
Table 7.
Surface pretreatment for aluminum specimens.
Table 7.
Surface pretreatment for aluminum specimens.
| Treatment | Description |
|---|
| Physical treatment | Abrasion with Scotchbrite fiber under rinsing water. |
| Physical + Chemical treatment with hot water (CTHW) | Immersion in water at 80 °C without stirring to allow a boehmite layer AlO(OH) to be formed, at different times. |
| Physical + CTHW + silanization | GPTMS was hydrolyzed in water at 25 °C for 60 min, then the aluminum specimen was immersed for 10 min at 25 °C and dried in a stove at 100 °C, for 60 min. |
| Sandblasting + CTHW + silanization | The aluminum specimen was sandblasted with silicon carbide (particles of 50 μm diameter) then the CTHW + silanization treatments were applied. |


 ,
, 


