1. Introduction
Fluctuation in fossil fuel prices, their shortage and an increasing concern with global warming have fostered a new decentralized mode of energy generation—distributed generation (DG)—which is becoming increasingly attractive. In addition, the integration of DG in grids with renewable energy (RE) systems leads to energy efficiency and a reduction of greenhouse gas (GHG) emissions, and also offers voltage support, diversification of power sources, reduction in transmission and distribution losses, and improvement of reliability [
1].
The recent growing interest in RE generation, especially front-end inverter-based large-scale photovoltaic (PV) and wind systems, has imposed new challenges to accommodate these sources into the existing transmission/distribution systems, while keeping power quality (PQ) indices within acceptable limits [
2]. Electric power systems are characterized by centralized generation and are designed for energy to flow in one direction, from transformer plants to each feeder. The increasing number of devices connected to the existing grids raises concerns about PQ, as the energy starts to flow in both directions [
3]. Voltage fluctuations, the injection of harmonics or excessive neutral currents cause low efficiency and poor power factor, decreasing the energy PQ [
4]. They can also cause disturbances to other consumers. Therefore PQ of medium to low voltage (LV) power distribution systems has become an important concern for utility, facility and consulting engineers in recent years [
5].
Solar energy is one of the most promising DG sources [
6], not only for supplying home owners with their energy needs, but also for other applications, such as electrolysis of water using the excess of electricity produced to supply fuel-cell vehicles [
7]. Its penetration level into the grid is also increasing worldwide. However, solar energy applications still have some limitations, such as its cost [
8], low PV efficiency (PV modules require a large surface area for a small amount of energy generation) [
9], intermittency and unpredictability [
6].
The massive penetration of small PV systems connected to LV grids can be a source of PQ problems [
10]. Changes in solar radiation, including weather changes and passing clouds, can affect the operation of a PV generator, as well as the energy produced, and therefore the output power [
11]. Voltage variations appear during short periods, however these can strongly stress the electrical devices supplied by the power system and, in particular, the owner of the PV facility [
12,
13].
The negative impact on the system’s power caused by variations in operating conditions is well known, however the analysis of PQ has received less attention than it deserves [
14,
15,
16]. Improving the PQ of microgrid systems has been an important issue in DG, mostly by developing control and operational concepts [
2,
17,
18], including their components [
19,
20,
21,
22]. The promising integration of DG using RE and its penetration in the market gave rise to the smart grid (SG) concept, where DG provides major opportunities. The use of microgrids may be able to simplify the implementation of SG functions, including reliability, self-healing, and load control as a way of improving the system’s PQ [
23].
The present work investigates operation malfunctions and economic viability of a micro PV generation facility connected to the grid.
Section 2 and
Section 3 review some issues related to the PQ problems and characteristics, as well as their effects on solar microgeneration, and present the acquisition data from the PV facility.
Section 4 defines the methodologies and analysis.
Section 5 addresses the results, showing graphic information about voltage fluctuation, dips and swells, frequency, harmonics and statistical analysis. A solution was proposed to overcome the identified problems and a grid strengthening was implemented. Results obtained before and after the grid strengthening were compared with the aim of investigating the source of the malfunction of the PV system.
Section 6 concludes the paper.
2. Power Quality Issues in Distribution Grid
PQ quality is a widely used expression referring to electromagnetic phenomena on a power supply system that can cause problems for the regular operation of the equipment. Ideally, the best electrical supply would have a sinusoidal voltage waveform with constant magnitude and frequency. However, the non-zero impedance of the supply system, the large variety of loads that may be encountered and other phenomena, such as transients and outages, result in high costs for the user [
24]. A lack of quality in a power system causes interruptions and deviations of the supply signals from the nominal characteristics [
25]. Most PQ problems are related to faulty connections and/or wiring. However, power frequency disturbances, transients, electromagnetic interference, harmonics and low power factors are other categories of PQ [
26,
27]. Among them, harmonics are the most dominant. Their effects were described by Henderson and Rose [
28]. According to the Institute of Electrical and Electronics Engineers (IEEE) standards, the harmonics of a power system should be limited by two methods: limit harmonics of current to the point of common coupling (PCC) and limit the harmonics of voltage to PCC [
27].
PV-caused disturbances in power systems are time-variant because of the continuous changes in PV output power. These variations are organized into two basic categories: disturbances and steady state variations. Disturbances are measured by triggering an abnormality in voltage or current. When the maximum value of the voltage exceeds a specified threshold, it is detected a transient. Steady state variations include normal root mean square (RMS) voltage variations and harmonic distortion, measured by sampling either voltage or current over time. These data are then presented as a trend of quantity over time and analyzed using statistical methods. Harmonic distortion is also a characteristic of PQ variation, but it is analyzed separately because it does not involve variation in the fundamental frequency of voltage component. PQ indices can refer either to the point of connection (PoC) of a single customer or to the whole distribution system [
10].
2.1. Voltage
Loads are continually changing over time and the system is continually adjusting to these changes, leading to long duration voltage variations, which can either be undervoltages or overvoltages, depending on circuit conditions. Long duration voltage variations are characteristic of a steady state, and include variations in the fundamental frequency voltage that last less than one minute [
5]. These voltage variations can be: momentary LV (dips), high voltage (swells) or loss of voltage (interruptions), all measured as variations in the RMS value of voltage, and characterized by longer time intervals whose duration can be measured in cycles or seconds. Voltage dips may occur more often, but interruptions are the most severe in terms of impact on end users. Short transients can be seen as voltage disturbances superimposed on the nominal waveform, evidenced by sharp brief discontinuities, measured in sub-cycles.
According to the Standards [
29,
30], it is possible to identify the different LV disturbances [
5]:
Brief momentary (cycle) voltage disturbances can be classified as impulsive or oscillatory transients. They can produce degradation in the insulation of electric equipment like capacitors, transformers and rotating machinery, decreasing the mean time between failures;
Dips, or undervoltage, refer to the momentary decrease in the RMS voltage amplitude, for durations varying from a half-cycle to 1 min;
Swells, or overvoltage, refer to the momentary increase in the RMS voltage amplitude, for durations varying from a half-cycle to 1 min;
Long duration variations (longer than 1 min) in the supply voltage are referred to as overvoltages and undervoltages;
Interruptions refer to a complete loss of voltage for a time period.
2.2. Harmonic Distortion
A harmonic distortion is a characteristic of the steady state voltage and current, resulting from the operation of nonlinear loads and devices in the power system. Nonlinear loads that cause harmonics can be represented as current sources of harmonics. Harmonic voltage distortion results from an interaction between the harmonic currents and the system impedance.
The harmonic distortion levels for voltages can be characterized by the complete harmonic spectrum, with the magnitudes of each individual harmonic component rated to the fundamental component or as a single quantity—the total harmonic distortion (THD). The most dominant harmonics are the 3rd, 5th, 7th and 11th order. However higher-orders can be observed [
10].
3. Power Quality Issues in Grid Integration of Solar Photovoltaic Systems
The PV panel is an array of PV modules either in series or parallel. The output will depend mainly on the solar intensity and cloud cover. PQ problems will depend on irradiation and the overall performance of the PV systems including the module, inverters, filters controlling mechanisms, etc. Good PQ translates into a sinusoidal voltage and current output from a PV system that avoids harmonics, interharmonics and eventually voltage distortion [
11].
Also important are aspects related to the quality of the electricity, namely the voltage and current profiles, generated by the inverter, the element in a PV system responsible for converting energy. Voltage swells may occur when heavy loads are removed from the connection or disturbances affect the voltage causing the disconnection of inverters from the grid and therefore resulting in losses of energy and degradation of efficiency [
9,
31].
Reliability issues are related to supply interruptions, low quality of energy and grid operation failures. These disturbances are associated with short circuit capacity. It is expected that PV systems will play an important role in distributed generation. Its presence will lead to changes in the configuration and operation of the electricity distribution systems. If a large number of PV systems are connected to a branch of a LV distribution system, voltage increases at the connection point and power might flow backwards, and thus voltage levels could increase during periods of small load and high solar irradiance [
16]. The presence of harmonics in the electrical system may lead to changes in line impedances, imbalances in line voltages and alterations in AC voltage values. Moreover, a LV public grid must have a degree of quality in electric power that may prevent the abnormal operation of the PV generator. Consequently, the abnormal operation of a PV generator can lead to a shutdown.
PQ is a complex area that covers many different topics [
32]. Related problems have shown a relevant economic impact in industry [
33]. Furthermore, in networks and industrial processes equipment is more interconnected, and hence the impacts of a single problem can cause more severe problems. There are two ways to mitigate the PQ problems, either from the costumer side or from the utility side [
3]. One approach is load conditioning and another solution is to adopt power conditioning systems to avoid possible disturbances.
4. Procedure Analysis and Methodologies
There is no specific standard methodology for the measurement and assessment of PV-caused disturbances, but it can be defined based on standards for disturbing equipment/installations [
29,
34,
35], and the standards for measuring main voltage parameters [
30,
36]. Nevertheless, the methodology needs to be adapted to certain characteristics of PV systems, such as random generation. Specification of procedures for measuring disturbing emissions in PV systems has never been a priority. However, some characteristics of PV-caused disturbances are dependent on the output PV power level and they are only present when PV systems operate during irradiance hours.
The test source conditions for small PV systems should agree with the standards mentioned above and the measurement equipment must have Class A accuracy [
37]. In addition, measurements should be recorded on the currently operating PV system [
10].
The integration in the same monitoring device of measurement capabilities for different disturbances that can affect loads, such as flickers, harmonics and transients, is required today for the continuous monitoring of PQ. Also, high resolution is required for measuring stationary harmonics, while continuous long term monitoring is required for measuring fluctuating harmonics [
26].
The aim of this work was to understand why frequently the converter automatically turned off from the grid. Since this occurs very often, it may reduce the amount of energy delivered to the grid, resulting in economic losses to the facility owner, insofar as he is not selling as much energy as he can produce. Moreover, this causes the converter to work in an undesirable operating mode. This situation creates fluctuations in the voltage caused by current variations.
The monitoring of the facility mentioned above began with the installation of a single phase voltage quality recorder (VR1710, Fluke, Eindhoven, The Netherlands) for collecting data corresponding to voltage evolution in a time interval. The data obtained was used for subsequent analysis of the facility’s operation behavior and voltage quality, aimed towards two different factors: voltage fluctuations of the PV system output and voltage harmonic distortion.
The former is usually considered to be a serious problem in PV systems due to the severe operational problems for the utility grid caused by variations in solar irradiance (depending on climacteric conditions or on panel placement), power swings in lines, both under and over loading, critical voltage fluctuations and voltage flickers [
38]. This is much more relevant in rural facilities with radial distribution systems and with automatic disconnection of the inverter from the grid due to overvoltage beyond the technical established limit (253 V). The latter is considered to be a serious PQ problem in PV systems, which may occur due to the use of power inverters, and causes decreases in the reliability of power systems [
39].
The equipment was configured to start data recording at the same time as the team visit and lasted four days. The voltage values were registered every 5 s. Therefore, 69,120 values of voltage, 69,120 values of frequency and 368 values of harmonics were collected. The voltage dips were defined as values not higher than 207 V and the voltage swells were defined as values not lower than 253 V (the rated voltage being 230 V).
5. Experimental Results
The system under study is a grid-connected centralized type, located in a countryside region of Portugal, with a peak installed power of 3.45 kWp, and is covered by a special regime, under Decree Law number 363/2007. The decree-law establishes that a low voltage consumer can also be a producer and sell electricity to the grid for 15 years within special conditions. This subsidized regime is applied to micro-units with a capacity limited to 50% of the contracted power and not more than 3.68 kW of delivered peak power, using the following energy sources: solar, wind, hydro, and biomass cogeneration covered by a special regime.
The facility is constituted by 21 UP-M175M type solar panels manufactured by UpSolar Europe SAS (Paris, France). The panels are installed in a fixed structure without tracking. The panel strings (three modules in parallel and seven panels per module) are connected to the grid through a Sunny Boy SB 3300 converter from SMA Solar Technology AG (Niestetal, Germany). The system installation,
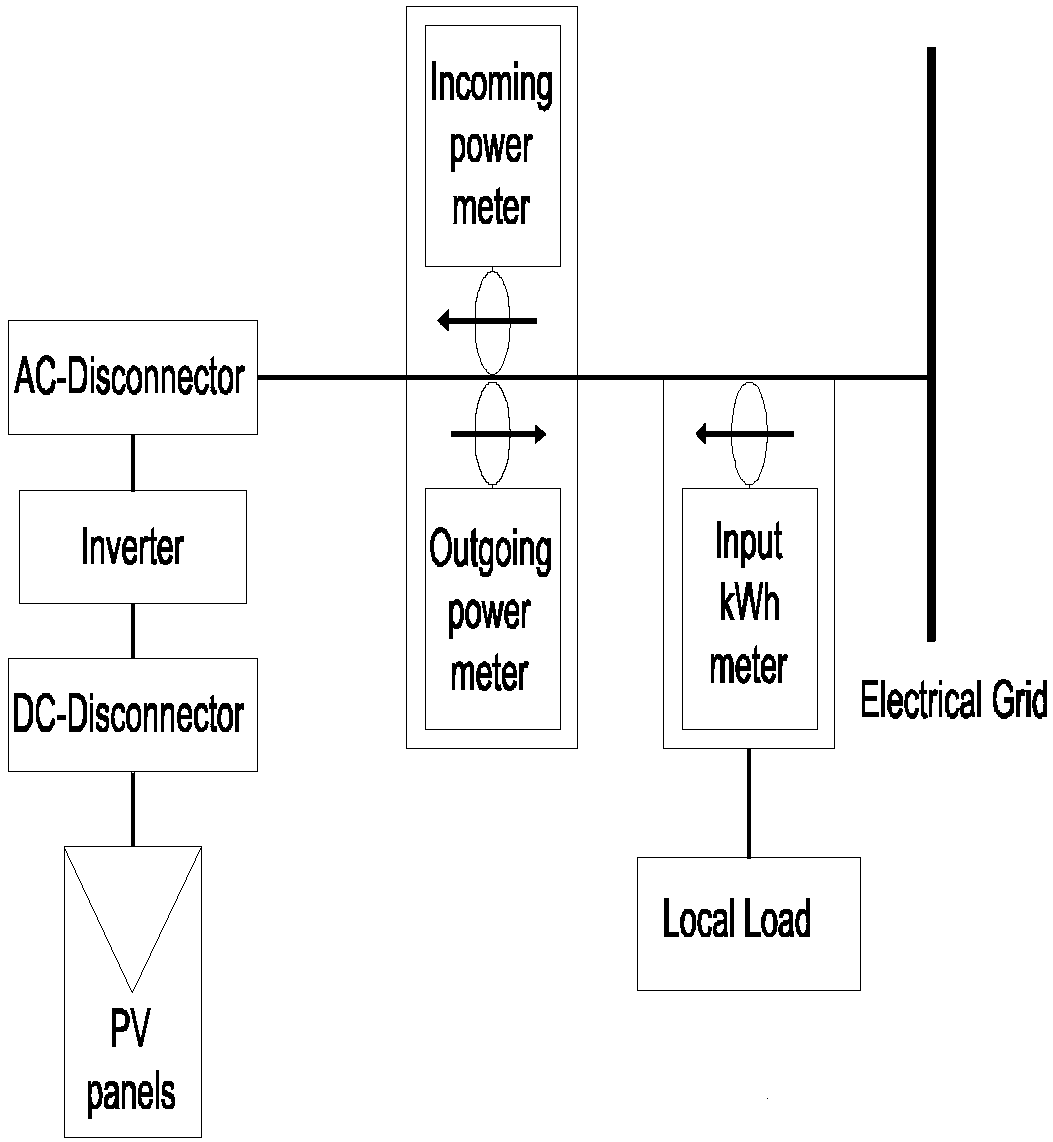
Figure 1, is located in a rural area, fed by a LV line with several residential consumers, derived from an aerial transformer located 1.5 km away (the end point).
The PV system holder reported very small revenues (less than 10% of the expected) from the beginning of the installation operation (in February). This happened consistently along the months until the grid strengthening (in September).
The acquired data were recorded during a period of four days in two grid conditions: before the grid strengthening (in June) and after the grid strengthening (in October). The grid strengthening was carried out by substituting the old LV overhead lines using bare conductors carried on ceramic insulators with a new aerial bundled cable system with a higher cross-section. The aim of that was to reduce the line impedance. All the data were obtained in chosen sunny days in order to guarantee similar weather conditions. The most critical behavior of the system occurs for both low load and high PV generation conditions. Due to the characteristics of the countryside region, the seasonal load variation occurs mainly in the afternoon, overnight and in the early morning. On the other hand, the highest PV generation occurs in the complementary period in sunny days. So, despite the seasonal variations, the observed days represent the most significant behavior, since they correspond to periods of higher production (spring, summer and autumn).
Statistical analysis considers all the data for both cases: before and after the grid strengthening, but for the remaining analysis here and for illustration purposes we rely on the data recorded during one single day for each case.
5.1. Voltage Profile
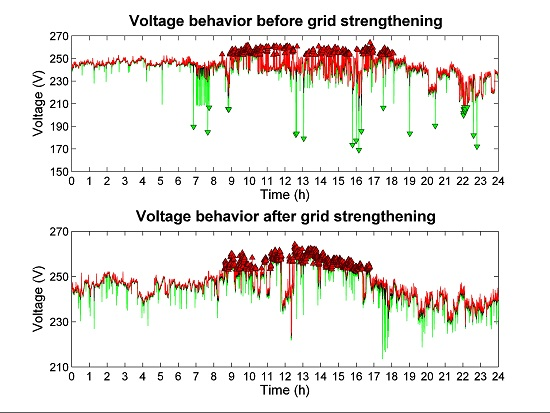
Figure 2 represents the voltage profile for the chosen day. It is possible to see that overnight and in the early morning, voltage exhibits values almost 10% higher than the rated voltage (230 V), the limit imposed by European Standard EN 50160 [
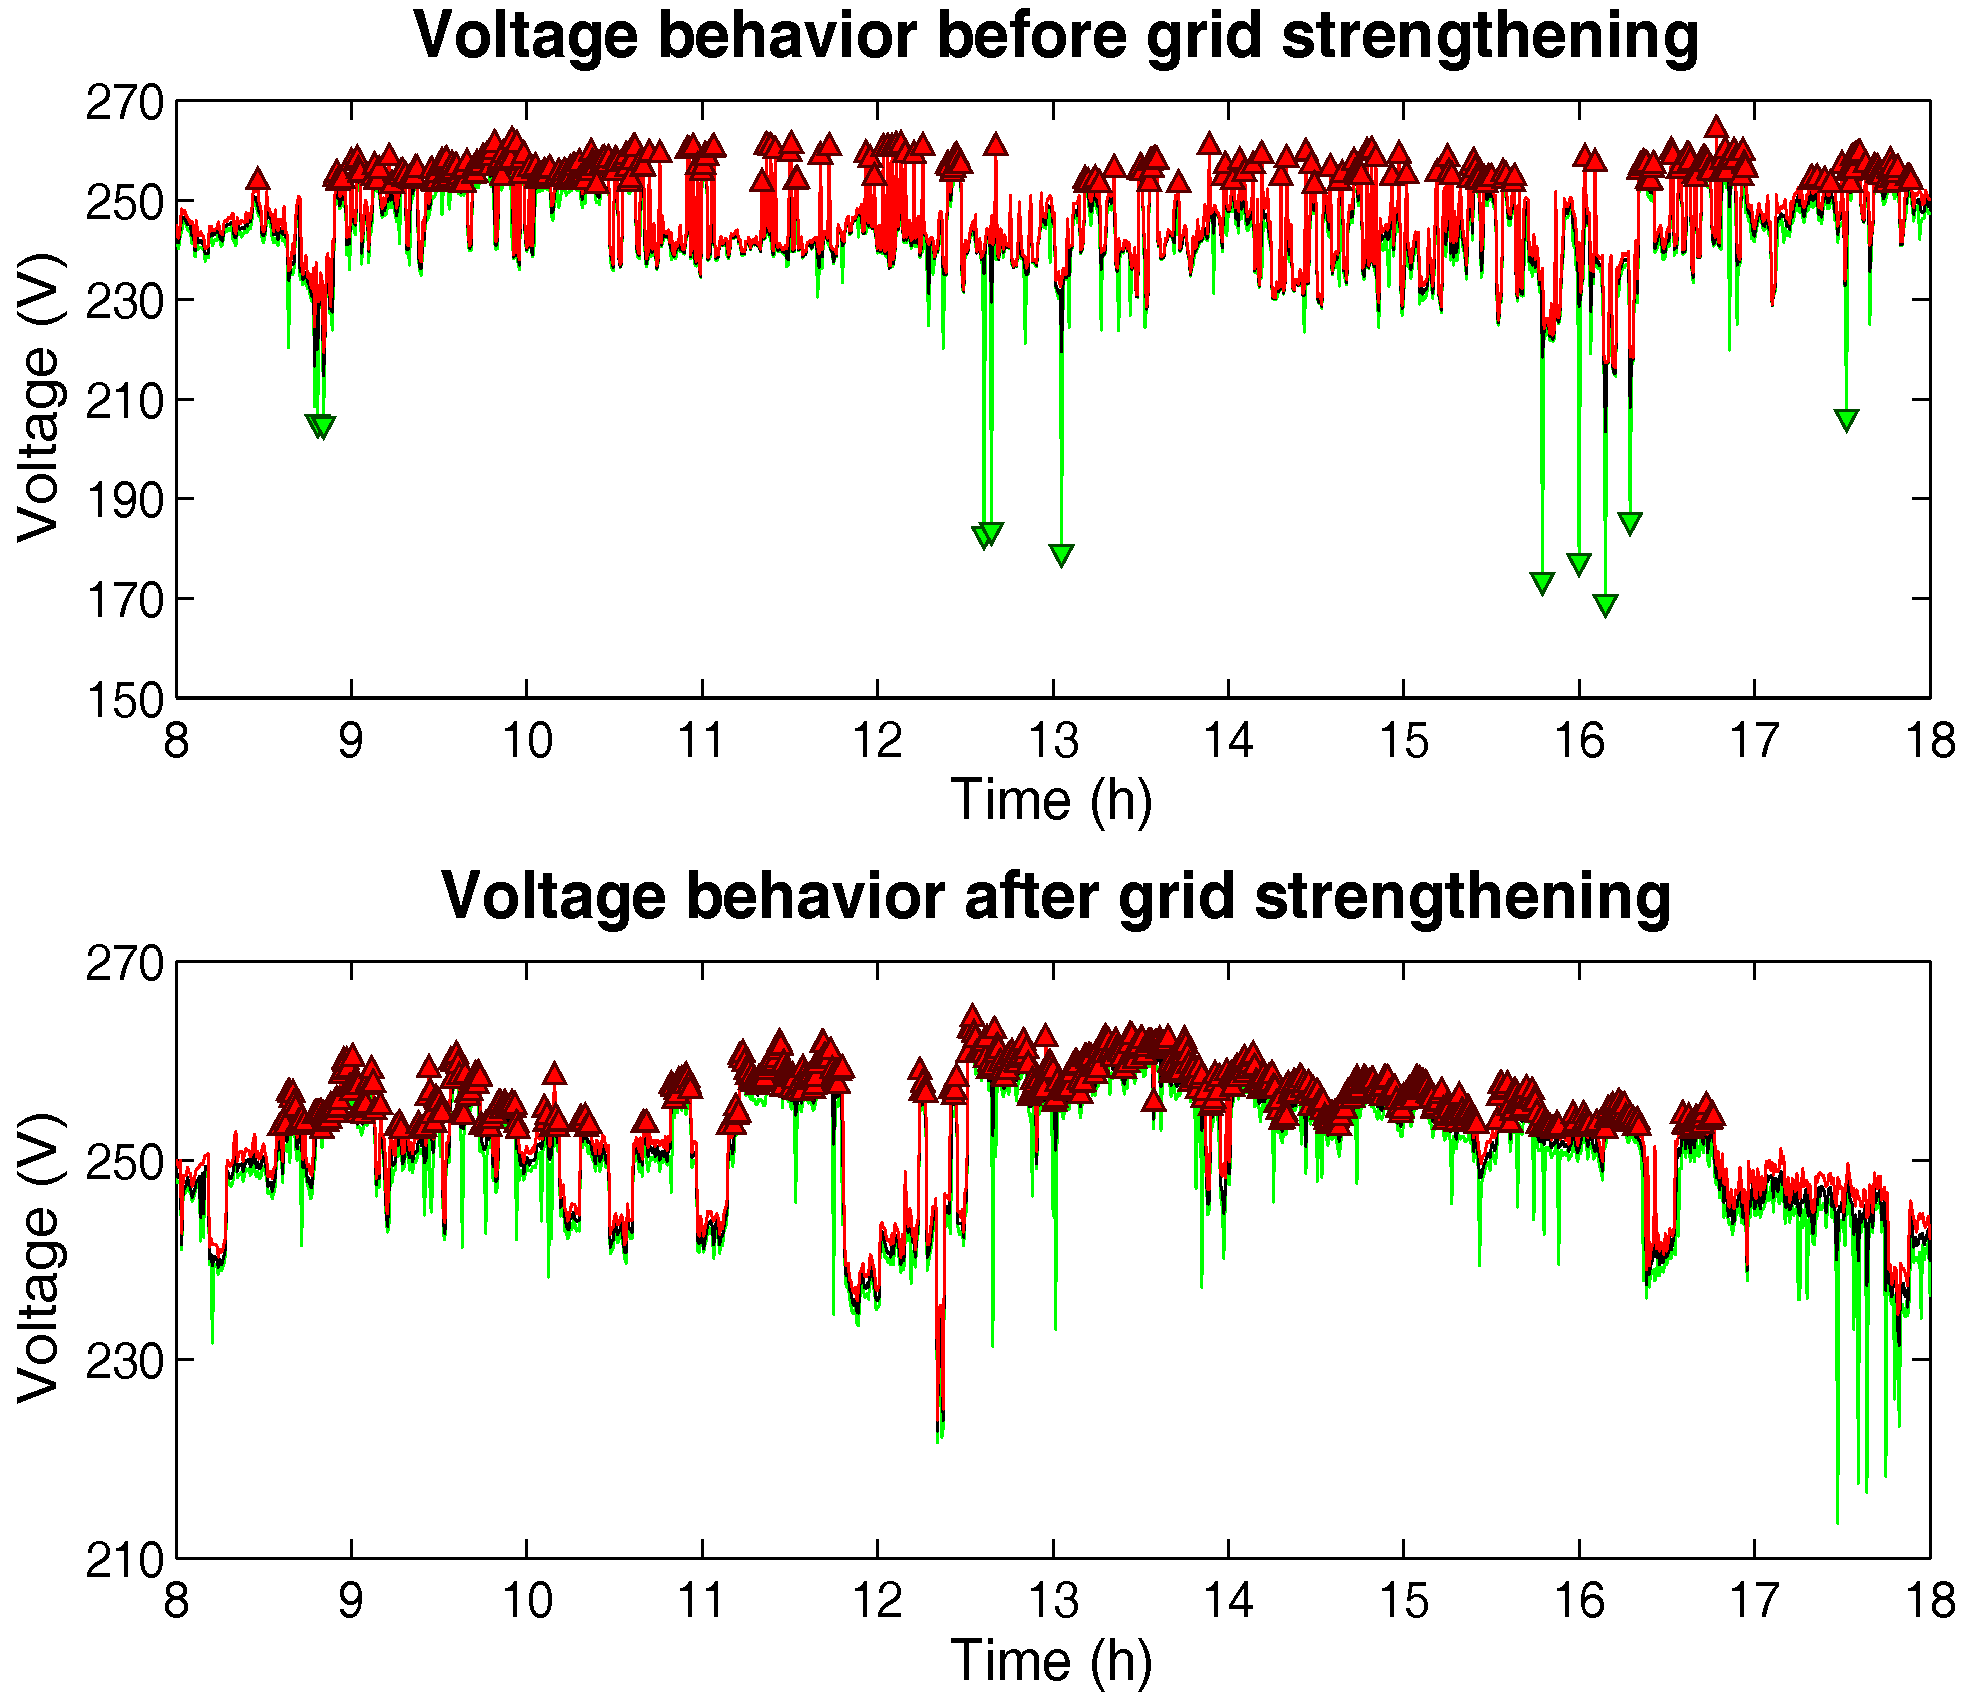
29]. Before considering the grid strengthening, two exceptions must be noted concerning the period from 7:00 to 8:00 where some successive voltage drops were observed, and concerning the period from 20:00 to 24:00, when voltage was lower and near the rated one. These exceptions were due to the existence of domestic consumption in both periods. Thus the rural grid voltage profile is highly influenced by the load variation. The grid strengthening diminished this influence and reduced the dips to zero. The successive voltage swells only existed from 8:00 to 18:00, the daylight hours, when people leave home, strongly decreasing the domestic energy consumption, and when the PV system produces energy. The voltage profile for this period is shown in
Figure 3, when voltage rises to values higher than the limit (253 V) imposed by the standard, as a consequence of the current injection into the grid from the PV inverter, when local energy consumption is low.
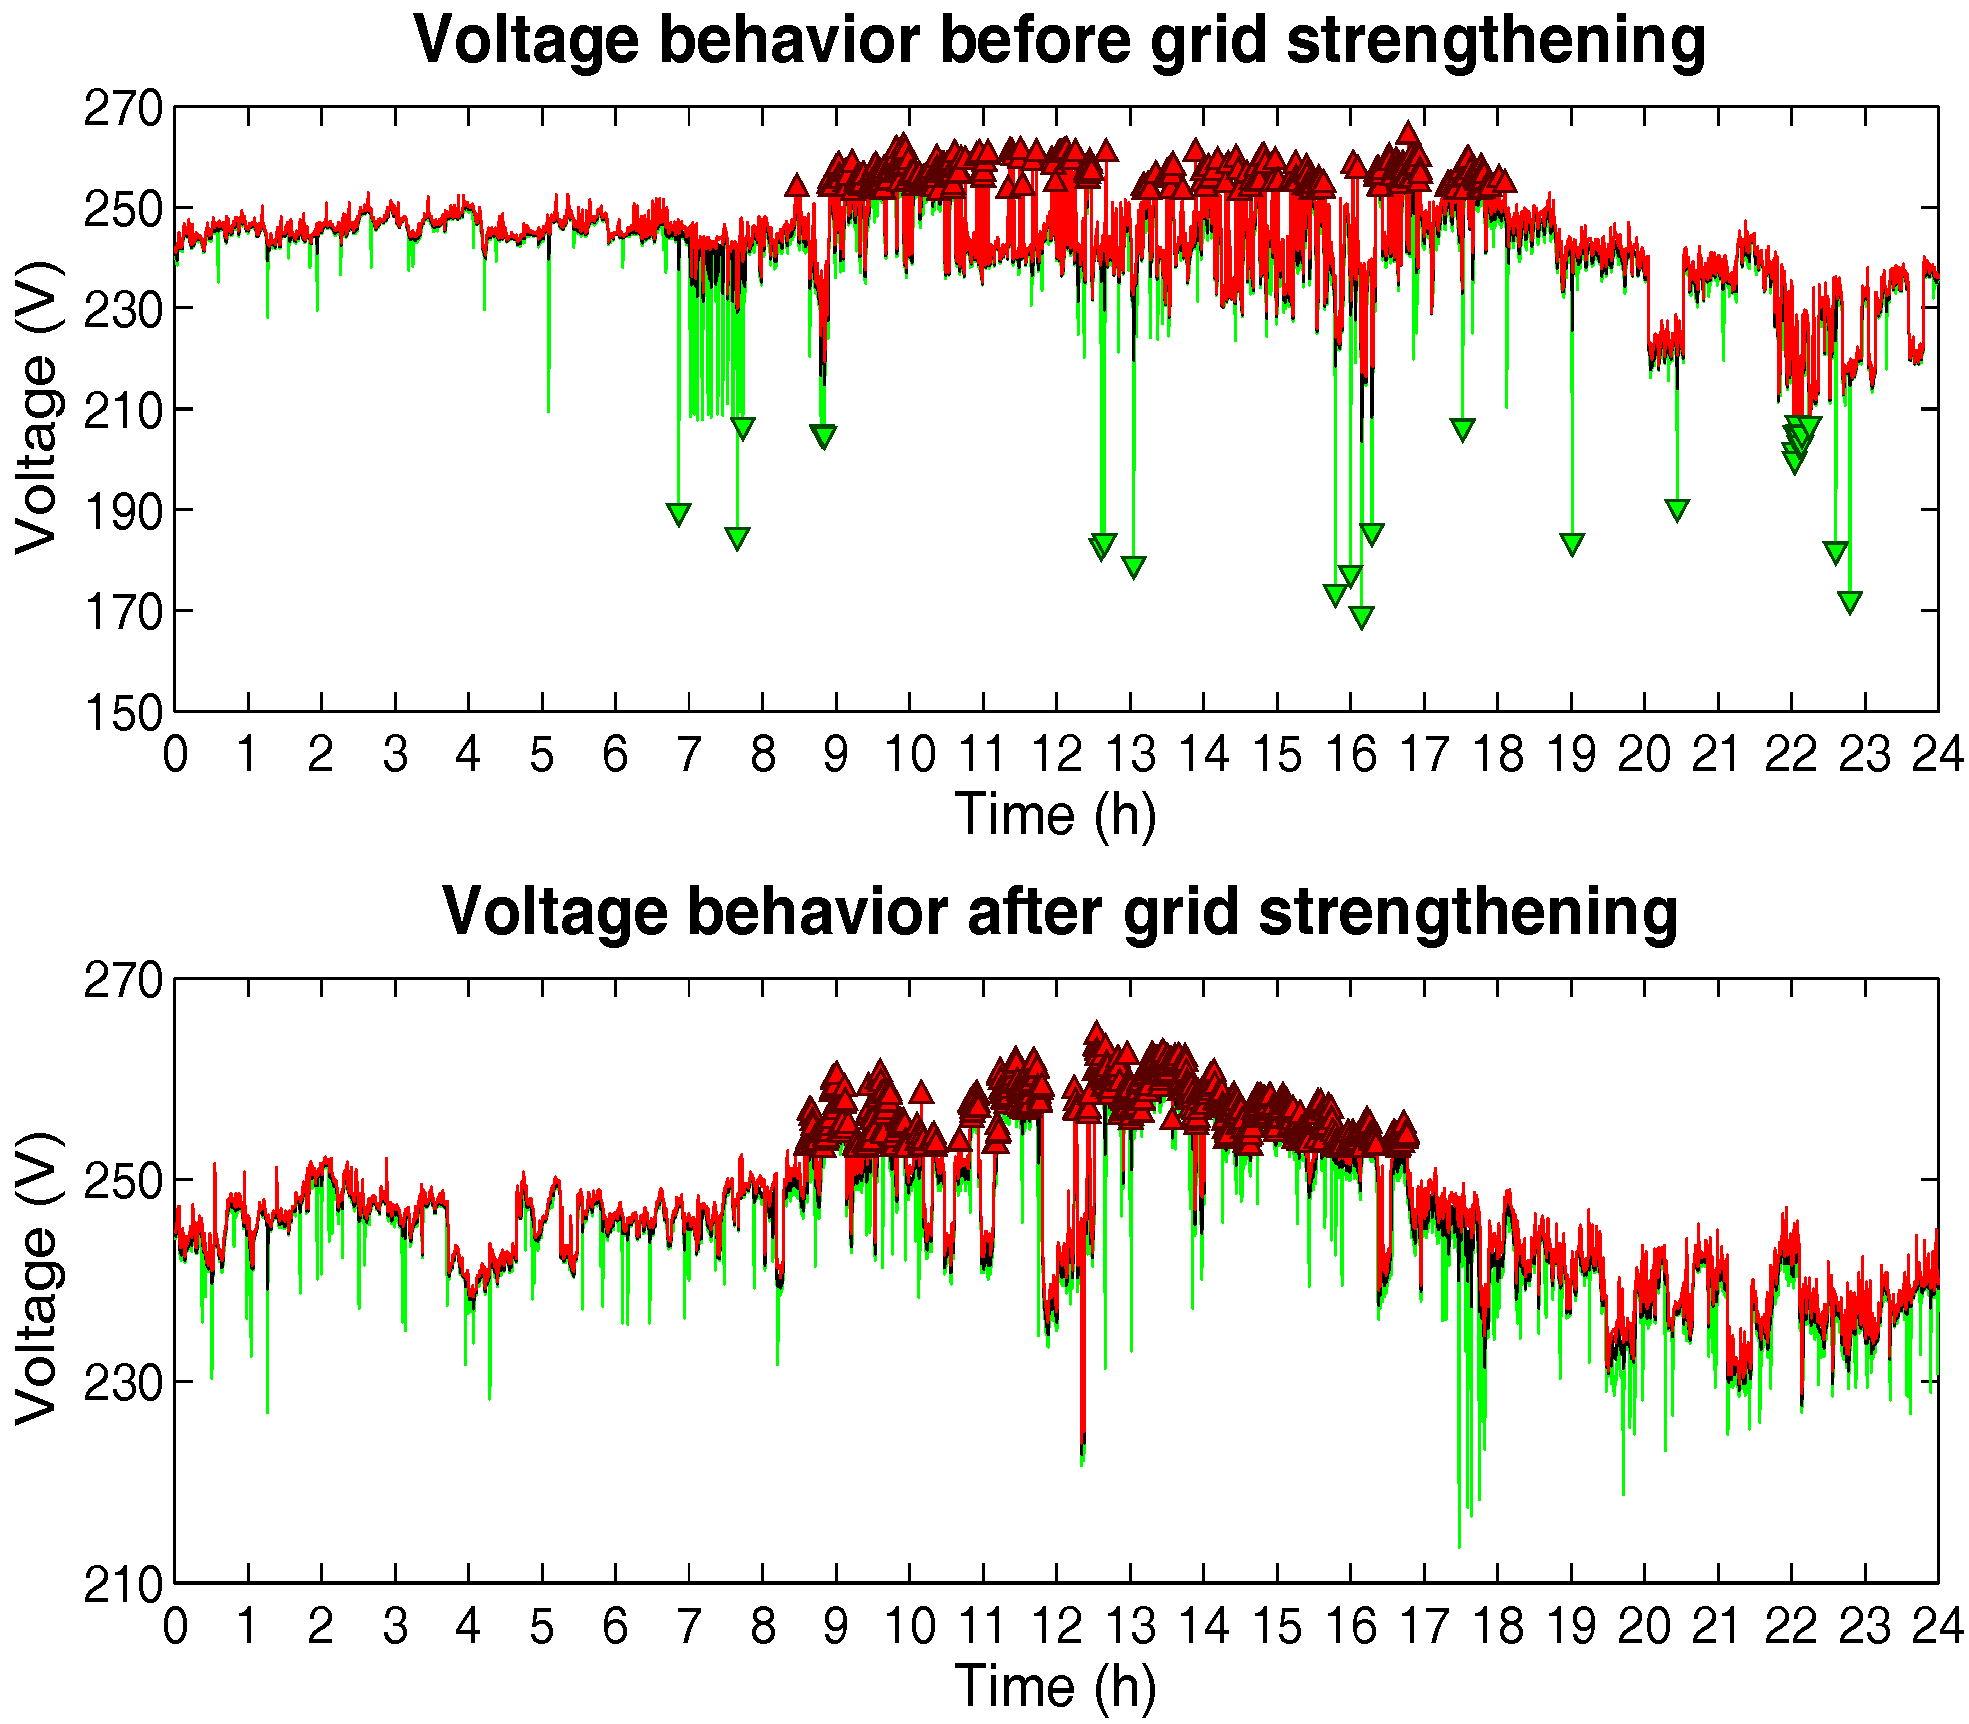
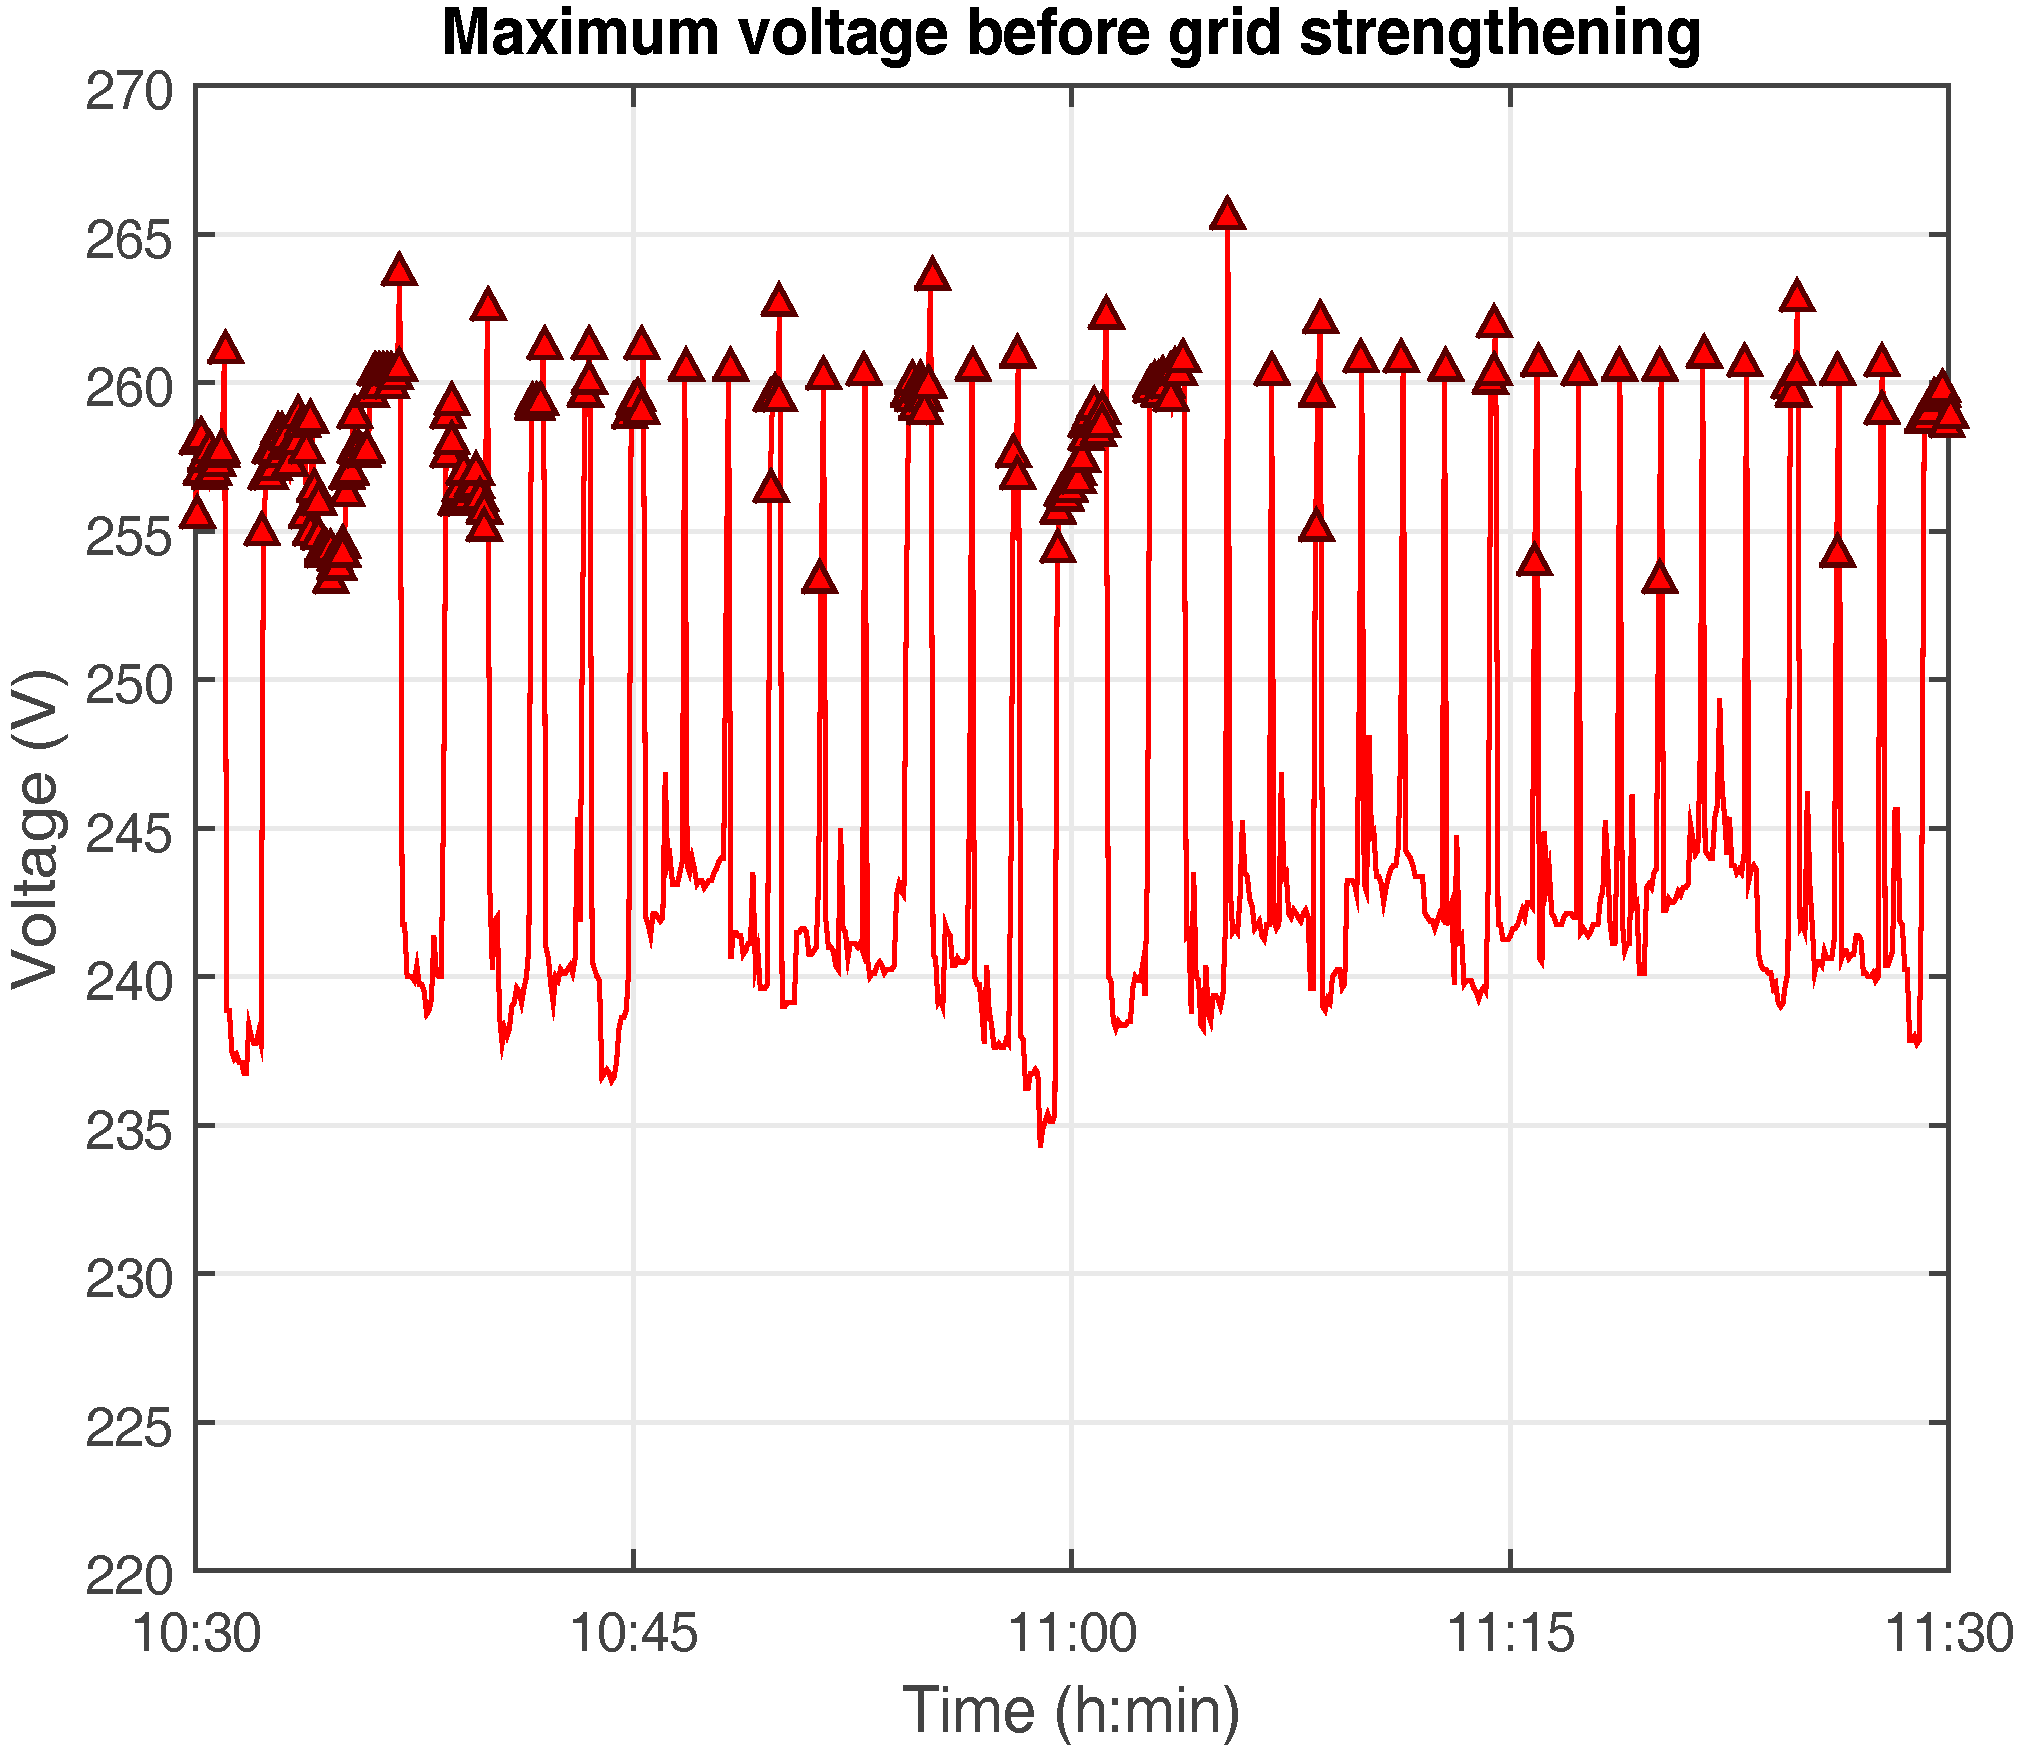
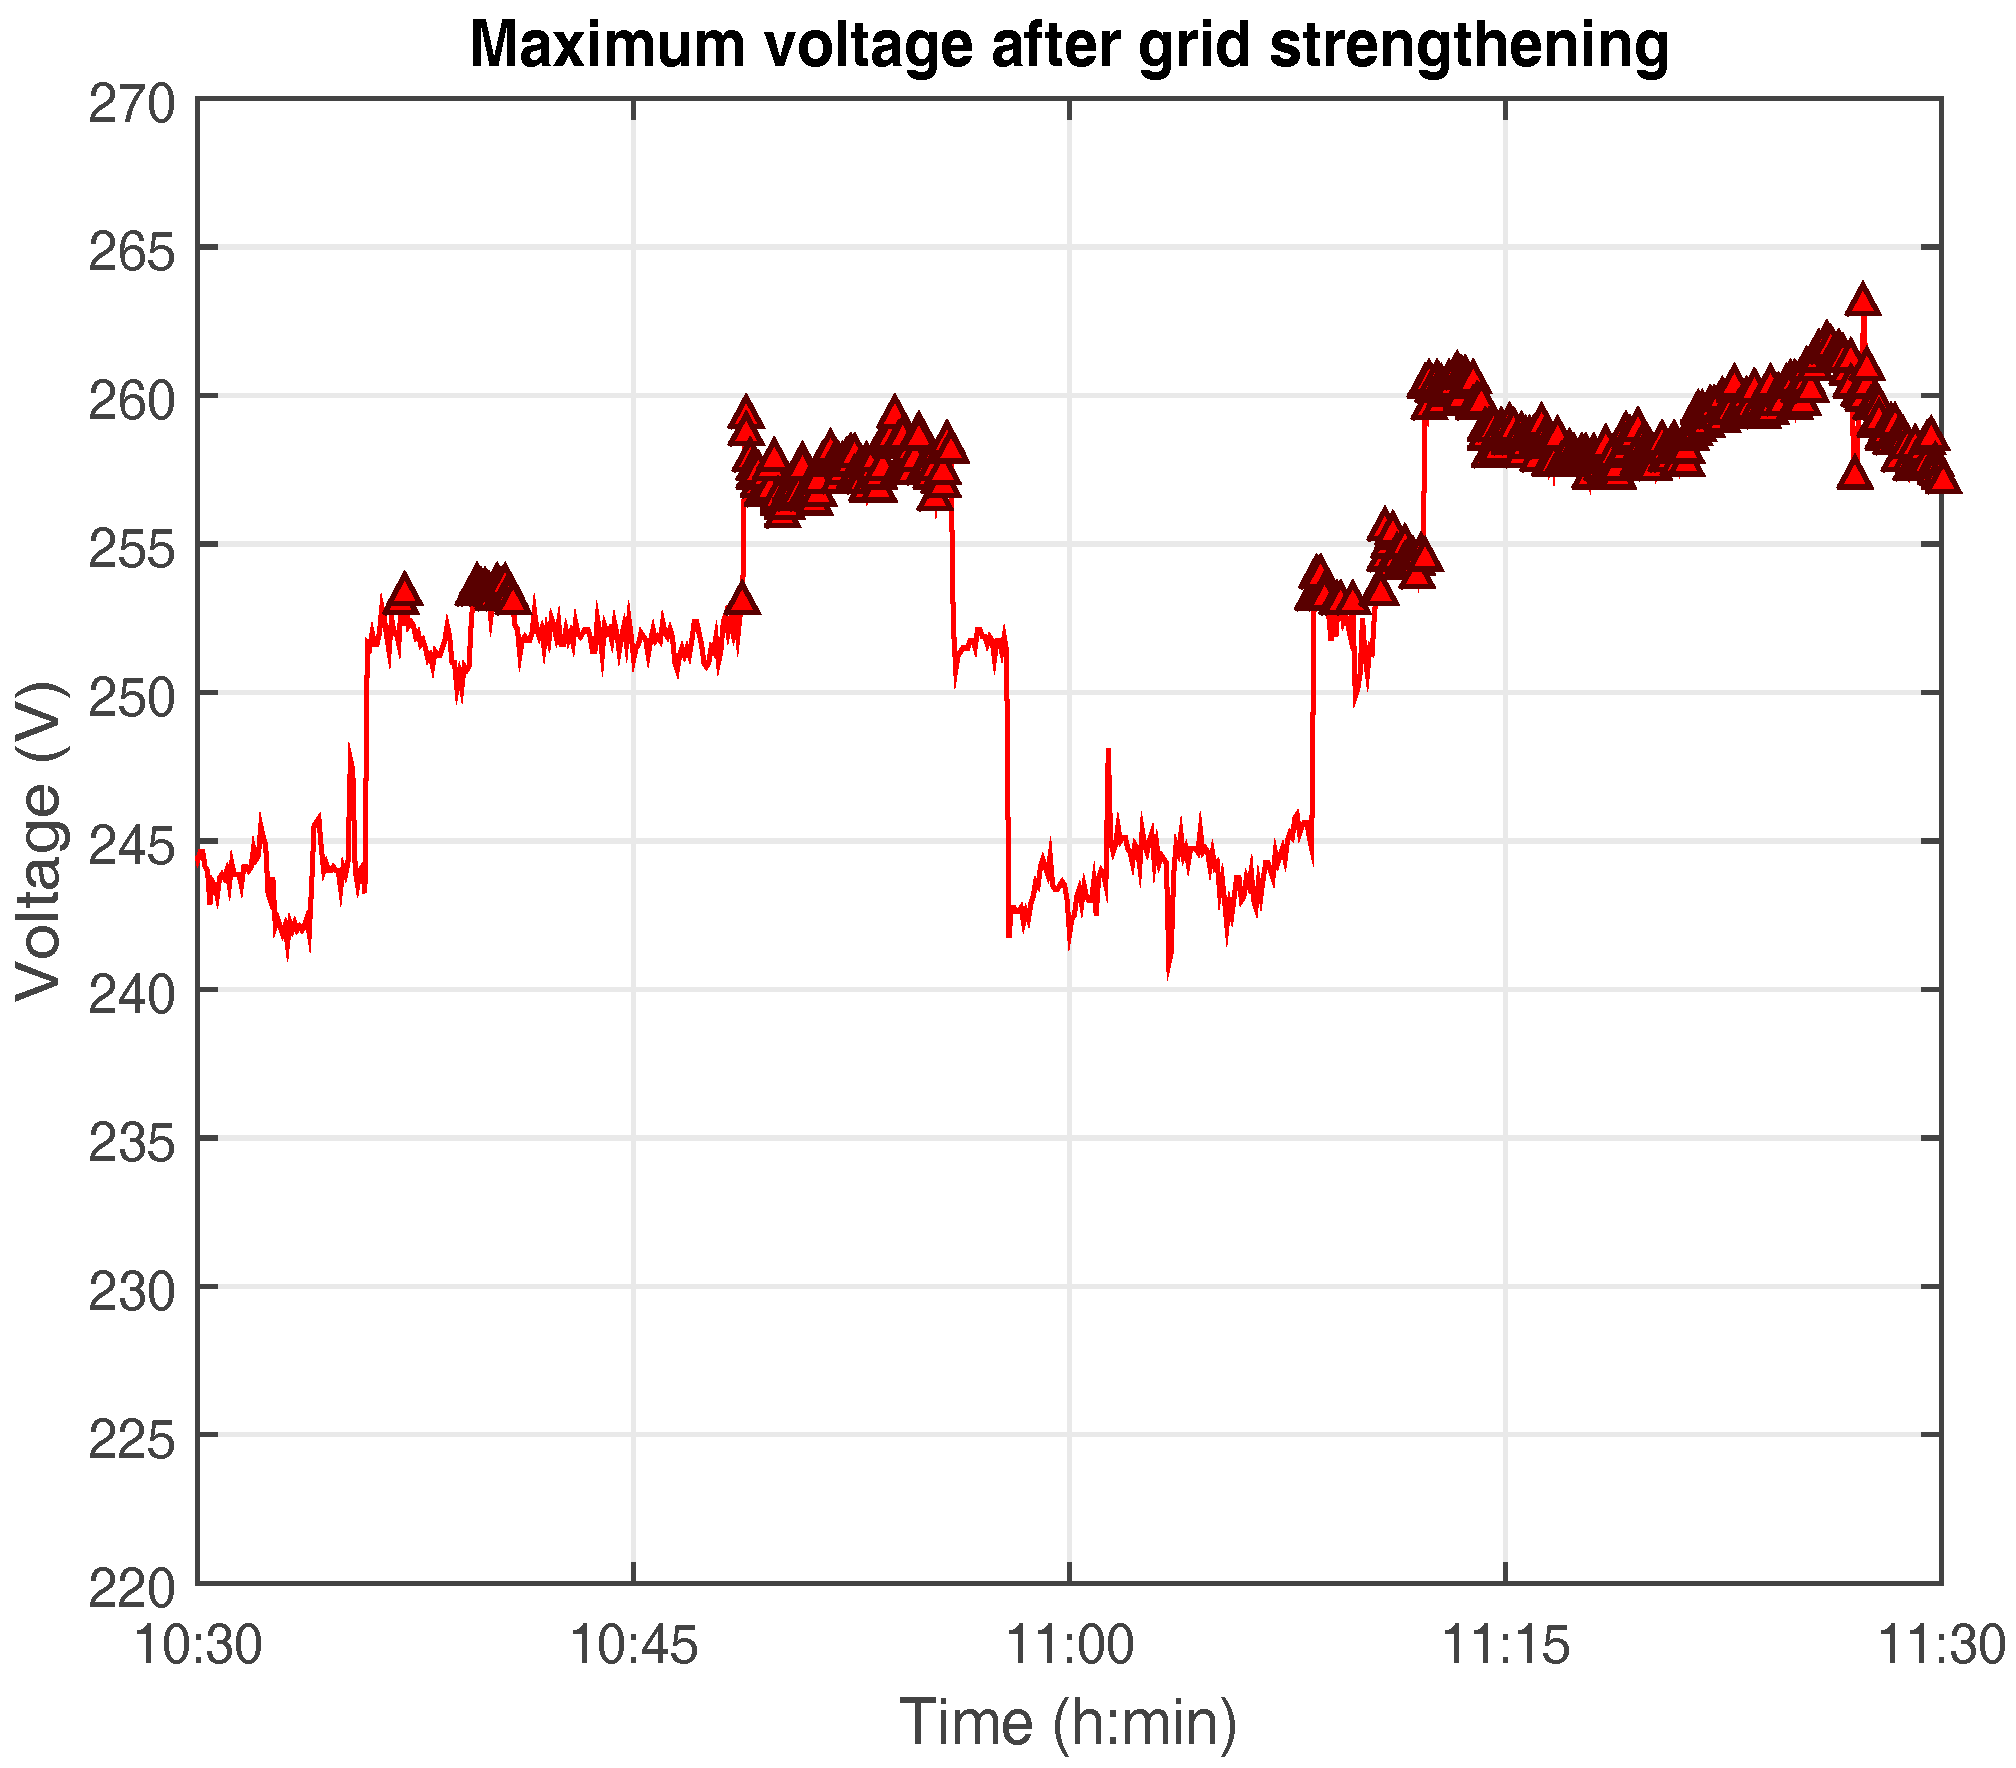
The voltage profile for the period of only one hour, from 10:30 to 11:30, is shown in
Figure 4 and
Figure 5 to better understand the behavior of the PV system before and after the grid strengthening.
Before the grid strengthening,
Figure 4, the swells corresponds mostly to the intermittent connection and disconnection of the inverter from the grid, due to the occurrence of voltage levels above the inverter imposed maximum limit (operating limits). In this case the line voltage is no longer within the permissible range and the inverter disconnects itself from the power distribution grid for safety reasons. In sunny hours and due to low load conditions, the voltage increases at the connection point as a consequence of backwards power flow. Note that this occurs about thirty times (whenever the voltage exceeded 260 V) during the period and the inverter remains connected to the grid only for a few minutes (voltage remains above 253 V permanently).
After the grid strengthening,
Figure 5, the swells become permanent as the inverter stays connected to the grid, the voltage remaining near or above 10% of the rated voltage. The grid strengthening did not decrease the number of the swells, but rather they increased. In fact the inverter no longer automatically connected and disconnected from the grid intermittently, but forced the grid, during the daylight period, in order to have a voltage profile always near or even above the rated voltage.
Before the grid strengthening the PV production has always been canceled whenever voltages were above 260 V. After the grid strengthening, the voltage remains above the 260 V for short periods (few minutes). As the line voltage values often exceeded the permissible range due to local grid conditions (low load), the grid operator agreed to change the values of the inverter monitored operating limits—the new parameter for the maximum voltage was set to 265 V (approximately 1.15 of the rated voltage). This is one of the two possible corrective measures in case of the line voltage exceeds the permissible range. The other one is the adjustment of the voltage at the feed-in point. Before the grid strengthening, one attempt to solve the problem has been made which was in fact to change the tap of the transformer. However, it has been reported that the under-voltages fluctuations increased drastically. Note that this attempt was made before the present authors’ work. After the grid strengthening, in the authors’ opinion, the transformer tap change could now be a solution to slightly diminish the voltage at the feed-in point.
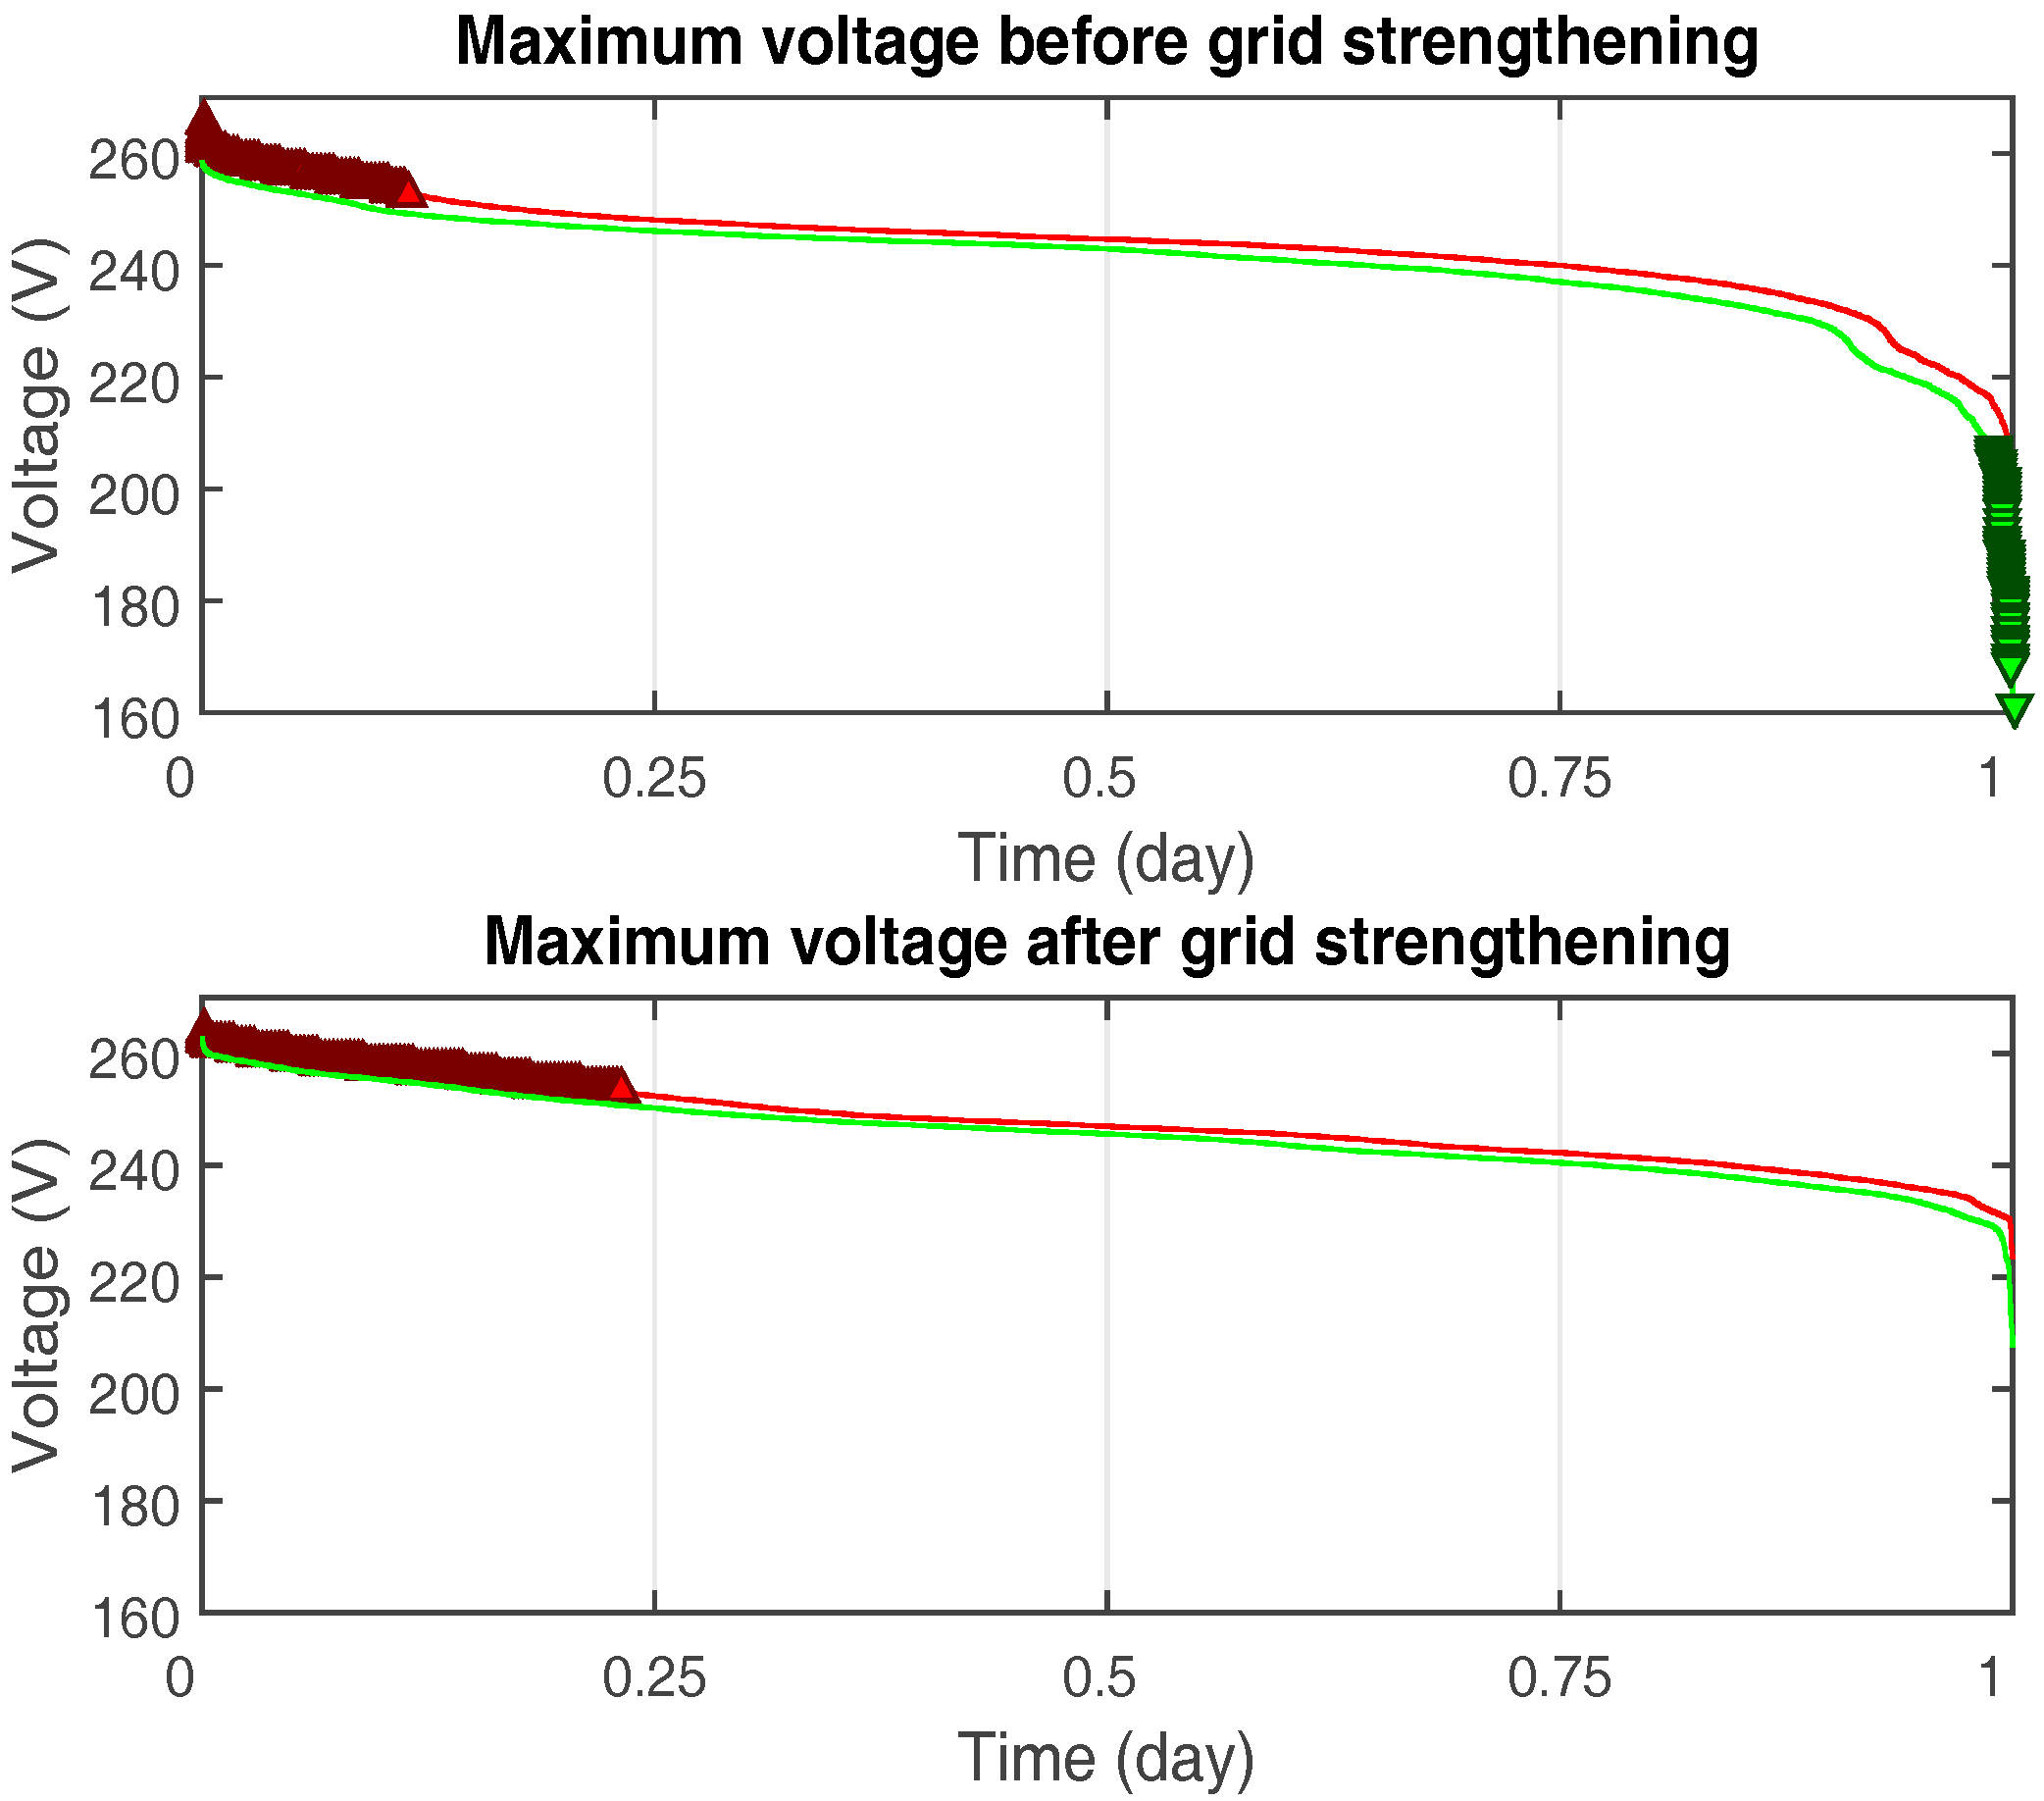
Figure 6 shows the voltage values before and after the grid strengthening sorted in descending order. It is possible to see that before the grid strengthening the swells occurred during more or less one eighth of the day and the dips only occurred during a very short period of time. After the grid strengthening the increase of swells in voltage becomes evident, where during almost a quarter of the day (half of the daylight) the values are above the rated superior limit and, as referred above, the dips were reduced to zero.
5.2. Dips, Swells and Transients
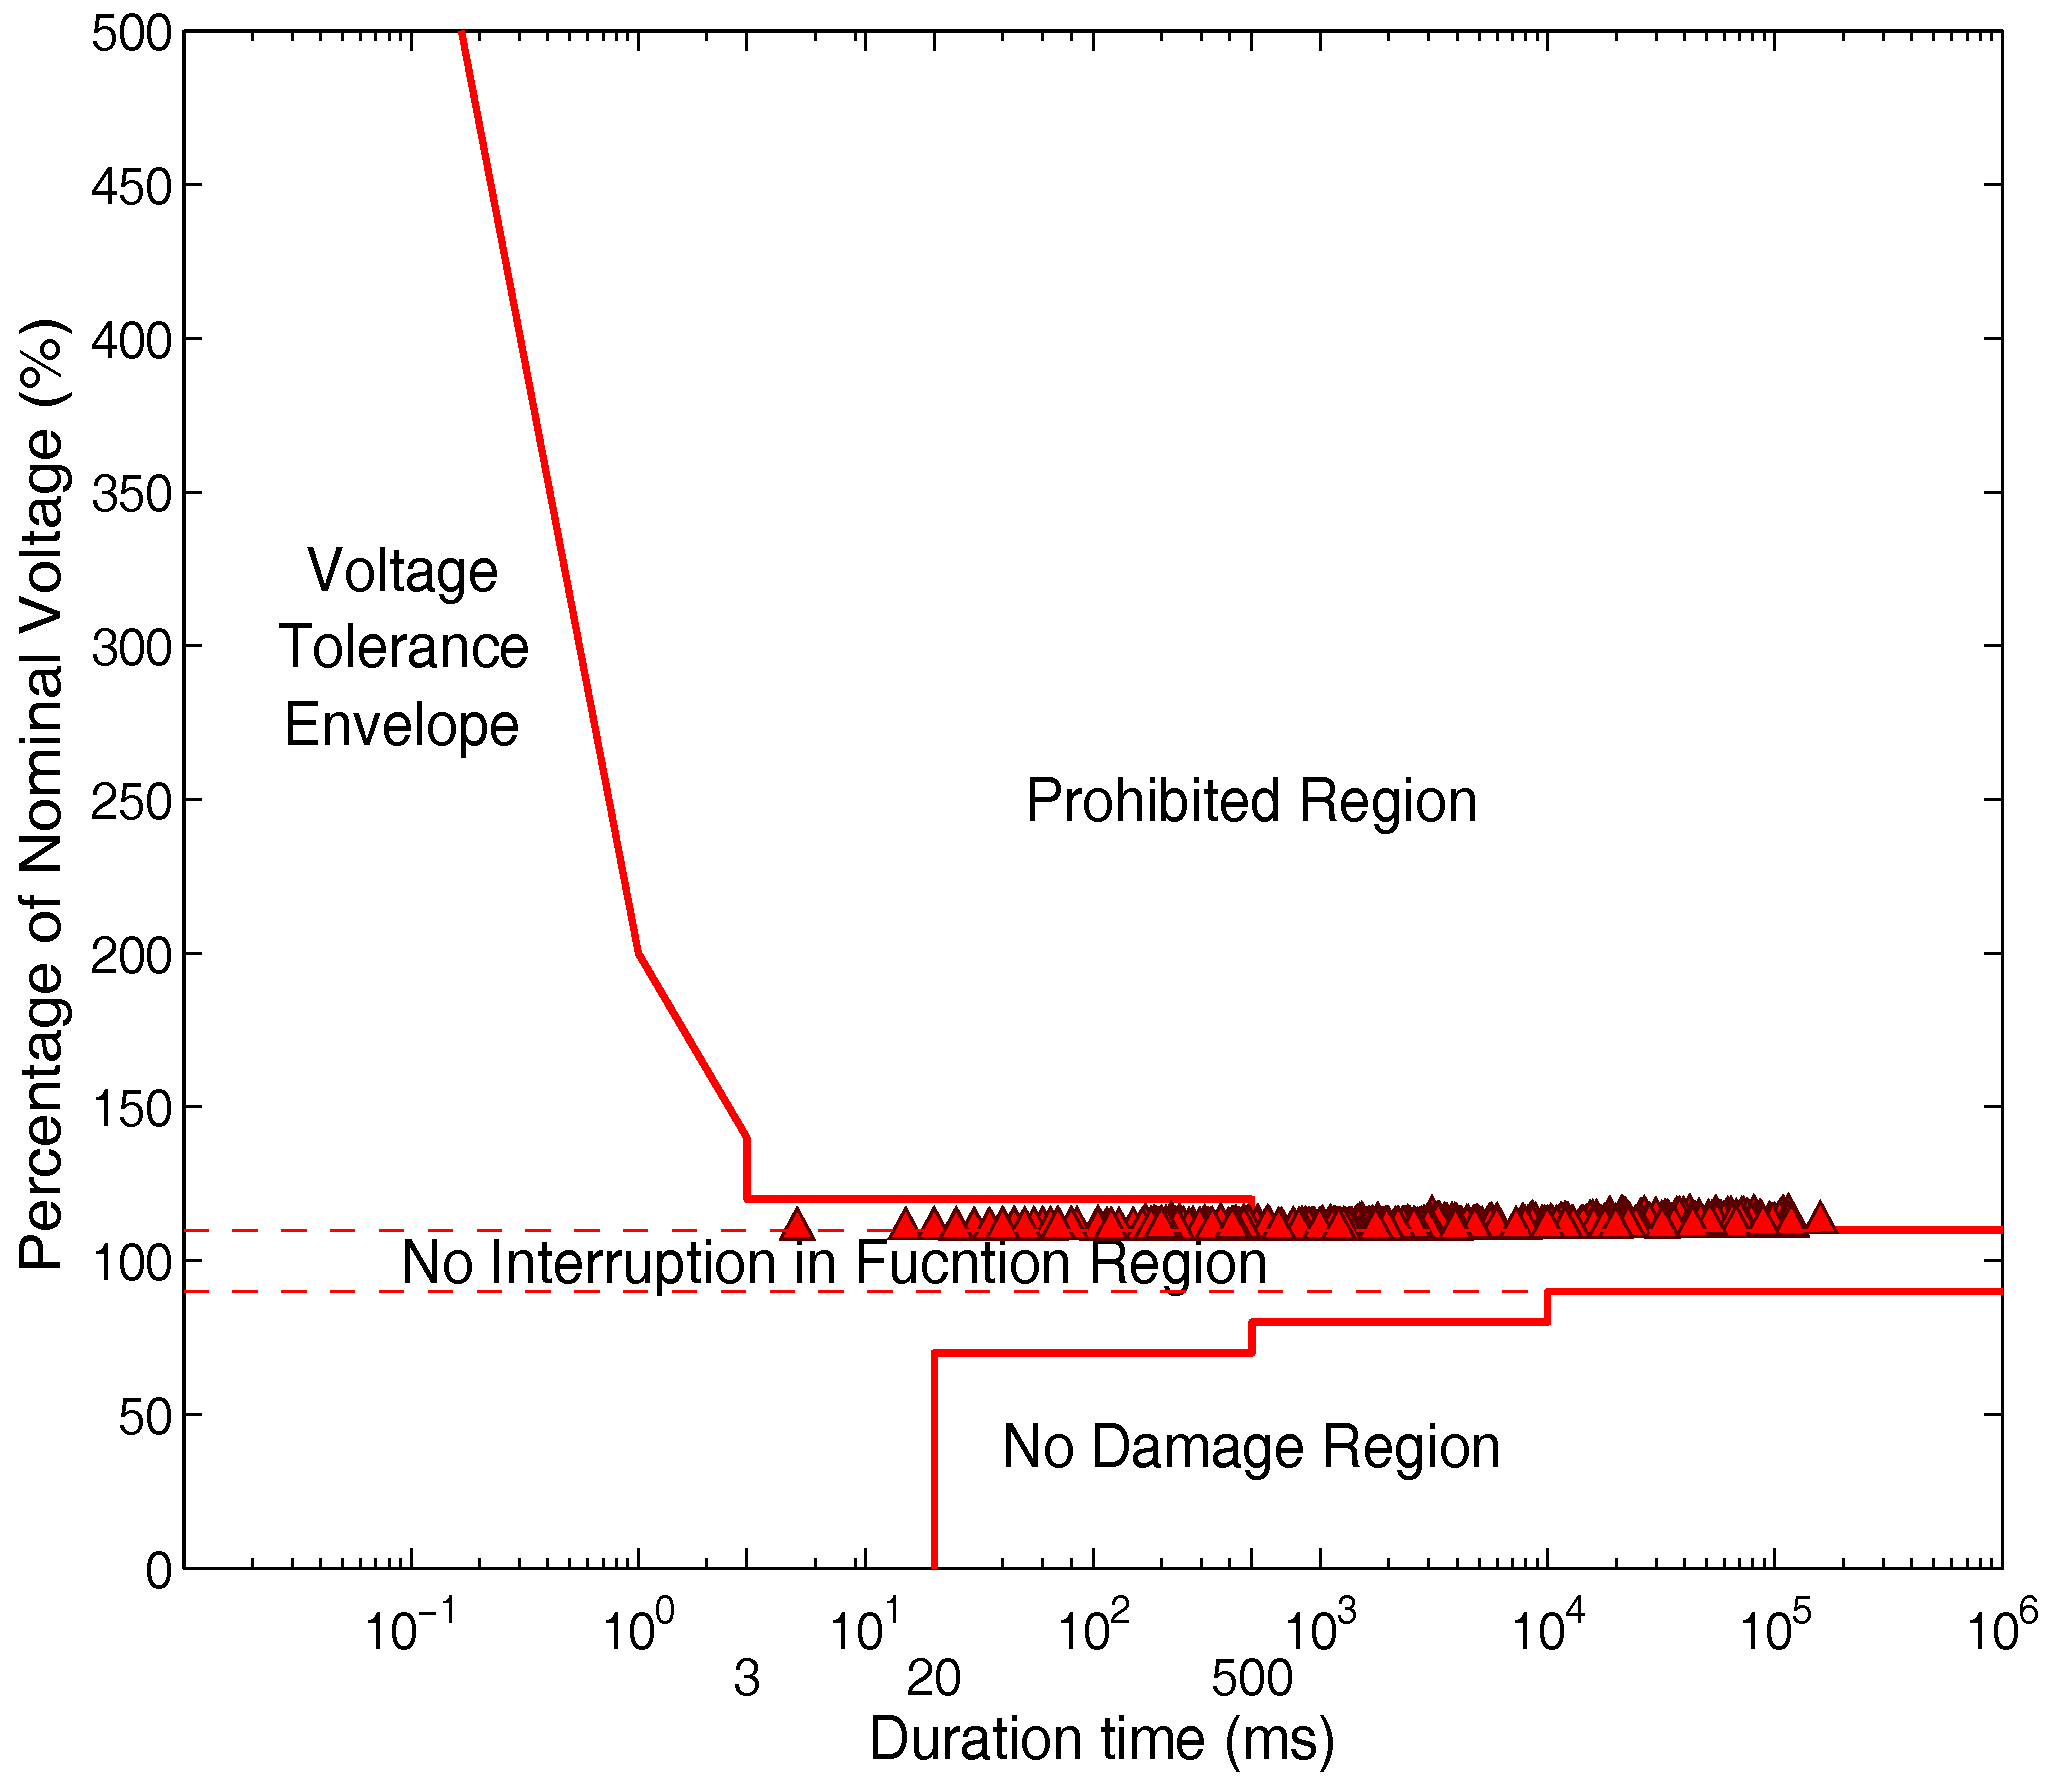
The registered dips and swells for the chosen day, before and after the grid strengthening, are shown in
Figure 7 and
Figure 8, respectively, drawn together with the Information Technology Industrial Council (ITIC) curve. The ITIC curve has been developed to help assess the ride-through capability of various electronics loads against PQ disturbances (voltage variations (dip/swell)) [
40]. The ITIC curve gives the envelope for the voltage variations outside which customer loads are affected and has been applied for general PQ evaluation. As can be seen, before the grid strengthening most of the dips lasted less than 1 s and there are few longer dips. After the grid strengthening there were no dips occurring in the data of the chosen day. Concerning the swells, a huge number of occurrences were verified of a wide range of duration (between 0.02 s and 100 s) before and after the grid strengthening.
In both cases all the swells occurred with almost the same voltage level (110% of the rated voltage), corresponding to the voltage maximum limit tolerated by the inverter. It is now clear that these swells are a consequence of the PV system injected power. The PV system forces the grid during the daylight hours to work near the prohibitive region, even after the grid strengthening. Thus, one can conclude that the grid strengthening solved the problem of the intermittent PV system operation, but the operation near the prohibitive region still remains. Moreover, 231 transients in the voltage behavior were registered before the grid strengthening during the chosen day, and there were no transients for the voltage after the grid strengthening.
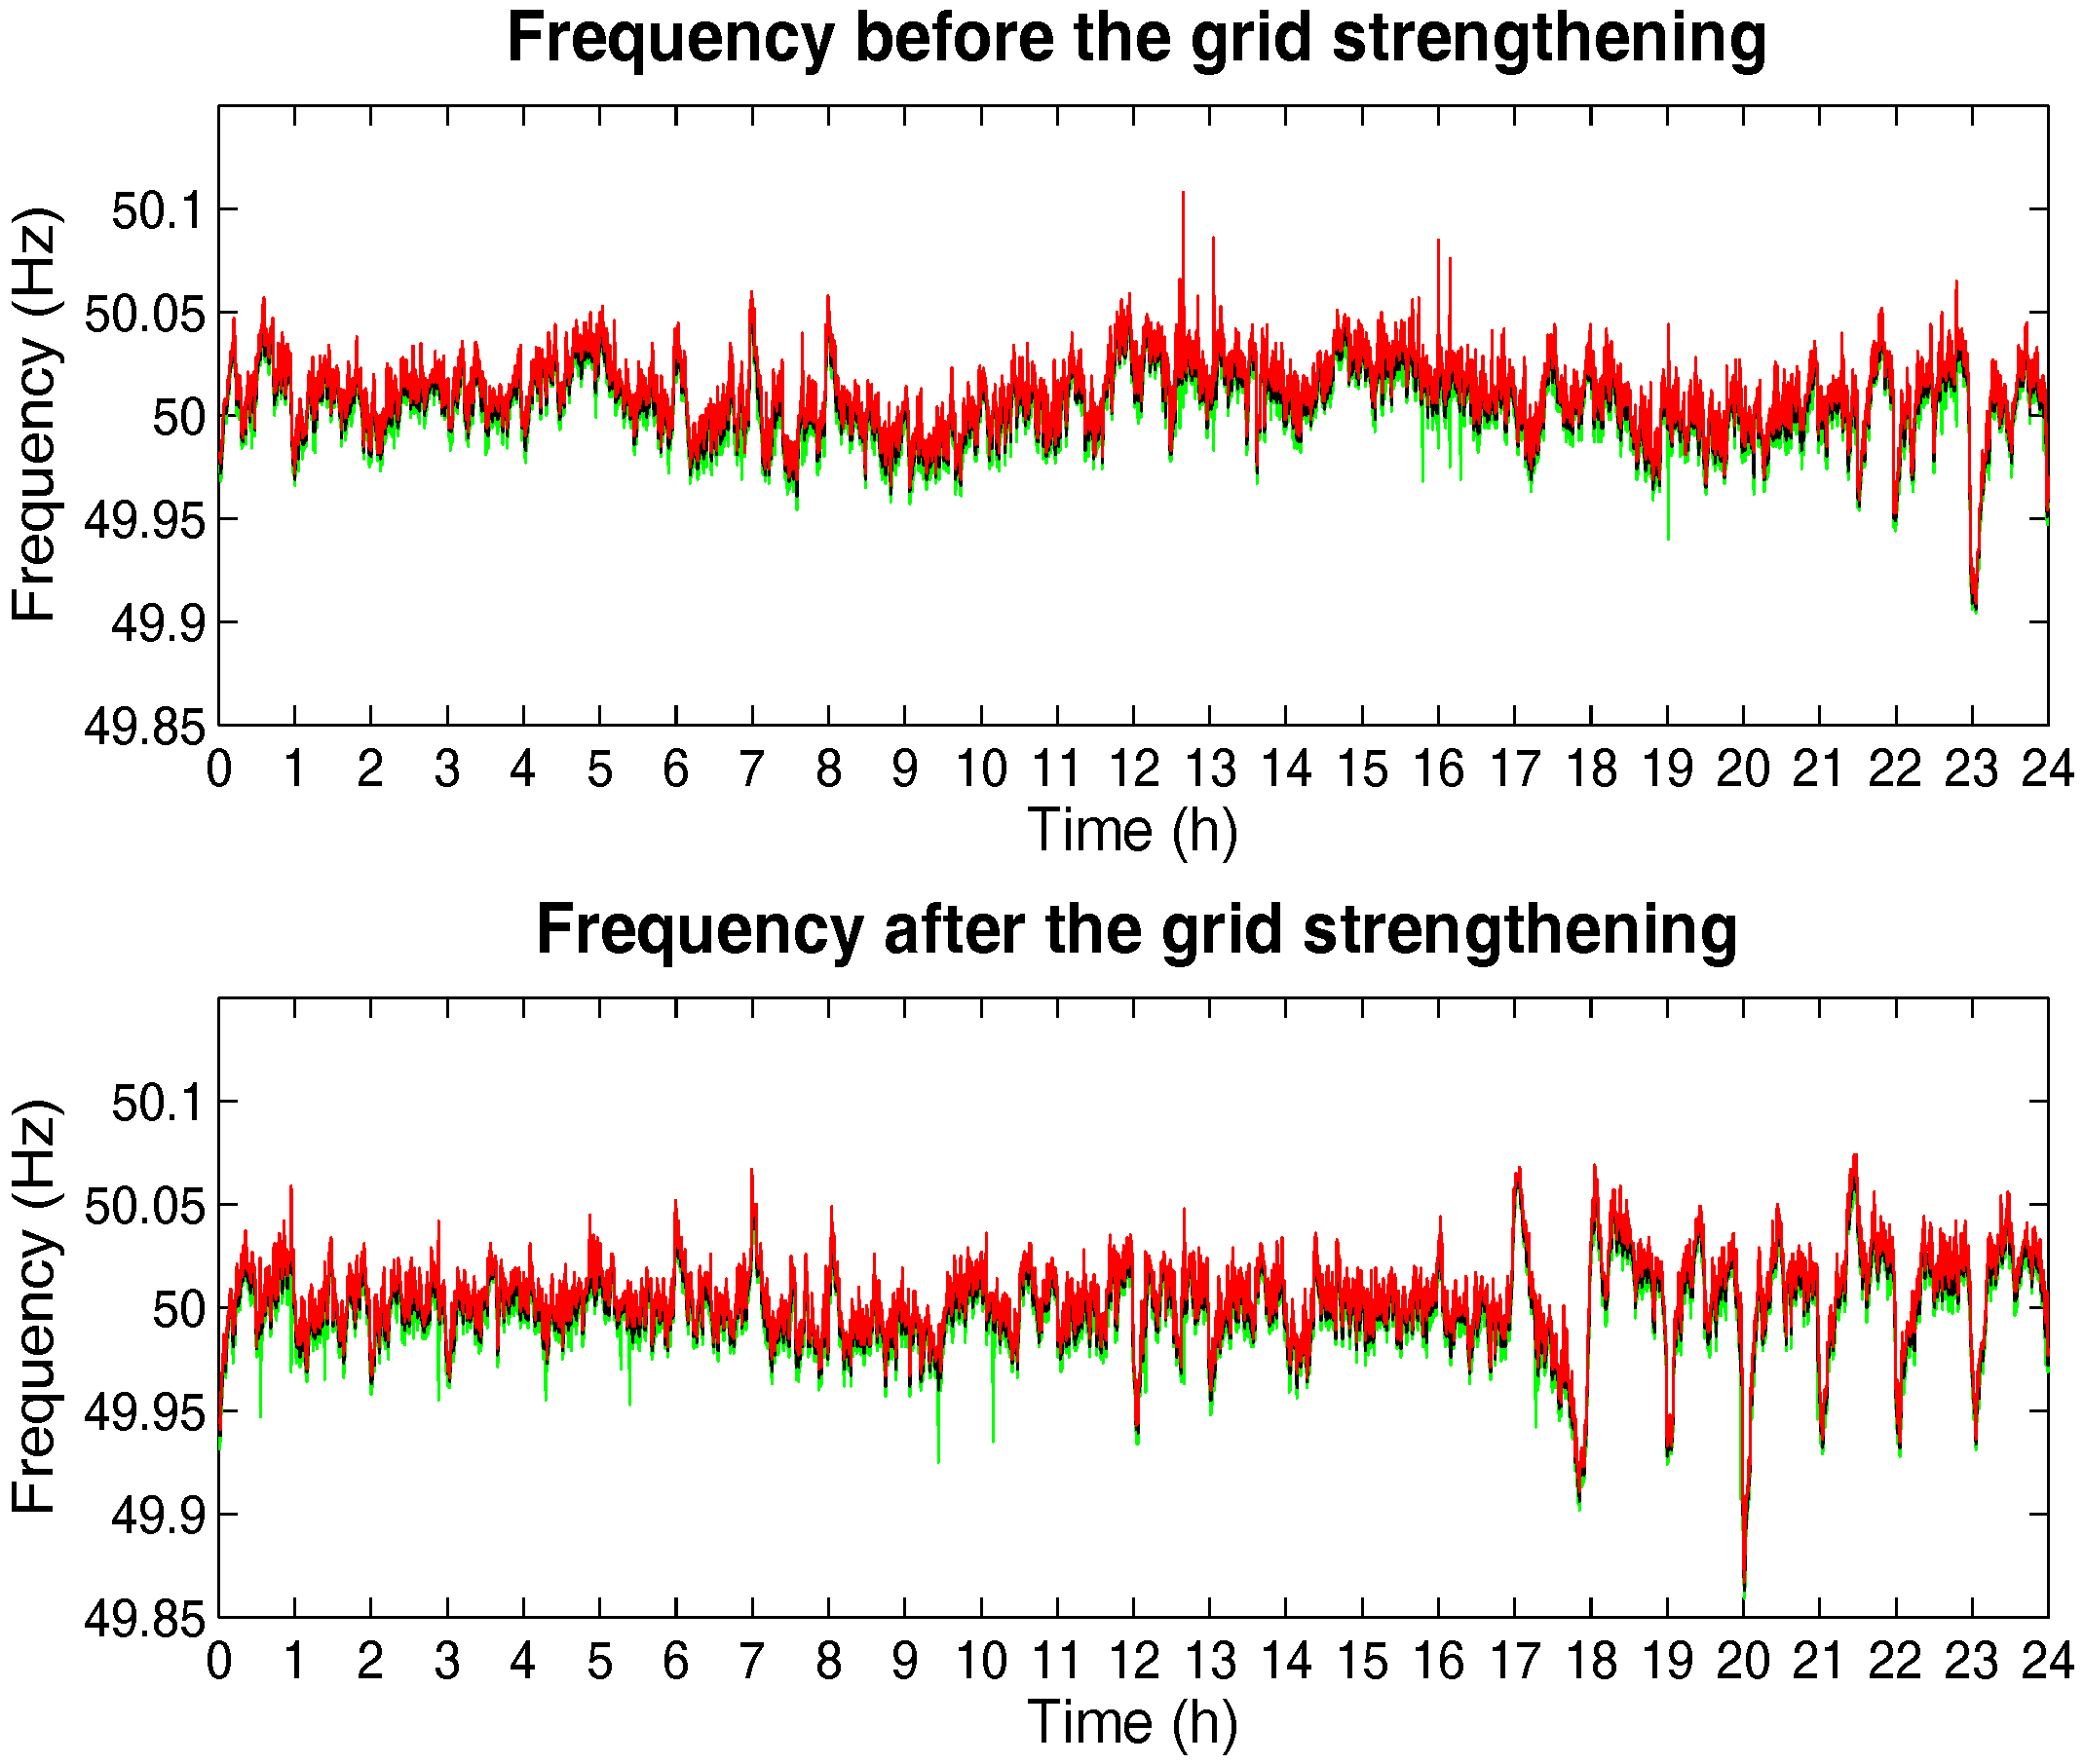
5.3. Frequency
Figure 9 shows the frequency for both situations: before and after the grid strengthening. The frequency deviations are clearly below the absolute value of 0.5 Hz as imposed by [
29]. It is possible to see the consistent behavior of the frequency and it can be concluded that frequency is not dependent on the voltage profile. Nevertheless, there are very clear drops at every hour for the frequency in the evening mainly due to tertiary power control in relation to the market. According to the information available from Redes Energéticas Nacionais (REN operates the main transport infrastructure and undertakes the overall management of the Portuguese Electric System) the imported energy (from Spain) starts to diminish at hour 17 and thus a tertiary power control occurred (reservoir hydropower). Particularly for the hour 20 in
Figure 9, there was an abrupt drop in the imported energy, and consequently an abrupt drop in frequency. The market and also the high penetration of wind generation in Portugal difficult the system’s operation and control.
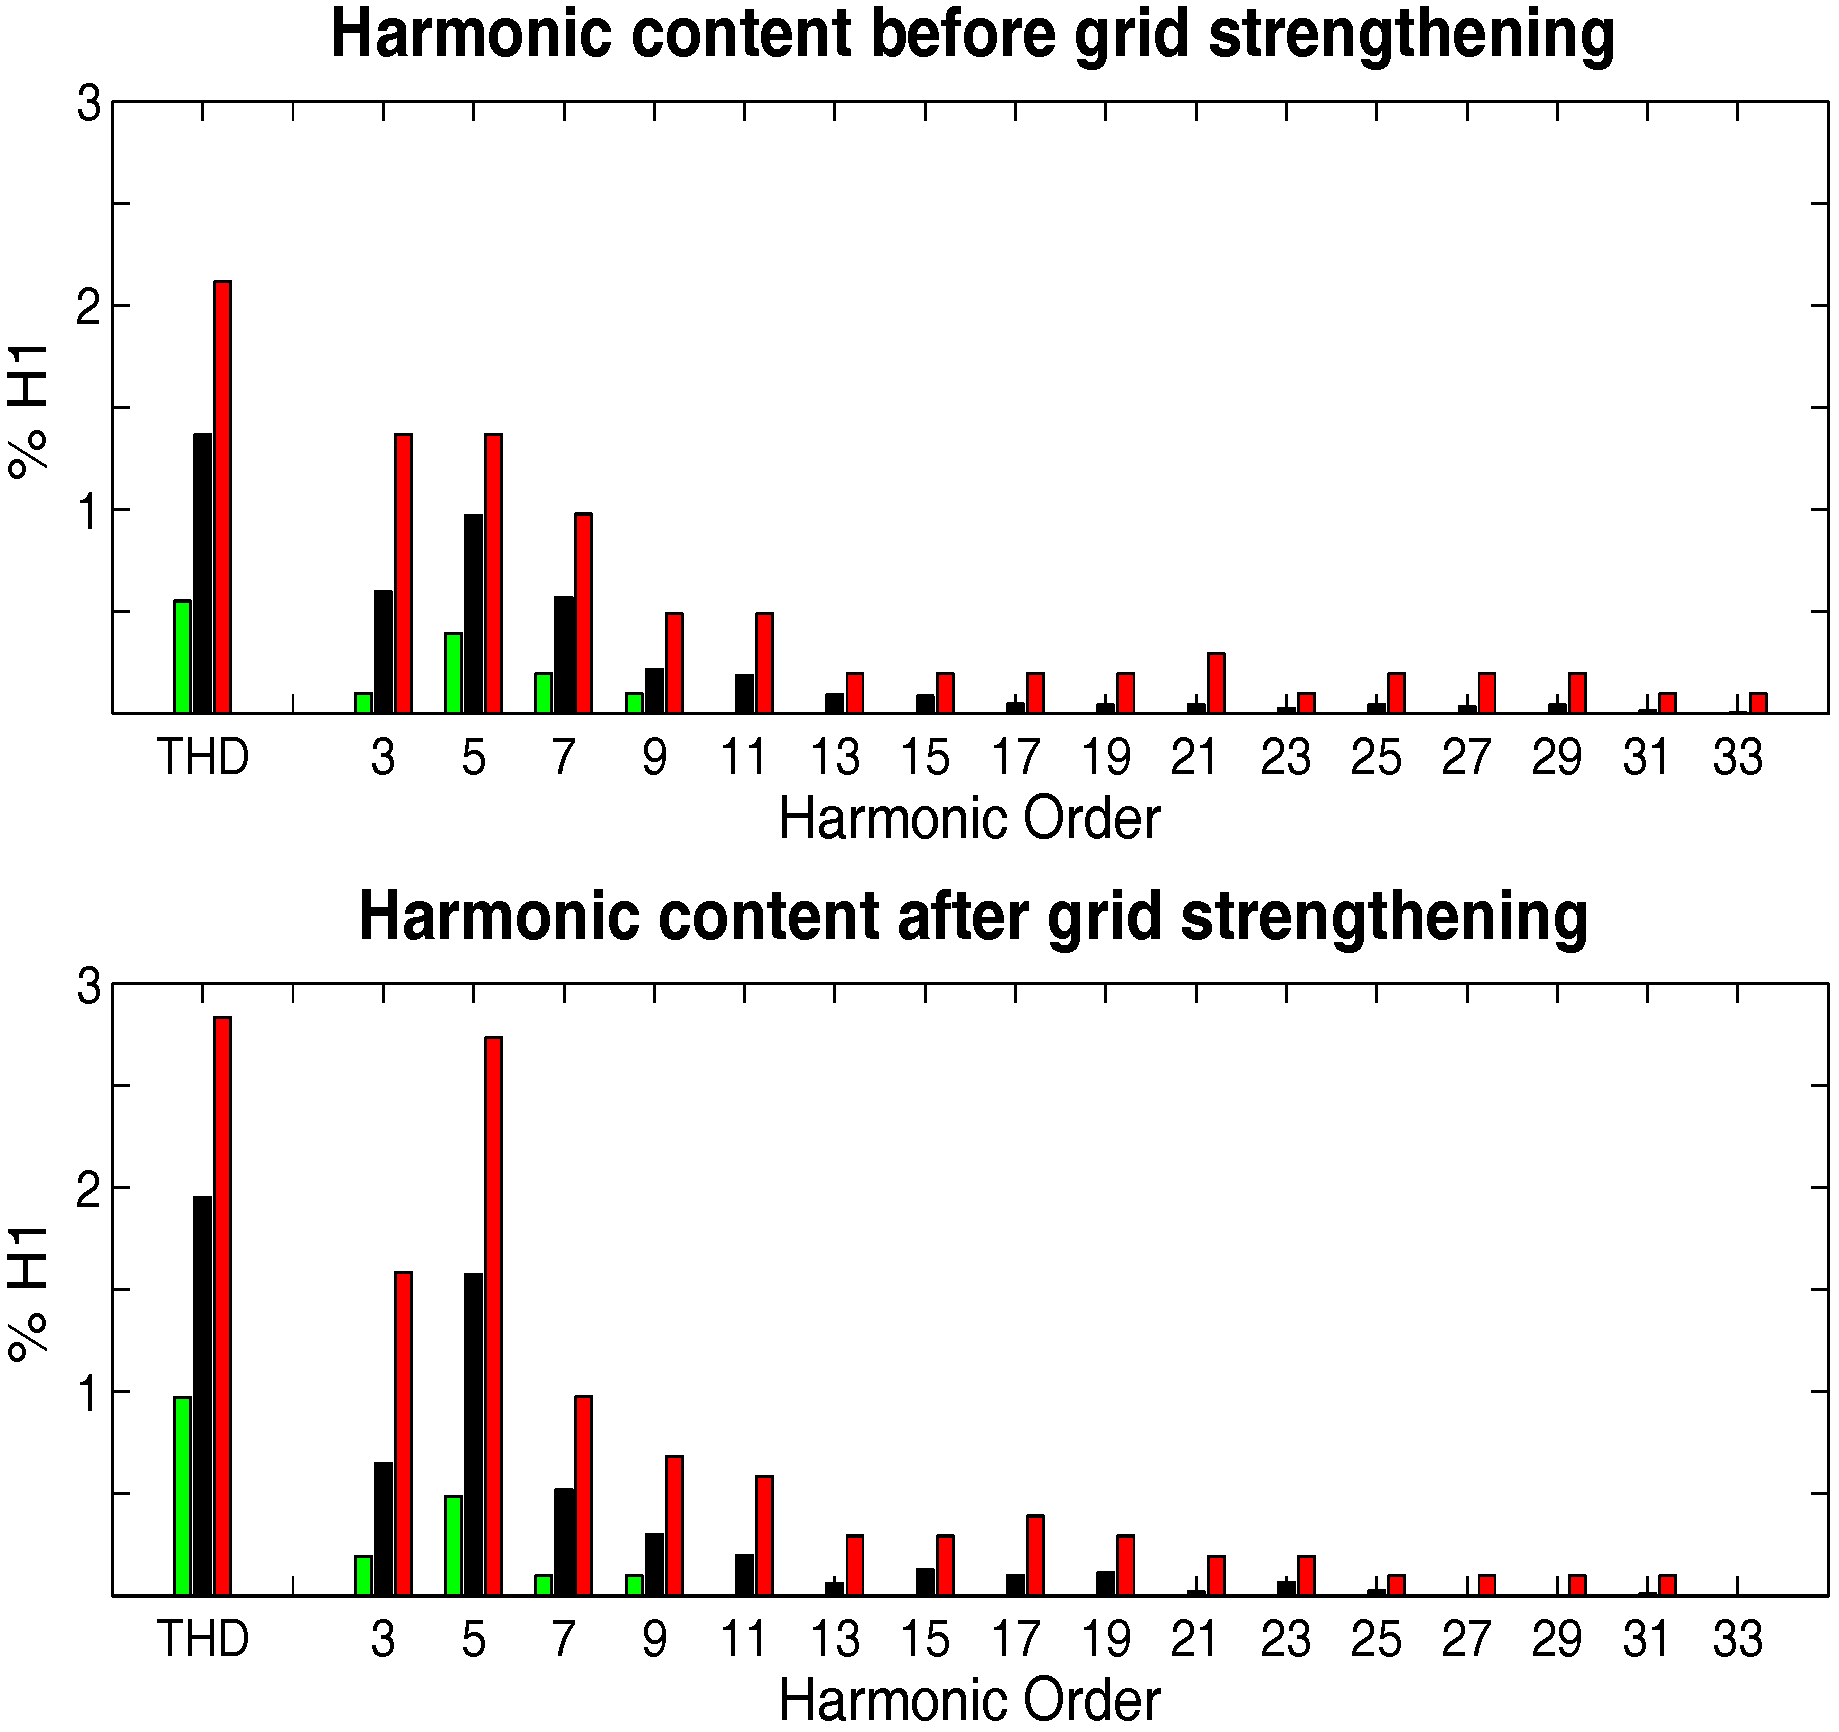
5.4. Voltage Total Harmonic Distortion and Harmonic Content
Figure 10 shows the minimum, medium and maximum values of the voltage THD and the harmonic content for the same days. Before and after the grid strengthening the voltage had measured harmonics up to 33th order. In both cases the PCC voltage THD and harmonics are clearly below the allowed limits: 8% for the THD, 5% for the 3th harmonic, 6% for the 5th harmonic, 5% for the 7th harmonic, 1.5% for the 9th, 19th, 23th and 25th harmonics, 3.5% for the 11th harmonic, 3% for the 13th, 0.5% for the 15th and 21th harmonics and 2% for the 17th harmonic, as stated in [
29].
Voltage harmonic content has increased with the grid strengthening. The harmonic order that differs the most is the 5th for the medium and maximum values (0.586% and 0.717% respectively). The differences of the remaining harmonic orders are minimal. The observed harmonics result from the influence of the inverter combined with other harmonics that have been developed elsewhere on the grid. Although the voltage harmonics are related with current harmonics, they also depend on the impedance at the PCC. This impedance was modified with the grid strengthening.
Before the grid strengthening the inverter remains connected to the grid only for a few minutes during the day, whereas after the grid strengthening the inverter stays connected for larger periods. It could therefore be said that there is certainly an influence in PCC voltage harmonic distortion when the inverter is connected and operating, particularly this influence is most noticeable on 5th harmonic after the grid strengthening.
5.5. Statiscal Analysis
The statistical analysis of the recorded data was performed to observe the fluctuations in the grid voltage for both situations and considering all data.
Table 1 presents the minimum, maximum and mean values, as well as the standard deviation of the minimum, medium and maximum voltage profiles. The 95th percentile and the percentage of values within the range between 90% and 110% of the rated voltage are also shown.
For the data collected before the grid strengthening, the mean and the highest voltage values of the minimum, medium and maximum voltage profiles are very close to one another, as they fall between 240.6 V and 243.5 V and between 258.5 V and 265.5 V, respectively. The lowest voltage values of the minimum, medium and maximum voltage profiles are within a wide range of voltages, as they fall between 149.3 V and 184 V. The minimum voltage values for all voltage profiles are very low, particularly for the minimum voltage profile, due to the fact that the installation is near to the line end point (1.5 km away from the transformer) which shows the weakness of the line. The 95th percentiles for the minimum, medium and maximum voltage profiles are 251.9, 253.4 and 255.6 V, respectively, which indicates that in all voltage profiles one has that 5% of the voltages values are approximately 10% above the rated voltage. Besides, 4.96%, 5.97% and 9.55% of the voltage values of the minimum, medium and maximum voltage profiles, respectively, are out of the range from 90% to 110% of the rated voltage. Despite the very low minimum value for the minimum voltage profile, only a small percentage of the values fall out of the standard limits. On the other hand, the maximum voltage profile has the highest percentage of values out of the standard limits caused by both low load and the constant attempt to PV generation (intermittent operation of the inverter).
For the data collected after the grid strengthening, one can see that the minimum, medium and maximum values of the minimum, medium and maximum voltage profiles all rose. Particularly for the minimum values that arose as a consequence of the grid strengthening. The standard deviation has decreased as the difference between the maximum value and the minimum value has also decreased. However, the values within the range from 90% to 110% of the rated voltage also decreased, which means that there were more voltage values lying out of the standard limits. The maximum voltage profile still has the highest percentage of values lying out of the standard limits, which was caused by both low load and the PV generation conditions. The difference is that now the inverter stays connected to the grid.
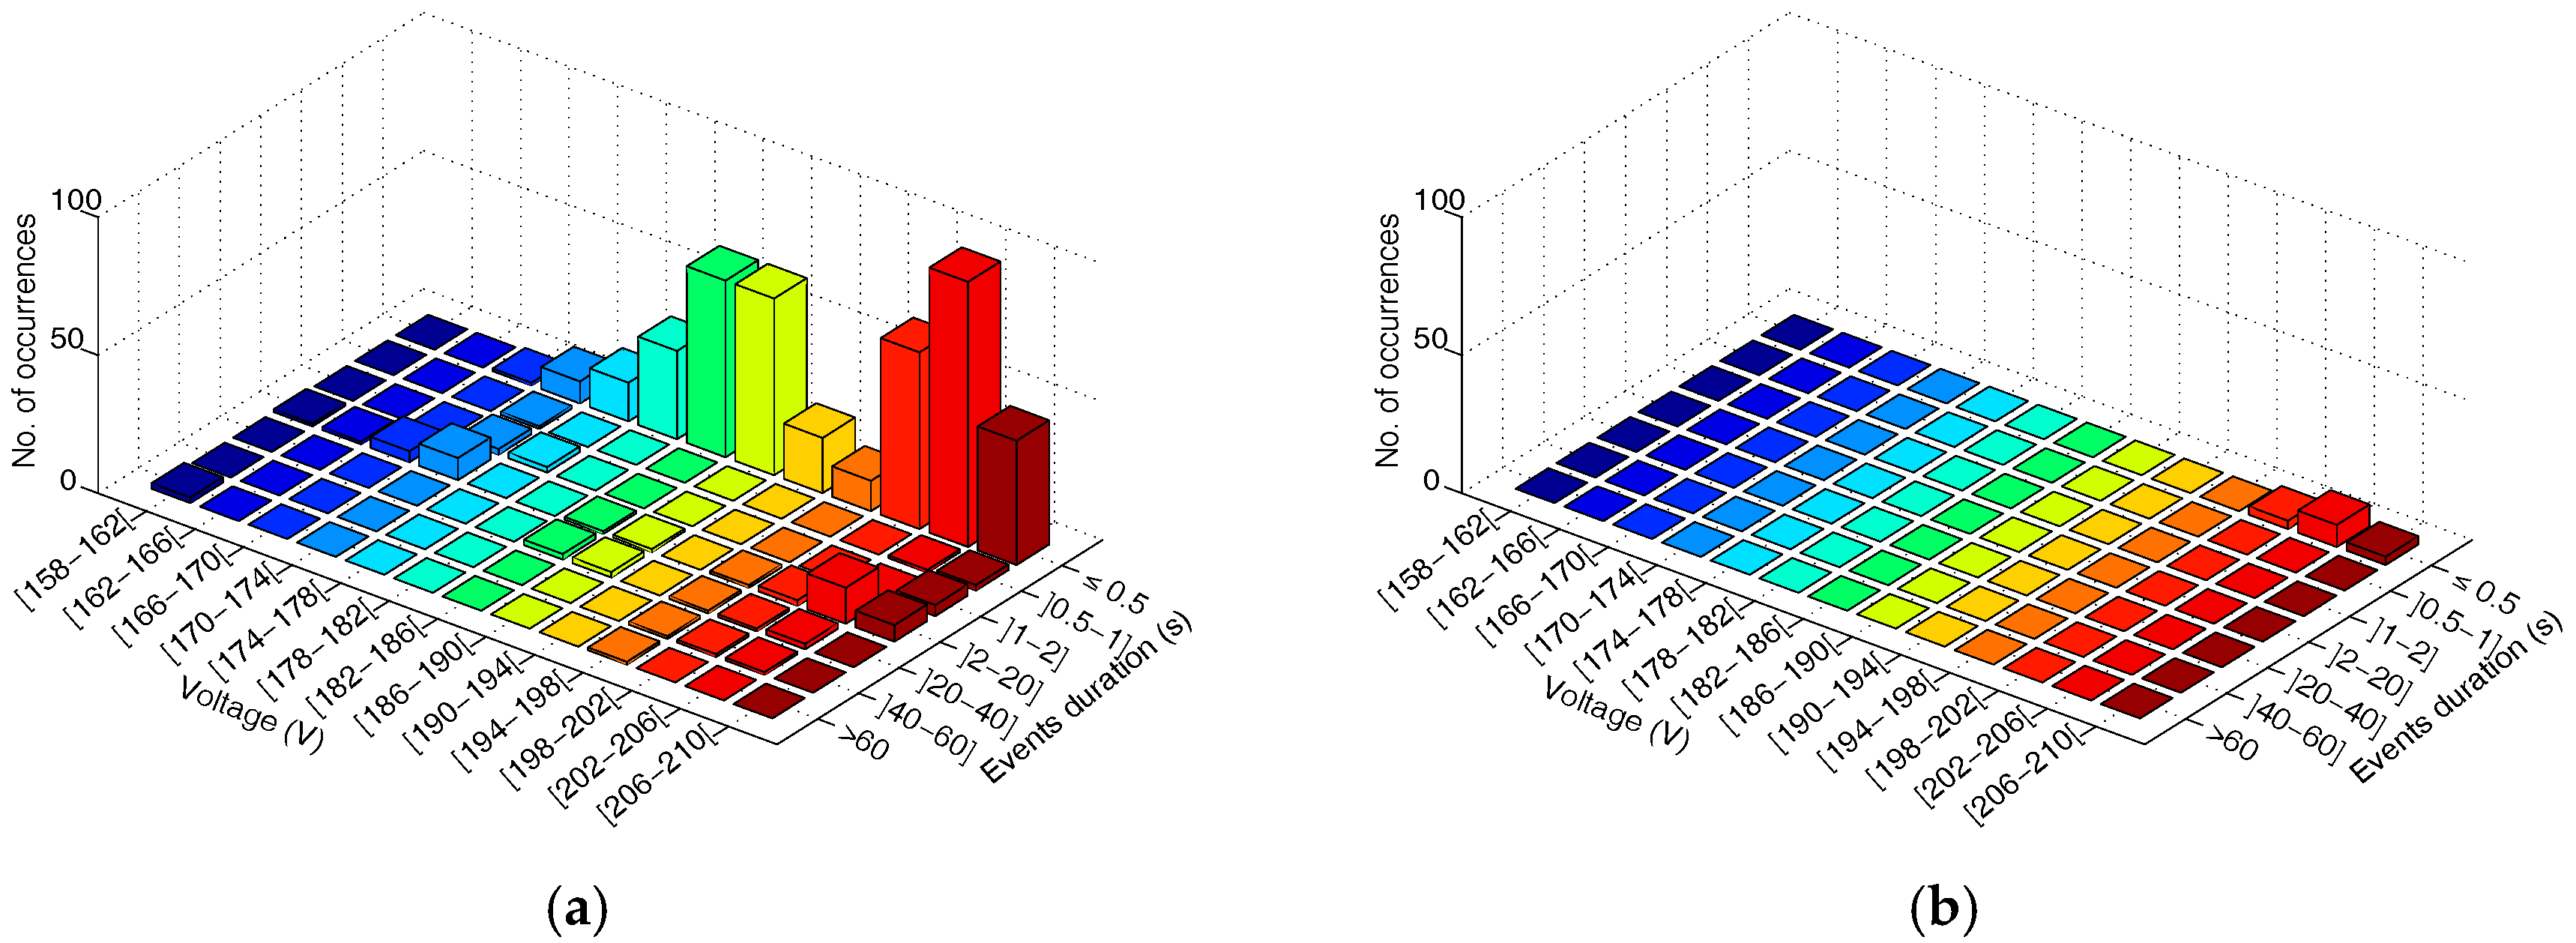
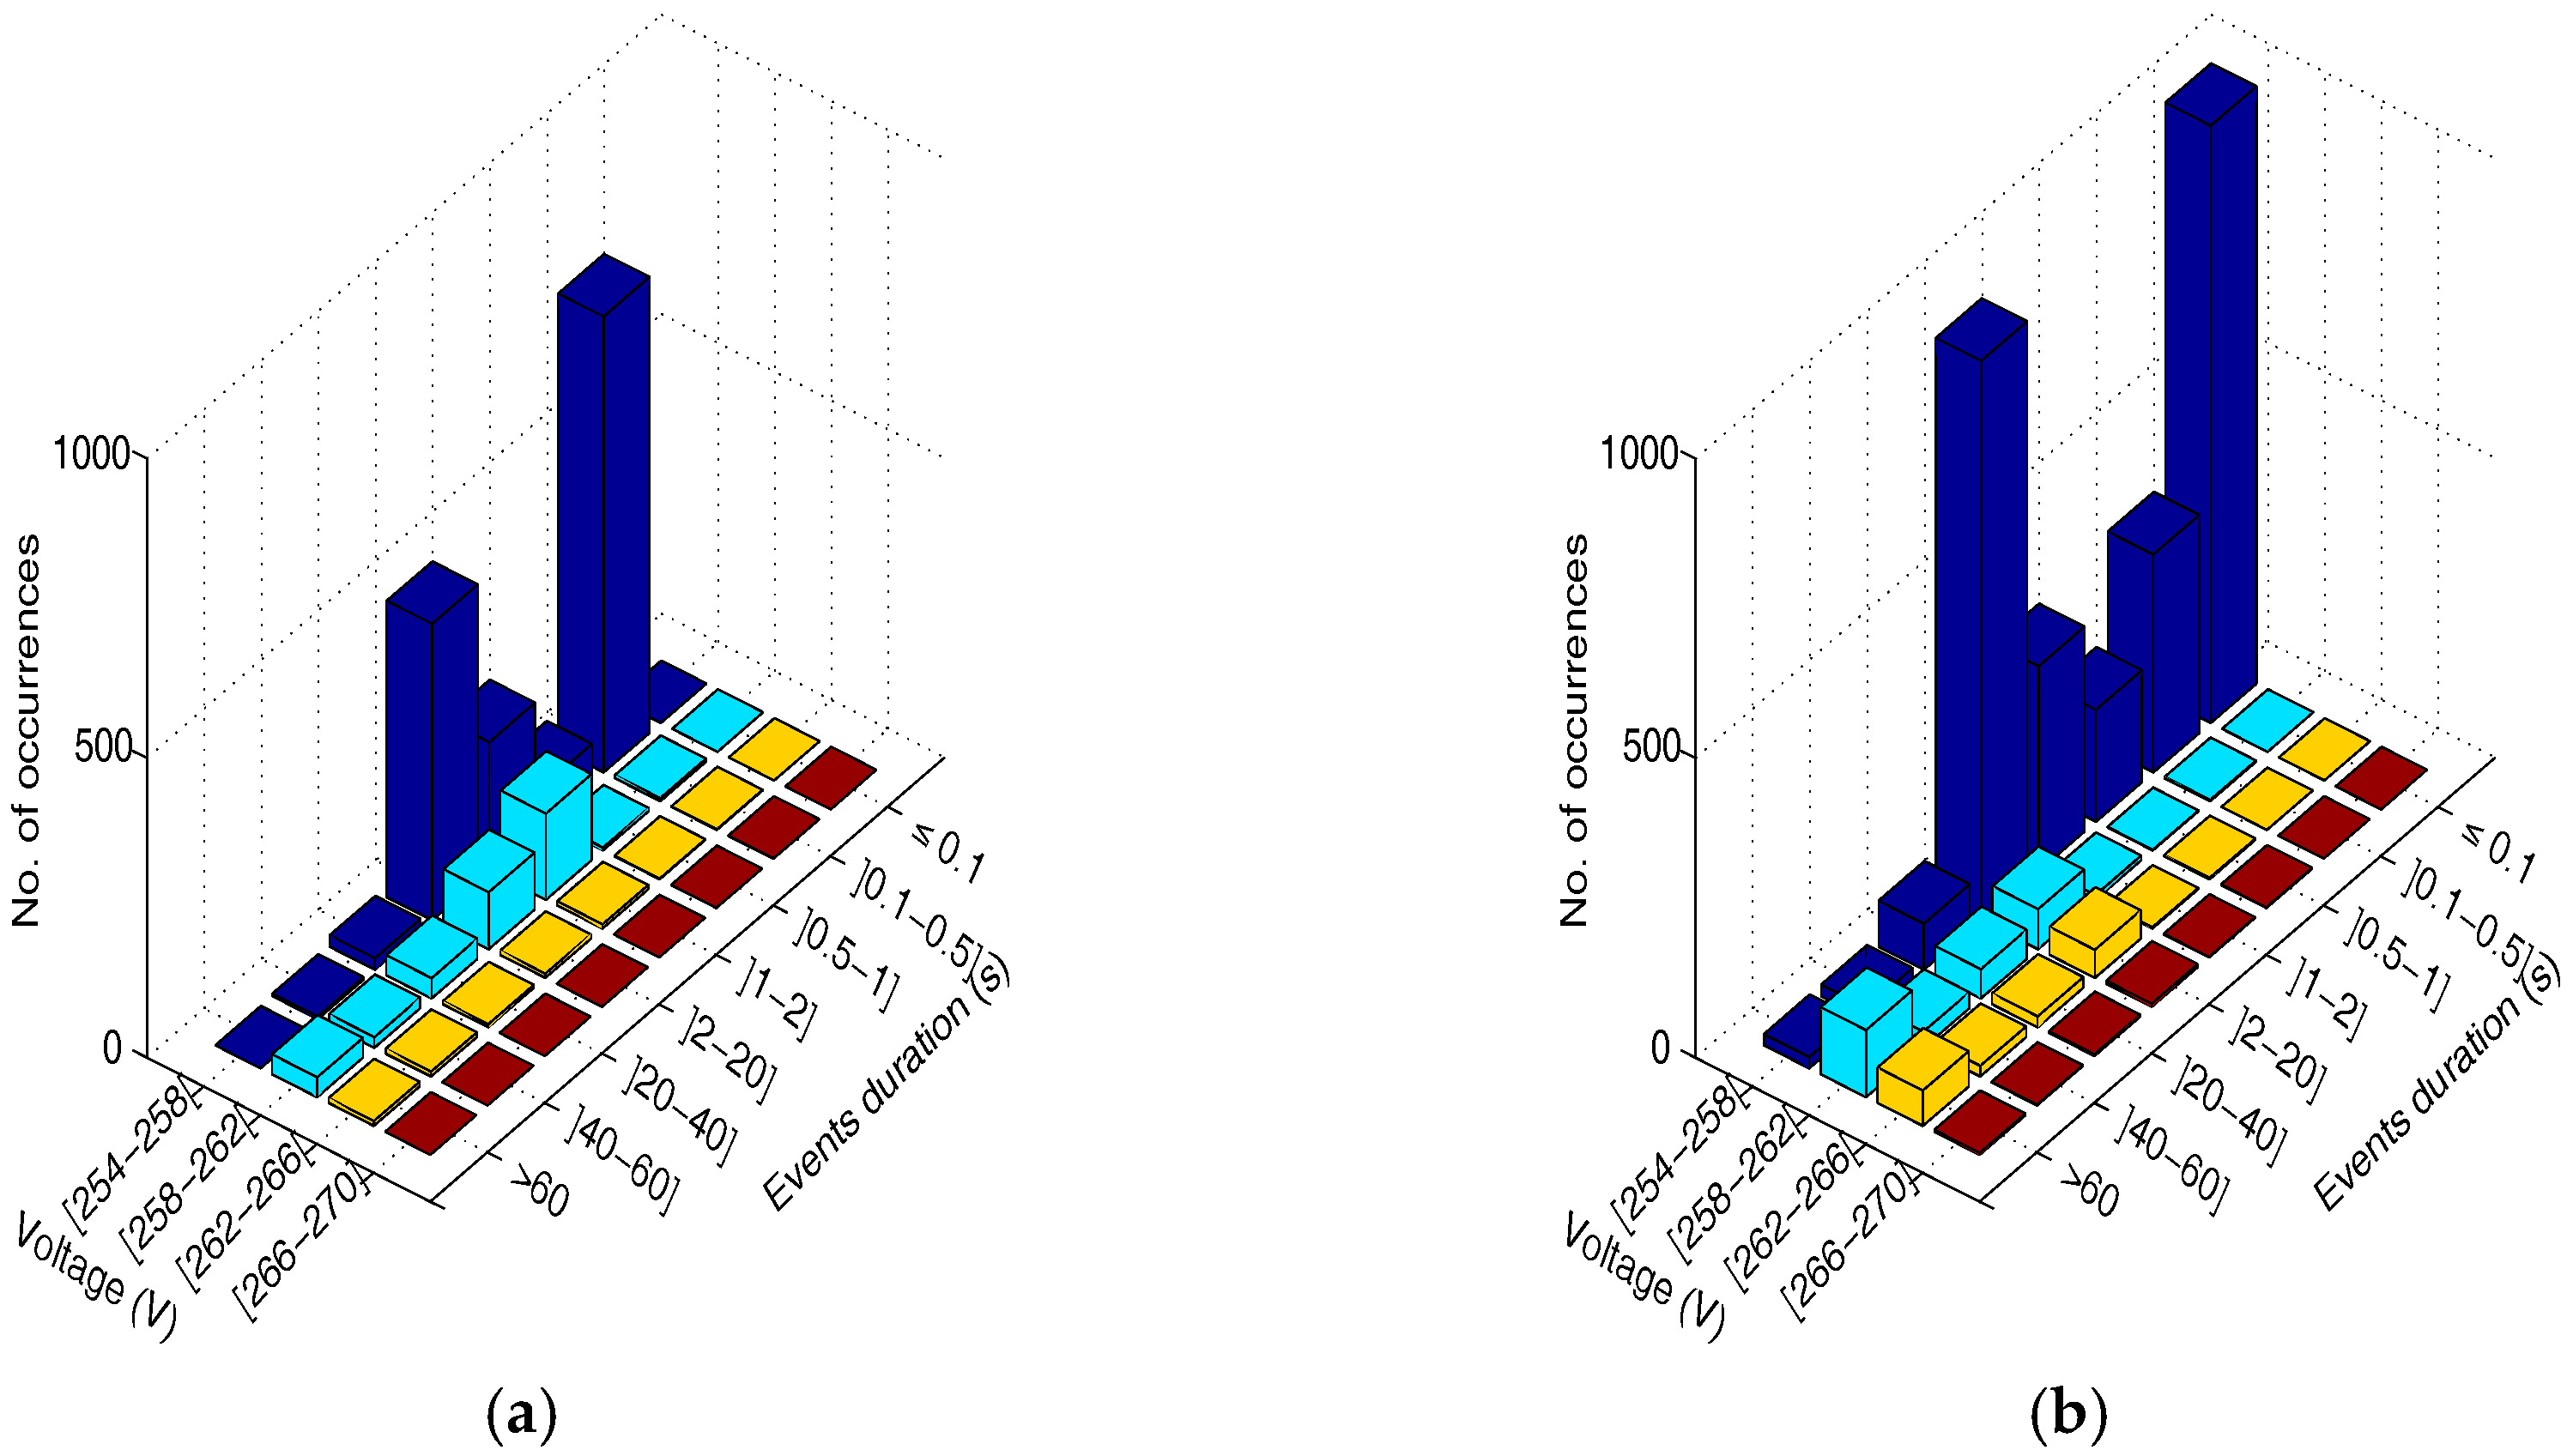
The registered dips and swells for all recorded data, both before and after the grid strengthening, are shown in a 3-dimenional view. The dips before and after the grid strengthening are compared in
Figure 11a and
Figure 12a, respectively. Likewise, the comparison for swells before and after the grid strengthening is shown in
Figure 11b and
Figure 12b, respectively.
Before the grid strengthening, there were 1929 swells concentrated in the interval [254–258[ V, for time durations between 0.1 s and 20 s, and in the interval that follows [258–262[ V for time durations higher than 10 s. With respect to the undervoltage we verified the existence of 417 dips mainly in the interval ]0.1–0.5] s (short duration) with several voltage values.
After the grid strengthening we verified 3438 swells concentrated in the interval [254–258[ V for durations higher than 0.1 s, which is almost double the swells registered earlier, and between [258–262[ V and [262–266[ V for durations higher than 20 s. There was evidently a great increase in the number of swells, mainly of long duration, but also of higher voltage values, as only after the grid strengthening were voltage values registered in the interval [266–270] V. As referred earlier, in this case the swells become permanent as the inverter stays connected to the grid, while the voltage remained either near or above 10% of the rated voltage. With respect to the undervoltage, we verified the existence of only 16 dips, also of short duration. This huge decrease results from the grid strengthening.
6. Conclusions
This paper presents PQ analysis results for a real rural grid-connected PV system for energy generation. The behavior of the voltage, frequency and harmonics were observed as well as the dips and swells occurring before and after a grid strengthening. A statistical analysis was also presented.
The results show that whenever the inverter connects to the grid, the voltage often exceeds the limits of the PQ values. Before the grid strengthening, generation is reduced to a small fraction of the energy available during the sunny hours. Simultaneously, as electricity generation is lower than expected, there are losses in revenue as well, as the converter keeps working in an undesirable operating mode. The severity of the voltage fluctuations can turn the analyzed installation economically unviable and subject the grid, near the injection point, to increased voltage pollution, decreasing the voltage PQ.
In order to avoid the nasty effects of this behavior, particularly the losses in revenue, a grid strengthening was carried out. After the grid strengthening, the intermittent operation (connection and disconnection) of the inverter was clearly reduced and made the PV system economically viable, in the sense that it stays connected to the grid delivering as much power as it can, given the available sunlight and temperature conditions, but the voltage still remained near the standard upper limit. In fact, in this case, the number of swells was higher than before the grid strengthening. Thus one can conclude that the severity of the voltage fluctuations was not solved.
The problem presented here, for a rural low-voltage grid connected PV generation facility, has also been identified in many other installations with similar technical characteristics. As the voltage THD and harmonic content are clearly below the allowed limits and the frequency deviations are also clearly below the imposed absolute value of 0.5 Hz, the main problem identified concerns the voltage fluctuations due to the low load near the power injection point. A possible solution could be a grid reconfiguration for obtaining load balancing.


