Article

Impact of Generator Stroke Length on Energy Production for a Direct Drive Wave Energy Converter

1
Division for Electricity, Uppsala University, Uppsala 75121, Sweden
2
Seabased AB, Sylveniusgatan 5 D, Uppsala 75450, Sweden
*
Author to whom correspondence should be addressed.
Energies 2016, 9(9), 730; https://doi.org/10.3390/en9090730
Submission received: 25 June 2016 / Revised: 29 August 2016 / Accepted: 31 August 2016 / Published: 9 September 2016
(This article belongs to the Special Issue Numerical Modelling of Wave and Tidal Energy)

Abstract

:
The Lysekil wave energy converter (WEC), developed by the wave energy research group of Uppsala University, has evolved through a variety of mechanical designs since the first prototype was installed in 2006. The hundreds of engineering decisions made throughout the design processes have been based on a combination of theory, know-how from previous experiments, and educated guesses. One key parameter in the design of the WECs linear generator is the stroke length. A long stroke requires a taller WEC with associated economical and mechanical challenges, but a short stroke limits the power production. The 2-m stroke of the current WECs has been an educated guess for the Swedish wave climate, though the consequences of this choice on energy absorption have not been studied. When the WEC technology is considered for international waters, with larger waves and challenges of energy absorption and survivability, the subject of stroke length becomes even more relevant. This paper studies the impact of generator stroke length on energy absorption for three sites off the coasts of Sweden, Chile and Scotland. 2-m, 4-m, and unlimited stroke are considered. Power matrices for the studied WEC prototype are presented for each of the studied stroke lengths. Presented results quantify the losses incurred by a limited stroke. The results indicate that a 2-m stroke length is likely to be a good choice for Sweden, but 4-m is likely to be necessary in more energetic international waters.

Graphical Abstract

1. Introduction

Uppsala University, Sweden, has an ongoing wave energy research project that was started in 2002 [1]. The group has a research site at the west coast of Sweden and the first wave energy converter (WEC) was installed at the site in 2006. The WEC, categorized as point absorber, consists of a point absorbing buoy floating on the ocean surface and a directly driven linear generator placed on the seabed. The choice of a directly driven permanent magnet generator was made for the sake of robustness and survivability through the avoidance of moving parts. The small size, relative to many other WECs, was chosen in part for the mild Swedish wave climate, but mainly to facilitate future series production and ease of transportation and deployment at sea. Large-scale parks will be needed to produce relevant energy levels to the grid, yet the many individual WECs create redundancy and allows for repairs and maintenance while maintaining electricity production from the parks.
Since the start of the project, twelve different prototypes of WECs, with a variety of mechanical designs and power ratings, have been installed [2]. In addition, relevant control and measurement systems, such as a marine substation [3], have also been developed and tests have been carried out on the WECs’ performances [4]. Collateral research areas include a tidal effect compensator [5], remote operation vehicle (ROV) connections [6], a study of the thermal properties of the power system [7], and management on the deployment [8]. For a future wave power plant, it will be important to identify its environmental impact. Therefore, environmental studies have been carried out since the start of the project.
Studies on biofouling on the buoys and colonization of species on and around the foundations have been performed [9]. Furthermore, research on large-scale power plants [10] installed in different park patterns has also been performed. Further details about the progress of the project can be found in [11,12]. Using a direct drive linear generator to convert the energy in the waves into electricity is used in some different wave energy projects, see for example References [13,14,15,16]. Current research topics include how to improve the technology’s energy absorption by optimizing the control and performance of the WEC. Though many options exist to this end the challenge is to improve performance while not introducing technology, which makes the devices more vulnerable or otherwise costly in relation to the added benefit.
There are several parameters on the device that will bring an impact on the performance of the generator and on the power production. In this study, the impact of the stroke length will be investigated. The stroke length is the range that the generator’s moving part, the translator, can move before being stopped by the end stops. In other words, it is the distance between the end stops minus the length of the translator, as shown in Figure 1. The stroke length effects the electrical conversion since it limits the translator’s maximum movable distance. Hence, it is important to investigate how strongly the energy absorption is affected by adjusting the stroke length, and to determine the design stroke for different wave climates. Furthermore, the manufacturing cost is an inevitable factor when designing a WEC device. The construction and the maintenance at sea are basically costly, a main challenge being to secure its survivability when exposed to the enormous wave forces while remaining economically sound. To this end it is significant to find a compromise between the exploitable wave energy and the construction cost, and one of the main parameters is the stroke length of the linear generator.

2. Theory

The WEC model consists of two parts, a buoy floating on the surface and a linear generator at the seabed. The floating buoy is connected to the generator via a line. Electrical power is converted by the relative motion between a fixed stator and a movable translator, as illustrated in Figure 1. There are two end stops installed inside the generator, with the purpose to protect the generator from damage during rough wave conditions.
In this study, the floating buoy is restricted to the motion only. The interaction between the waves and the buoy is modeled by the potential theory. The hydrodynamic parameters for the excitation force and the radiation impedance are calculated by the software WAMIT (WAMIT, Inc., Chestnut Hill, MA, USA) [17].
Equation (1) describes the vertical motion for the buoy x 1 and the translator x 2 under excitation from the waves. The upper differential equation describes the interaction between the buoy and the waves, where m a is the mass of the buoy, m is the added mass in infinity, f exc   is the time dependent excitation force, h ( t ) is the impulse response function for the radiation impedance, f H is the hydrostatic stiffness and f line is the line force. The lower differential equation describes the motion of the translator driven by the buoy, where m b is the translator mass and f damp is the generator damping force. The end stops are springs with a high spring constant, as denoted as f upp _ es and f low _ es respectively in the equation. The line between the buoy and the translator is modelled as stiff spring that becomes active when the translator reaches its end positions. The line force is modeled by Equation (2), where the spring constant is denoted as k line .
{ ( m a + m ) x ¨ 1 = f exc ( t ) h ( t ) x ˙ 1 ( t ) f h f line ( x 1 , x 2 ) m a g m b x ¨ 2 = f line ( x 1 , x 2 ) + f damp ( x 2 , x ˙ 2 ) m b g + f upp _ es + f low _ es
f line ( x 1 , x 2 ) = { k line ( x 1 x 2 ) if     x 1 > x 2   0       else
Equations (3) and (4) describe the upper and lower end stop force. In the equations k s 1 and k s 2 are the spring constant for the end stops and l 1 and l 2 are the stroke length to the upper and lower end stop, respectively.
f upp _ es ( x 2 ) = { k s 1 ( x 2 l 1 ) if     x 2 > l 1   0           else
f low _ es ( x 2 ) = { k s 2 ( x 2 l 2 ) if         x 2 < l 2   0   else
The generator damping force is proportional to the translator speed with the damping coefficient γ in Equation (5).
f damp ( x ˙ 2 ) = γ x ˙ 2
In Reference [18], Eriksson proposed a numerical approach for the WEC modeling by using the potential theory and with the generator modeled as a viscous damper. The WEC model was later built up and validated with full-scale experimental test results from the wave power plants installed off the Swedish west coast in the Lysekil project. The validation was published in Reference [19].
Figure 2 gives an example of results from the numerical model showing the motion of the WEC buoy and linear generator in response to, in this simplified case, harmonic waves. According to the harmonic waves with known amplitude and energy period, the velocity and the position for both buoy and translator are obtained by solving the set of equations with given parameter settings such as the mass of the translator and buoy, the damping coefficient, buoy draft, etc. In this example case, the natural frequency for the WEC device is 6 Hz.

3. Materials and Methods

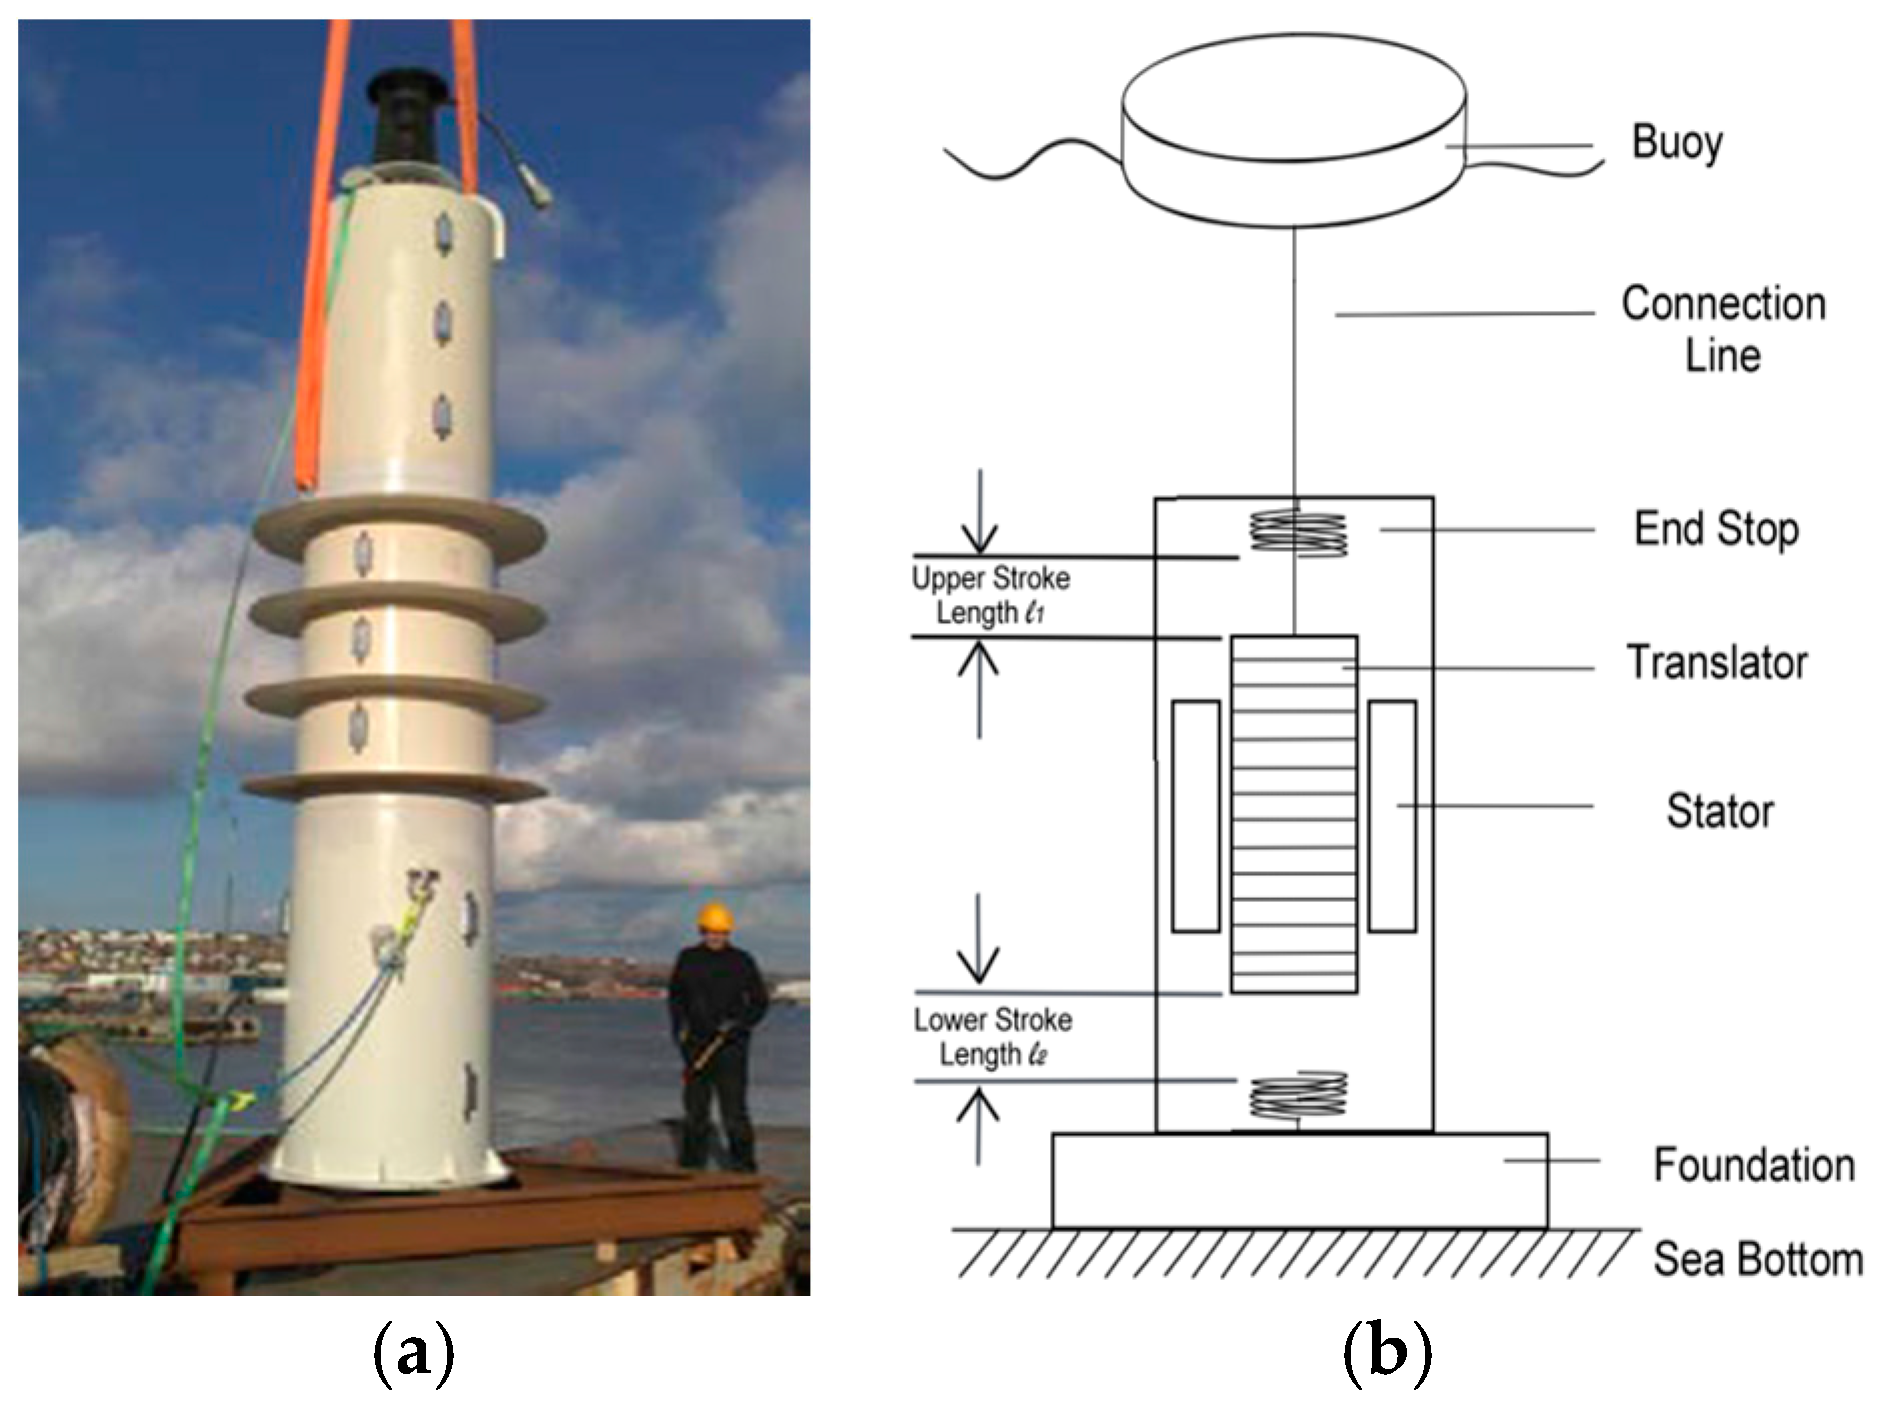
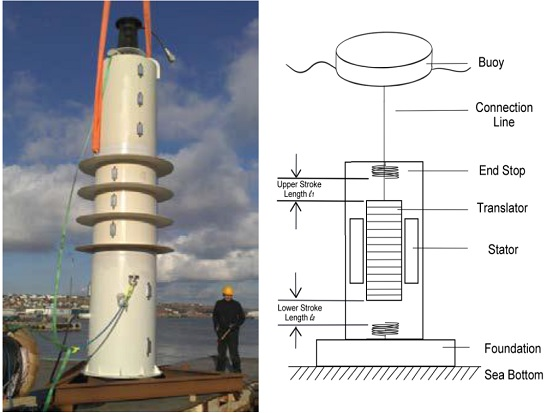
3.1. The Wave Energy Converter Model

The WEC model in this study was built up to simulate one of the prototypes of the Lysekil project [19]. The model consists of two parts—one is the hydrodynamic system and the other is the point absorber system. The hydrodynamic system is utilized to supply the wave energy to the linear generator model. It is possible to model the irregular wave climate at the test sites with information on the energy period and the significant wave height. The point absorber system, on the other hand, is the floating buoy connected to the linear generator. This system is able to model the behavior of the buoy by the irregular wave generated by the hydrodynamic system. The parameters for the WEC are listed in Table 1.
In this paper, the generator’s stroke length is investigated, in order to observe the impact to the power production for the WEC device. The stroke length will be adjusted to 2-m, 4-m, and infinite, respectively. The performance of the WEC is studied with a constant damping coefficient of 60 kN·s/m, which is a compromise between the studied sea states of the three sites and the buoy size.

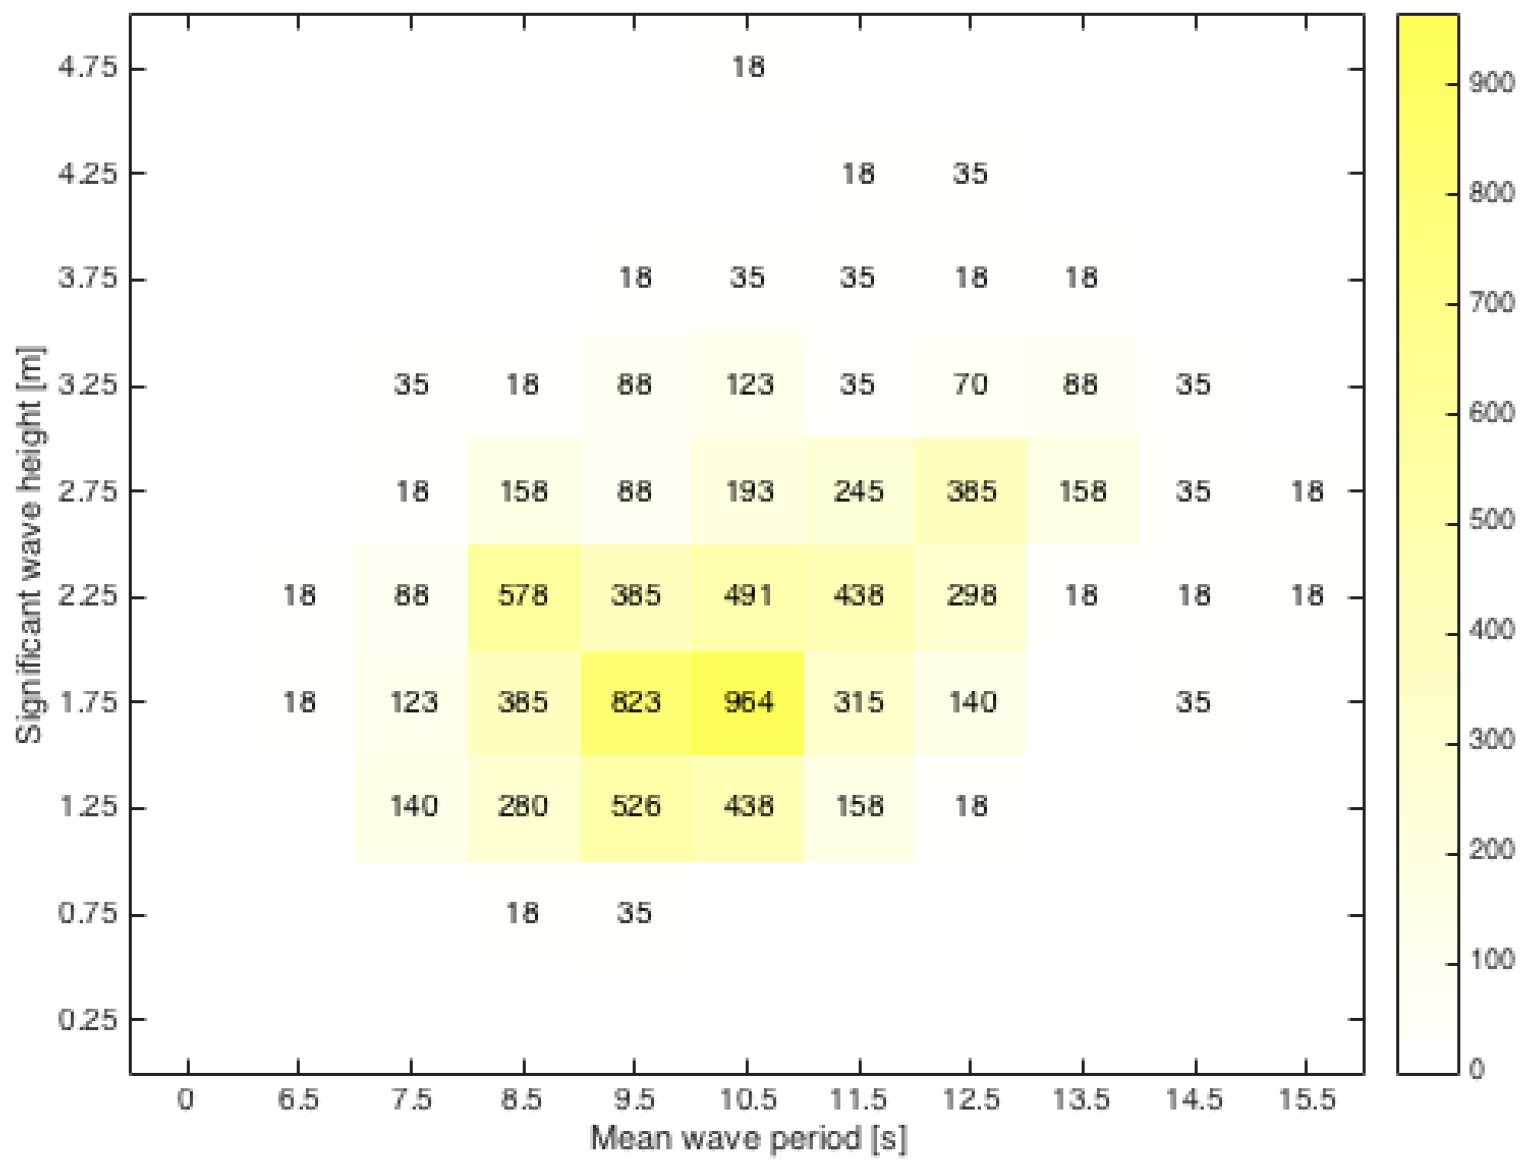
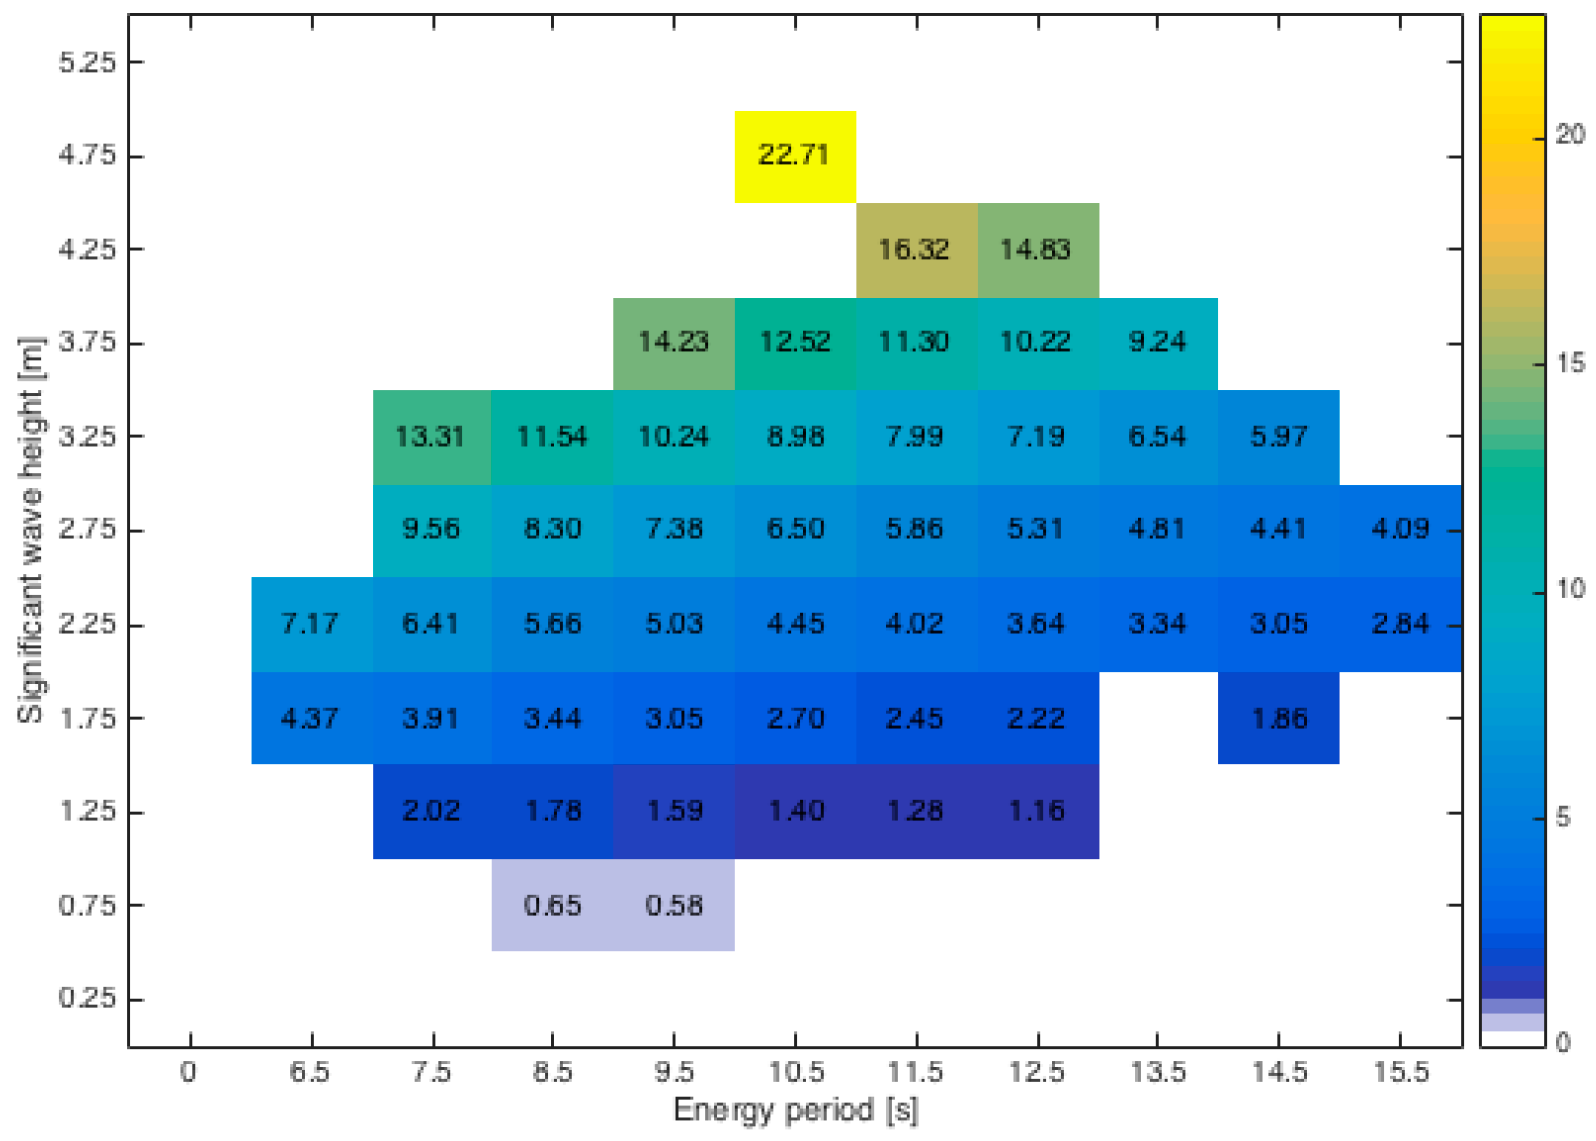
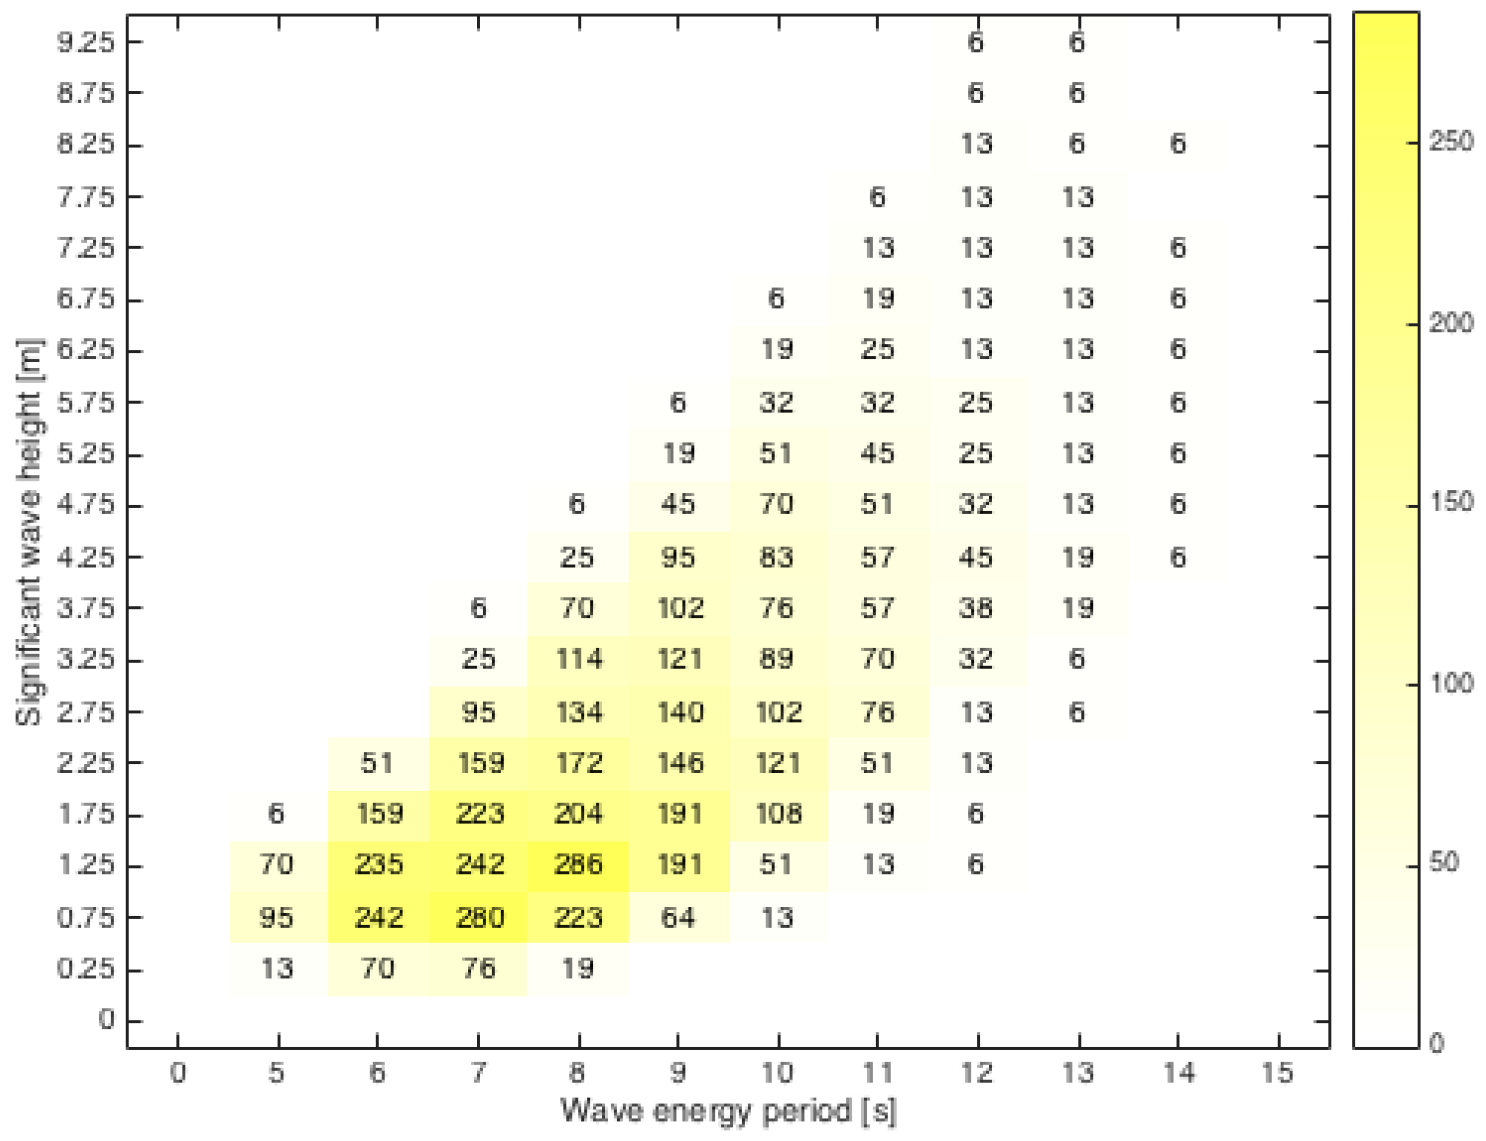
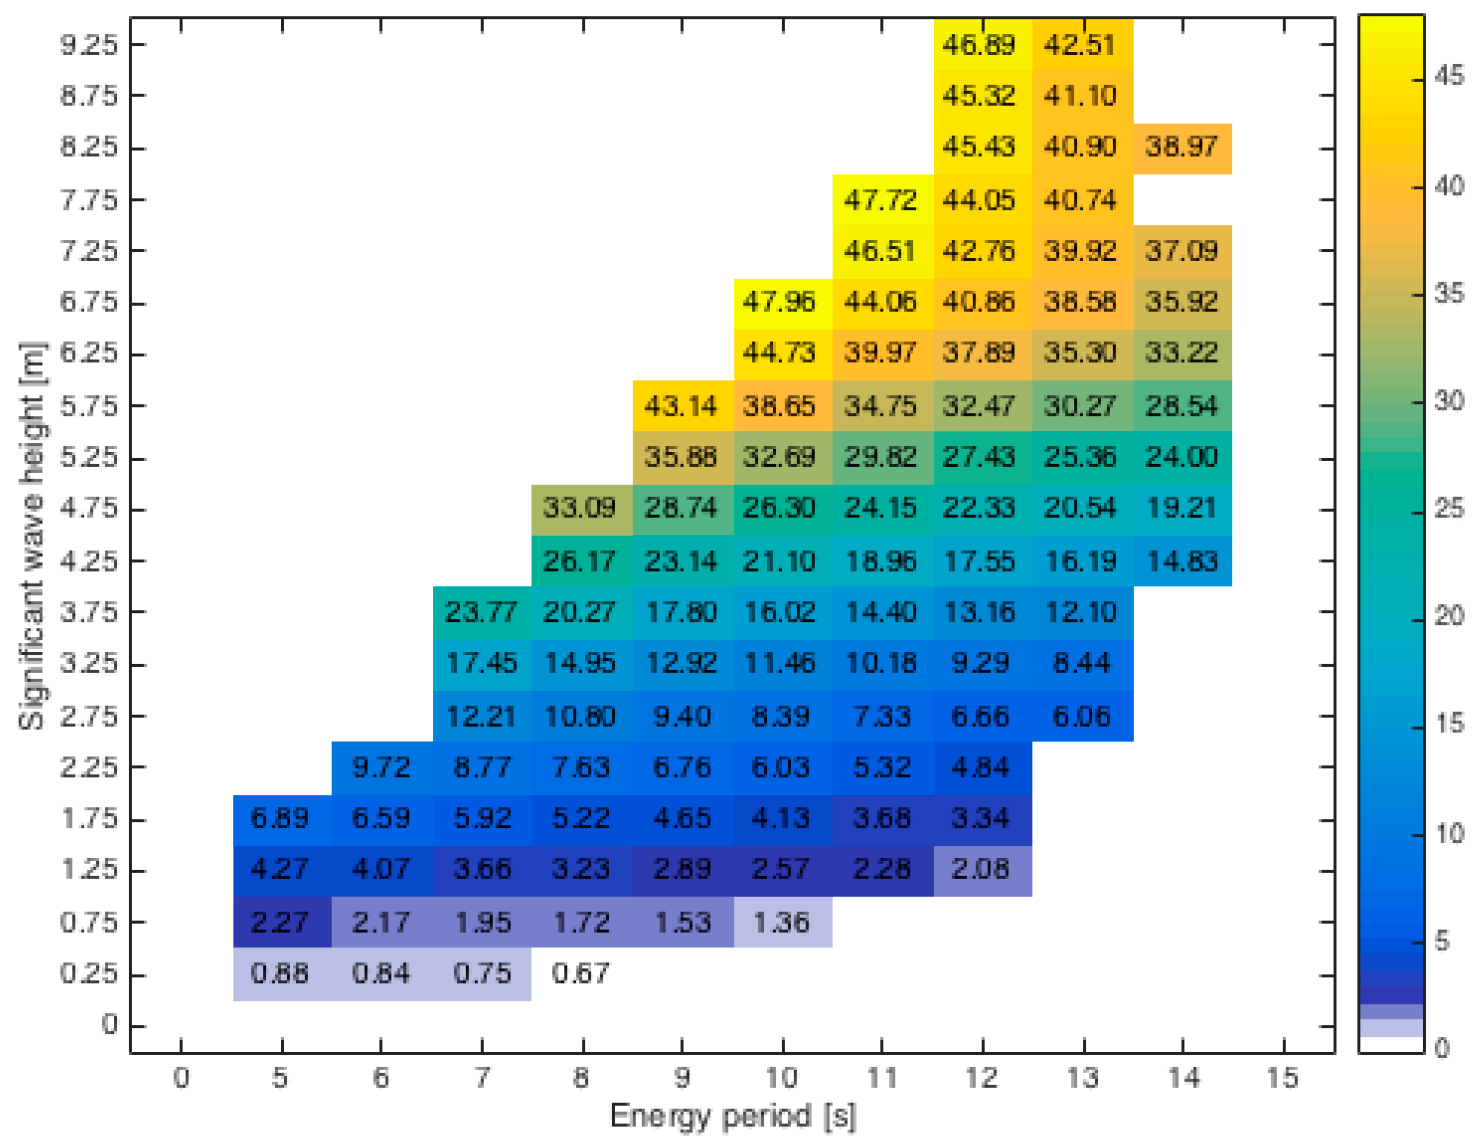
3.2. Irregular Wave Source

3.2.1. Lysekil Test Site

For the first studies in this paper, the wave data at test Site 6 is provided as the irregular wave source to the model. Figure 3a displays the location for the test Site 6 (58.38 N, 11.00 E) and the relevant wave occurrence [20] is presented in Figure 3b. The average water depth is around 80 m at the test site and it is located 18 km from coastline. The wave data for test Site 6 was obtained from Fugro OCEANOR AS of Norway [21]. The data available spanned the years 1997 to 2004. In this study, this wave data will be used in the WEC model to investigate the impact brought by varied stroke length, as well as to construct power scatter matrices for the test site.

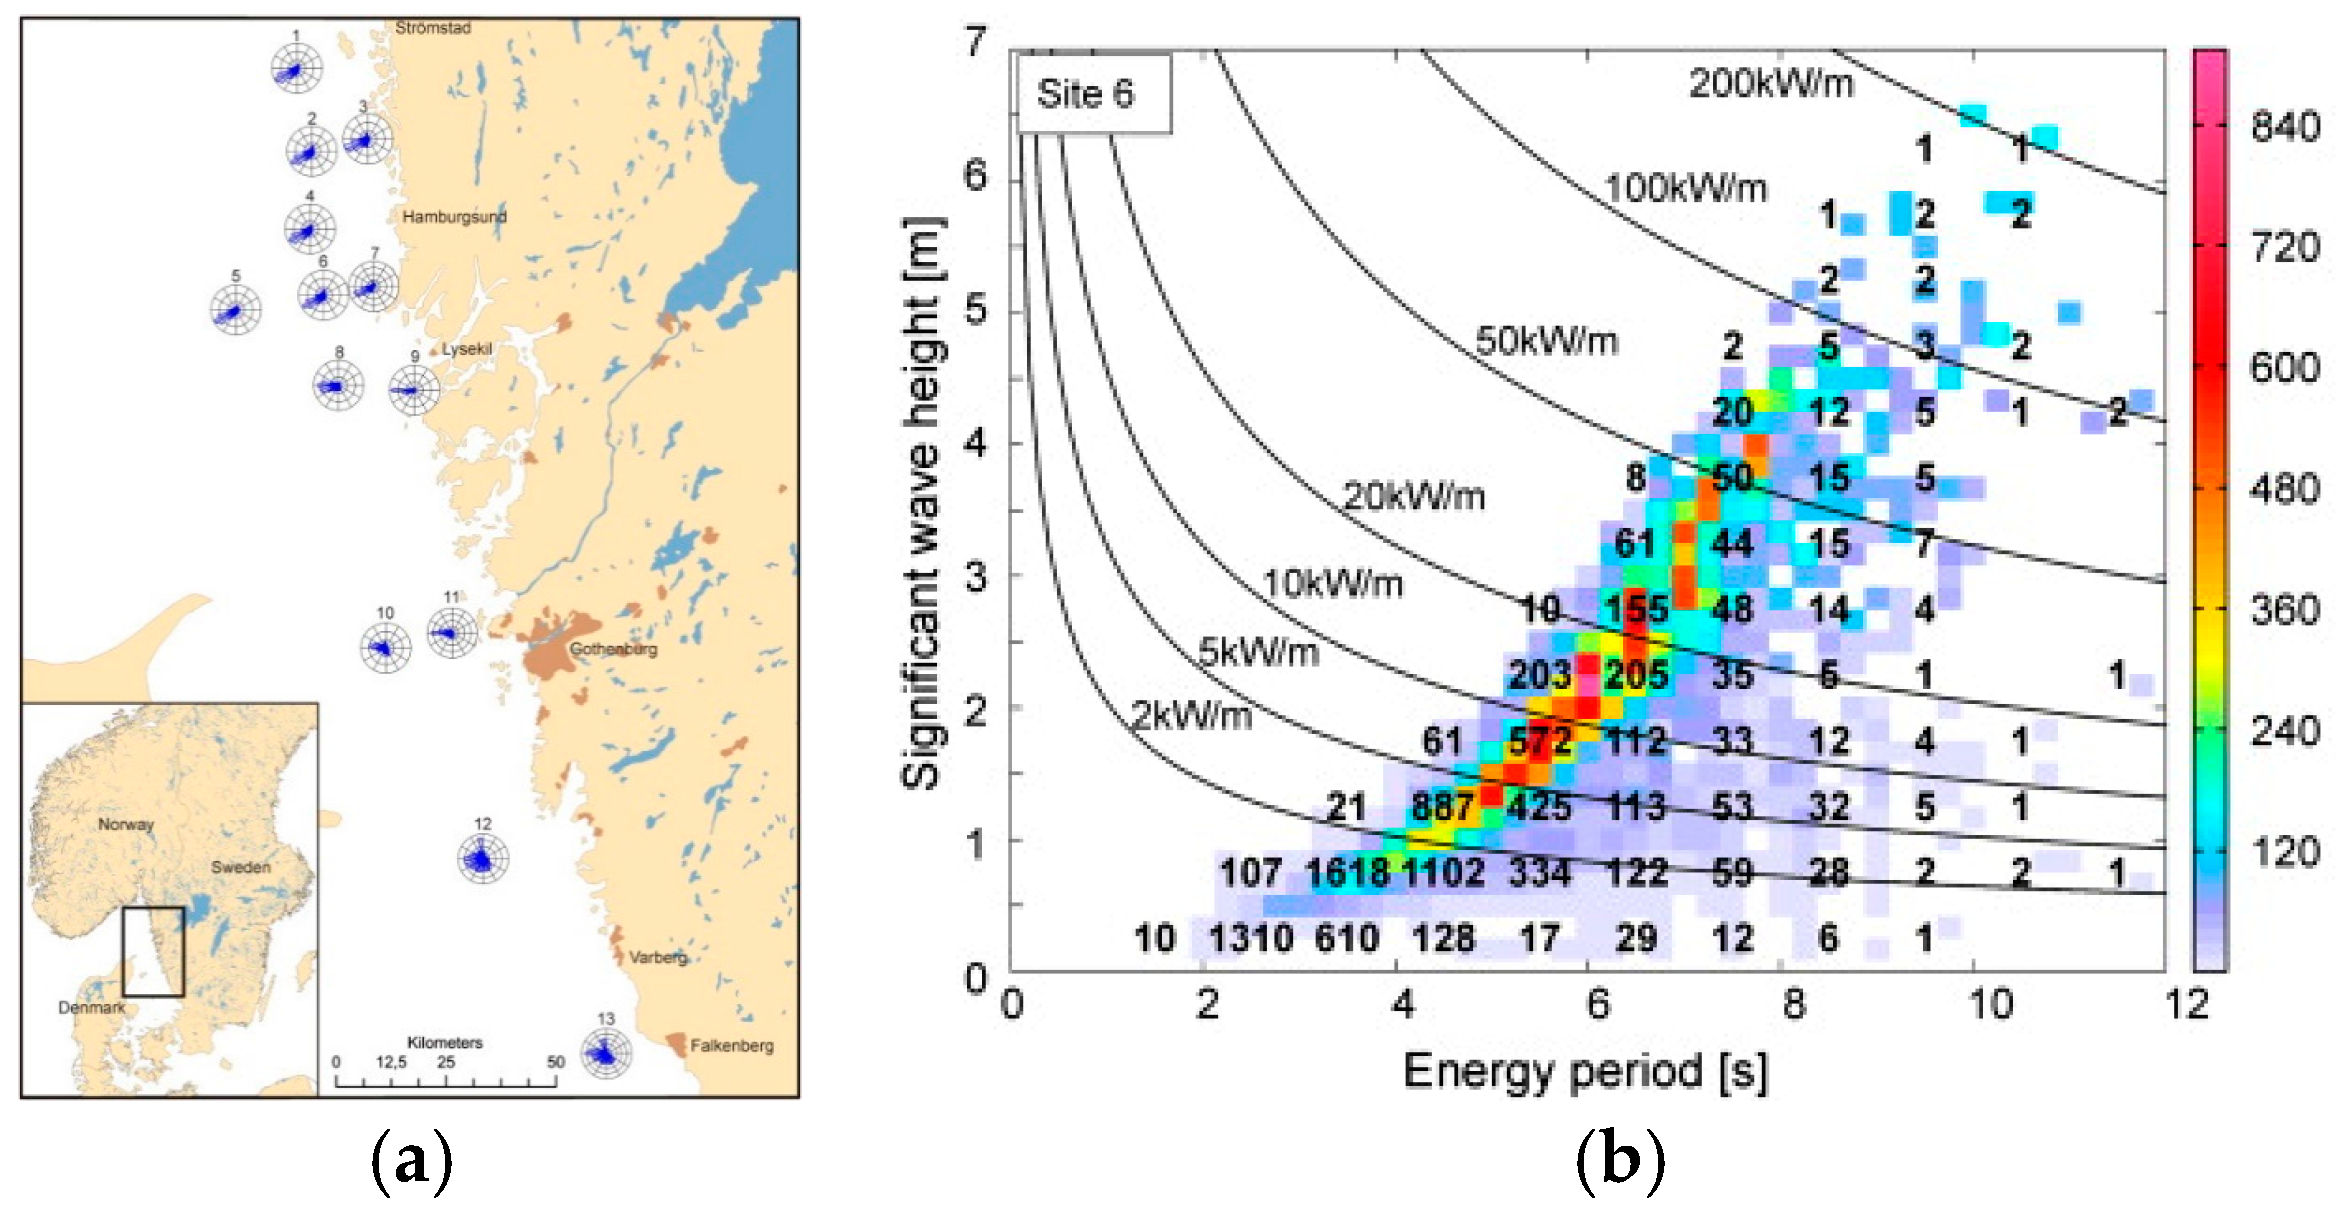
3.2.2. Other Test Sites

In addition to the Lysekil test site, two other test sites in other counties are also studied with the Lysekil WEC model. One site is the west coast of Scotland located at 57° N, 9° W [22], with data from wave energy Scotland (WES), while the other is located at 21°30′ S, 71°30′ W, off the coast of Chile [23]. In this paper, the wave data for both sites are utilized to predict the power and the energy absorption with the WEC model, and a comparison is made between these three test sites.

4. Results

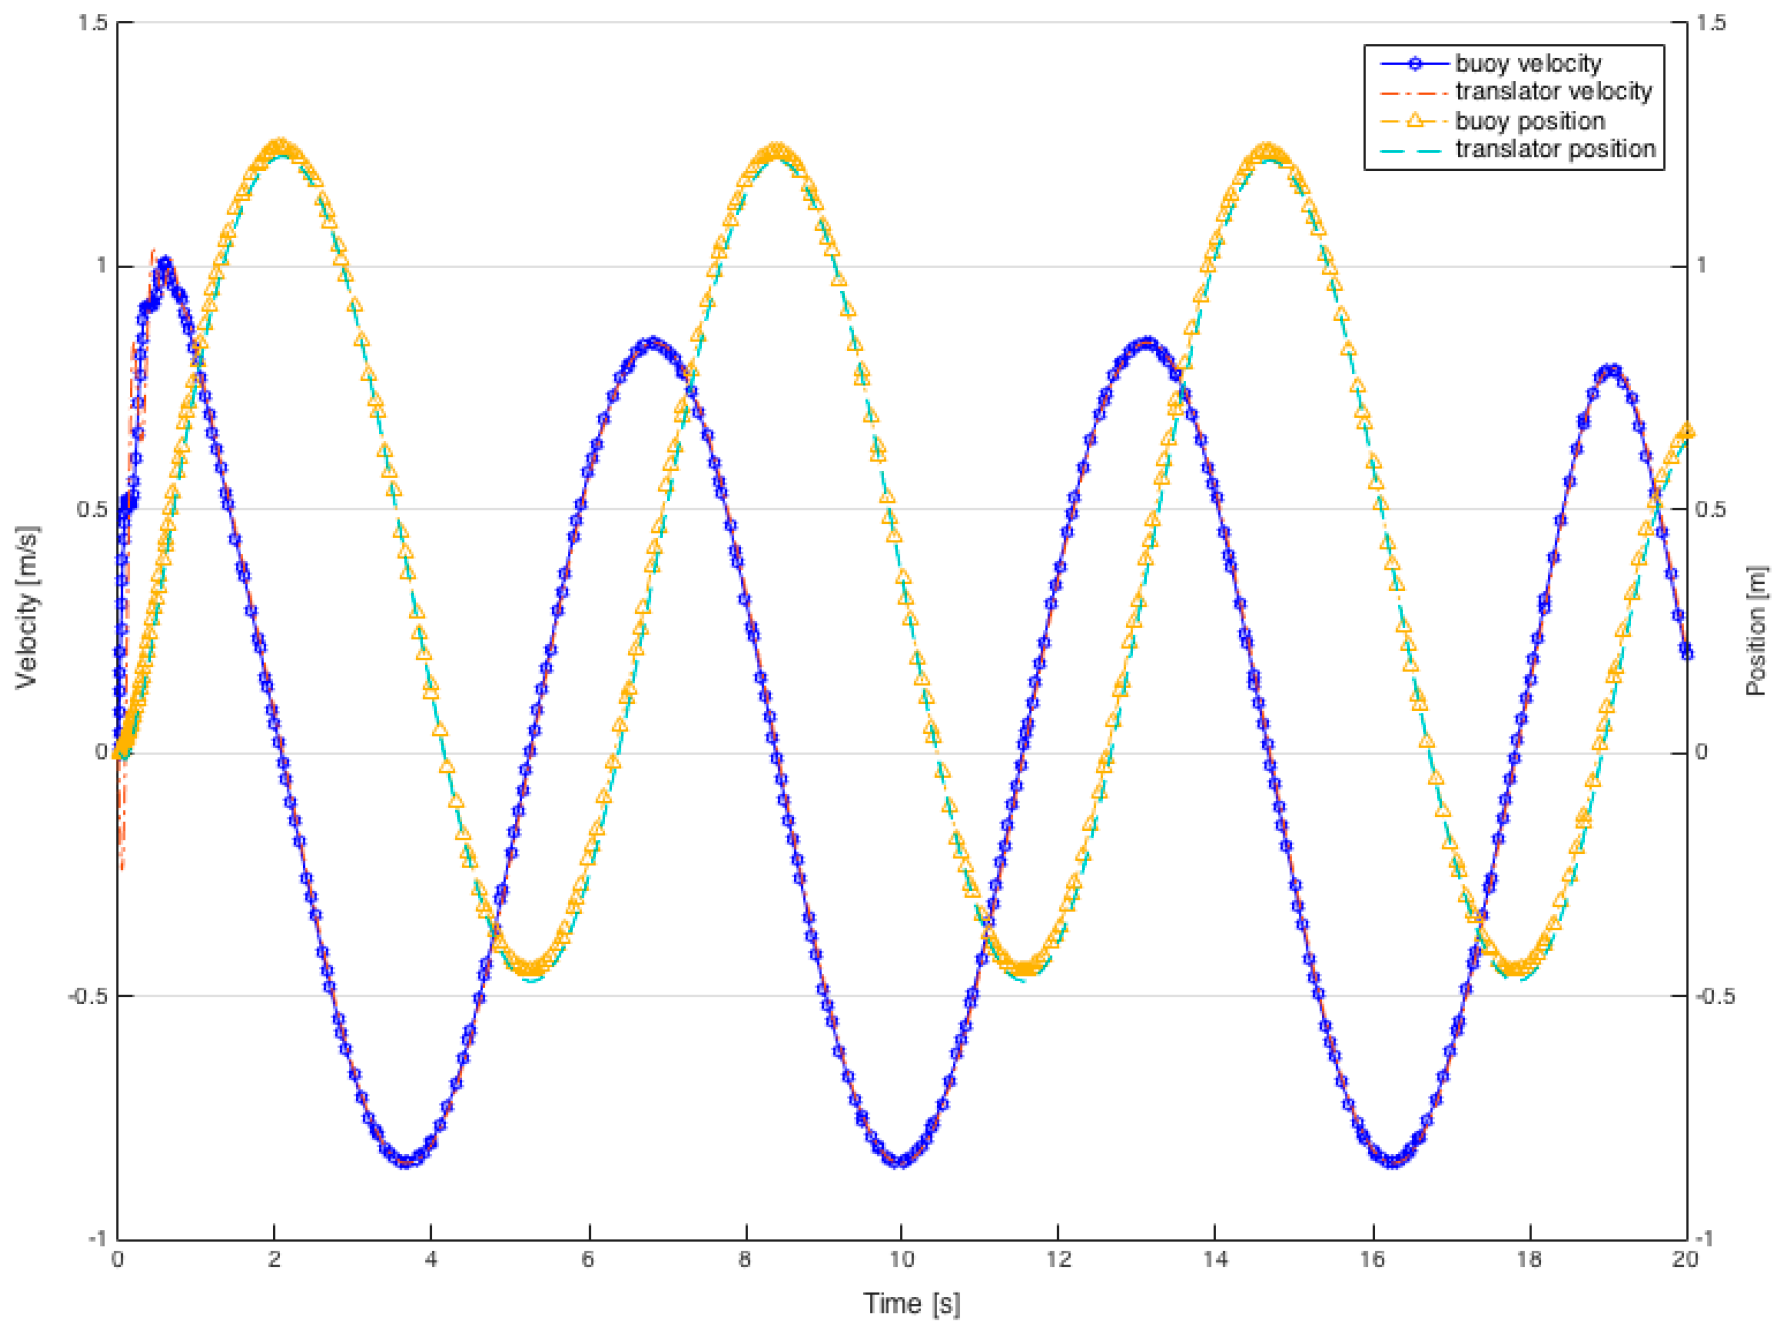
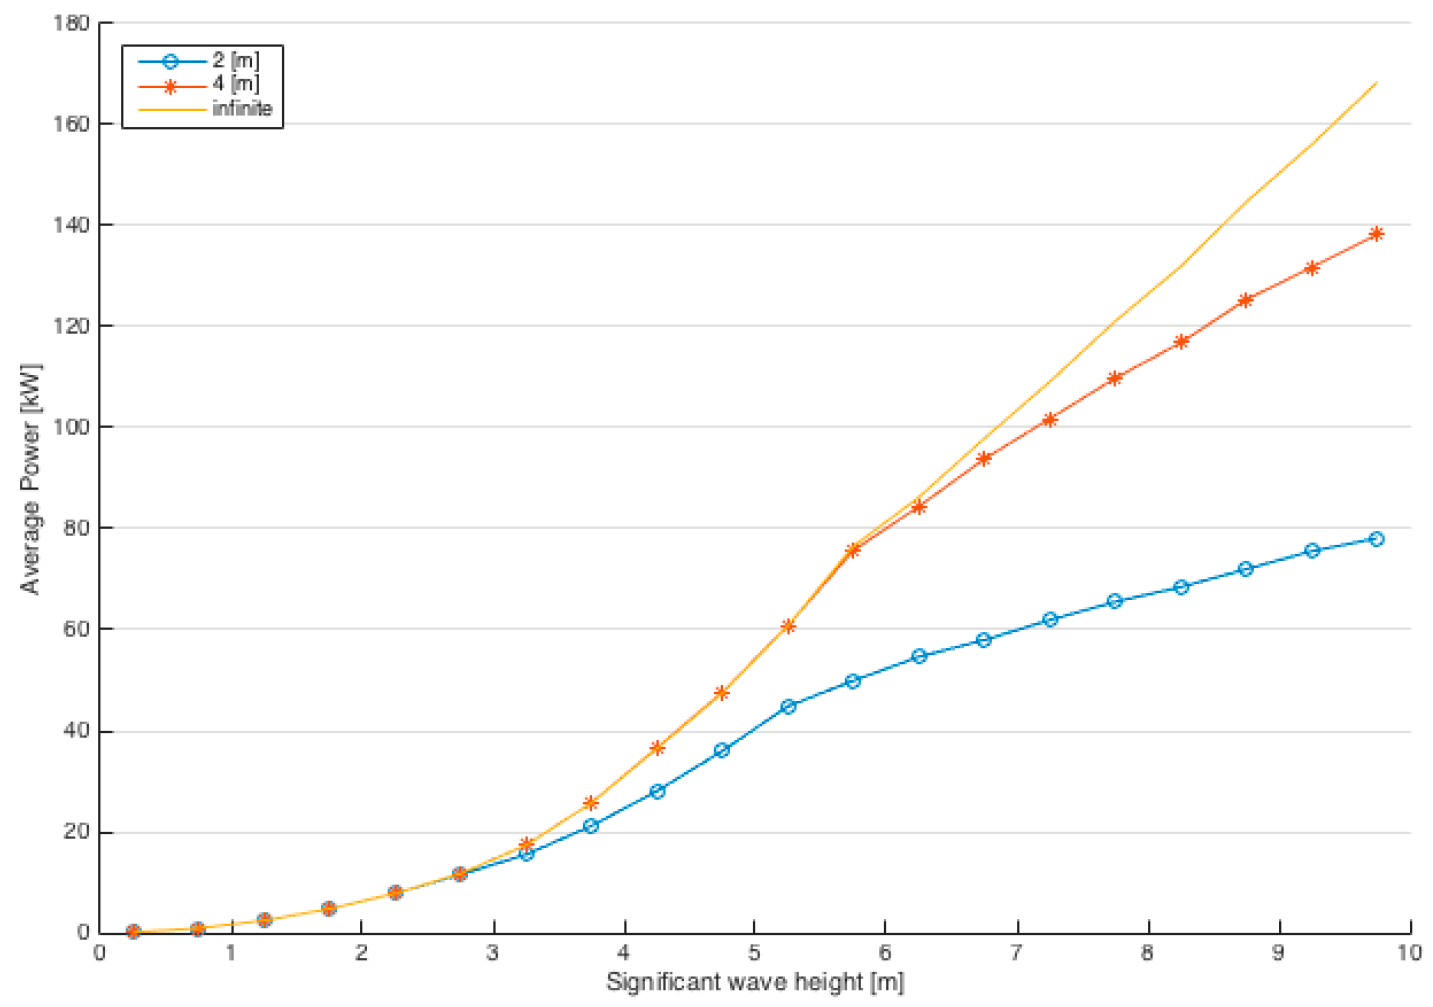
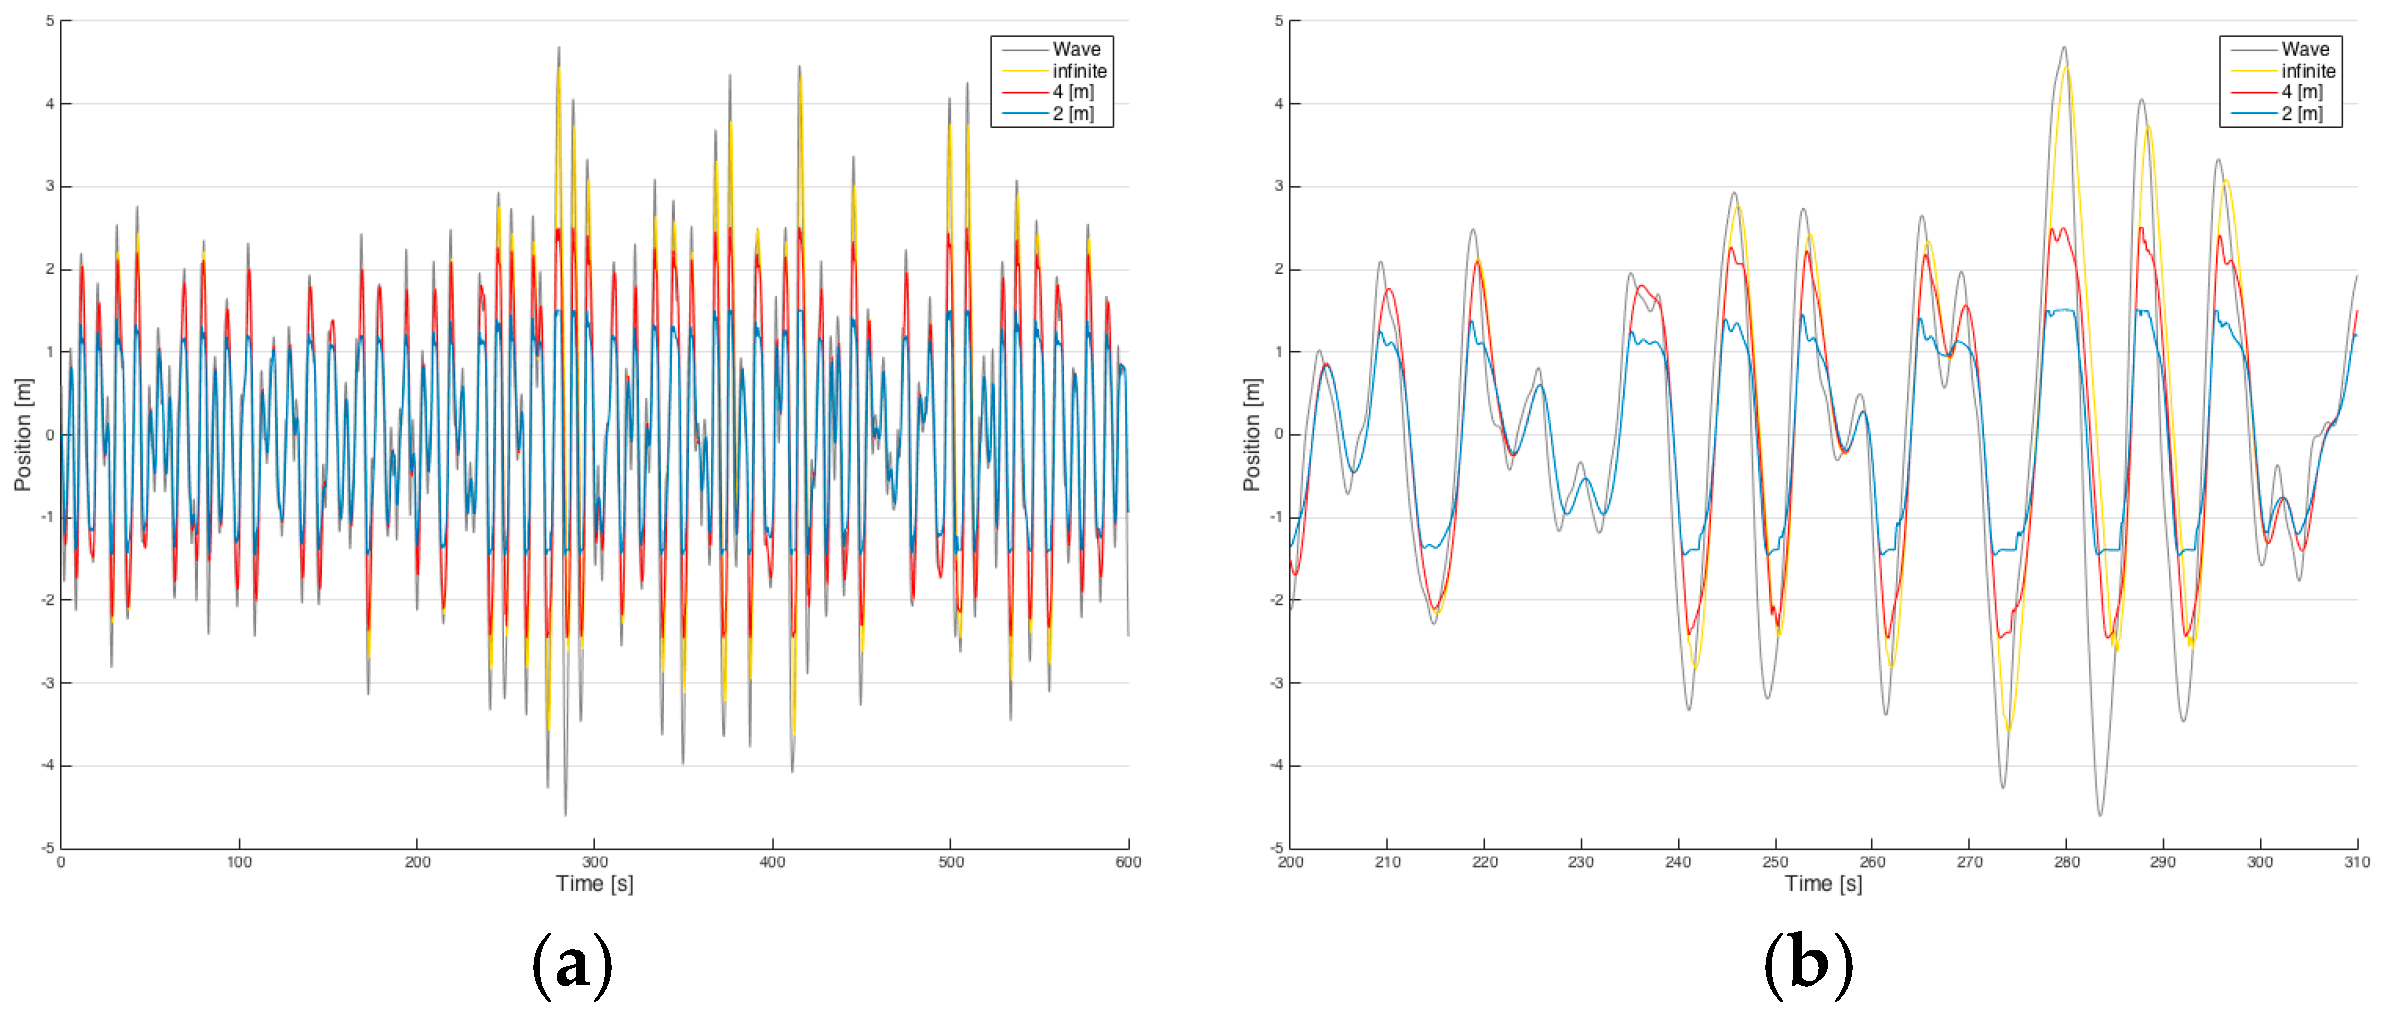
4.1. Consequences of a Limited Stroke Length

A powerful wave climate (Te = 9.5 s, Hs = 6.25 m) was first chosen in order to visualize the impact of a limitation of stroke length on the motion of the translator relative to the sea surface. Although this wave climate is one of the least frequently occurring at test Site 6 near Lysekil on the Swedish west coast [13] it is more common in less sheltered international waters.
The translator motion for three different stroke lengths is presented in Figure 4 together with the motion of the free water surface for comparison. Figure 4a shows a time span of 10 min while Figure 4b shows a time span less than 2 min for a more detailed view. The difference between a 2-m, 4-m, or infinite stroke length is clearly observed in the figures. As expected, the motion of the translator with a 2-m stroke is very constrained while the translator with infinite stroke length is free to follow the wave.
Judging from Figure 4, it can be expected that a limitation in stroke length will have a negative impact on energy absorption. This is illustrated in Figure 5, where the power profiles for the three cases are given in relation to the significant wave height. The energy period was held at a constant 5.5 s to clarify the reason for the different power levels. The figure shows how the 2-m case starts to diverge when the significant wave height rises above 2.75 m. The 4-m and infinite stroke length cases follow the same pattern up to a wave height of 5.75 m when they also start to diverge. In other words, as expected, as long as the translator’s motion is not hindered all three cases generate the same power.
Figure 5 is a simplified case, since the combinations of wave height and period are more complex in reality. Thus, in order to quantify the impact of stroke lengths in realistic cases one needs to look at all natural appearing combinations of wave height and period. With the purpose of studying the impact of different stroke lengths at different offshore sites three power matrices have been generated based on the sea states appearing at Site 6. The results are presented in Figure 6.
The top diagram of Figure 6 shows a power matrix resulting from limiting the stroke length to 2-m, the middle diagram shows the 4-m case, and the lower diagram shows the case where there is no limit to the motion of the translator. The presented values represent the average power during one hour at the corresponding sea state. Some common observations can be observed in the power matrices: (i) the average power is enhanced as the significant wave height increases. This is expected, and is explained by the higher excitation force brought by the more energetic waves; (ii) For identical significant wave heights the average power generally decreases as the energy period becomes longer. The average energy absorption is clearly confined by limits in stroke length, as seen in Case (a) and Case (b).
When comparing the power matrices of Case (a) and Case (b), a boundary can be observed that relates to the differences in stroke length. The boundary is marked as a red line in Figure 6b for the benefit of the reader. The values in the lower part of the diagram (b) matrix share identical values as in Figure 6a. However, the values in the upper part are significantly higher compared to the values in Figure 6a.
Similarly, in Figure 6c, a red boundary line is also marked. This line distinguishes the power production in Case (b) from Case (c). Here, it can also be observed that the values in the upper part of the matrix are higher for Case (c) while the values in lower part are the same.

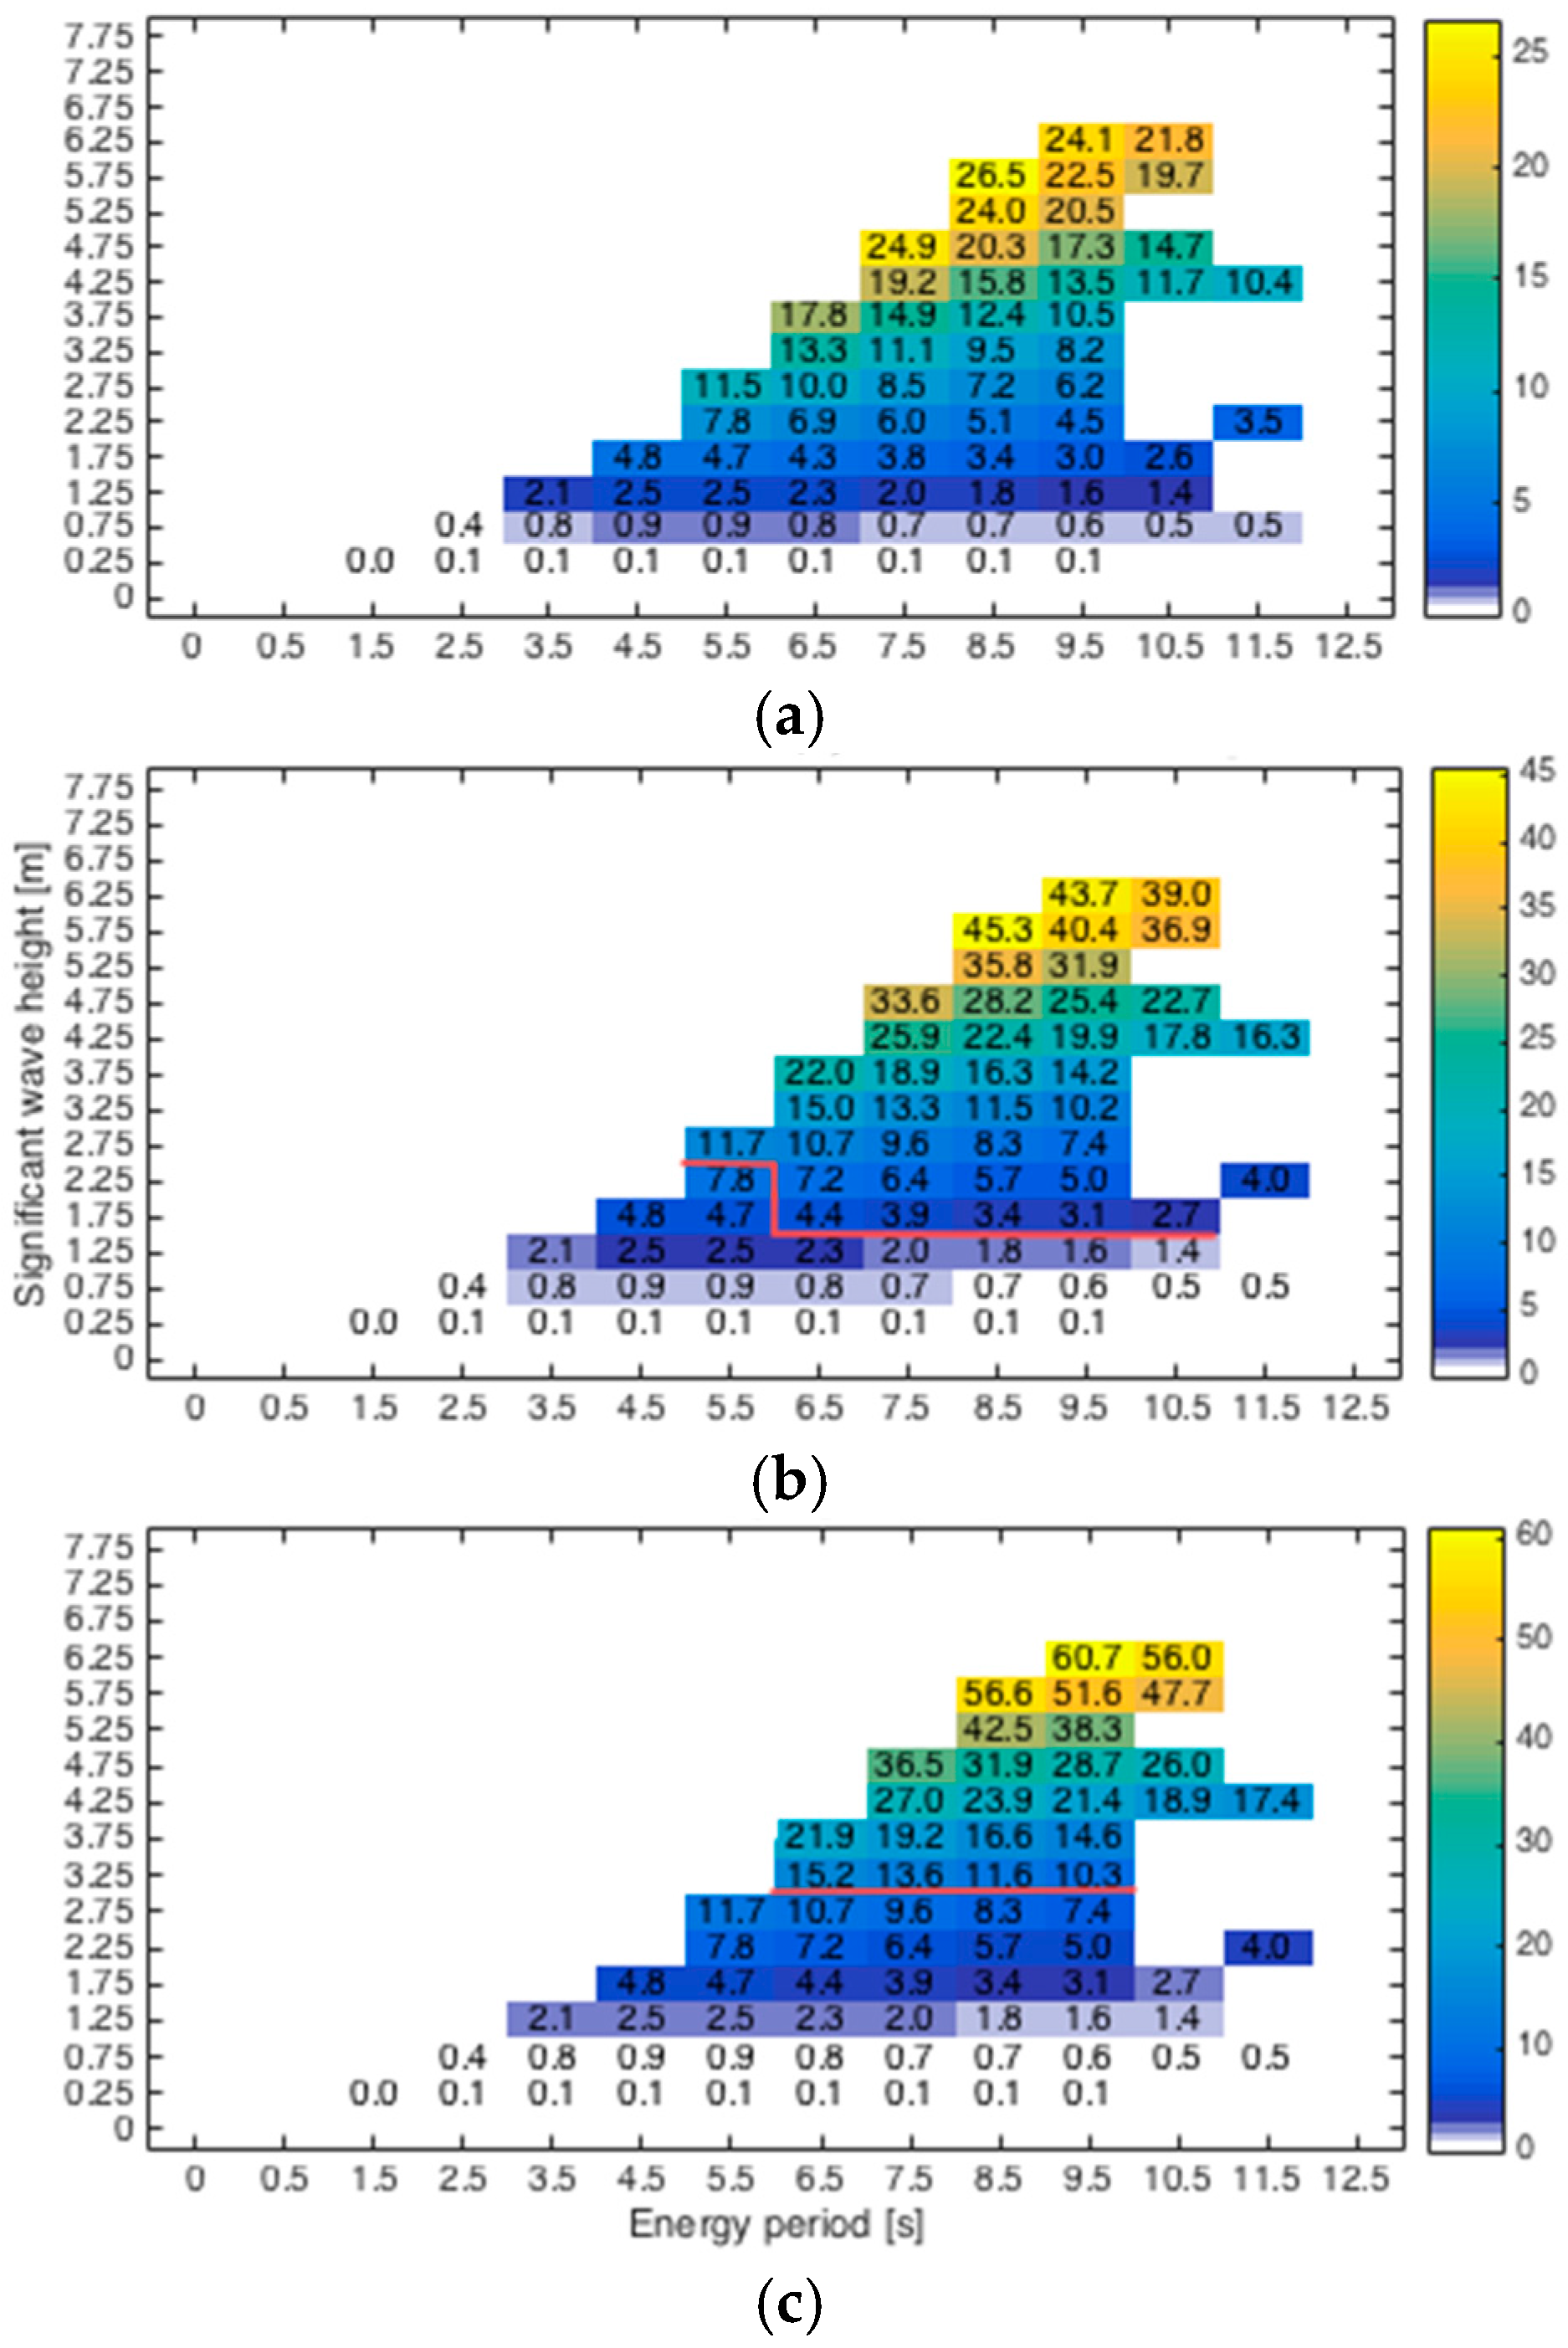
4.2. Other Test Sites

The wave climate varies greatly from site to site and Sweden is considered to have a mild climate from an international perspective. In order to study the energy absorption and the effects of limiting the stroke length to 4-m in international waters, two sites were chosen as references—one off the west coast of Scotland, and one off the coast of Chile. The annual sea state occurrence for both sites is displayed in scatter diagrams in Figure 7 and Figure 8, respectively.
The values in the scatter diagrams correspond to the average annual occurrence of the sea states in hours. The corresponding power matrices for the two sites are presented in Figure 9 and Figure 10. Multiplying the scatter diagrams with the power matrices and calculating the sum of the resulting values gives the annual energy production, (Table 2). In the table, the calculated energy production is based on a 4-m stroke length for the WEC. The energy conversion presented is from the waves to the power take off (PTO), i.e., the electrical transmission and later losses are not included.
The wave climate off the west coast of Scotland shows a larger variety of sea states compared with the wave climate at Site 6 off the coast of Lysekil, as shown in Figure 7. The significant wave height ranges from 0.25 m to 9.25 m and the energy period ranges from 5 s to 14 s. As for the wave climates at the west coast of Chile, shown in Figure 8, it is milder compared to the Scottish site but has the interesting characteristic of being relatively stable, i.e., less varying over time.

5. Discussion

The results presented in Figure 4 give a clear picture of the impact that a limitation of the stroke length has on the behavior of the linear generator of the WEC. Case (a) with a 2-m free stroke length is naturally most strongly affected. Technically, in the WECs, this limitation is achieved by end stops installed in the top and bottom of the generator enclosure. A large wave will drive the translator into the upper end stop where it will remain until the wave subsides after which the translator sinks by its own weight. A close look at the Figure 6 shows that the translator is not totally restricted by the length of 2-m. The reason is that the free stroke length is 2-m and the end stops are large springs allowing for another 0.5 m of movement. For Case (b), 4-m free stroke length, a longer stroke enables the translator to move a longer distance before hitting the end stops. However, during the largest waves this generator will also reach its limits. Case (c) shows how the translator would follow the waves if the generator had an unlimited stroke length. Looking further into the details of Figure 4 one can observe a small phase shift between the wave and the translator, and that even for Case (c) the translator’s range of motion is a little smaller than that of the wave. This is caused by the translator’s mass and the damping force of the generator.
The effects of a limited stroke on generated power were then investigated for the three studied cases, as shown in Figure 5. According to the figure the three cases exhibit the same pattern of power production until the wave height reaches approximately 2.7 m when the 2-m stroke length of Case (a) starts to have an effect on the absorption. The next threshold is reached at approximately 6.75 m where the 4-m case start producing significantly less power than Case (c). The purpose of this figure was to investigate, qualitatively, when a generator design of a certain stroke length starts producing less energy. The cost of upgrading to a generator with a longer stroke length should eventually be evaluated against both the decrease in energy absorption with a shorter stroke but also the risks associated with the larger and more frequent end stop forces that will occur. For the Lysekil case, i.e., Site 6 in Reference [19], the most energy relevant significant wave heights are around 2.25 m. Hence in this case, although the difference in energy production between Case (a) and Case (b) is quite large for powerful sea states, it would seem that the search for balance between the WEC cost and power production indicates that a 2-m stroke is sufficient. It is likely that a linear generator for Case (a) would be significantly cheaper compared to Case (b). Furthermore, it is meaningful to notice that the power production for Case (b) is not that much different from that of Case (c). This would seem to suggest that even for sites with very powerful wave climates, such as the studied west coast of Scotland, Case (b) might still be the more economic choice compared to, e.g., a generator with a 6-m stroke length.
However, since the results in Figure 5, due to the fixed energy period of the study, are only qualitative, more comprehensive studies are needed. This motivated the generation of the power matrices of Figure 6, Figure 9 and Figure 10.
In Figure 6b, a red boundary line was included to visualize how the power matrix of a 4-m stroke length differs from the 2-m case of Figure 6a. The diagrams seem to suggest that Case (b) is much more competitive than the Case (a), due to the large enhancement in power production associated with the longer stroke. However, the most relevant sea states in this case (Lysekil—test Site 6) are below the boundary line. Thus, from the perspective of annual energy production, the area above the boundary line does not seem to contribute to a significant degree. This is quantified in Table 3 where the annual energy production for the three cases is presented. An increase of stroke length from Case (a) to Case (b) improves energy production by 7%, and an increase from Case (b) to Case (c) improves it by another 1%. Hence, for the studied WEC and with linear damping one can conclude that a 2-m stroke length is probably the more economic choice for the studied site.
For each site where WECs are considered for deployment these types of studies are needed and power matrices such as the ones presented in Figure 6, Figure 9 and Figure 10 are important tools. The results show that the studied WEC is able to work in an environment with a wide range of sea states. Although the studied constant linear damping coefficient of 60 kN·s/m was chosen because it is a good compromise for the studies sea states and buoy size, other more advanced methods of control are likely to increase the energy absorption significantly. The presented results will thus provide a reference for future investigations on both the performance of linearly damped WECs in offshore experiments as well as studies on more advanced methods of control. Future research into this field should produce power matrices for more advanced WEC control, e.g., different types of active control [24], for the relevant buoy sizes and geometries, and associated generators.

6. Conclusions

The purpose with this paper was to investigate the impact of linear generator stroke length on energy absorption. The study was made by simulating a prototype WEC from the Lysekil project with three different stroke lengths and at three geographical locations with different wave climates. The results indicate that for the studied locations the 2-m stroke length is likely to be sufficient for Sweden, while the economic benefits of a longer stroke length is likely to dominate at the studied locations in Scotland and Chile. Future research should include more advanced control methods of the WECs, as well as in depth cost/benefit economic analyses.

Acknowledgments

The work was supported by SweGRIDS, KIC InnoEnergy-CIPOWER, Vetenskapsrådet, Statkraft AS, Fortum OY, the Swedish Energy Agency, Seabased Industry AB, Chinese Scholarship Council, Draka Cable AB, the Gothenburg Energy Research Foundation, Falkenberg Energy AB, Helukabel, Proenviro, ÅF Group, Vinnova, the Foundation for the Memory of J. Gust, Richert, the Göran Gustavsson Research Foundation, Vargöns Research Foundation, Swedish Research Council Grant No. 621-2009-3417 and the Wallenius Foundation.

Author Contributions

Yue Hong was responsible for the modeling results and wrote most of the article. Mikael Eriksson provided the theory for the modeling. Cecilia Boström helped with the correction of parts of the article. Rafael Waters supervised the project and helped with most of the correction.

Conflicts of Interest

The authors declare no conflict of interest.

References

  1. Leijon, M.; Boström, C.; Danielsson, O.; Gustafsson, S.; Haikonen, K.; Langhamer, O.; Strömstedt, E.; Stålberg, M.; Jan, S.; Svensson, O.; et al. Wave Energy from the North Sea: Experiences from the Lysekil Research Site. Surv. Geophys. 2008, 29, 221–240. [Google Scholar]
  2. Lejerskog, E.; Gravråkmo, H.; Savin, A.; Strömstedt, E. Lysekil research site, Sweden: A status update. In Proceedings of the 9th European Wave and Tidal Energy Conference, Southampton, UK, 5–9 September 2011.
  3. Ekström, R.; Kurupath, V.; Svensson, O.; Leijon, M. Measurement system design and implementation for grid-connected marine substation, Renew. Energy 2013, 55, 338–346. [Google Scholar]
  4. Bostrom, C.; Svensson, O.; Rahm, M.; Lejerskog, E.; Savin, A.; Stromstedt, E.; Engstrým, J.; Gravrýkmo, H.; Haikonen, K.; Waters, R.; et al. Design proposal of electrical system for linear generator wave power plants. In Proceedings of the 2009 35th Annual Conference of IEEE Industrial Electronics, Porto, Portugal, 3–5 November 2009; pp. 4393–4398.
  5. Castellucci, V.; Waters, R.; Eriksson, M.; Leijon, M. Tidal effect compensation system for point absorbing wave energy converters. Renew. Energy 2013, 51, 247–254. [Google Scholar] [CrossRef]
  6. Remouit, F.; Lopes, M.; Pires, P.; Sebastiao, L. Automation of subsea connections for clusters of wave energy converters. In Proceedings of the 25th International Ocean and Polar Engineering Conference, Kona, HI, USA, 21–26 June 2015.
  7. Baudoin, A.; Bostrm, C.; Leijon, M. Thermal Rating of a Submerged Substation for Wave Power. IEEE Trans. Sustain. Energy 2016, 7, 436–445. [Google Scholar] [CrossRef]
  8. Chatzigiannakou, M.A.; Dolguntseva, I.; Ekström, R.; Leijon, M. Offshore Deployment of Marine Substation in the Lysekil Research Site. In Proceedings of the 25th International Offshore and Polar Engineering Conference, Kona, HI, USA, 21–26 June 2015.
  9. Langhamer, O.; Wilhelmsson, D. Colonisation of fish and crabs of wave energy foundations and the effects of manufactured holes—A field experiment. Mar. Environ. Res. 2009, 68, 151–157. [Google Scholar] [CrossRef] [PubMed]
  10. Rahm, M.; Svensson, O.; Bostrom, C.; Waters, R.; Leijon, M. Experimental results from the operation of aggregated wave energy converters. IET Renew. Power Gener. 2012, 6, 149–160. [Google Scholar] [CrossRef]
  11. Hong, Y.; Hultman, E.; Castellucci, V.; Ekergård, B.; Sjökvist, L.; Elamalayil, S.D.; Krishna, R.; Haikonen, K.; Baudoin, A.; Lindblad, L.; et al. Status update of the wave energy research at Uppsala University. In Proceedings of the 10th European Wave and Tidal Conference, Aalborg, Denmark, 2–5 September 2013.
  12. Parwal, A.; Remouit, F.; Hong, Y.; Francisco, F.; Castellucci, V.; Hai, L.; Ulvgård, L.; Li, W.; Lejerskog, E.; Baudoin, A.; et al. Wave energy research at Uppsala University and the Lysekil Research Site, Sweden: A status update. In Proceedings of the 11th European Wave and Tidal Energy Conference (EWTEC), Nantes, France, 6–11 September 2015.
  13. Waters, R. Energy from Ocean Waves: Full Scale Experimental Verification of a Wave Energy Converter. Ph.D. Thesis, Uppsala University, Uppsala, Sweden, 2008. [Google Scholar]
  14. De, O.; Falcão, A.F. Wave energy utilization: A review of the technologies. Renew. Sustain. Energy Rev. 2010, 14, 899–918. [Google Scholar]
  15. Gardner, F.E. Learning experience of AWS pilot plant test offshore Portugal. In Proceedings of the 6th European Wave Energy Conference, Glasgow, UK, 29 August–2 September 2005; pp. 149–154.
  16. Elwood, D.; Schacher, A.; Rhinefrank, K.; Prudell, J.; Yim, S.; Amon, E.; Brekken, T.; von Jouanne, A. Numerical modelling and ocean testing of a direct-drive wave energy device utilizing a permanent magnet linear generator for power take-off. In Proceedings of the 28th International Conference on Ocean Offshore Arctic Engineering, ASME, Honolulu, HI, USA, 31 May–5 June 2009.
  17. Eriksson, M. Modelling and Experimental Verification of Direct Drive Wave Energy Conversion. Ph.D. Thesis, Uppsala University, Uppsala, Sweden, 2007. [Google Scholar]
  18. Eriksson, M.; Isberg, J.; Leijon, M. Hydrodynamic modelling of a direct drive wave energy converter. Int. J. Eng. Sci. 2005, 43, 1377–1387. [Google Scholar] [CrossRef]
  19. Hong, Y.; Eriksson, M.; Castellucci, V.; Boström, C.; Waters, R. Linear generator-based wave energy converter model with experimental verification and three loading strategies. IET Renew. Power Gener. 2016, 10, 349–359. [Google Scholar] [CrossRef]
  20. Waters, R.; Engström, J.; Isberg, J.; Leijon, M. Wave climate off the Swedish west coast, Renew. Energy 2009, 34, 1600–1606. [Google Scholar]
  21. Barstow, S.F.; Mørk, G.; Lønseth, L.; Mathisen, J.P.; Schjølberg, P. The role of satellite wave data in the WORLDWAVES project. In Proceedings of the 5th International Symposium on Ocean Wave Measurement and Analysis, Madrid, Spain, 3–7 July 2005.
  22. European Marine Energy Centre. Performance Assessment for Wave Energy Conversion Systems in Open Sea Test Facilities. 2004. Available online: http://www.emec.org.uk (accessed on 5 September 2016).
  23. Groenewoud, G.K.P.; de Valk, C.F. Nearshore Waveclimate: Methods and Validation of the Nearshore Branch of waveclimate.com. Available online: http://www.waveclimate.com/ (accessed on 5 September 2016).
  24. Hong, Y.; Waters, R.; Boström, C.; Eriksson, M.; Engström, J.; Leijon, M. Review on electrical control strategies for wave energy converting systems. Renew. Sustain. Energy Rev. 2014, 31, 329–342. [Google Scholar] [CrossRef]
Figure 1. Illustration of the wave energy converter (WEC) device developed in Lysekil Project: (a) one of the WEC prototypes L12 was assembled at the harbor; and (b) a simplified mechanical structure of a direct-drive type WEC device.
Energies 09 00730 g001
Figure 2. A solution example from the numerical model of differential Equation (1). In this case, the amplitude of the harmonic wave is 1 m and the period is 6 s with a sampling time of 0.1 s. The WEC is modeled with a translator mass of 5000 kg and a constant damping coefficient of 60 (kN·s/m).
Energies 09 00730 g002
Figure 3. Map and sea states at the test Site 6 studied by the Lysekil Project: (a) map presenting the location of the studied sites. The wave roses are placed with their center on the studied sites and show the distribution in time of the direction on incoming waves; and (b) combined scatter and energy diagrams for Site 6. Colors show annual energy transport per meter of wave front (kWh/year). Numbers give average occurrence in hours per year. These two figures are cited from a published research article [20].
Energies 09 00730 g003
Figure 4. The translator’s position with three different stroke length settings (2-m, 4-m and infinite): (a) with a 10 min time span; and (b) with a 1.5 min time span. The wave climate for (a) and (b) is Hs = 6.25 m, Te = 9.5 s.
Energies 09 00730 g004
Figure 5. The average generated power for three different stroke-lengths in relation to the significant wave height. The energy period is kept constant at 5.5 s.
Energies 09 00730 g005
Figure 6. Power matrices for three different stroke-lengths: (a) 2-m stroke length; (b) 4-m stroke length; and (c) infinite stroke length. The power matrices are obtained with a constant damping coefficient of 60 kN·s/m and a translator mass of 10 tons. The red line marks the difference to the preceding power matrix.
Energies 09 00730 g006
Figure 7. Scatter diagram of sea states on the west coast of Scotland (centre of area is at 57° N, 9° W). Numbers indicates occurrence in hours per year.
Energies 09 00730 g007
Figure 8. Scatter diagram of sea states on the west coast of Chile (centre of area is at 21°30′ S, 71°30′ W). Numbers indicates occurrence in hours per year.
Energies 09 00730 g008
Figure 9. Corresponding energy matrix in kW on the west coast of Scotland (centre of area is at 57° N, 9° W).
Energies 09 00730 g009
Figure 10. Corresponding power matrix in kW at the west coast of Chile (centre of area is at 21°30′ S, 71°30′ W).
Energies 09 00730 g010
Table 1. WEC specifications.
WEC SpecificationsValueUnit
Vertical stator length2000mm
Vertical translator length2000mm
Translator weight10,000kg
Buoy diameter4m
Buoy weight6300kg
Damping coefficient60kN·s/m
Stroke length2/4/infinitem
Table 2. The calculated annual energy production and average climate for three test sites.
ScotlandChileLysekil
Annual energy (MWh)65.5336.4220.84
Average climate (kW/m)66.6024.975.00
Table 3. The annual energy production at test Site 6 with three different stroke length settings.
2-m4-mInfinite
19.48 MWh20.84 MWh21.10 MWh

