Article

A Study of an Effective Heat-Dissipating Piezoelectric Fan for High Heat Density Devices

1
Department of Mechanical Engineering, Far East University, Tainan 74448, Taiwan
2
Department of Mechanical Engineering, National Cheng-Kung University, Tainan 70101, Taiwan
3
Department of Mechanical Engineering, Air Force Institute of Technology, Kaohsiung 82047, Taiwan
*
Author to whom correspondence should be addressed.
Energies 2016, 9(8), 610; https://doi.org/10.3390/en9080610
Submission received: 23 March 2016 / Revised: 25 July 2016 / Accepted: 27 July 2016 / Published: 3 August 2016

Abstract

:
Heat dissipation per unit volume has grown rapidly, as the size of modern electronic devices has continued to decrease. The air flow induced by an oscillating cantilever blade enhances the heat transfer performance of high heat density devices. The heat transfer improvement mainly depends on the velocity magnitude and distribution of air streams induced by the vibrating blade. Accordingly, this study numerically and experimentally examines the time-varying flow characteristics of a vibrating cantilever for five blade types. The blades are rectangular or trapezoidal with various widths and actuated at various frequencies. The fluid domain is numerically discretized using a dynamic meshing scheme to model the three-dimensional time-varying vibrating blade. The experiment utilizes nine hot-wire velocity meters to measure the average velocities. The flow structure with streamlines and velocity contours of the induced air flow are determined at various section planes. The results show that a major maximum-velocity region appears around the blade tip and that four minor local-maximum-velocity regions appear at the four corners. In addition, the width and width ratio of the blade significantly affects the velocity distribution of the flow induced by the vibrating cantilever blade.

Graphical Abstract

1. Introduction

As the size of modern electronic devices has continued to shrink, heat dissipation per unit volume has grown rapidly. Piezoelectric fans (piezofans) are commonly used to improve heat transfer performance under natural convective conditions due to their operational simplicity, small size, minimal noise emission and low power consumption. Such fans are composed of a thin flexible blade and a piezoelectric patch and are actuated by a periodically-alternating electric voltage at the resonance frequency. The cantilever blade vibrates between two extreme locations, inducing an air flow stream in alternate directions. This results in the downstream flow changing periodically on opposite sides.
Toda [1,2] was the first to perform a theoretical and experimental investigation of the flow field induced by a vibrating Polyvinylidene fluoride (PVF2) bimorph plate. Since then, many studies experimentally examined the performance of heat transfer enhancement under the actuation of a piezofan [3,4,5,6,7]. Some numerical studies were performed to investigate the flow fields and heat transfer performance of piezofans [8,9,10,11,12,13,14,15,16]. Their results revealed that the average maximum heat transfer augmentation and local maximum heat transfer augmentation can be increased by about 100% and 350%, respectively. Lin [14,15] utilized a three-dimensional numerical model to examine the flow field and heat transfer performance under the actuation of a piezofan and presented the flow structure of the flow streams while the induced air stream was incident on the heated surface. His results revealed the mechanism of the induced flow for the improvement of heat transfer performance under the free convection condition for both rectangular and circular cylindrical heat sources. He found that the average heat transfer augmentations are about 1.6–3.6-fold for a flat-plate heat source and about 1.2–2.4-fold for the cylindrical heat source, with good agreement between numerical and experimental results.
In general, the heat transfer improvement achieved by the actuation of a piezofan depends on the clearance between the fan tip and the heat source, the vibration amplitude of the fan tip and the applied vibration frequency. Most previous studies focused on the effects of the operating parameters. Yoo et al. [17] used lead zirconate titanate to test several shapes of piezofans to examine the maximum fan tip displacement. They found a correlation between air velocity and the applied voltage. Their results indicated that the ceramic bimorphs on a rectangular blade shape produced a highest maximum tip displacement of 35.5 mm under an input of 220 Volts and 60 Hz. Liu et al. [6] examined the heat transfer performance of piezofans with six different dimensions and proposed a correlation between the heat transfer augmentation ratio and the dimensions of piezofans. The results showed that the heat transfer performance increased with increasing width of the piezofan. Recently, Shyu and Syu [18] used a finger-like piezofan in a plate-fin array to cool a heat sink. The heat transfer performance was better than that of rectangular blades. Most previous studies presented the heat transfer performance and flow field for rectangular piezofans. The heat transfer performance is significantly affected by the velocity of the flow generated by the piezofan [19]. The present study examines the flow characteristics of a piezofan under its first resonant vibration mode for the rectangular and trapezoidal blades with various widths. Five blade types are examined in this work; three rectangular with different widths and two trapezoidal blades with divergent and convergent shapes, respectively.

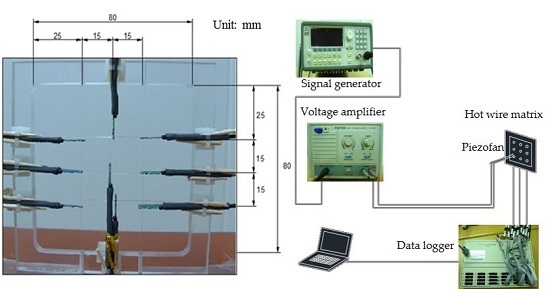
2. Experimental Procedures

A piezofan is composed of a thin flexible blade and a piezoelectric ceramic. The piezoelectric ceramic has dimensions of 29 mm × 12.7 mm × 0.5 mm (length × width × thickness) and is commercially available, packaged with electric cords (Piezo Systems, Inc., (Woburn, MA, USA)). The length of the blade is 51 mm with an overlap of 4 mm attached to the piezoelectric ceramic, resulting in a total length of 76 mm. Schematic diagrams and dimensions of the five blade types are shown in Figure 1 and Table 1, respectively. Five sheets made of PVC or PET with different thicknesses were used as the blades for each type of piezofan to create the different resonance frequencies; thus, a total of 25 piezofans were tested in the experiment. A sinusoidal voltage with a specified resonance frequency was generated by a signal generator (PICOTEST G5100A) for each piezofan. The signal was fed to a voltage amplifier (PINTEK HA-405) to drive the piezoelectric ceramics. The amplitude of the vibration blade was adjusted via the amplification ratio.
Nine hot-wire velocity sensors were constructed as a measurement matrix to examine the average velocity magnitude downstream of the piezofan. The distance between the fan tip and the matrix is defined as d; it was 6.35–76.2 mm, adjusted using a movable platform. The velocity sensors were arranged as a 3 × 3 matrix, with a separation distance of 15 mm between sensors, as shown in Figure 2a. Therefore, the effective measurement area was 45 mm × 45 mm. The test section was enclosed in a cubic box, whose dimensions were 750 mm × 750 mm × 750 mm, to reduce the influence of environmental air streams. The experimental setup is schematically shown in Figure 2b.
The velocity sensors used in the measurements were made by Degree Controls, Inc. (Milford, NH, USA). Their accuracy is 10% in the measurement range of 0.15–0.75 m/s and 0.04 m/s in the measurement range of 0.76–5 m/s. The resolution of the velocity data logger (Degree Controls, Inc., ATM24) is within 1%, which results in an experimental uncertainty of less than 15% [20]. The response of the hot-wire velocity meter corresponded to one second, which is insufficient to measure the time-varying stream induced by a piezofan vibrated at 20–50 Hz; thus, the measured velocity is a time-averaged magnitude of the velocity in the experiment.

3. Theoretical Analysis

3.1. Governing Equations

As a blade vibrates periodically, the flow velocity varies over time. Accordingly, the continuity equation and momentum equation are solved in transient form and given as:
ρ τ + x i ( ρ u i ) = 0
τ ( ρ u i ) + ρ x j ( u i u j ) = p x i + x j [ μ e f f ( u i x j + u j x i 2 3 δ i j u i x i ) ] + x j ( ρ u i u j ¯ )
In the simulations, the k-ω two-equation model is used, since this model is known to provide a superior representation of the viscous near-wall region and the effects of streamwise pressure gradients in boundary layer flow [21]. The turbulent kinetic energy and turbulent frequency equations are given as follows:
τ ( ρ κ ) + x j ( ρ κ u i ) = x j ( Γ κ κ x j ) + G κ Y κ
τ ( ρ ω ) + x j ( ρ ω u i ) = x j ( Γ κ ω x j ) + G ω Y ω
where G κ represents the generation of turbulent kinetic energy due to the mean velocity gradient; G ω represents the generation of ω ; Γ κ and Γ ω represent the effective diffusivities of κ and ω , respectively; and Y κ and Y ω represent the dissipations of κ and ω due to turbulence, respectively. Note that several turbulence models were tested in order to evaluate their ability to yield an accurate and convergent solution for the piezofan vibration; the Shear Stress Transport (SST) SST k-ω model was adopted in the simulation based on the results.
Because the boundaries of the computational domain are a free surface, the pressure boundaries are considered at these surfaces. The surface at the base plane of the piezofan is assumed to be the pressure inlet boundary condition due to the flow direction of induced stream mainly along the blade base to the blade tip, and the remaining surfaces are considered as the pressure outlet boundary condition. Note that the pressure boundary allows the airstream to inflow or outflow on the boundaries simultaneously, depended on the momentum of the airstream. The pressures on all of the surfaces of the computational domain are considered as zero gauge pressure. The turbulence intensity is assumed to be 10% at the boundary to simulate the surrounding perturbation. In addition, the surface of the piezofan is a no-slip wall boundary condition.
A maximum shape deformation placement function is utilized to describe the flexible blade, which was modeled as a thin slender beam. Thus, the maximum shape deformation of each point along the vibrating blade was described by the following polynomials [14,15]:
F 1 ( x ) = a 2 ( c 0 + c 1 x + c 2 x 2 + c 3 x 3 )  for  0 x L 1
F 2 ( x ) = a 2 ( c 4 + c 5 x + c 6 x 2 + c 7 x 3 + c 8 x 4 )  for  L 1 x L 2
Note that the constants used in the above equations have the following values:
L 1 = 29  mm ,   L 2 = 76  mm
c 0 = 8.772 × 10 6 , c 1 = 1.819 × 10 5 mm 1 , c 2 = 7.000 × 10 5 mm 2 , c 3 = 4.763 × 10 7 mm 3 , c 4 = 1.159 , c 5 = 9.419 × 10 2 mm 1 , c 6 = 2.567 × 10 3 mm 2 , c 7 = 2.488 × 10 5 mm 3 , c 8 = 9.371 × 10 8 mm 4
where a is the amplitude of the fan tip, specified to be 12.7 mm, and L1 and L2 are the patch length and total fan length, respectively. The stiffness of the various types of blades for each shape is slightly different, resulting in different resonance frequencies and different deformation curves of the piezofans. The errors of the calculated average velocity based on Equations (5) and (6) are less than 1.0% by adopting the above coefficients c 0 c 8 . Therefore, the coefficients are used for all cases in these calculations. In this study, the base width of the piezofan is considered as the characteristic length. Thus, the dimensionless amplitude of the fan tip, α , is defined as a/wo, and the dimensionless distance from the blade tip, δ, is defined as d/wo.
The instant displacement of the blade is expressed as sin(2πfτ) due to the input signal being a sinusoidal voltage. Thus, the deformation and instant velocity of each point of the piezofan are computed as:
x k = F ( x ) sin ( 2 π f τ )
u k = F ( x ) 2 π f cos ( 2 π f τ )
where F ( x ) = F 1 ( x )  or  F 2 ( x ) .
The primary quantity in the present study is the average velocity of the fan tip at a specific area. The velocity, V k , is firstly integrated over the calculated area at each time step. The final average velocity, V ¯ , is calculated by averaging the velocity over a complete vibration cycle. The equations are as follows:
V k = A i   u k d A A s
V ¯ = 1 φ ( τ τ + φ V k d τ )
where As is the specified measured area, which is 45 mm × 45 mm in this study, and φ is the period of each specified frequency.

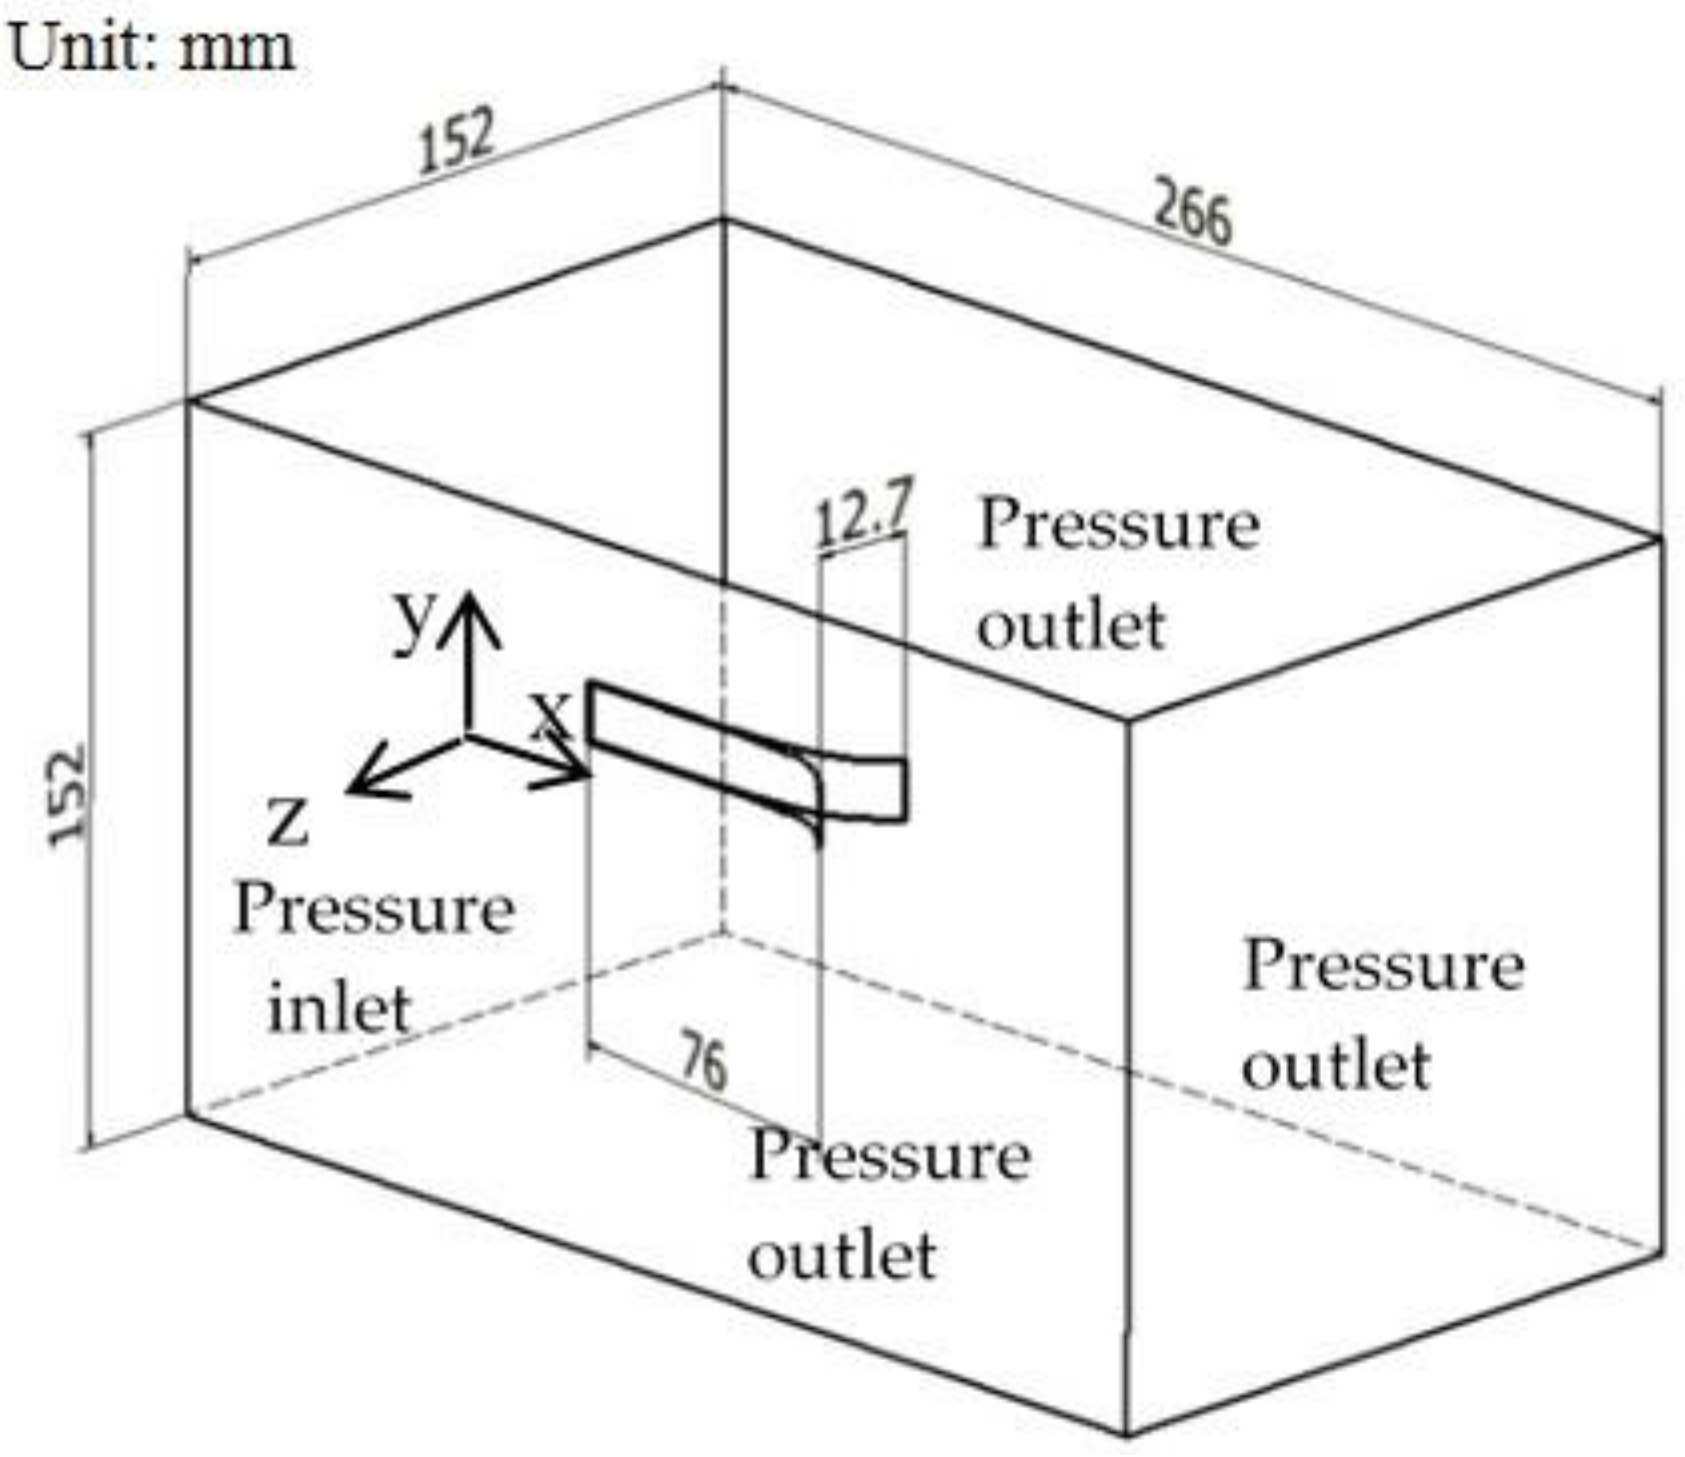
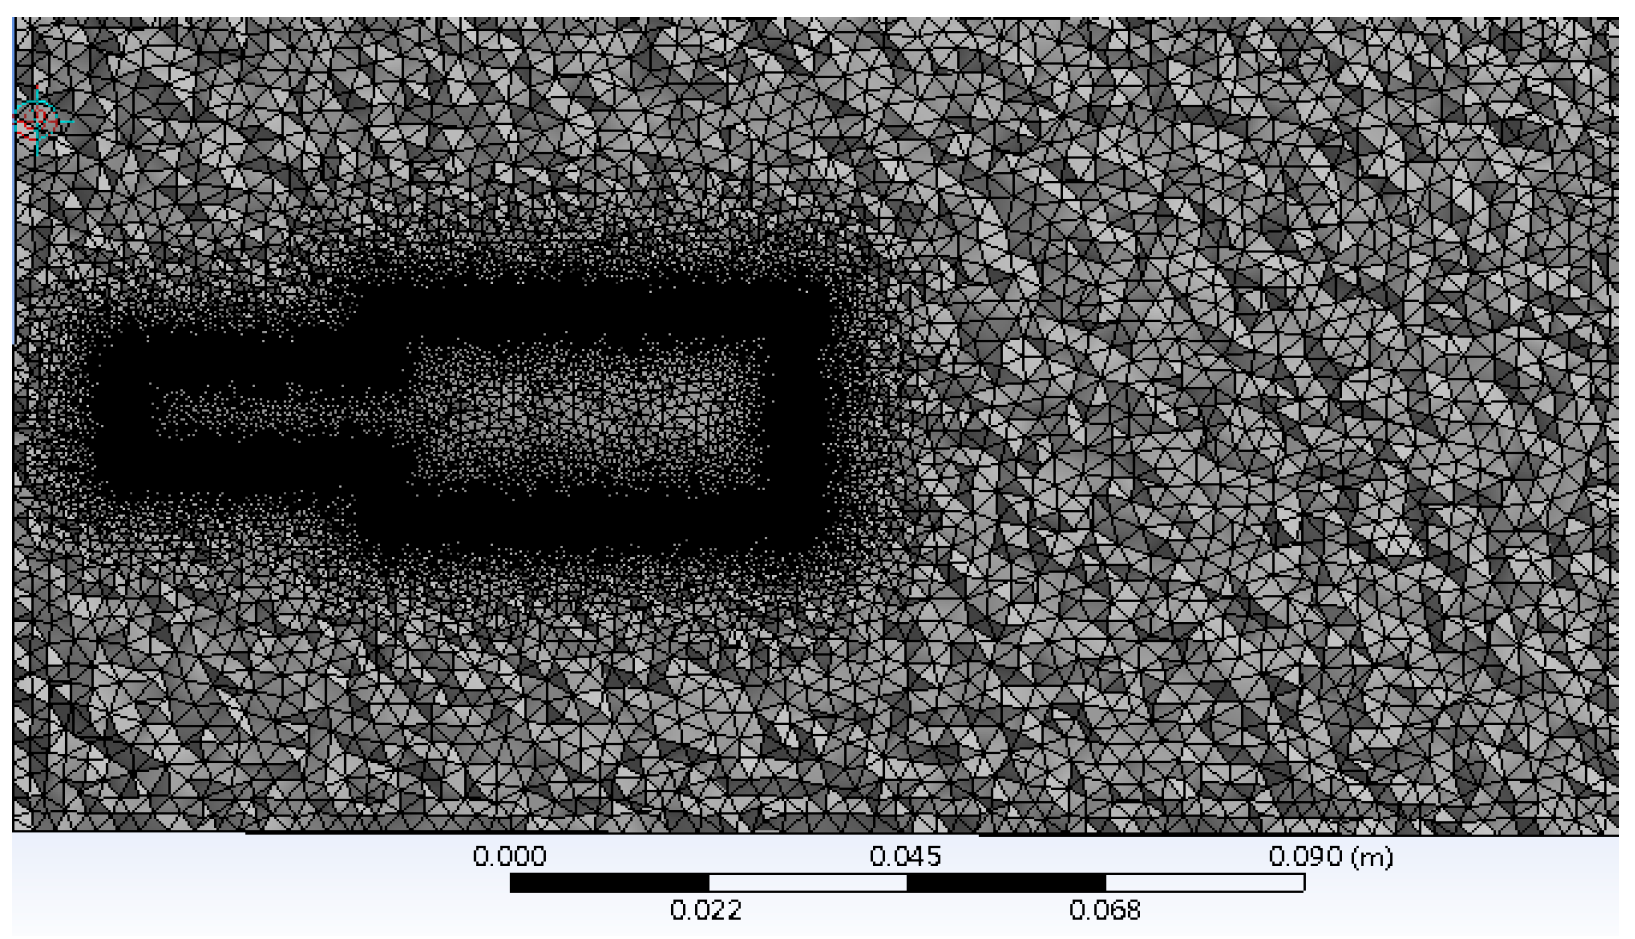
3.2. Numerical Method

Figure 1 displays the dimensions of the five piezofans. The computational domain has dimensions of 266 mm × 152 mm × 152 mm, as shown in Figure 3. The simulations performed in this study consider four resonance frequencies for the vibrating piezofans, namely 20, 30, 40 and 50 Hz, respectively, which correspond to periods of 0.050 s, 0.033 s, 0.025 s and 0.020 s, respectively. Each vibration period is evenly partitioned into 80–100 time steps. The location and displacement of each position along the length of the blade are calculated at each time step according to Equations (5)–(7). To perform the time-varying geometry and location of the piezofan, a dynamic mesh scheme is developed as a sophisticated user-defined function (UDF) implemented in the commercial FLUENT code to describe the movement velocity of the vibrating blade. Accordingly, the velocities of the flow stream were interpolated to fit the location of the new mesh after each time step.
The grid cells at the fan tip experience significant deformation as the blade vibrates. As a result, the region of the computational domain adjacent to the fan tip is mapped with a fine grid structure in order to ensure numerical convergence. The remainder of the domain is mapped with a coarser structure in order to minimize the overall computational cost. Take Piezofan B as an example; Figure 4 shows that the total grid number is about 3,240,000, with about 1,000,000 grids around the fan blade. In the grid independence test, the computational domain was discretized using three meshing schemes comprising 2,702,347, 3,241,974 and 3,890,521 grids for Piezofan B, respectively. The average grid sizes are about 0.80, 0.76 and 0.72 mm for the three grid systems, respectively. Note that the grid system is rearranged at each time step due to the deformation of the piezofan, so the above grid numbers are the original established quantities. Grid independence was tested by ensuring that the maximum difference among the three simulated values of the average velocity deviated by no more than 2%. For each meshing scheme, the average velocities at a dimensionless distance of 0.5 were found to be 0.5097, 0.5056 and 0.5024 m/s, respectively. A numerical uncertainty analysis was performed by using the Richardson extrapolation method [22]. Based on the calculated convergence average velocity of 0.4929 m/s, the three grid systems were found to have numerical uncertainties of 3.4%, 2.6% and 1.9%, respectively.
Since the induced air flow velocity varies periodically, the pseudo steady state solution was obtained while the relative error ( | ( V n ¯ V n 1 ¯ ) / ( V n ¯ ) | 1 × 10 4 ) was satisfied for every calculated time step within one complete vibration period. The convergence of the velocity was examined at distances of δ = 0.5 and δ = 4 from the blade tip; the relative errors must be satisfied simultaneously. Note that the average velocity is computed at a square area of 45 mm × 45 mm in the normal direction from the blade tip. The variations of velocity with the time step for Piezofan C under a resonance frequency of 40 Hz are displayed in Figure 5a, where every time step is equal to 0.00025 s. The average velocities are about V ¯ = 0.624 and V ¯ = 0.118 m/s for distances of δ = 0.5 and 4, respectively. Figure 5b shows the variation of the average velocity for every complete period with the time step. The velocity fluctuation is about ± 0.028 m/s, ( ± 4.5 % ), at a distance of δ = 0.5. The calculation needs about 70–110 vibration periods to achieve convergent results.

4. Results and Discussion

Figure 6 displays the streamlines released from the blade edges and the tip of the vibration blades under a resonance frequency of 40 Hz. The initial velocity of the released stream increases with increasing blade position along the blade base to blade tip. As the streamlines leave the blade edges, they form a pair of counter-rotating screw-type jet-like streams and flow along the longitude direction of the piezofan. When they move toward the neutral positions, as shown in Figure 6a, they concentrate in front of the blade tip. In contrast, the streamlines became widespread when they moved to the extreme displacement position (Figure 6b). A close inspection of Figure 6a indicate that most of the streamlines are dragged by the moving blade and flow backward to the side surfaces of the blades, resulting in a circulation flow for Piezofans A, B, C and D. Note that, if a heat source (such as a heated cylinder or a heated plate) is placed in front of the piezofan, the circulation flow will be broken [14,15,19] due to the clearance between the heat source and fan tip being smaller than the circulation zone. This recirculation flow did not appear for Piezofan E due to the blade with the trapezoidal convergent shape inducing flow that contracted to a narrow region around the tip, eliminating recirculation. Figure 6b shows that no circulation appears ahead of the blade tip for all piezofans. The streamlines flow straight along the tangent direction of the blade edges and spread over the front of the tip due to the blade shape having the maximum deformed curve at the extreme position.
Figure 7a–d displays the velocity contours at the central plane, y = 0, of the cantilevers for a complete vibration period for Piezofan B. The velocity of the air stream induced by the vibrating cantilever at the neutral positions is greater than that at the points of extreme blade displacement due to the blade having the maximum moving velocity at the neutral positions. The maximum velocity appears at the region behind the moving blade tip; the stream is induced by the drag force of the oscillation cantilever. Figure 7e–h shows the velocity contours for the contracted trapezoid shape (Piezofan E). Compared to the velocity contours of Piezofan B, the region of velocity greater than 0.2 m/s is smaller and contracted in the front of the blade tip. This confirms that flow circulation (shown in Figure 6) did not appear for the contracted trapezoid blade shape.
The cross-section velocity contours of the x-axis for the five piezofans are shown in Figure 8. These contours were obtained at a dimensionless distance of δ = 0.5 from the blade tip. Because the vibrating direction of the blade is along the z-axis, the velocity contours extend horizontally. Figure 8a shows that the maximum velocity regions are just behind the moving blade tip when the blade moves toward the neutral positions. In contrast to Figure 8a, the maximum-velocity regions are not so obvious when the fan tip moves to the maximum displacement in the positive z-direction (Figure 8b) due to the movement velocity of the blade approaching zero. Although the maximum velocity occurs around the central region, four minor high-velocity regions appear at the corners, i.e., around the extreme displacement locations of the moving blade. The velocity contours at a distance of δ = 2 are shown in Figure 9. The streams spread more widely since they leave farther from the piezofan, like the velocity distribution of a jet flow. The strength of flow decreases along the positive x-direction, resulting in the velocity magnitudes being smaller than those shown in Figure 8. The four minor high-velocity regions at the four corner are more obvious than those in Figure 8. In addition, the velocity of the streams around the central region diverges more quickly than that of those at the four corners. For Piezofan A, the velocity decreases rapidly with the increasing of the distance from the fan tip.
Because the air flow induced by the vibrating blade is a time-varying flow field, the strength of flow is mainly dominated by the movement velocity of the blade at each location in every period. The major flow at the central region in front of the fan tip resulted from the dragging effect of the fan tip [19]. This maximum-velocity region changed location and oscillated horizontally as the blade tip periodically vibrated. The strength of the flow decreased with increasing distance from the fan tip, as mentioned above. In contrast, the strength of the minor flow at the corner decreased more smoothly than that of the main flow. The four local minor flows in the corners are produced by the screw-type flow from the blade edges; the flows extended widely due to the large deformation of the blade. Note that the local maximum-velocity regions are less obvious for Piezofan E due to its blade having a convergent shape, resulting in the streamlines being more concentrated around the center region compared to those of other shapes. The blade with a contracted shape (piezofan E) is thus the better for hot spots heat source than those with divergent and rectangular shapes.
The turbulence intensities, I, at the fan tip plane and middle plane of the piezofans are displayed in Figure 10. The turbulence intensity is strongest around the fan tip due to the greater displacement there. The distributions of the turbulence intensity around the fan tip are similar to those of the velocity contours shown in Figure 8a. This reveals that turbulence intensity coincides with velocity distribution around the fan tip.
Figure 11 displays the average velocity varying with the distance from the fan tip along the neutral direction of the blade (positive x-direction). The average velocity was calculated from the grid data within a square area of 45 mm × 45 mm in front of the fan tip. The resonance frequencies used in the numerical simulation are 20, 30, 40 and 50 Hz, respectively. As expected, the velocity decreases with increasing distance away from the fan tip and increases with increasing resonance frequency. The average velocity of the streams decays steeply at a short distance, about 20 mm (δ = 1.5), from the blade tip, and then decreases smoothly at a large distance from the blade tip. The velocity distribution variation with the distance from the blade tip is similar to that of a jet-like flow, but decreases more rapidly. The experimental results are also presented in Figure 11 to validate the accuracy of the numerical results. The trends of the numerical results are consistent with those of the experimental measurements. The velocities obtained in the experiment are all greater than those of the numerical results. The deviations are 2%–35% for Piezofan A, 5%–25% for Piezofan B, 3%–38% for Piezofan C, 2%–33% for Piezofan D and 2%–32% for piezofan E, respectively. Note that the resonance frequencies used in the experiment for each piezofan cannot be completely the same as the numerical simulation. They depend on the dimensions of the blade and the composite stiffness of the fan blade with the piezoelectric ceramics. Among the five piezofans, Piezofan E (D) had the highest (lowest) resonance frequencies for the given blade material. Accordingly, the resonance frequency increases with decreasing width ratio, W2/W1.
Figure 12 shows the average velocity distribution along the axis of the piezofan for the five fan types at a resonance frequency of 40 Hz. Piezofan C (A) has the highest (lowest) velocity distribution. In general, a blade with a larger width has a larger average velocity, and the divergent shape is better than the convergent one. Figure 12 shows that the velocity of Piezofan D is slighter greater than that of Piezofan E, but most of the streams released from Piezofan E are confined within a concentrated region ahead of the blade tip. Accordingly, the performance of Piezofan E is similar to that of Piezofan D in the calculated area. Even though Piezofans B, D and E have the same magnitude of blade area, the velocity distribution of Piezofan B is greater than those of Piezofans D and E at a short distance from the fan tip and smaller at a farther distance.

5. Conclusions

This study numerically and experimentally investigated the flow characteristics of five vibrating blades under their major resonance frequencies. Based on the results, the following major conclusions are drawn:
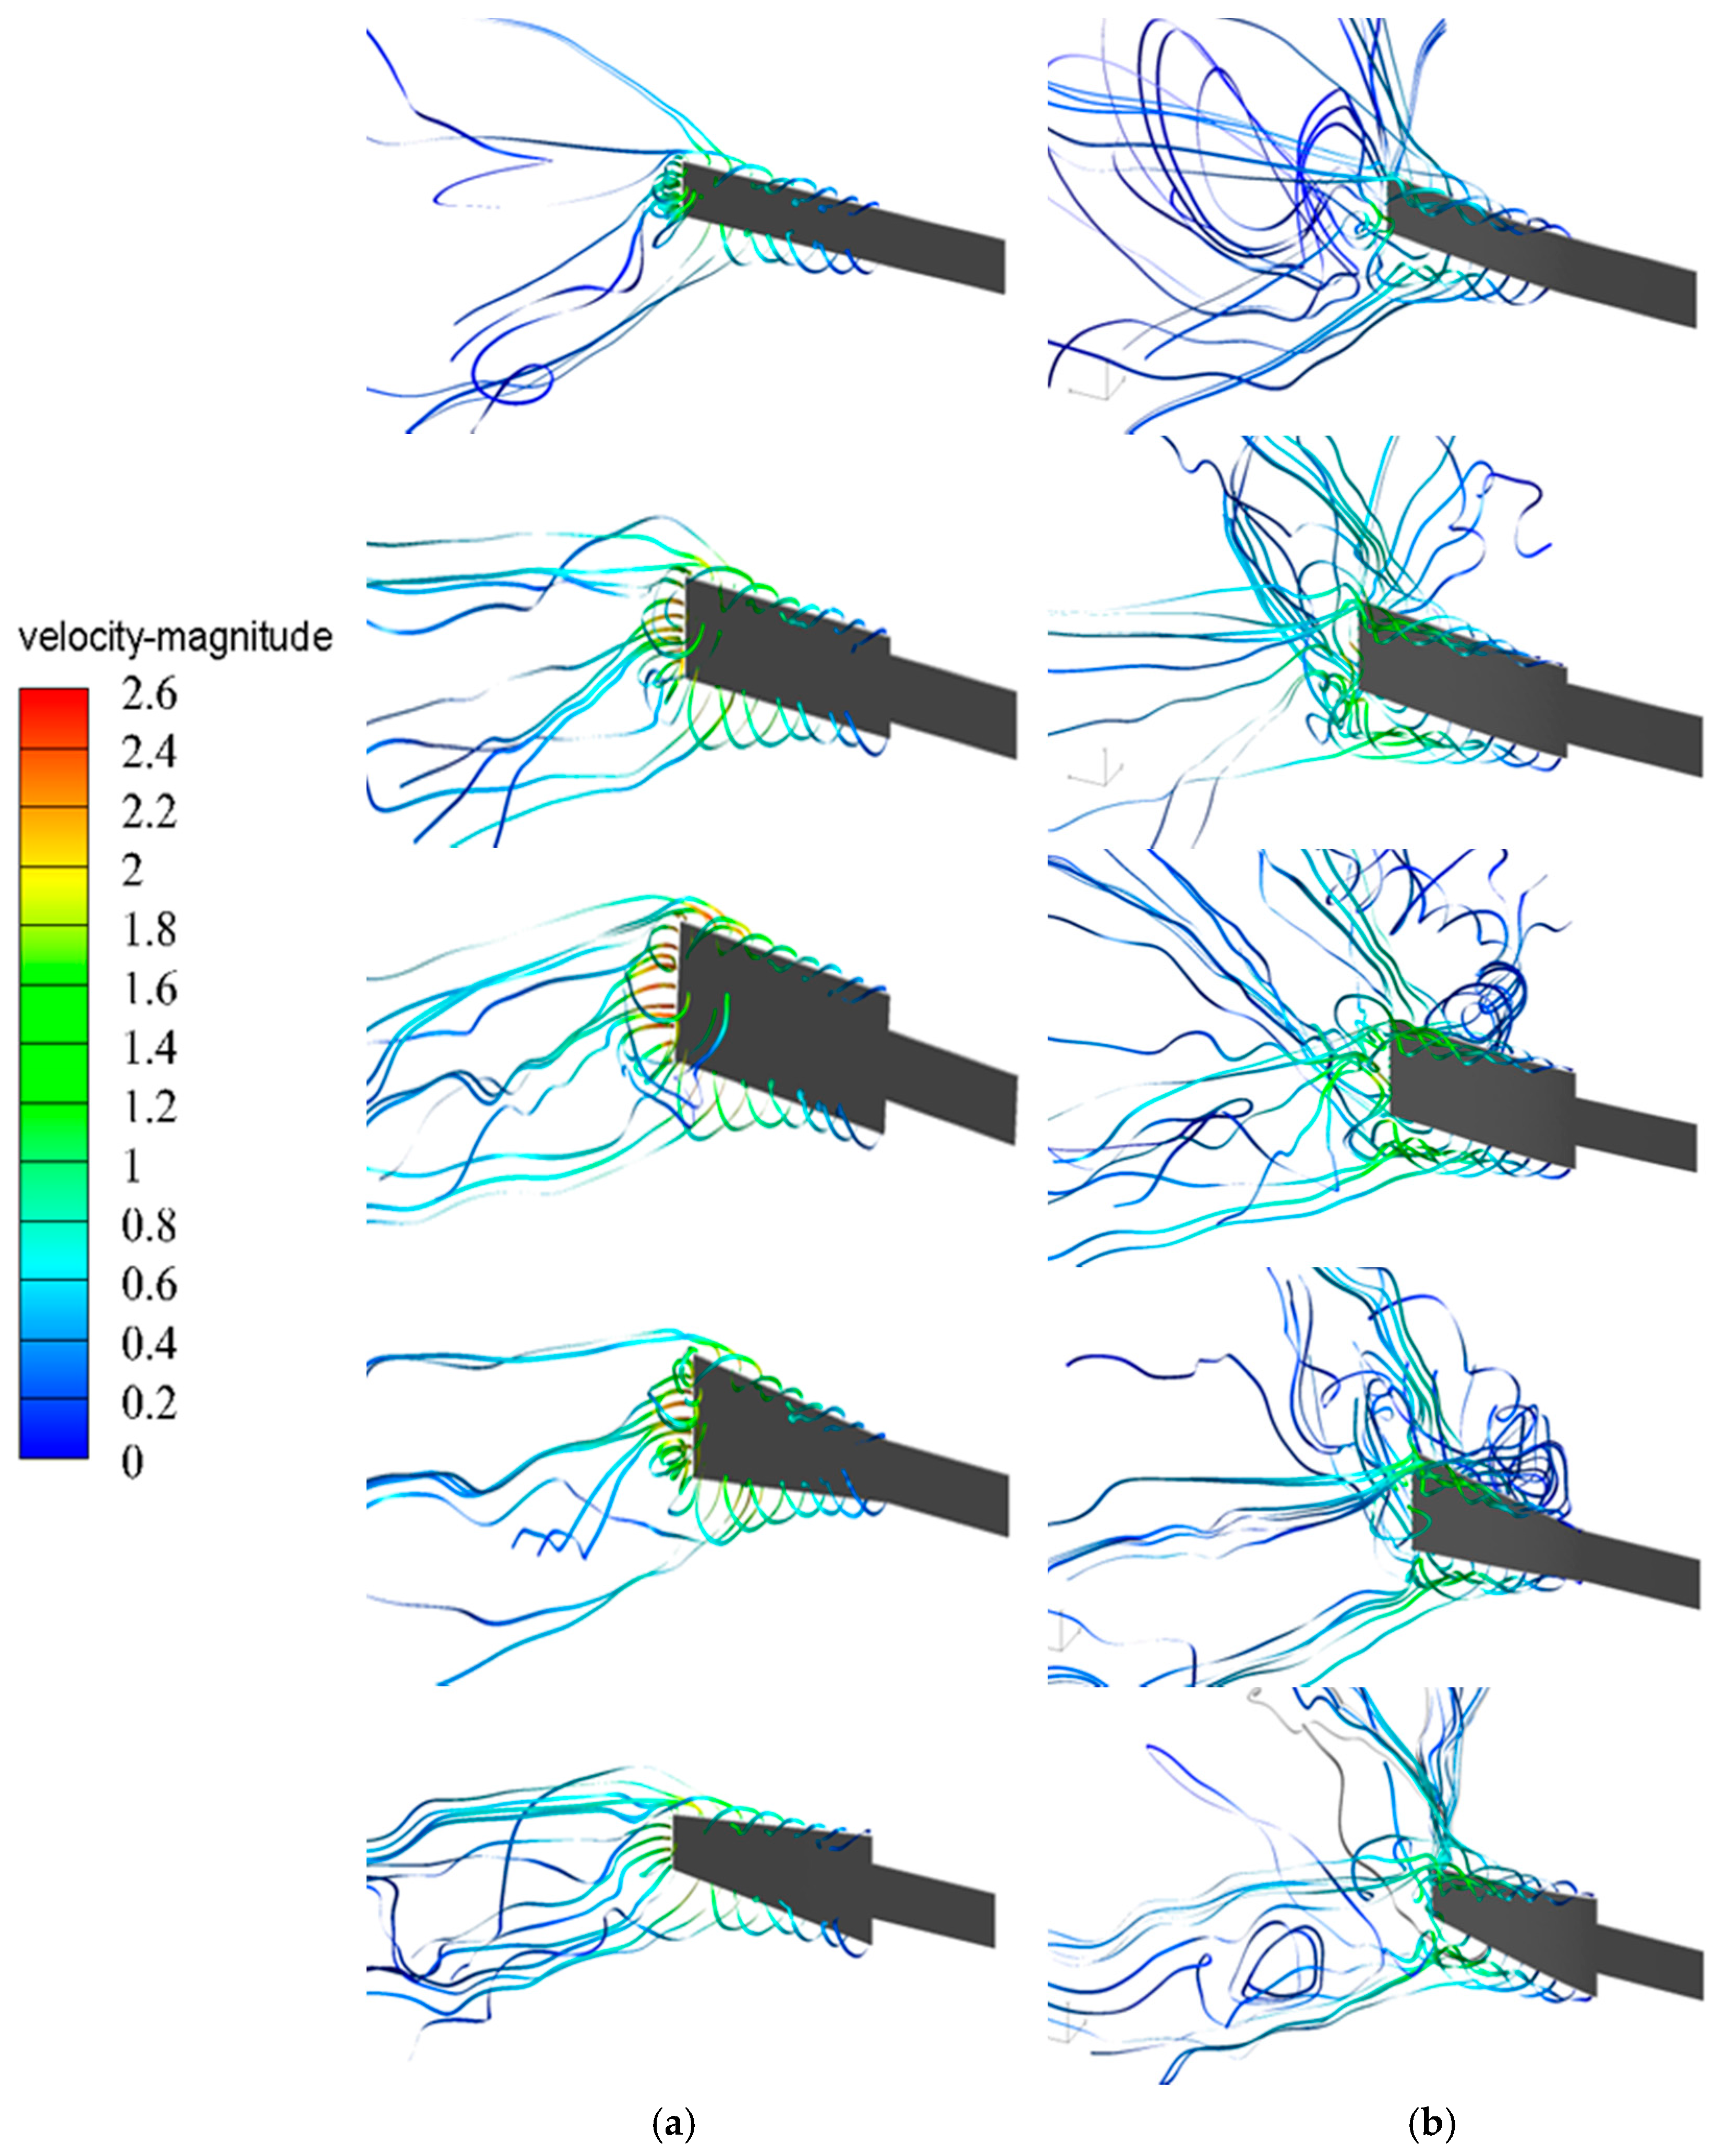
  • While the vibrating blade moves toward the neutral position, most of the streamlines released from the piezofan are dragged by the moving blade and flow back to the side surface of the piezofans for Piezofans A, B, C and D. However, this phenomenon does not occur for the contracted blade shape (Piezofan E).
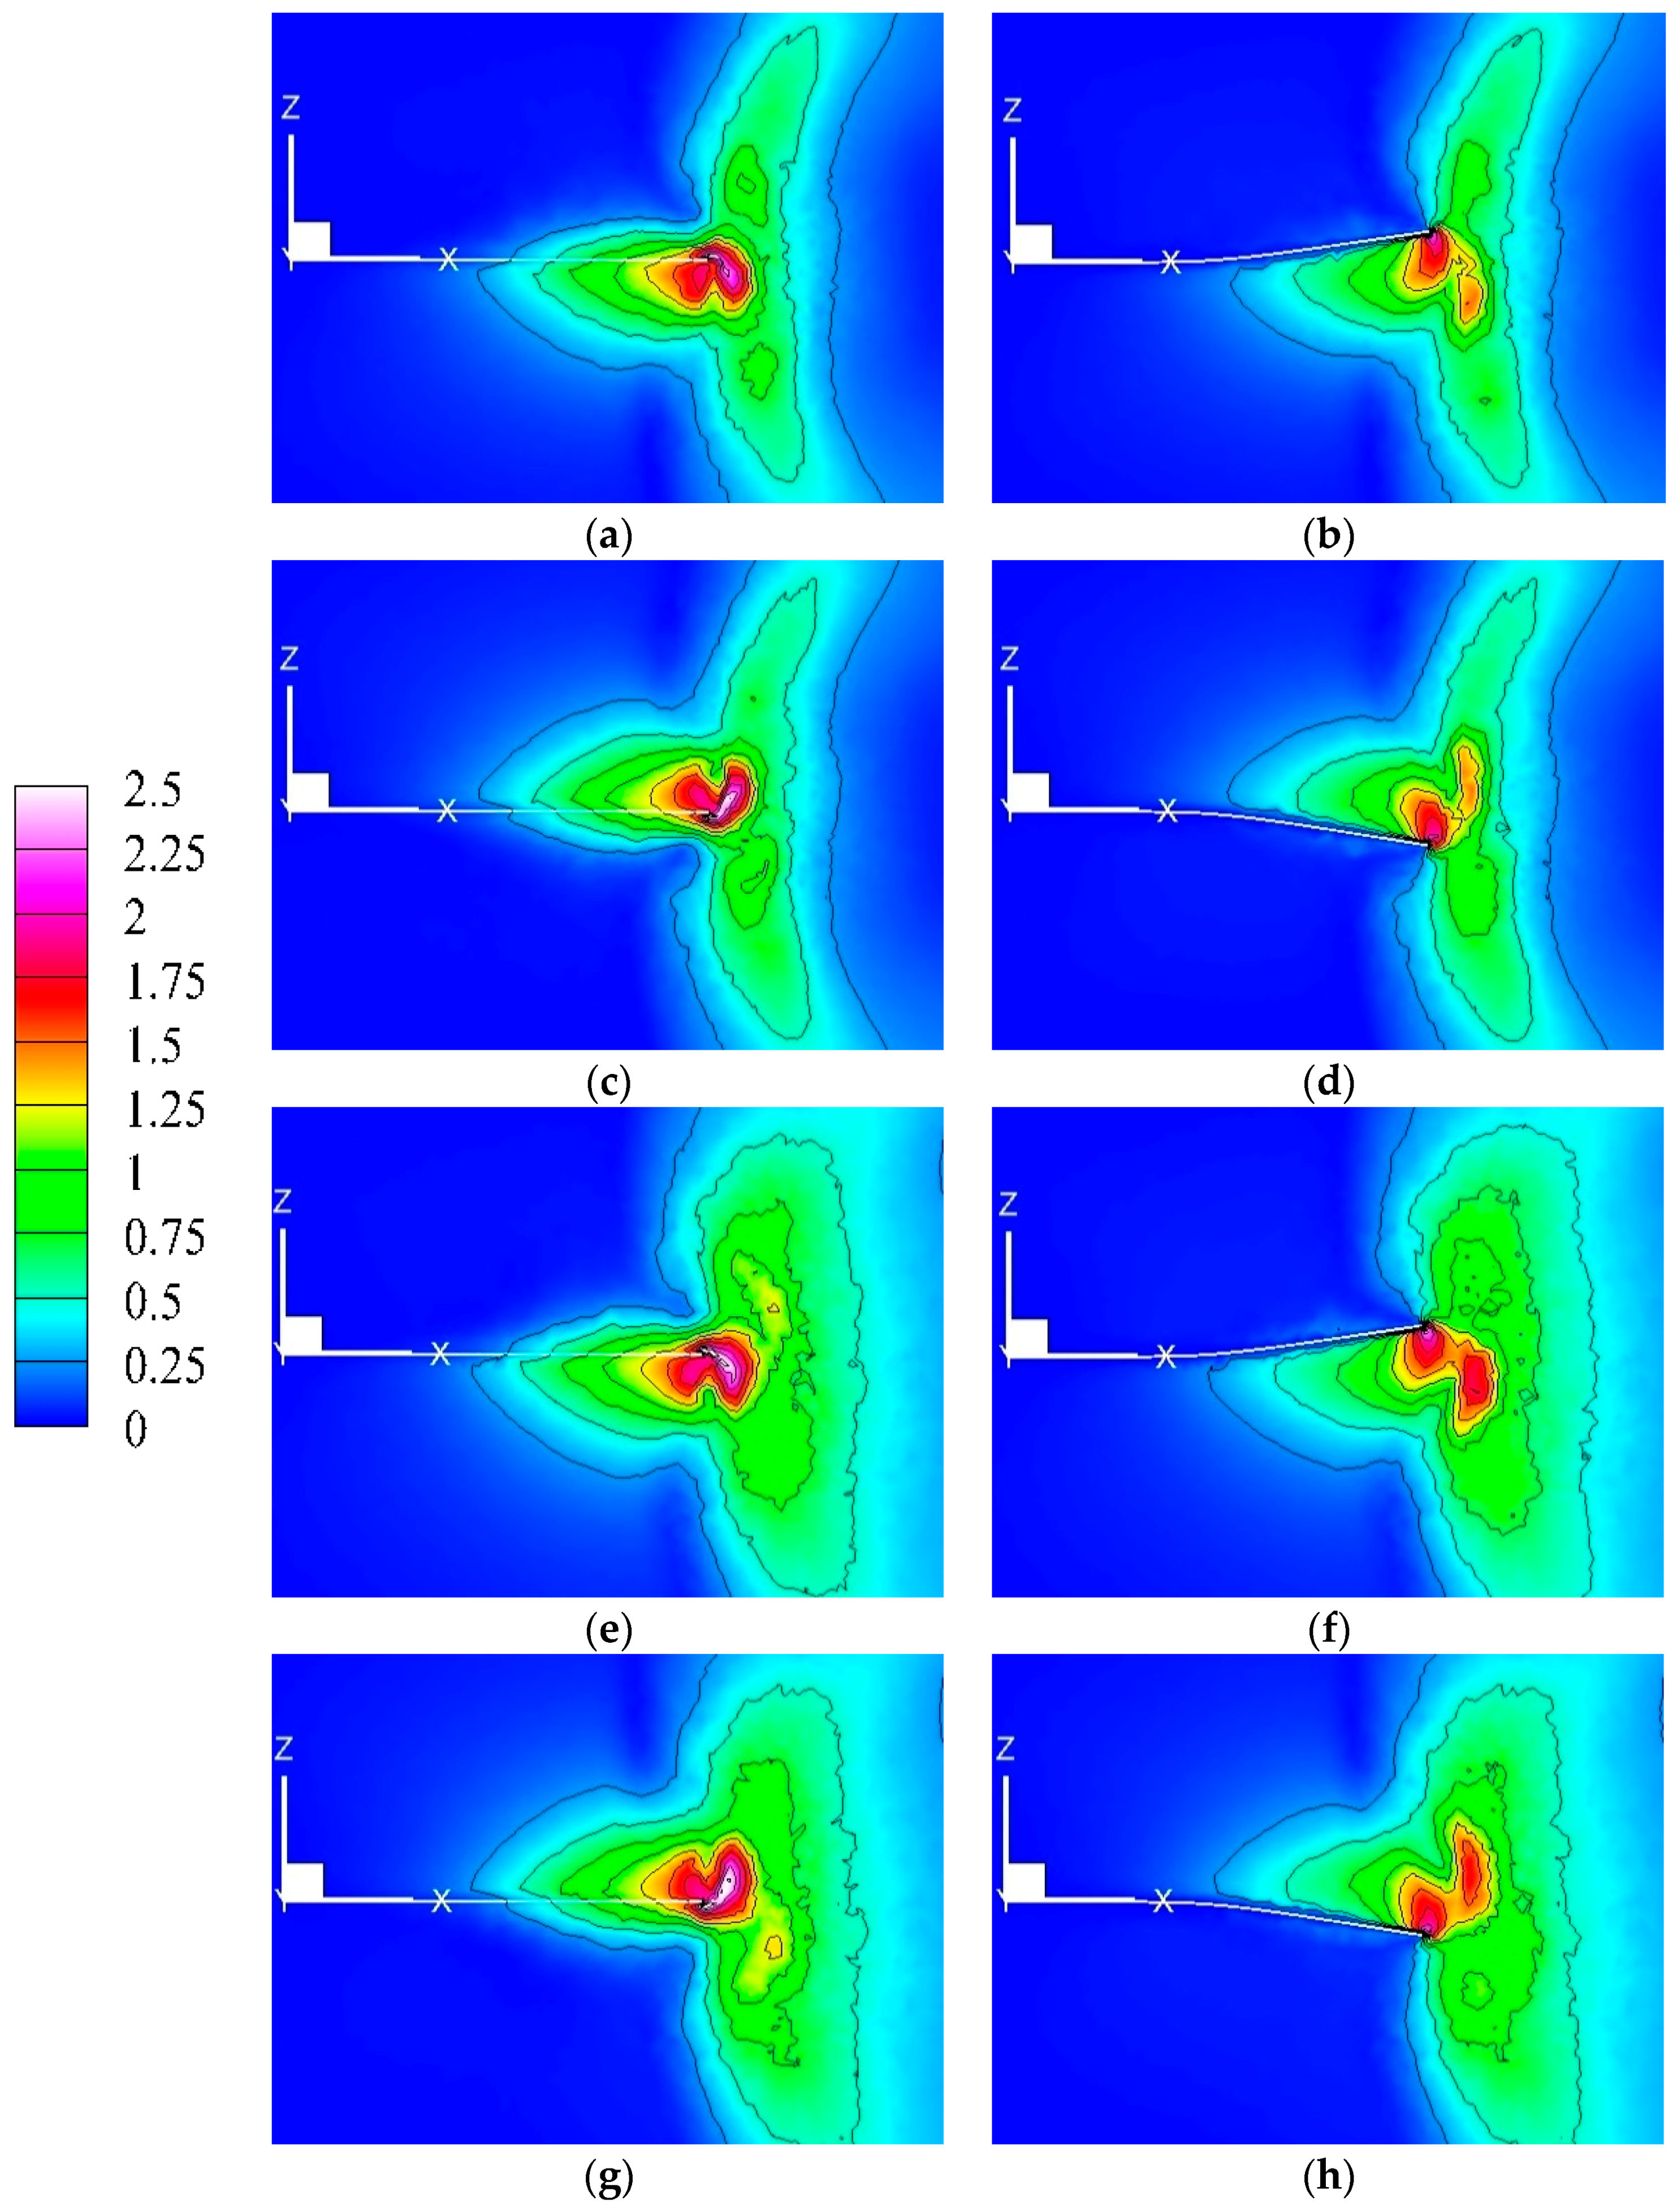
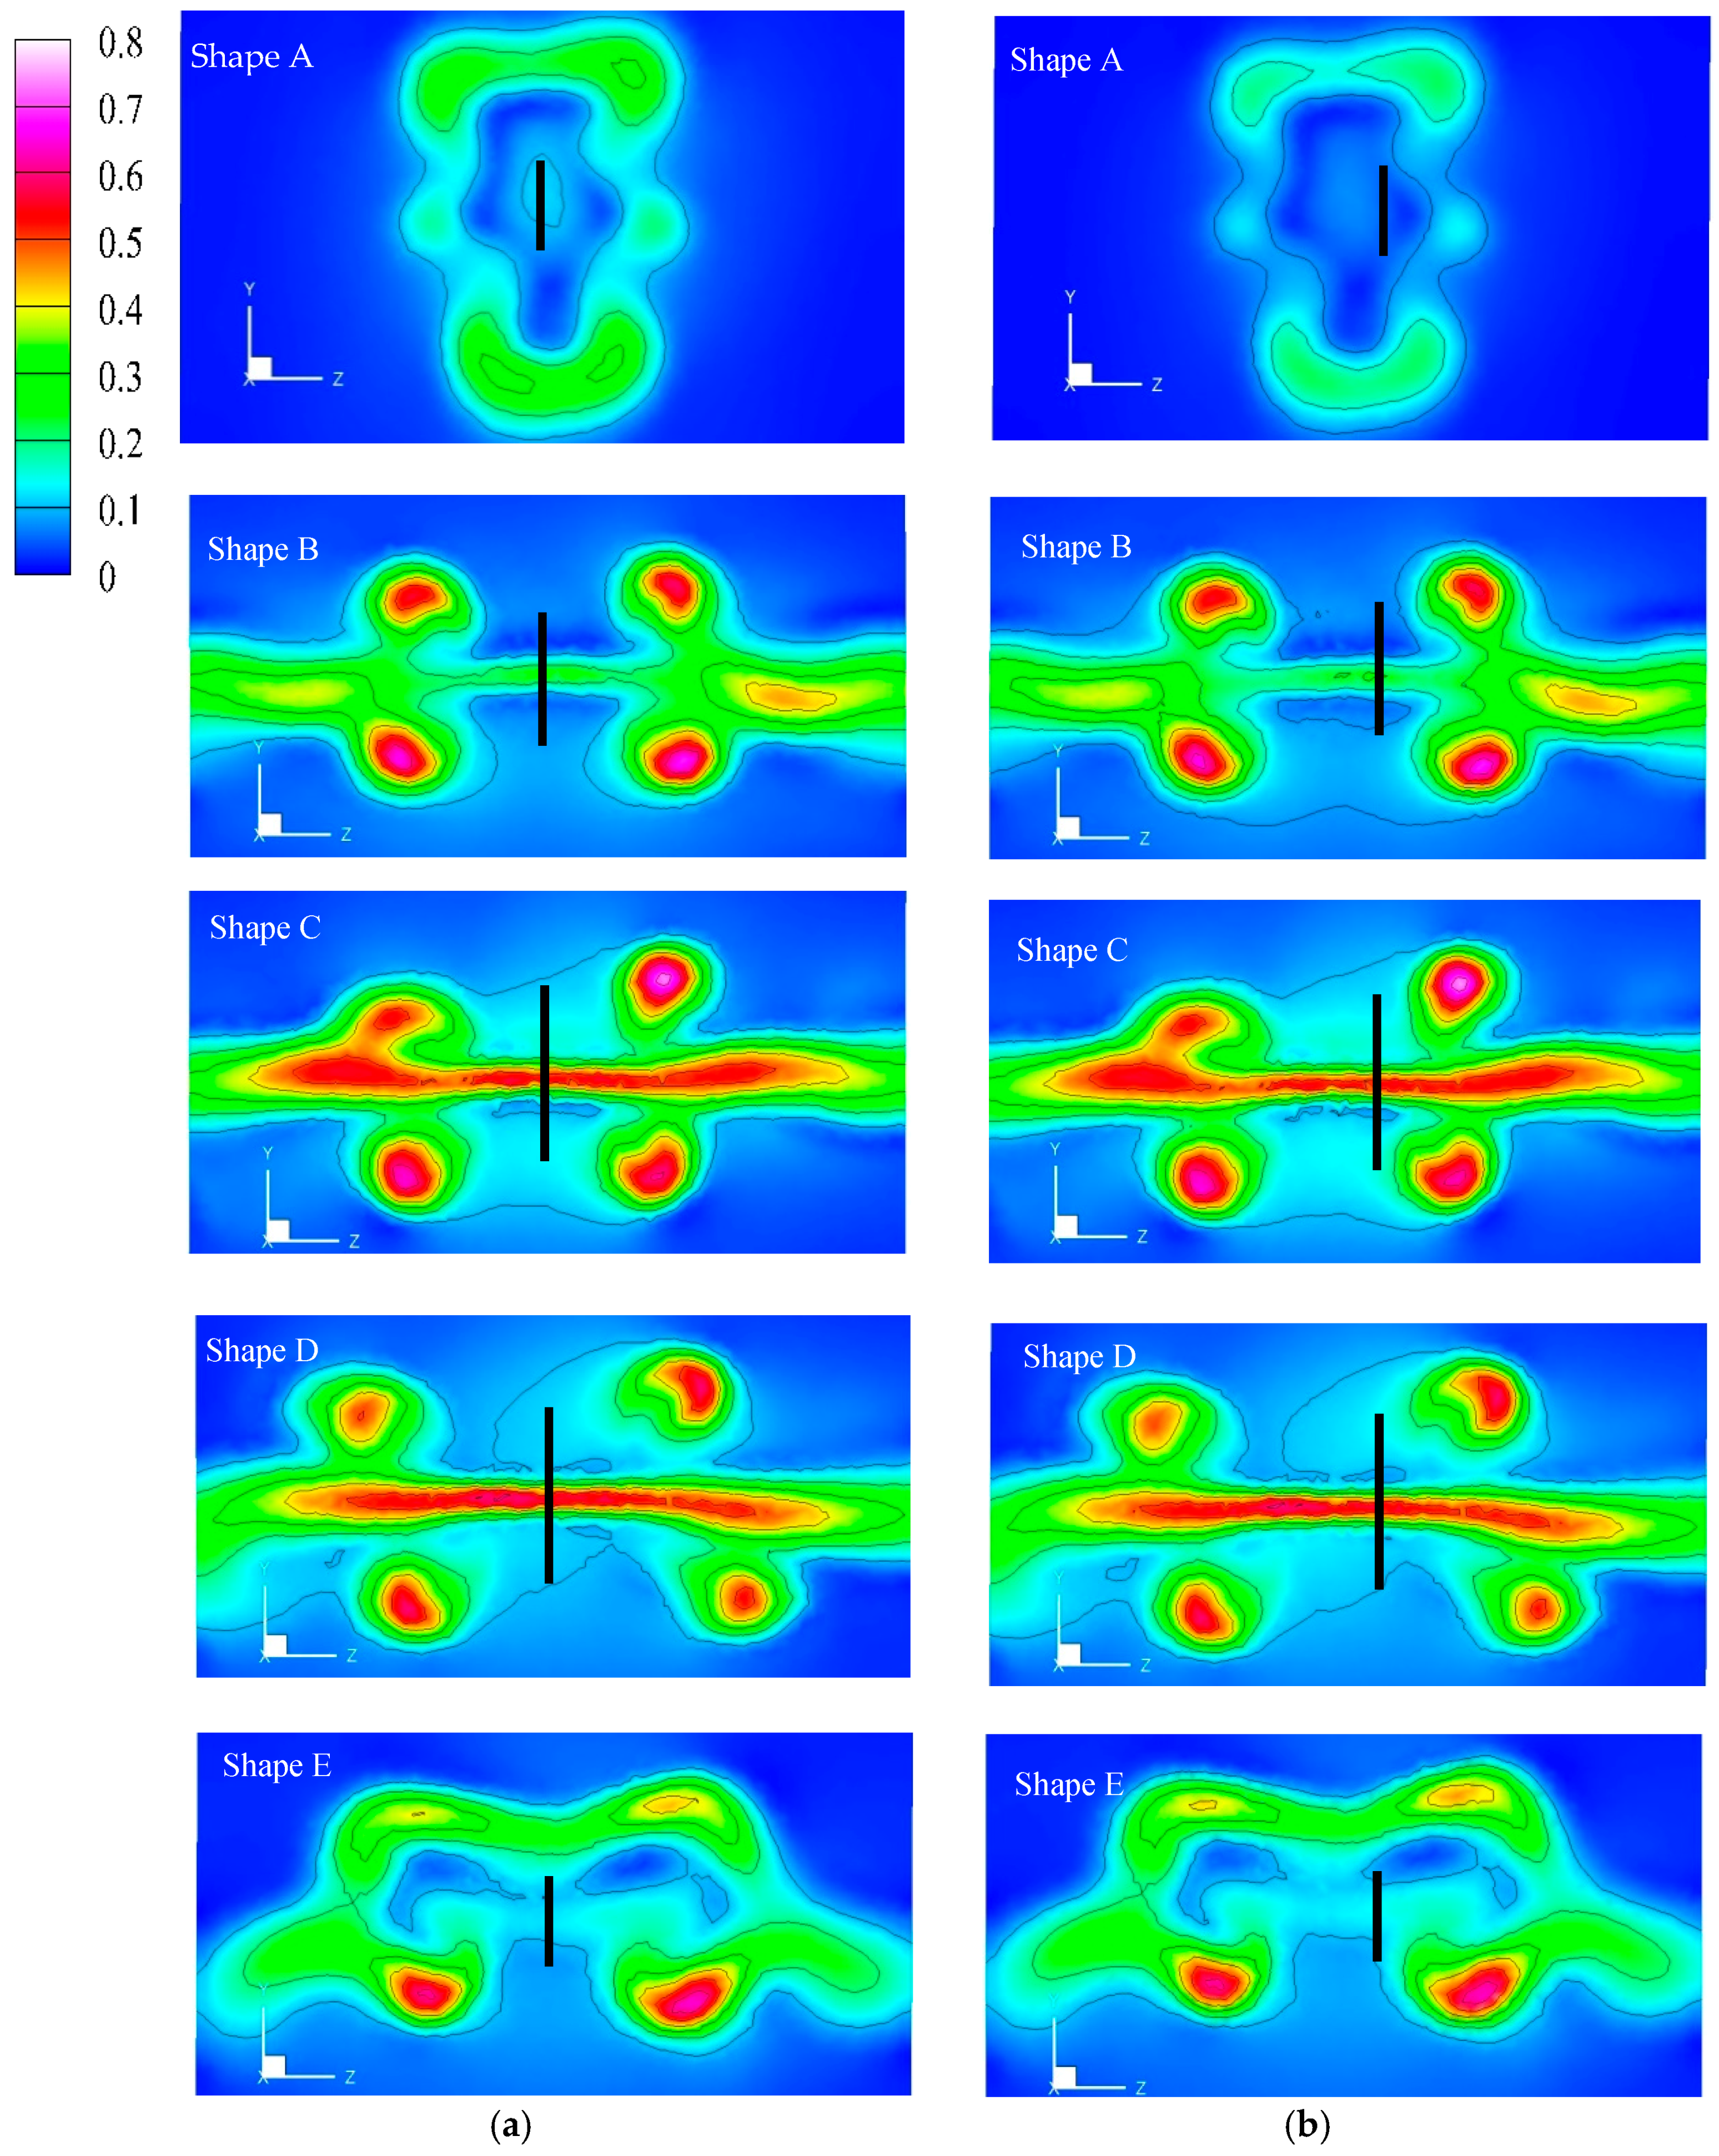
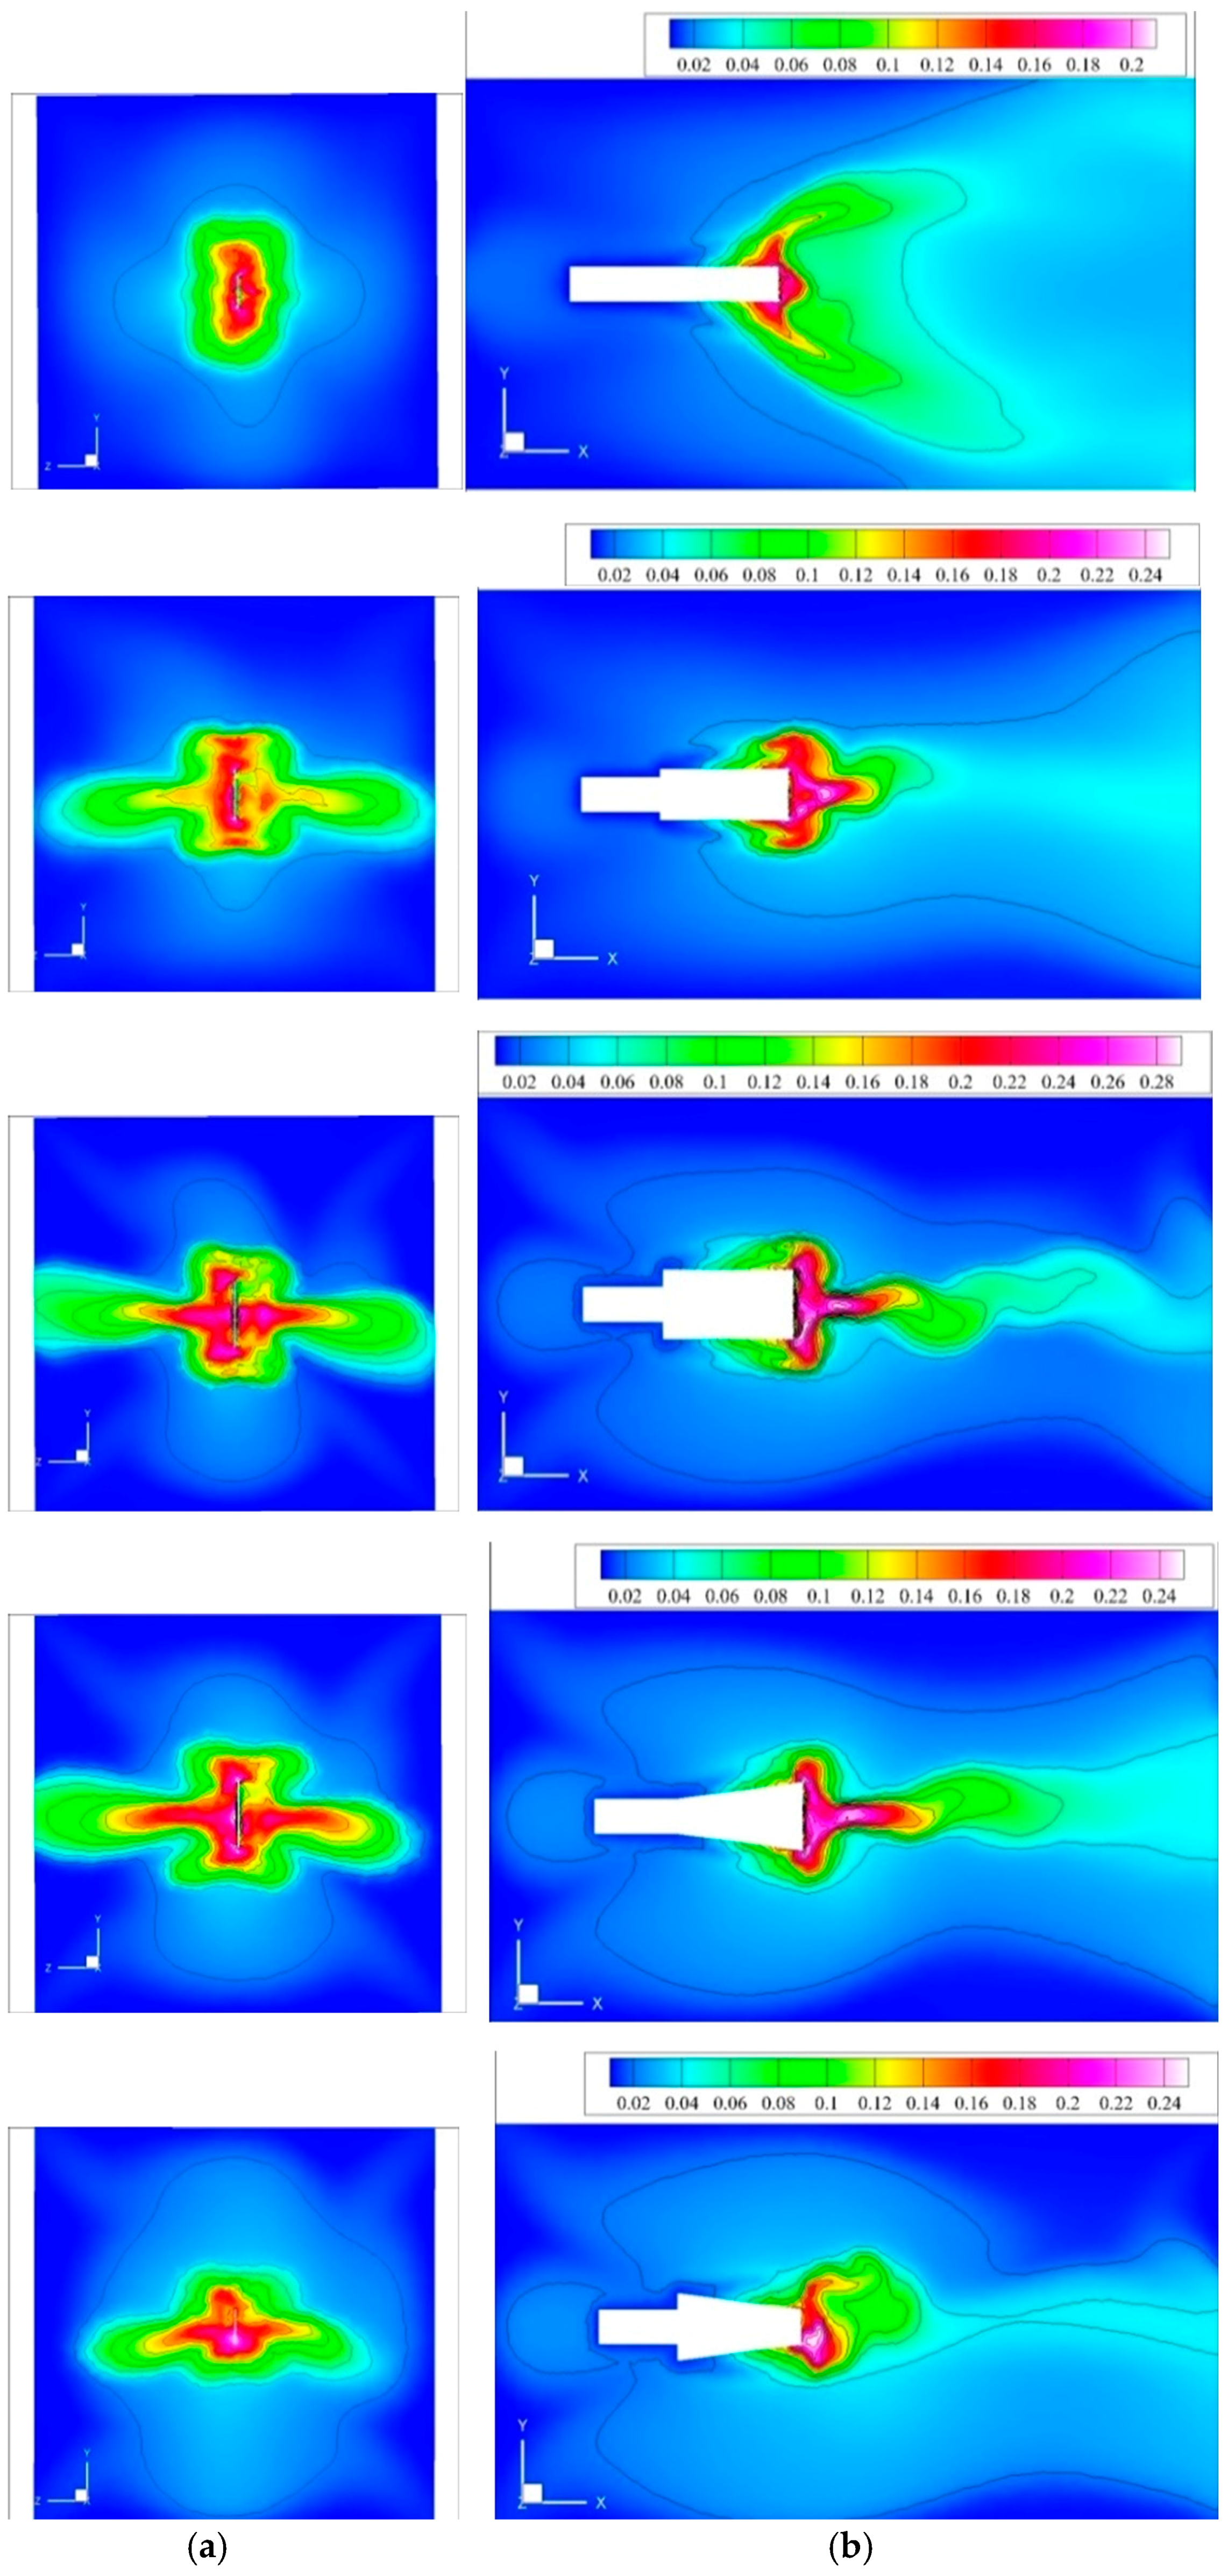
  • The maximum-velocity region in front of the fan tip is due to the dragged and pushed flow by the blade. Local-maximum-velocity regions at the four corners of the central region are produced by the flow released from the blade edges.
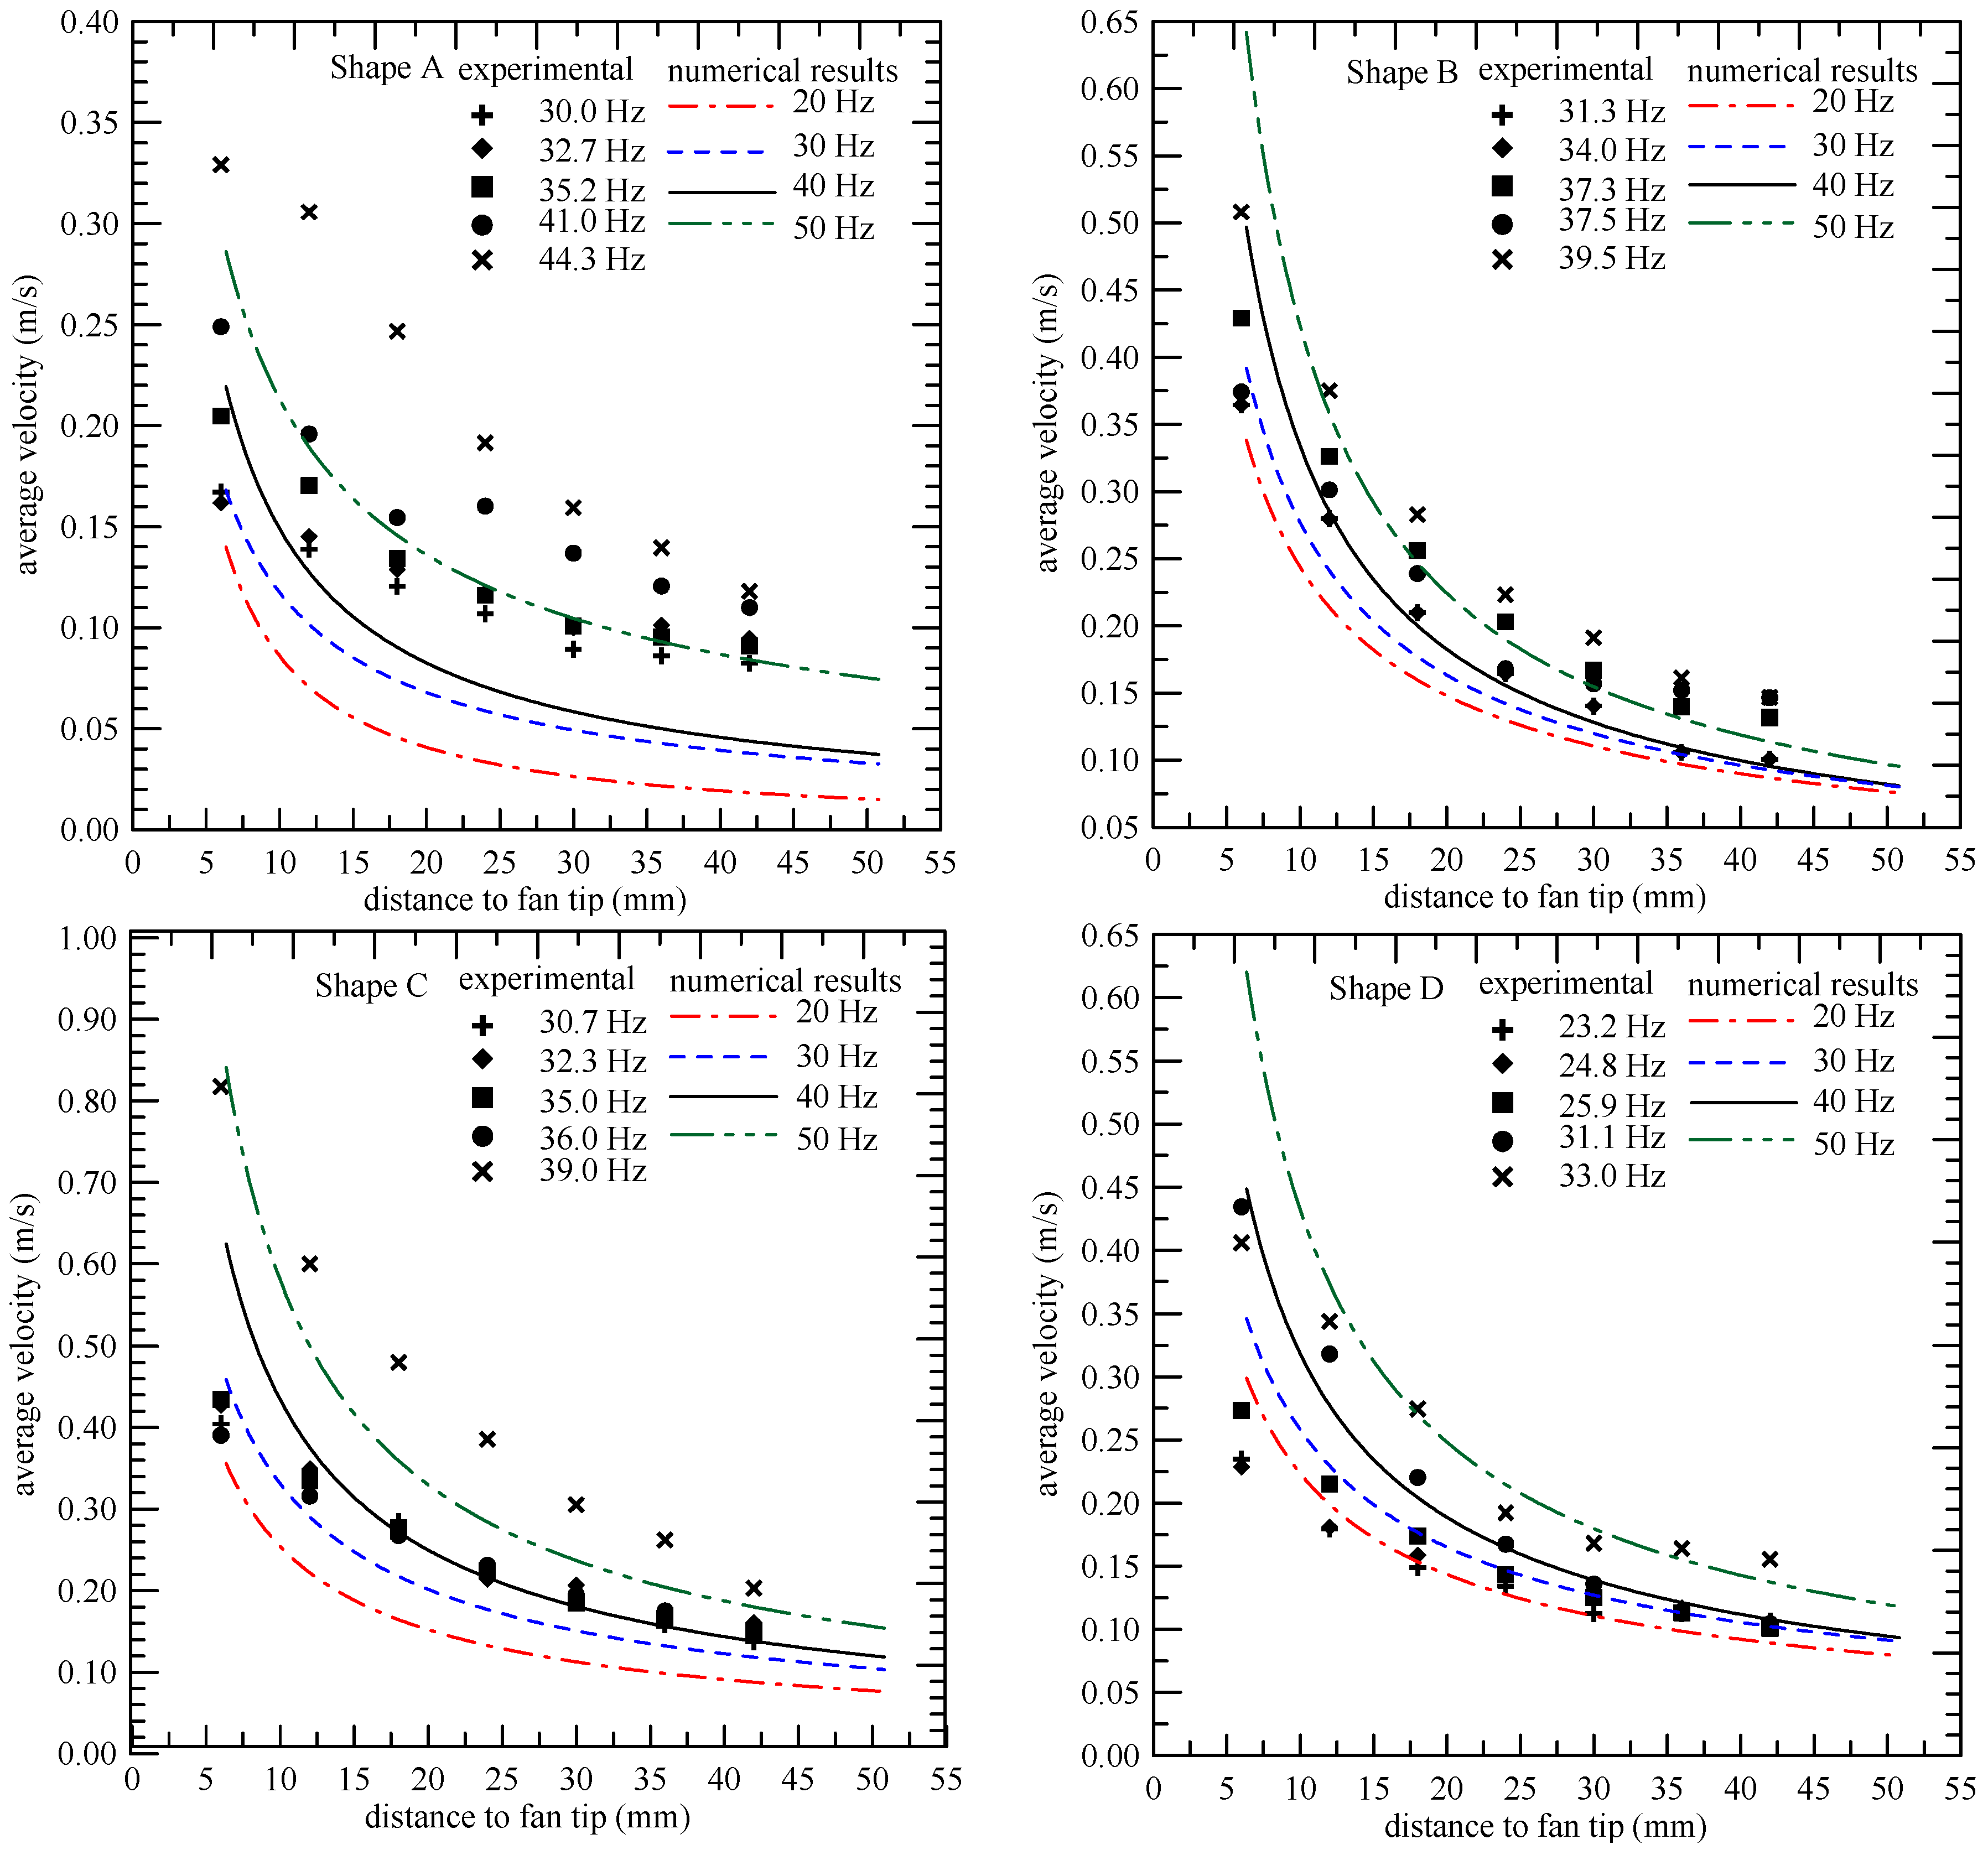
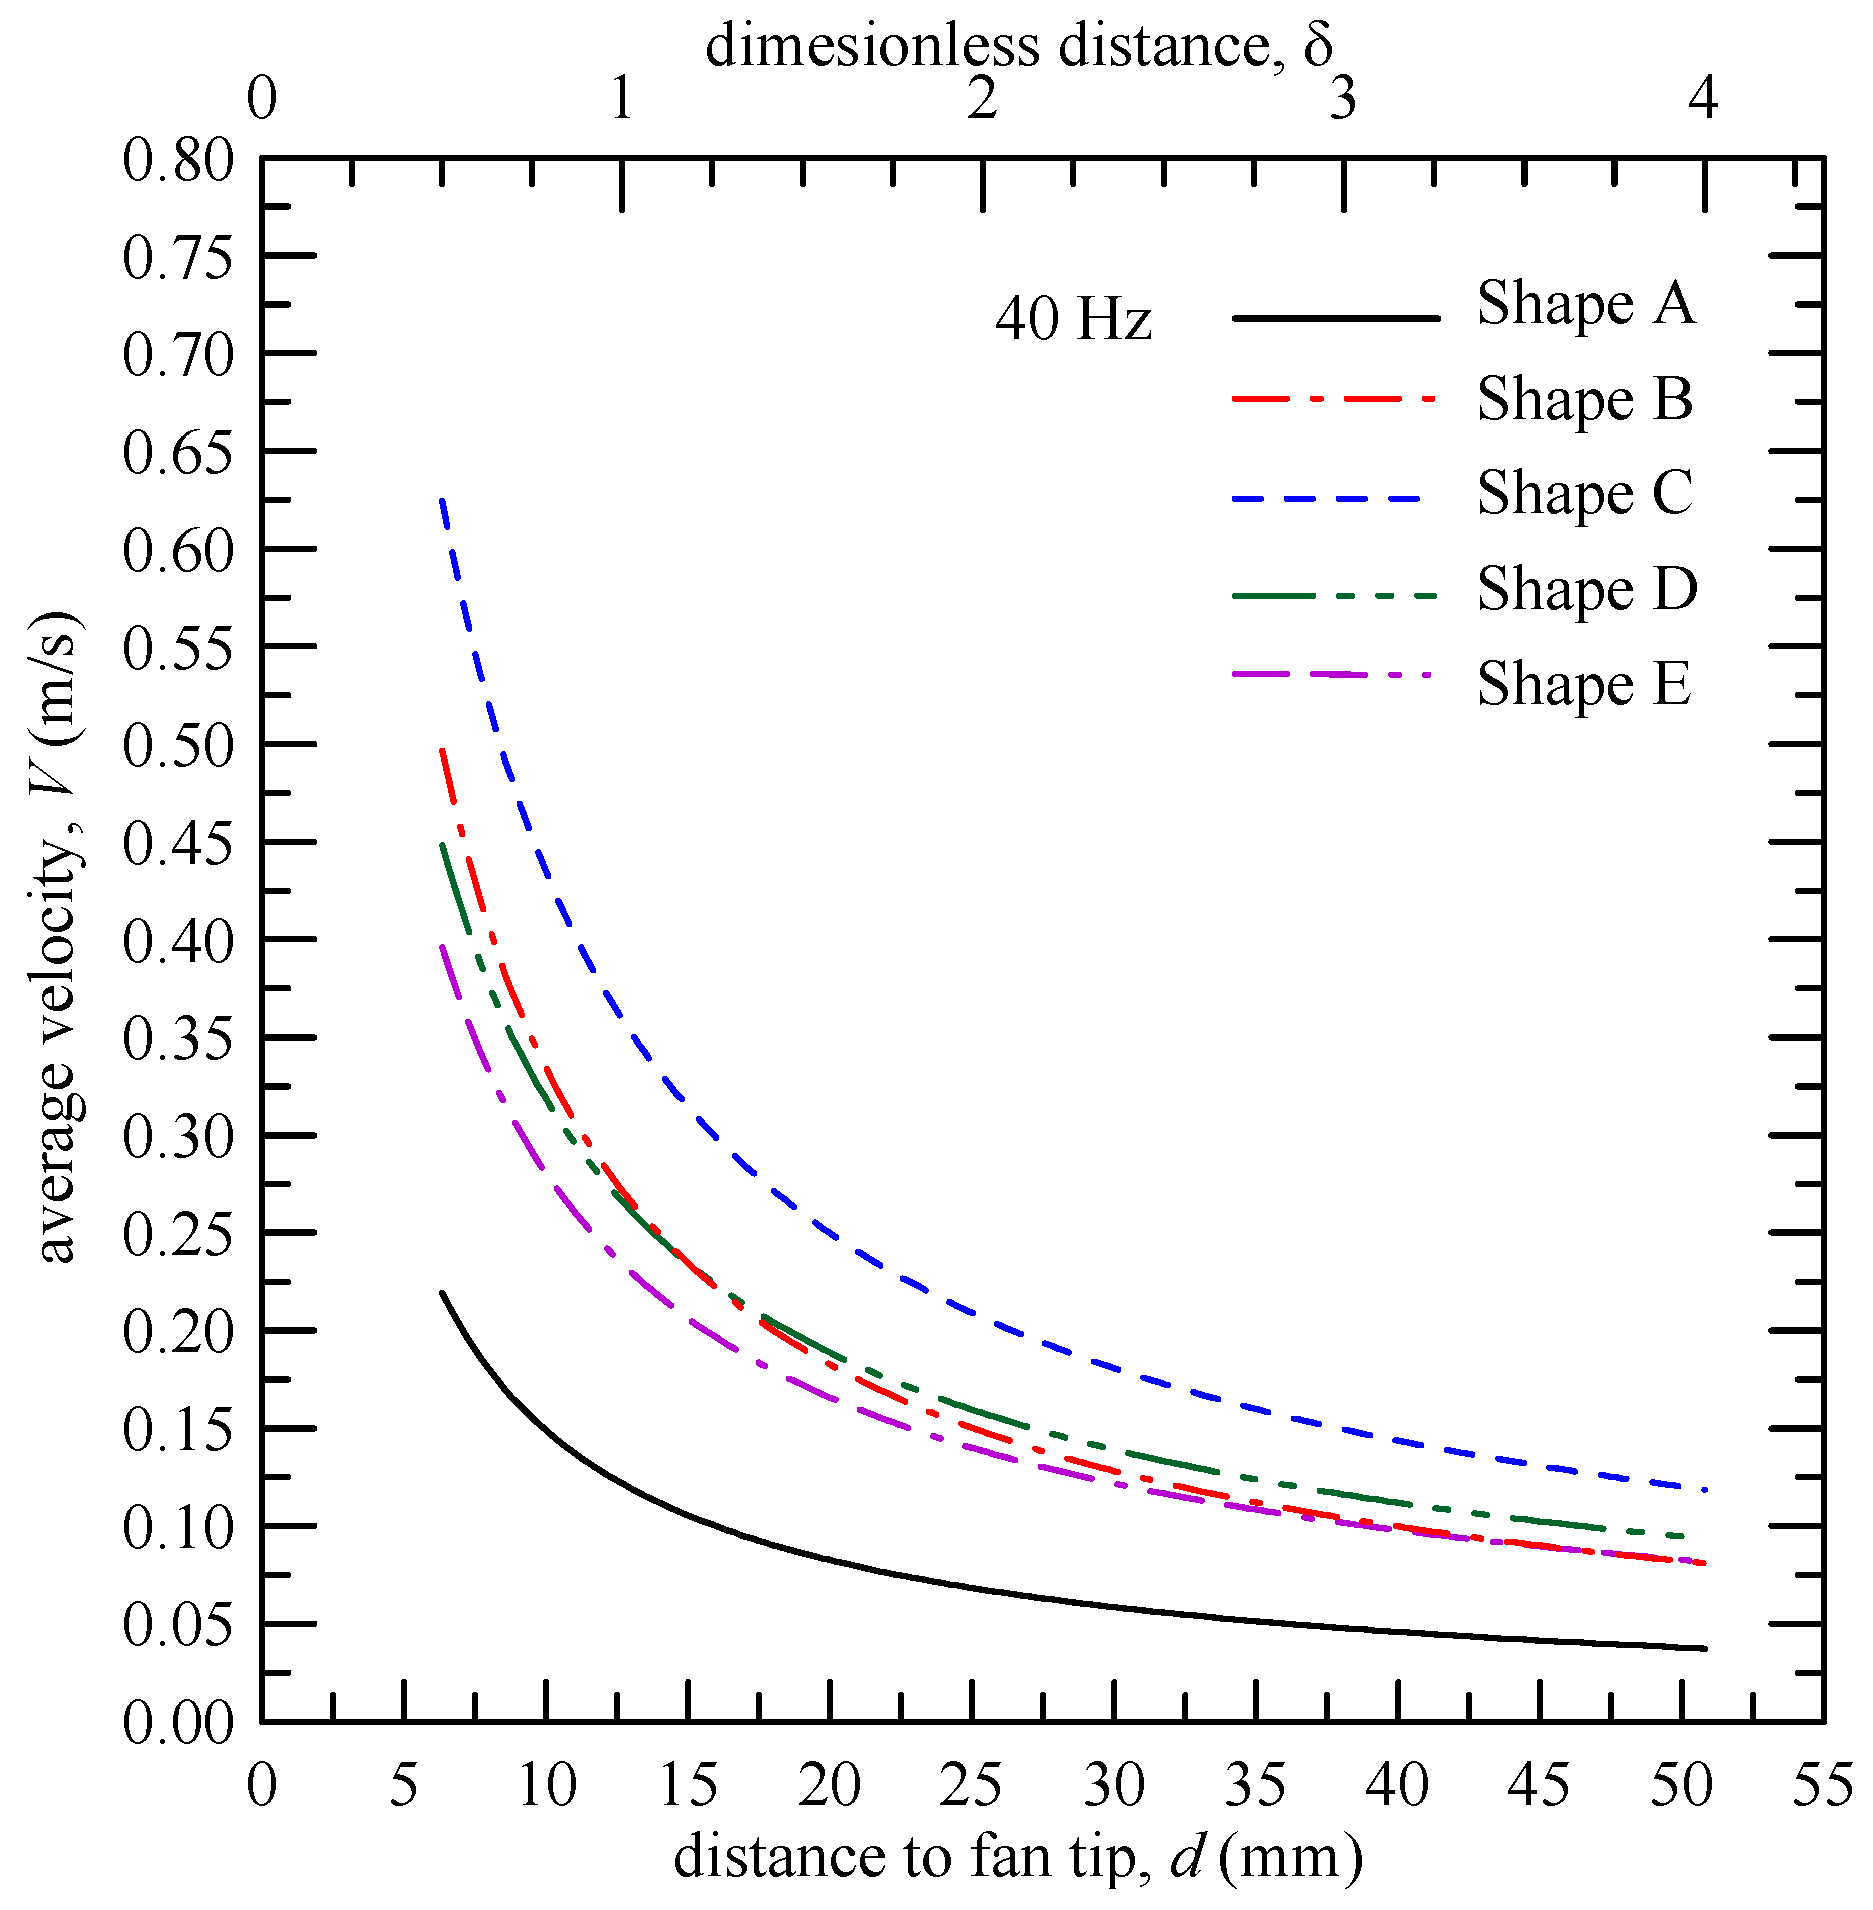
  • The variation of the velocity with distance away from the tip is similar to that of a jet-like flow, but decrease more rapidly. The average velocity of the streams decays steeply within a short distance of 20 mm (δ = 1.5) from the blade tip.
  • In general, a blade with a larger width has a larger velocity. The blade with a contracted shape (Piezofan E) is better for hot spot heat sources than those with divergent and rectangular shapes (Piezofans D and B).

Acknowledgments

This research was financially supported by the Ministry of Science and Technology (MOST), Taiwan, under contracts No. MOST 102-2221-E-269-014 and MOST 104-2622-8-006-001.

Author Contributions

All authors contributed to this work. Chien-Nan Lin performed numerical modeling and data reduction. Jiin-Yuh Jang performed theoretical and experimental model. Jin-Sheng Leu executed the numerical work and experimental measurement.

Conflicts of Interest

The authors declare no conflict of interest.

Nomenclature

Aamplitude of piezofan tip, mm
ciconstant in Equations (3) and (4)
ddistance from fan tip along the axis of the piezofan, mm
F1,F2polynomials in Equations (5) and (6)
ffirst mode resonance frequency, Hz
Iturbulence intensity, I = u / u ¯
i,j,kcoordinate indices
L1,L2length of piezofan blade, mm
ppressure, Pa
uivelocity component, m·s−1
Vkvelocity magnitude, m·s−1
V ¯ average velocity magnitude, m·s−1
wwidth of piezofan, mm
x,y,zspace coordinates
αdimensionless amplitude of piezofan, α = a / w 0
δdimensionless distance from fan tip, δ = d / w 0
εturbulent dissipation rate, m2·s−3
κturbulent kinetic energy, m2·s−2
μdynamic viscosity, N s·m−2
ρ density of air, kg·m−3
τtime, s
φ vibration period of piezofan, s
ϖturbulent frequency (specific dissipation rate), s−1 ( ω = ε / κ )

References

  1. Toda, M. Theory of air flow generation by a resonant type PVF2 bimorph cantilever vibrator. Ferroelectrics 1979, 22, 911–918. [Google Scholar] [CrossRef]
  2. Toda, M. Voltage-induced large amplitude bending device PVF2 bimorph—Its properties and applications. Ferroelectrics 1981, 32, 127–133. [Google Scholar] [CrossRef]
  3. Açıkalın, T.; Wait, S.; Garimella, S.V.; Raman, A. Experimental investigation of the thermal performance of piezoelectric fans. Heat Transf. Eng. 2004, 25, 4–14. [Google Scholar] [CrossRef]
  4. Kimber, M.; Garimella, S.V.; Raman, A. Local heat transfer coefficients induced by piezoelectrically actuated vibrating cantilevers. J. Heat Transf. 2007, 129, 1168–1176. [Google Scholar] [CrossRef]
  5. Kimber, M.; Garimella, S.V.; Raman, A. Measurement and prediction of the cooling characteristics of a generalized vibrating piezoelectric fan. Int. J. Heat Mass Transf. 2009, 52, 4470–4478. [Google Scholar] [CrossRef]
  6. Liu, S.F.; Huang, R.T.; Sheu, W.J.; Wang, C.C. Heat transfer by a piezoelectric fan on a flat surface subject to the influence of horizontal/vertical arrangement. Int. J. Heat Mass Transf. 2009, 52, 2565–2570. [Google Scholar] [CrossRef]
  7. Ma, S.L.; Chen, J.W.; Li, H.Y.; Yang, J.T. Mechanism of enhancement of heat transfer for plate-fin heat sinks with dual piezoelectric fans. Int. J. Heat Mass Transf. 2015, 90, 454–465. [Google Scholar] [CrossRef]
  8. Ihara, A.; Watanabe, H. On the flow around flexible plates oscillating with large amplitude. J. Fluids Struct. 1994, 8, 601–619. [Google Scholar] [CrossRef]
  9. Florio, L.A.; Harnoy, A. Use of a vibrating plate to enhance natural convection cooling of a discrete heat source in a vertical channel. Appl. Therm. Eng. 2007, 27, 2276–2293. [Google Scholar] [CrossRef]
  10. Abdullah, M.K.; Abdullah, M.Z.; Ramana, M.V.; Khor, C.Y.; Ahmad, K.A.; Mujeebu, M.A.; Ooi, Y.; Mohd, R.Z. Numerical and experimental investigations on effect of fan height on the performance of piezoelectric fan in microelectronic cooling. Int. Commun. Heat Mass Transf. 2009, 36, 51–58. [Google Scholar] [CrossRef]
  11. Açıkalın, T.; Garimella, S.V. Analysis and prediction of the thermal performance of piezoelectrically actuated fans. Heat Transf. Eng. 2009, 30, 487–498. [Google Scholar] [CrossRef]
  12. Dey, S.; Chakrborty, D. Enhancement of convective cooling using oscillating fins. Int. Commun. Heat Mass Transf. 2009, 36, 508–512. [Google Scholar] [CrossRef]
  13. Choi, M.; Lee, S.Y.; Kim, Y.K. On the flow around a vibrating cantilever pair with different phase angles. Eur. J. Mech.-B/Fluids 2012, 34, 146–157. [Google Scholar] [CrossRef]
  14. Lin, C.N. Analysis of three-dimensional heat and fluid flow induced by piezoelectric fan. Int. J. Heat Mass Transf. 2012, 55, 3043–3053. [Google Scholar] [CrossRef]
  15. Lin, C.N. Heat transfer enhancement analysis of a cylindrical surface by a piezoelectric fan. Appl. Therm. Eng. 2013, 50, 693–703. [Google Scholar] [CrossRef]
  16. Huang, C.H.; Chen, Y.F.; Ay, H. An Inverse Problem in Determining the Optimal Position for Piezoelectric Fan. Int. J. Heat Mass Transf. 2012, 55, 5289–5301. [Google Scholar] [CrossRef]
  17. Yoo, J.H.; Hong, J.I.; Cao, W. Piezoelectric ceramic bimorph coupled to thin metal plate fan as cooling fan for electronic devices. Sens. Actuators A Phys. 2000, 79, 8–12. [Google Scholar] [CrossRef]
  18. Shyu, J.C.; Syu, J.Z. Plate-fin array cooling using a finger-like piezoelectric fan. Appl. Therm. Eng. 2014, 2, 573–580. [Google Scholar] [CrossRef]
  19. Lin, C.N.; Leu, J.S. Study of thermal and flow characteristics of a heated cylinder under dual piezoelectric fans actuation. Int. J. Heat Mass Transf. 2014, 78, 1008–1022. [Google Scholar] [CrossRef]
  20. Holman, J.P. Experimental Methods for Engineers; McGraw-Hill: Singapore, Singapore, 2001. [Google Scholar]
  21. Pope, S.B. Turbulent Flows; Cambridge University Press: Cambridge, UK, 2000; Chapter 10. [Google Scholar]
  22. Roache, P.J. Verification and Validation in Computational Science and Engineering; Hermosa Publishers: Albuquerque, NM, USA, 1998; Chapter 5. [Google Scholar]
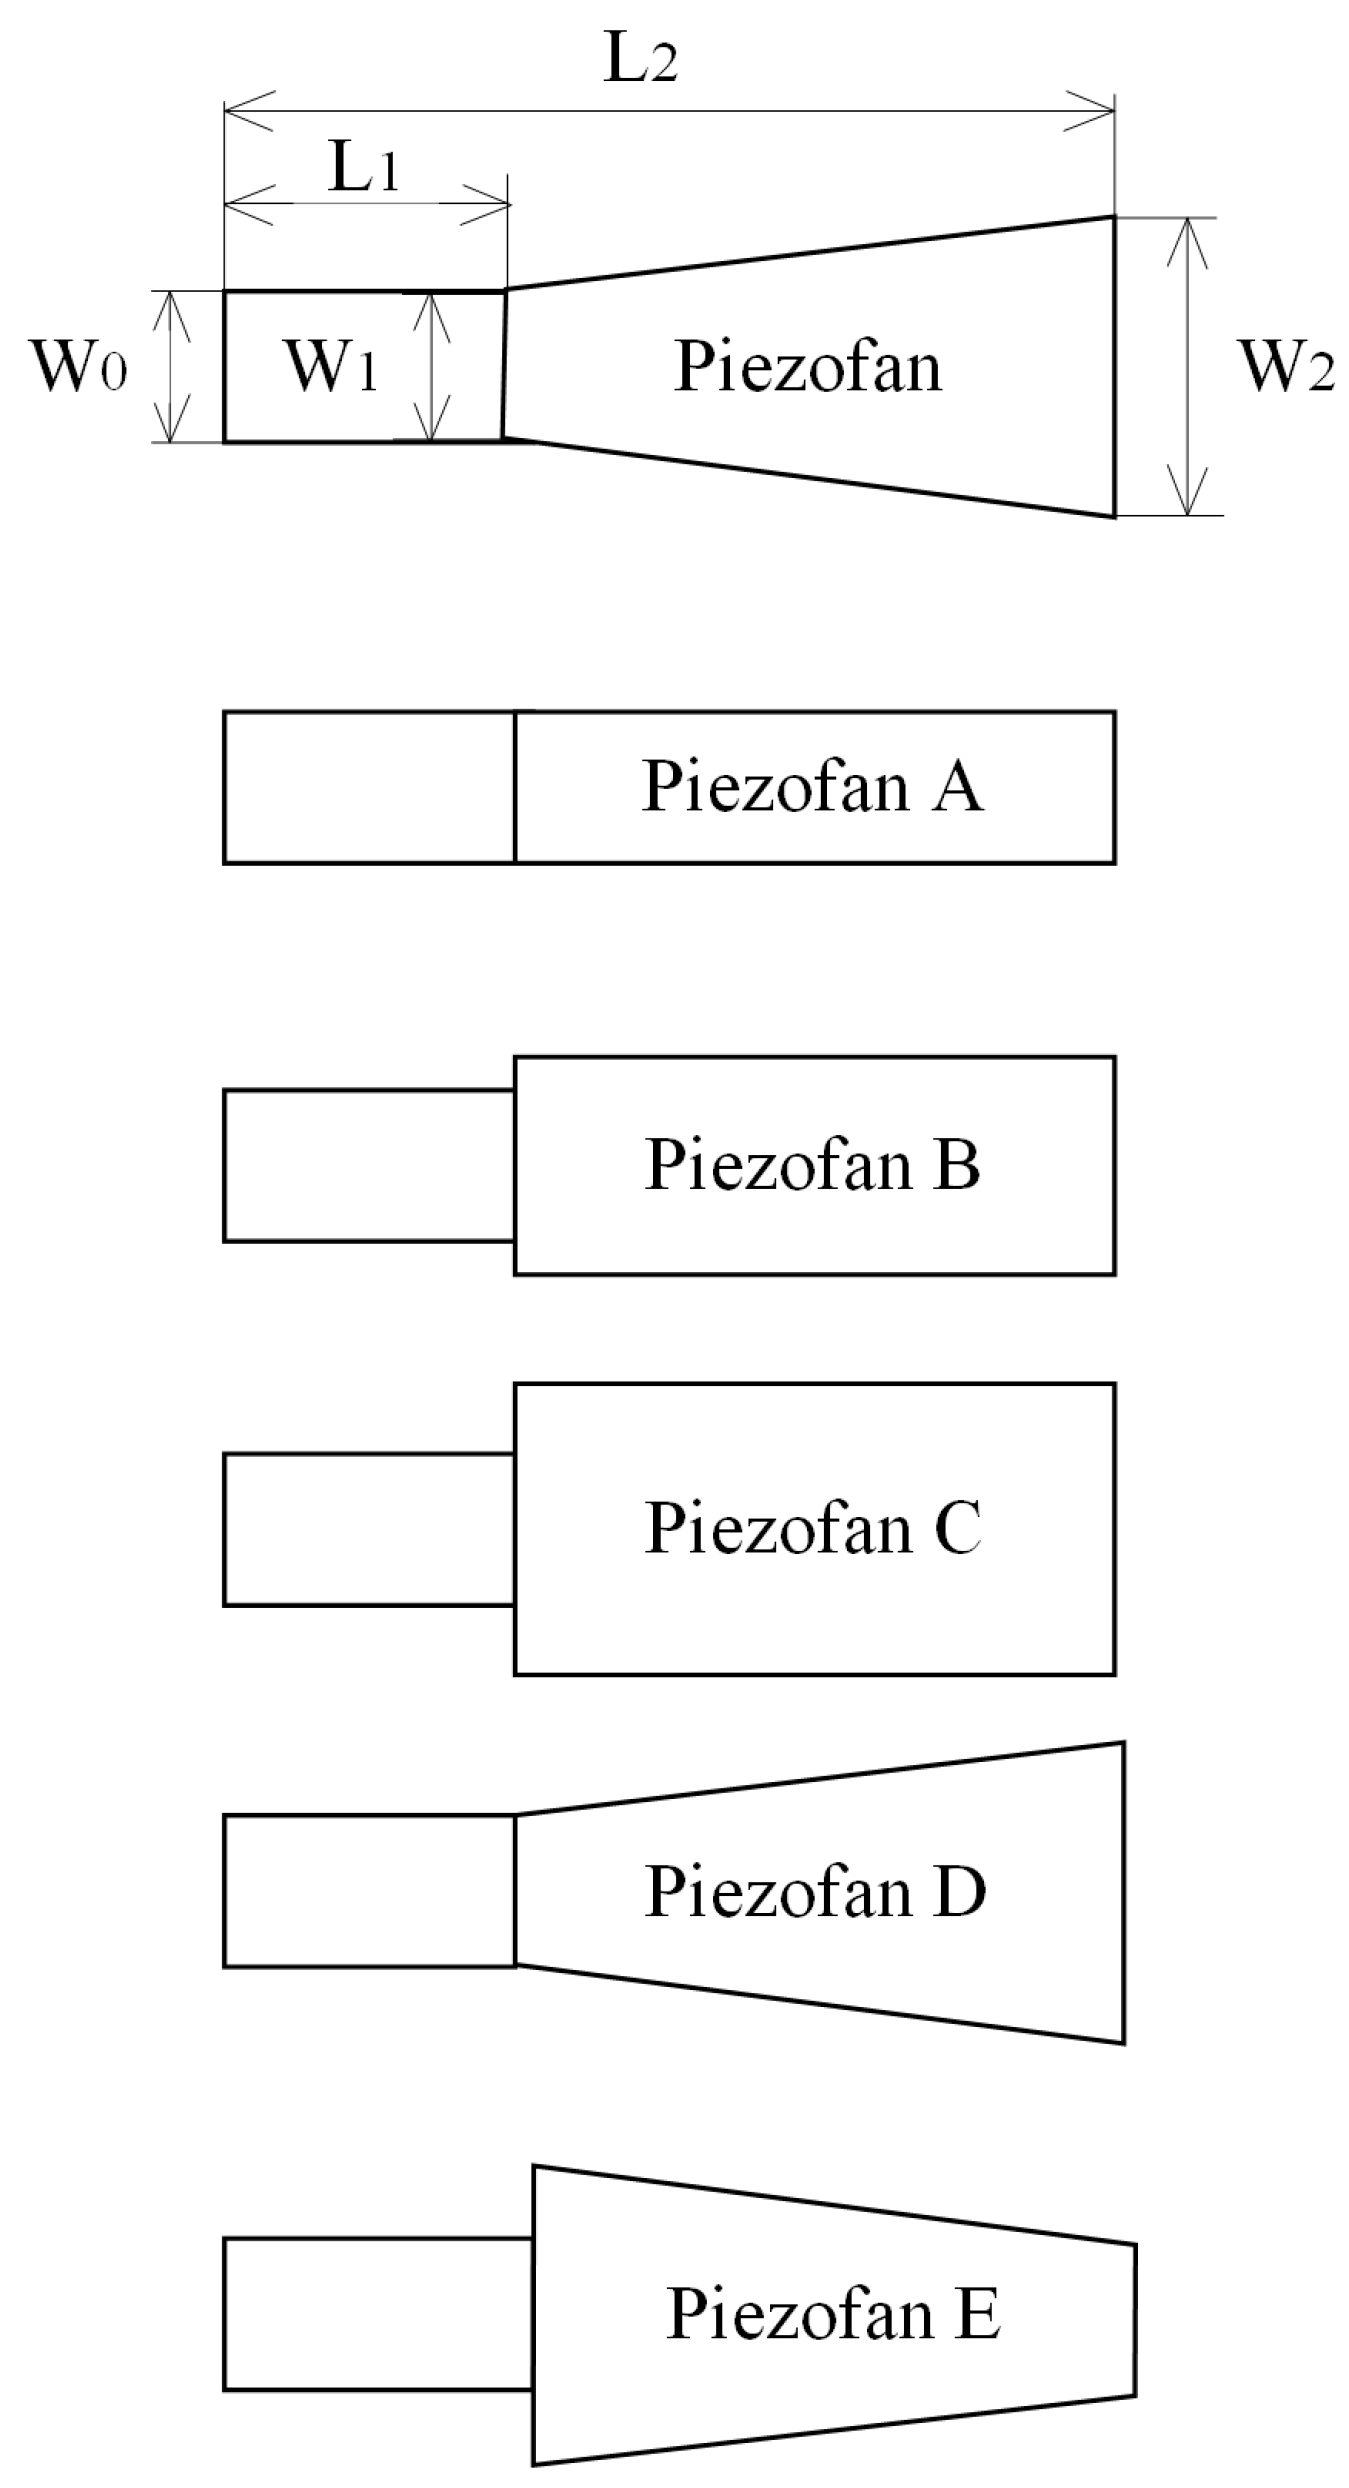
Figure 1. Schematic diagrams of the piezofans.
Energies 09 00610 g001
Figure 2. (a) Measurement matrix of hot-wire velocity meters (unit: mm); and (b) schematic diagrams of the experimental setup.
Energies 09 00610 g002
Figure 3. Schematics of the calculated domain.
Energies 09 00610 g003
Figure 4. Diagrams of the computational domain for Piezofan B.
Energies 09 00610 g004
Figure 5. Variation of velocity with time for Piezofan C under a resonance frequency of 40 Hz. (a) δ = 0.5 and δ = 4, (b) δ = 0.5 at time step 6000–8000.
Energies 09 00610 g005
Figure 6. Streamlines for five piezofans at (a) the neutral position (moving in the positive z-direction) and (b) the extreme right position.
Energies 09 00610 g006
Figure 7. Velocity contours at the central plan of the cantilevers for a completed vibration period for Piezofans (ad) B and (eh) E.
Energies 09 00610 g007
Figure 8. Velocity contours ahead of the fan tip at 6.35 mm, δ = 0.5 , for five piezofans at (a) the neutral position (moving in the positive z-direction) and (b) the extreme right position.
Energies 09 00610 g008
Figure 9. Velocity contours ahead of the fan tip at 25.4 mm, δ = 2 , for five piezofans at (a) the neutral position (moving in the positive z-direction) and (b) the extreme right position.
Energies 09 00610 g009
Figure 10. Turbulence intensity at (a) the plane of the fan tip and (b) middle plane of the piezofans.
Energies 09 00610 g010
Figure 11. Variation of the velocity with the distance from the fan tip for various resonance frequencies.
Energies 09 00610 g011aEnergies 09 00610 g011b
Figure 12. Variation of the velocity with the distance from the fan tip for five piezofans.
Energies 09 00610 g012
Table 1. Dimensions of the piezofans (unit: mm).
L1L2W0W1W2W2/W1
Piezofan A297612.712.712.71
Piezofan B19.119.11
Piezofan C25.425.41
Piezofan D12.725.42
Piezofan E25.412.70.5

