1. Introduction
The threat of climate change consequences and the request to be independent from importing scarce fossil fuels, as well as the nuclear disaster in Fukushima, have led many countries to switch their energy generation to a generation based on renewable energy sources (RES). This transition takes place in the heating, transport, and electricity sectors. The European Union has ambitious targets in terms of RES and has taken a leading role with its “2030 climate and energy framework” [
1]. At least 27% of the annual overall energy consumption in the European Union has to be covered by RES until 2030. By 2050 Germany wants to cover 80% of its annual gross electricity consumption by RES [
2]. In order to reach such high penetration shares of RES, volatile generation types like wind turbines (WTs) and photovoltaic systems (PVs) will take an important part in future electricity generation.
One major challenge in this transition movement will be the future of power system stability. Power generation and consumption in an alternating current (AC) power system have to be balanced in every moment. The grid frequency is the indicator for the balance of power generation and consumption. Hence, an important part of power system stability is frequency control. Frequency control was, and still is, the task of conventional power plants. In order to keep frequency deviations in an acceptable range, either RES have to take over this duty, or conventional must-run capacities have to remain in operation. However, keeping must-run capacities would contradict the energy transition. Due to the time which is needed until control power is fully activated, system inertia is required to limit frequency deviations and gradients. A major challenge in terms of frequency control by RES is the provision of power system inertia. WTs and PVs are connected to the grid by power electronics and therefore do not provide inherent inertia [
3]. However, it is extensively discussed, that WTs are capable of providing so called synthetic inertia [
4,
5,
6,
7]. Currently, a research project regarding the provision of synthetic inertia using WTs and its effects on mechanical loads and costs is conducted at the Wind Energy Technology Institute (WETI), in collaboration with the WT manufacturer Suzlon Energy.
Cao et al. have studied the impact of variable system inertia on the performance of frequency based protection for the AC island system of the United Kingdom [
8]. For a larger synchronous area Wang et al. have studied the impact of high penetration of variable RES in the European Continental Synchronous Area (ECSA) [
9]. The German Energy Agency (DENA) has stated that until 2030 sufficient system inertia is available in the ECSA in order to react appropriately to frequency deviations in the event of an imbalance of 3 GW [
10]. The main reasoning behind this statement is the great differences in the share of RES across the ECSA. A possible consequence of insufficient system inertia is the split of the grid into islands. These grid islands have to be controllable in terms of frequency stability. Such splits into electric islands occurred in September 2003 when Italy was disconnected and in November 2006 when the former Union for the Coordination of the Transmission of Electricity (UCTE) split into three islands [
11,
12]. After Italy was disconnected from the UCTE the grid frequency in Italy was temporarily stabilised at 49 Hz. It declined further for various reasons, which finally led to a system blackout. The incident in 2006 led to the split of the UCTE grid into three separate areas (west, northeast and southeast) with significant power imbalances. These imbalances caused under-frequencies in the west and southeast areas and an over frequency in northeast. Full synchronisation of the UCTE was achieved 38 min after the split.
One part of low rotational inertia in the power system relates to technical issues. While this is addressed extensively, a literature study has shown that the economical perspective of system inertia has only been researched superficial yet. Society and economy are highly dependent on electricity and its undisturbed provision due to an extensive use of electrical devices. Large frequency fluctuations or even blackouts might cause huge financial damages. Leahy and Tol evaluated the damage caused by blackouts for the private and the industrial sector in Ireland [
13]. The same was done by Nooij et al. for the Netherlands [
14] and by Growitch et al. for Germany [
15]. Pelletier et al. analysed the development of system inertia in New Zealand and proposed a financial compensation/penalty system for generators providing sufficient or insufficient system inertia respectively. Based on the spread between the power system inertia constant and the individual inertia constant of each generator, a fee would have to be paid for generators providing insufficient inertia or a benefit would be received for generators providing sufficient inertia [
16]. However, this proposal is not applicable due to a non-transparent calculation and a non-guarantee of sufficient system inertia, that is, a controllable power system.
The paper at hand emphasizes the importance of power system inertia for the ECSA for the purpose of frequency stability and provides a closer look on the economical side of inertia. Due to its decreasing nature, it is proposed that inertia should be a traded good in future power systems. Therefore, a physical trading unit is discussed and proposed. In a following step, an energy storage system is designed to provide synthetic inertia in order to maintain frequency stability in the ECSA as it is known today, and financially assessed. An obvious solution for maintaining system inertia appears to be idle operation of decommissioned conventional power plants. This option is not pursued here, because when decommissioning conventional power plants large masses are being disconnected from the turbine train and the inertia reduces significantly [
10]. Although, synthetic inertia provision by RES and its impact on mechanical loads is currently researched at WETI, it is not part of this paper. It can be assumed that the provision of synthetic inertia by WTs increases mechanical stress and, therefore, reduces the life expectancy of WTs. Alternatively the mechanical design has to be adapted, which leads to increased cost of energy from these WTs. As RES depend on the availability of primary energy sources (e.g., wind), storage units are unavoidable for the purpose of frequency stability at all times. Nevertheless, future research and finally a market for system inertia will determine, whether RES or storage units will be a proper and economical efficient solution.
In this paper
Section 2 introduces the basic working principle of today’s power system, the behaviour of the grid frequency in the event of a power imbalance, as well as the working principle of system inertia.
Section 3 discusses and clarifies the unit in which futures system inertia should be traded, once the inherent inertia does no longer suffice for stable power system operation. In
Section 4 an energy storage system for the provision of synthetic inertia is dimensioned with respect to power and energy and it is also modelled.
Section 5 evaluates the costs of such a storage system. Additionally, levelised costs of inertia are introduced for the purpose of comparison.
Section 6 sums up the results.
2. Power System Operation and the Influence of System Inertia
In present AC electrical systems, power generation and consumption have to be balanced in every moment. The grid frequency,
f, indicates whether power generation and power consumption is balanced. The grid frequency is directly coupled to the rotational speed of all synchronous generators and all other rotating electric machines which are connected to the grid without power electronics. Depending on the synchronous region considered, the nominal grid frequency,
, is 50 Hz (like in the ECSA) or 60 Hz. A simple approach to describe the relation between power generation, power consumption, and the grid frequency is shown with Equation (1) [
5].
is the accumulated power generation torque, is the torque of the total power consumption including grid losses and the power system inertia. Power system inertia is the aggregated mass moment of inertia of all directly coupled rotational machines, i.e., mainly synchronous generators of conventional power plants. is the change of the rotational speed of these machines. The rotational speed of a generator is coupled to the grid frequency by . In the case of an unscheduled generation loss, turns negative and the grid frequency decreases from its nominal value. In the case of a surplus of , the frequency increases.
System inertia refers to the lagging speed response of all coupled synchronous machines in an AC power system in the event of an imbalance between power generation and demand; hence, all synchronous machines can be seen as short-time accumulators. They dampen frequency deviations by storing or releasing kinetic energy.
Equation (2) describes the relation between stored kinetic energy, the inertia of a machine,
, and the rotational speed
. If the frequency decreases, the rotational speed of the machine decreases, kinetic energy is released and converted into additional electrical energy, which is fed into the grid. If the frequency increases, the opposite happens. It is the state of the art to describe the system resilience against frequency deviations by the inertia constant,
[
17]. The inertia constant determines the duration a generating machine, theoretically, is able to provide its rated power solely from its stored kinetic energy, i.e., its speed decreases from rated to zero. See Equation (3):
where
is the rated power of the machine. Typical values for
are in the range of 2 s to 10 s [
17].
Information about control energy and power in this paper refer to standards set by the European Network of Transmission System Operators of Electricity (ENTSO-E) [
18,
19]. In continental Europe control energy and power is divided into three categories, namely Primary Control Reserve (PCR), Secondary Control Reserve (SCR), and Tertiary Control Reserve. PCR gets activated when frequency deviation exceeds ±20 mHz from its nominal value
. It starts within a few seconds after the incident and has to be fully activated in no greater than 30 s. All power plants delivering PCR participate equally in the synchronous area. PCR has to be delivered until it is completely taken over by SCR and Tertiary Control Reserve (TCR) but at least for 15 min.
In summary, system inertia is an essential part for the functionality of present frequency control, as it provides PCR sufficient time to adjust its power. However, due to the increasing share of inverter based RES in power systems, system inertia decreases. Hence, in a future power system inertia has to be provided externally and suppliers have to be compensated for their expenses.
3. Determining Factors for Providing Non-Inherent Inertia in a Power System
As system inertia decreases, in future power systems the provision of non-inherent inertia becomes inevitable and has to be financially compensated. Consequently, a physical unit in which the good inertia can be traded has to be defined. Obvious choices would be power or energy—the units in which PCR and SCR are traded nowadays—or simply inertia. To find a reasonable unit, the ways of providing inertia in the future are analysed and compared with the behaviour of inertia today.
Grid frequency control must fulfil two targets:
The rate of change of frequency (ROCOF) has to be kept under 2 Hz/s [
20,
21,
22]. If the ROCOF exceeds this threshold, ROCOF relays trigger.
The frequency must be kept within certain limits, e.g., 49–51.5 Hz in the ECSA [
23]. Otherwise, load shedding is activated and parts of the grid are disconnected.
The performance of frequency control is assessed for the case of a sudden loss of a large power plant (3 GW), the so-called reference incident [
18]. The reaction of the frequency in such an event is described by an imbalance of the torque (
) and the system inertia (
) of Equation (1). Consequently, high system inertia allows limiting the absolute frequency excursion by ramping up the PCR power plants over a period of 30 s.
However, in a future grid system inertia has to be provided externally as the inherent inertia decreases. The system inertia in Equation (1) can be split into two independent inertias:
Inertia provided by rotating loads (fans, pumps, etc.)—is assumed to vary with the load level and is assumed to decline in the future, as newly installed rotating loads are often connected via frequency converters.
Inertia provided by synchronous generators—decreases with an increasing penetration of RES and varies with the load level of the grid.
It is assumed that, even in a system with 100% generation from RES, i.e., zero inertia from conventional power plants, a residual inertia,
, remains in the grid, which is the inertia provided by the loads, as well as hydro and biomass power plants. Usually, hydro and biomass power plants are RES which comprise AC connected synchronous generators.
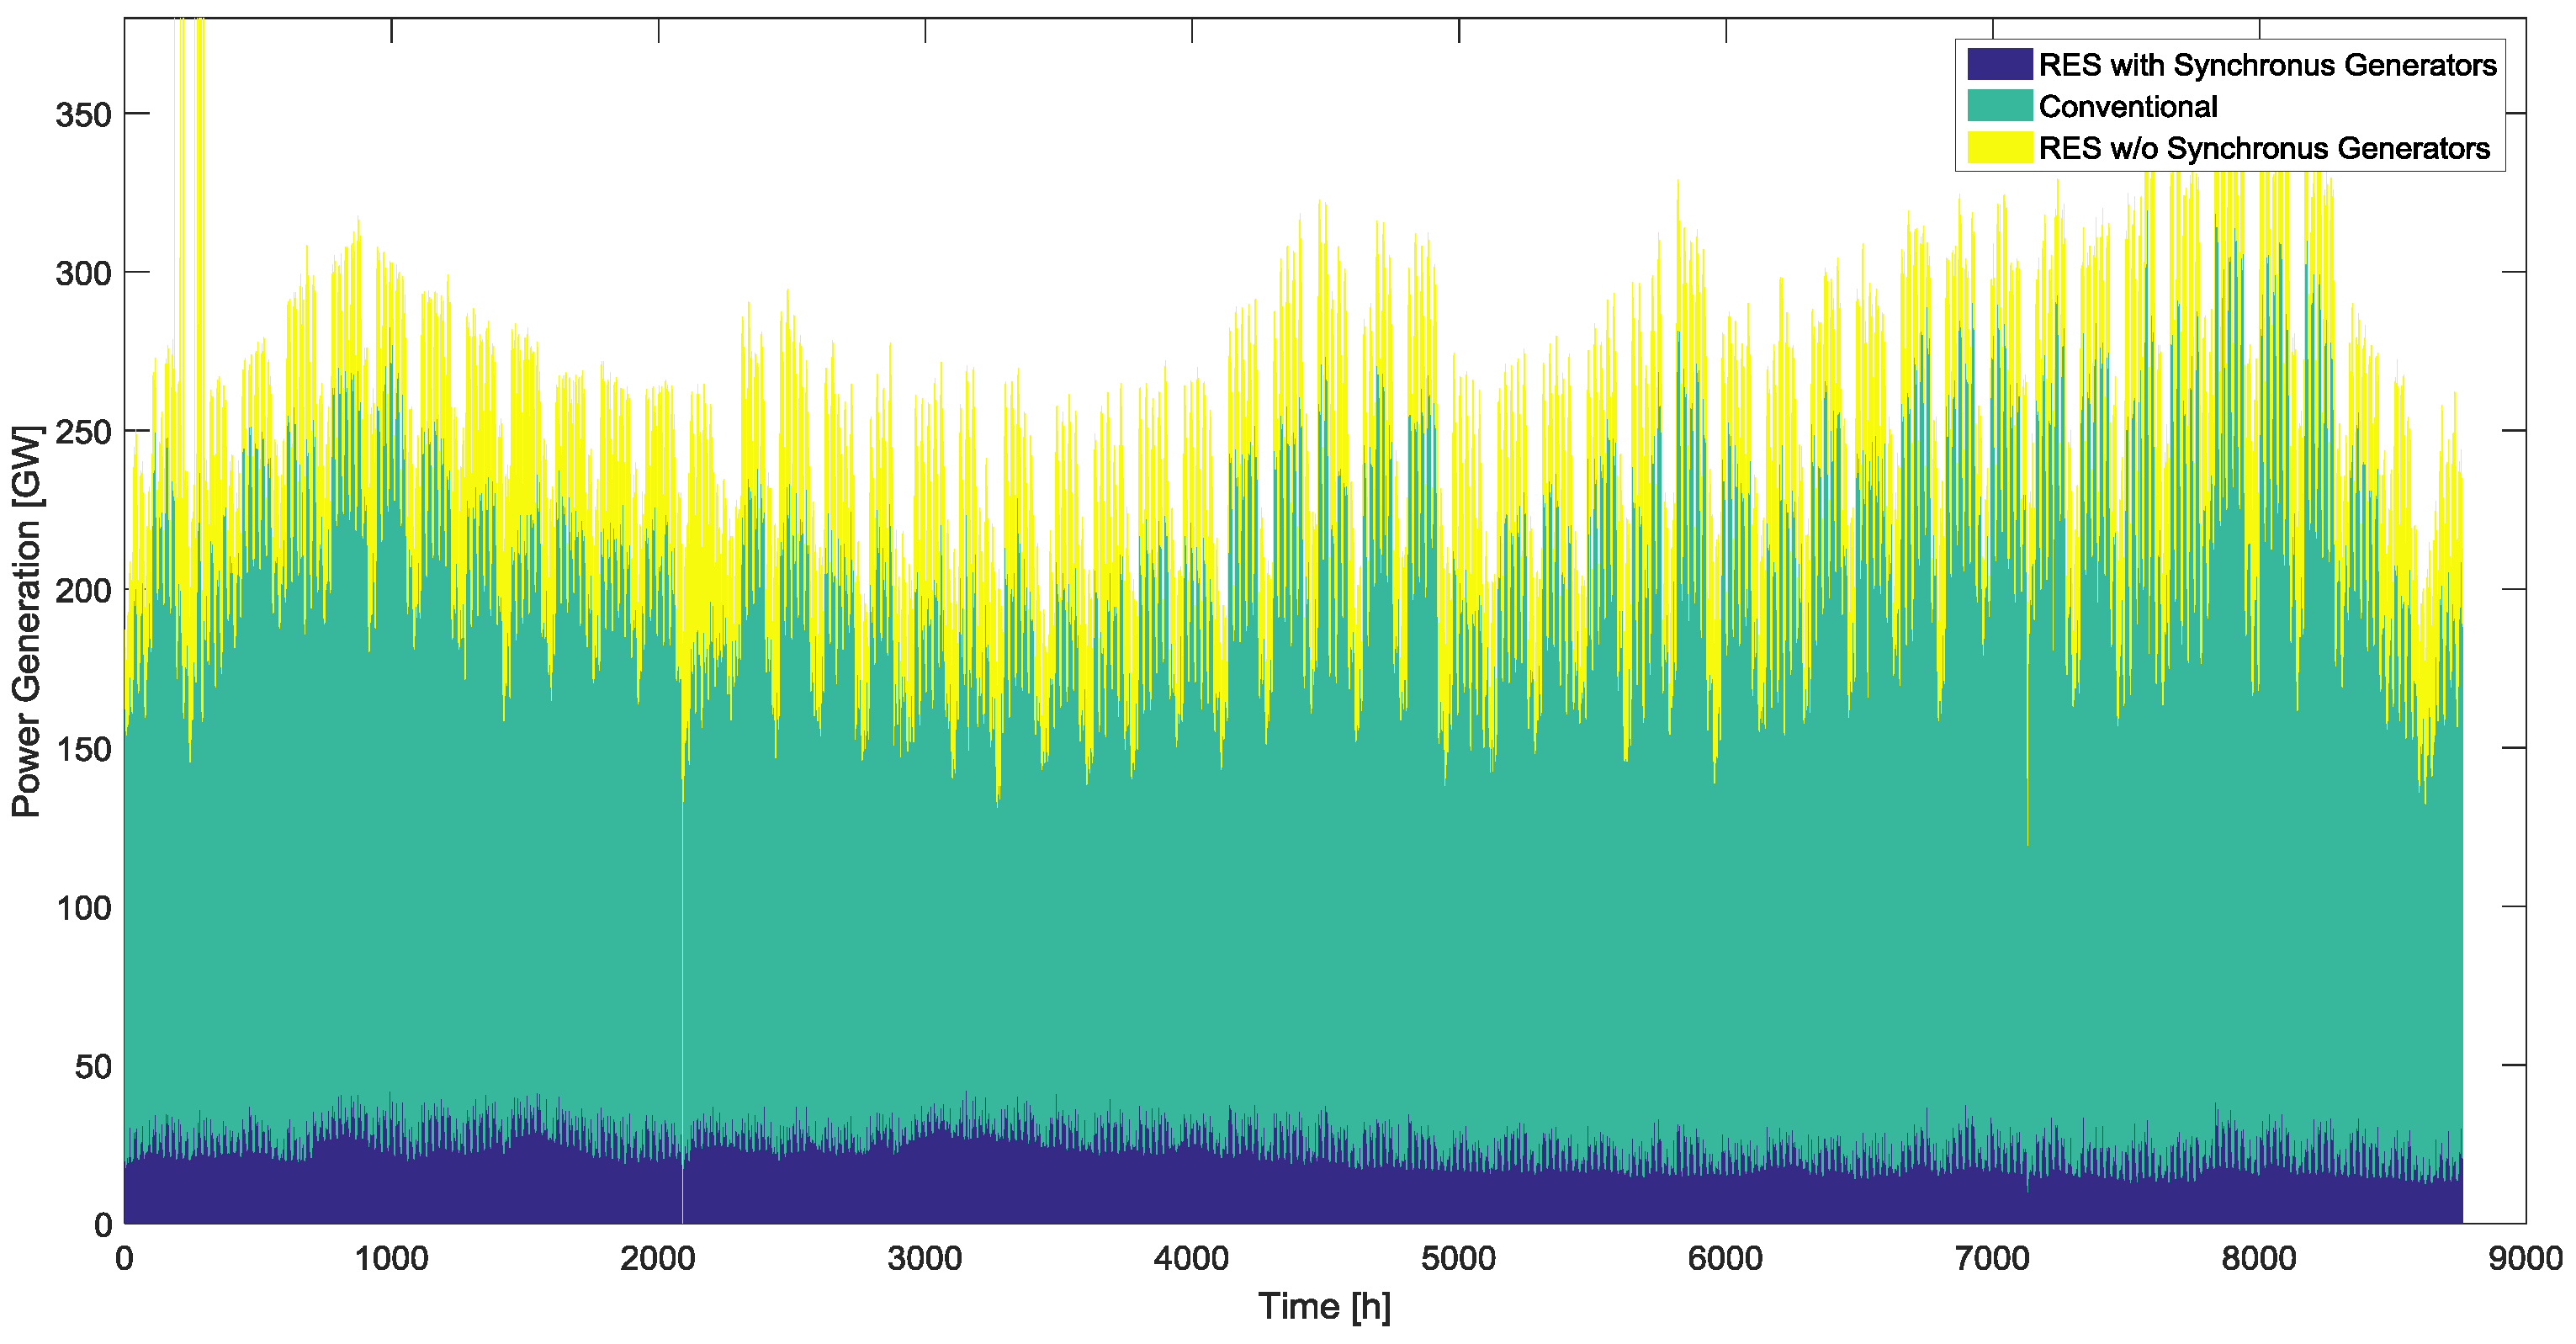
Figure 1 shows the power generation structure in continental Europe in the year 2015 [
24]. The bottom part of
Figure 1 shows RES equipped with synchronous generators (biomass and hydro power plants). Even though volatility is clearly visible, a certain base load of system inertia supplied by RES is obvious. Information drawn from such data can be used to predict
.
However, the decrease in the inertia in the future causes higher ROCOFs, which cannot be handled by the present frequency control method. Hence, additional system inertia has to be provided—so-called synthetic inertia. In contrast to today’s inertia it will not necessarily be provided by rotating masses, but by any kind of very fast reacting generation or storage units. In contrast to PCR providing power plants, these units are assumed to respond instantaneously. If these units emulate the behaviour of today’s inertia, the frequency control method will not have to be changed.
Today’s inertia automatically exchanges power with the grid, whenever the grid frequency changes. The amount of power exchanged depends on the ROCOF and the frequency. The energy exchanged, is determined by the frequencies at the beginning and the end of the frequency excursion.
Energy from system inertia: The provided energy is equal to the change of kinetic energy, which is stored in the rotating parts of the machines. The kinetic energy is described in Equation (2). Comparing the kinetic energies for two different frequencies, the difference can be described with Equation (4):
Power from system inertia: The feed-in power from inertia is the gradient of the kinetic energy, which is stored in the rotating parts of the machines. It can be calculated by differentiating Equation (2) with respect to time:
Equation (5) shows, that the power provided by the system inertia depends on the frequency and the ROCOF. The provided power reduces the imbalance in the numerator of Equation (1) and counteracts the change of frequency and, therefore, limits the ROCOF.
From the paragraph above, it becomes obvious, that the traded unit should be inertia. If power was used instead, the amount of energy needed to limit the absolute change of frequency would be neglected (target 2 of the frequency control). By using energy instead, the instantaneous power response and therefore the ROCOF criteria (target 1 of the frequency control) would be neglected. As shown above, synthetic inertia could fulfil both targets at the same time by emulating today’s inertia. In contrast to PCR, system inertia would be used almost anytime. This is a major difference between trading inertia and trading PCR power.
4. Dimension of a Storage System for the Provision of System Inertia
Potential bidders in a future scenario must dimension their units for the provision of synthetic inertia in terms of power and energy. As mentioned in the previous section, futures system inertia is a combination of the residual inertia, , and the synthetic inertia, . In a first approach, established energy storage technologies are evaluated for the provision of synthetic inertia.
Each storage unit is connected to the electrical grid via a power conversion system (PCS). Assessed storage technologies in this paper are three types of battery storages (li-ion, lead acid, and sodium sulphur), supercapacitors, and flywheel storage systems. Power is provided almost instantaneously with a deployment time of 10 ms for flywheels and super capacitors and a deployment time of 5 ms for the battery storage systems after the detection of the imbalance [
25]. The input signal for the PCS would be the grid frequency. Hence, a certain amount of inherent inertia needs to be provides by any kind of rotating mass, i.e., the residual inertia. Otherwise, the grid frequency would change instantaneously and infinitely steep, hence, it would not be possible to react appropriately. The amount of
needed is determined by the largest permitted ROCOF, i.e.,
= 2 Hz/s. It can be calculated by rearranging Equation (1) and leads to 759,908 kg·m
2 for the standard loss of generation scenario in the ECSA (ENTSO-E reference incident). One part of
is provided from the consumer side and is, hence, unknown. Therefore, it is neglected and
is assumed to be supplied by rotating masses of hydro and biomass power plants only. Rearranging Equation (3) for
and using the inertia constant of a large hydro power plant (
), as well as
= 759,908 kg·m
2 leads to an overall rated power of 12.49 GW for the ECSA [
26]. Compared to the power feed-in from RES equipped with synchronous generators shown in
Figure 1, it seems achievable, that futures
could be provided solely by such generation sources. It has to be noted that it is a conservative approach to assume a capacity factor of 100%, as it is unlikely that all synchronous generator based RES run at full load at any time.
In the next step, the amount of required synthetic inertia is determined with the help of frequency simulations.
is increased stepwise, until the sum of residual (
) and synthetic inertia (
) also meet the second frequency control target mentioned in
Section 4.
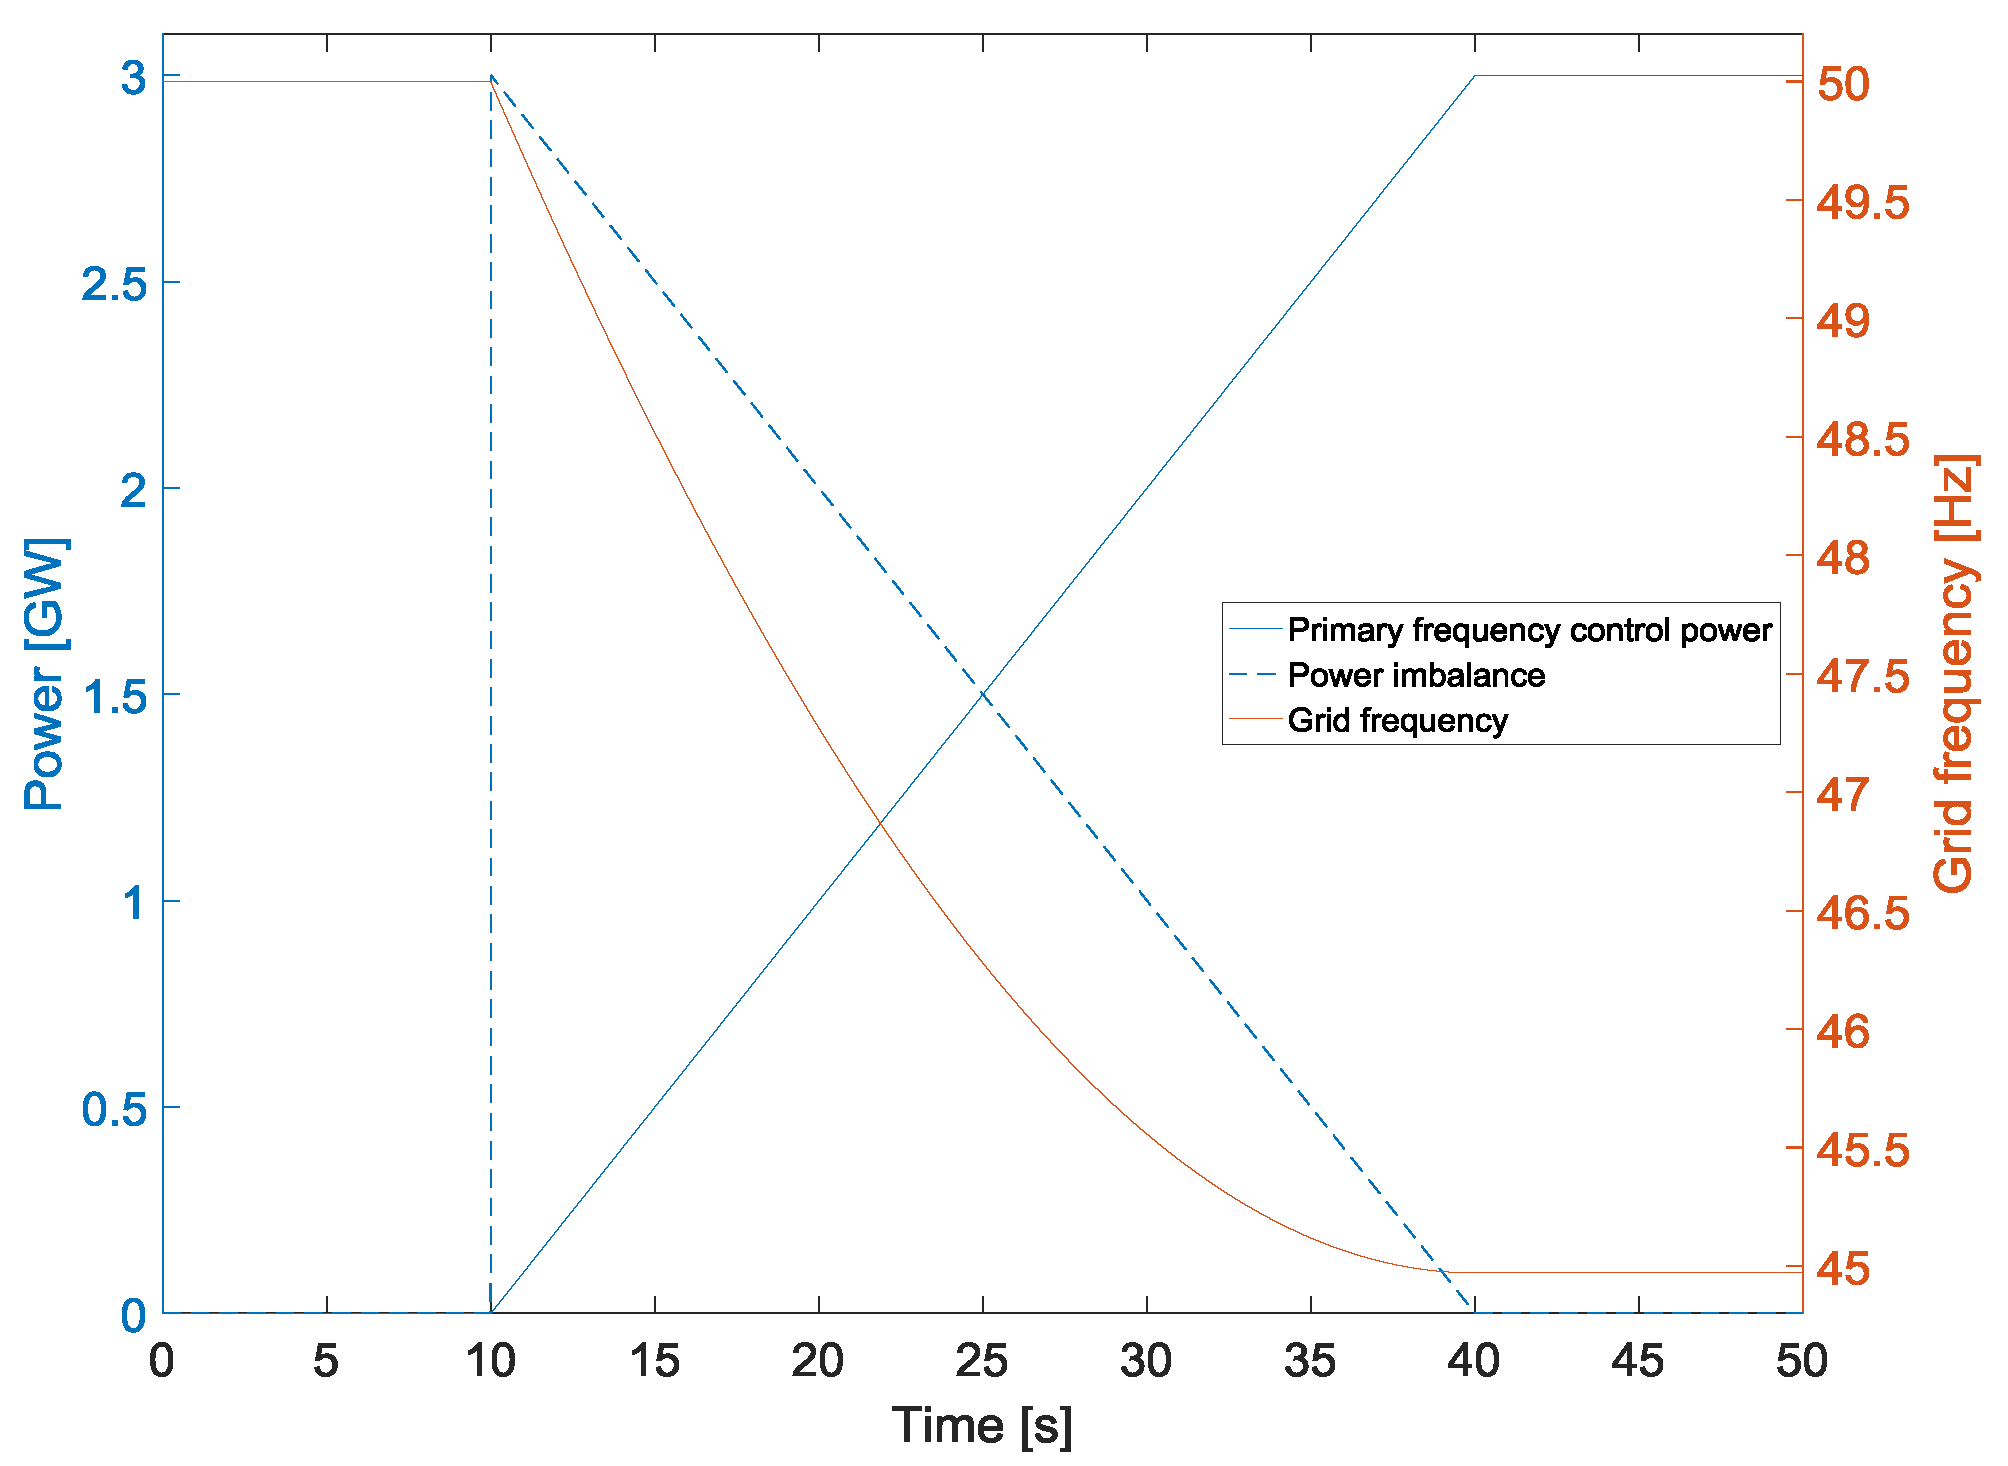
Figure 2 shows the time trace of the frequency based on the ENTSO-E reference incident applying
. The effects of SCR are not shown which is why the grid frequency levels out at 45 Hz. Once the imbalance is detected, power plants offering PCR start to adapt their power output. The additional power reduces the imbalance of the torque in the numerator of Equation (1). This results in a decreasing decline in the grid frequency.
Figure 2 illustrates the fact that
alone does not limit the frequency to the threshold of 49 Hz. Hence, synthetic inertia is essential for frequency control. With simulations, the needed
to stay above 49 Hz is determined to be
kg·m
2 for the ECSA. It is the spread between
, which results in the achievement of the first frequency control target and
which is the minimum amount of system inertia necessary to achieve both frequency control targets.
The maximum power and energy needed from the energy storage system emulating the characteristics of present system inertia are calculated by adapting Equations (4) and (5). To calculate the maximum power the highest allowed grid frequency (51.5 Hz) and the maximum ROCOF (2 Hz/s) are taken. Equation (6) shows the relationship where the frequency is expressed in terms of angular speed
. In Equation (6)
results in 12.65 GW for the ECSA if
is set to
kg·m
2 (derived above), if the maximum permissible frequency is set to
f = 51.5 Hz and the maximum permissible ROCOF
) is applied.
The maximum needed energy for the provision of synthetic inertia is calculated using Equation (7):
Nowadays, synchronous generators provide energy by automatically adapting the kinetic energy in their rotation. The generators have to remain connected to the grid as long as the grid frequency is between 51.5 Hz and 47.5 Hz [
23]. Hence, the kinetic energy, which is stored in the rotating masses has to be determined for a variation in rotational speed that results from a grid frequency variation from 51.5 Hz to 47.5 Hz. Applying these frequencies and
as determined above, in Equation (7), leads to
Ws = 6.75 MWh. This is the minimum energy that a future energy storage systems providing synthetic inertia has to be able to supply.
In order to show the functionality of storage units providing synthetic inertia, their behaviour in the event of the ENTSO-E reference incident and the behaviour for current grid frequencies is modelled. As stated in the beginning of this section, five different types of storage units are assessed and grouped based on their deployment time.
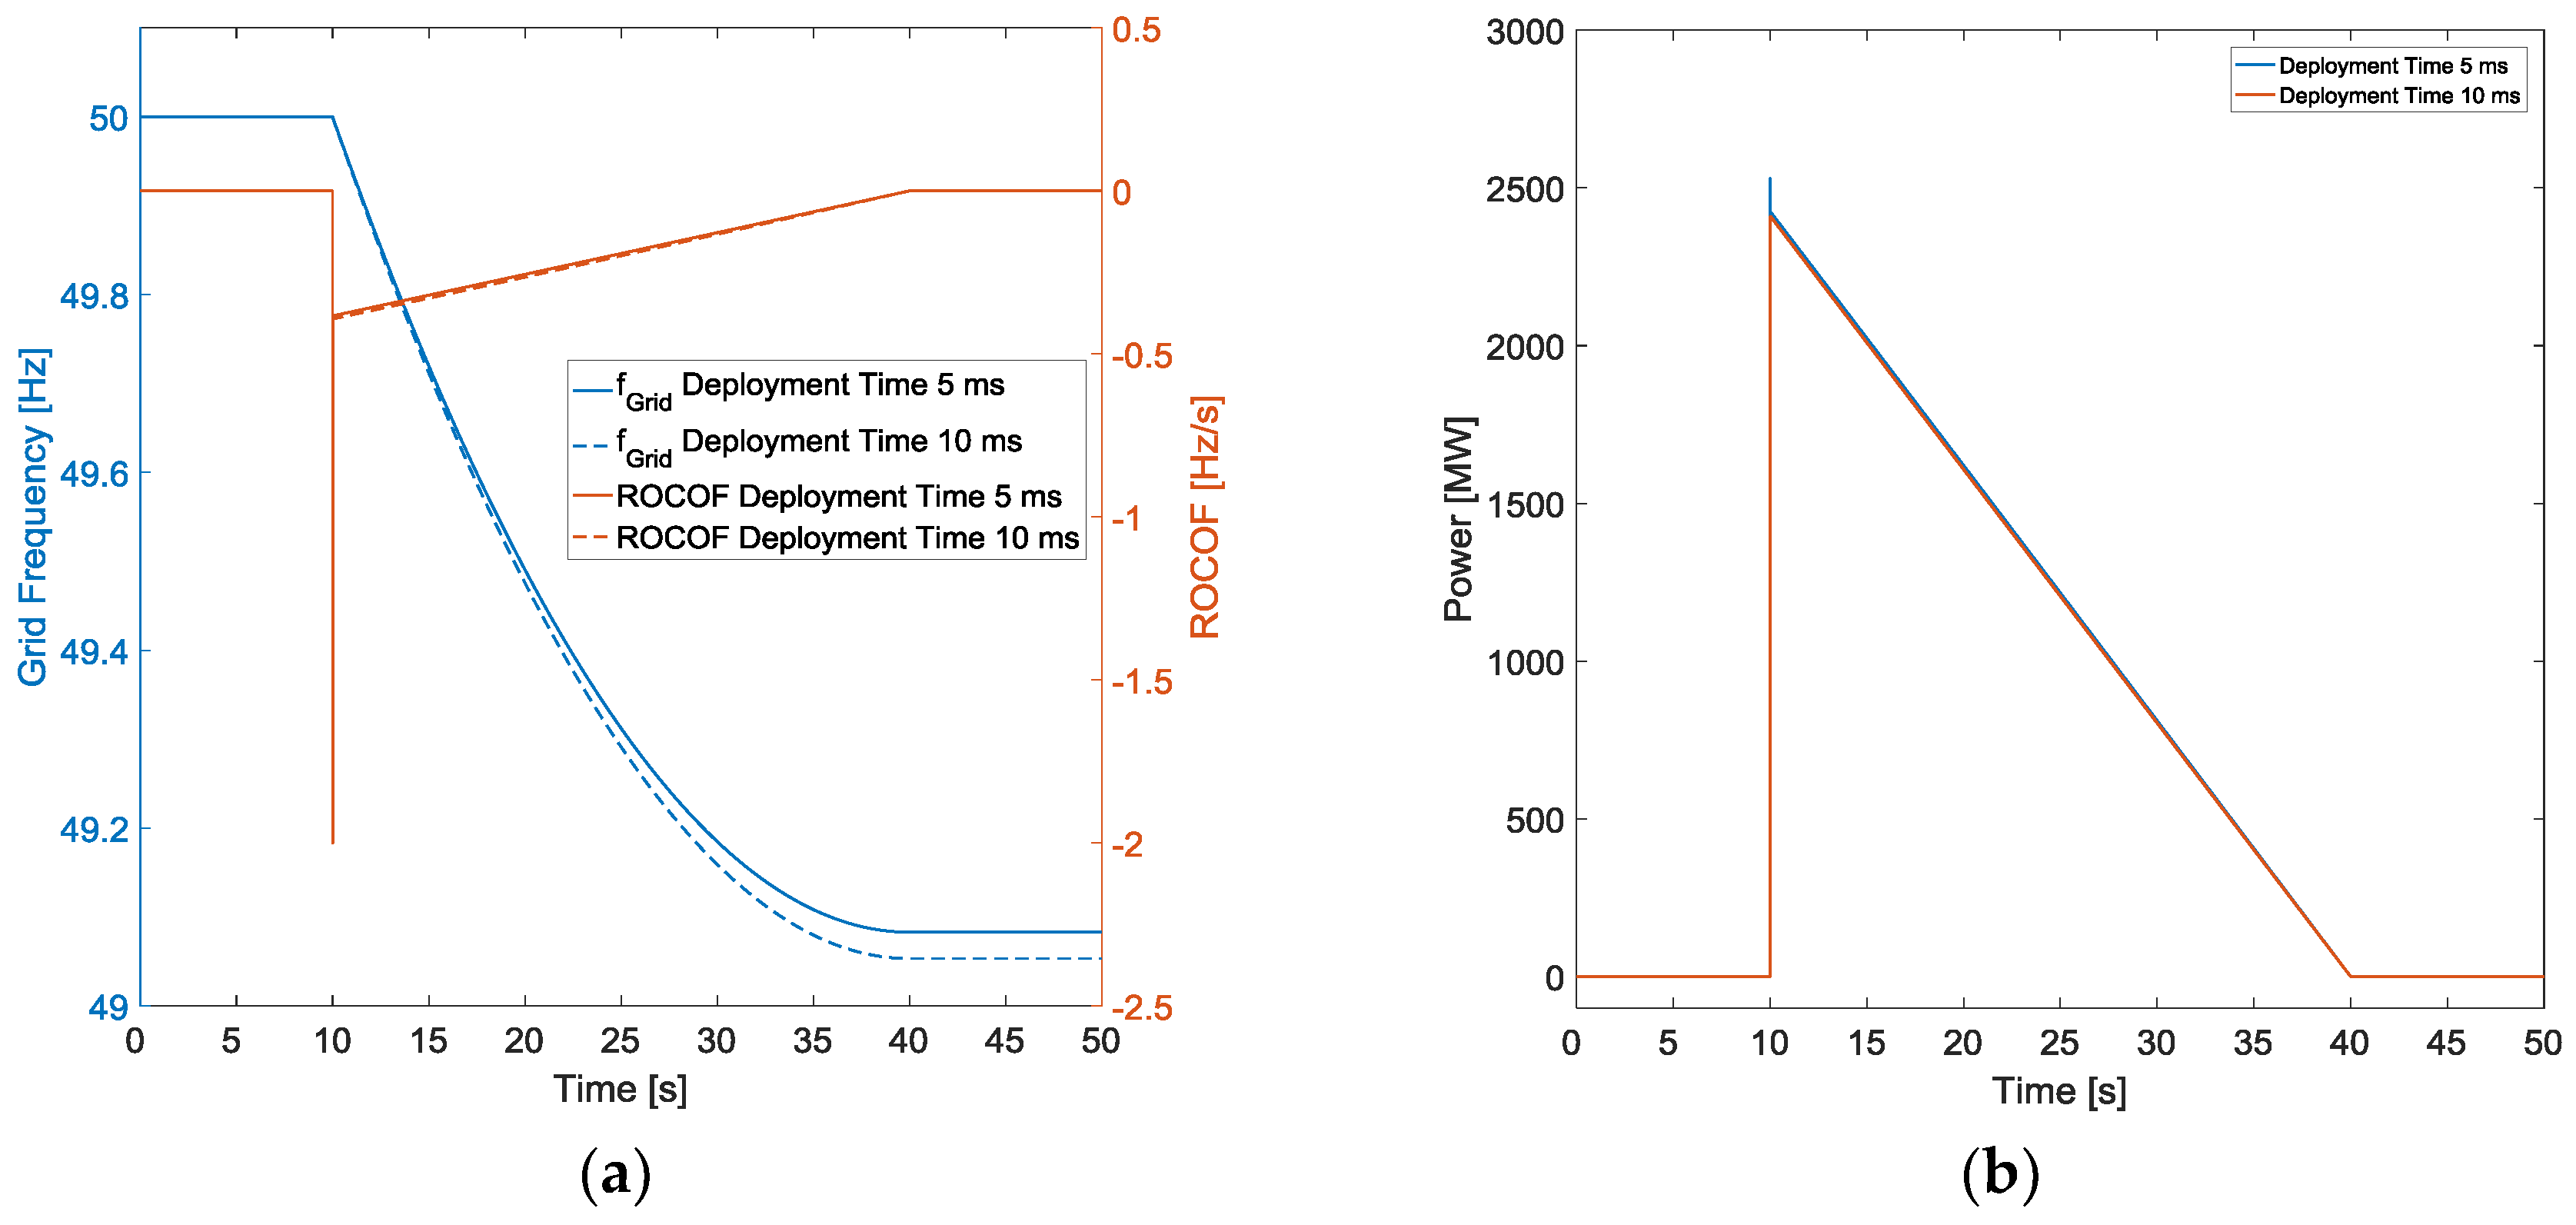
Figure 3a shows the time traces of the grid frequency and the ROCOF. The blue and solid red lines show the grid frequency and ROCOF, respectively, for the provision of synthetic inertia via storage units with a deployment time of 5 ms (li-ion, lead acid, and sodium sulphur). The dotted lines display the grid frequency and the ROCOF using storage units with a deployment time 10 ms (flywheel and super capacitors). Obviously, storage units with a slower deployment time lead to a lower grid frequency nadir.
Figure 3b shows the power feed-in of the storage units. Storage units with a faster deployment time have a slightly higher power feed in. Nevertheless, both grouped storage systems are capable of providing the needed synthetic inertia as it is requested by the frequency control targets.
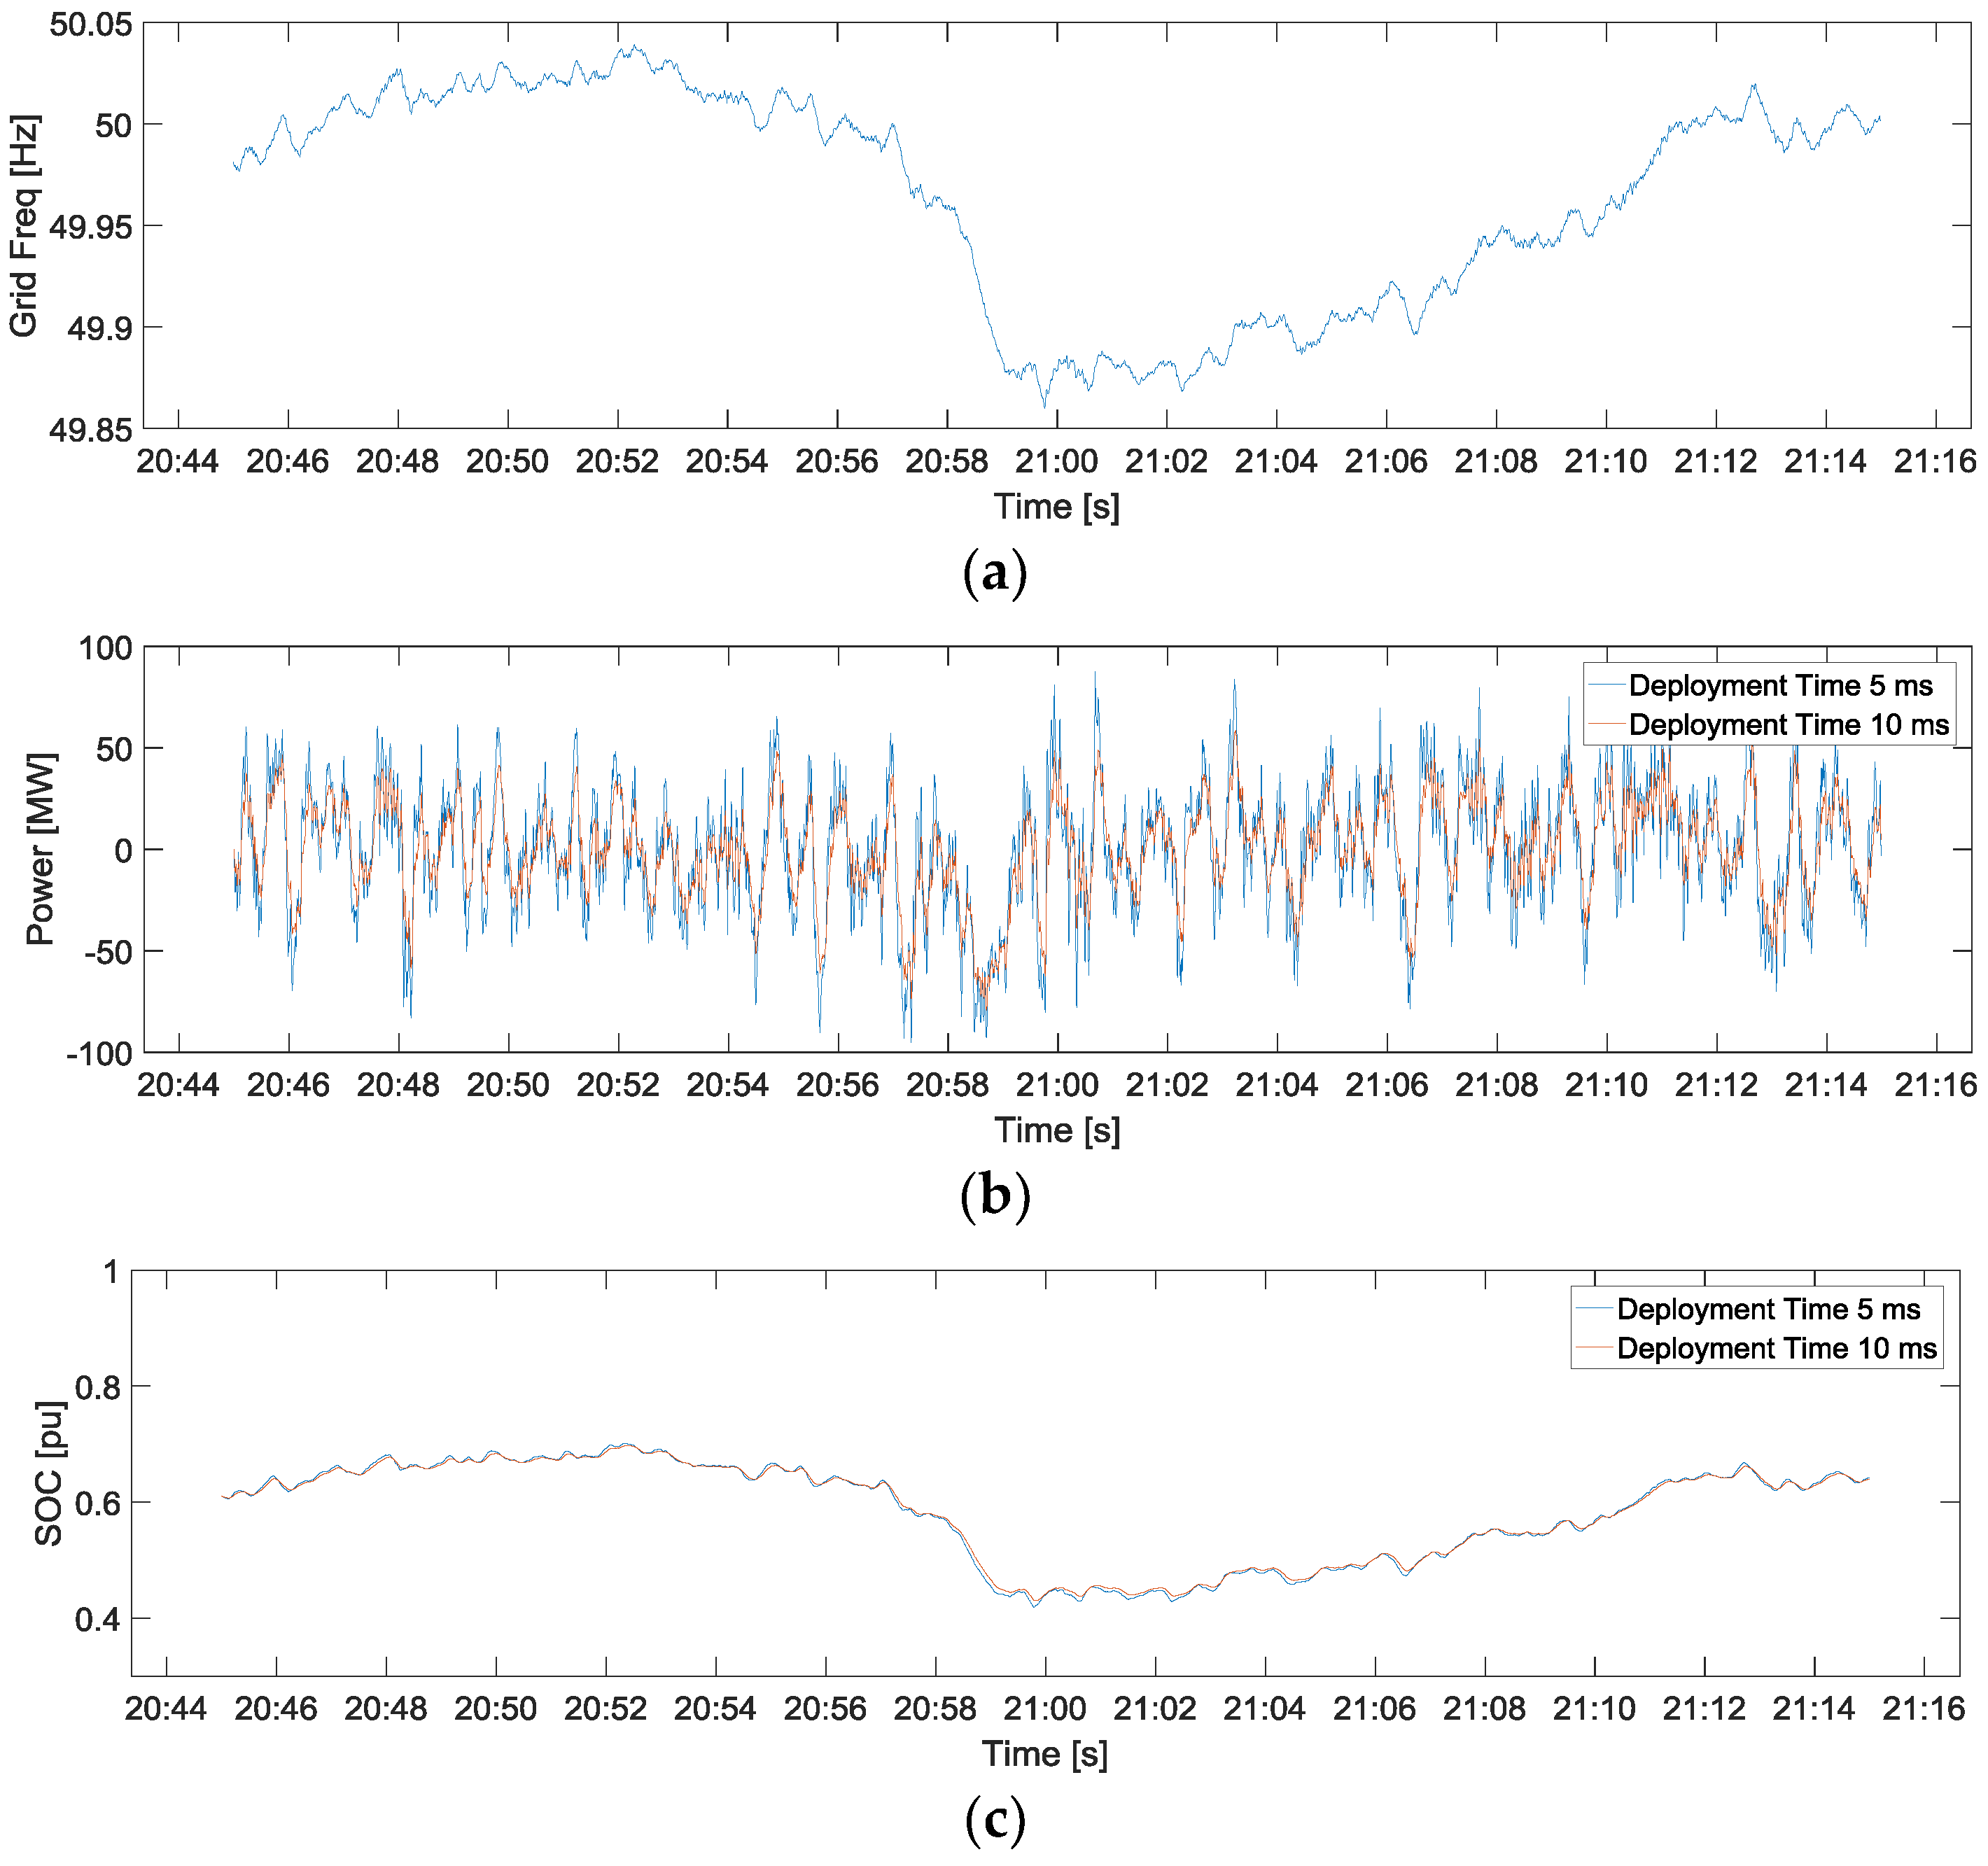
Figure 4 displays the behaviour of the storage units responding to measured time series of the current grid frequency.
Figure 4a shows the grid frequency of the ECSA on 3 March 2016 from 20:45 to 21:15.
Figure 4b illustrates the power feed-in of both grouped storage units. As batteries are capable of providing power with a smaller time delay, the power feed-in is higher compared to storage units with a higher deployment time (flywheels and super capacitors).
Figure 4c shows the state of charge (SOC) of both grouped storage units. At the beginning of the assessed frequency measurement, storage units are charged at a level of 61%. The SOC of storage units with a quicker response time (blue line) is slightly more volatile than the SOC of flywheels and super capacitors.
Storage systems can be located and controlled at different voltage levels [
27]. As current conventional power plants, which are providing inertia today, are commonly connected to high voltage levels storage units providing synthetic inertia could be connected to the same voltage level. However, in order to minimise system losses a detailed assessment of the power flows in the grid has to be undertaken. Synthetic inertia covers gaps between supply and demand; therefore, the power that it exchanges with the grid travels to and from the generators and the consumers. The impedances through which this power travels have to be as low as possible. Hence, a generally applicable rule for the voltage level to which storage units providing synthetic inertia should be connected cannot be made. It has to be ensured that the grid capacity is sufficient for the power flow caused by synthetic inertia. The geographical allocation could be undertaken similar to today’s allocation of PCR [
19]. PCR is allocated based on the contribution coefficient of the various control areas. Nevertheless, future development of the power system has to be considered regarding the geographical allocation of storage units.
5. Economical Evaluation of Power System Inertia
This section determines the economic costs involved for the provision of synthetic inertia by energy storage units. Therefore, different storage units are examined—three types of battery storages (li-ion, lead acid, and sodium sulphur), supercapacitors and flywheel storage systems. The storage systems are financially evaluated using the net present value (NPV) method. Currently, no market for system inertia exists. Consequently, only costs have been considered in the financial evaluation.
The NPV is calculated by taking the initial investment,
, and the cash flow,
, at time
. All cash flows are discounted with the target rate,
r, which reflects the value of alternate usage of the investment as seen in Equation (8) [
28]:
The initial investment is the sum of the storage costs with respect to the needed power and capacity as well as for the costs for the PCS with respect to the power as listed in
Table 1 [
28,
29,
30]. The needed power and capacity are determined in the previous section. The cash flow consists of loan capital repayments, the interest payments and costs for operation and maintenance (O and M). These are represented in costs per year. The loan time of each investment is assumed to be three quarter of the life time of the energy storage unit and the interest rate is 7% [
31]. Each storage unit has a unique life time. Hence, in order to achieve comparable results an examination time of 25 years is assumed. Once a storage technology reaches its expected lifetime, the same technology gets reinstalled. At the end of the examination time the remaining value of the system is being offset as a single revenue. The lifetime of a storage unit depends on a number of fixed charging/discharging cycles within a maximum given lifetime [
32]. Due to present frequency characteristics in the ECSA full cycles are seldom achieved. Hence, the maximum lifetime is not affected by the number of charge/discharge cycles and the maximum given lifetime is used for calculations. The price level increases at a rate of 2% per annum.
It is common practice to compare different electricity generation technologies (conventional and renewables) using the levelised cost of electricity (LCOE) methodology [
33,
34,
35]. Derived from the LCOE methodology, levelised cost of inertia (LCOI) is introduced, in order to introduce a parameter to compare different sources for the provision of synthetic inertia. Equation (9) displays how LCOI is calculated:
The LCOI represents the overall costs with respect to the amount of provided inertia in a certain period. It has been concluded in the third chapter, that neither power nor energy are suitable units for the provision of synthetic inertia. Likewise to the financial concept of PCR, the provision of synthetic inertia is compensated and not the actual utilisation similar to the recently proposed meter-based method [
36]. In this case it is assumed that the tender period is one year. Hence, the unit is €/(kg·m
2·year).
Table 1 gives an overview of the used data. The information have been taken from [
25,
29,
30]. The prices for PCSs are specified for an application at the distribution system [
29]. As labelled, the upper rows of the table indicate the data used for the calculations; the lower rows contain the results.
The lowest NPV, i.e., the least cost solution, for the provision of synthetic inertia is found to be the flywheel storage unit with NPV = €7.19 billion. It is followed by supercapacitors with NPV = €8.24 billion and li-ion batteries with NPV = €8.82 billion. Also in terms of LCOI, the flywheel system is the cheapest technology with LCOI = 167.64 €/(kg·m2·year), followed by supercapacitors and li-ion batteries.
6. Conclusions and Future Research
This paper emphasises the importance of system inertia and the necessity of synthetic inertia for future frequency control. Synchronous generators of conventional power plants are being replaced by RES equipped with frequency converters, which do not provide system inertia. System inertia is essential for frequency control as it limits the ROCOF and provides PCR with time to adjust its power.
In a future power system insufficient system inertia has to be compensated by the provision of synthetic inertia. Synthetic inertia is the behaviour of frequency converter equipped generation or storage units, emulating synchronous generators. This can be achieved by appropriate control strategies. The yet free of charge service inertia, has to be traded in a future power system due to additional costs for the provision of synthetic inertia. A suitable trading unit is inertia (kg·m2), as it represents the behaviour of present synchronous machines regarding system inertia. Levelised cost of inertia (€/kg·m2) is a suitable comparison parameter for the provision of inertia by different sources.
Different energy storage units are evaluated regarding the emulation of system inertia. As incomes for the provision are not yet assessable, only costs are considered. The NPV concludes, that the provision of synthetic inertia by a flywheel storage system is the least costly solution with overall system costs of €8.23 billion for the evaluated examination period. Adapting the newly introduced LCOI and assuming a tender period of one year leads to costs of 167.64 €/(kg·m2·year) for the provision using flywheel storage systems.
A future market for inertia will presumably reduce costs for the provision of system and synthetic inertia. RES are capable of providing synthetic inertia, too [
5,
6,
29,
37]. Future research will indicate whether these sources are capable of providing synthetic inertia at lower costs then the evaluated storage systems in this work. Currently, a research project is conducted at the Wind Energy Technology Institute, in cooperation with the wind turbine manufacturer Suzlon Energy. In this project the provision of synthetic inertia with wind turbines is assessed in terms of performance and in terms of consequences for the mechanical loads, hence, costs. It has to be acknowledged though that RES generators, like wind turbines, cannot provide synthetic inertia permanently, but only at times of operation. Hence, alternative technologies, which are independent from the availability of prime energy, are inevitable.


