
Energy Simulation of a Holographic PVT Concentrating System for Building Integration Applications

 ,
,  , and
, and
Abstract
:1. Introduction
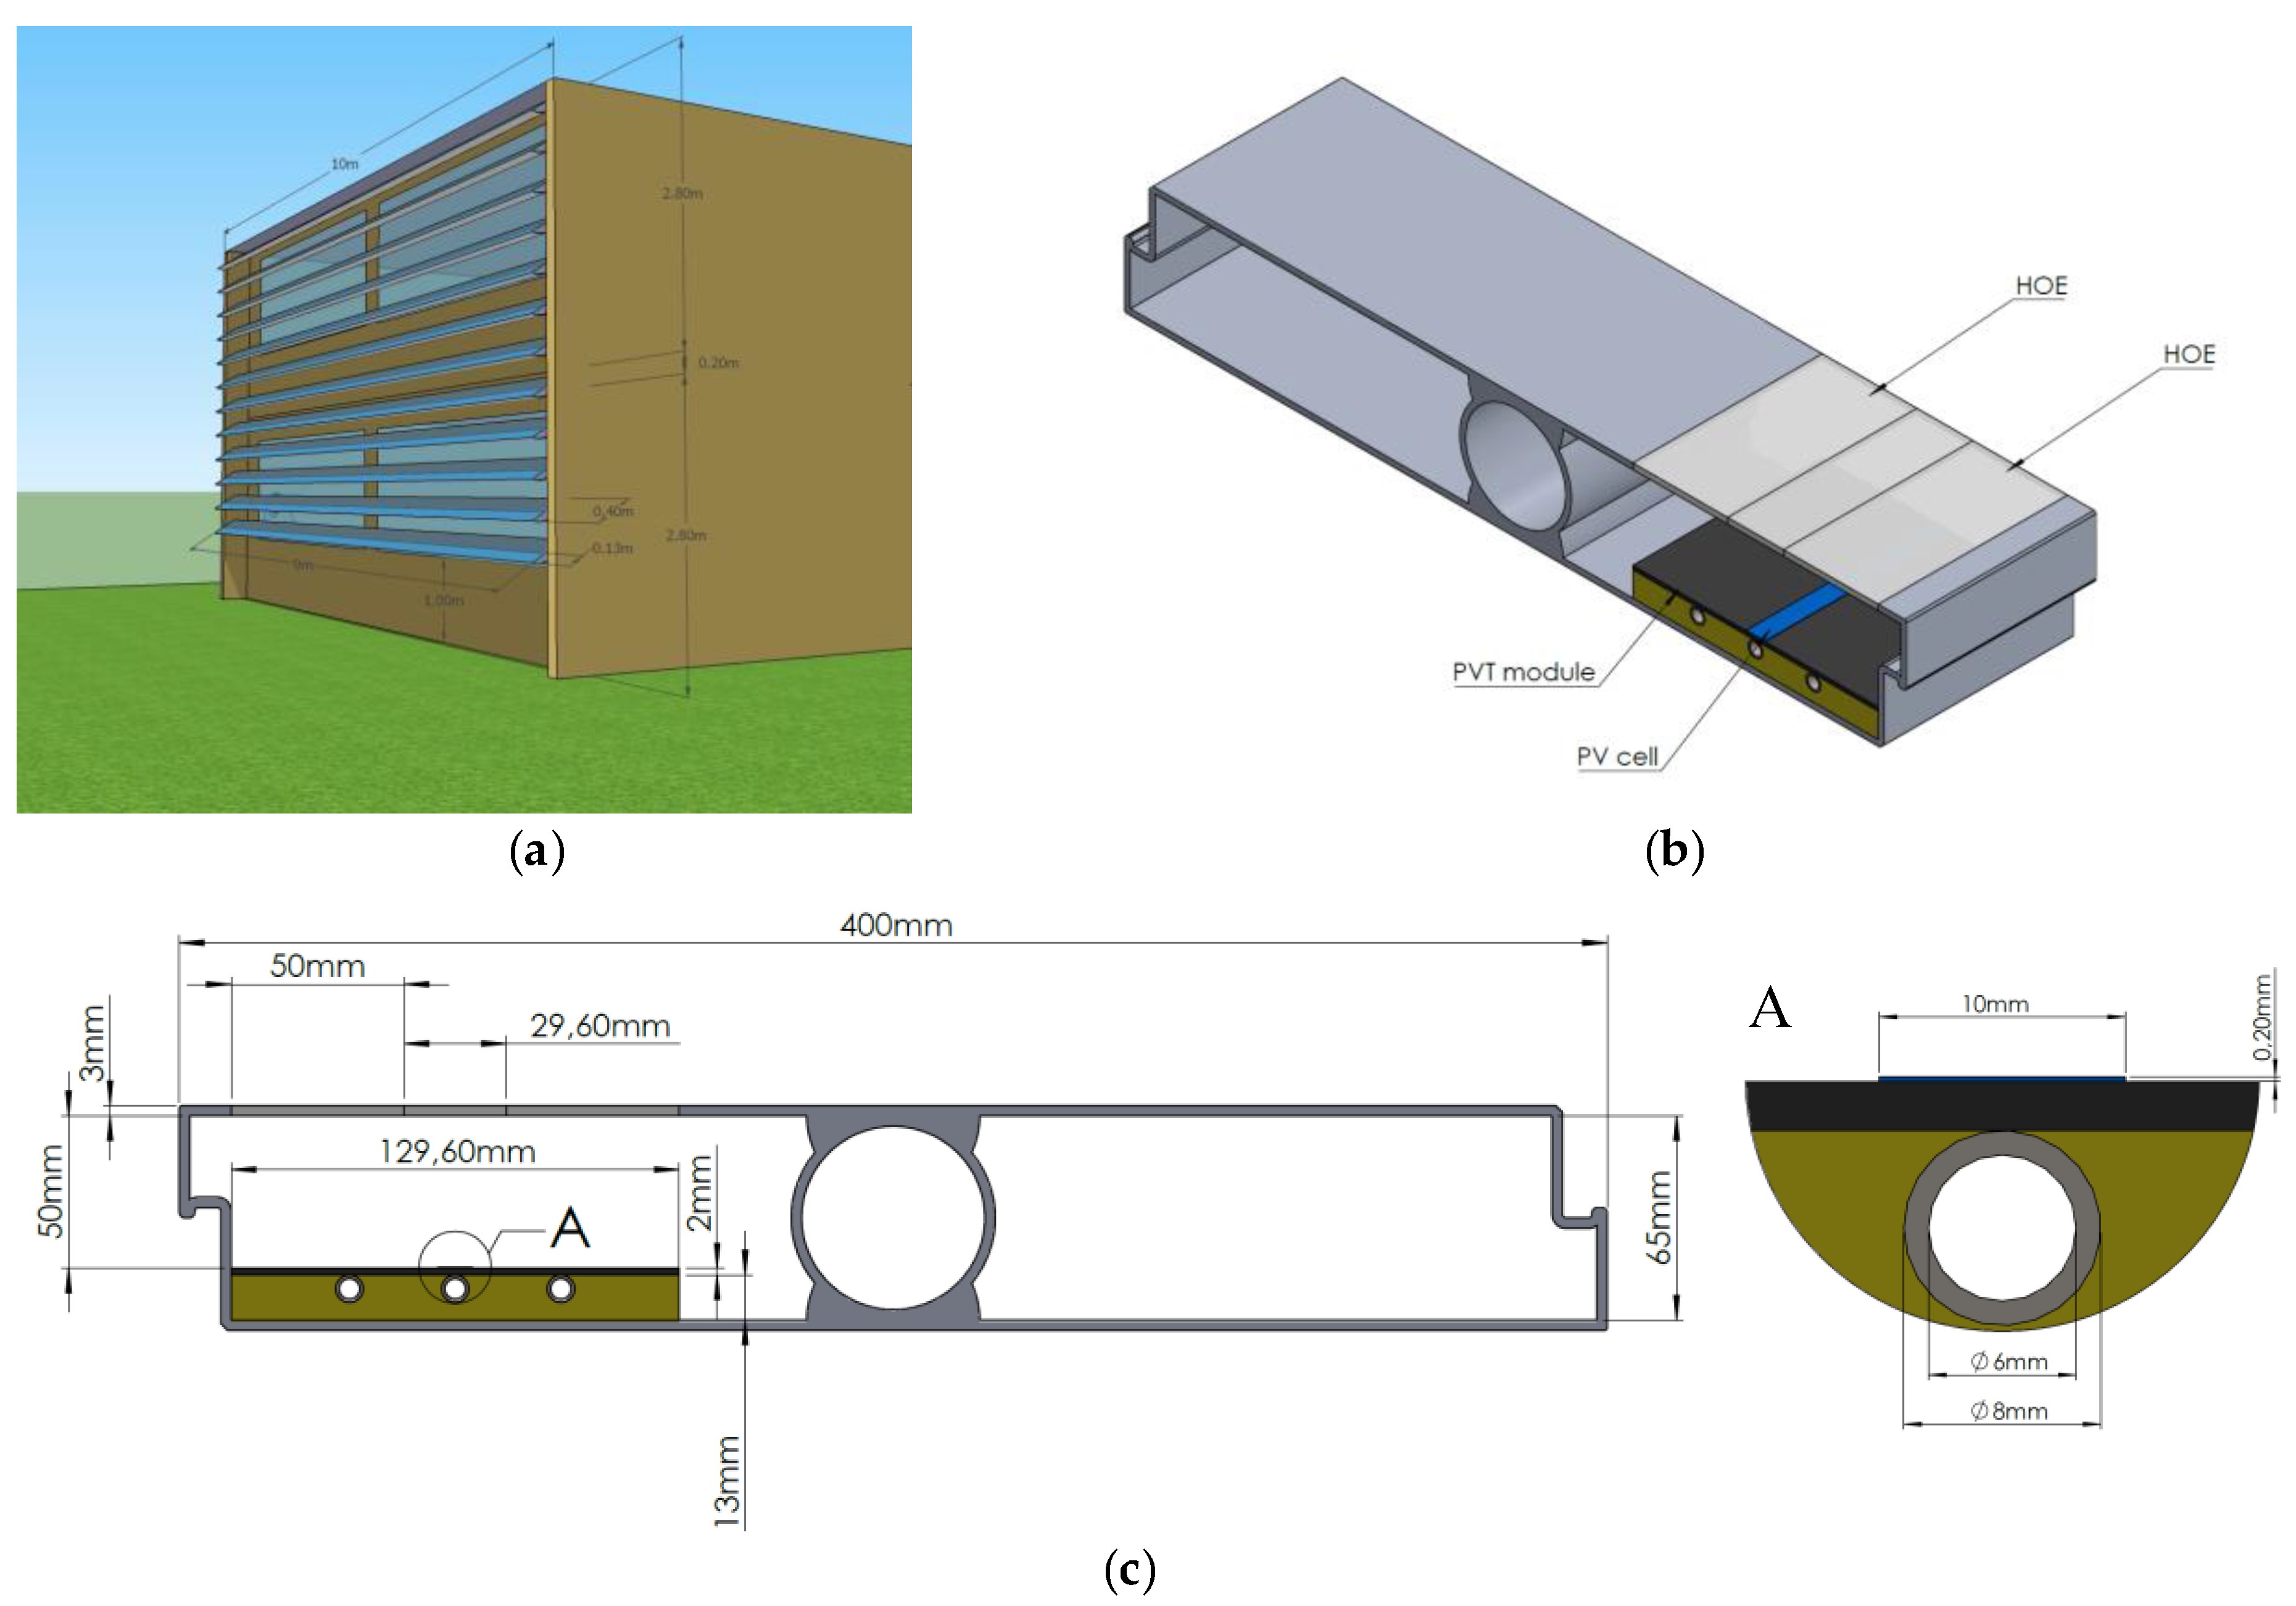
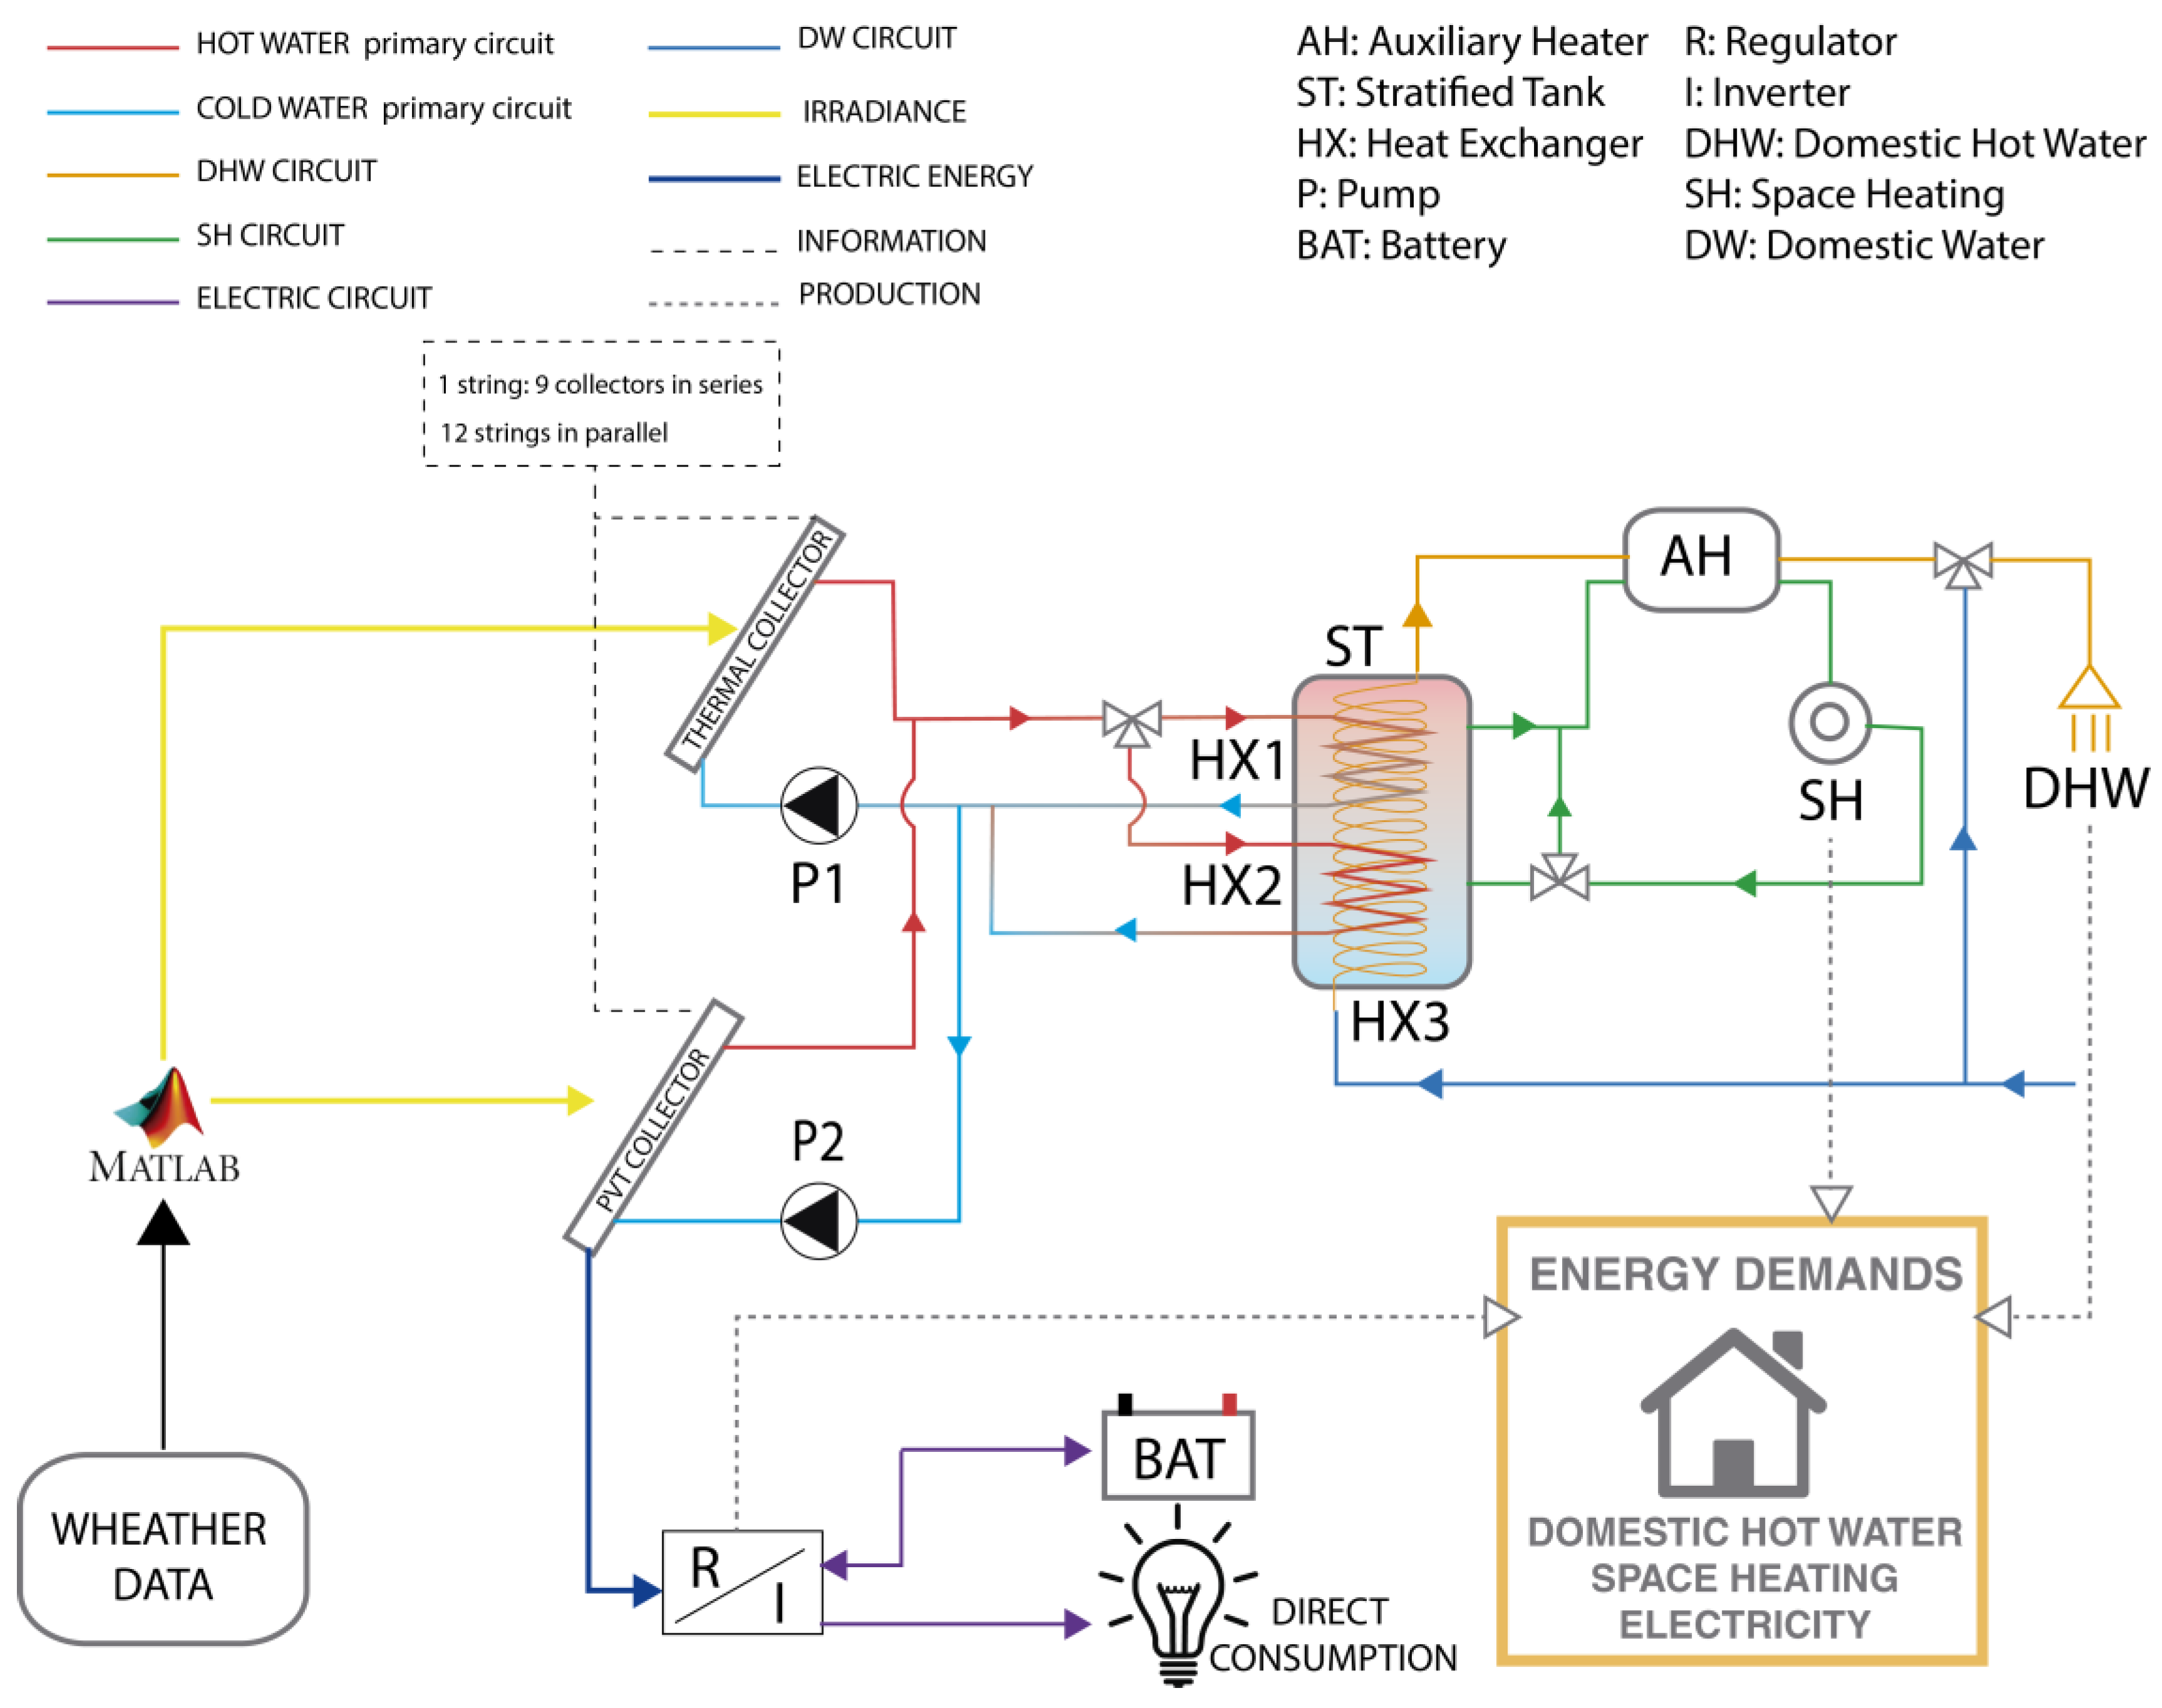
2. System Description
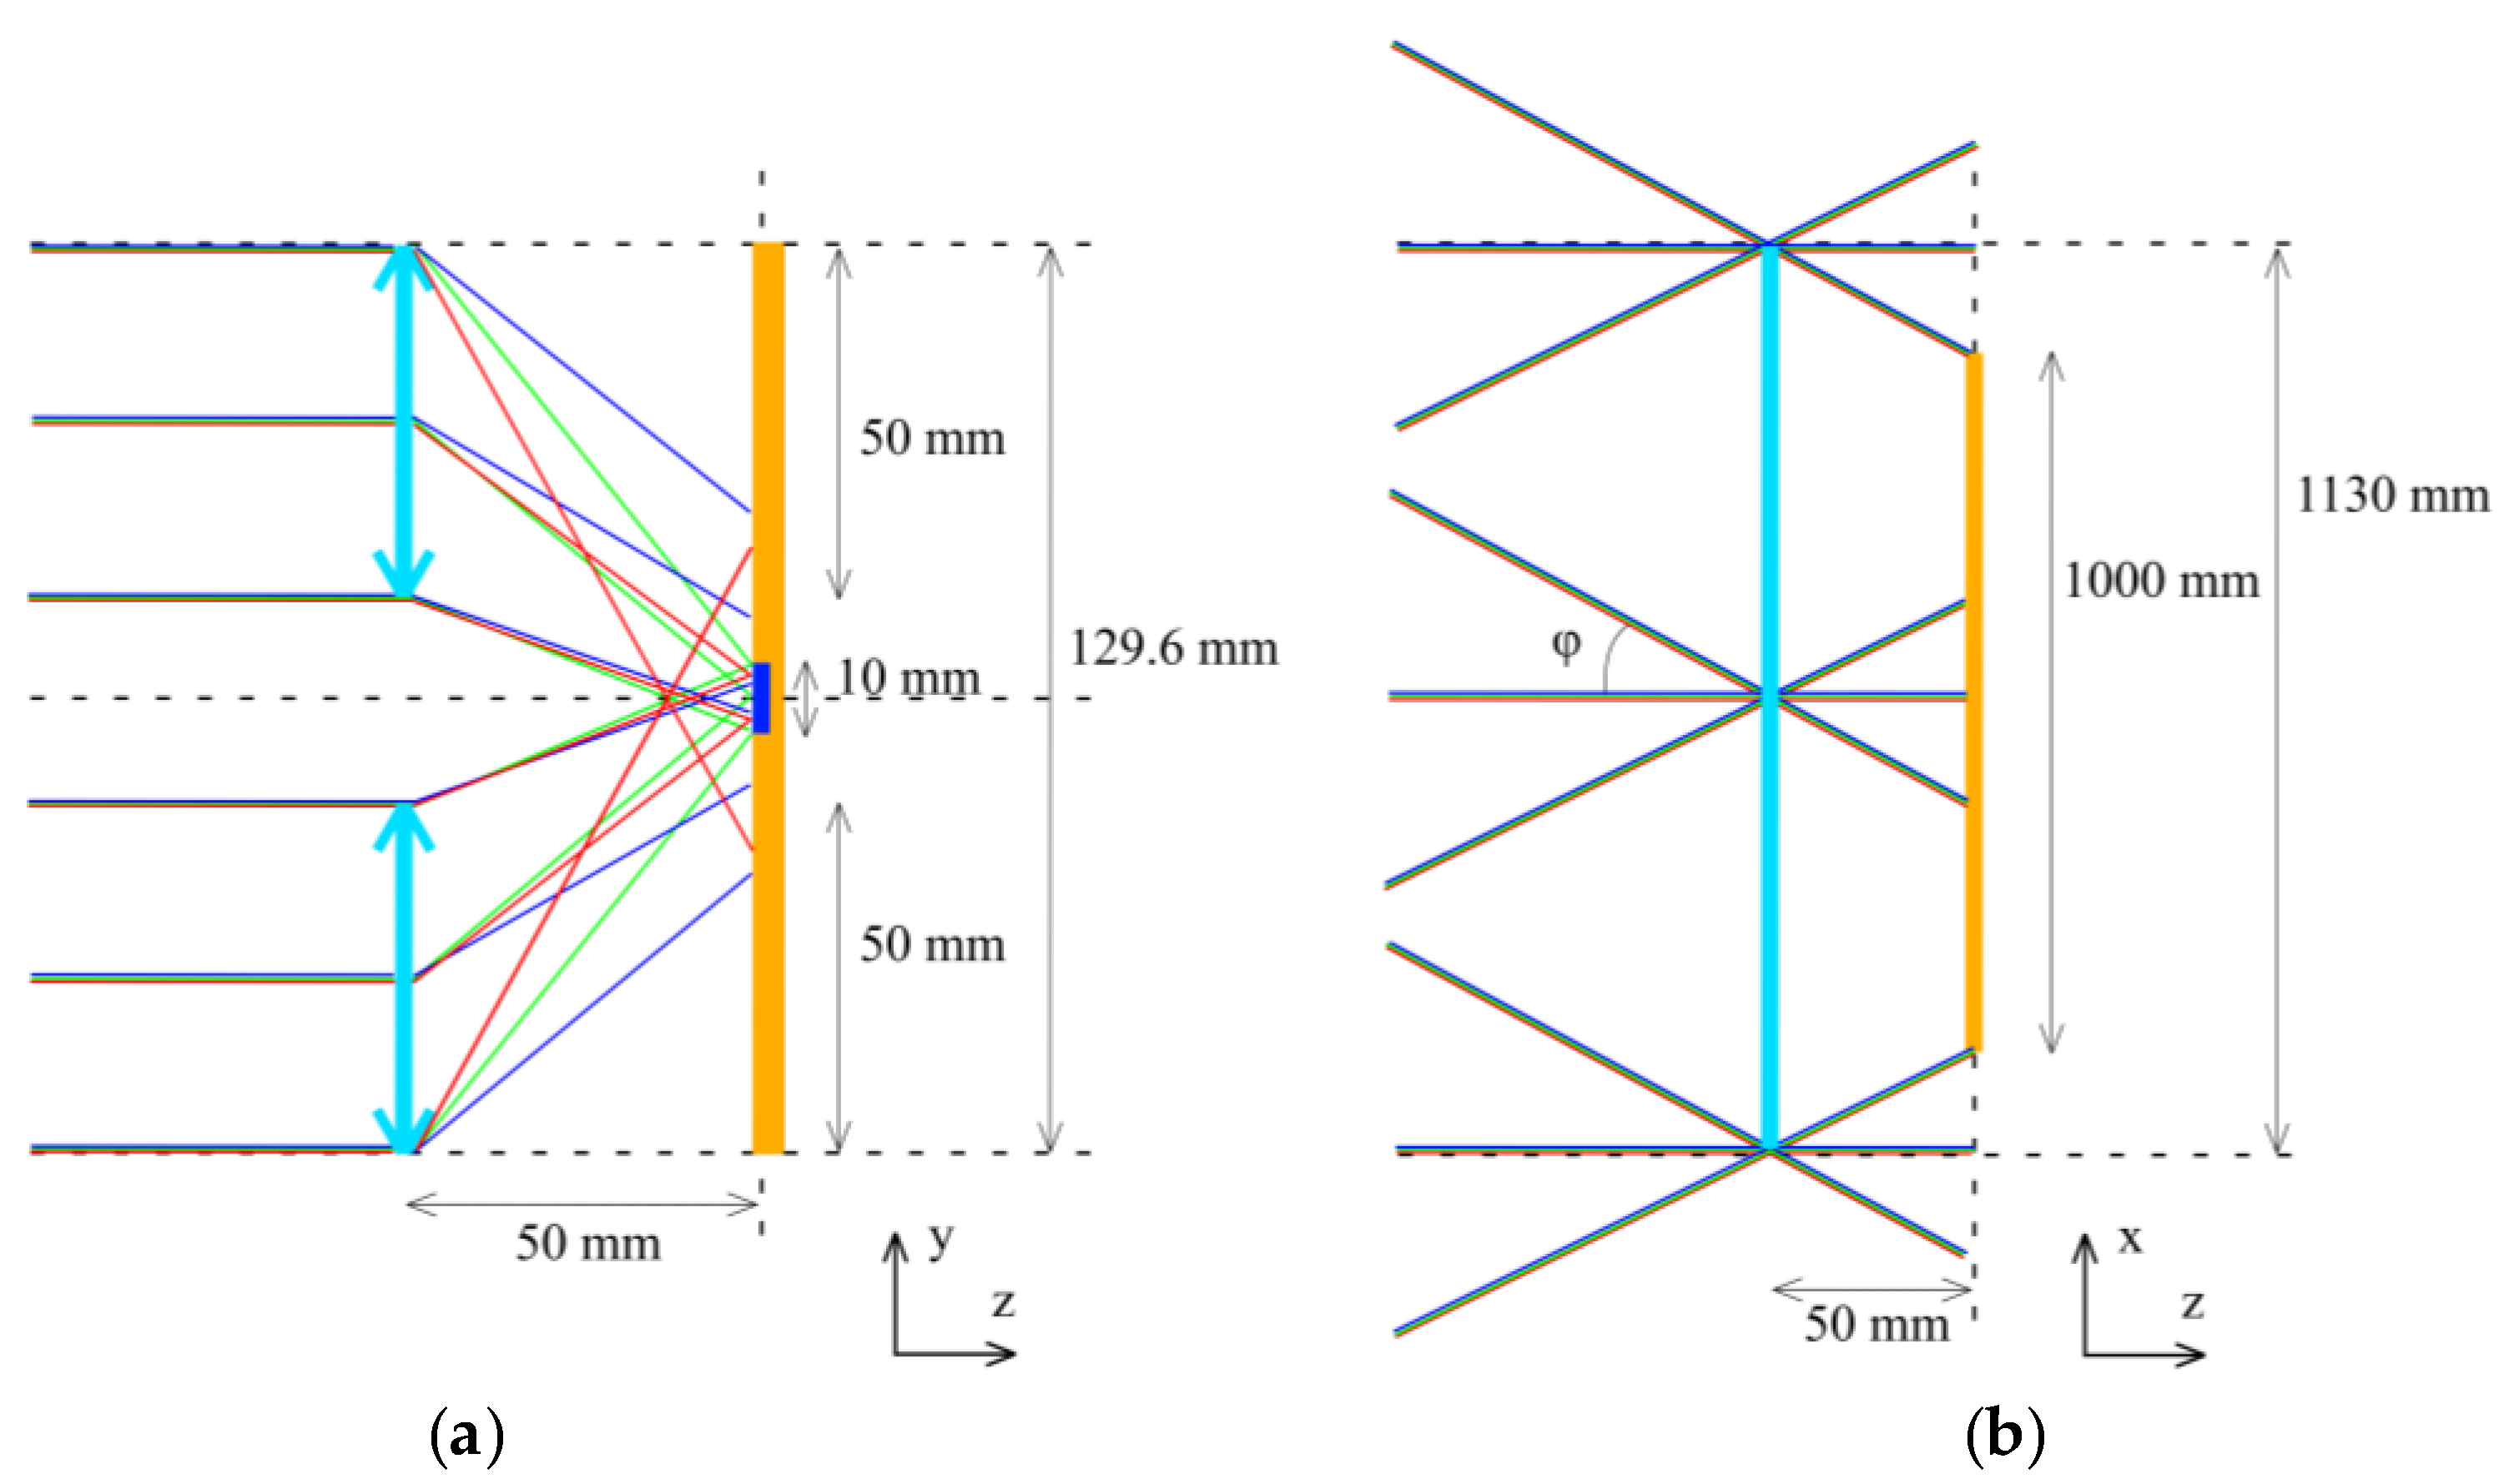
2.1. Holographic Optical Element
2.2. Hybrid Photovoltaic-Thermal Module
3. Methodology
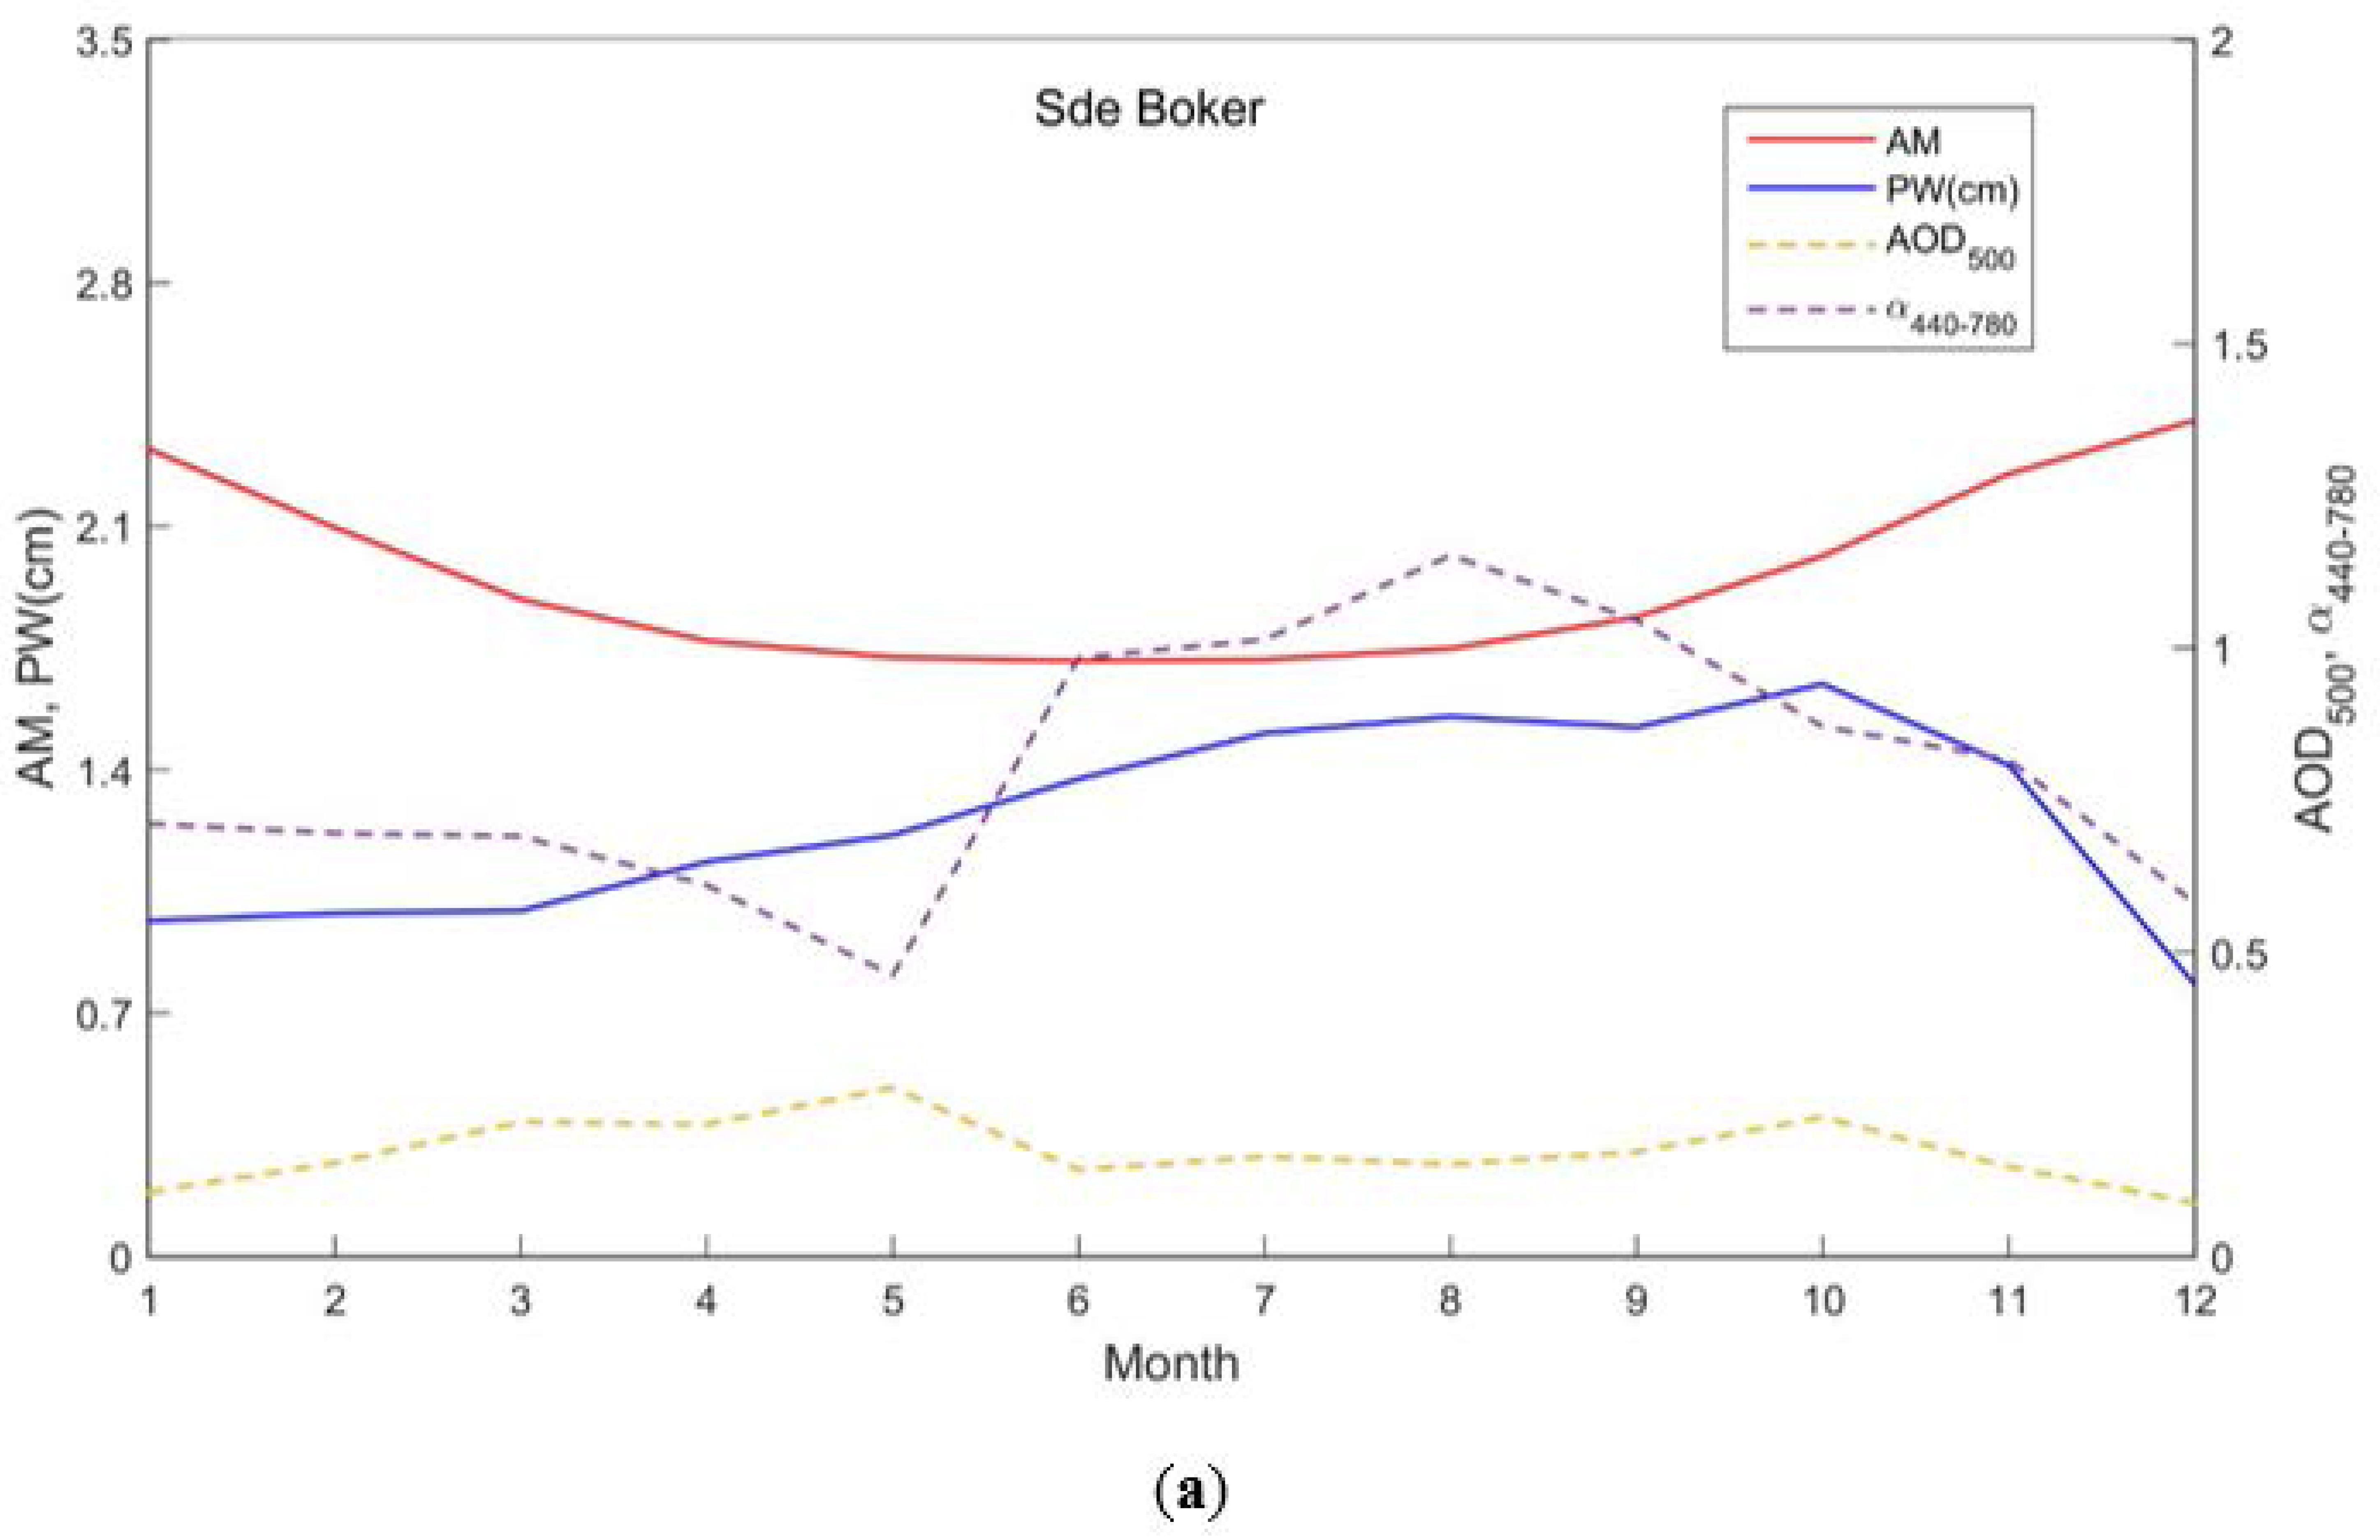
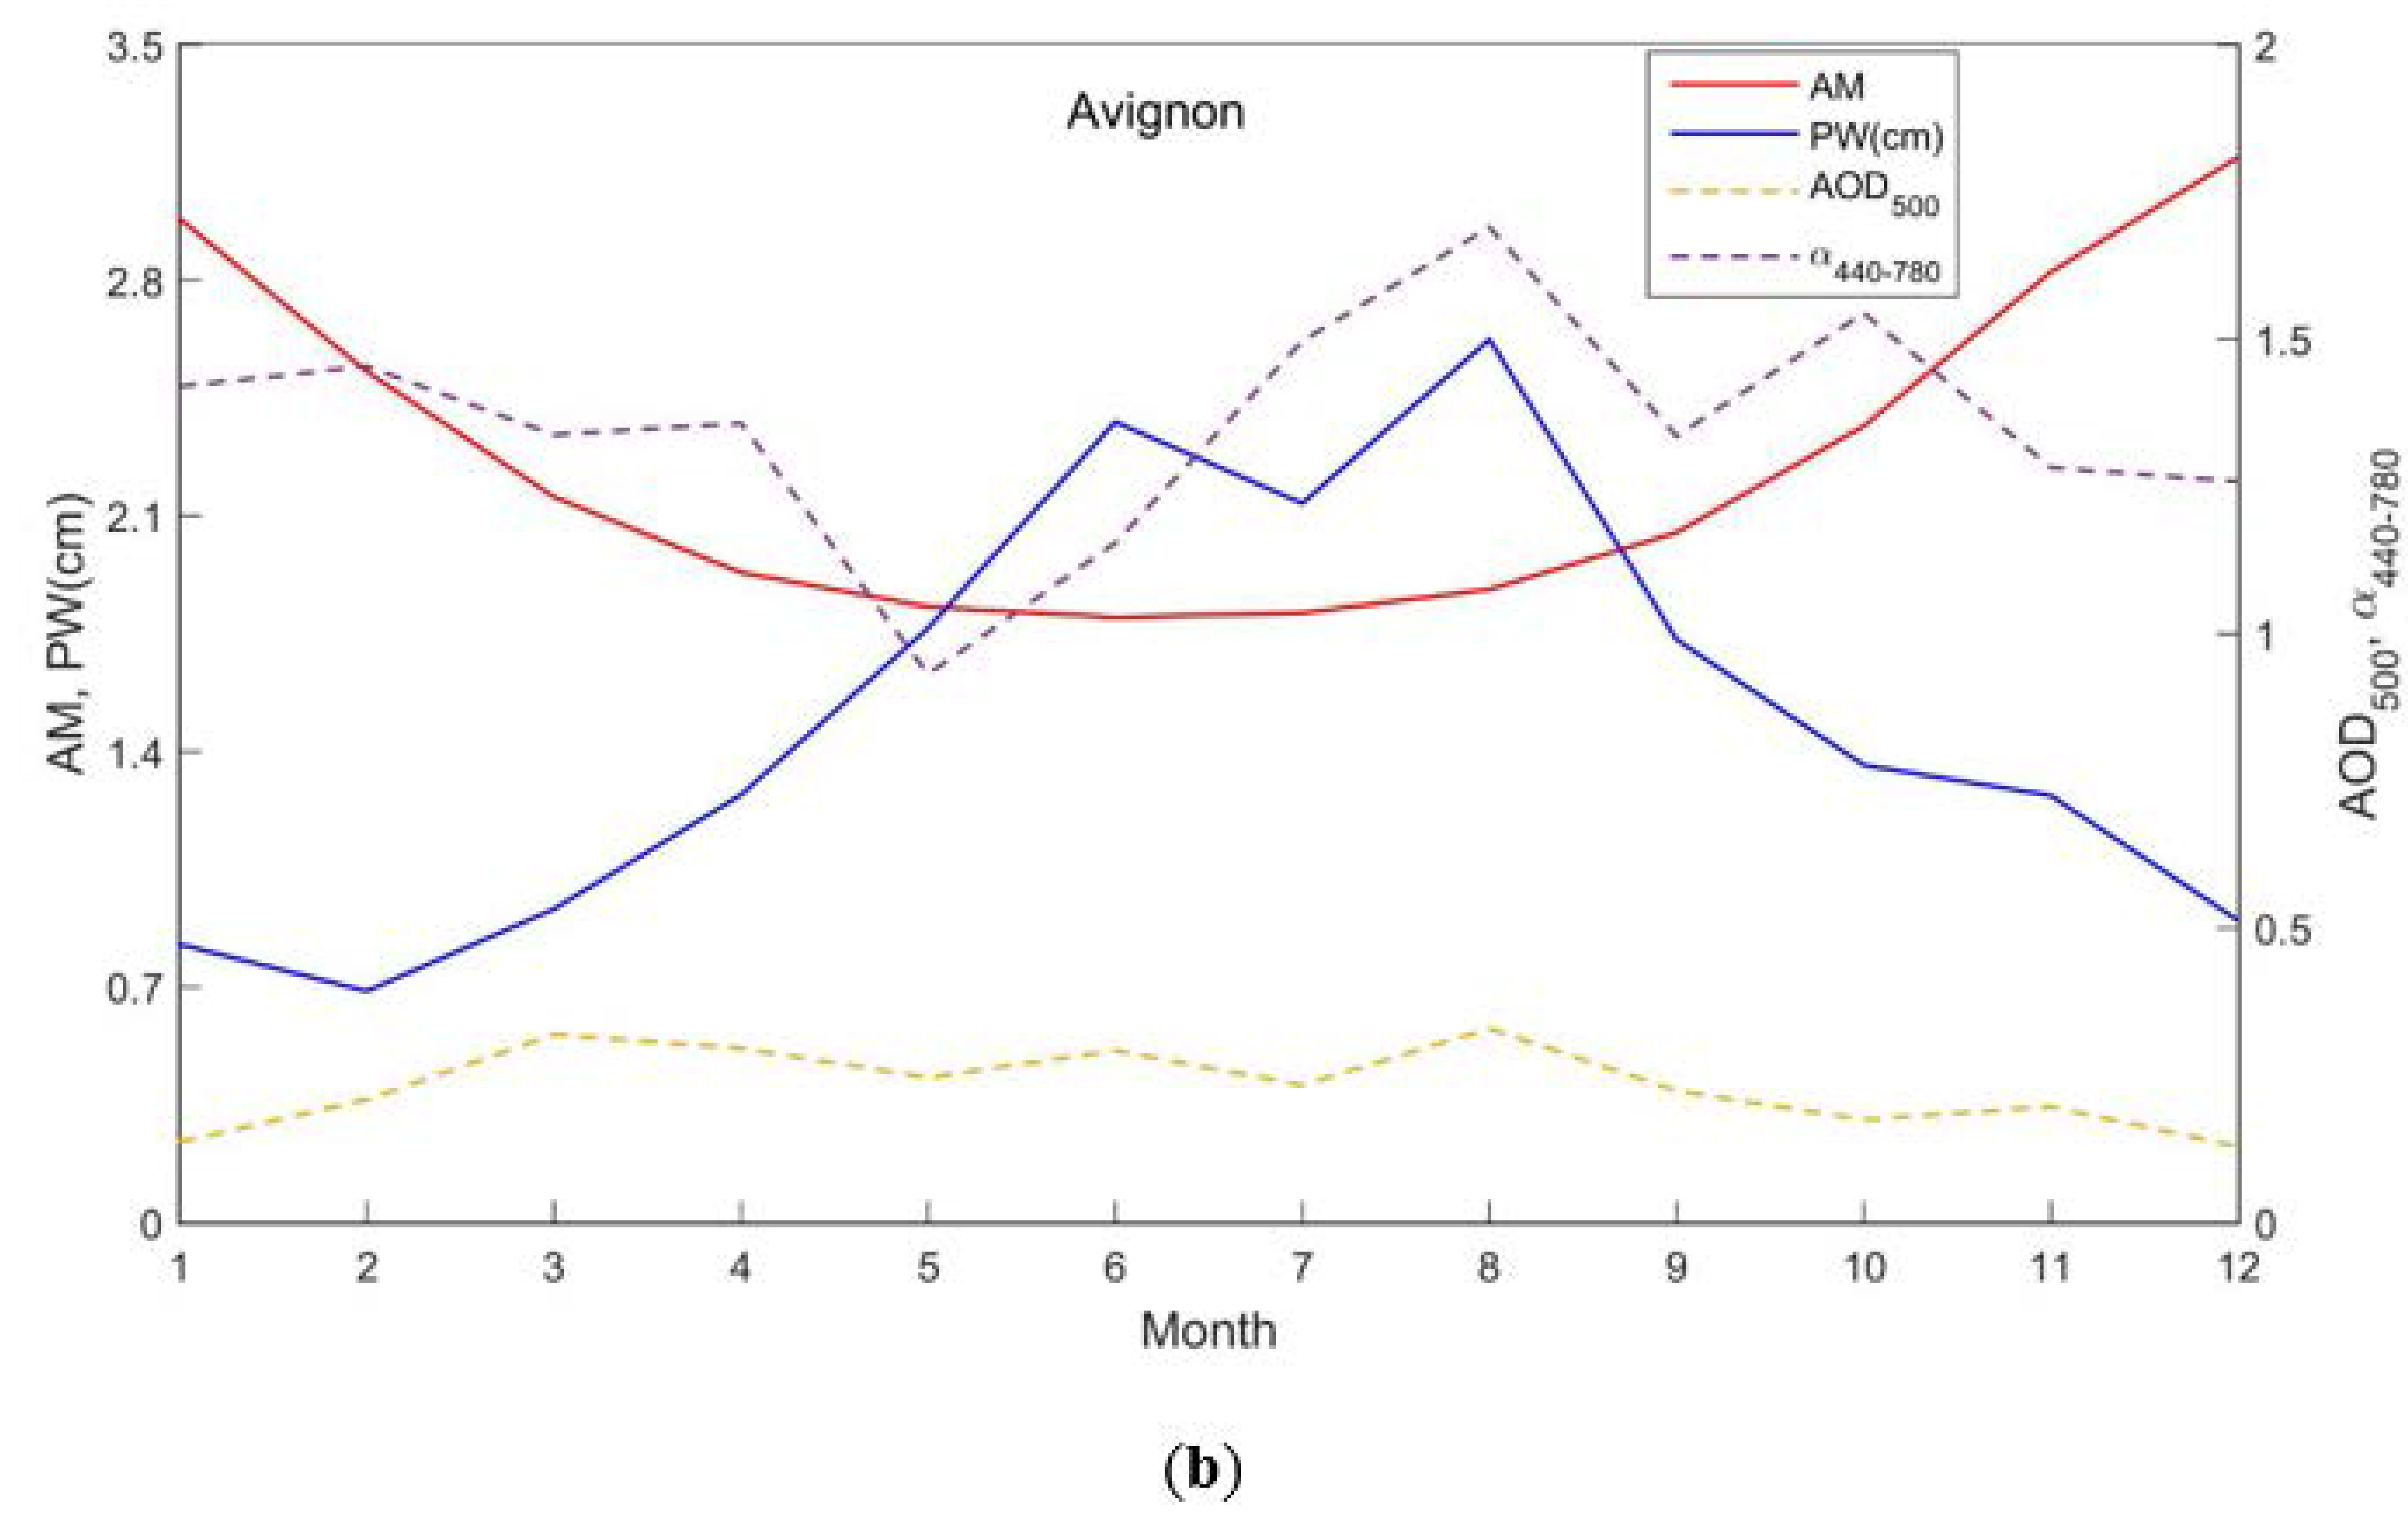
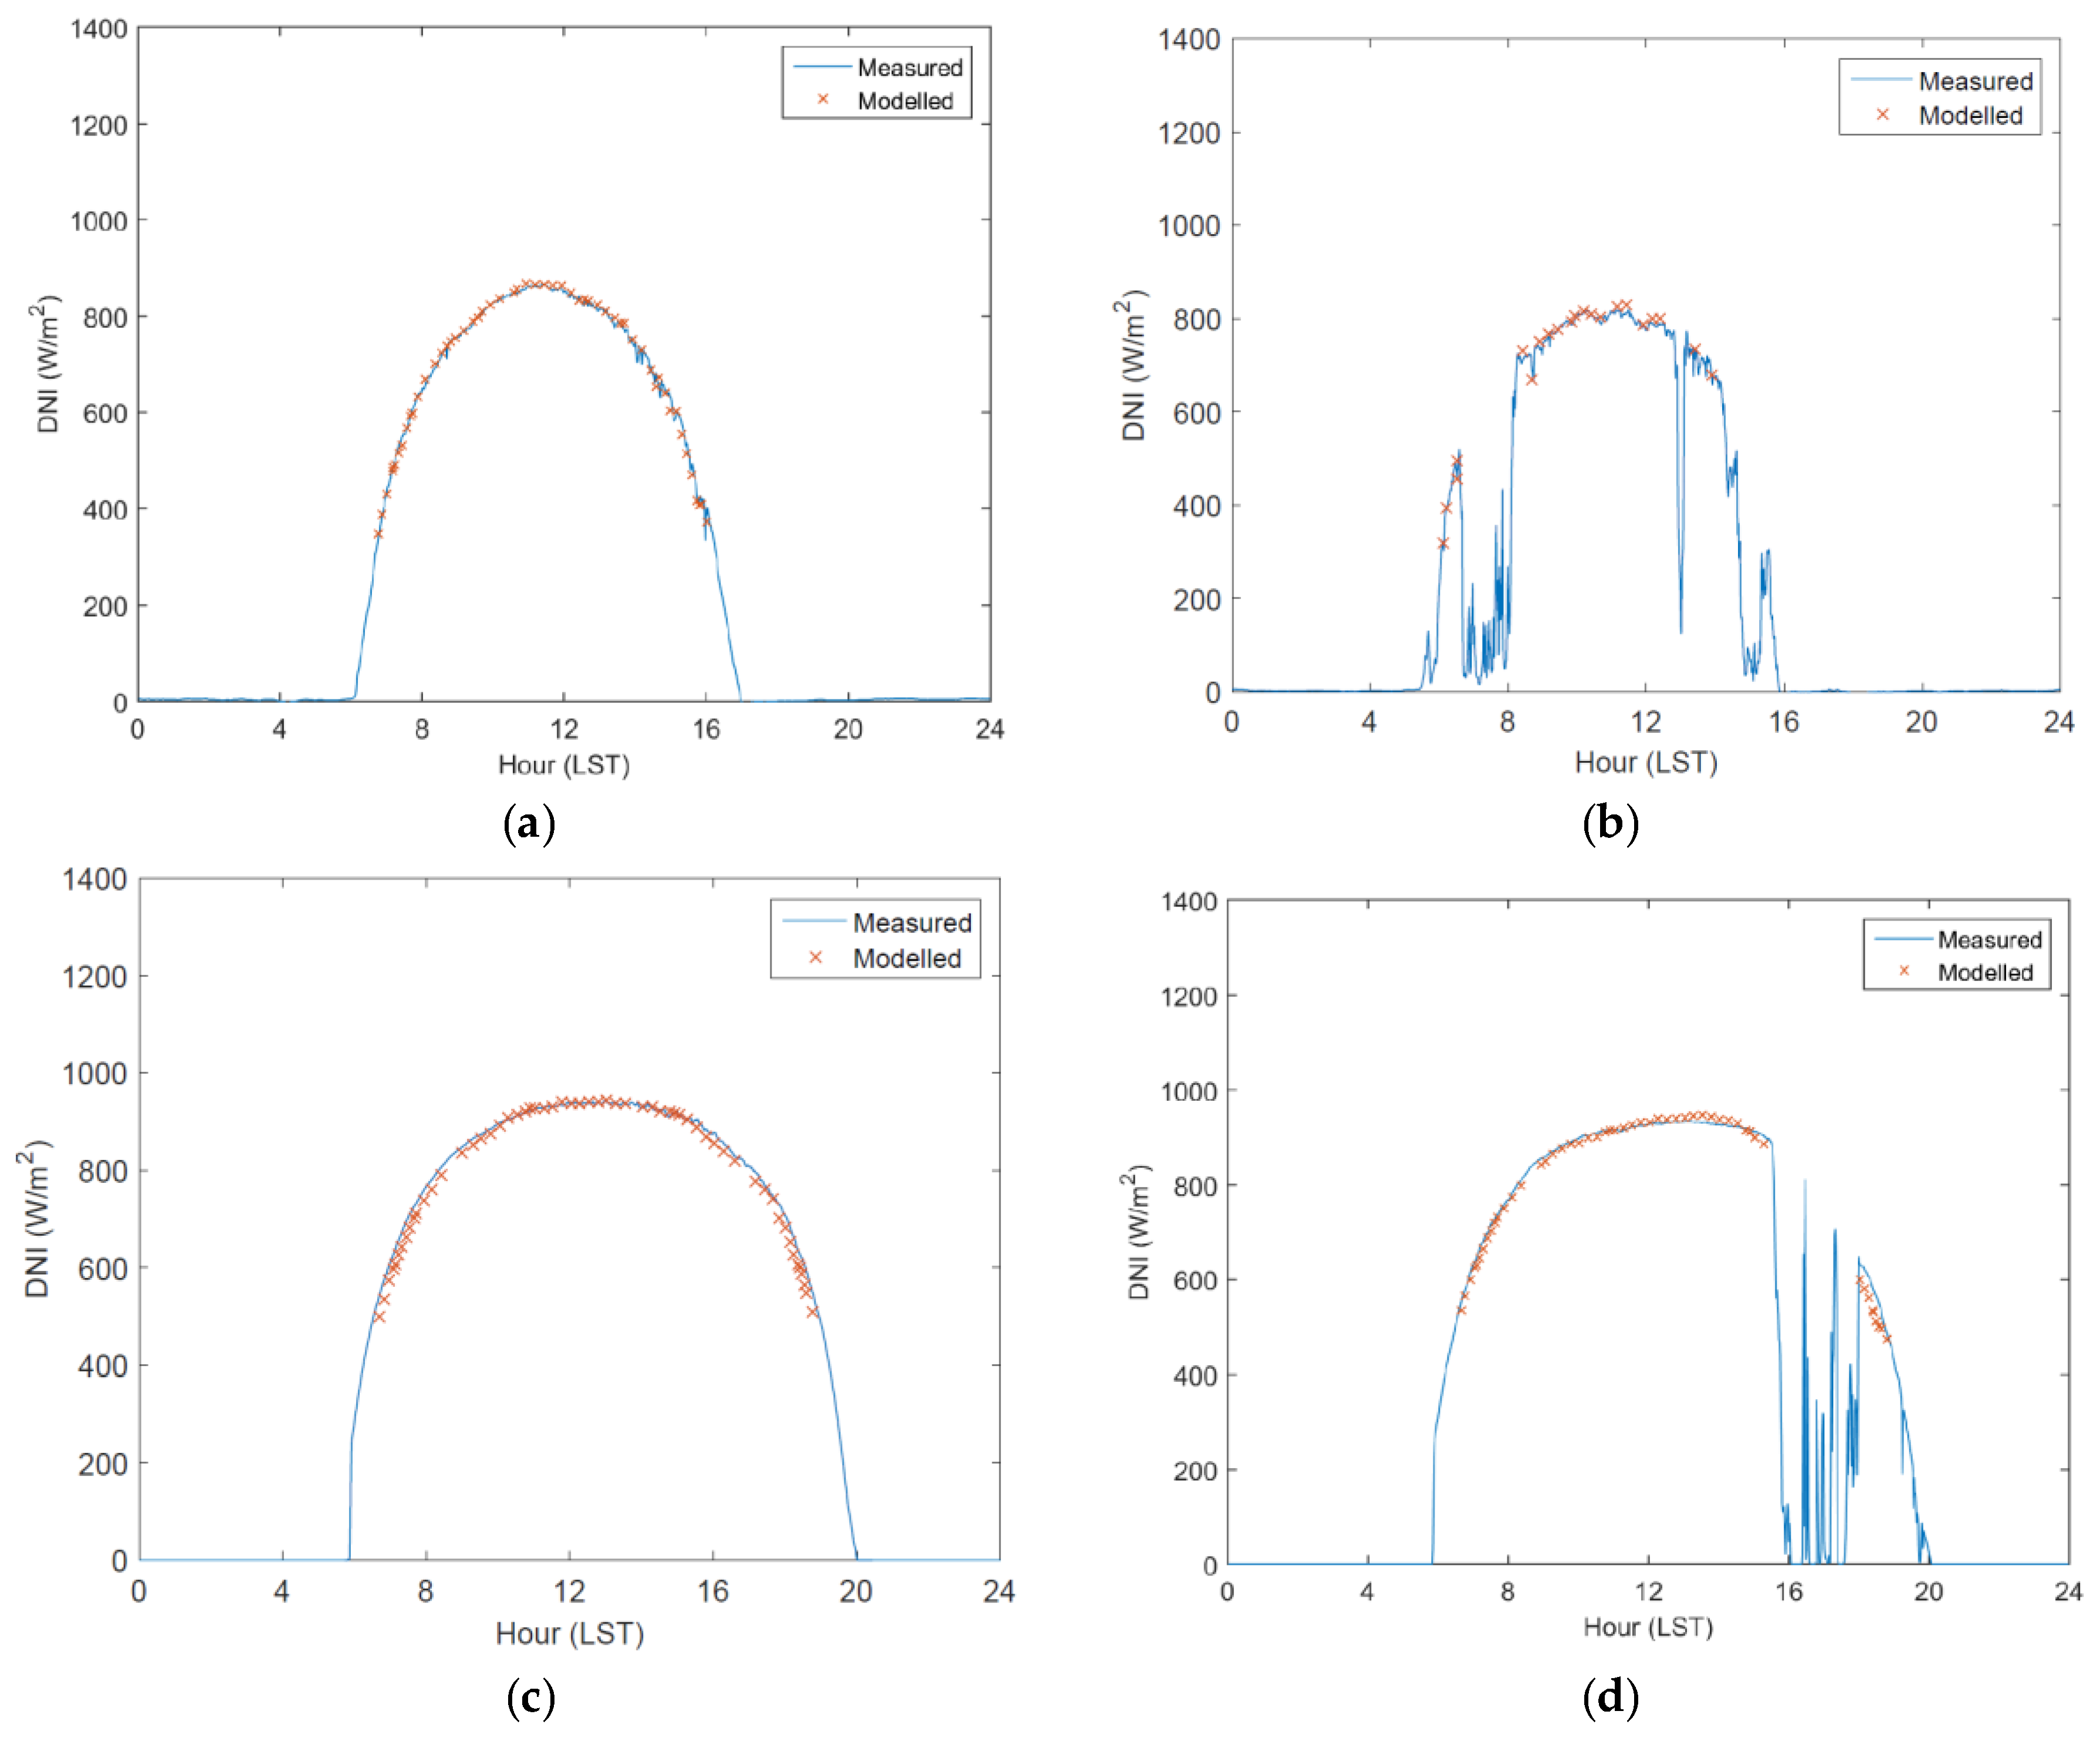
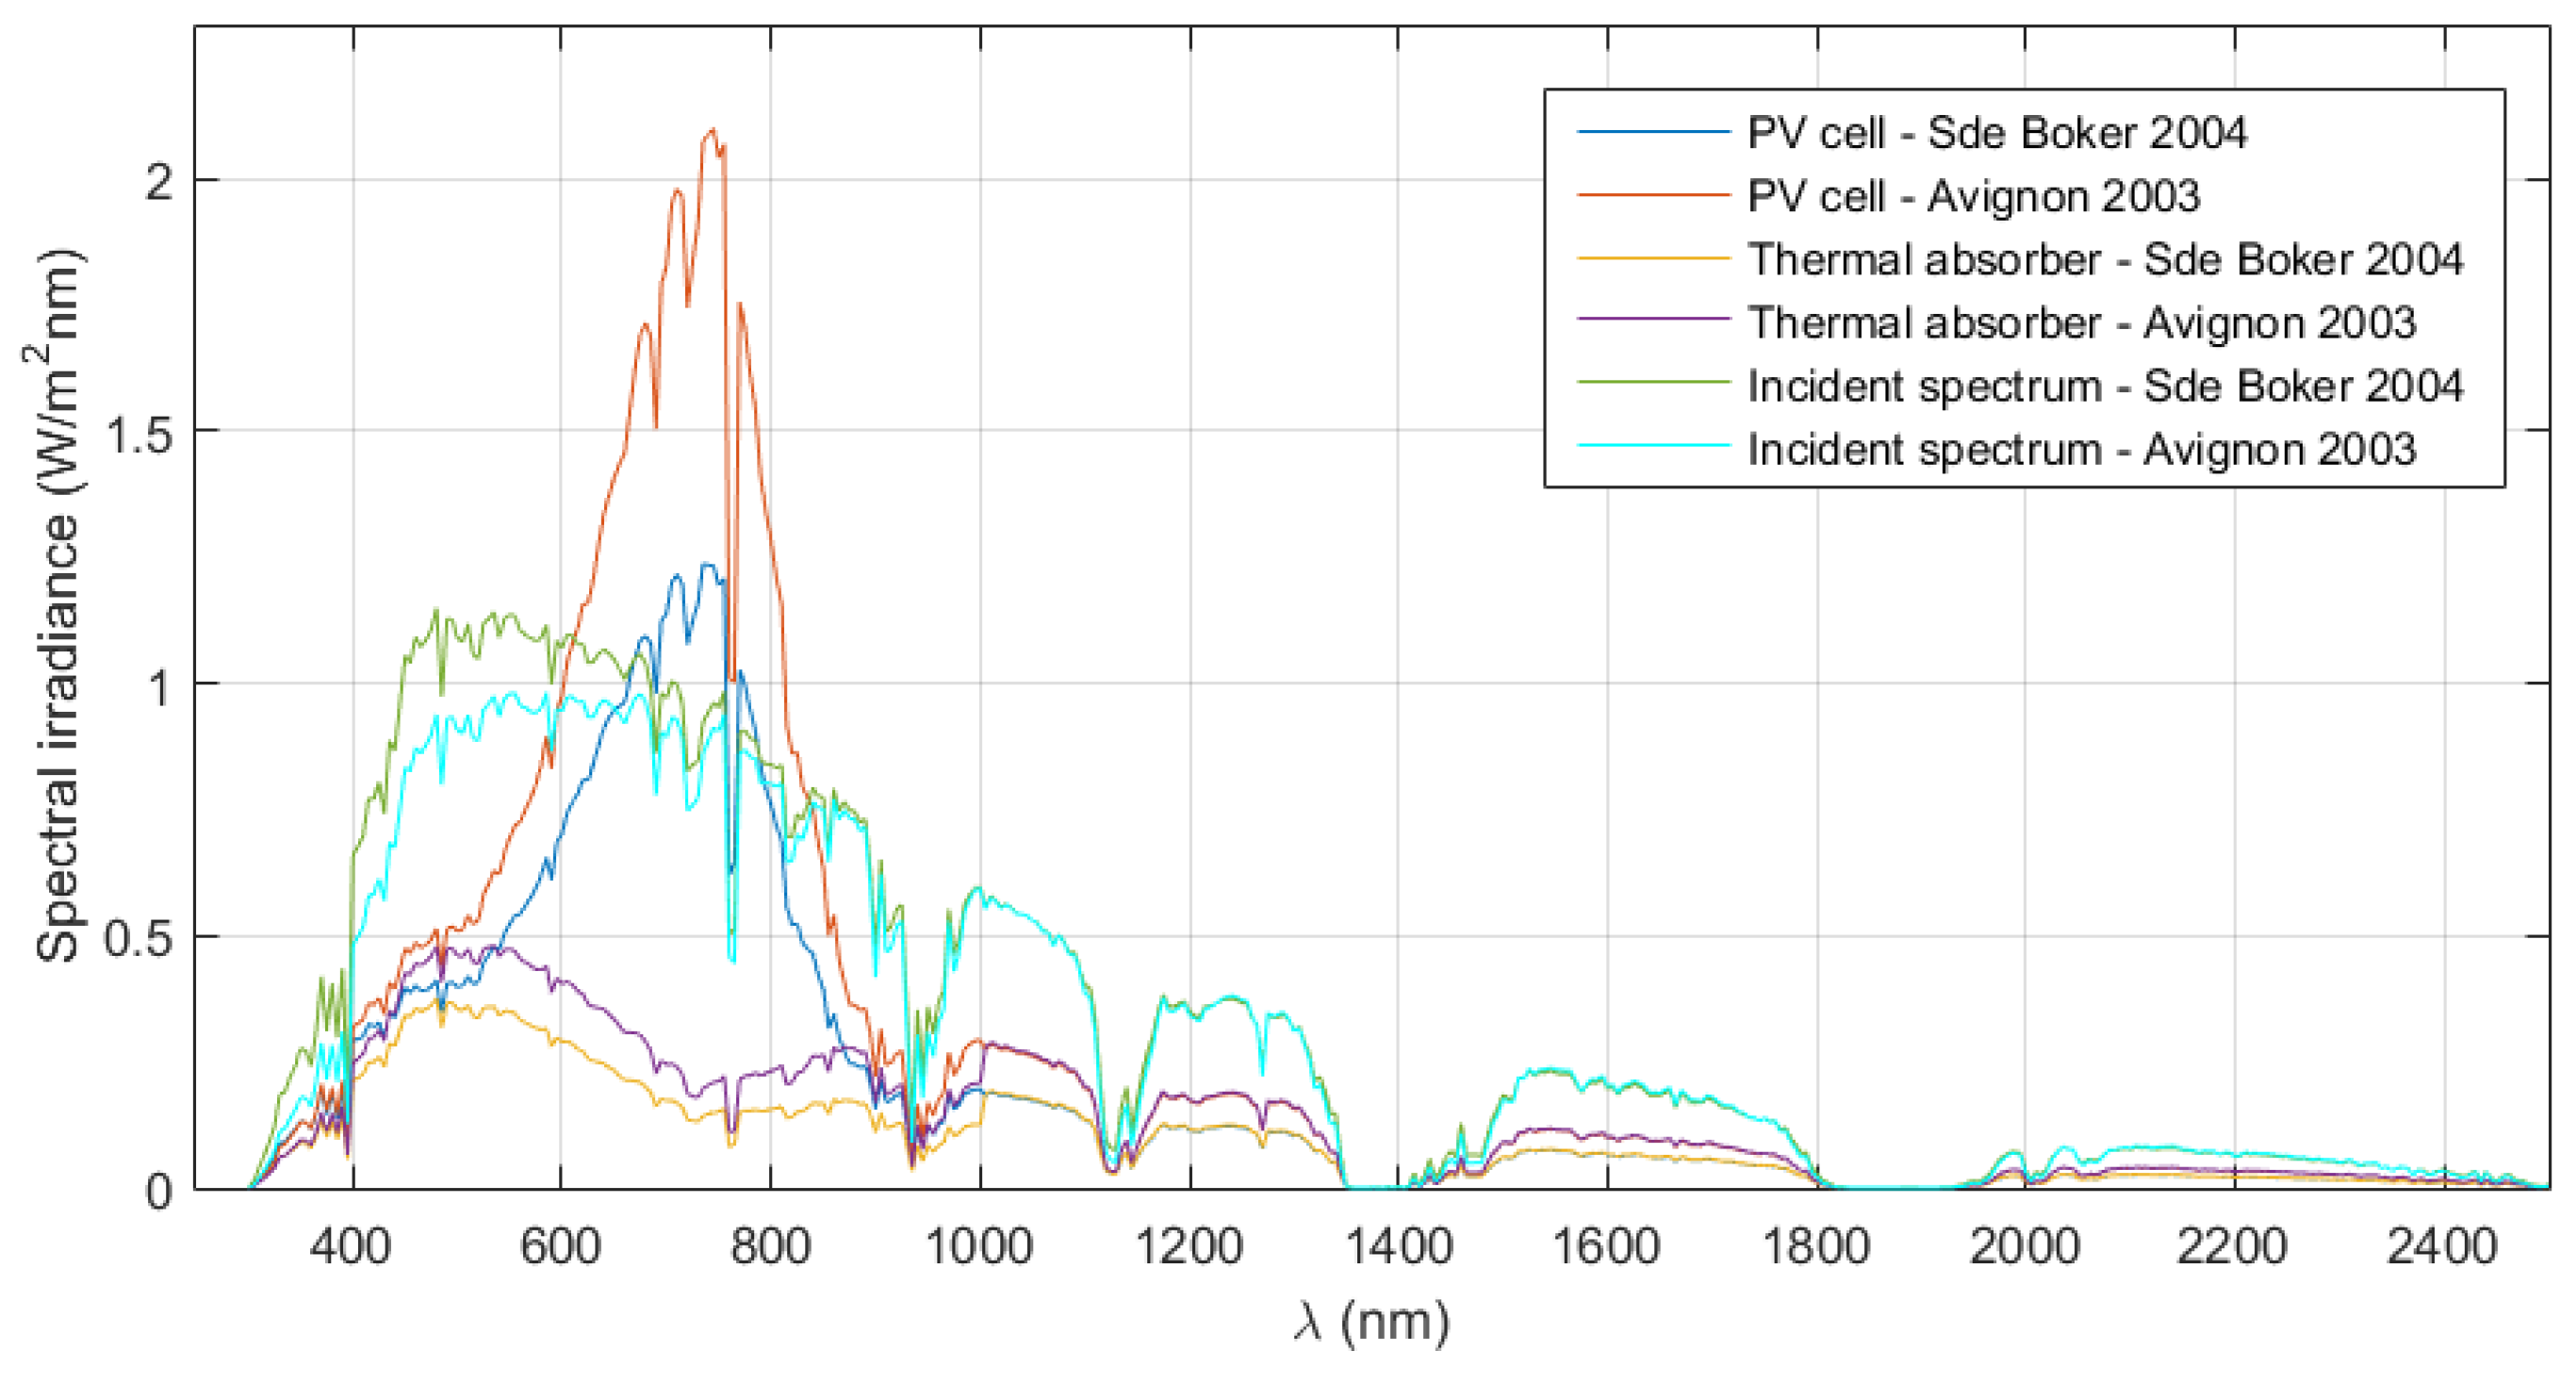
3.1. Spectra Simulation
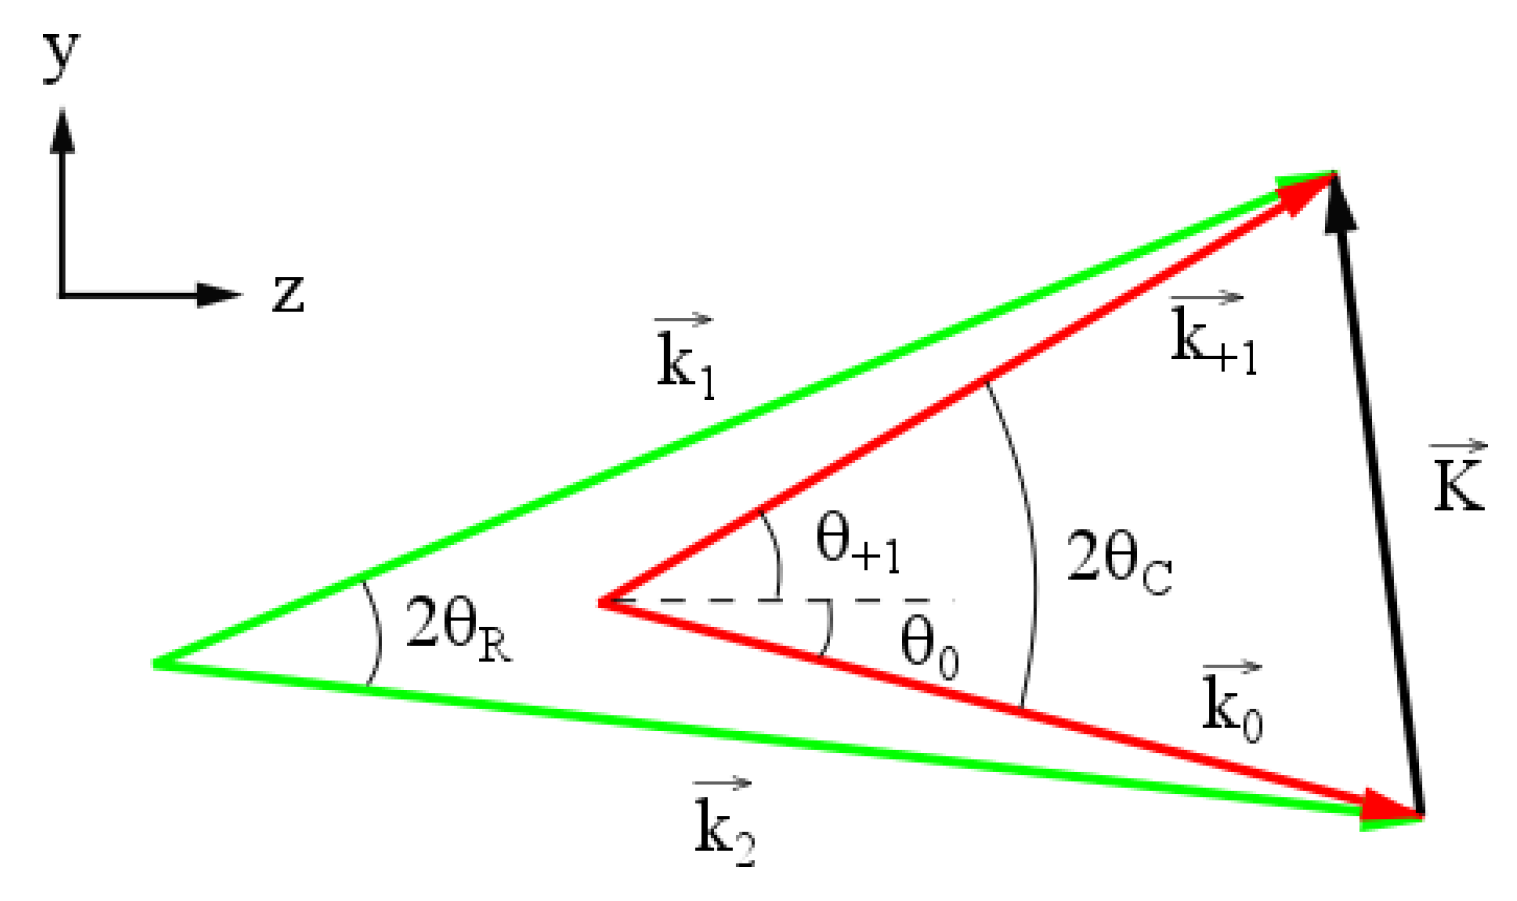
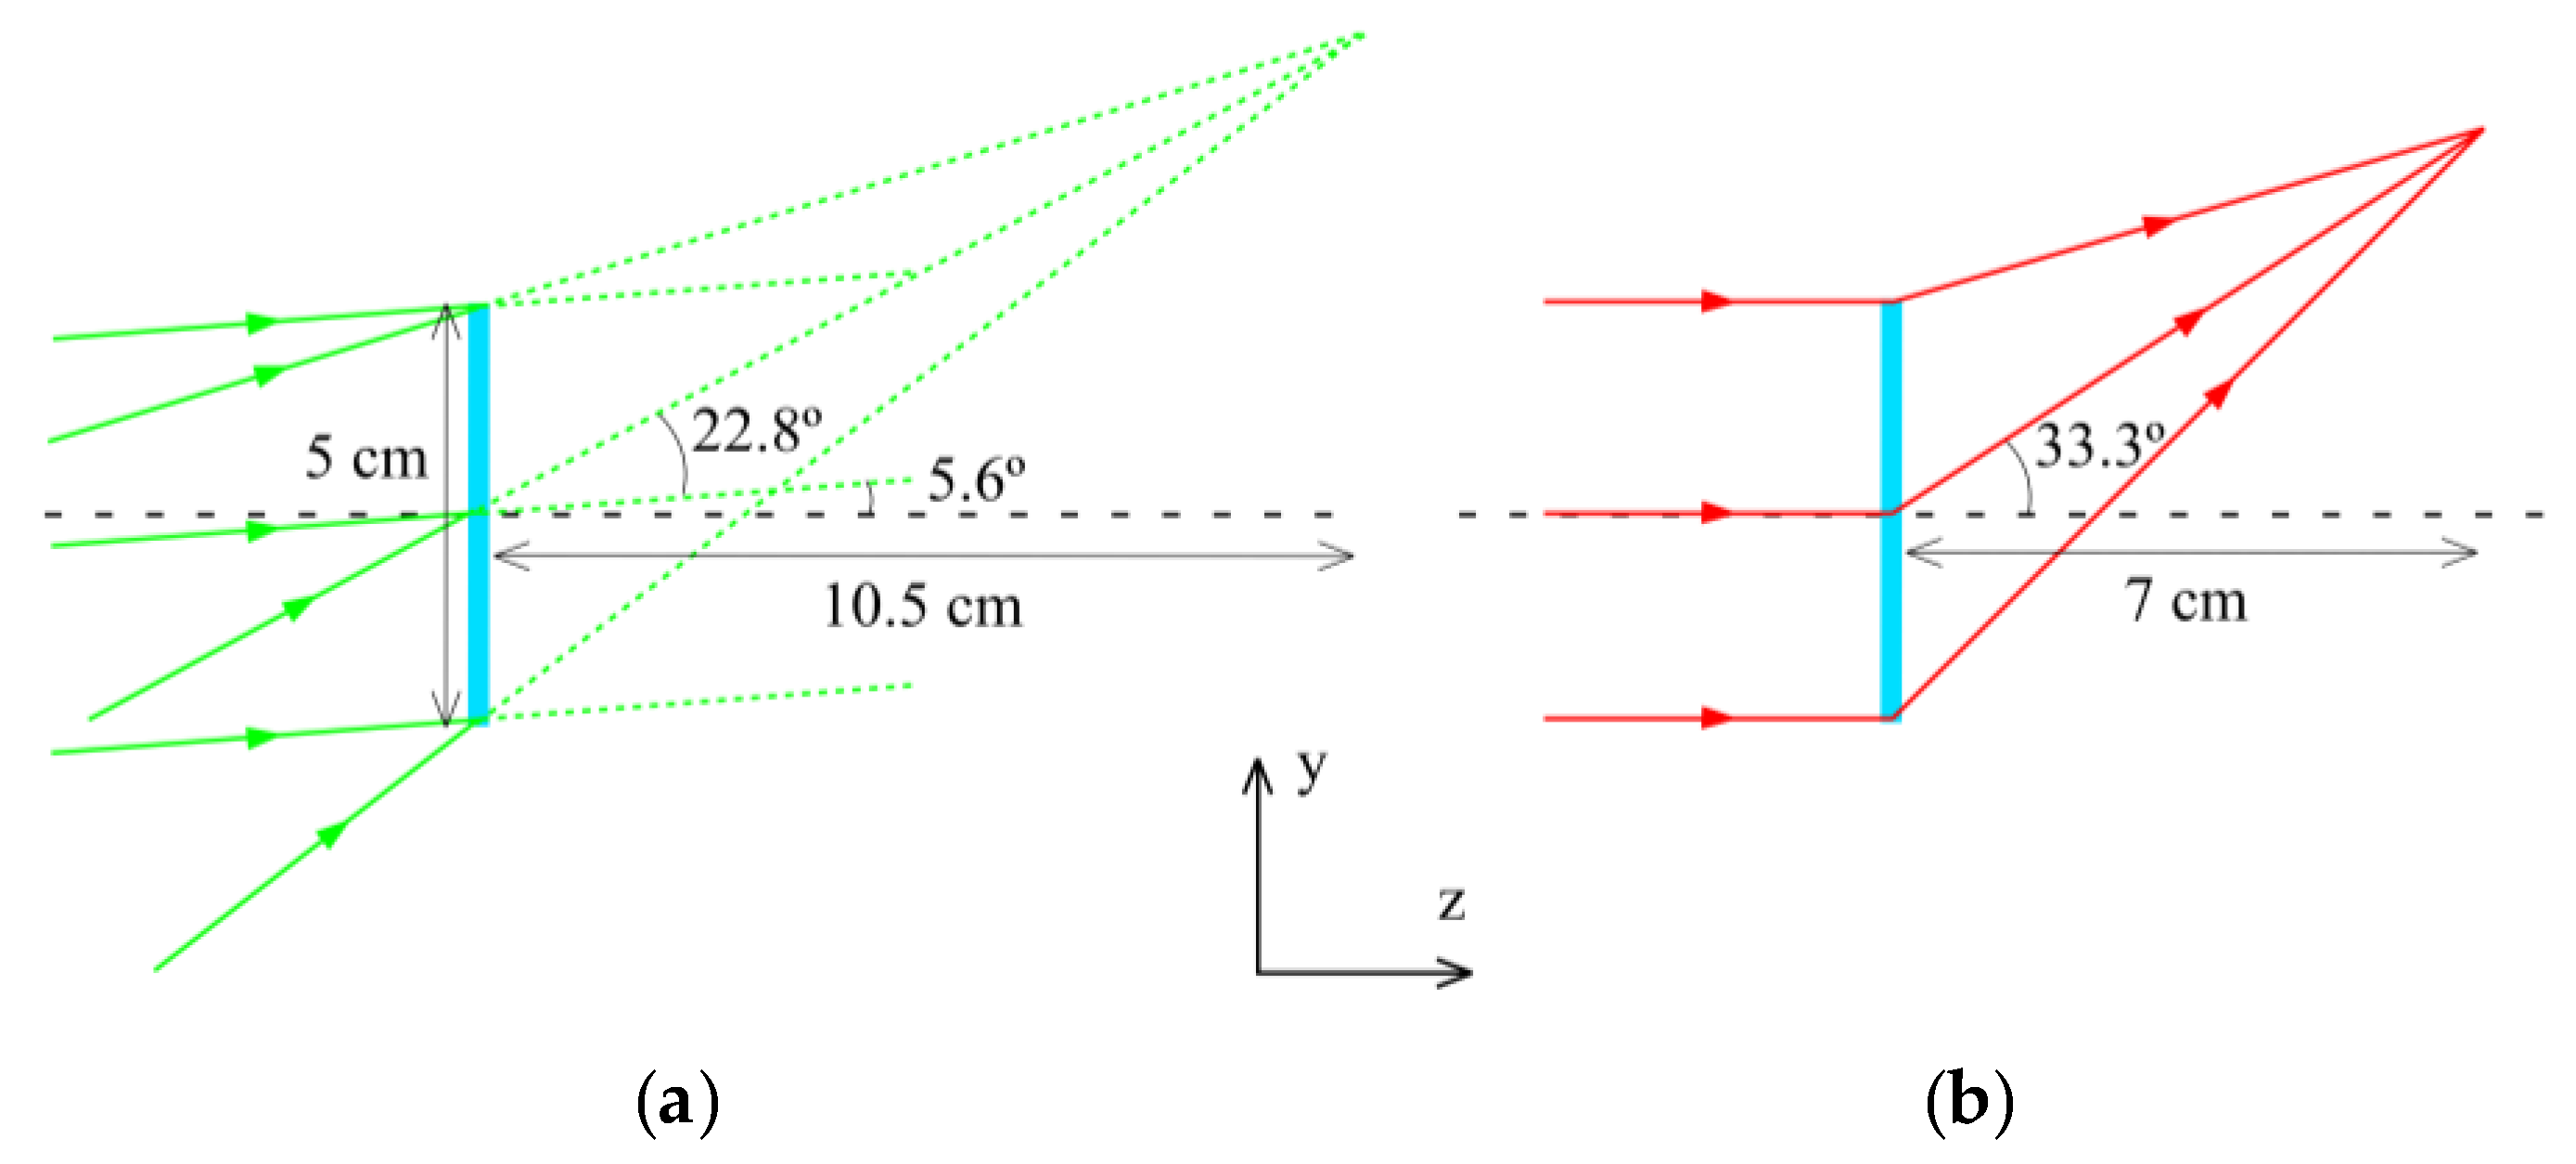
3.2. Optical Simulation
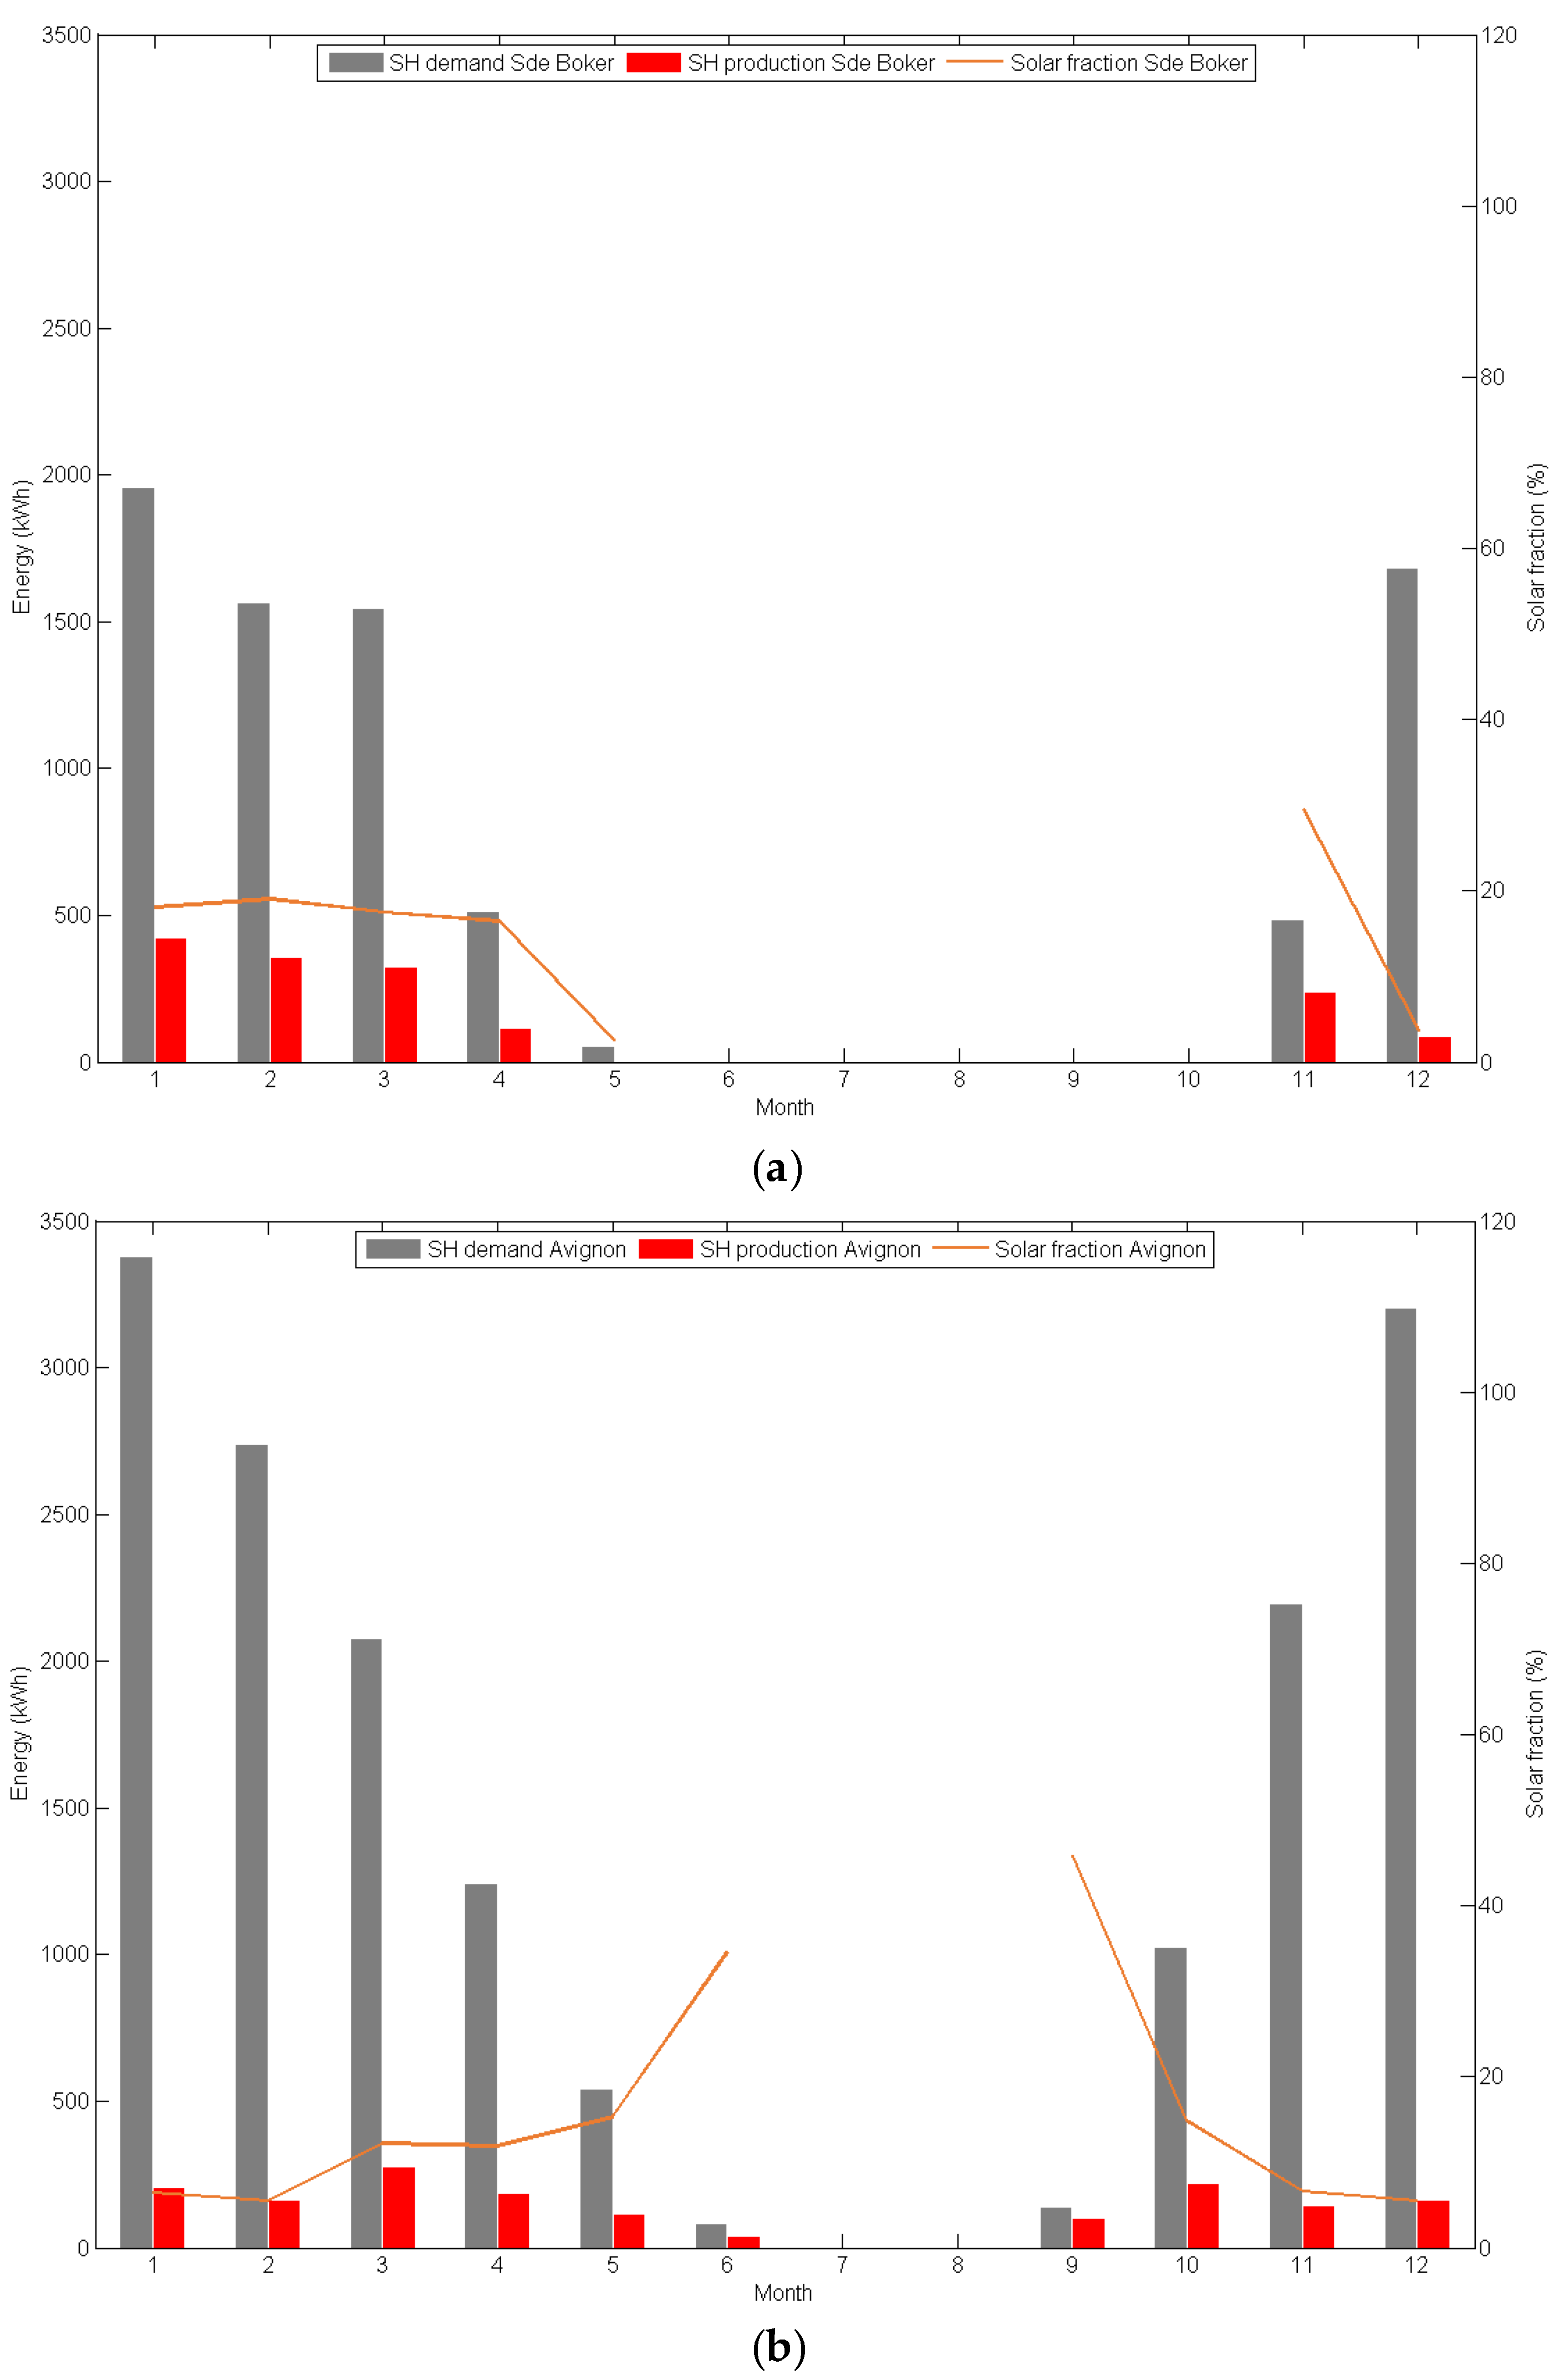
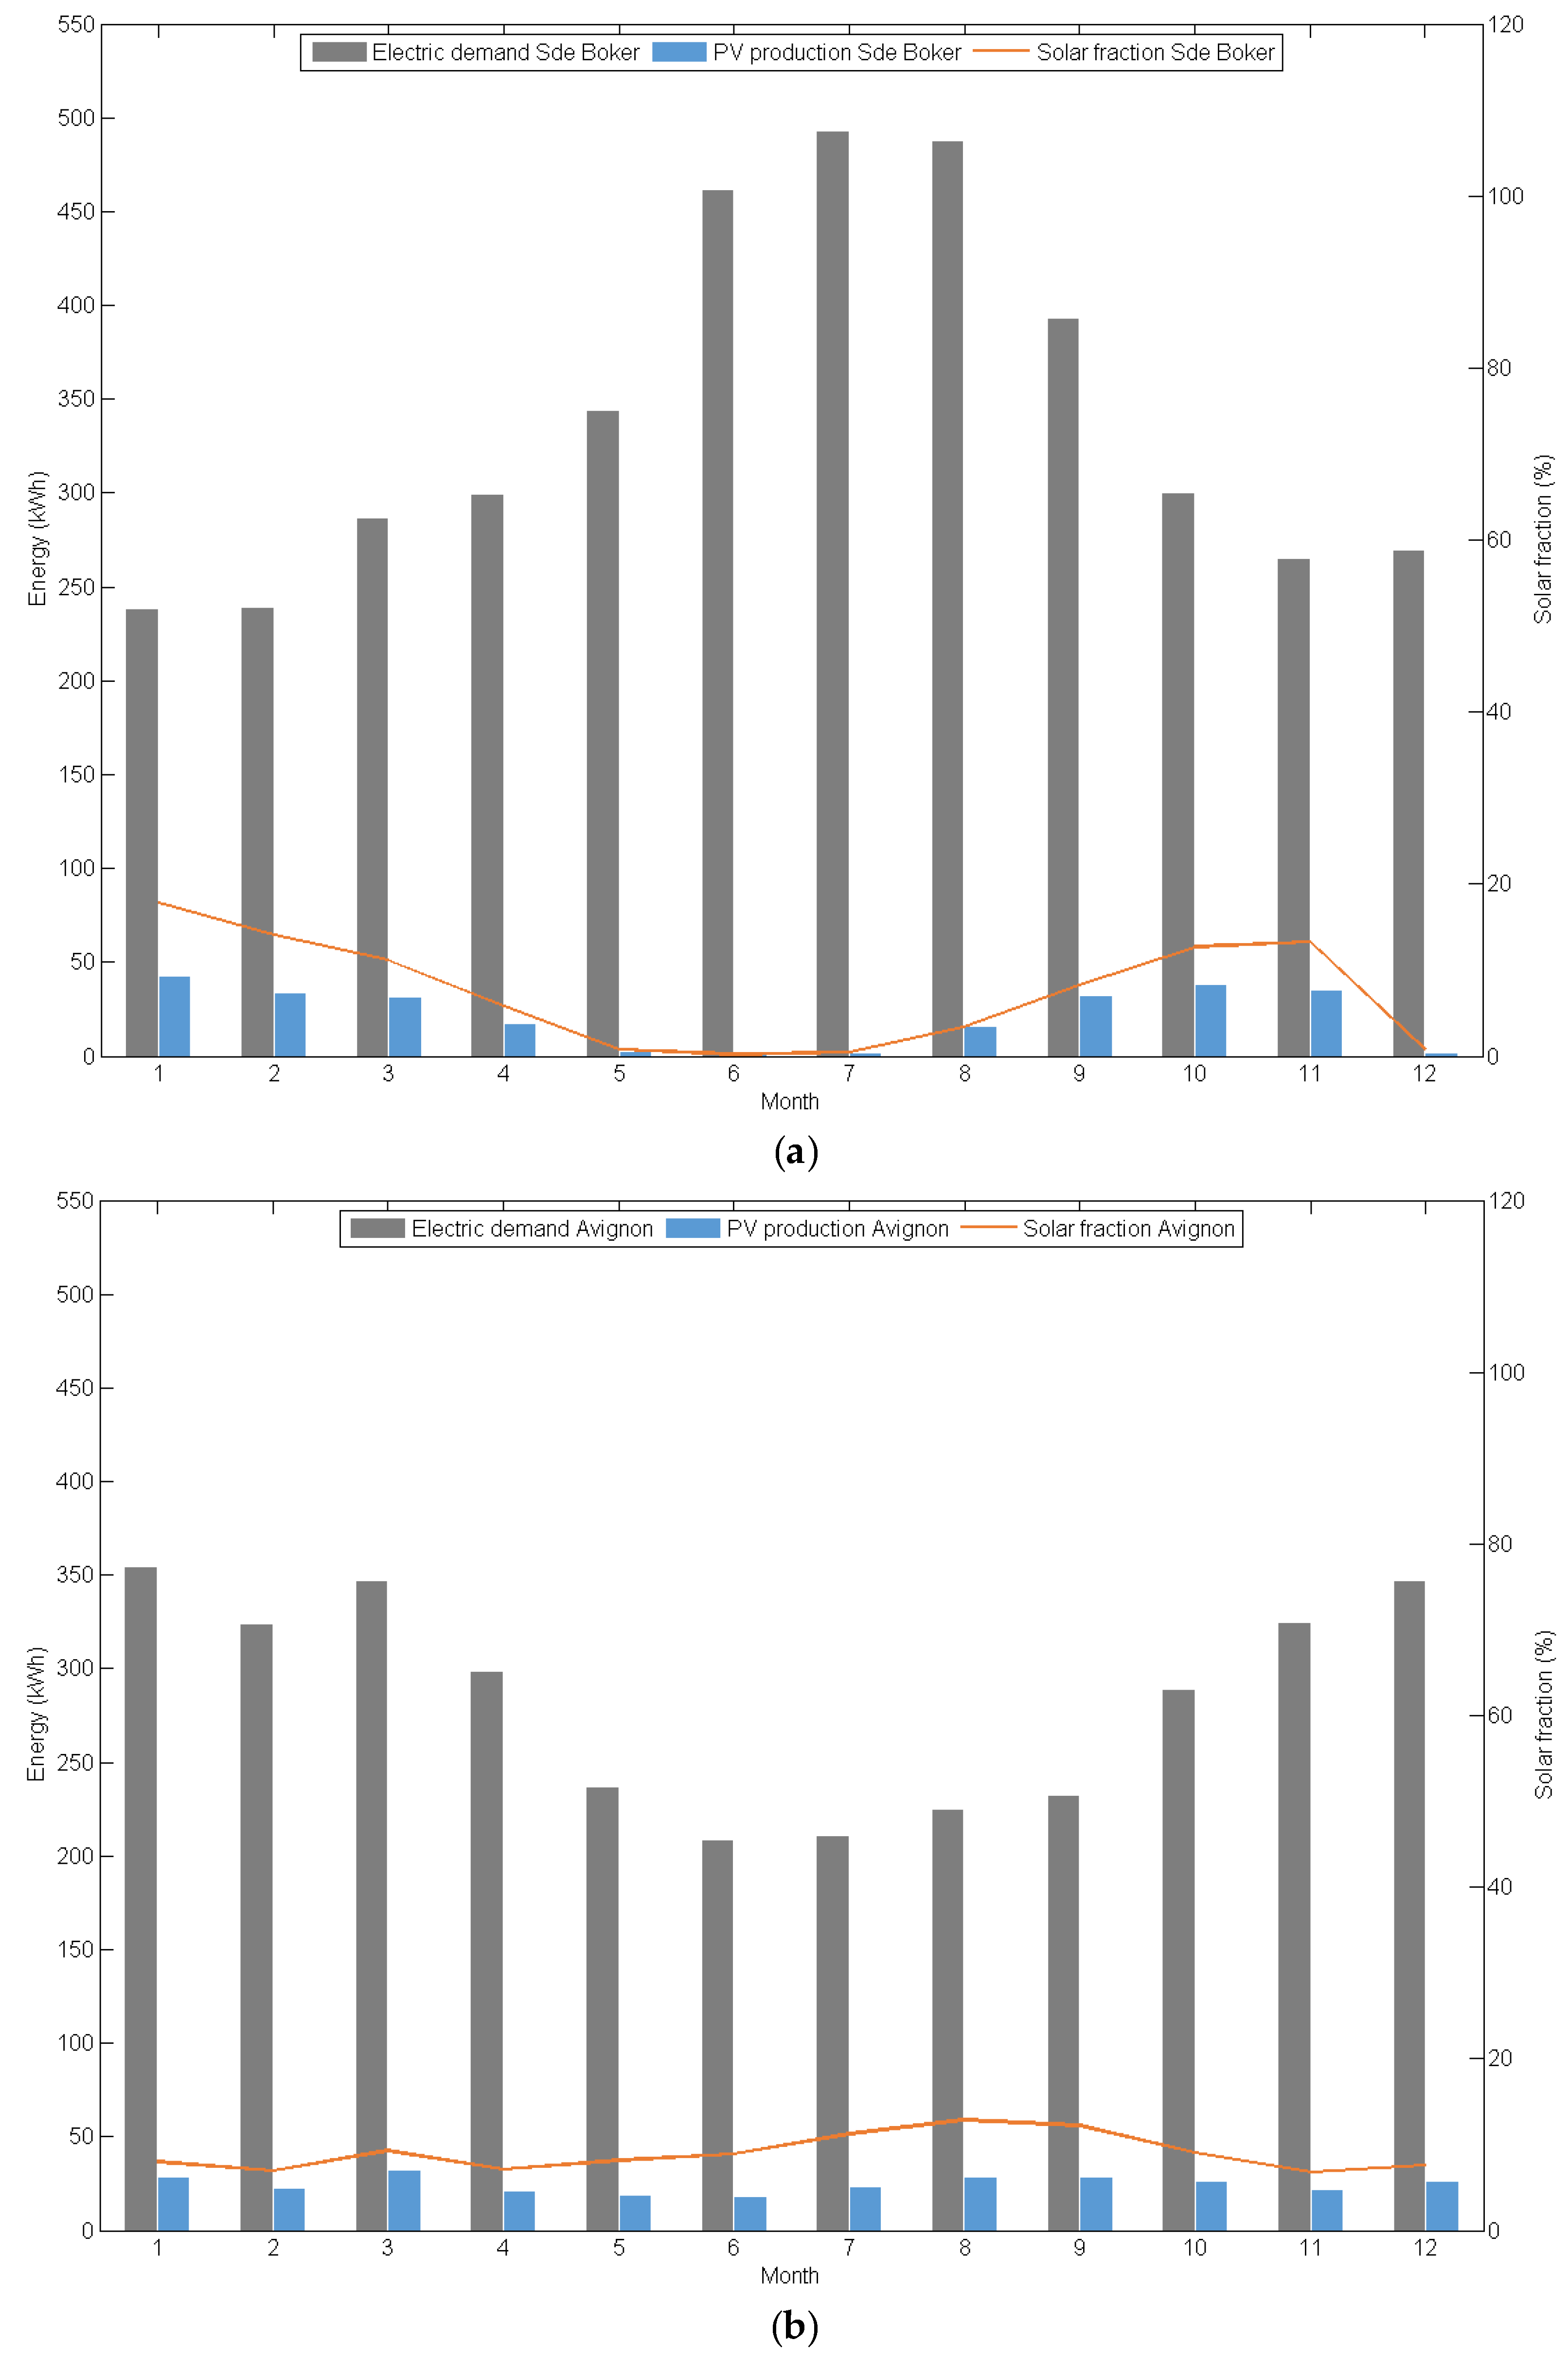
3.3. Energetic Simulation
4. Results
5. Conclusions
Acknowledgments
Author Contributions
Conflicts of Interest
References
- Directive 2010/31/EU of the European Parliament and of the Council of 19 May 2010 on the Energy Performance of Buildings. European Parliament: Strasbourg, France, 2010.
- Menoufi, K.; Chemisana, D.; Rosell, J.I. Life Cycle Assessment of a Building Integrated Concentrated Photovoltaic scheme. Appl. Energy 2013, 111, 505–514. [Google Scholar] [CrossRef]
- Collados, M.V.; Chemisana, D.; Atencia, J. Holographic solar energy systems: The role of optical elements. Renew. Sustain. Energy Rev. 2016, 59, 130–140. [Google Scholar] [CrossRef]
- Zhang, D.; Castro, J.M.; Kostuk, R.K. One-axis tracking holographic planar concentrator systems. J. Photonics Energy 2011, 1. [Google Scholar] [CrossRef]
- Castillo, J.E. Thermal effects of the extended holographic regions for holographic planar concentrator. J. Photonics Energy 2011, 1. [Google Scholar] [CrossRef]
- Castro, J.M.; Zhang, D.; Myer, B.; Kostuk, R.K. Energy collection efficiency of holographic planar solar concentrators. Appl. Opt. 2010, 49. [Google Scholar] [CrossRef] [PubMed]
- Chemisana, D.; Collados, M.V.; Quintanilla, M.; Atencia, J. Holographic lenses for building integrated concentrating photovoltaics. Appl. Energy 2013, 110, 227–235. [Google Scholar] [CrossRef]
- Ludman, J.E.; Riccobono, J.; Semenova, I.V.; Reinhand, N.O.; Tai, W.; Li, X.; Syphers, G.; Rallis, E.; Sliker, G.; Martín, J. The optimization of a holographic system for solar power generation. Sol. Energy 1997, 60, 1–9. [Google Scholar] [CrossRef]
- Zhang, D.; Gordon, M.; Russo, J.M.; Vorndran, S.; Kostuk, R.K. Spectrum-splitting photovoltaic system using transmission holographic lenses. J. Photonics Energy 2013, 3. [Google Scholar] [CrossRef]
- Vorndran, S.; Russo, J.M.; Wu, Y.; Gordon, M.; Kostuk, R. Holographic diffraction-through-aperture spectrum splitting for increased hybrid solar energy conversion efficiency. Int. J. Energy Res. 2015, 39, 326–335. [Google Scholar] [CrossRef]
- Ludman, J.E. Holographic solar concentrator. Appl. Opt. 1982, 21, 3057–3058. [Google Scholar] [CrossRef] [PubMed]
- Xiao, C.; Yu, X.; Yang, D.; Que, D. Impact of solar irradiance intensity and temperature on the performance of compensated crystalline silicon solar cells. Sol. Energy Mater. Sol. Cells 2014, 128, 427–434. [Google Scholar] [CrossRef]
- Chander, S.; Purohit, A.; Sharma, A.; Nehra, S.P.; Dhaka, M.S. A study on photovoltaic parameters of mono-crystalline silicon solar cell with cell temperature. Energy Rep. 2015, 1, 104–109. [Google Scholar] [CrossRef]
- Iurevych, O.; Gubin, S.; Dudeck, M. Combined receiver of solar radiation with holographic planar concentrator. IOP Conf. Ser. Mater. Sci. Eng. 2012, 29. [Google Scholar] [CrossRef]
- Froehlich, K.; Wagemann, E.U.; Frohn, B.; Schulat, J.; Stojanoff, C.G. Development and fabrication of a hybrid holographic solar concentrator for concurrent generation of electricity and thermal utilization. In Proceedings of SPIE, San Diego, CA, USA, 13–14 July 1993; pp. 311–319.
- Xia, X.W.; Parfenov, A.V.; Aye, T.M.; Shih, M.-Y. Efficient hybrid electric and thermal energy generation. In Proceedings of SPIE, San Diego, CA, USA, 22–24 August 2011.
- Berneth, H.; Bruder, F.-K.; Fäcke, T.; Jurbergs, D.; Hagen, R.; Hönel, D.; Rölle, T.; Walze, G. Bayfol HX photopolymer for full-color transmission volume Bragg gratings. SPIE Photonics West 2014-OPTO Optoelectron. Devices Mater. 2014, 9006. [Google Scholar] [CrossRef]
- Marín-Sáez, J.; Atencia, J.; Chemisana, D.; Collados, M.-V. Characterization of volume holographic optical elements recorded in Bayfol HX photopolymer for solar photovoltaic applications. Opt. Express 2016, 24, A720. [Google Scholar] [CrossRef] [PubMed]
- Sunways. Copyright: Sunways AG · Photovoltaic Technology · Max-Stromeyer-Str. 160 · D-78467 Konstanz. SD310912A version 03/13 EN. Available online: http://www.sunways.eu (accessed on 22 May 2013).
- Gueymard, C.A. Parameterized transmittance model for direct beam and circumsolar spectral irradiance. Sol. Energy 2001, 71, 325–346. [Google Scholar] [CrossRef]
- Eck, T.F.; Holben, B.N.; Reid, J.S.; Dubovik, O.; Smirnov, A.; O’Neill, N.T.; Slutsker, I.; Kinne, S. Wavelength dependence of the optical depth of biomass burning, urban, and desert dust aerosols. J. Geophys. Res. Atmos. 1999, 104, 31333–31349. [Google Scholar] [CrossRef]
- Aerosol Robotic Network (AERONET). Available online: http://aeronet.gsfc.nasa.gov/ (accessed on 14 October 2015).
- Holben, B.N.; Eck, T.F.; Slutsker, I.; Tanré, D.; Buis, J.P.; Setzer, A.; Vermote, E.; Reagan, J.A.; Kaufman, Y.J.; Nakajima, T.; et al. AERONET—A Federated Instrument Network and Data Archive for Aerosol Characterization. Remote Sens. Environ. 1998, 66, 1–16. [Google Scholar] [CrossRef]
- Jaus, J.; Gueymard, C.A. Generalized spectral performance evaluation of multijunction solar cells using a multicore, parallelized version of SMARTS. In Proceedings of the AIP Conference, Toledo, Spain, 16–18 April 2012; Volume 1477, pp. 122–126.
- Chan, N.L.A.; Brindley, H.E.; Ekins-Daukes, N.J. Impact of individual atmospheric parameters on CPV system power, energy yield and cost of energy. Prog. Photovoltaics Res. Appl. 2014, 22, 1080–1095. [Google Scholar] [CrossRef]
- Solar and Wind Energy Resource Assessment (SWERA). Available online: https://maps.nrel.gov/swera (accessed on 27 May 2016).
- World Radiation Monitoring Center—Baseline Surface Radiation Network Homepage. Available online: http://bsrn.awi.de/ (accessed on 27 May 2016).
- Kogelnik, H. Coupled wave theory for thick hologram gratings. Bell Syst. Tech. J. 1969, 48, 2909–2947. [Google Scholar] [CrossRef]
- Syms, R.R.A. Vector Effects in Holographic Optical Elements. Opt. Acta Int. J. Opt. 1985, 32, 1413–1425. [Google Scholar] [CrossRef]
- Bañares-Palacios, P.; Álvarez-Álvarez, S.; Marín-Sáez, J.; Collados, M.-V.; Chemisana, D.; Atencia, J. Broadband behavior of transmission volume holographic optical elements for solar concentration. Opt. Express 2015, 23, A671–A681. [Google Scholar] [CrossRef] [PubMed]
- Hecht, E. Optics; Addison Wesley: Reading, UK, 1998. [Google Scholar]
- Marion, B. A method for modeling the current-voltage curve of a PV module for outdoor conditions. Prog. Photovoltaics Res. Appl. 2002, 10, 205–214. [Google Scholar] [CrossRef]
- Amrizal, N.; Chemisana, D.; Rosell, J.I. Hybrid photovoltaic–thermal solar collectors dynamic modeling. Appl. Energy 2013, 101, 797–807. [Google Scholar] [CrossRef]
- Schüco. Available online: https://www.schueco.com (accessed on 27 May 2016).


| (V) | (A/m2) | (%) | γ (%/°C) | (°C) |
|---|---|---|---|---|
| 0.635 | 377.6 | 78.4 | −0.44 | 45 |
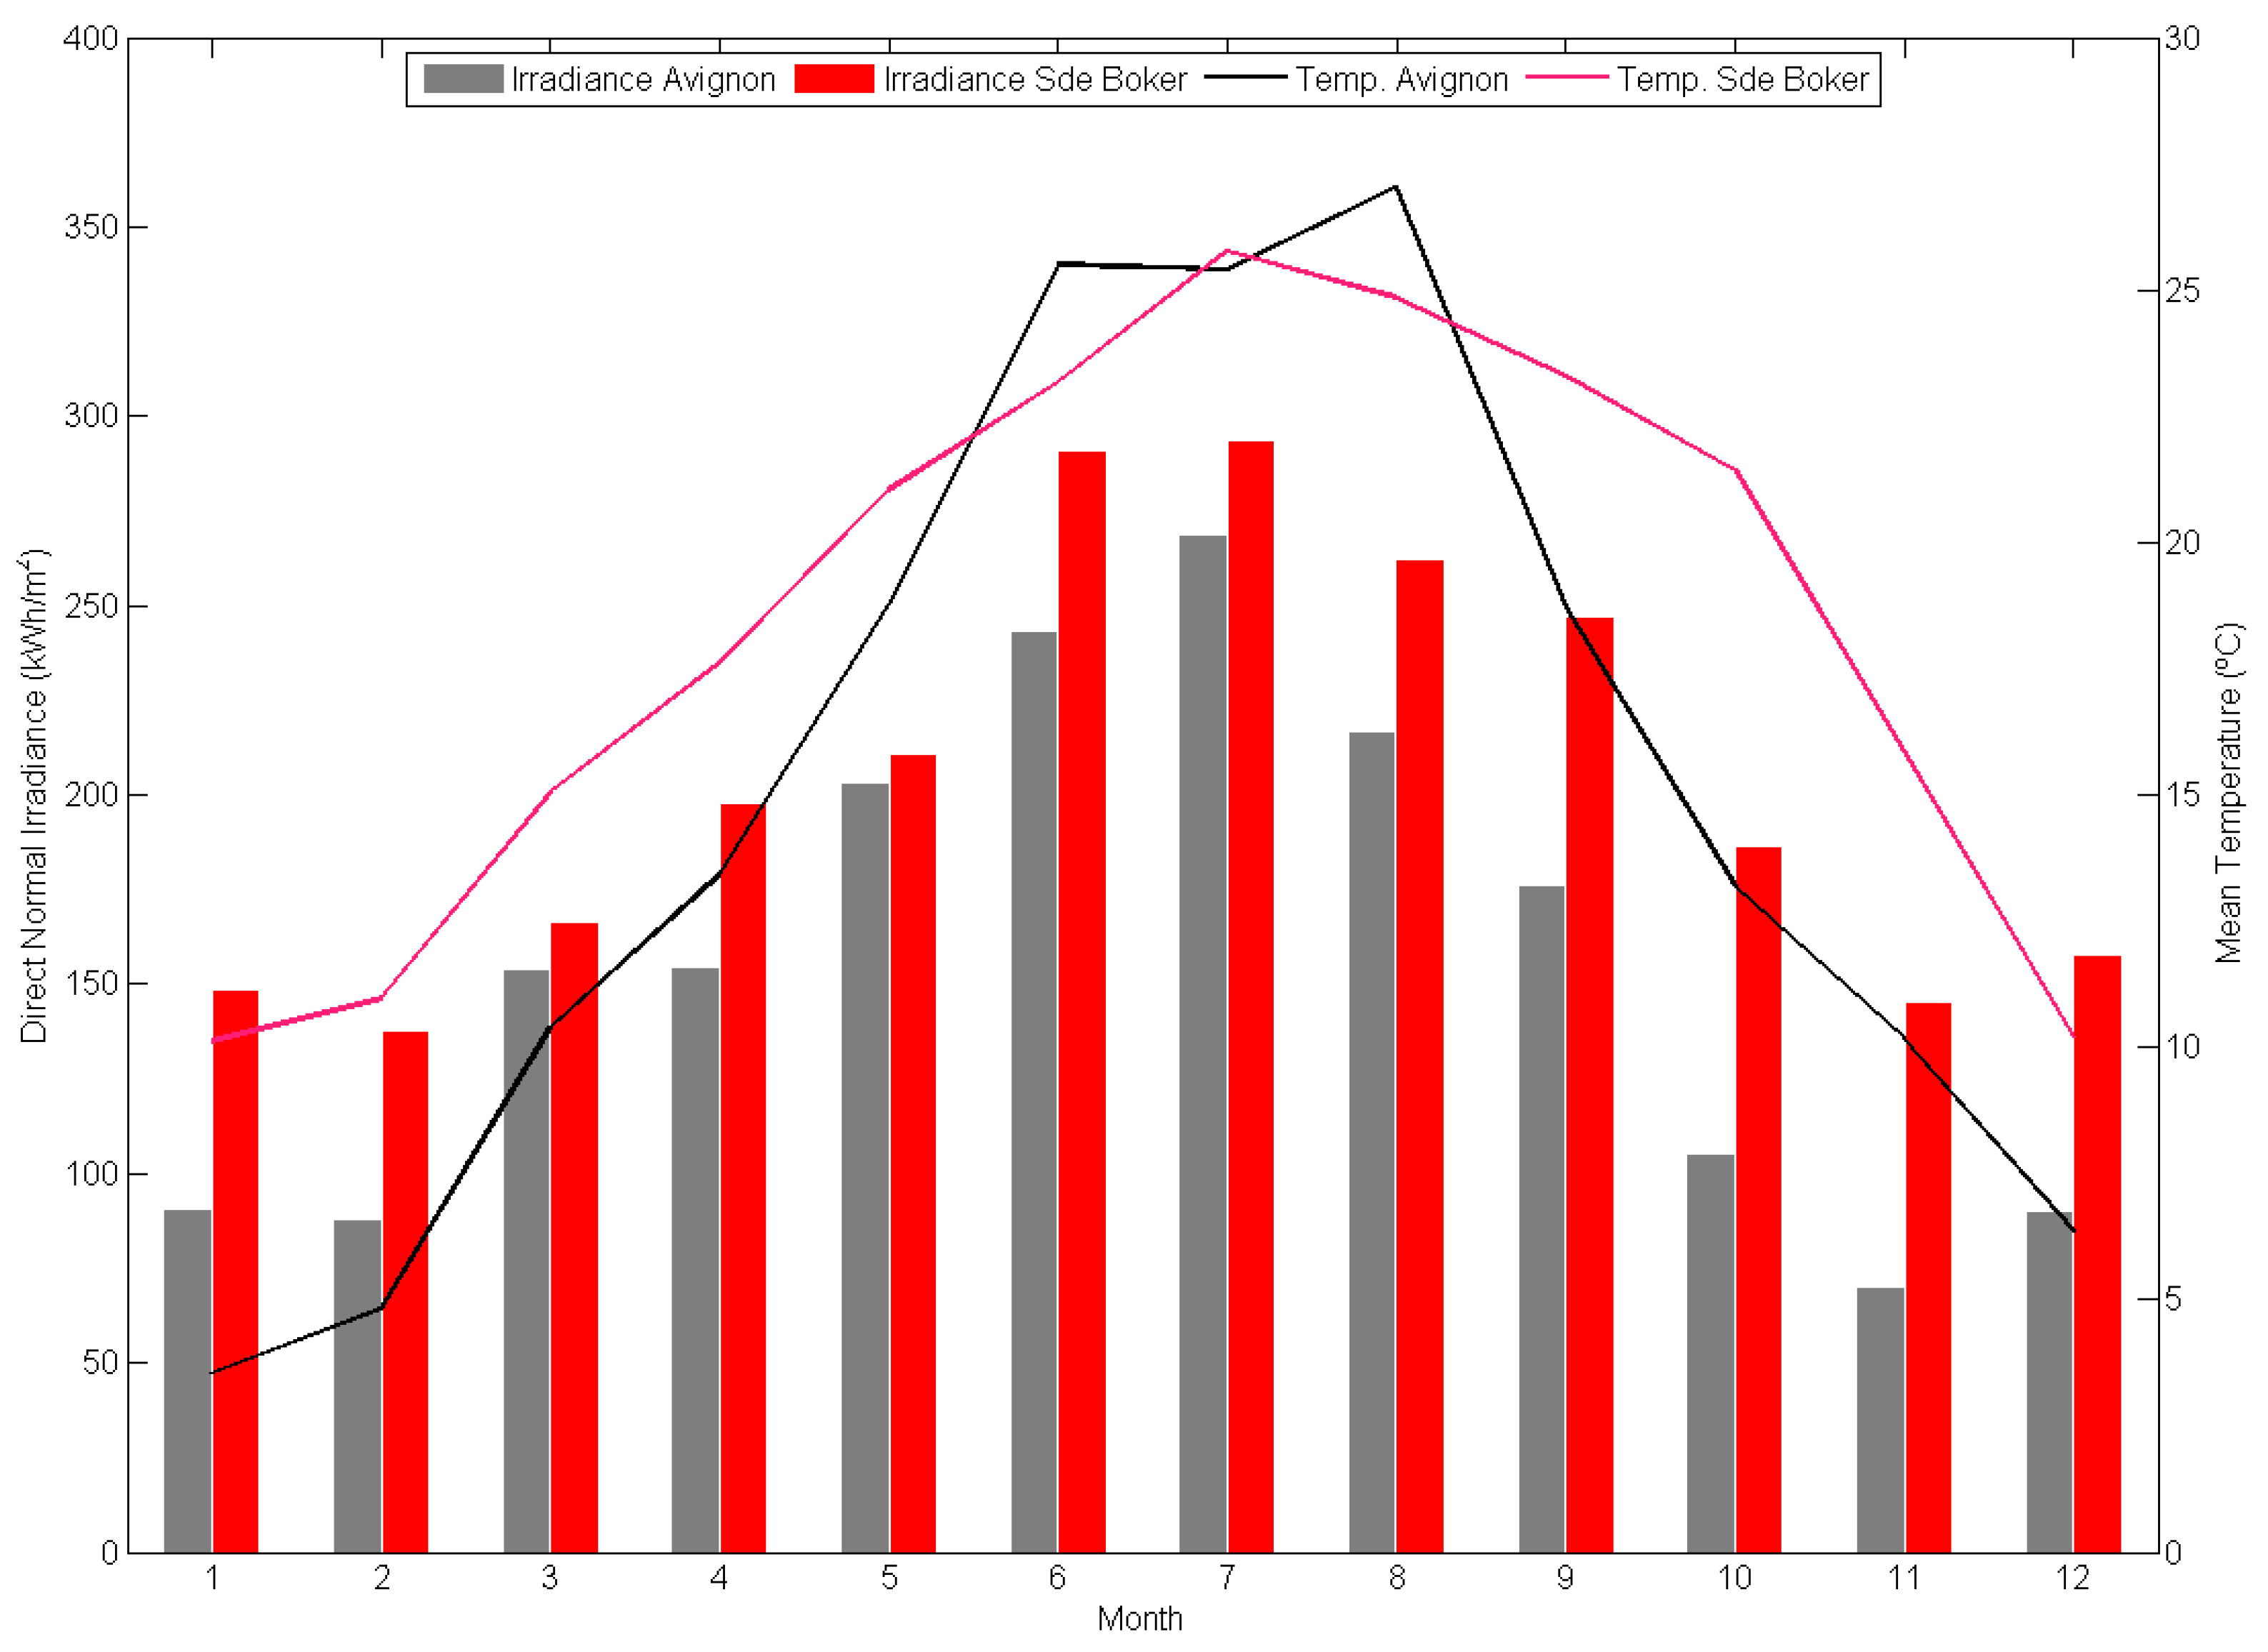
| Location | Simulated Year | Lat. (°) | Long. (°) | Elevation (m) | Mean Daily DNI (kWh/m2/day) [26] | Annual Mean Atmospheric Parameters AM | τ | PW |α |
|---|---|---|---|---|---|---|
| Sde Boker | 2004 | 30.86 | 34.78 | 480 | 6–6.5 | 1.92 | 0.18 | 1.34 |0.86 |
| Avignon | 2003 | 43.93 | 4.88 | 32 | 5–5.5 | 2.16 | 0.25 |1.76 | 1.37 |
| Location | DHW (kWh) | SH (kWh) | Electricity (kWh) |
|---|---|---|---|
| Sde Boker | 1589 | 7813 | 4433 |
| Avignon | 1955 | 16624 | 3575 |
| η0 (%) | UL (W/m2K) | k2 (W/m2K2) | F′ | ε (%) | α (%) | τ (%) |
|---|---|---|---|---|---|---|
| 79.9 | 3.97 | 0.016 | 0.913 | 5.0 | 95.5 | 91.6 |
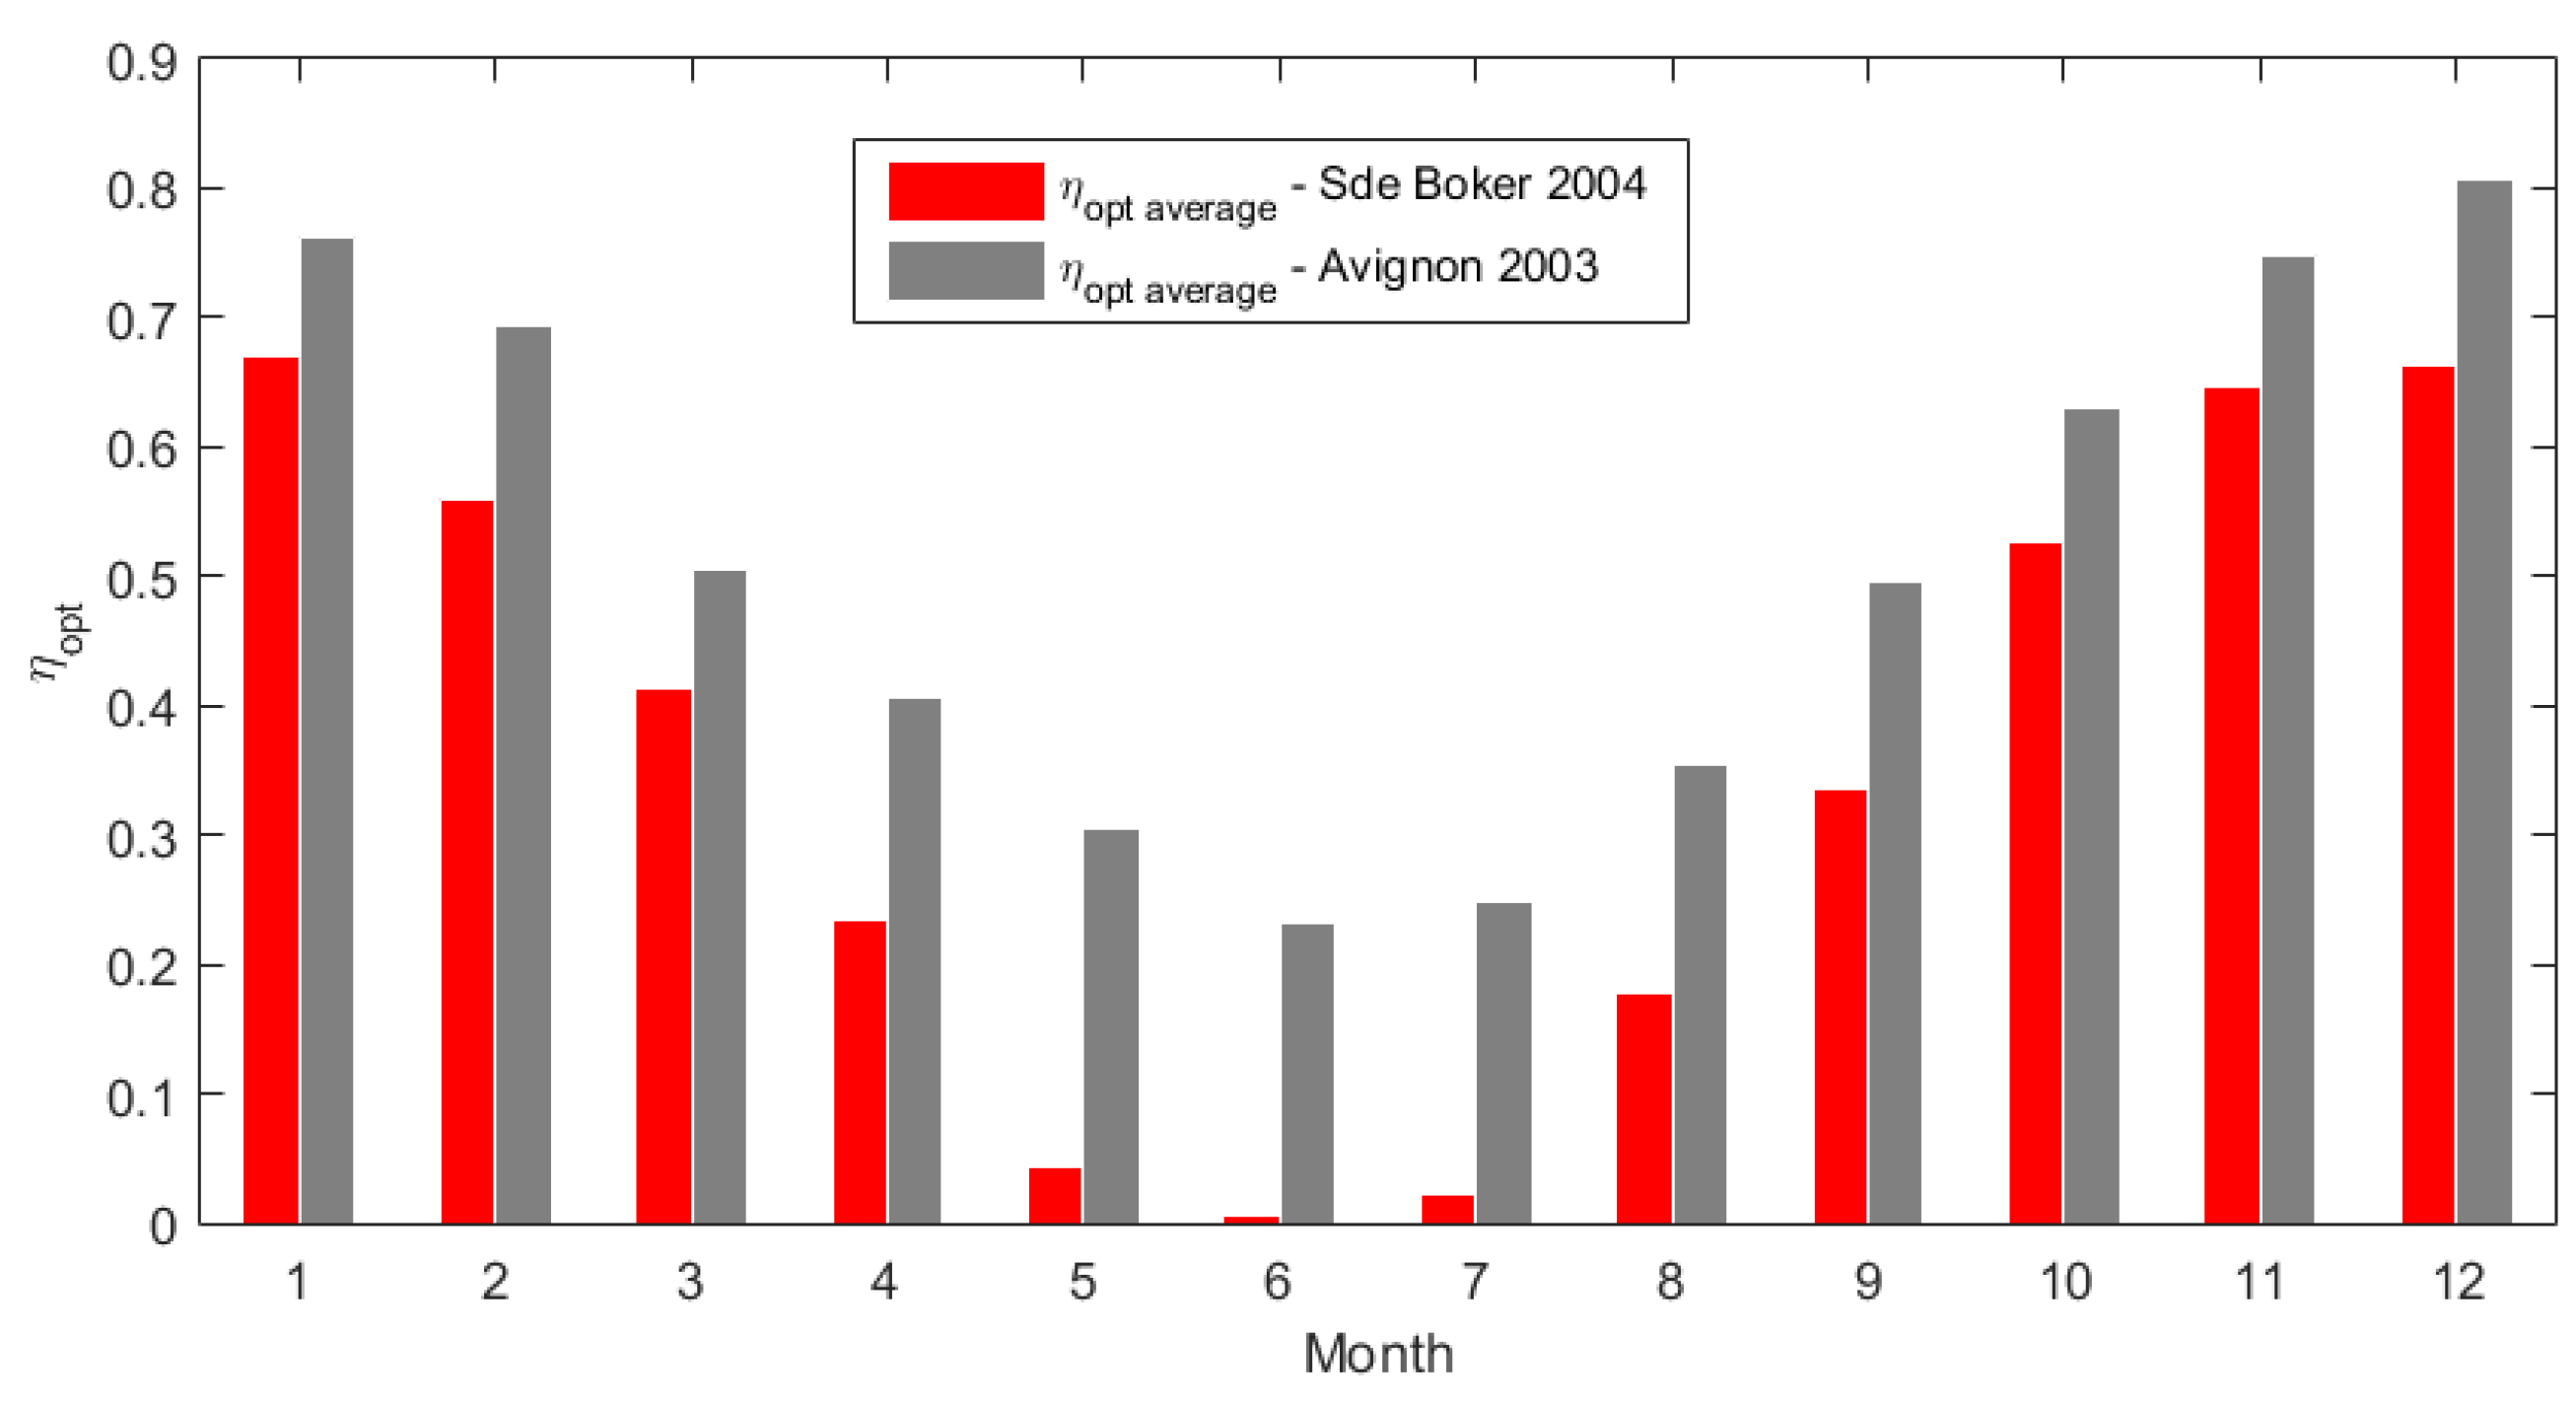
| Month | Average Optical Efficiency (%) | Average Thermal Efficiency DHW (%) | Average Thermal Efficiency SH (%) | Average Electrical Efficiency (%) | ||||
|---|---|---|---|---|---|---|---|---|
| Sde Boker | Avignon | Sde Boker | Avignon | Sde Boker | Avignon | Sde Boker | Avignon | |
| January | 67.1 | 76.3 | 11.9 | 19.7 | 28.2 | 22.0 | 22.4 | 16.6 |
| February | 56.1 | 69.5 | 12.5 | 21.7 | 27.7 | 19.2 | 27.7 | 15.2 |
| March | 41.4 | 50.5 | 13.1 | 16.8 | 26.6 | 23.9 | 23.5 | 17.0 |
| April | 23.3 | 40.6 | 17.2 | 20.3 | 14.2 | 20.9 | 29.9 | 14.3 |
| May | 4.3 | 30.4 | 45.8 | 23.0 | 1.0 | 15.0 | 22.6 | 15.8 |
| June | 0.7 | 23.1 | 56.3 | 27.2 | 0.0 | 5.7 | 23.1 | 16.8 |
| July | 2.2 | 24.8 | 51.5 | 23.4 | 0.0 | 0.0 | 24.4 | 16.8 |
| August | 17.8 | 35.5 | 18.9 | 17.0 | 0.0 | 0.0 | 19.7 | 16.8 |
| September | 33.5 | 49.6 | 11.4 | 17.2 | 0.0 | 9.9 | 23.7 | 16.5 |
| October | 52.6 | 63.1 | 10.0 | 16.2 | 0.0 | 21.2 | 21.9 | 14.7 |
| November | 64.7 | 74.9 | 11.6 | 23.1 | 18.5 | 20.1 | 19.7 | 16.9 |
| December | 66.2 | 80.6 | 17.5 | 22.0 | 28.9 | 20.5 | 17.6 | 17.3 |
© 2016 by the authors; licensee MDPI, Basel, Switzerland. This article is an open access article distributed under the terms and conditions of the Creative Commons Attribution (CC-BY) license (http://creativecommons.org/licenses/by/4.0/).
Share and Cite
Marín-Sáez, J.; Chemisana, D.; Moreno, Á.; Riverola, A.; Atencia, J.; Collados, M.-V. Energy Simulation of a Holographic PVT Concentrating System for Building Integration Applications. Energies 2016, 9, 577. https://doi.org/10.3390/en9080577
Marín-Sáez J, Chemisana D, Moreno Á, Riverola A, Atencia J, Collados M-V. Energy Simulation of a Holographic PVT Concentrating System for Building Integration Applications. Energies. 2016; 9(8):577. https://doi.org/10.3390/en9080577
Chicago/Turabian StyleMarín-Sáez, Julia, Daniel Chemisana, Álex Moreno, Alberto Riverola, Jesús Atencia, and María-Victoria Collados. 2016. "Energy Simulation of a Holographic PVT Concentrating System for Building Integration Applications" Energies 9, no. 8: 577. https://doi.org/10.3390/en9080577
APA StyleMarín-Sáez, J., Chemisana, D., Moreno, Á., Riverola, A., Atencia, J., & Collados, M.-V. (2016). Energy Simulation of a Holographic PVT Concentrating System for Building Integration Applications. Energies, 9(8), 577. https://doi.org/10.3390/en9080577