Article

Combined Turbine and Cycle Optimization for Organic Rankine Cycle Power Systems—Part A: Turbine Model

1
Department of Mechanical Engineering, Technical University of Denmark, Nils Koppels Allé, Building 403, Kongens Lyngby 2800, Denmark
2
Laboratorio di Fluidodinamica delle Macchine, Dipartimento di Energia, Politecnico di Milano, Via Lambruschini 4, Milan I-20156, Italy
*
Author to whom correspondence should be addressed.
Energies 2016, 9(5), 313; https://doi.org/10.3390/en9050313
Submission received: 21 March 2016 / Revised: 14 April 2016 / Accepted: 18 April 2016 / Published: 25 April 2016

Abstract

:
Axial-flow turbines represent a well-established technology for a wide variety of power generation systems. Compactness, flexibility, reliability and high efficiency have been key factors for the extensive use of axial turbines in conventional power plants and, in the last decades, in organic Rankine cycle power systems. In this two-part paper, an overall cycle model and a model of an axial turbine were combined in order to provide a comprehensive preliminary design of the organic Rankine cycle unit, taking into account both cycle and turbine optimal designs. Part A presents the preliminary turbine design model, the details of the validation and a sensitivity analysis on the main parameters, in order to minimize the number of decision variables in the subsequent turbine design optimization. Part B analyzes the application of the combined turbine and cycle designs on a selected case study, which was performed in order to show the advantages of the adopted methodology. Part A presents a one-dimensional turbine model and the results of the validation using two experimental test cases from literature. The first case is a subsonic turbine operated with air and investigated at the University of Hannover. The second case is a small, supersonic turbine operated with an organic fluid and investigated by Verneau. In the first case, the results of the turbine model are also compared to those obtained using computational fluid dynamics simulations. The results of the validation suggest that the model can predict values of efficiency within ± 1.3%-points, which is in agreement with the reliability of classic turbine loss models such as the Craig and Cox correlations used in the present study. Values similar to computational fluid dynamics simulations at the midspan were obtained in the first case of validation. Discrepancy below 12 % was obtained in the estimation of the flow velocities and turbine geometry. The values are considered to be within a reasonable range for a preliminary design tool. The sensitivity analysis on the turbine model suggests that two of twelve decision variables of the model can be disregarded, thus further reducing the computational requirements of the optimization.

Graphical Abstract

1. Introduction

The effective exploitation of medium-to-low temperature heat sources demands power generation technologies which are efficient, flexible and cost-competitive. In this context, Organic Rankine Cycle (ORC) power systems represent an advantageous proposition due to their technical feasibility, inherent simplicity, and the possibility to be used in combination with renewable energy sources and decentralized power plants.
In their simplest configuration, ORC power systems consist of a pump, a boiler, an expander and a condenser. The expander is arguably a crucial component owing to design complexities often associated with the presence of real-gas phenomena and supersonic flow conditions, and since it can greatly affect both the overall energetic efficency and the total cost of the system. As an example, Stine et al. [1] estimated an expander cost of almost 30 % on the whole plant investment. Lecompte et al. [2] performed a techno-economic optimization of an ORC, indicating a relative incidence between 22 % and 34 % on the overall plant costs according to the selected working fluid. Cayer et al. [3] showed that the investment cost of a turboexpander can be as high as 50 % of the total cost of the ORC system.
One of the preliminary design steps of an ORC unit is the selection of a suitable expander type. Volumetric machines such as scroll, screw, piston, and rotary vane expanders are competitive solutions in the lower power output range (<50 kW), are easier to manufacture and can be cheaper compared to turboexpanders. Furthermore, they operate at lower rotational speeds and can tolerate two-phase flows during expansion, which can lead to blade erosion issues in turbomachines. However, the applicability of volumetric expanders is limited by a maximum volume ratio and by low values of efficiency. Bao and Zhao [4] have reported maximum volume ratios of approximately eight and maximum efficiency of approximately 70%. Axial and radial turboexpanders are employed for high flow rates and large pressure ratios, typically in the power range above 50 kW [5]. In the ORC field, Fiaschi et al. [6] have suggested the use of radial inflow turbines as advantageous solutions in the small power range due to their compact structure, higher enthalpy drop per stage and insensitivity to load variation at off-design. In the context of radial turboexpanders, novel architectures have been studied by Persico et al. [7], Pini et al. [8] and Casati et al. [9], who have highlighted the specific flow features and advantages of centrifugal turbine configurations for high-temperature and small-power output applications. Axial turbines are generally adopted for high mass flow rates and in multistage configurations [10,11]. Many ORC manufacturers [12,13] employ axial turbines for small to large scale applications. Uusitalo [14] has recommended the use of axial stages for high values of turbine specific speed. Klonowicz et al. [15] have highlighted that axial-flow turbine configurations usually have better structural properties than their radial counterparts because, in the latter, the centrifugal force acts perpendicularly to the blades. Several methods are available for axial-flow turbine analysis, according to the design phase and objective of the study. At the early stage, a one-dimensional tool can be used to estimate turbine performance and the design of the annulus line.
The objective of this two-part paper is to provide a methodology for the combined optimal design of a turbine and an ORC power system. The axial-flow turbine configuration was selected due its technological maturity, the high performance achievable already with a single stage, the wide range of applicability, the possibility of adopting multiple stages or partial admission for very low or high mass flow rates, and the large availability of data and scientific publications in the literature. The model presented herein, named TURAX, has been particularly conceived to (i) simulate axial-flow turbines operating with organic fluids and to (ii) perform a coupled optimization with the design of the ORC system. In this respect, the use of a reliable, accurate and computationally efficient model is of paramount importance. Part A outlines a description and an extensive validation of the mean-line model, in order to ensure reliability and accuracy of results. In addition, a global sensitivity analysis on the main parameters is presented, in order to identify the most significant decision variables for turbine design and optimization, and reduce the computational efforts when the model is coupled to the thermodynamic cycle. The validation was carried out considering the experimental data of two well-documented test cases from literature, one of which features an ORC turbine. In the first case, the model was also validated using computational fluid dynamics (CFD) simulations, in order to provide a comparison with state-of-the-art modeling techniques. The simultaneous optimization of the expander and cycle design is applied on a case study and is presented in part B.
One-dimensional numerical tools for preliminary turbine design similar to those presented in this paper have been developed in the past [8,16,17]. However, in comparison with previous works, a much more thorough validation of the code is presented in this paper, based on the best available and documented data from literature. In this respect, the model is also validated using the data of an ORC axial turbine, for which no other well-documented references are found in the literature. Another novel approach is that a global sensitivity analysis is carried out in order to reduce the number of decision variables and, consequently, the computational efforts required by the model optimization. Moreover, in comparison to previous works, TURAX enables the user to select a suitable optimization method among genetic algorithm, population-based methods, direct search methods, gradient-based methods, or a combination of the previous ones, in order to tailor the solution strategy to the specific requirements of the considered application. The coupling of expander and cycle tools to estimate the design of an ORC system has been presented by Ventura and Rowlands [18] and Uusitalo et al. [19]. One difference compared with the present work is that a radial inflow turbine configuration was considered in both studies, whereas an axial turbine design is considered herein. Moreover, both of the cited works did not optimize the design of the turbine: Ventura and Rowlands [18] obtained the turbine performance from a database, whereas Uusitalo et al. [19] set the expander efficiency to 80 % . Conversely, in the present work, a simultaneous optimization of both cycle and expander designs is carried out. In conclusion, to the authors’ best knowledge, this is the first time that a thorough validation of a mean-line axial turbine model is presented and that the design tool is coupled with an ORC cycle model for the simultaneous optimization of both expander and cycle designs using advanced optimization algorithms.
Part A is structured as follows: Section 2 explains the methods for validation and sensitivity analysis. Section 3 presents the results. Conclusions are given in Section 4.

2. Axial Turbine Model

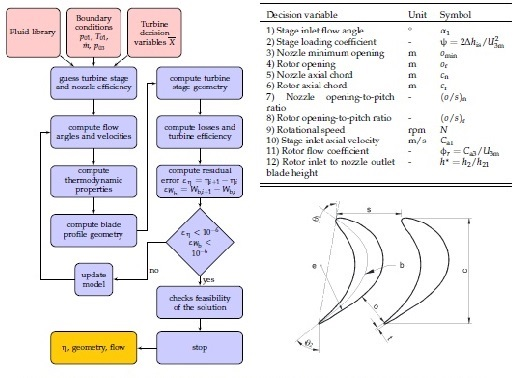
2.1. Modeling Approach

The axial turbine model, TURAX, originated from an MSc thesis work [20] and has been used in a subsequent study [21]. The model is written in Matlab language [22] and provides the mean-line preliminary design and the efficiency prediction for an axial-flow turbine.
The model requires the following inputs:
a)
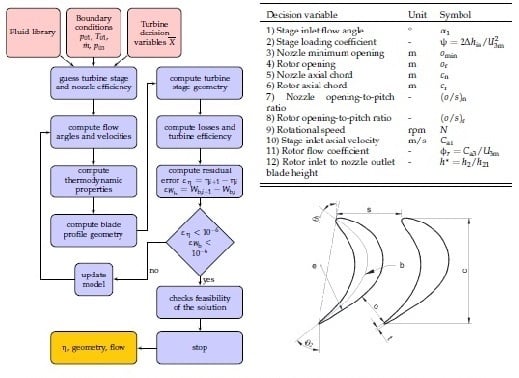
A set of boundary conditions: inlet total pressure p 01 , inlet total temperature T 01 , mass flow rate m ˙ , outlet total pressure p 03 . These are typically inputs from cycle calculations.
b)
An array X ¯ of 12 turbine decision variables listed in the table of Figure 1.
c)
Specifications on blade shape geometry, clearance between nozzle and rotor s s , blade tip clearance t cl , surface roughness k s , nozzle to rotor mean radius ratio R * .
d)
A fluid library: the fluid can be a pure component or a mixture at a specified molar composition. For instance, the user can select the fluid thermophysiscal property libraries REFPROP® [23] or CoolProp [24].
The model can be expressed in the analytical form:
[ η tt , g e o m e t r y , f l o w ] = f ( T 01 , p 01 , p 03 , m ˙ , f l u i d , X ¯ ) ,
where the outputs are the isentropic efficiency (i.e., the total-to-total efficiency η tt ), the turbine main geometrical parameters ( g e o m e t r y ), and the thermo-fluid-dynamic features ( f l o w ) at nozzle and rotor inlet and outlet. The working principle for a single-stage turbine is illustrated in Figure 1. The calculation process is iterative and proceeds as follows:
  • In the first iteration, assumption of the guessed values of turbine stage and nozzle efficiencies.
  • Estimation of outlet flow angles and velocities. The former are estimated with the correlation of Ainley and Mathieson [25] for subsonic flow regimes. The Vavra correlation [26] is used for supersonic flow conditions.
  • Calculation of thermodynamic properties.
  • Calculation of nozzle and rotor blade profile geometry and outlet flow angles. The Deich’s formula [27] is used to calculated the blade opening for converging-diverging nozzle. The profile loss correlations of Craig and Cox used for nozzle converging profiles are also adopted for a supersonic configuration. This approach, supported by Macchi [28], is based on the large number of efficient converging-diverging nozzles which were designed and tested according to Deich’s method.
  • Calculation of turbine stage geometry.
  • Estimation of losses and efficiency. The method by Craig and Cox [29] is used since it is considered by a number of references as one of the most complete and reliable [15,30,31]. Shock losses in a blade row are computed according to Kacker and Ockapuu [32]. Disk windage losses are estimated according to Balje and Binsley [33]. Partial admission losses are calculated using the method by Suter and Traupel [34], which is considered as one of the best available and comprehensive models [11,35].
  • In order to account for the area restriction due to the influence of the boundary layer, restriction factors are applied to the mass balance equation using the method of Vavra [26] with an energy form factor of 0.9 [28].
  • Calculation of the error on efficiency and blade work. The process iterates until the residual error between two consecutive iterations is below a predefined threshold value (i.e., 10 - 6 ).
  • In order to produce a feasible solution, the algorithm checks that the resulting turbine design satisfies a set of predefined constrains in the end of the iterative loop. The user can specify the values of the desired constraints in the model. An example of such constraints is provided in part B.
The detailed equations for turbine design can be found in textbooks and papers on the topic [11,26,28,36,37,38] and are therefore not reported here.

2.2. Validation

The model was validated considering two reference cases. The first case is the last stage of a four-stage turbine investigated at the Technical University of Hannover by Groschup [39] in 1977, and subsequently used as reference for further studies [40,41]. The working fluid is air and the turbine facility is an open loop configuration with exhaust to the atmosphere. The blading is of the free-vortex type with 50% degree of reaction. Total and static pressure, flow angles and total temperature were measured for ten traverse points with a probe. A total pressure measurement error in the order of 0.25% was reported . Table 1 lists the turbine operating conditions and geometry at the design point.
In the present work, CFD simulations on the flow in the same turbine were performed using ANSYS CFX®. The results are included as reference for the validation of TURAX. The CFD simulations were performed using a 3D, unsteady model with the RANS k - ω SST model by Menter [42], applying the standard CFD model for turbomachinery flow simulations in use at Politecnico di Milano [43]. The reliability of this model was assessed against experiments performed at Politecnico di Milano. The CFD model predicted accurately the fully three-dimensional and unsteady flow physics, and estimated the stage efficiency within 1% of experimental data. For the Hannover turbine test case, the three-dimensional blade profiles were generated using the data available in Kotzing and Evers [41]. The computational domain was discretized using a structured, orthogonal and flow-oriented mesh. A grid-sensitivity analysis was performed using the turbine polytropic efficiency [37] as an indicator. Different tests were run by refining the mesh with a step of 400,000 cells each time. A change in polytropic efficiency below 0.1% was achieved using 110 layers in spanwise direction and about 3,200,000 cells in the computational domain. Figure 2a shows an example of the final rotor grid. The model was set up using profiles of total pressure, total temperature, a constant inlet flow angle of 10°, and turbulence intensity of 1% as boundary conditions at the nozzle inlet. The total pressure and temperature profiles at the inlet were interpolated from the experimental data of the turbine. A constant mass flow rate of 6.786 kg/s was imposed as boundary condition at the stage outlet. In addition, periodic boundary conditions were imposed on the lateral surfaces of the blade channel. Convergence in the residual values of the momentum equations in the integral value of blade work was reached for a value of 100 in the accumulated time step of the solver. ANSYS CFX® default settings were used for the other parameters in the simulation setup. The validation of TURAX was performed imposing a stage degree of reaction of 0.5 and the actual stage inlet blade height.
The second case of validation is a low-power output turbine operated with an organic fluid and documented by Verneau [44]. The turbine was developed for waste heat recovery applications of automotive engines. The turbine is of the impulse type and it operates with the fluid R113 and partial admission. The measured total-to-static efficiency is 63% and the delivered power output is 3 kW. The stage is highly-loaded featuring a converging-diverging nozzle with supersonic exit conditions and transonic conditions in the rotor. Due to the small blade heights, untwisted profiles were adopted. The report of Verneau does not include the specific data of the blade profiles, therefore it was not possible to carry out a CFD analysis as in the other case study. Nonetheless, considering the complexity of the phenomena within the turbine (i.e., supersonic flows, partial admission, real fluid behavior, low Reynolds number), this case of validation is useful to highlight advantages and limitations of a mean-line model for the estimation of the preliminary design of an ORC turbine. Moreover, the interest in the analysis of this specific case comes also from the strong lack of reliable and accurate data on ORC turbines in the open literature. For this case of validation, two correlations were employed in addition to those presented in Section 2.1:
  • A correction in the profile losses suggested by Craig and Cox [29] in order to account for the converging-diverging shape of the nozzle.
  • A formula due to Aungier [11] in order to include supersonic expansion losses at nozzle outlet.
It was observed that the introduction of these two correlations has a limited impact on the estimate of the overall stage performance. However, it allowed having a better redistribution of losses between the nozzle and the rotor, and consequently a better match in the velocities. Another approach is found in Macchi [28], where the nozzle losses for supersonic flows have been taken into account including the profile losses for converging nozzle and the correction from Vavra [26]. Since not all data required for the validation were provided in the reference, stage loading, opening-to-pitch ratios, flow coefficient, inlet axial velocity were estimated by obtaining the best possible match with nozzle inlet and rotor outlet blade heights, and with the number of nozzle and rotor blades. Furthermore, uniform entry conditions to tip seals were considered. The main data on geometry and operating parameters of the turbine are listed in Table 1.

2.3. Sensitivity Analysis

Since the axial turbine model is to be coupled to the thermodynamic cycle model, it is important to ensure that it is as computationally efficient as possible. However, the number of decision variables for a turbine model optimization can be very large and can exponentially increase the computational requirements. Therefore, a sensitivity analysis was performed on the turbine model with the aim to indicate which decision variables have the biggest influence on turbine efficiency, and, possibly, to reduce the number of required decision variables by removing those that have limited or negligible impact on the solution. The sensitivity analysis was performed according to the Morris screening method [45]. The information obtained from a local sensitivity analysis is combined in order to provide a global preliminary screening of the most important decision variables in the model by using limited computational efforts. In addition, the method allows highlighting the mutual interactions and the interdependence among the variables. The Morris screening method is based on statistical analysis. The reader is referred to the original paper by Morris [45] for additional details. In this context, the original decision variables subjected to the analysis were twelve. The method requires using a value of sampling size and of number of screening levels in each decision variable domain. These two parameters are an arbitrary choice of the analyst, and different values can be selected [45,46]. In the present work, six screening levels and a value sampling size of 50 were used, in order to obtain a satisfactory compromise between accuracy and calculation time. The sensitivity analysis was performed using the model developed by Sin et al. [47] and was based on the Hannover turbine test case. The decision variables were varied in the range ± 25 % of their nominal values of Table 1.

3. Results

3.1. Hannover Turbine

Table 2 shows the comparison of TURAX and CFD results with the experimental data of the Hannover turbine test case. CFD and experimental values are reported as mass-weighted averages except for pressure, which is provided as area-weighted average. The mass-weighted average and the relative error for the generic quantity φ were computed as:
φ ¯ = A ρ C a φ d A A ρ C a d A E r r φ = | φ - φ ¯ exp | φ ¯ exp ,
where ρ , C a and A are the density, axial velocity and cross-sectional area. The subscript e x p refers to measured experimental data. The error in flow angles and geometric angles is provided in degrees. Figure 2 shows the some details of CFD simulations. Figure 3 shows static temperature and pressure profiles in spanwise direction at different turbine sections. The experimental points are reported in the chart. The average thermodynamic conditions and flow angles at nozzle outlet (see also Figure 3a–b) of CFD and TURAX are in good agreement with experiments. Experimental and CFD results show a good match along the blade span, and CFD values are close to those of TURAX at midspan. The axial velocity profiles of Figure 3c are uniform at the nozzle outlet, although they appear to be underestimated by both tools. As a result, higher discrepancy in the estimation of average absolute velocity is found. The higher velocity at the nozzle outlet from experimental data can also be related to the fluid-dynamic characteristics in the rotor. The results show that the prediction error increases from nozzle to rotor. These differences are more evident in the axial and relative velocity profiles where the mismatch increases in the endwall regions. Figure 2b shows the entropy field in the rotor, which highlights the complex loss mechanisms in the rotor row. Hirsch and Denton [40] remark that the low flow coefficient and aspect ratio (chord over blade span) of the turbine are likely to be the cause of flow turning and secondary flow effects which become particularly strong at the root, and have influence on the flow field along the blade span. These 3D effects propagate toward the midspan. As a consequence of the error propagation along the stage and the difficulty in predicting the large change of flow angles and velocities in the spanwise direction, TURAX and the CFD model show a discrepancy in the average flow angles and velocities at nozzle outlet as high as 10% and 11.8%, respectively, by comparison with the experimental data.
The mean-line model provided accuracy within 1% in the estimation of the mean radius, within 5% in the blade heights, within 8° in the flare angles, and underestimated the number of blades by one unit. The performance of the turbine stage was evaluated through the total-to-total efficiency η t t and the nozzle and rotor kinetic energy loss coefficients, ζ n and ζ r , defined as
η tt = h 01 - h 03 h 01 - h 03 s ζ n = h 2 - h 2 s C 2 2 / 2 ζ r = h 3 - h 3 s W 3 2 / 2 ,
where 1,2,3 refer to nozzle inlet, nozzle outlet, and rotor outlet, h is the specific enthalpy, 0 refers to total conditions, s refers to isentropic conditions, and C and W are the absolute and relative velocities, respectively. The mass-weighted average value of efficiency from experimental results was calculated as approximately 91 . 6 % . Both CFD simulations and TURAX overestimated the efficiency of the stage by 1.7 and 1.2%-points, respectively. The presence of effects difficult to predict accurately such as 3D turning, secondary flow effects as well as of the unsteady stator-rotor interaction might explain the lower value of turbine efficiency obtained in the experiments. The blade row parameters can be related to the efficiency of the stage by resorting to approximate relations such as those proposed by Dixon and Hall [37]. For similar thermodynamic conditions at the nozzle outlet, the higher value of absolute velocity in the experimental measurements results in a lower nozzle loss coefficient whilst a higher experimental rotor loss coefficient contributes to the lower turbine efficiency.
In this case of validation, TURAX proved to be a reliable tool by comparison with both experimental and CFD results since the discrepancy in the estimated efficiency was in the order of 1 % . In addition, it provided very good agreement with average CFD values and acceptable agreement with experiments, thus making it suitable for preliminary design estimation.

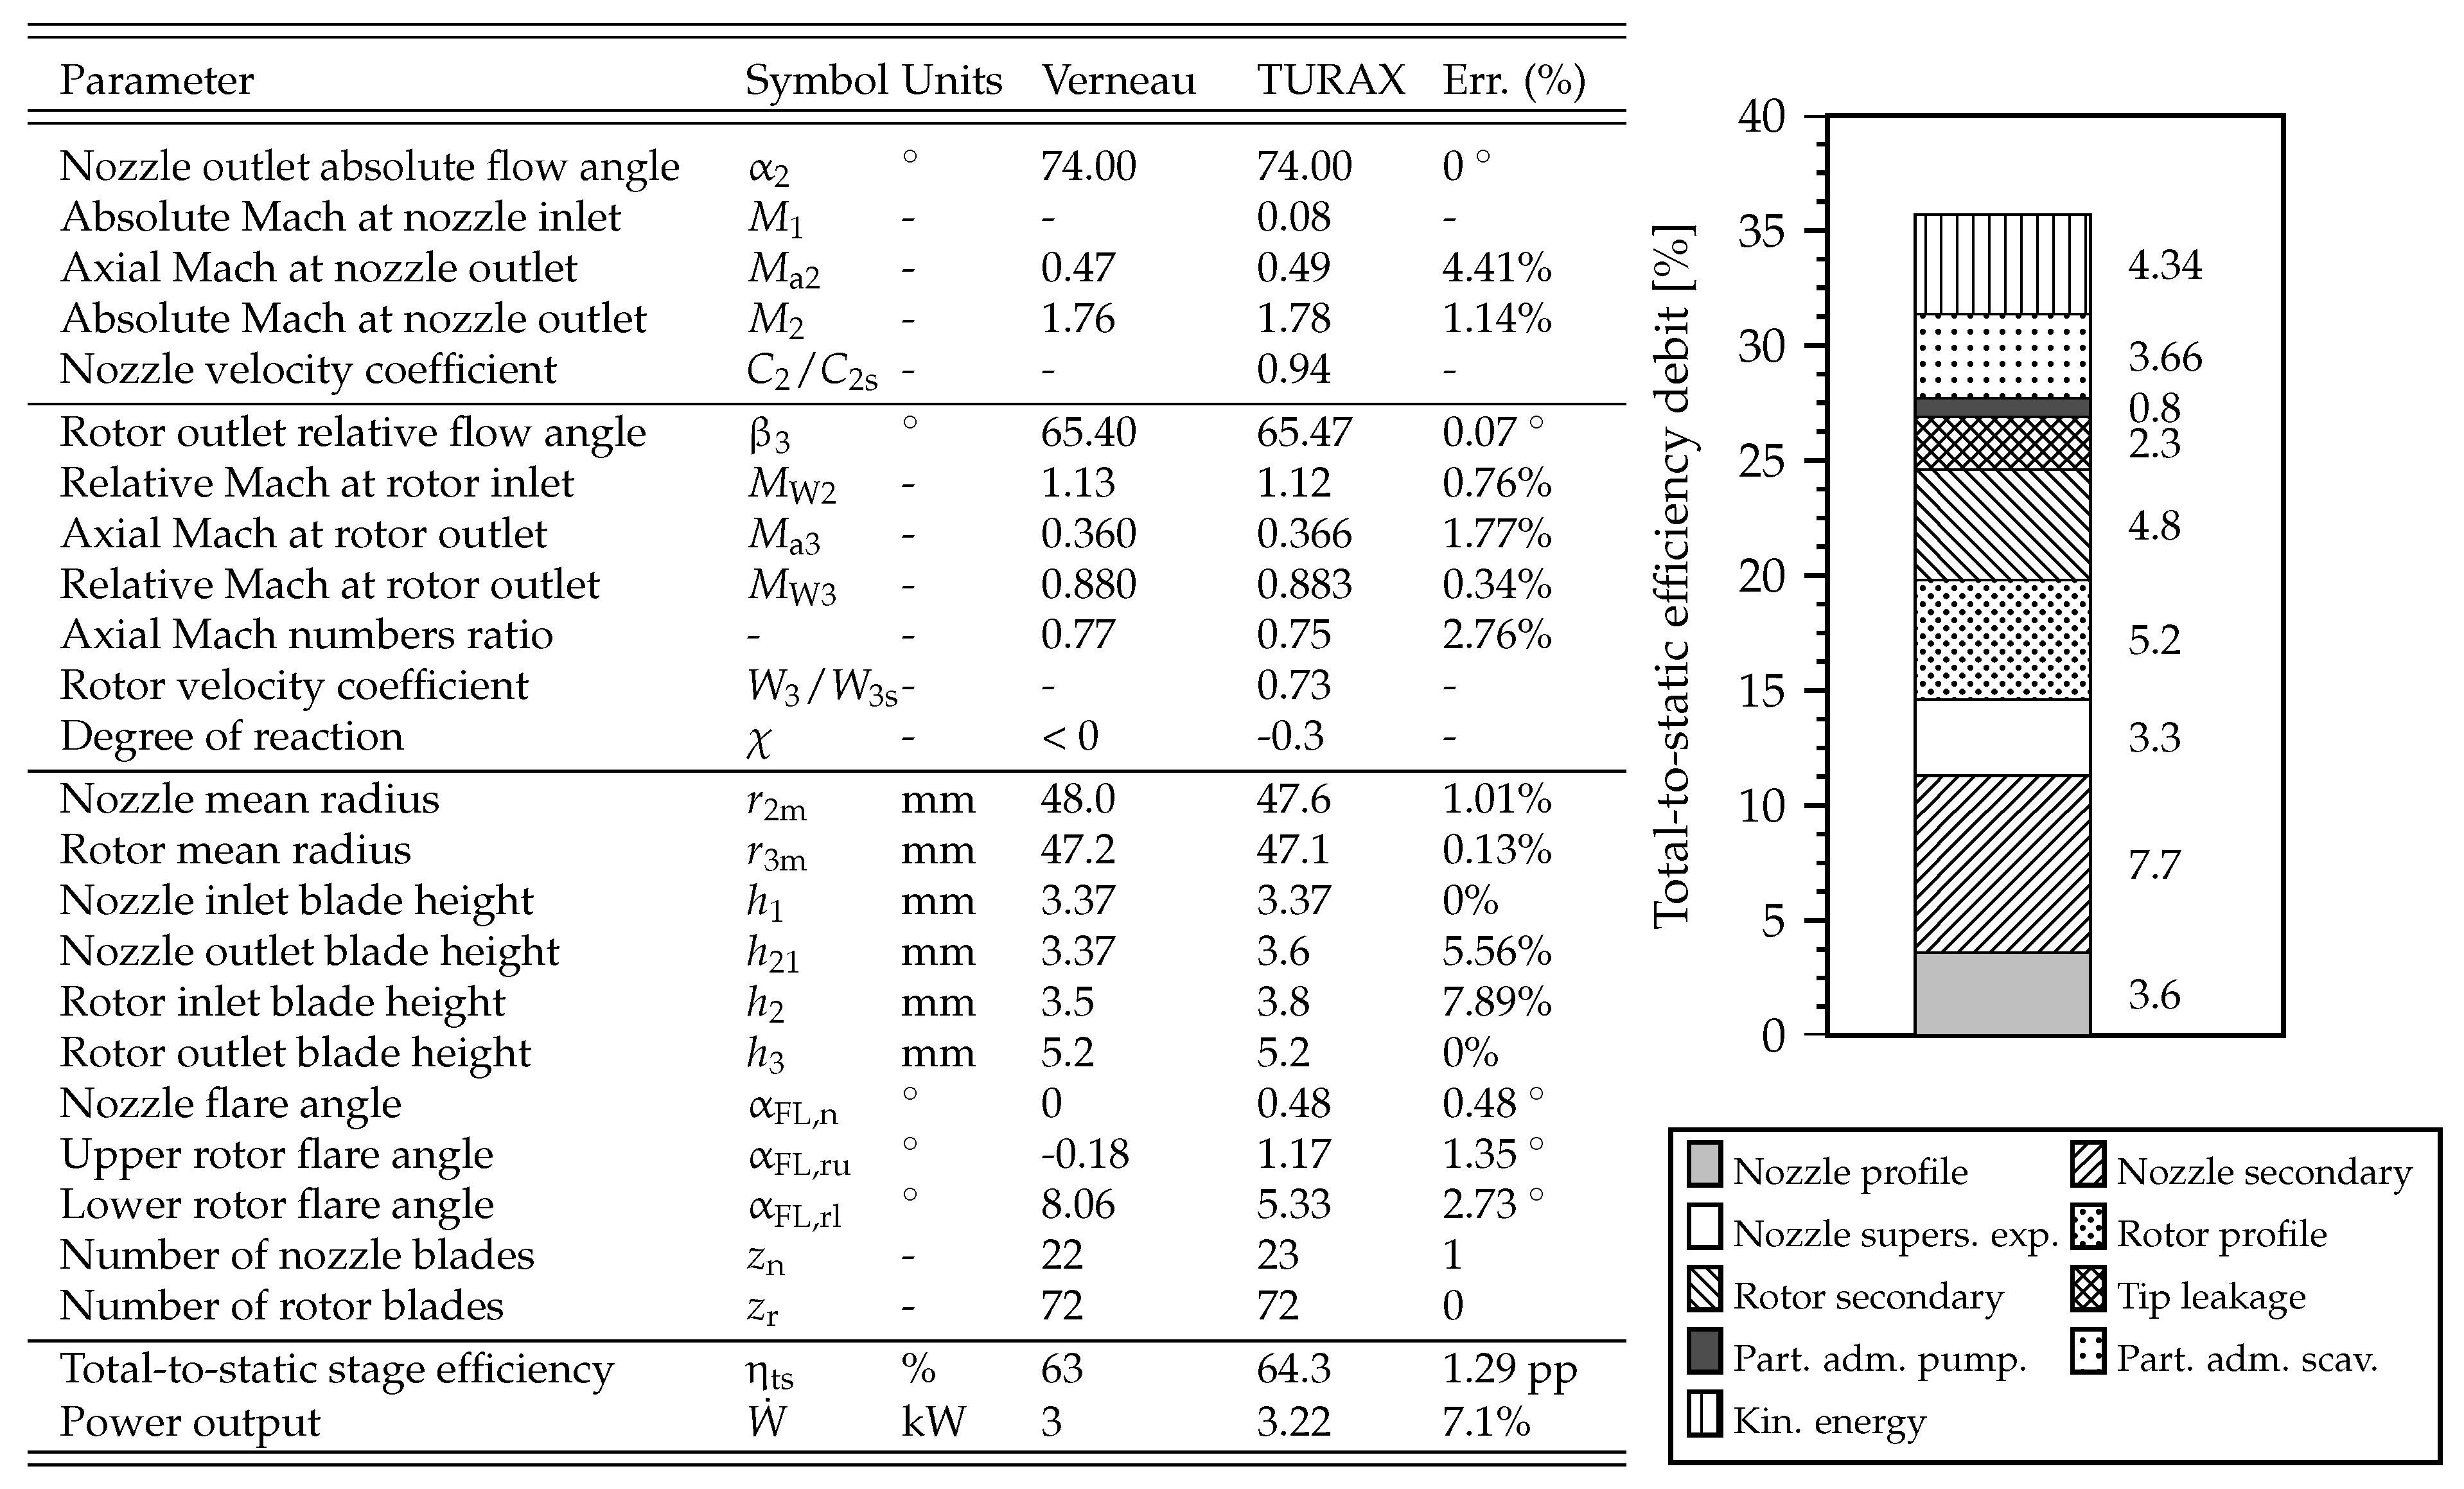
3.2. Verneau Turbine

Figure 4 shows the results of the validation of TURAX with the ORC turbine investigated by Verneau [44]. Excellent agreement is obtained in the estimation of nozzle and rotor outlet flow angles and good agreement is obtained in the prediction of velocities. The error on the flow velocities affects the values of blade heights, which nevertheless differ by only 0.3 mm. The performance prediction was performed using the total-to-static efficiency:
η ts = h 01 - h 03 h 01 - h 3 s .
TURAX predicted a value of 64 . 3 % , which is within 1.3%-points of the measured value. The relative contribution of losses is higher in the rotor, as highlighted by the lower value of rotor velocity coefficient. However, a higher efficiency debit is computed for the nozzle, due to the higher kinetic energy at the outlet. The chart in Figure 4 shows the breakdown of turbine losses. The blade profile is adapted to a converging-diverging shape and the profile losses in the nozzle result in being comparatively small. Nozzle secondary losses represent the first source of performance degradation, with approximately 7.7%-points of efficiency debit. Secondary losses in a blade row increase for high inlet to outlet velocity ratios and low aspect ratios (blade height over backbone length). The nozzle exhibits a very small velocity ratio (about 0.04), thus the biggest contribution to secondary losses stems from the small value of aspect ratio (ca. 0.27), which generates strong secondary flows within the blade row. The high Mach number at the nozzle trailing edge suggests the presence of shock waves in the stator-rotor gap leading to additional losses, here referred to as supersonic expansion losses. Transonic flow conditions are encountered at the rotor inlet. Consequently, profile losses increase due to the presence of shock waves generated at the leading edge of the rotor blades. The high velocity ratio (i.e., >1) and the low aspect ratio significantly increase the secondary losses in the rotor. At the same time, the high velocity at the outlet results in significant discharge kinetic energy losses (around 4.3%-points). Tip leakage losses depend on the aerodynamic loading of the rotor. In this case, it provides only a marginal efficiency debit since the turbine has a very low degree of reaction, therefore the pressure drop typically associated with this type of loss is small. Finally, partial admission losses provide a contribution on the same order of magnitude as the kinetic energy losses. In this case, most of the wasted energy comes from the filling of inactive passages within the blade row, referred to as scavenging losses. The difference in power output obtained by TURAX and that reported by Verneau is 7.1%, corresponding to 0.22 kW.

3.3. Sensitivity Analysis
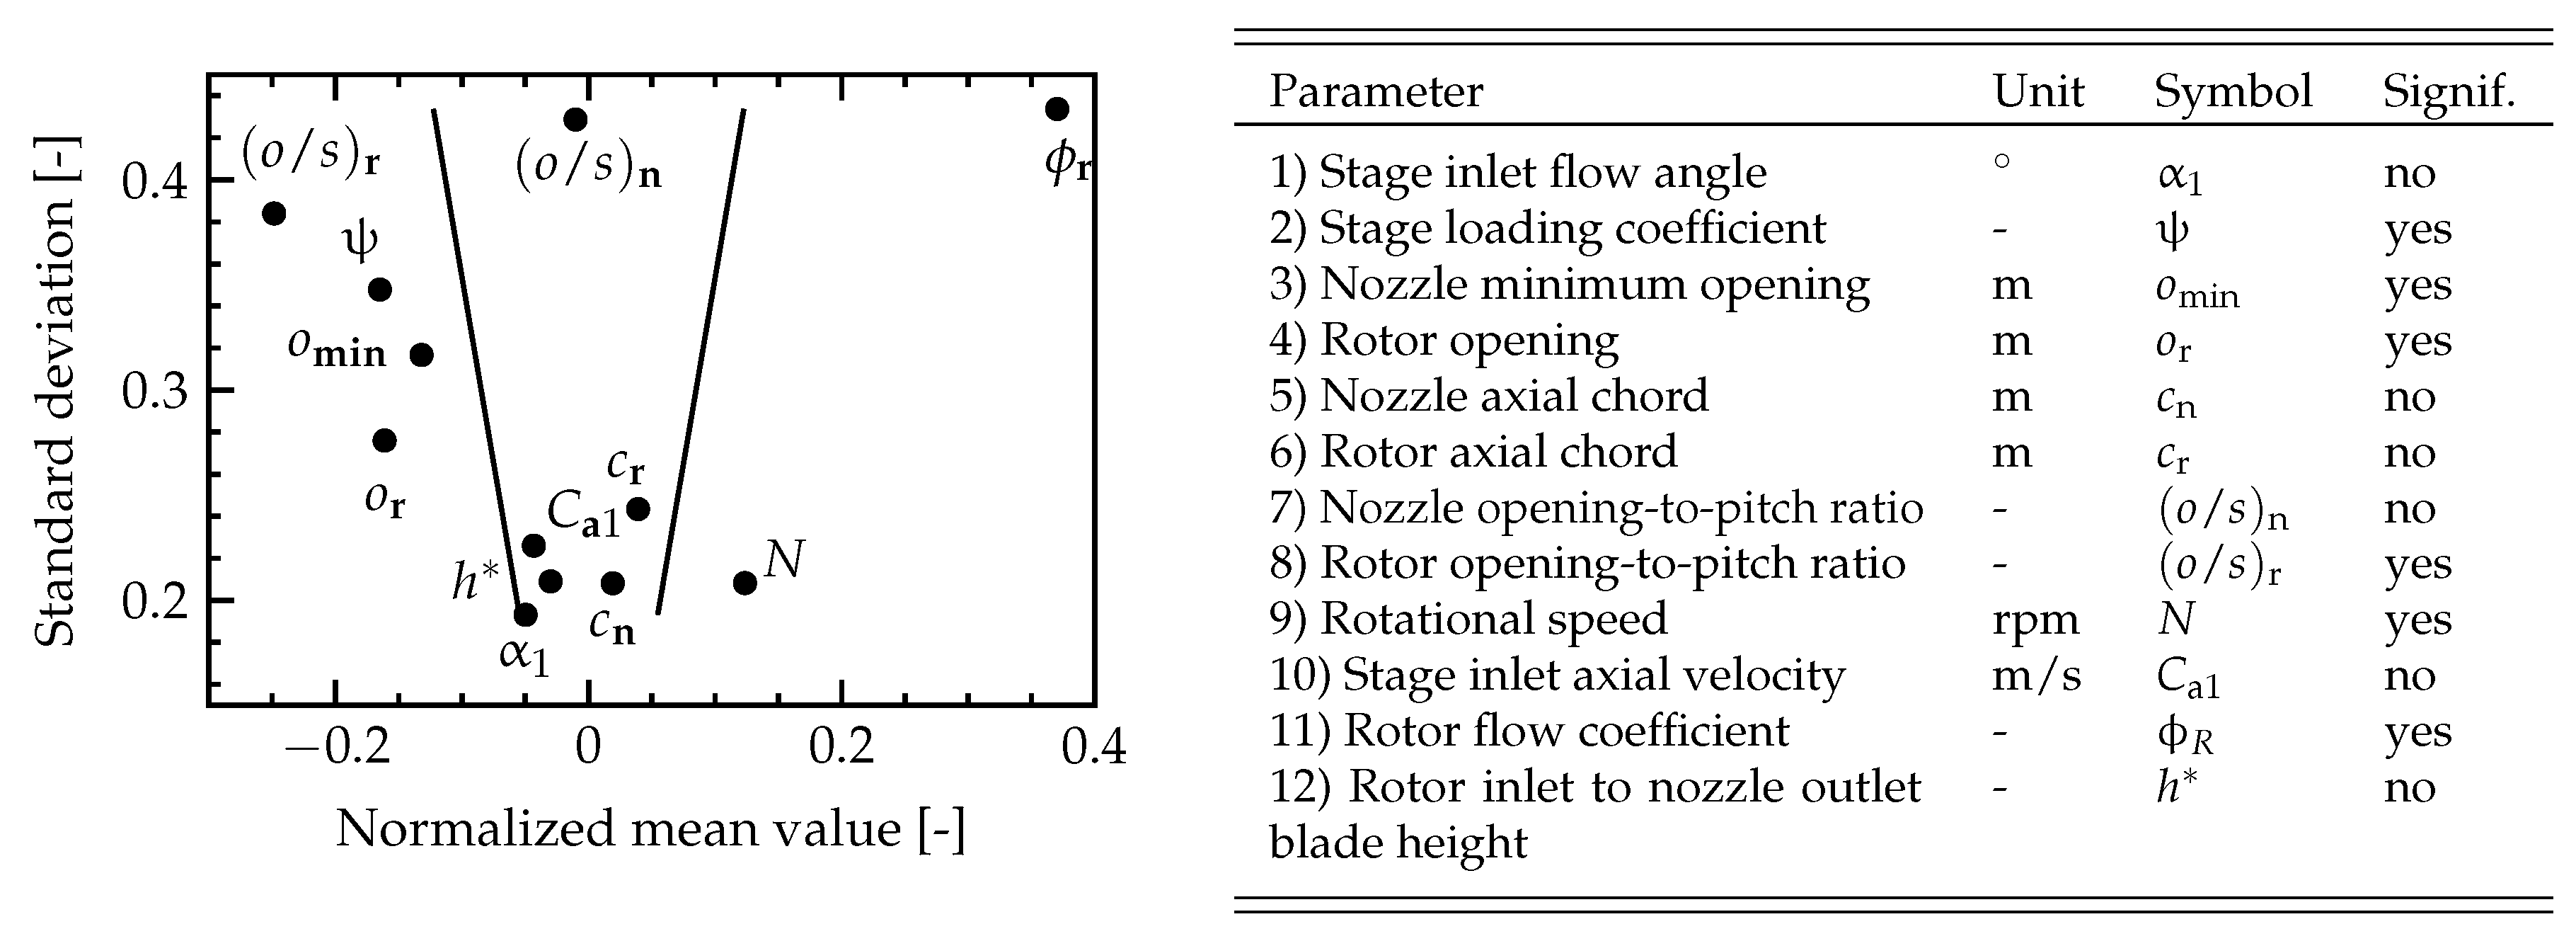
Figure 5 presents the results in the standard deviation-mean value diagram. Two black lines are drawn in the chart, which connect standard error and mean value of each decision variable. According to Morris [45]: (1) a large deviation of the mean value implies that a variable can be considered important in terms of affecting the model output, i.e., it provides a significant contribution to the change of turbine efficiency; (2) a high value of standard deviation implies that a variable produces non-linear effects and/or has strong interactions with other variables; (3) if a variable is inside the wedge formed by the two lines, it can be considered as less important than the others, thus it can possibly be screened out from the set of the input parameters. The table in Figure 5 shows the results of the analysis. All parameters show mutual interdependency since they have non-zero standard deviations in the Morris plot. The selection criterion of the decision variables is based both on significance from the sensitivity analysis results and on importance from a design viewpoint.
  • ψ , o min , o r , ( o / s ) r , N, ϕ r are indicated as significant parameters. Moreover, they tightly relate to the design features of the stage.
  • The nozzle opening-to-pitch ( o / s ) n is not important according to the results. However, it is affected by a high standard deviation compared to the others, which implies strong interactions with the other parameters in the model. In addition, it cannot be disregarded from the design viewpoint since it relates to the estimation of nozzle pitch and outlet flow angle, and allows determining the number of nozzle blades.
  • The stage inlet velocity C a 1 is screened as an insignificant parameter for the performance of the turbine. However, the value of C a 1 is strictly related to nozzle inlet blade height, which is a relevant aspect in the design and manufacturing of an axial turbine. This aspect becomes particularly critical for small-scale expanders, as highlighted, for example, by Klonowicz et al. [15]. Consequently, this variable was not excluded from the decision variables.
  • Nozzle and rotor axial chords, c n and c r , do not significantly affect the efficiency according to Morris’s method. However, they tightly relate to the estimation of flaring angles. The optimization of the parameters c n and c r in the model would enable one to broaden the space of feasible design solutions. Furthermore, they relate to the actual length of the turbine and can be relevant for applications where compactness is a relevant decision criterion.
  • The stage inlet flow angle α 1 does not provide a significant contribution to the efficiency. From the design point of view, it is a common practice to set it to the value of zero. Thus, it can be conveniently screened out from the decision variables of the model.
  • The rotor inlet to nozzle outlet blade height ratio h * can be screened out in the model. Although related to tip clearance and annulus losses in the Craig and Cox correlations, it shows a limited impact on both preliminary design and efficiency of the turbine due to the short range of variation given by typical design constraints (i.e., 1.0–1.1) [29].

4. Conclusions

In this paper, the axial-flow turbine computational model TURAX was presented, including a thorough validation and a global sensitivity analysis. The validation of the axial turbine model, TURAX, considering two very different test cases confirms that the design performance can be predicted within 1.3%-points, which is in agreement with the commonly accepted prediction accuracy of the empirical loss model used in the code, namely the Craig and Cox correlation. The thermodynamic conditions at the different turbine sections can be accurately predicted by TURAX. The model provided values of velocity and flow angles in good agreement with CFD at the midspan for the case of validation of a subsonic, reaction turbine using air. Maximum discrepancy in the order of 10 % was found for both TURAX and CFD models when comparing the flow results with experimental measurements, and blade heights and geometry were predicted in the same order of accuracy as velocities. In a second test case, TURAX showed a good match in the comparison with the experimental data from an ORC turbine, notwithstanding the complexity of the case addressing real fluid behavior, supersonic flows, shock waves in the blade channels, partial admission, low aspect ratio, converging-diverging nozzle, and rotor impulse blades. The fluid-dynamic features were predicted within 5 % accuracy and the blade heights within 8 % accuracy. In both cases, the discrepancy in the results can largely depend on the uncertainty in the outlet flow angle and loss correlations, and on the uncertainty in the experimental measurements. Hirsch and Denton [40] have shown that, using different correlations applied to through-flow methods, the accuracy in the estimation of turbine efficiency and losses can be ± 2 %-points and ± 20 % , respectively. The global sensitivity analysis using the Morris screening method combined with design considerations resulted in the selection of a minimum of 10 decision variables, which will be used for model optimization purposes as shown in the second part of this paper.

Acknowledgments

The research work was conducted within the frame of the THERMCYC project ("Advanced thermodynamic cycles utilizing low-temperature heat sources"; see http://www.thermcyc.mek.dtu.dk/) funded by InnovationsFonden, The Danish Council for Strategic Research in Sustainable Energy and Environment.

Author Contributions

Andrea Meroni wrote the first draft and contributed to the turbine model improvement, validation and sensitivity analysis. Angelo La Seta contributed to the model development and to a first validation. Jesper Graa Andreasen and Leonardo Pierobon contributed to the model development and improvement. Giacomo Persico provided the CFD results and contributed to the analysis and discussion of the model validation. Fredrik Haglind contributed to the discussion and provided guidance throughout the work. All authors contributed to the first and second revisions, read and approved the final manuscript.

Conflicts of Interest

The authors declare no conflict of interest.

Nomenclature

A
Cross-sectional area (m2)
C
Absolute velocity (m · s−1)
D m
Mean diameter of the stage (m)
E r r
Error (-)
M
Mach number (-)
N
Rotational speed (rpm)
R *
Rotor to nozzle mean radius ratio (-)
R e
Reynolds number (-)
T
Temperature (K)
U
Peripheral velocity (m · s−1)
U tip
Tip Speed (m · s−1)
W
Relative velocity (m · s−1)
W b
Blade work (J · kg−1)
m ˙
Mass flow rate (kg · s−1)
b
Blade backbone length (m)
c
Axial chord (m)
e
Blade rear surface suction curvature (m)
h
Blade height [m]; specific enthalpy (J · kg−1)
h *
Ratio of Rotor inlet to nozzle outlet blade height (-)
k s
Blade surface roughness (m)
o
Blade opening (m)
p
Pressure (Pa)
r
radius (m)
s s
Nozzle to rotor axial clearance (m)
t
Trailing edge thickness (m)
t cl
Blade tip clearance (m)
z
Number of blades (-)

Abbreviations and acronyms

CFD
Computational Fluid Dynamics
ORC
Organic Rankine Cycle

Greek letters

α
Absolute flow angle (°)
α FL
Flaring angle (°)
β
Relative flow angle (°)
χ
Stage degree of reaction (-)
ϵ
Degree of admission (-); residual error (-)
η
Turbine isentropic efficiency (-)
ϕ
Flow coefficient (-)
ψ
Stage loading coefficient (-)
ρ
Density (kg · m−3)
φ
Generic quantity (-)
ζ
Kinetic energy loss coefficient (-)

Subscripts

0
Total conditions
1
Nozzle inlet
2
Rotor inlet
21
Nozzle outlet
3
Rotor outlet
a
Axial component
m
Referred to the mean diameter
min
Referred to the minimum opening
n
Nozzle
o
Outlet
r
Rotor
s
Isentropic conditions
ts
Total-to-static
tt
Total-to-total
W
Referred to the relative coordinate system

References

  1. Stine, W.B.; Harrigan, R.W. Solar Energy Fundamentals and Design; John Wiley and Sons, Inc.: New York, NY, USA, 1985. [Google Scholar]
  2. Lecompte, S.; Huisseune, H.; van den Broek, M.; De Schampheleire, S.; De Paepe, M. Part load based thermo-economic optimization of the Organic Rankine Cycle (ORC) applied to a combined heat and power (CHP) system. Appl. Energy 2013, 111, 871–881. [Google Scholar] [CrossRef]
  3. Cayer, E.; Galanis, N.; Nesreddine, H. Parametric study and optimization of a transcritical power cycle using a low temperature source. Appl. Energy 2010, 87, 1349–1357. [Google Scholar] [CrossRef]
  4. Bao, J.; Zhao, L. A review of working fluid and expander selections for organic Rankine cycle. Renew. Sustain. Energy Rev. 2013, 24, 325–342. [Google Scholar] [CrossRef]
  5. Quoilin, S.; Broek, M.V.D.; Declaye, S.; Dewallef, P.; Lemort, V. Techno-economic survey of Organic Rankine Cycle (ORC) systems. Renew. Sustain. Energy Rev. 2013, 22, 168–186. [Google Scholar] [CrossRef]
  6. Fiaschi, D.; Manfrida, G.; Maraschiello, F. Design and performance prediction of radial ORC turboexpanders. Appl. Energy 2015, 138, 517–532. [Google Scholar] [CrossRef]
  7. Persico, G.; Pini, M.; Dossena, V.; Gaetani, P. Aerodynamics of Centrifugal Turbine Cascades. J. Eng. Gas Turbines Power 2015, 137. [Google Scholar] [CrossRef]
  8. Pini, M.; Persico, G.; Casati, E.; Dossena, V. Preliminary Design of a Centrifugal Turbine for Organic Rankine Cycle Applications. J. Eng. Gas Turbines Power 2013, 135. [Google Scholar] [CrossRef]
  9. Casati, E.; Vitale, S.; Pini, M.; Persico, G.; Colonna, P. Centrifugal Turbines for Mini-ORC Power Systems. J. Eng. Gas Turbines Power 2014, 136, 1–11. [Google Scholar] [CrossRef]
  10. Colonna, P.; Casati, E.; Trapp, C.; Mathijssen, T.; Larjola, J.; Turunen-Saaresti, T.; Uusitalo, A. Organic Rankine Cycle Power Systems: From the Concept to Current Technology, Applications, and an Outlook to the Future. J. Eng. Gas Turbines Power 2015, 137, 1–19. [Google Scholar] [CrossRef]
  11. Aungier, R.H. Turbine Aerodynamics; American Society of Mechanical Engineers Press: New York, NY, USA, 2006. [Google Scholar]
  12. Turboden. Turboden: Clean Energy Ahead. 2016. Available online: http://www.turboden.eu (accessed on 1 January 2016).
  13. Ormat Technologies. Green Energy You Can Rely On. 2016. Available online: http://www.ormat.com (accessed on 1 January 2016).
  14. Uusitalo, A. Working Fluid Selection and Design of Small-scale Waste Heat Recovery Systems Based on Organic Rankine Cycles. Ph.D. Thesis, Lappeenranta University of Technology, Lappeenranta, Finland, 2014. [Google Scholar]
  15. Klonowicz, P.; Heberle, F.; Preißinger, M.; Brüggemann, D. Significance of loss correlations in performance prediction of small scale, highly loaded turbine stages working in Organic Rankine Cycles. Energy 2014, 72, 322–330. [Google Scholar] [CrossRef]
  16. Lozza, G.; Macchi, E.; Perdichizzi, A. On the influence of the number of stages on the efficiency of axial-flow turbines. In Proceedings of the 27th American Society of Mechanical Engineers, International Gas Turbine Conference and Exhibit, American Society of Mechanical Engineers, London, UK, 18–22 April 1982.
  17. Da Lio, L.; Manente, G.; Lazzaretto, A. New efficiency charts for the optimum design of axial flow turbines for organic Rankine cycles. Energy 2014, 77, 447–459. [Google Scholar] [CrossRef]
  18. Ventura, C.A.D.M.; Rowlands, A.S. Design and performance estimation of radial inflow turbines coupled with a thermodynamic cycle analysis procedure. In Proceedings of the ASME ORC 2013: 2nd International Seminar on ORC Power Systems, Rotterdam, The Netherlands, 7–8 October 2013; pp. 1–5.
  19. Uusitalo, A.; Turunen-Saaresti, T.; Gronman, A.; Honkatukia, J.; Backman, J. Combined Thermodynamic and Turbine Design Analysis of Small Capacity Waste Heat Recovery ORC. In Proceedings of the ASME ORC 2015: 3nd International Seminar on ORC Power Systems, Brussels, Belgium, 12–14 October 2015; pp. 1–10.
  20. Gabrielli, P. Design and Optimization of Turbo-Expanders for Organic Rankine Cycles. Master’s Thesis, Technical University of Denmark, Copenhagen, Denmark, 2014. [Google Scholar]
  21. La Seta, A.; Andreasen, J.G.; Pierobon, L.; Persico, G.; Haglind, F. Design of Organic Rankine Cycle Power Systems Accounting for Expander Performance. In Proceedings of the 3rd International Seminar on ORC Power Systems, Brussels, Belgium, 12–14 October 2015; pp. 1–12.
  22. Mathworks. MATLAB 2015b Documentation. Available online: http://www.mathworks.com (accessed on 1 January 2016).
  23. Lemmon, E.W.; Huber, M.L.; McLinden, M.O. NIST reference fluid thermodynamic and transport properties–REFPROP; U.S. Department of Commerce: Gaithersburg, MD, USA, 2002.
  24. Bell, I.H.; Wronski, J.; Quoilin, S.; Lemort, V. Pure and pseudo-pure fluid thermophysical property evaluation and the open-source thermophysical property library CoolProp. Ind. Eng. Chem. Res. 2014, 53, 2498–2508. [Google Scholar] [PubMed]
  25. Ainley, D.G.; Mathieson, G.C.R. A Method of Performance Estimation for Axial-Flow Turbines; Technical Report; Aeronautical Research Council Great Britain: London, UK, 1951. [Google Scholar]
  26. Vavra, M. Axial Flow Turbines. Flow in Turbines. (VKI Lecture Series 15); Von Karman Institute For Fluid Dynamics: Rhode-Saint-Genése, Belgium, 1969; pp. 1–117. [Google Scholar]
  27. Deich, M. Atlas of Axial Turbine Blade Cascades; Deich, M.E., Filippov, G.A., Lazarev, L.Ya., Eds.; Maschinostroenie Publishing House: Moscow, Russia, 1965; pp. 4563–4564. [Google Scholar]
  28. Macchi, E. Design Criteria for Turbines Operating with Fluids having a Low Speed of Sound. Closed Cycle Gas Turbines. (VKI Lecture Series 100); Von Karman Institute For Fluid Dynamics: Rhode-Saint-Genése, Belgium, 1977; Volume 2, pp. 1–34. [Google Scholar]
  29. Craig, H.; Cox, H. Performance estimation of axial flow turbines. Proc. Inst. Mech. Eng. 1970, 185, 407–424. [Google Scholar] [CrossRef]
  30. Macchi, E.; Perdichizzi, A. Efficiency Prediction for Axial-Flow Turbines Operating with Nonconventional Fluids. J. Eng. Power 1981, 103, 718–724. [Google Scholar] [CrossRef]
  31. Lozza, G. A comparison between the Craig-Cox and the Kacker-Okapuu methods of turbine performance prediction. Meccanica 1982, 17, 211–221. [Google Scholar] [CrossRef]
  32. Kacker, S.C.; Okapuu, U. A Mean Line Prediction Method for Axial Flow Turbine Efficiency. J. Eng. Power 1982, 104, 111–119. [Google Scholar] [CrossRef]
  33. Balje, O.E.; Binsley, R.L. Axial Turbine Performance Evaluation. Part A Loss-Geometry Relationships. J. Eng. Gas Turbines Power 1968, 90, 341–348. [Google Scholar]
  34. Traupel, W. Thermische Turbomaschinen: Thermodynamisch-Strömungstechnische Berechnung; Springer: Berlin, Germany, 1966; Volume 1. [Google Scholar]
  35. Macchi, E.; Lozza, G. Comparison of Partial vs. Full Admission for Small Turbines at Low Specific Speeds. In Proceedings of the ASME 1985 International Gas Turbine Conference and Exhibit, Houston, Texas, 18–21 March 1985.
  36. Saravanamuttoo, H.I.H.; Rogers, G.F.C.; Cohen, H. Gas Turbine Theory; Pearson Education Limited: Essex, UK, 2001. [Google Scholar]
  37. Dixon, S.L.; Hall, C.A. Fluid Mechanics and Thermodynamics of Turbomachinery; Butterworth-Heinemann: Waltham, MA, USA, 2010; pp. 105–107. [Google Scholar]
  38. Vavra, M.H. Aero-thermodynamics and Flows in Turbomachines; John Wiley & Sons: New York, NY, USA, 1960. [Google Scholar]
  39. Groschup, D.I.G. Strömungstechnische Untersuchung einer Axialturbinenstufe im Vergleich zum Verhalten der erben Gitter ihrer Beschaufelung. Ph.D. Thesis, Technische Universität Hannover, Hannover, Germany, 1977. [Google Scholar]
  40. Hirsch, C.; Denton, J. Through Flow Calculations in Axial Turbomachines. AGARD Advisory Report N.175; Technical Report; AGARD, Propulsion and Energetics Panel, Working Group 12: Neuilly Sur Seine, France, 1981. [Google Scholar]
  41. Kötzing, P.; Evers, B. Test Case e/tu-4, 4-stage Low Speed Turbine. AGARD Report No.275 AR-275; Technical Report; AGARD: Neuilly Sur Seine, France, 1990. [Google Scholar]
  42. Menter, F.R. Zonal Two Equation k – ω Turbulence Models for Aerodynamic Flows. In Proceedings of the 23rd Fluid Dynamics, Plasmadynamics, and Lasers Conference, Orlando, FL, USA, 6–9 July 1993.
  43. Persico, G.; Mora, A.; Gaetani, P.; Savini, M. Unsteady aerodynamics of a low aspect ratio turbine stage: Modeling issues and flow physics. J. Turbomach. 2012, 134. [Google Scholar] [CrossRef]
  44. Verneau, A. Supersonic turbines for organic fluid Rankine cycles from 3 to 1300 kW; Small High Pressure Ratio Turbines, (VKI Lecture Series 1987-2007); Von Karman Institute For Fluid Dynamics: Rhode-Saint-Genése, Belgium, 1987. [Google Scholar]
  45. Morris, M.D. Factorial Sampling Plans for Preliminary Computational Experiments. Technometrics 1991, 133, 295–302. [Google Scholar] [CrossRef]
  46. Saltelli, A.; Tarantola, S.; Campolongo, F.; Ratto, M. Sensitivity Analysis in Practice: A Guide to Assessing Scientific Models; John Wiley & Sons: Chichester, West Sussex, UK, 2004. [Google Scholar]
  47. Sin, G.; Gernaey, K.V.; Lantz, A.E. Good Modeling Practice for PAT Applications: Propagation of Input Uncertainty and Sensitivity Analysis. Biotechnol. Prog. 2009, 25, 1043–1053. [Google Scholar] [CrossRef] [PubMed]
  48. Calvi, S. Analisi e validazione di solutori CFD ad alta e bassa fedeltá per turbomacchine. Master’s Thesis, Politecnico di Milano, Milan, Italy, 2015. [Google Scholar]
Figure 1. Axial turbine model flowchart, decision variables and nomenclature in the blade-to-blade plane.
Energies 09 00313 g001
Figure 2. Computational fluid dynamics (CFD) results of the Hannover turbine using ANSYS CFX®: (a) details of the rotor grid at the midspan; (b) entropy field in streamwise direction at (i) the rotor inlet, (ii) the rotor outlet, and (iii) the measurement station; (c) contours of static pressure in the meridional plane; (d) contours of tangential velocity in the meridional plane. Adapted from Calvi [48].
Energies 09 00313 g002
Figure 3. Profiles of (a) static temperature, (b) pressure, (c) axial velocity, (d) absolute and relative velocity and (e) flow angles at nozzle inlet, nozzle outlet and rotor outlet. Experimental, CFD and TURAX data of the Hannover turbine test case are shown in the charts.
Energies 09 00313 g003
Figure 4. Comparison of results between TURAX and Verneau data [44]. pp = percentage-points. The breakdown of losses is shown in the chart.
Energies 09 00313 g004
Figure 5. Sensitivity analysis and significance of decision variables of the axial turbine model. Morris screening method [45] applied to the Hannover turbine test case.
Energies 09 00313 g005
Table 1. Decision variables (1–12) and input variables of TURAX for the Hannover [39,40] and Verneau [44] turbine test cases.
Hannover TurbineVerneau Turbine
ParameterSymbolUnitsNozzleRotorNozzleRotor
(1) Inlet flow angle α 1 °100 ( * * )
(2) Stage loading coefficient ψ -2.1 ( * ) 4.4 ( * )
Nozzle (3) and rotor (4) throat opening o n , min , o r mm15141.761.75
Nozzle (5) and rotor (6) axial chord c n , c r mm48.237.112.5 ( * * ) 12.5
Nozzle (7) and rotor (8) opening to pitch ratio ( o / s ) n , ( o / s ) r -0.378 ( * ) 0.358 ( * ) 0.277 ( * ) 0.425 ( * )
(9) Rotational speedNrpm720018,000
(10) Inlet axial velocity C a1 m/s55.9 ( * ) 10.1 ( * )
(11) Rotor flow coefficient ϕ r -0.39 ( * ) 0.52 ( * )
(12) Rotor inlet to nozzle outlet blade height h * -11.039
Degree of admissionε-10.4
Mass flow rate m ˙ kg/s6.7860.18
Total inlet temperature T 01 K358.69 ( * ) 403
Total inlet pressure p 01 Pa 1 . 2486 × 10 5 ( * ) 6 . 8 × 10 5
Total outlet pressure p 03 Pa 0 . 998 × 10 5 ( * ) 1 . 21 × 10 5 ( * )
Rotor to nozzle mean radius ratio R * -1.0190.99
nozzle-rotor axial clearancessmm34.366.3 ( * * )
Radius of blade rear suction side curvature e n , e r mm109.00166.57 10 8 ( * * ) 10 8 ( * * )
Trailing edge thickness to blade opening ratio ( t / o ) n , ( t / o ) r -0.02530.03570.070.172
Blade surface roughness k s mm 2 × 10 - 3 ( * * ) 2 × 10 - 3 ( * * )
Rotor tip clearance t cl mm0.24-
Inlet width arc-mm29.6034.95-
Backbone length b n , b r mm62.1057.63-
Trailing edge thickness t n , t r mm0.380.500.30.3 ( * * )
( * ) = estimated value ( * * ) = assumed value.
Table 2. Comparison of results obtained with TURAX, CFD, and experimental investigations on the Hannover turbine. pp = percentage-points.
ParameterSymbolUnitsExp. Data [39,40,41]TURAXCFD [48]Error TURAXError CFD
Nozzle outlet absolute flow angle α 2 °69.8468.5568.451.29 °1.39 °
Nozzle outlet relative flow angle β 2 °7.134.604.822.53 °2.31 °
Nozzle outlet absolute velocity C 2 -170.8150.8153.8411.8%9.95%
Absolute Mach at nozzle outlet M 2 -0.4570.4060.41211.2%9.9%
Static pressure at nozzle outlet p 2 bar 1 . 111 1 . 105 1 . 108 0.31%0.28%
Static temperature at nozzle inlet T 1 K357.4357.4357.40.0%0.0%
Static temperature at nozzle outlet T 2 K347.17347.75347.060.17%0.03%
Rotor outlet relative flow angle β 3 °68.7569.3167.070.56 °1.68 °
Rotor outlet absolute flow angle α 3 °2.455.917.583.46 °5.13 °
Rotor outlet relative velocity W 3 m/s166.3153.9157.517.43%5.30%
Static pressure at rotor outlet p 3 bar 0 . 994 0 . 998 0 . 983 0.33%1.15%
Static temperature at rotor outlet T 3 K337.86337.96336.600.03%0.37%
Nozzle mean radius r 2 m mm181.5180.1181.50.77%0%
Rotor mean radius r 3 m mm185183.51850.81%0%
Nozzle inlet blade height h 1 mm89.289.289.20%0%
Nozzle outlet (rotor inlet) blade height h 2 mm97100.2973.3%0%
Rotor outlet blade height h 3 mm103108.11034.95%0%
Nozzle flare angle α FL , n °5.6212.835.627.21 °0 °
Rotor flare angle α FL , r °7.8912.047.894.15 °0 °
Number of nozzle blades z n -29282910
Number of rotor blades z r -30303000
Nozzle kinetic energy loss coefficient ζ n -3.79%6.48%5.82%2.69 pp2.03 pp
Rotor kinetic energy loss coefficient ζ r -9.08%6.76%6.66%2.32 pp2.42 pp
Total-to-total stage efficiency η tt -91.62%92.84%93.32%1.22 pp1.70 pp

