1. Introduction
Photovoltaic (PV) technologies are an expanding market segment in modern power markets. The utilization of PVs in distributed generation offers a set of changes and challenges that have been analyzed extensively by numerous studies [
1]. PV installations have increased considerably in recent years in many countries. One of the key factors that have served as the basis for the continuous increase of installations was the introduction of the Feed-in-Tariffs (FiTs), a favorable policy mechanism in many EU countries. In a global context, PV installations have increased from almost 1 GWp in 1998 to more than 177 GWp by the end of 2014, with 38.7 GWp of PV implementations taking place only in 2014 [
2]; among them, the installations in Europe account for 87 GWp, approximately [
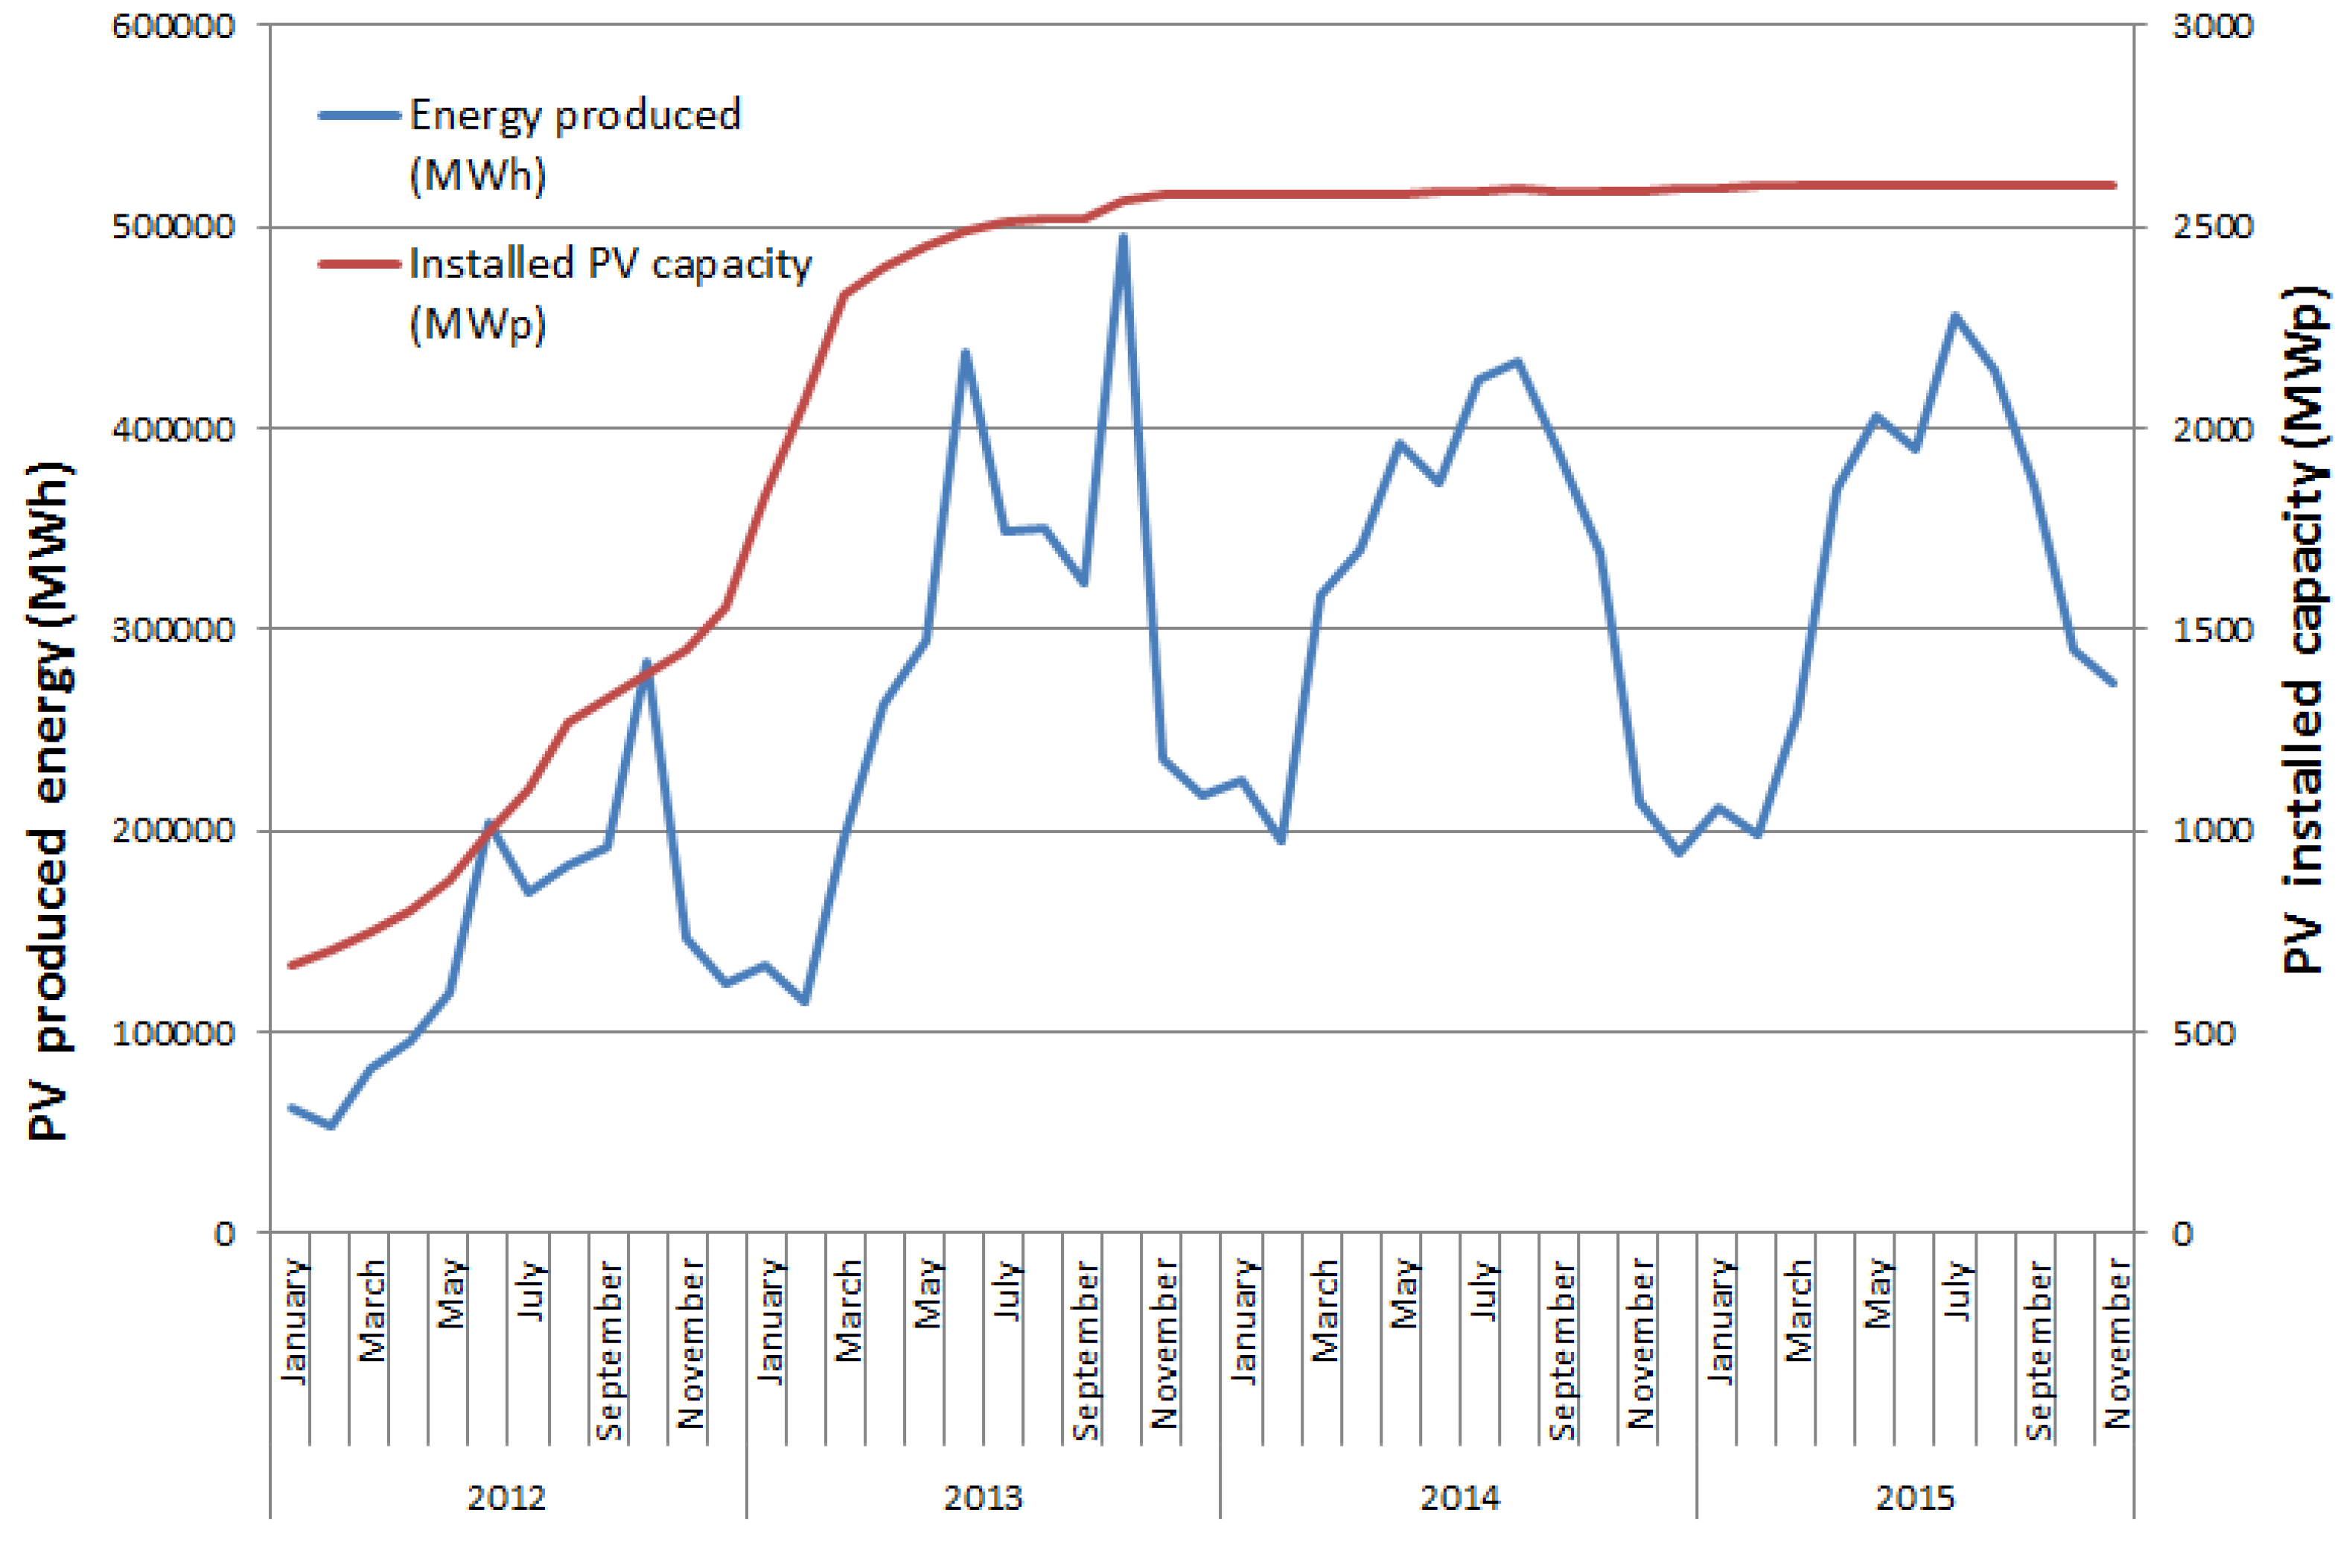
3]. By the end of 2014, Germany had already installed 38.3 GWp of PV power. On the contrary, in the high solar potential Mediterranean region countries, Italy had installed 18.45 GWp followed by France with 5.6 GWp, Spain with 4.7 GWp and Greece with 2.6 GWp. In all these countries the FiT policy mechanism was employed. In other Mediterranean countries where the FiT policy was employed later or not employed at all, PV growth was limited. By the end of 2014, the installed PV capacity in Portugal was 419 MWp, in Slovenia 256 MWp and in Cyprus 64.8 MWp [
3]. However, the FiT policy was not designed to last forever. Thus, all fixed tariffs started to decline or even were abolished in certain countries. This led to a decrease in PV installation across Europe. In fact, the newly installed capacity in Europe declined from 16.70 GWp in 2012 to 10.1 GWp in 2013 and just 6.88 GWp in 2014 [
4]. This led to a European Union market share drop from 73.6% in 2012 to 26.5% in 2013 and just 17.7% in 2014.
Recently, Net-Metering (NEM) has attracted the interest from energy stakeholders, such as the regulatory authorities, utilities, and decision makers. NEM offers an alternative option for positive investment opportunities from small scale PV generation, especially in the residential sector [
5,
6]. Under NEM, the prosumer (a customer who at the same time produces and consumes energy) offsets the energy consumed within its premises with energy produced from a local (rooftop) PV system. It should be noted that NEM allows the energy consumption and production to happen at different times. This fact distinguishes NEM policies from others such as self-consumption or tax reductions for self-consumed electricity. The charge is based on the “net amount” between the consumed and produced energy in different netting periods depending on the contract. In the case of negative netting,
i.e., the production is lower than the consumption, the prosumer can be charged either only for the “net” energy consumed or including additional charges as a compensation for using the transmission and distribution grid and other grid services. If the produced energy is higher (the case of a positive net amount), a NEM policy may foresee the compensation of the excess energy at various prices, or not.
Regarding the EU countries, the introduction of NEM policies are relatively limited, but due to the interest of many parties, it is expected to play an active role in the coming years [
7]. The currently limited implementation of NEM policies is due to barriers such as the installation capacity limits, settlement period (
i.e., the netting balance calculation period), compensation or not of the excess electricity (
i.e., in cases of positive netting), the price of the compensated energy and others. These factors lead to the adaptation of country specific NEM policies, implying a lack of a general EU policy that will harmonize the respective laws in every member country [
8,
9].
NEM variations are plentiful and, therefore, policies in different countries or regions can vary significantly. The basic questions that arise regarding a NEM policy are: (a) whether a full or partial netting approach should be regarded; (b) whether the excess energy should be compensated and at what price; and (c) what happens in cases of extra charges posed by the utilities to account for the grid services. From the prosumer’s perspective, the focus of interest is the optimal PV system size in accordance with the consumption profile, in terms of making a PV investment attractive under a specific NEM policy. Some initial studies in the USA [
10,
11,
12,
13,
14] and just recently in the rest of the world [
15,
16,
17,
18,
19], have discussed some of the above issues and investigated the influence of different techno-economic parameters on the bill savings of net-metered PV customers. However, a generalized methodology capable of being applied to many alternative NEM policies has not been proposed yet, according to the authors’ knowledge.
In this context, the scope of this study is the development and testing of a model and a concise methodology for the evaluation of the attractiveness of various NEM policies to prospective PV prosumers. By using this methodology a wide variety of scenarios can be examined, which may help policy makers in fine-tuning policy alternatives and keep at the same time adequate profitability for the prosumer. The model characteristics follow the guidelines of the research held in the ”Promotion of PV energy through net metering optimization” (PV-NET) project, co-funded by the European Territorial cooperation 2007–2013 programme MED and by national funds, which resulted in the development of a sophisticated optimization tool [
20]. Overall, the objective is to pave the way for more efficient Renewable Energy Resources (RES) exploitation in the Mediterranean through a more cost-effective RES incorporation into the energy mix. Thus, the objectives of the PV-NET project are highly relevant to EU policies and targets. The results of the PV-NET can form a basis for a cost-effective and energy efficient implementation of RES in the Mediterranean and the EU as a whole.
The proposed methodology is tested in a case study based on the experience gained from the newly established NEM policy in Greece. Since there is a lack of research in investigating NEM alternatives, this paper examines a series of NEM options for the Greek system. A scenario-based approach that simulates a series of different options is used to test the methodology. These scenarios consider both full and partial netting mechanisms and involve hourly netting options. Moreover, the proposed model allows examining different PV installation characteristics, consumption patterns, and financial parameters. The outputs of the model are the billing savings of the prosumer expressed in yearly cash-flows and relevant investment appraisal indicators. This makes the model a prosumer oriented tool that estimates the economic benefits given a NEM mechanism.
The rest of the paper is structured as follows: in
Section 2 the current situation of the PV market in Greece is outlined along with a description of the recently adopted NEM policy.
Section 3 presents the proposed methodology for assessing NEM policies, which consists of three stages. In
Section 4 the case study used for the testing of the methodology is defined, along with the examined policy scenarios.
Section 5 presents the results from the implementation of the methodology on the case study and finally conclusions and useful recommendations are included in
Section 6.
3. Proposed Methodology
This section outlines the methodology used in this work, which is divided into three parts. It was devised with the intention to make it as general as possible so that it may also cover other NEM policies that this paper does not deal with. The goal of the methodology is to determine the annual profits for a prosumer under a certain NEM policy. Afterwards, a standard financial analysis is performed to evaluate the attractiveness of a NEM policy from a prosumer’s point of view. This methodology was also used to develop the optimization tool described in [
20].
3.1. First Stage: Pre-Processing and Modeling
The methodology begins with the pre-processing stage, where the required input data concerning both the prosumer’s load and the PV generation are determined. A generalized methodology may skip this part and proceed to directly input measured or predicted data into the next stage, however, a pre-processing stage makes it easier to perform mass calculations and keeps calculation time limited.
3.1.1. Electrical Load Modeling
Generally, electrical load data can be obtained through actual measurements at various time steps. Alternatively, when measurements are not available, averaged load profiles may be used that correspond better to the prosumer’s profile. For reasons related mainly to the availability of climatic data in various databases, the methodology uses monthly load profiles.
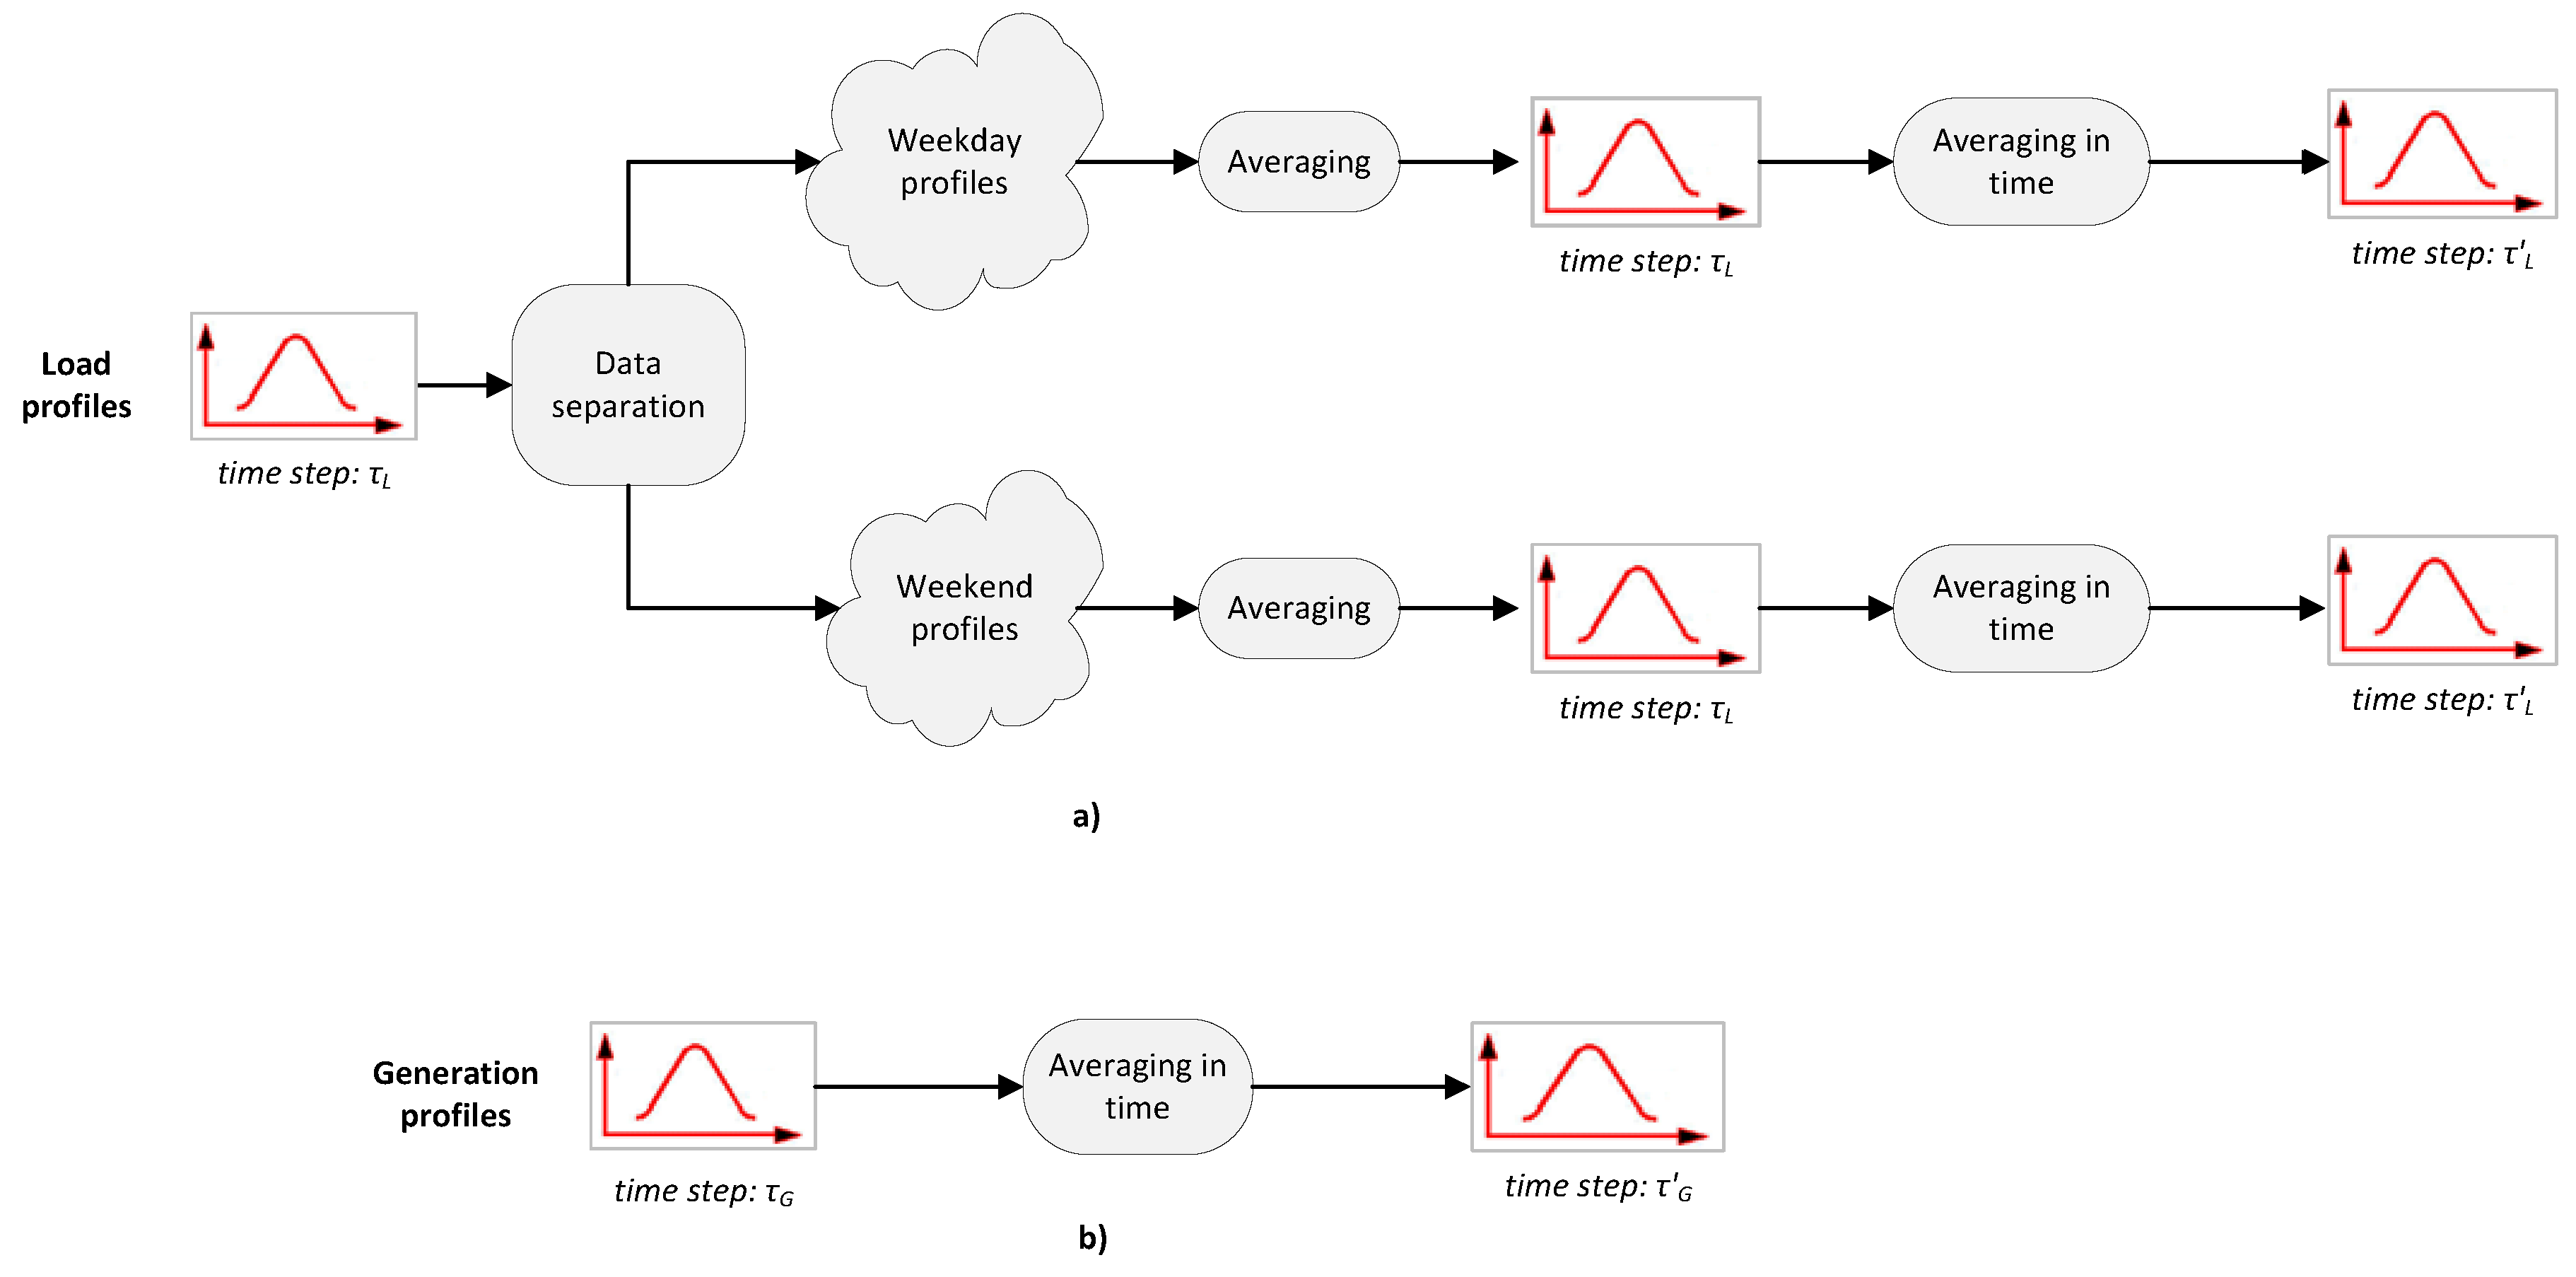
The load profiles are calculated from measured data covering a 12-month period following the pre-processing procedure of
Figure 2a.
First, the available data are separated into two distinct groups related to the customer demand during weekends/holidays and weekdays. Next, the consumption profile of the customer at a given month is evaluated by averaging the load data as separated in the previous stage. In total, twenty-four annual load curve patterns are constructed, two for each month of a year. Moreover, the gathered input data may be at different time step (τL) than the one used for the load profiles. The required load curves are adapted to the model’s time step by averaging in time the data based on the model’s time interval (τ’L).
3.1.2. PV Generation Modeling
Considering the PV generation, a similar procedure can be followed as shown in
Figure 2b, if real data recorded from PV installations are used. Alternatively, PV generation data can be obtained from other sources, such as the Photovoltaic Geographical Information System (PVGIS) online platform of the EU Joint Research Centre. The PVGIS on-line tool provides the solar resource for the countries of Europe and Africa, along with relevant climatic data for a typical day of each month in 15-min. time steps [
26]. The hourly PV energy production is calculated using Equation (1). There, the available solar irradiance on a fixed plane is denoted as,
Hh (W/m
2), the installed capacity as
P (kWp) and the performance ratio as
PR:
The performance ratio,
PR, can be evaluated by employing Equation (2), where,
n1,
n2, and
n3 are the performance ratio of inverters, cables and electrical panel respectively, σ
P is an optional coefficient related to air pollution and σ
T is the air temperature coefficient.
The air temperature coefficient, σ
T, is calculated using the empirical relationship of Equation (3).
The data provided by the PVGIS service have a resolution of 15-min (τ
G = 15-min). Therefore, an averaging in time procedure must be utilized if the chosen interval τ’
G for the load profiles is different. For example, if an hourly interval is utilized, the hourly PV generation data are calculated by applying the averaging in time procedure, as shown in
Figure 2b.
3.2. Second Stage: Determination of Profits for a Prosumer under a NEM Policy
The outputs of the pre-processing stage, i.e., the load and PV generation profiles related to the prosumer are used for the evaluation of the annual profits under a NEM policy. However, since various NEM policies exist, a generalized formulation is needed in order to model and assess possible policy variations.
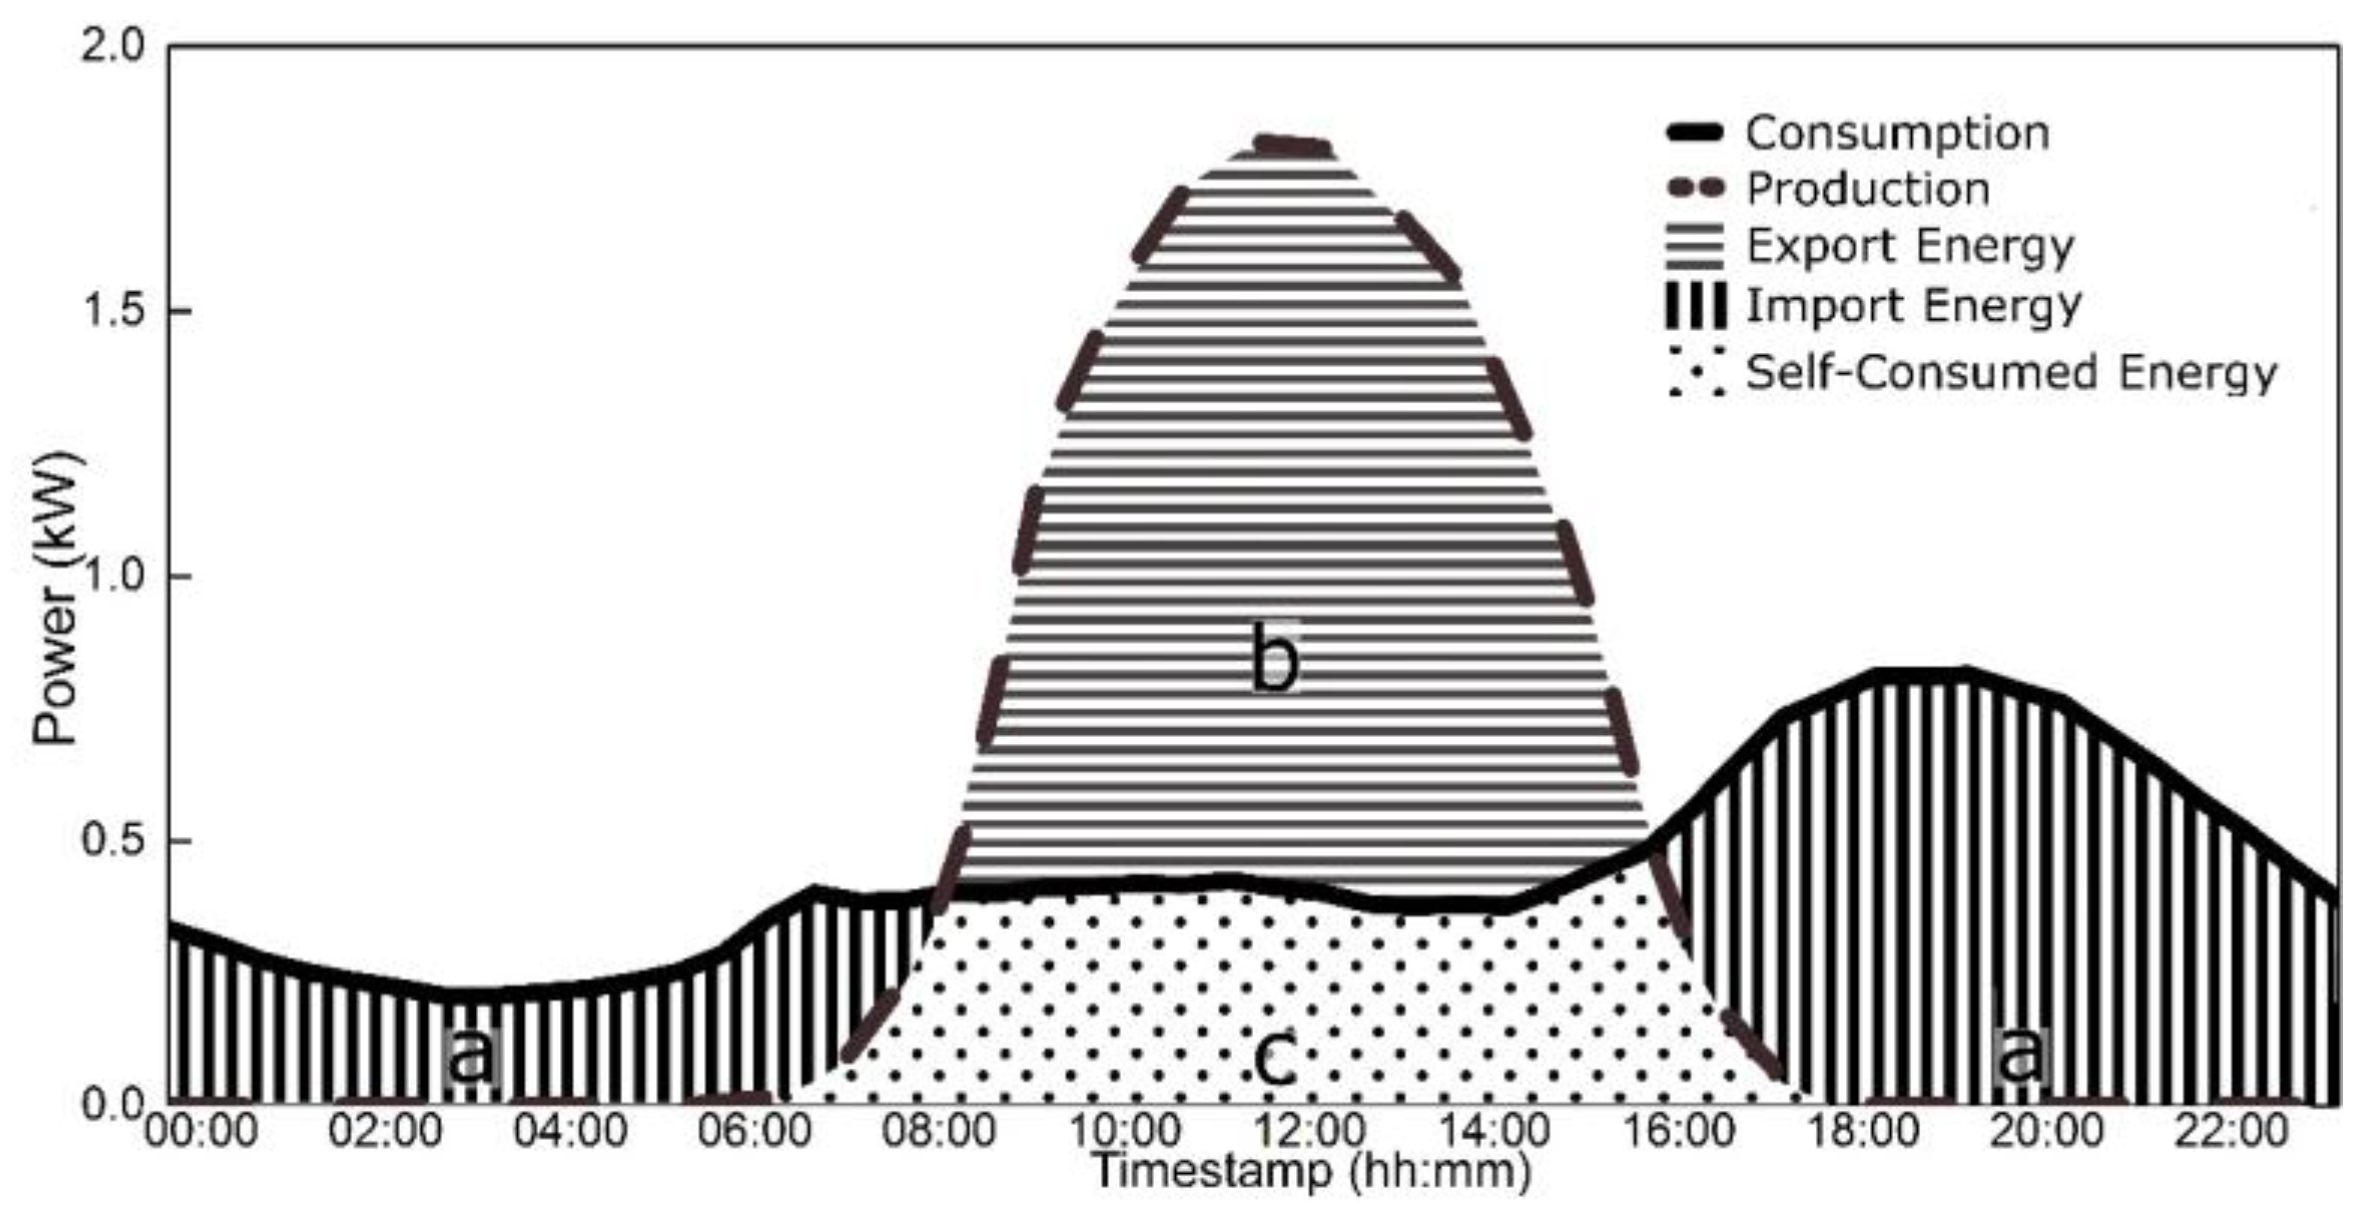
3.2.1. Energy Consumption and Production
A NEM policy may use various elements related to the consumption and production of electrical energy within a time step. In order though to utilize some of the following elements in a real installation, a configuration using two meters is required. In case a new perspective installation is evaluated, the estimation of the self-consumption and the utilization rates may be necessary. These are defined with the aid of
Figure 3 as follows:
the self-consumption rate (SCr) is the ratio between the PV energy directly consumed on-site over the total PV energy production, that is: SCr = (c/c + b) × 100.
the utilization rate (Ur) is a measure of the percentage of PV energy used on-site compared with the total energy demand. This means: Ur = (c/a + c) × 100.
In this context, the following elements are determined for every time step:
Energy generation EGτ (kWh): the produced PV energy from the installed PV system within the time step τ used. It can be measured using a dedicated meter, or obtained from the pre-processing stage.
Energy demand EDτ (kWh): the electrical energy absorbed from the grid during time step τ.
Energy feed EFτ (kWh): the electrical energy injected to the grid during time step τ. The last two elements can be measured using one bi-directional meter, or obtained from the pre-processing stage and an estimation for the SCr.
Netted energy ENτ (kWh): the net electrical energy consumed during time step τ, calculated by subtracting the injected energy from the absorbed energy i.e., (EDτ − EFτ).
Energy consumption ECτ (kWh): the real electrical energy consumed within the prosumer’s premises during τ. This can be obtained from the pre-processing stage or calculated with the formula (EDτ + EGτ) − EFτ.
3.2.2. Electricity Cost and Revenue
An important parameter regarding a NEM policy is the cost that a customer has to pay for consuming electrical energy from the grid,
i.e., the electricity retail tariff. Although each region/country may have different electricity cost categories and pricing, a breakdown of the retail electricity prices into four cost categories is generally common, enabling cross-country comparisons. These cost categories are the production cost, network cost, standing fees, taxes and VAT. However, from a NEM policy perspective, the important issue is how a prosumer is charged at each billing period. In that sense, a more appropriate breakdown of the electricity cost for a NEM prosumer is the following:
Netted cost CN (€/kWh): the charge for the prosumer is calculated using the net energy consumed in a billing period.
Non-netted cost CNN (€/kWh): the charge is calculated using the total energy consumed by the prosumer, i.e., the sum of the imported energy from the grid and the self-consumed PV energy.
Grid demand cost CD (€/kWh): the charge is calculated using the total energy imported from the grid.
Fixed cost CF (€ or €/kWp or €/kW): this charge may be due to various charge mechanisms that exist, like the standing fees, the power component of transmission and distribution charges, the possible special charge for a NEM prosumer based on the installed power, etc.
Concerning taxes, grid charges or other duties imposed, they can be included in the above categories as well. For example, a full netting policy implies that all taxes and duties are included in the “Netted cost”, which means that they are calculated based on the net consumed energy within a netting period. On the other hand, a partial netting policy may imply that part or all of taxes and duties are included in the “Non-netted cost” category, whereas the grid charges may be included in the “Grid demand cost”. The latter is influenced by the level of self-consumption, since the higher this rate is, the lower the energy imported from the grid and hence the charge for the prosumer.
In addition, a policy variation may dictate the selling of the excess produced PV energy to the grid at a certain price, similar to the FiT policy. This can be modelled using a revenue element as follows:
Obviously, when dealing with certain retail electricity tariffs and NEM policies, a pre-processing is required in order to be able to determine the above cost and revenue elements.
3.2.3. Calculating Prosumer Profits in a NEM Policy
Generally, a prosumer that is under a NEM policy may profit either directly from selling excess PV produced energy to the grid, or indirectly through the avoided electricity cost that would have been obliged to pay otherwise. Therefore, in order to calculate the total benefits for a prosumer both types of profits must be evaluated. While the direct profit is straightforward to evaluate, the indirect profit may be more complicated since it contains elements that can be specific to a certain NEM policy. Therefore, before going through the calculation procedure, some important definitions related to such policies are provided.
The Billing Period (BP) is defined as the period when all the relevant elements are calculated and the prosumer is charged. In case the netted energy is positive (i.e., excess of PV energy generated during the billing period), this energy can be either transferred to the next billing period as Renewable Energy Credits (RECs) within a netting period or reimbursed using the Feed-in repayment RF. The Netting Period (NP) is a policy setting that determines for how long the RECs are still valid and taken into account for the prosumer charging.
- Step 1
For each billing period the following energy-related elements are calculated
Total PV generated energy, EG,bp (kWh):
Total energy absorbed from the grid, ED,bp (kWh):
Total energy injected to the grid, EF,bp (kWh):
Total netted energy, EN,bp (kWh), adding any RECs from the previous billing period (if applicable):
Total energy consumption, EC,bp (kWh):
- Step 2
For each billing period the relative costs and revenues are calculated
The total cost for the prosumer has a component related to the netted cost (CN), a component related to the non-netted cost (CNN), one related to the grid demand cost (CD) and one to the fixed costs (CF):
The total direct revenues for the prosumer (if applicable) for injecting excess PV energy to the grid:
- Step 3
For each billing period the indirect profit due to avoided electricity cost is calculated
Determine the electricity cost for the prosumer without the PV system based on the existing electricity tariff and the total actual consumption (business as usual scenario). This is denoted as CA,bp and generally can be evaluated as: , where denotes the fixed cost as before but without any possible charges related to the NEM policy.
Evaluate the indirect profit in a billing period by subtracting CNEM,bp from CA,bp:
- Step 4
For each billing period the total profits,
Rbp, for the prosumer are evaluated
- Step 5
Repeat Steps 1 to 4 for all billing periods within a netting period
- Step 6
Repeat Step 5 for all netting periods within a year
3.3. Third Stage: Financial Analysis and Investment Appraisal
The calculated annual profits from the Second Stage are used in the financial analysis, where the annual cash flows are utilized. The main financial parameters required for the investment appraisal are the installation/capital costs (€/kWp), the operation & maintenance (O & M) costs (% of capital cost), the DR (%), the investment lifetime (years) and the inflation (%) of both the electricity prices and the O & M costs. Other financial parameters may be utilized as well, such as the inverter replacement costs at a certain year during the investment’s lifetime, the evolution of the feed-in repayment (RF) for the exported energy to the grid, etc. Also, parameters related to the reduction of PV generation rate at a certain percentage per-year and the change in the consumption profile or the prosumer may be utilized as well.
The annual calculated cash flows are then used to calculate standard investment appraisal indicators, such as the Internal Rate of Return (IRR), the Simple or Discounted Payback Period (SPP, DPP), the Net Present Value (NPV), etc. The determination of such indicators is important when evaluating an existing or proposed NEM policy, since, for instance, a low IRR or NPV value may indicate that the NET policy will not attract investors, while a high IRR or NPV value may imply that the policy favors prosumers at the expense of the rest electricity consumers.
4. Definition of the Case Study and Policy Scenarios
This section presents the case study used to test the methodology detailed in the previous section under different policy scenarios. Utilizing this methodology and focusing on the Greek case, presented in
Section 2, several policy scenarios can be investigated regarding variations of the NEM policy. In fact, while there is no general EU policy for NEM to guide member countries towards specific energy policies, it is crucial to examine a series of different cases to fully assess the benefits of NEM for optimizing the usage of the PV capacity. Different cases are formulated in a series of Scenarios that are considered separately, having a life-cycle of 20 years.
4.1. Policy Scenarios
The policy Scenarios involve a residential prosumer in the Thessaloniki area, Greece and can be distinguished in two general types,
i.e., full netting and partial netting. A further categorization of the Scenarios under study involves the treatment of the excess generated electricity. The aim is to analyze the level of influence of the various techno-economic parameters that determine the operation of a PV installation. The prosumer is charged with the most common residential tariff (“G1” tariff) of the Public Power Corporation S.A. (Athens, Greece) [
27]. An analytical description of the different charges in the “G1” tariff is summarized in
Table 2,
Table 3 and
Table 4.
Generally, there are three charge categories, namely the competitive charges, the regulated charges and various dues and taxes. Specifically about the “Services of General Interest” (SGI) charge, it is used to compensate the higher electricity production cost in the islands (expensive diesel generators) compared to the mainland Greece (majority from cheap lignite power plants) and to cover the provision for the considerably reduced Social Residential Tariff.
The limits that are shown in the first column of
Table 2 and
Table 3 concern the total consumption of the consumer during the entire billing period (4-months). This means that the charges are dependent on the 4-month consumption and the final charge is not scalable. For instance, if the 4-month consumption is higher than 2000 kWh, then all kWh consumed are charged with the same (higher) price of 0.10252 €/kWh. Furthermore, it is assumed that the PV capacity is not limited by space or other barriers.
It is evident by comparing the LCOE calculations in
Table 1 and the “G1” Tariff that PV grid parity has already been reached for certain values of DRs. In several cases “production cost” parity has been reached as well, which is a situation encountered when the LCOE is lower than the competitive charges of a certain electricity tariff.
In contrast to the current NEM policy in Greece, where excess electricity can be transferred to the next billing periods (RECs) within a year, the other scenarios examined here use the historical System Marginal Price (SMP) values or the 2015 FiT value (0.115 €/kWh) to compensate the excess electricity. By compensating the excess electricity with the SMP values a policy close to a market-based electricity pricing is simulated. This is justified as the reimbursement of the PV produced energy in the actual energy market would have been made using the SMP values. At all times, the SMP values used here are lower than the current FiT value.
In the following scenarios, different forms of partial netting are examined, allowing for the selection of the tariff element that will be included in the netted, non-netted and grid demand costs. Thus, a detailed assessment of the influence of the different tariff elements (e.g., standing fees, network usage charges, and others) on the prosumer’s bill is possible. The scenarios assume an hourly netting period, which means that any excess produced electricity per hour is compensated with either the SMP of the FiT. This approach can form the basis of demand side management strategies from the prosumer perspective,
i.e., managing the residence load subject to PV generation margins and market prices conditions. Following, a short description of each Scenario is provided while
Table 5 collects their most important characteristics:
Scenario #1: Full netting policy with no excess generated electricity transfer. The netting is calculated on an hourly basis and the excess electricity is compensated using SMP historical values and more specifically, the SMP values of 2013. The billing period remains at 4 months, which means that the G1 tariff is used for charging the prosumer. The charge is based solely on the net-energy accumulated at each hour inside the billing period.
Scenario #2: Partial netting policy with no excess generated electricity transfer. The netting is calculated on an hourly basis and the excess electricity is compensated using SMP historical values and more specifically, the SMP values of 2013. The tariff applied to the prosumer is similar to Scenario #1, except that the SGI charge is a non-netted cost element.
Scenario #3: Full netting policy with no excess generated electricity transfer. The netting is calculated on an hourly basis and the excess electricity is compensated using the current FiT. The prosumer is charged as in Scenario #1.
Scenario #4: Partial netting policy with no excess generated electricity transfer. The netting is calculated on an hourly basis and the excess electricity is compensated using the current FiT. The prosumer is charged as in Scenario #2.
Scenario #5: This simulates the current NEM policy in Greece, as described in
Section 2. The demand cost includes the Transmission System Operator (TSO) and Distribution System Operator (DSO) energy charges, the “rest” charges, the excise duty and the special duty for RES charge. The SGI charge is again a non-netted cost element.
The scope of the analysis is to assess the attractiveness of a PV system investment under different NEM policies. The flexibility of the methodology (and of the developed optimization tool) allows the consideration of an expanded set of sub-Scenarios utilizing different PV installation capacities, electricity consumption profiles, site characteristics, market price forecasts, economic conditions (i.e., loans) and others.
4.2. Description of Case Study
By inspecting the formulated Scenarios it may be realized that the SMP and the consumption profile are the crucial factors that define the prosumer’s profits. On the one hand, the volatile SMP affects the revenue from selling energy back to the grid in Scenarios #1 and #3, whereas the FiT is constant. On the other hand, the consumption profile determines the level of self-consumption and the hourly netting with certain production profiles, hence affecting all the 5 Scenarios. Consequently, in order for a case study to reach meaningful results, these inputs must be carefully selected. The present study utilizes a simulated consumption profile based on consumption data from a sample of 29 residential consumers located in the Thessaloniki area, Greece. The data refer to the year of 2014. For each consumer, hourly load data is available. We consider the representative prosumer of the sample by averaging the available data of the consumers. Initially,
Figure 4 and
Figure 5 present the consumption profiles for three periods throughout a year, allowing an easier comparison. Specifically,
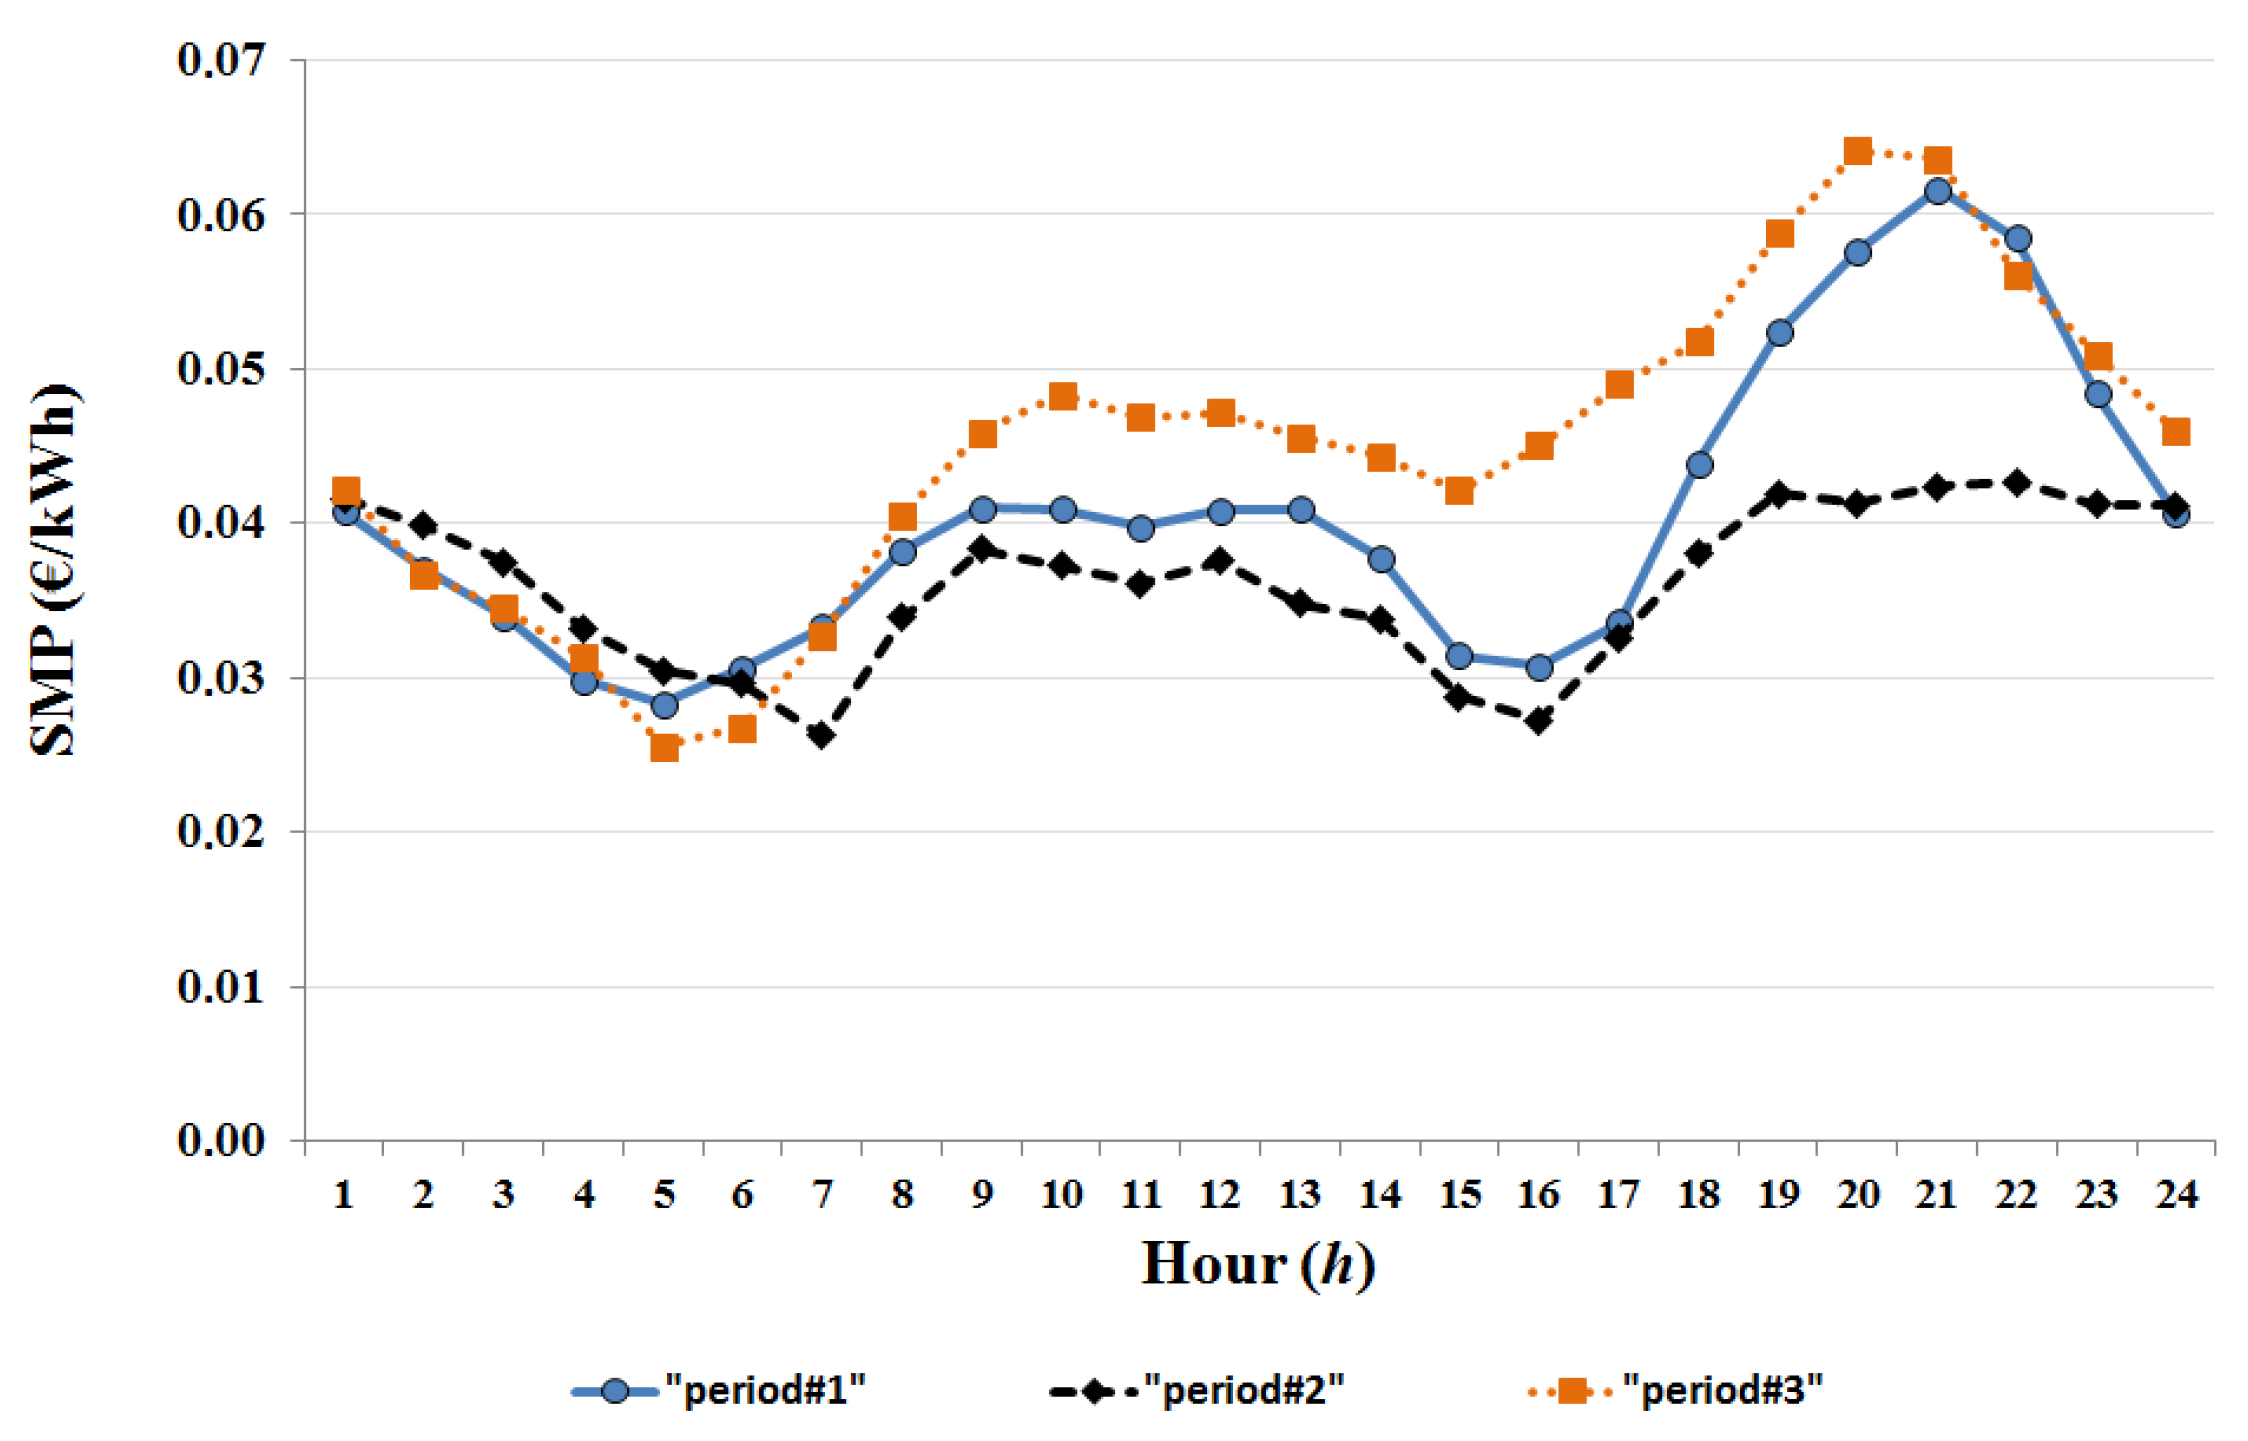
Figure 4 shows the average daily load diagrams over three periods, of which the 1st period corresponds to the months of April, May, October and November (“period#1”), the 2nd period to the months of July, June, August and September (“period#2”) and the 3rd to the months of December, January, February and March (“period#3”). It is evident that the load diagrams do not follow the same pattern. For example, in “period#3” the consumption is much higher, especially in the late evening hours. This is possibly an indication of electrical heating.
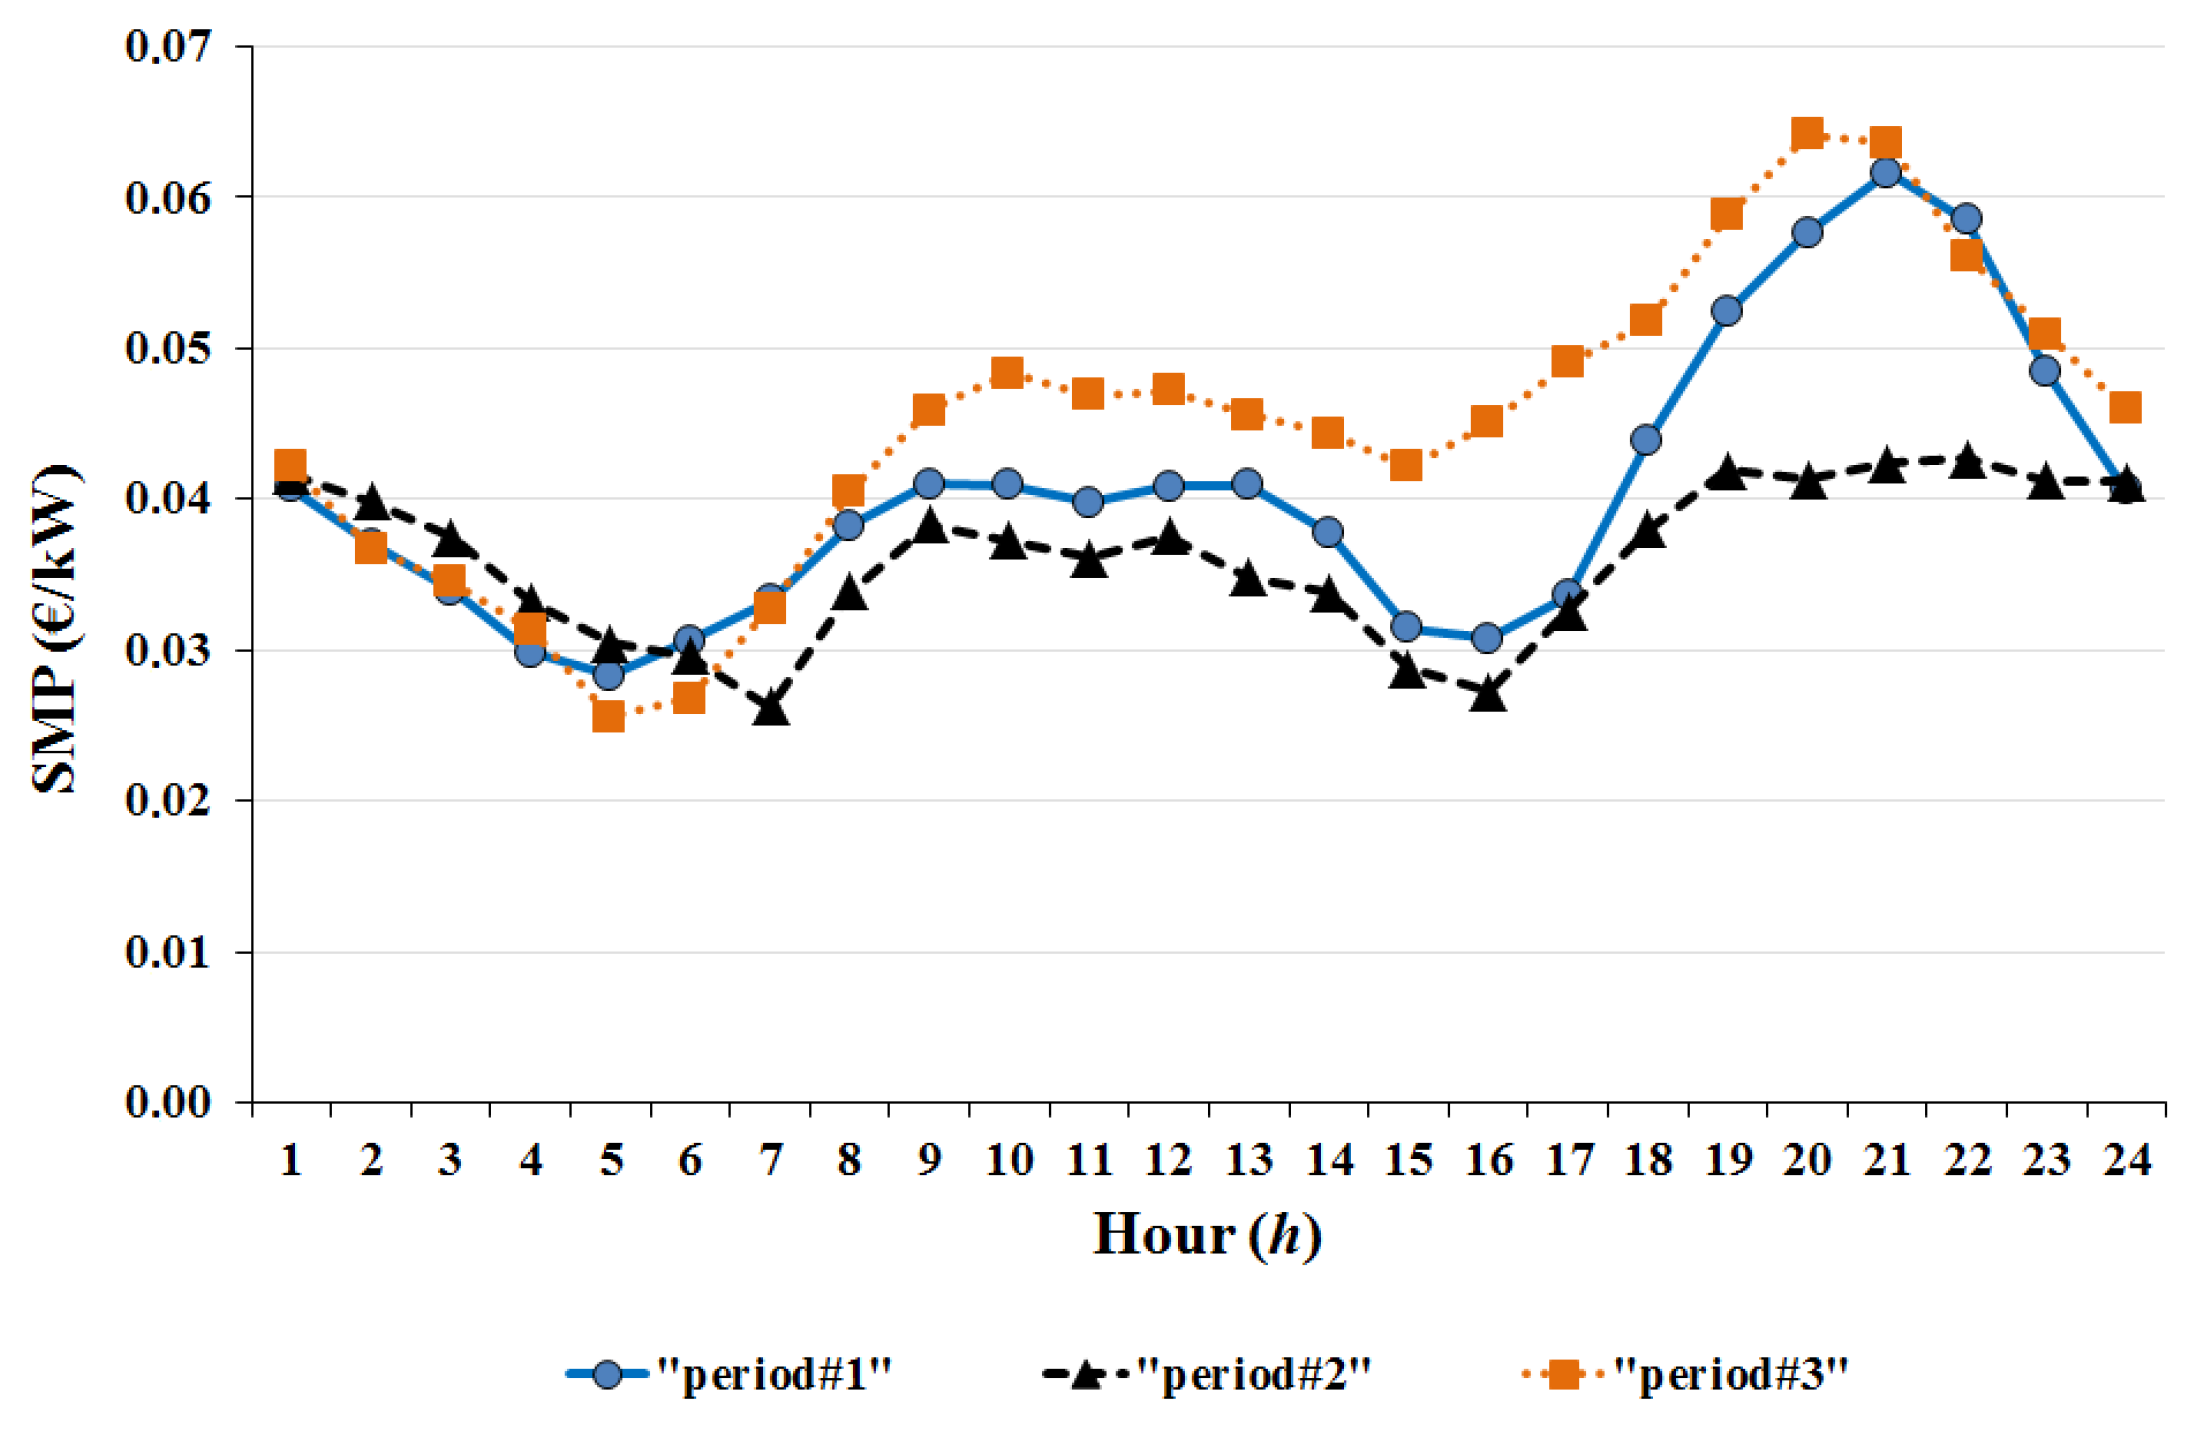
Furthermore, the same periods apply to the SMP values. The Greek wholesale electricity market is structured as a mandatory pool market [
28]. The energy and ancillary services are simultaneously traded in a day-ahead market and are dispatched on the available generation units. The objective of the market is to bring efficiencies to short-term system operations and dispatch. For illustrative comparison reasons, average daily SMP diagrams of 2013 are depicted in
Figure 5.
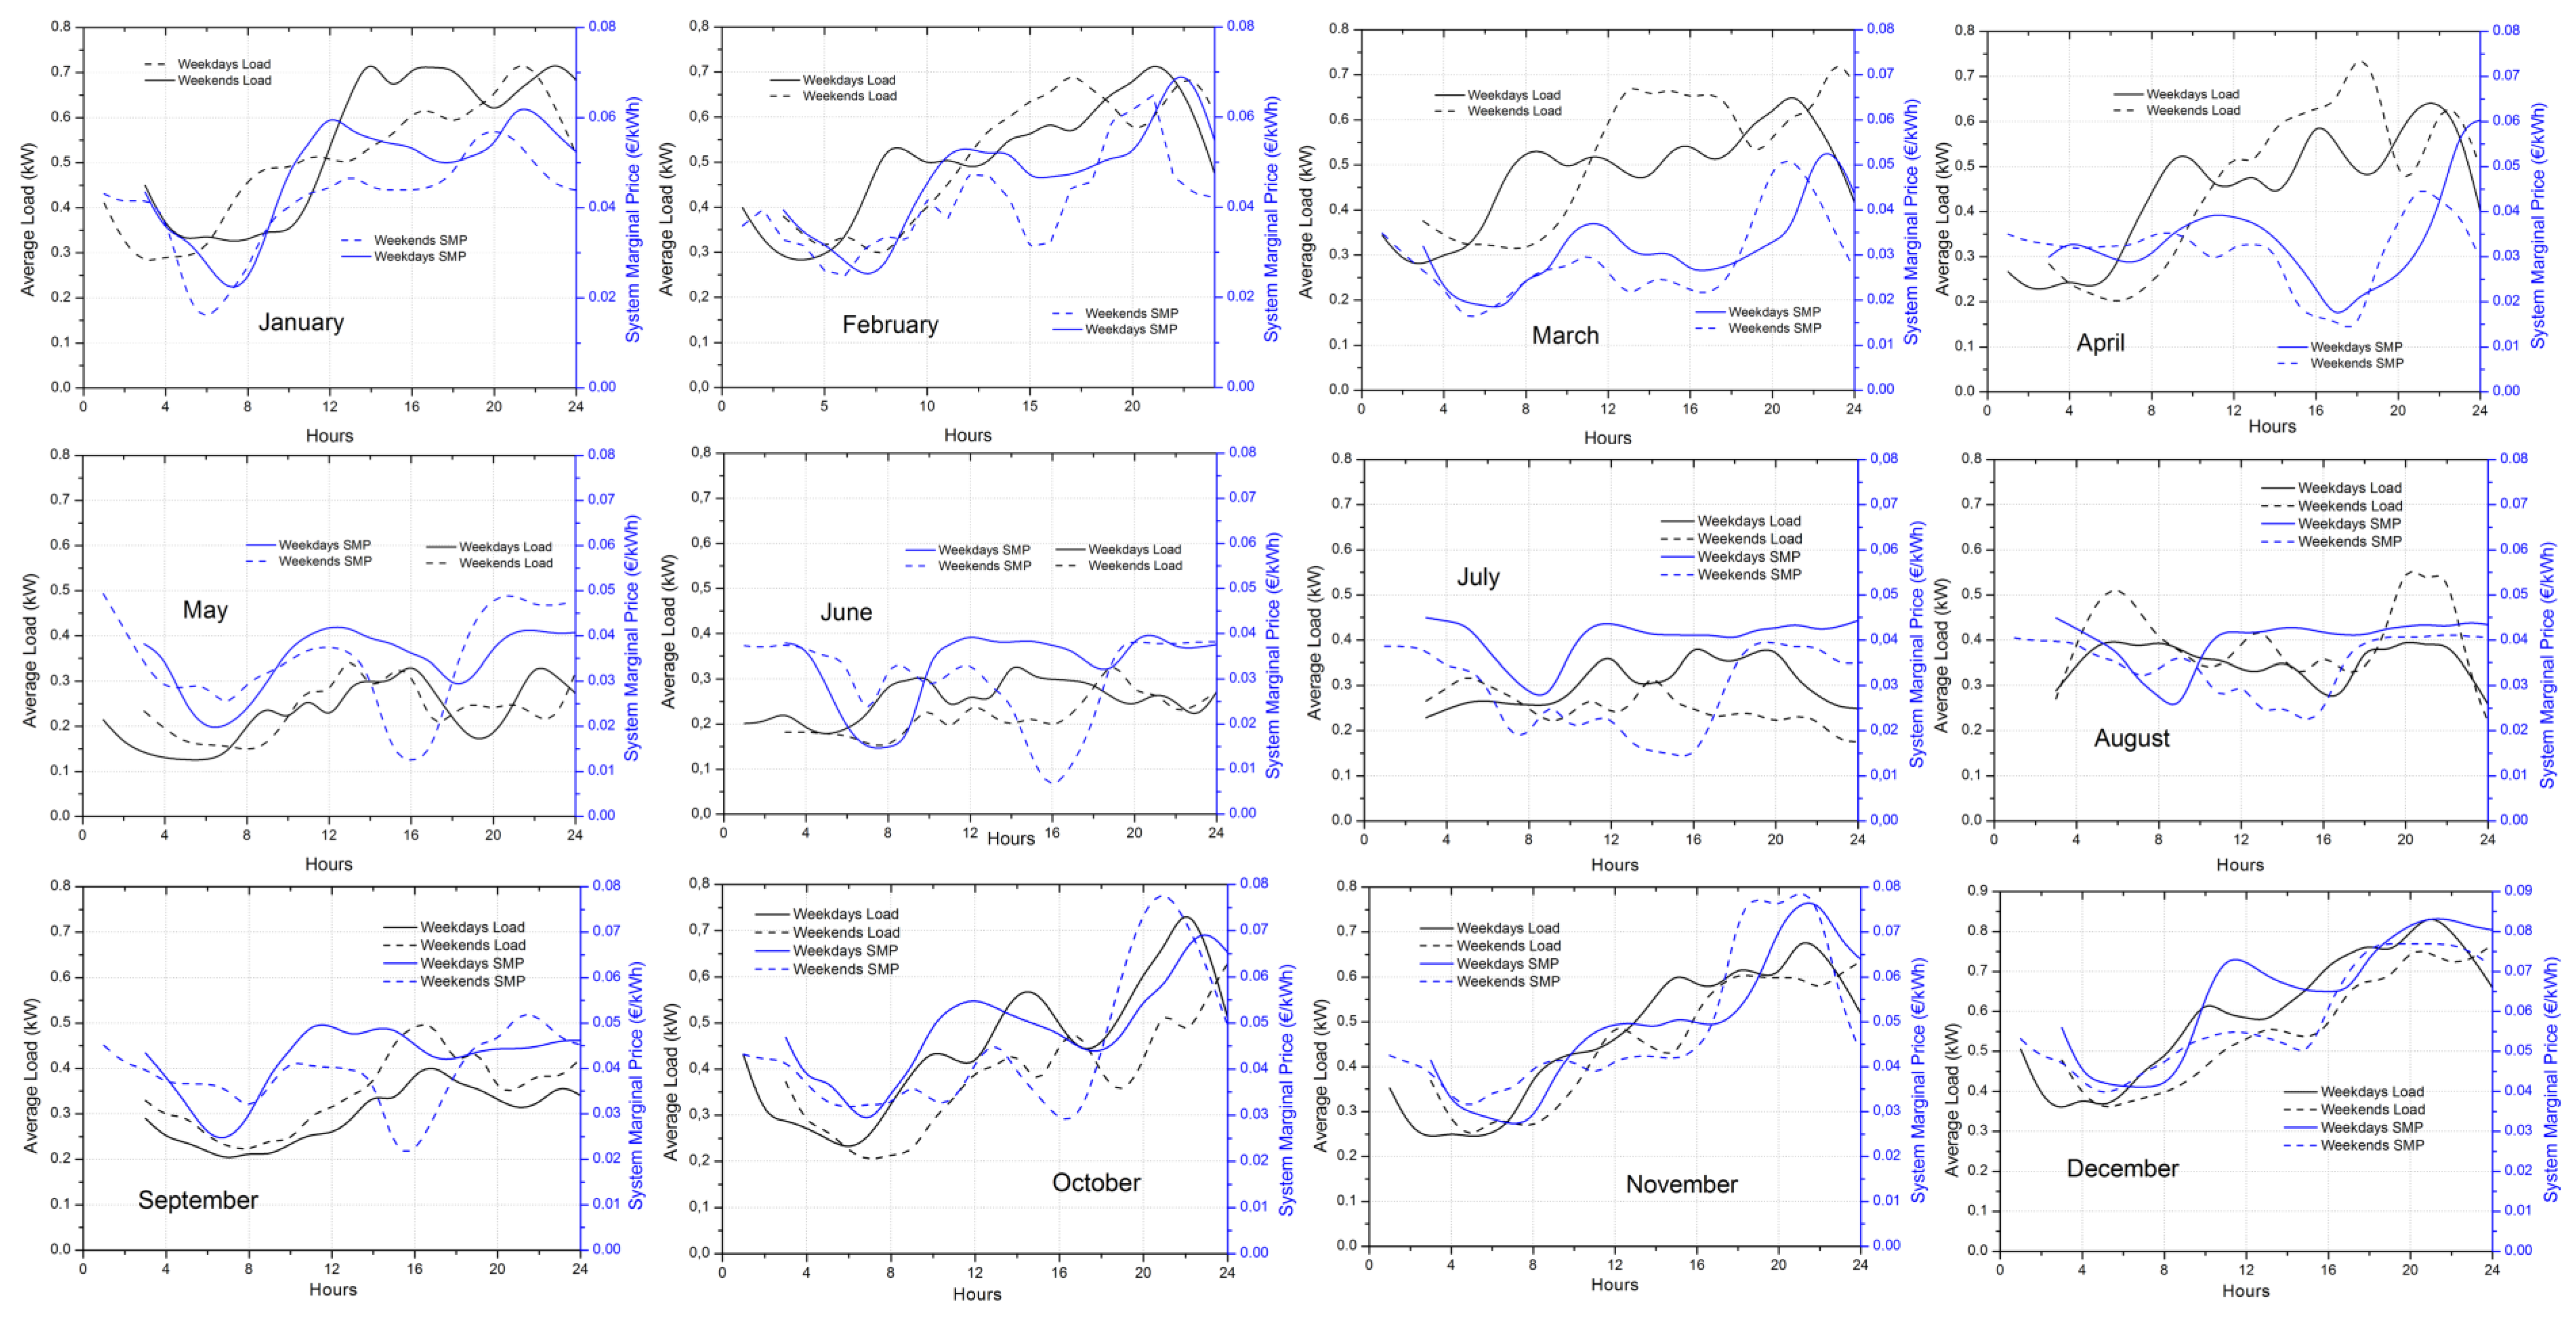
Utilizing the methodology of
Section 3, the present study considers averaged load curves and system marginal prices separately for weekdays and weekends, for each month. Hence, 24 average load curves are used.
Figure 6 illustrates these monthly averaged curves used as input to the case study. With the exception of December, the axis of all other months has the same scaling (0–0.8 kW for the left
y-axis and 0–0.08 €/kWh for the right
y-axis).
4.3. Financial Parameters Input
The financial parameters concerned for the calculations of the case studies are based on actual research concerning the cost of PV systems and relevant literature review [
29]. The main financial parameters used here are included in
Table 6.
The installation cost includes the cost of all required elements of the system (PV panels, inverters, cabling, protection, etc.) and the labor cost. The grid connection cost is the actual cost required by the Greek DSO for three-phase connections (up to 55 kWp of PV power capacity) and includes the inspection and replacement of the existing consumption meter. The Operation and Maintenance (O&M) costs include the insurance costs of the PV systems as well. This and the electricity prices are assumed to inflate each year with an annual rate of 2% which is the long-term target of the European Central Bank (ECB).
Regarding electricity prices, the competitive tariff charges of
Table 2 and the TSO, DSO and the rest charges of
Table 3 are allowed to increase at the inflation rate target of 2% each year. The charges of RES tax and services of general interest are kept constant throughout the 20 year lifetime. This is justified (for the case of RES tax) since the “new deal” that imposed lower FiTs on existing PV installations is expected to minimize the deficit of the electricity market operator and hence, in the worst case, keep the RES tax stable. Regarding the services of general interest charge, taking into consideration that a major part of this charge is due to the high cost of electricity generation in the non-interconnected islands (diesel plants), the announced interconnection of Cyclades islands and Crete will certainly lead to a reduction of this charge or in the worst case keep it unchanged.
5. Results
The results section is split into two parts. The goal of the first part is to highlight the influence that certain parameters have on the attractiveness of the current NEM policy in Greece, using a 4-month netting period. The second part of the results aims in investigating the NEM policy scenarios described in
Section 4.1. For both cases, the main input is the calculated average consumption for a residential consumer (
Figure 6). The prosumer is located in Thessaloniki area in northern Greece and has a contractual capacity of 25 kVA (3-phase connection). The climatic data required to estimate PV production are obtained from the PVGIS platform, while the simple method outlined in
Section 3 is used for obtaining the actual PV production, as in [
26], with the overall system efficiency being 90%.
Taking as input the average monthly load curves shown in
Figure 6 and the respective simulated PV production curves,
Table 7 details the monthly consumption, PV generation, and netting, along with the calculated incoming and outgoing energy, for 3 kWp installed PV power. In order to calculate the actual charge for the prosumer under a certain NEM policy, the parameters shown in
Table 7 may be required. Then, the profit for the prosumer is determined by subtracting this actual charge from the electricity cost he would have been charged without the PV system.
5.1. Assessing the Current NEM Policy in Greece
As explained in
Section 2, the current NEM policy in Greece is a partial-netting policy with a 4-month billing period and an annual netting period. In case excess PV energy is produced within a billing period, the exported energy to the grid is transferred to the next billing period as RECs and not directly compensated. An important parameter that influences the attractiveness of this specific policy is the self-consumption rate, shown in the last column of
Table 7. With the current NEM policy in Greece, the higher the self-consumption rate, the lower the energy exported to the grid is and, thus, the demand from the grid is lower as well. This results in increased savings for the prosumer, since the regulated tariff charges (apart from the SGI charge) and the special duty for RES are calculated based on the imported energy from the grid. Specifically regarding the case that is shown in
Table 7, the annual average self-consumption rate is calculated at 43.32% approximately. The 4-month billing periods are assumed to be January–April (with a total consumption of 1410.75 kWh), May–August (822.9 kWh) and September–December (1312.9 kWh).
As it may be realized by inspecting the “G1” tariff charges of
Table 2,
Table 3 and
Table 4 and the resulting 4-months averaged consumption, the benefit for this prosumer under the NEM policy is limited. This is because the avoided electricity cost based on actual electricity consumption is calculated with the lower values of the charge elements of
Table 2,
Table 3 and
Table 4 (
i.e., 0.0946 €/kWh instead 0.10252 €/kWh). Generally, the “G1” tariff structure favours prosumers that have higher 4-months consumption. Therefore, since high-consuming prosumers are more likely to install a PV system under a NEM policy, simulations are carried out assuming higher consumption as well.
In order to preserve the load curve shapes, the simulated higher consumptions are constructed by increasing the average load curves of
Figure 6 by 50%, 100%, and 150%.
Table 8 collects the average electricity costs for the NEM prosumer under the categories described in
Section 3, for the 4 different consumption cases. The average netted and non-netted costs are constructed referring to
Table 2 and
Table 3. For instance, the 50% higher consumption case considers 4-month consumptions of 2115 kWh, 1234 kWh, and 1968 kWh respectively, which means that the netted cost (CN) is 0.0946 €/kWh for the 2nd and 3rd periods and 0.10252 €/kWh for the 1st period, resulting in an average netted cost of 0.0974 €/kWh.
It has to be noted that the majority of residential consumers of the sample falls into the first category (~75%). The rest is split between the second and third categories (14% and 11% respectively). None of the recorded consumptions falls into the fourth case, however, it is studied here since it leads to a higher average netted cost, which may be realized as an indirect FiT.
Utilizing the methodology of
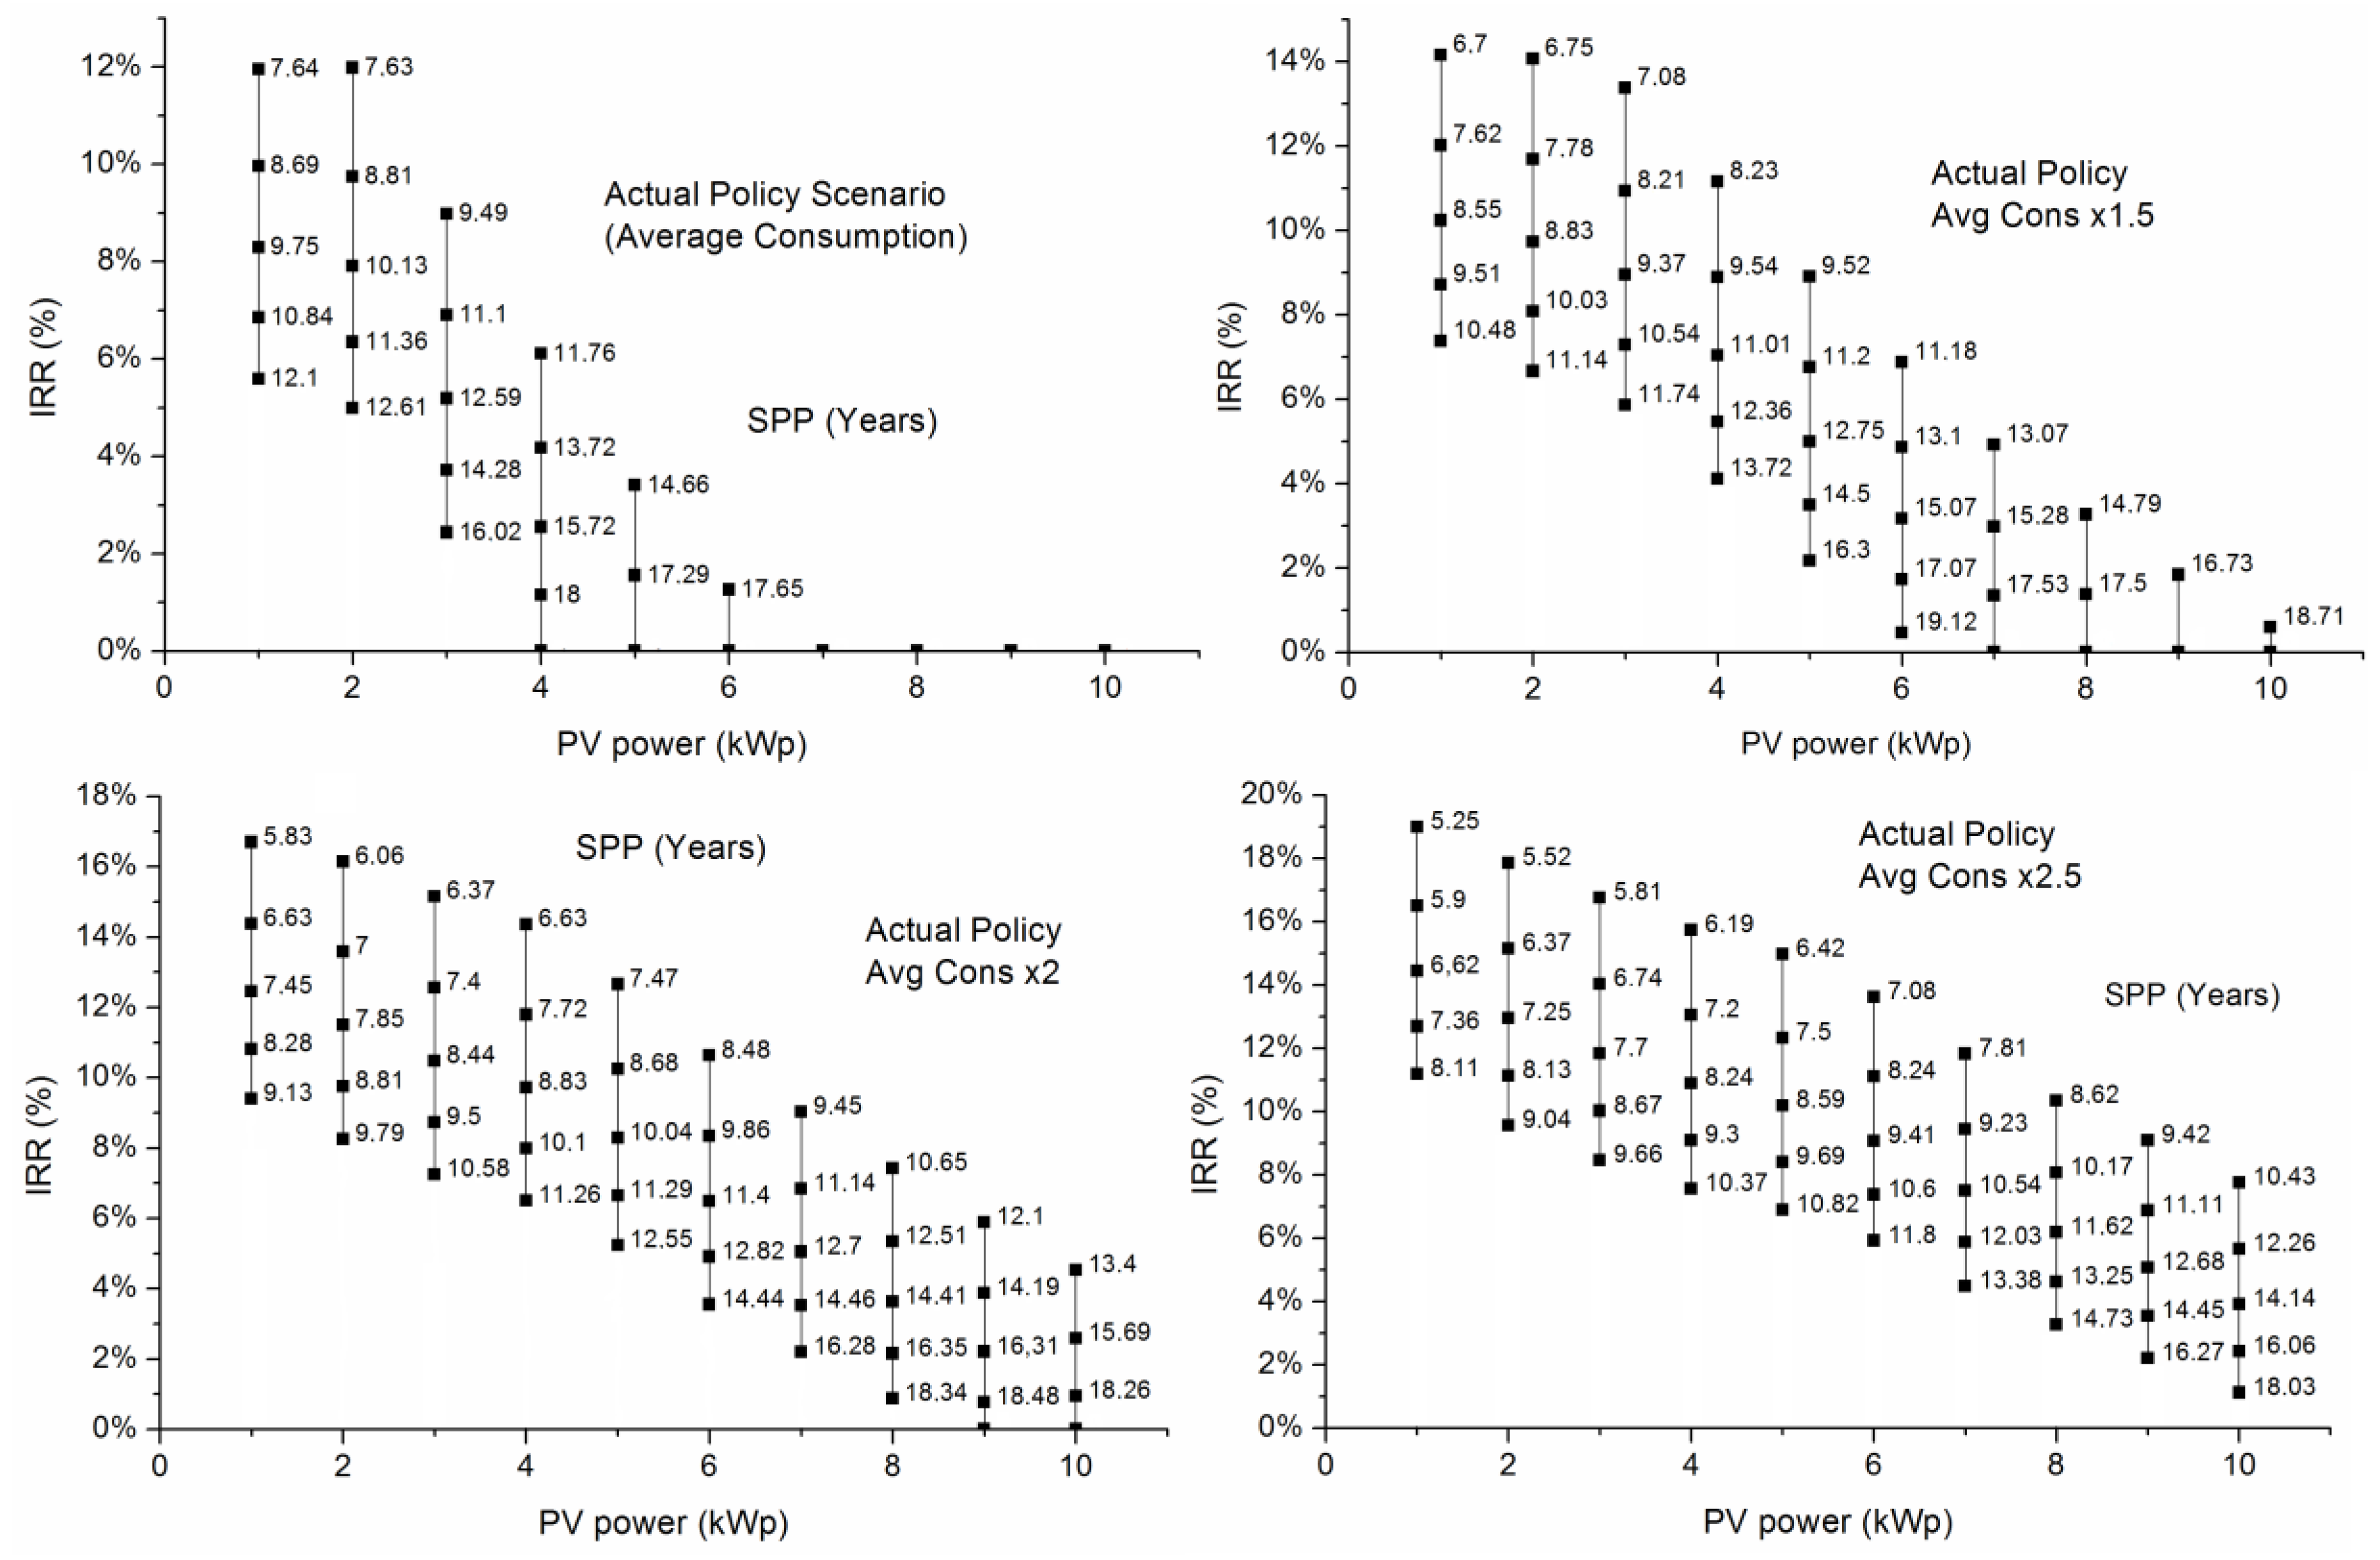
Section 3, a series of simulations were performed for each of the 4 consumption cases. The PV installed capacity varies between 1 kWp and 10 kWp while the installation costs vary between 1200 €/kWp and 2000 €/kWp with a step of 200 €/kWp.
Figure 7 depicts both the calculated IRR and the SPP for each PV-installed power and each installation cost, for the 4 consumption cases. The black rectangles, which are shown on the vertical lines at each installed power value, correspond to a different installation cost, the top being the lowest one (1200 €/kWp).
Inspecting the different graphs of
Figure 7, one can conclude that the attractiveness of the current NEM policy is heavily influenced by the installation cost as expected. However, a closer look at the results shows how the attractiveness of the NEM investment increases as the electricity consumption increases. If the IRR is selected as the decisive indicator for choosing the optimum PV power, the value of 2 kWp is the optimal one for the three higher consumption cases. The same result is observed regarding the SPP indicator. The variation of the installation costs between the two extremes results is more than 4 years in the SPP indicator and more than 7% difference in the IRR indicator (for the 2 kWp optimal power). Moreover, the variation of consumption for the same conditions may lead to differences of more than 1.8 years in the SPP and more than 3% in the IRR indicator.
5.2. Investigating Alternative Net-Metering Policies
The results of the previous sub-section indicate that under certain conditions and capital costs, a NEM investment can become considerably attractive for a prosumer, exceeding in many instances a 10% IRR. This may imply that the current policy favours NEM prosumers at the expense of other electricity consumers. For example, by allowing a yearly netting period the prosumer can offset the PV energy produced with consumed energy at different times, which presupposes the existence of the grid, an asset that all consumers pay for its services, maintenance, and development. Moreover, this results in reduced revenue for the grid operator and the VAT. These may lead to an increase of retail prices to counterbalance the loss revenues. This can be characterized as a macroeconomic rebound effect. In this case, the prosumer is less influenced with respect to other consumers.
Therefore, policy-makers may have to consider alternative policies, more closely related to market-based ones, in order to form a win-win situation for all parties involved. Such policies may involve a smaller netting period (e.g., hourly netting) in order to influence lower grid interaction, or may forbid the transferring of excess produced energy in the form of RECs and instead allow for selling the energy with the market price of that time step (i.e., the SMP).
The four alternative policy scenarios detailed in
Section 4.1 are constructed in this direction, especially since the netting period is reduced to 1 h, instead of 1 year in the current NEM policy. Consequently, the aim of this section is to investigate if such alternative policies compare with the current NEM policy in terms of attractiveness to a prospective investor.
The base case examined here takes as input the average load curves of
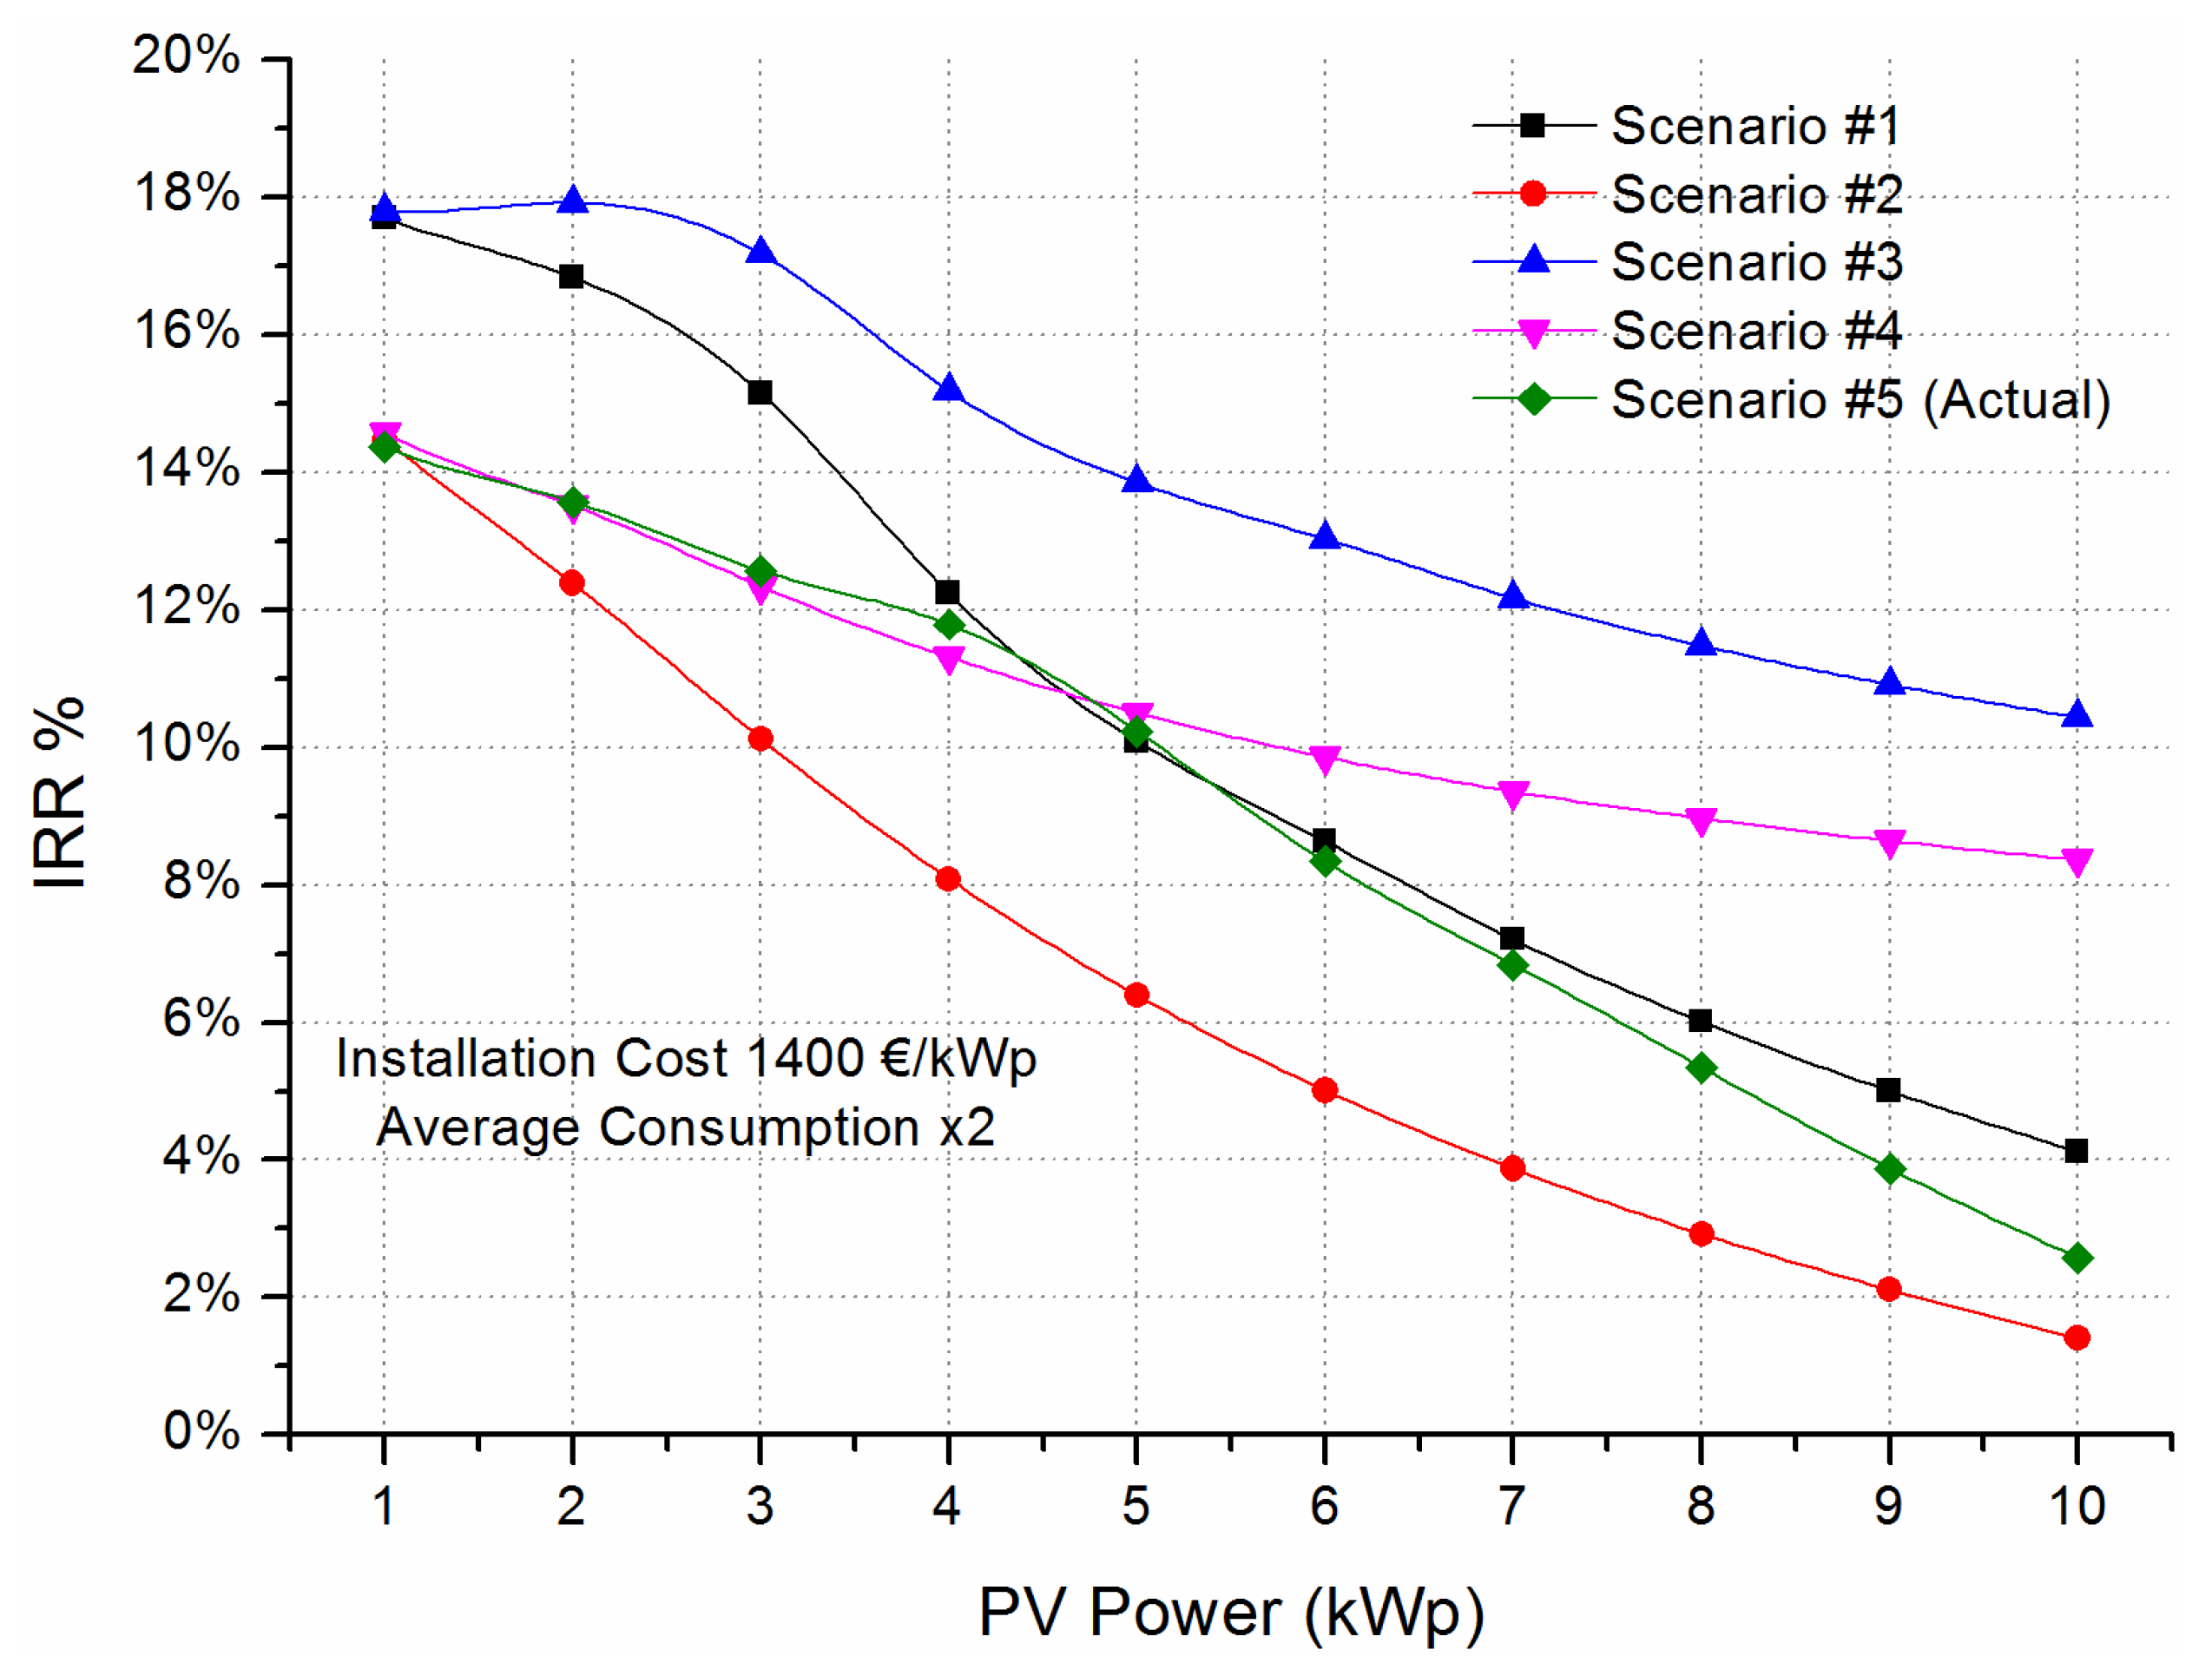
Figure 6 increased by 100%. The justification for this choice is that it is more likely for a high-consumption prosumer to install a NEM PV system than for a low-consumption one. Initially, the installation cost is set to 1400 €/kWp and the four alternative scenarios are compared with the current NEM policy (Scenario #5) under varied PV-installed power.
Figure 8 depicts the variation of the IRR indicator for each of the 5 scenarios considered.
The results of
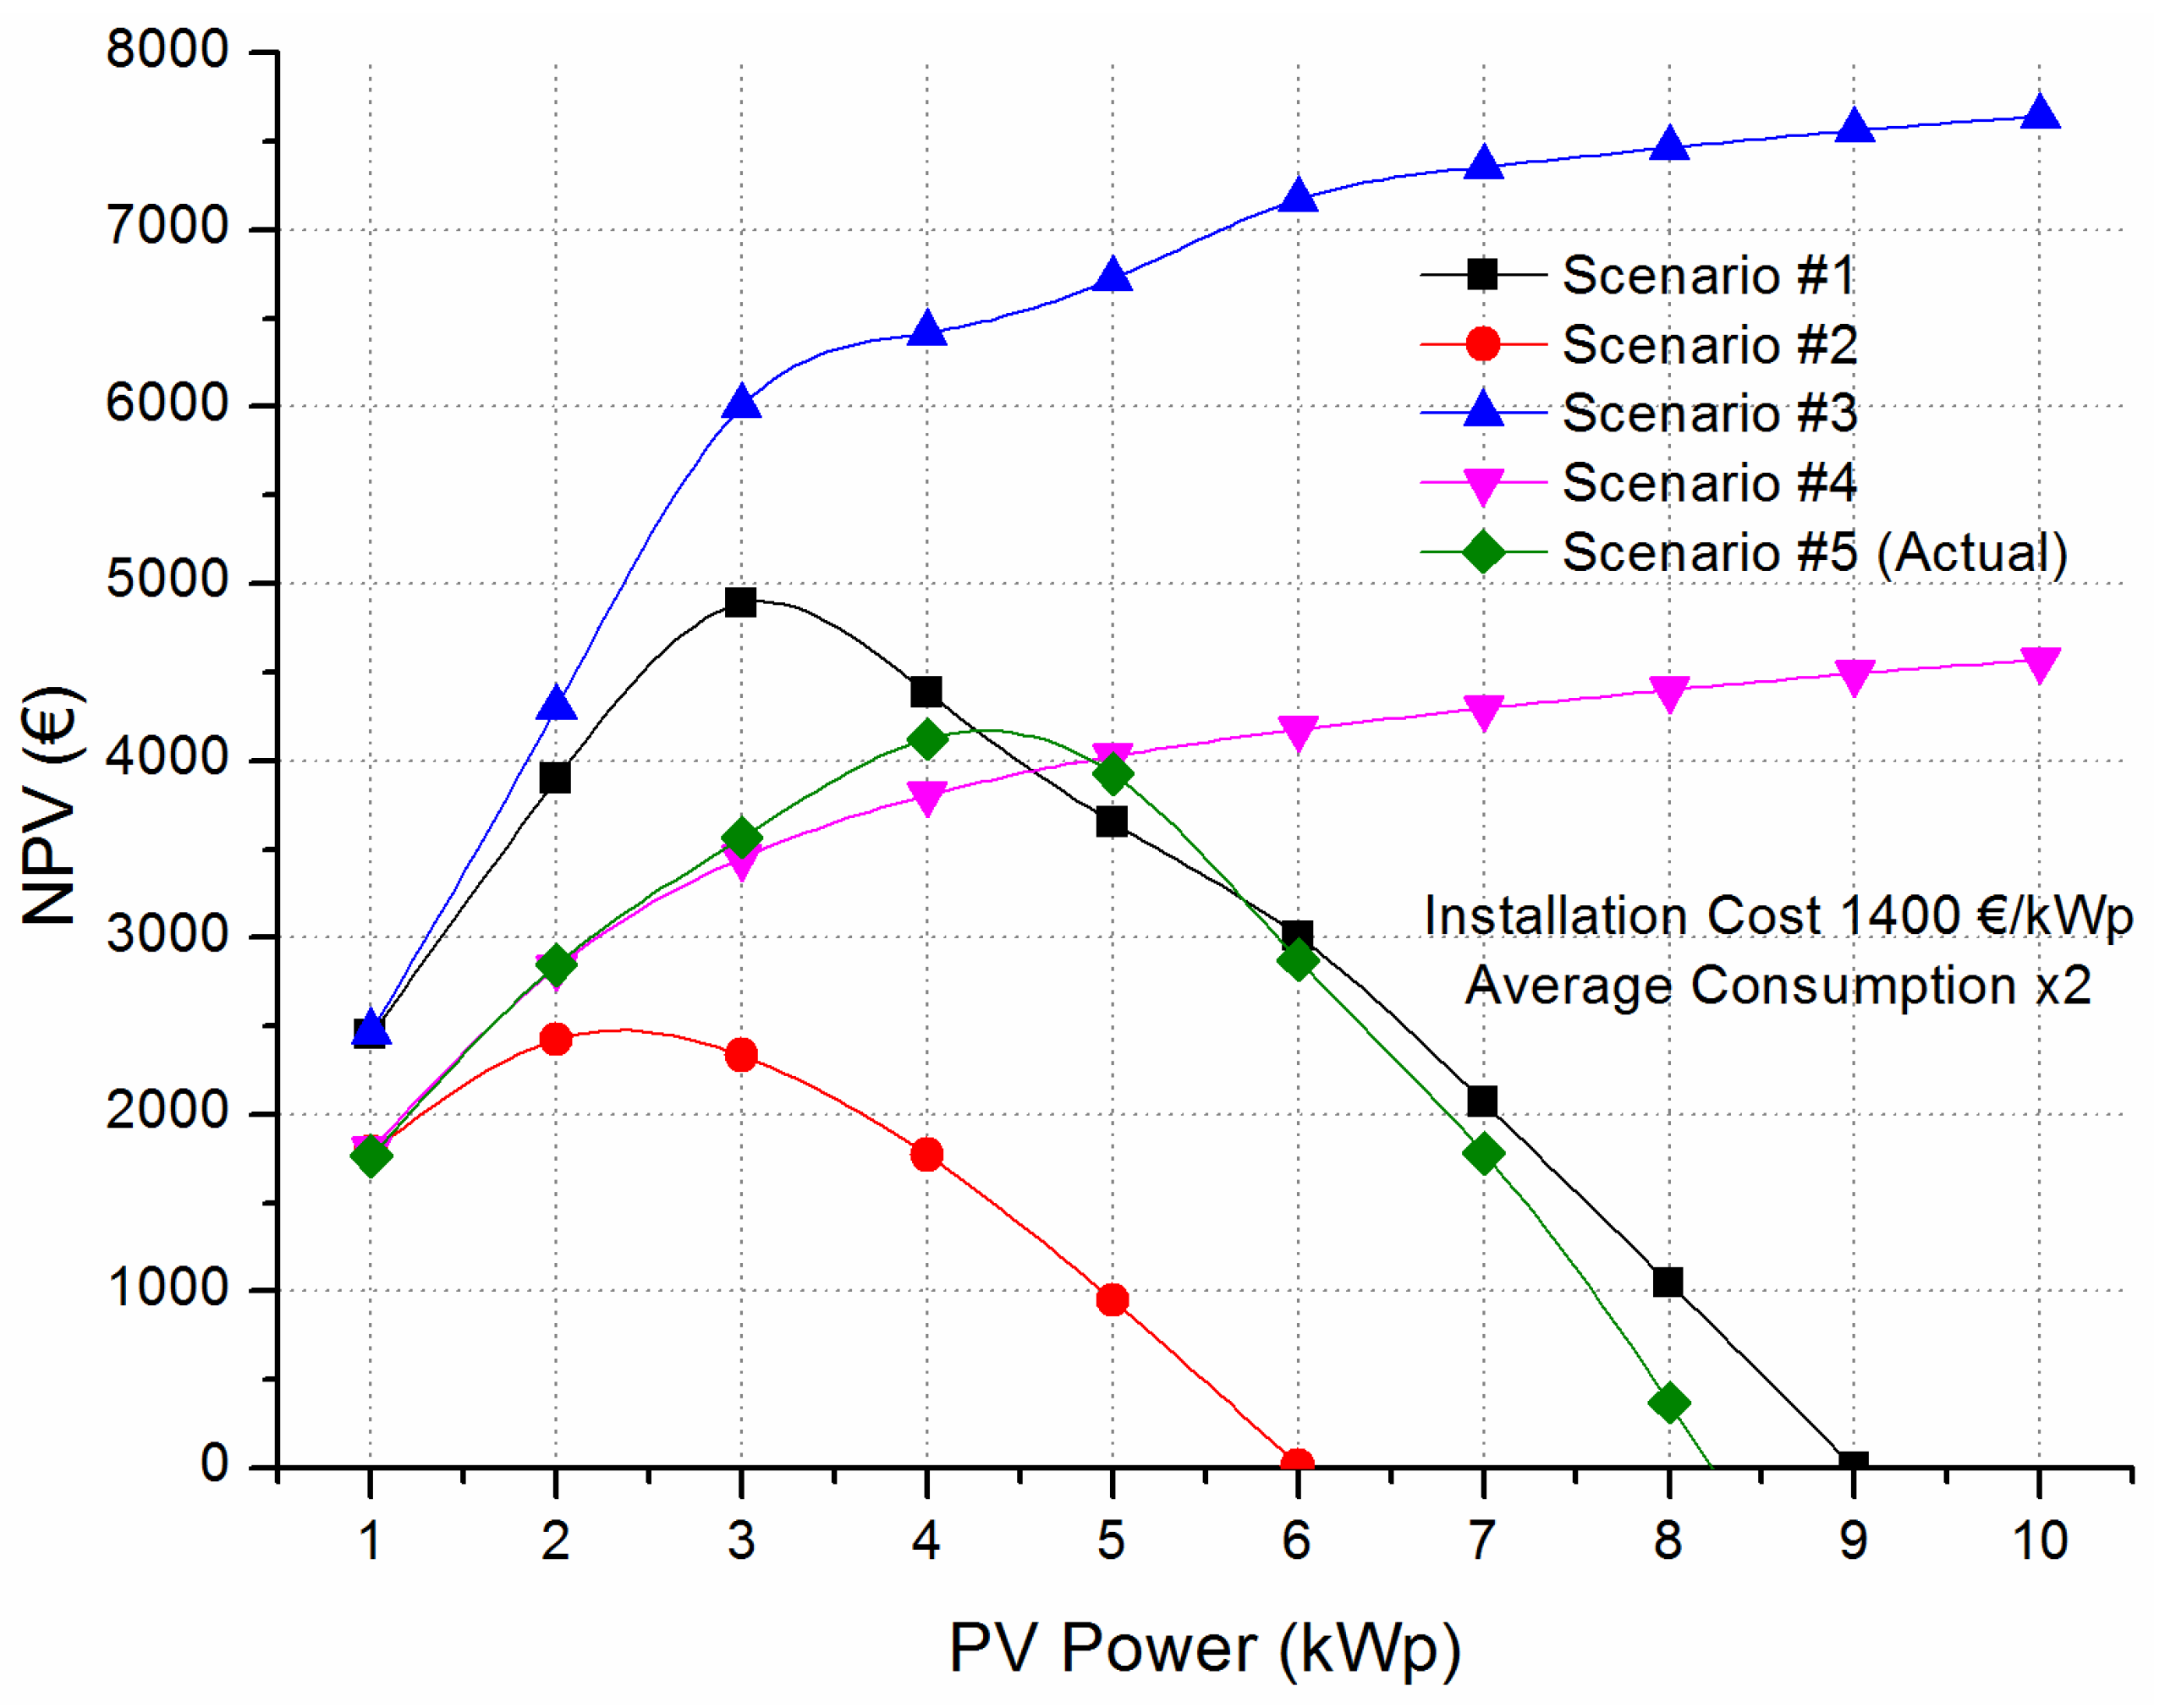
Figure 8 show that the current NEM policy is generally less favorable to the prosumer than the examined alternatives, with the exception of Scenario #2. However, the IRR indicator does not measure the absolute size of the investment and, therefore, the same graph is repeated showing the NPV variation in
Figure 9. The DR used is 5%, taking into account the ECB’s target inflation of 2%, plus a 3% investment risk-premium.
Comparing the results from the NPV variation in
Figure 9 with the ones from the IRR variation, it may be realized that the optimal PV-installed power ranges between 2 kWp (Scenario #2) and 4 kWp (Scenario #5—current NEM policy). Also, the compensation of the excess energy with the current FiT that is foreseen in Scenarios #3 and #4, leads to an optimal PV power higher than 10 kWp.
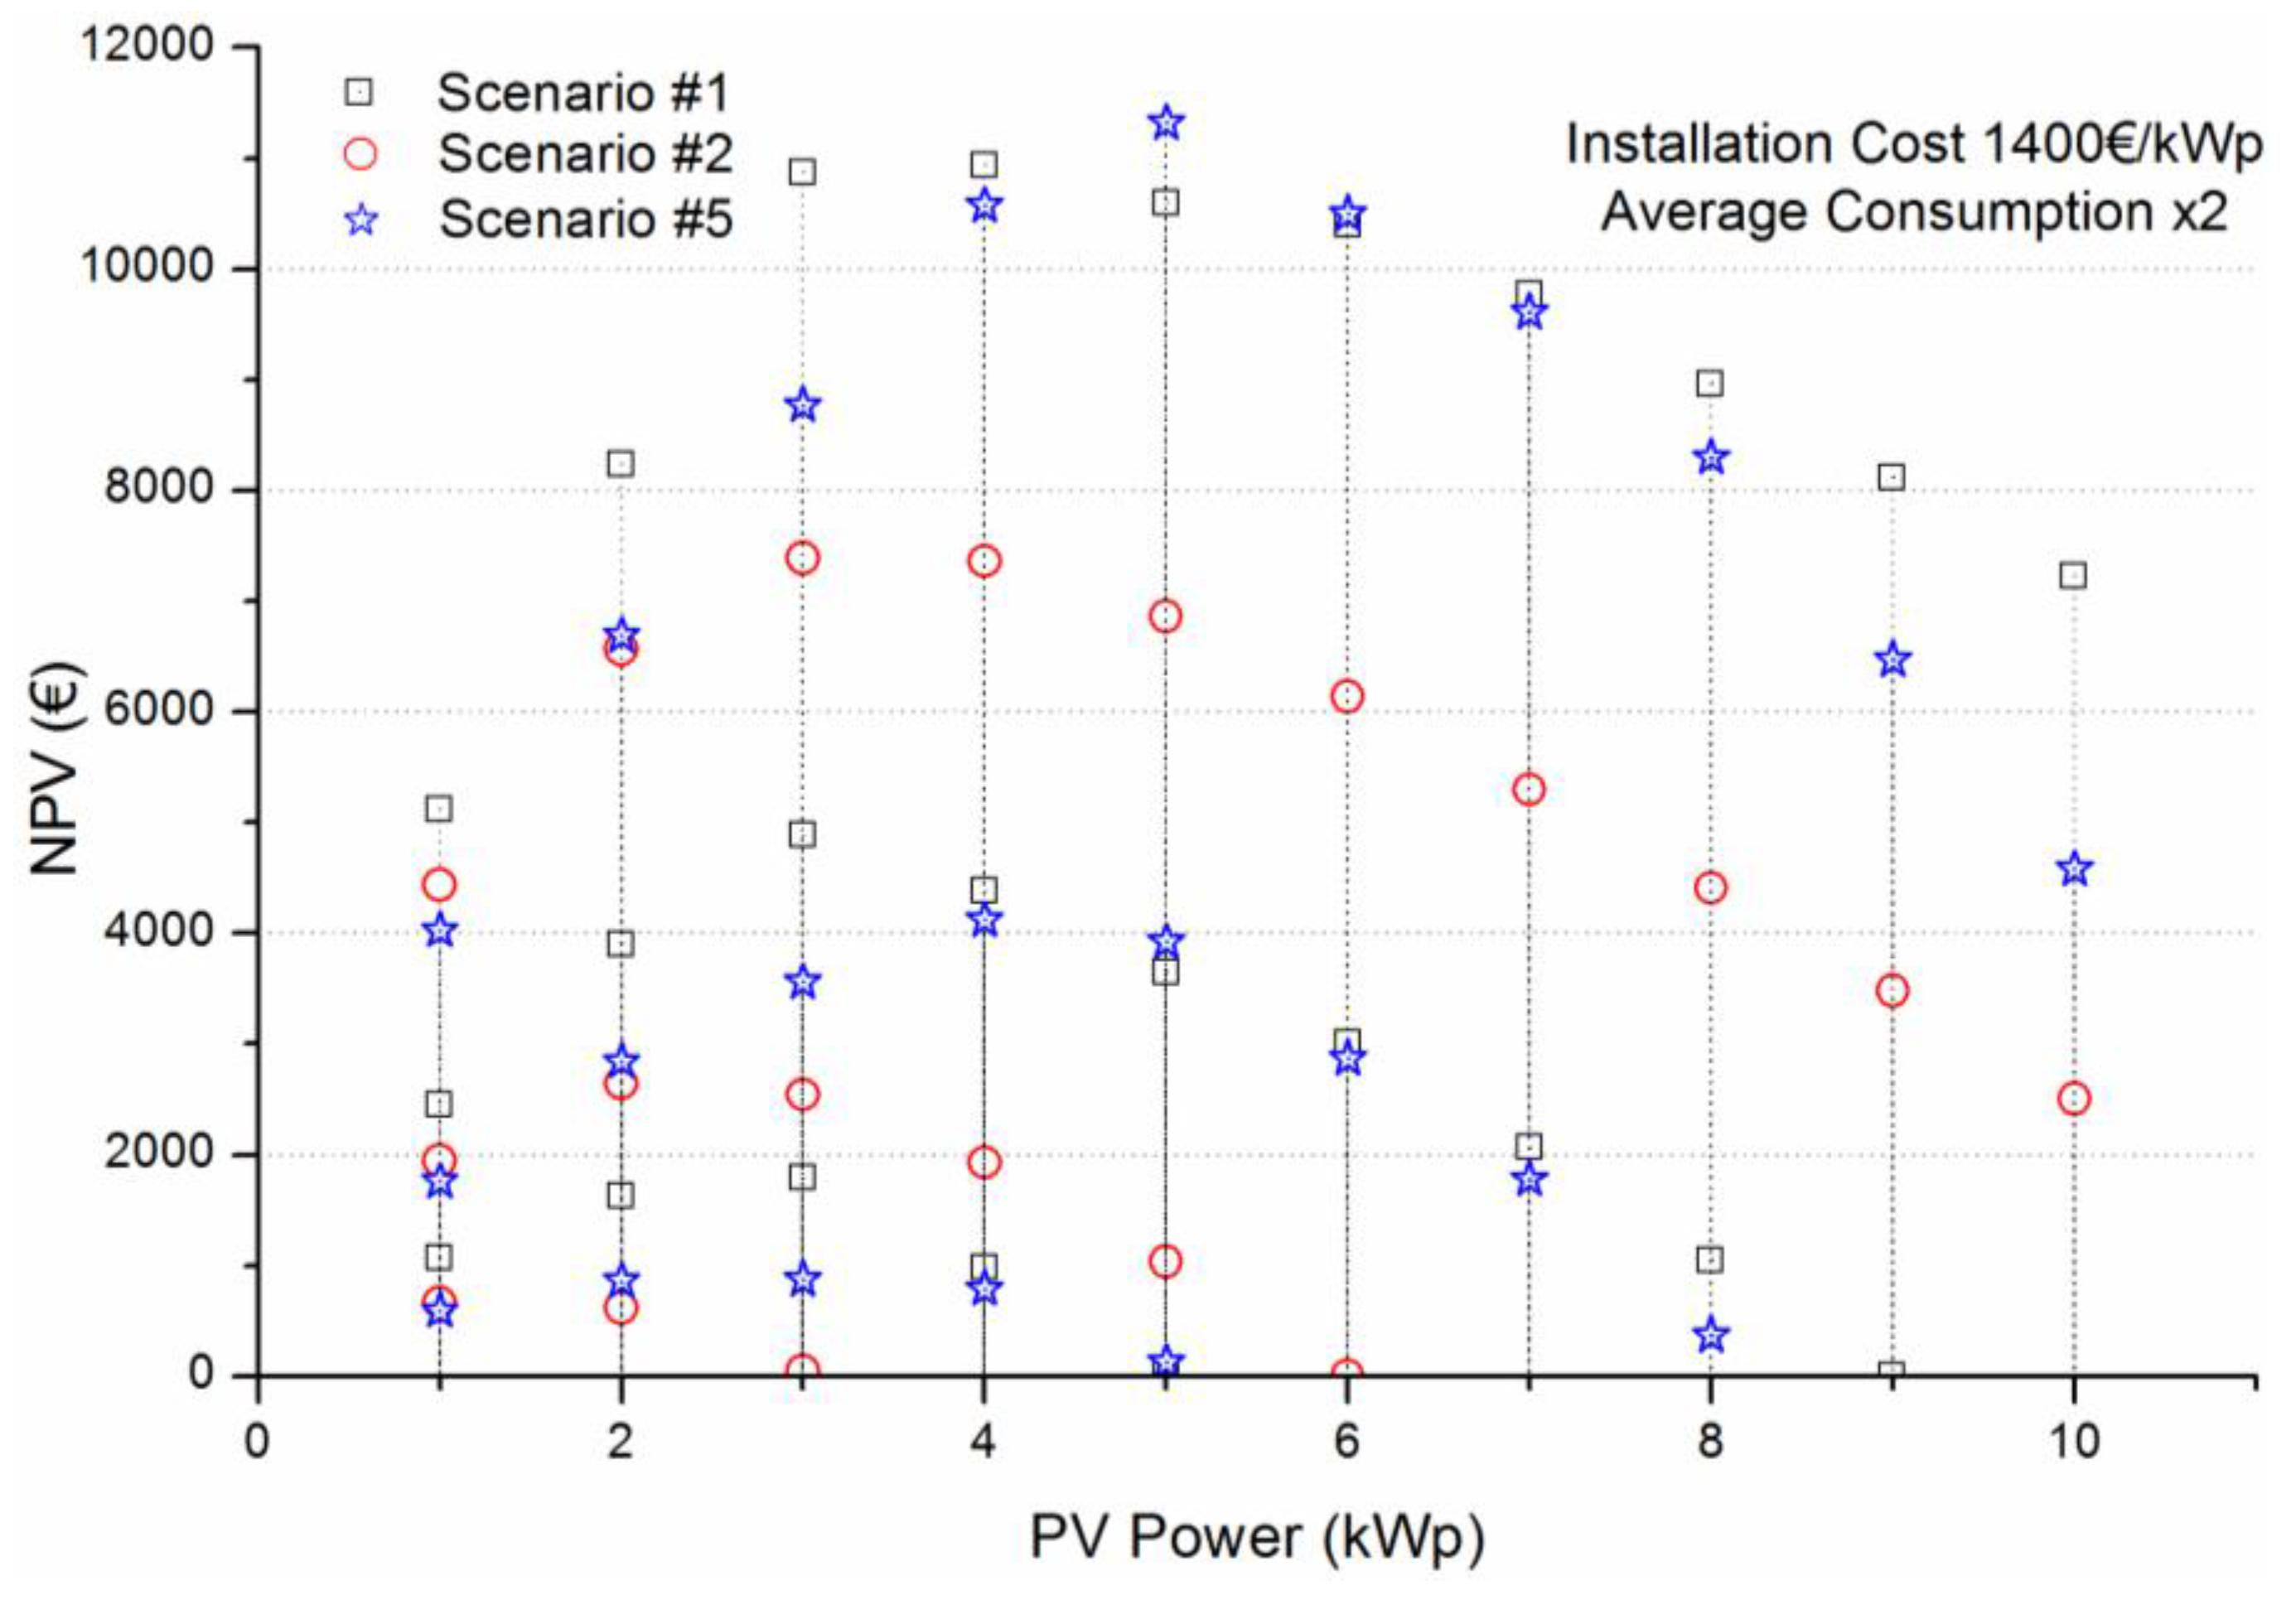
Since the NPV depends on the DR, the above simulations were repeated for 0% and 10% DR values as well. The following
Figure 10 illustrates the dependence of NPV on the DR for Scenarios #1, #2 and #5 with varying PV installed capacity.
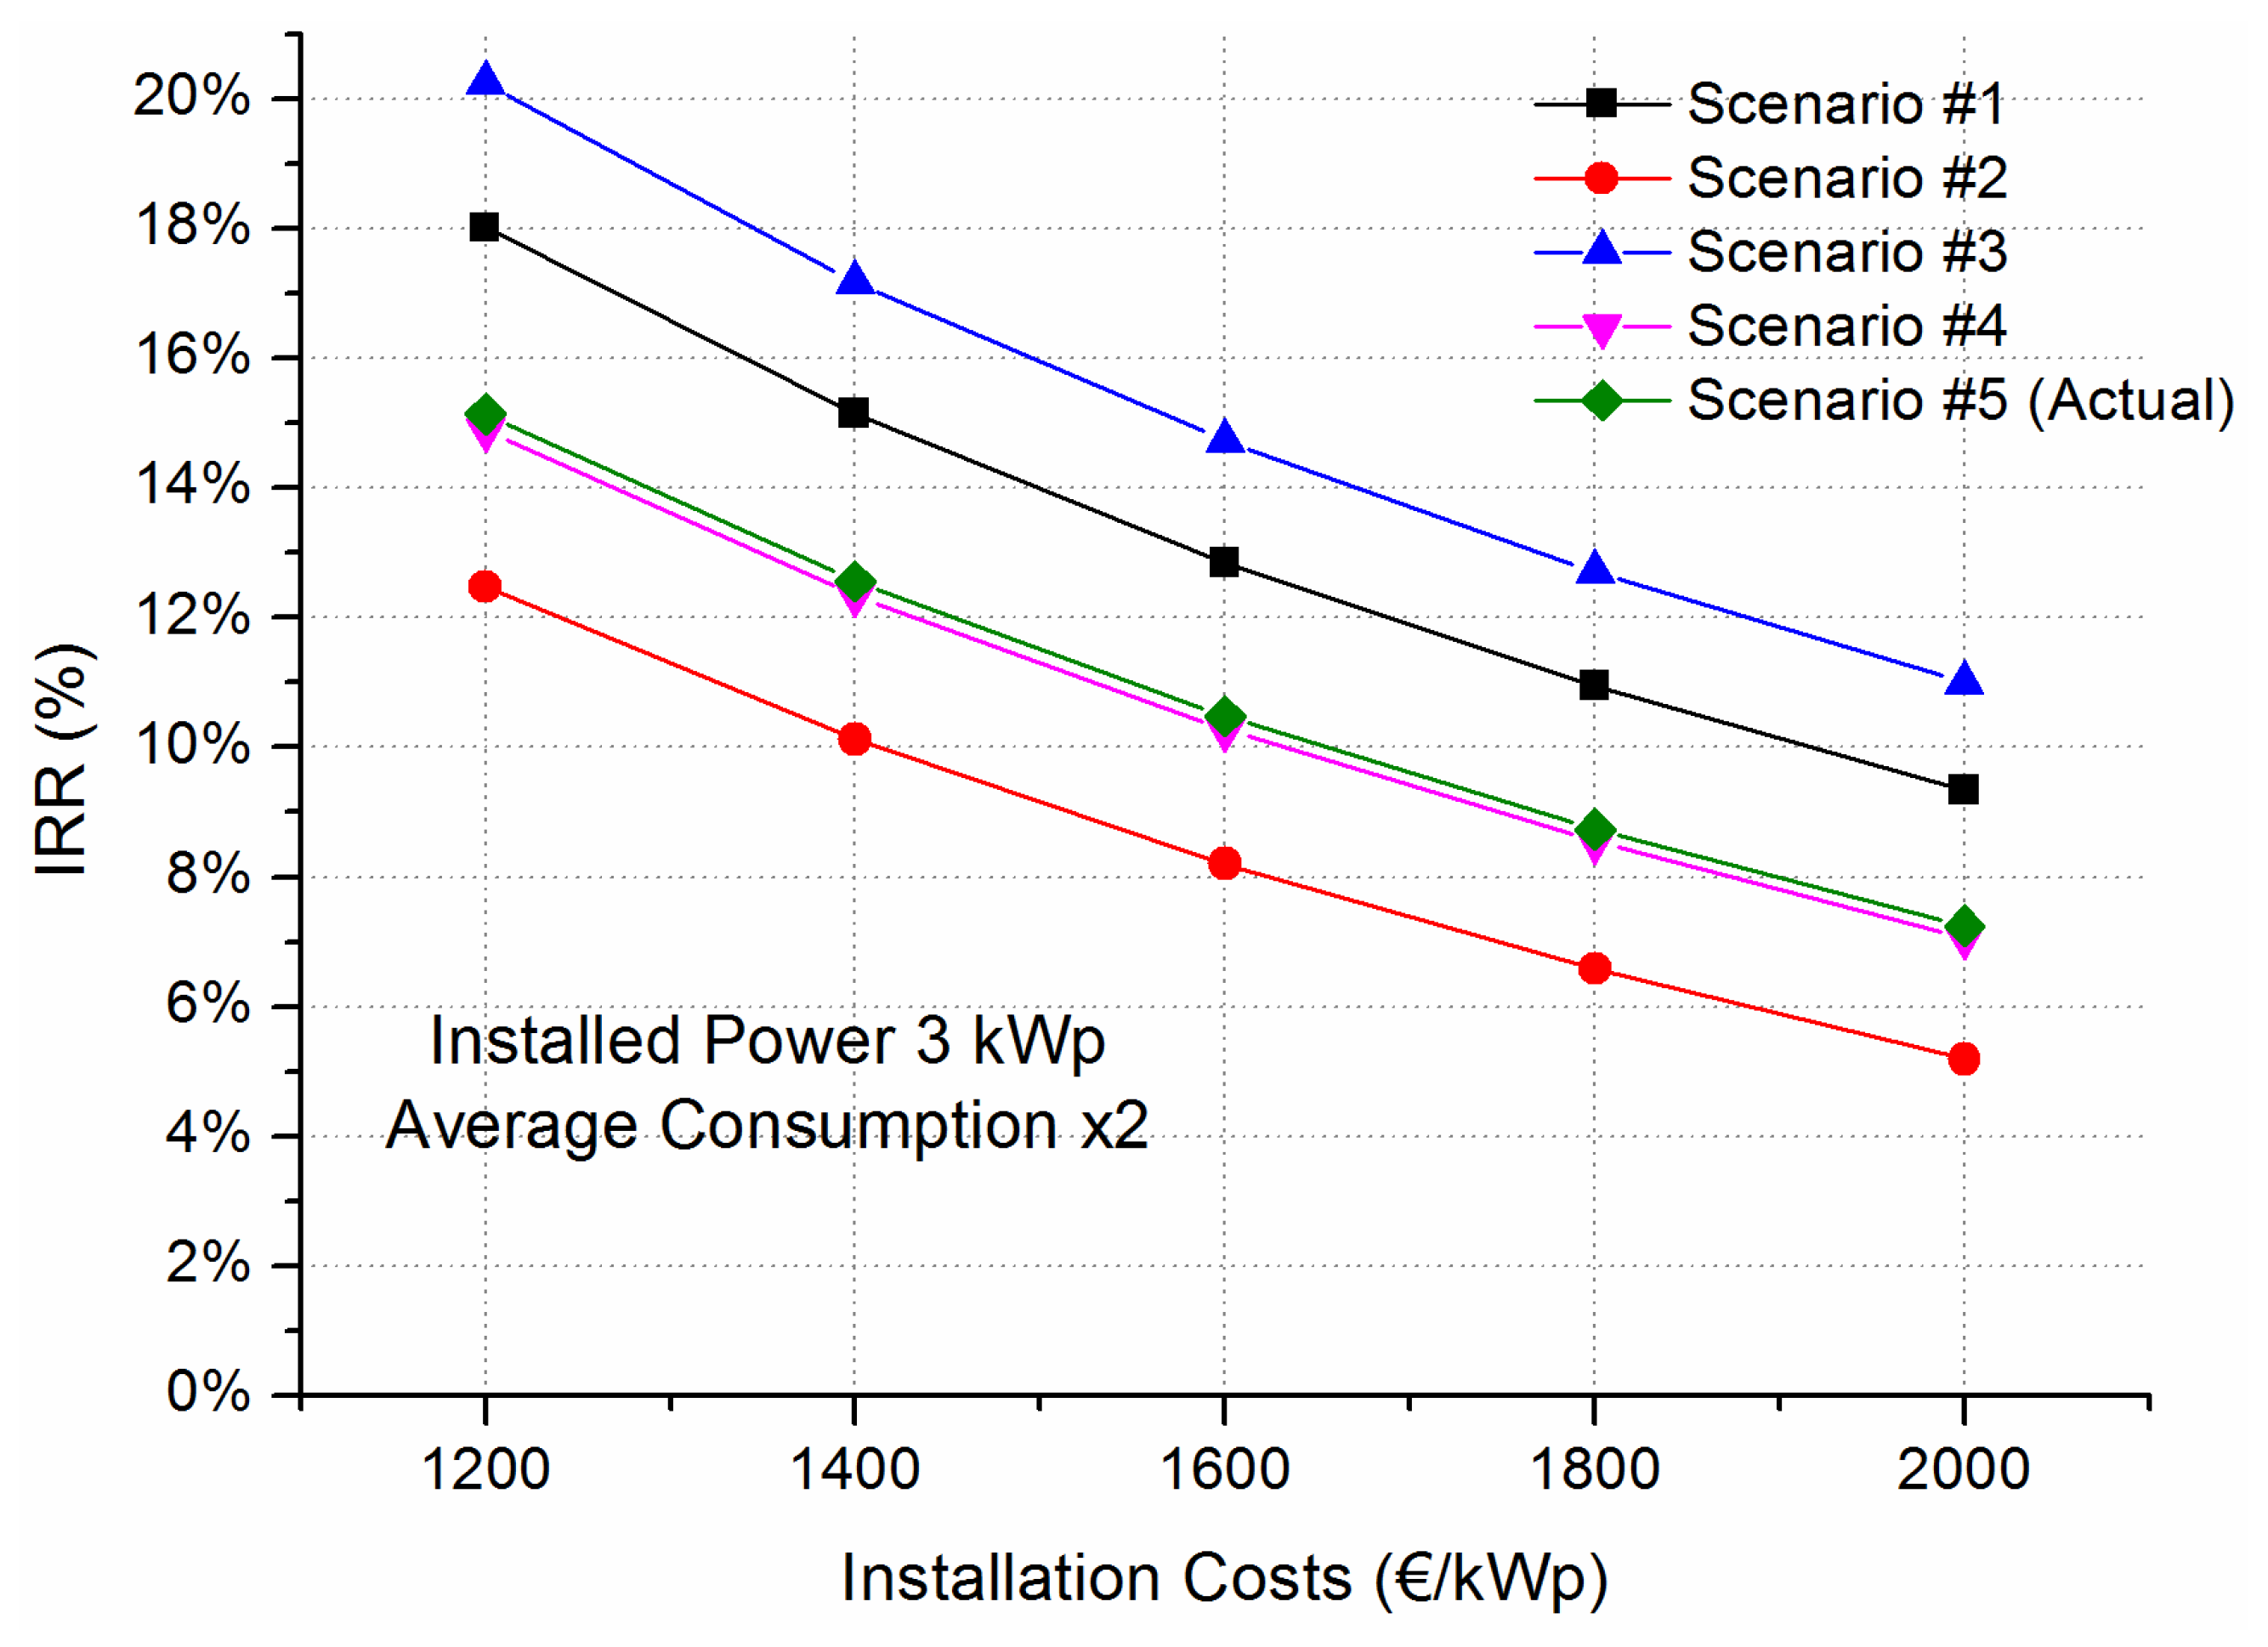
Next, the influence of the installation cost parameter is examined.
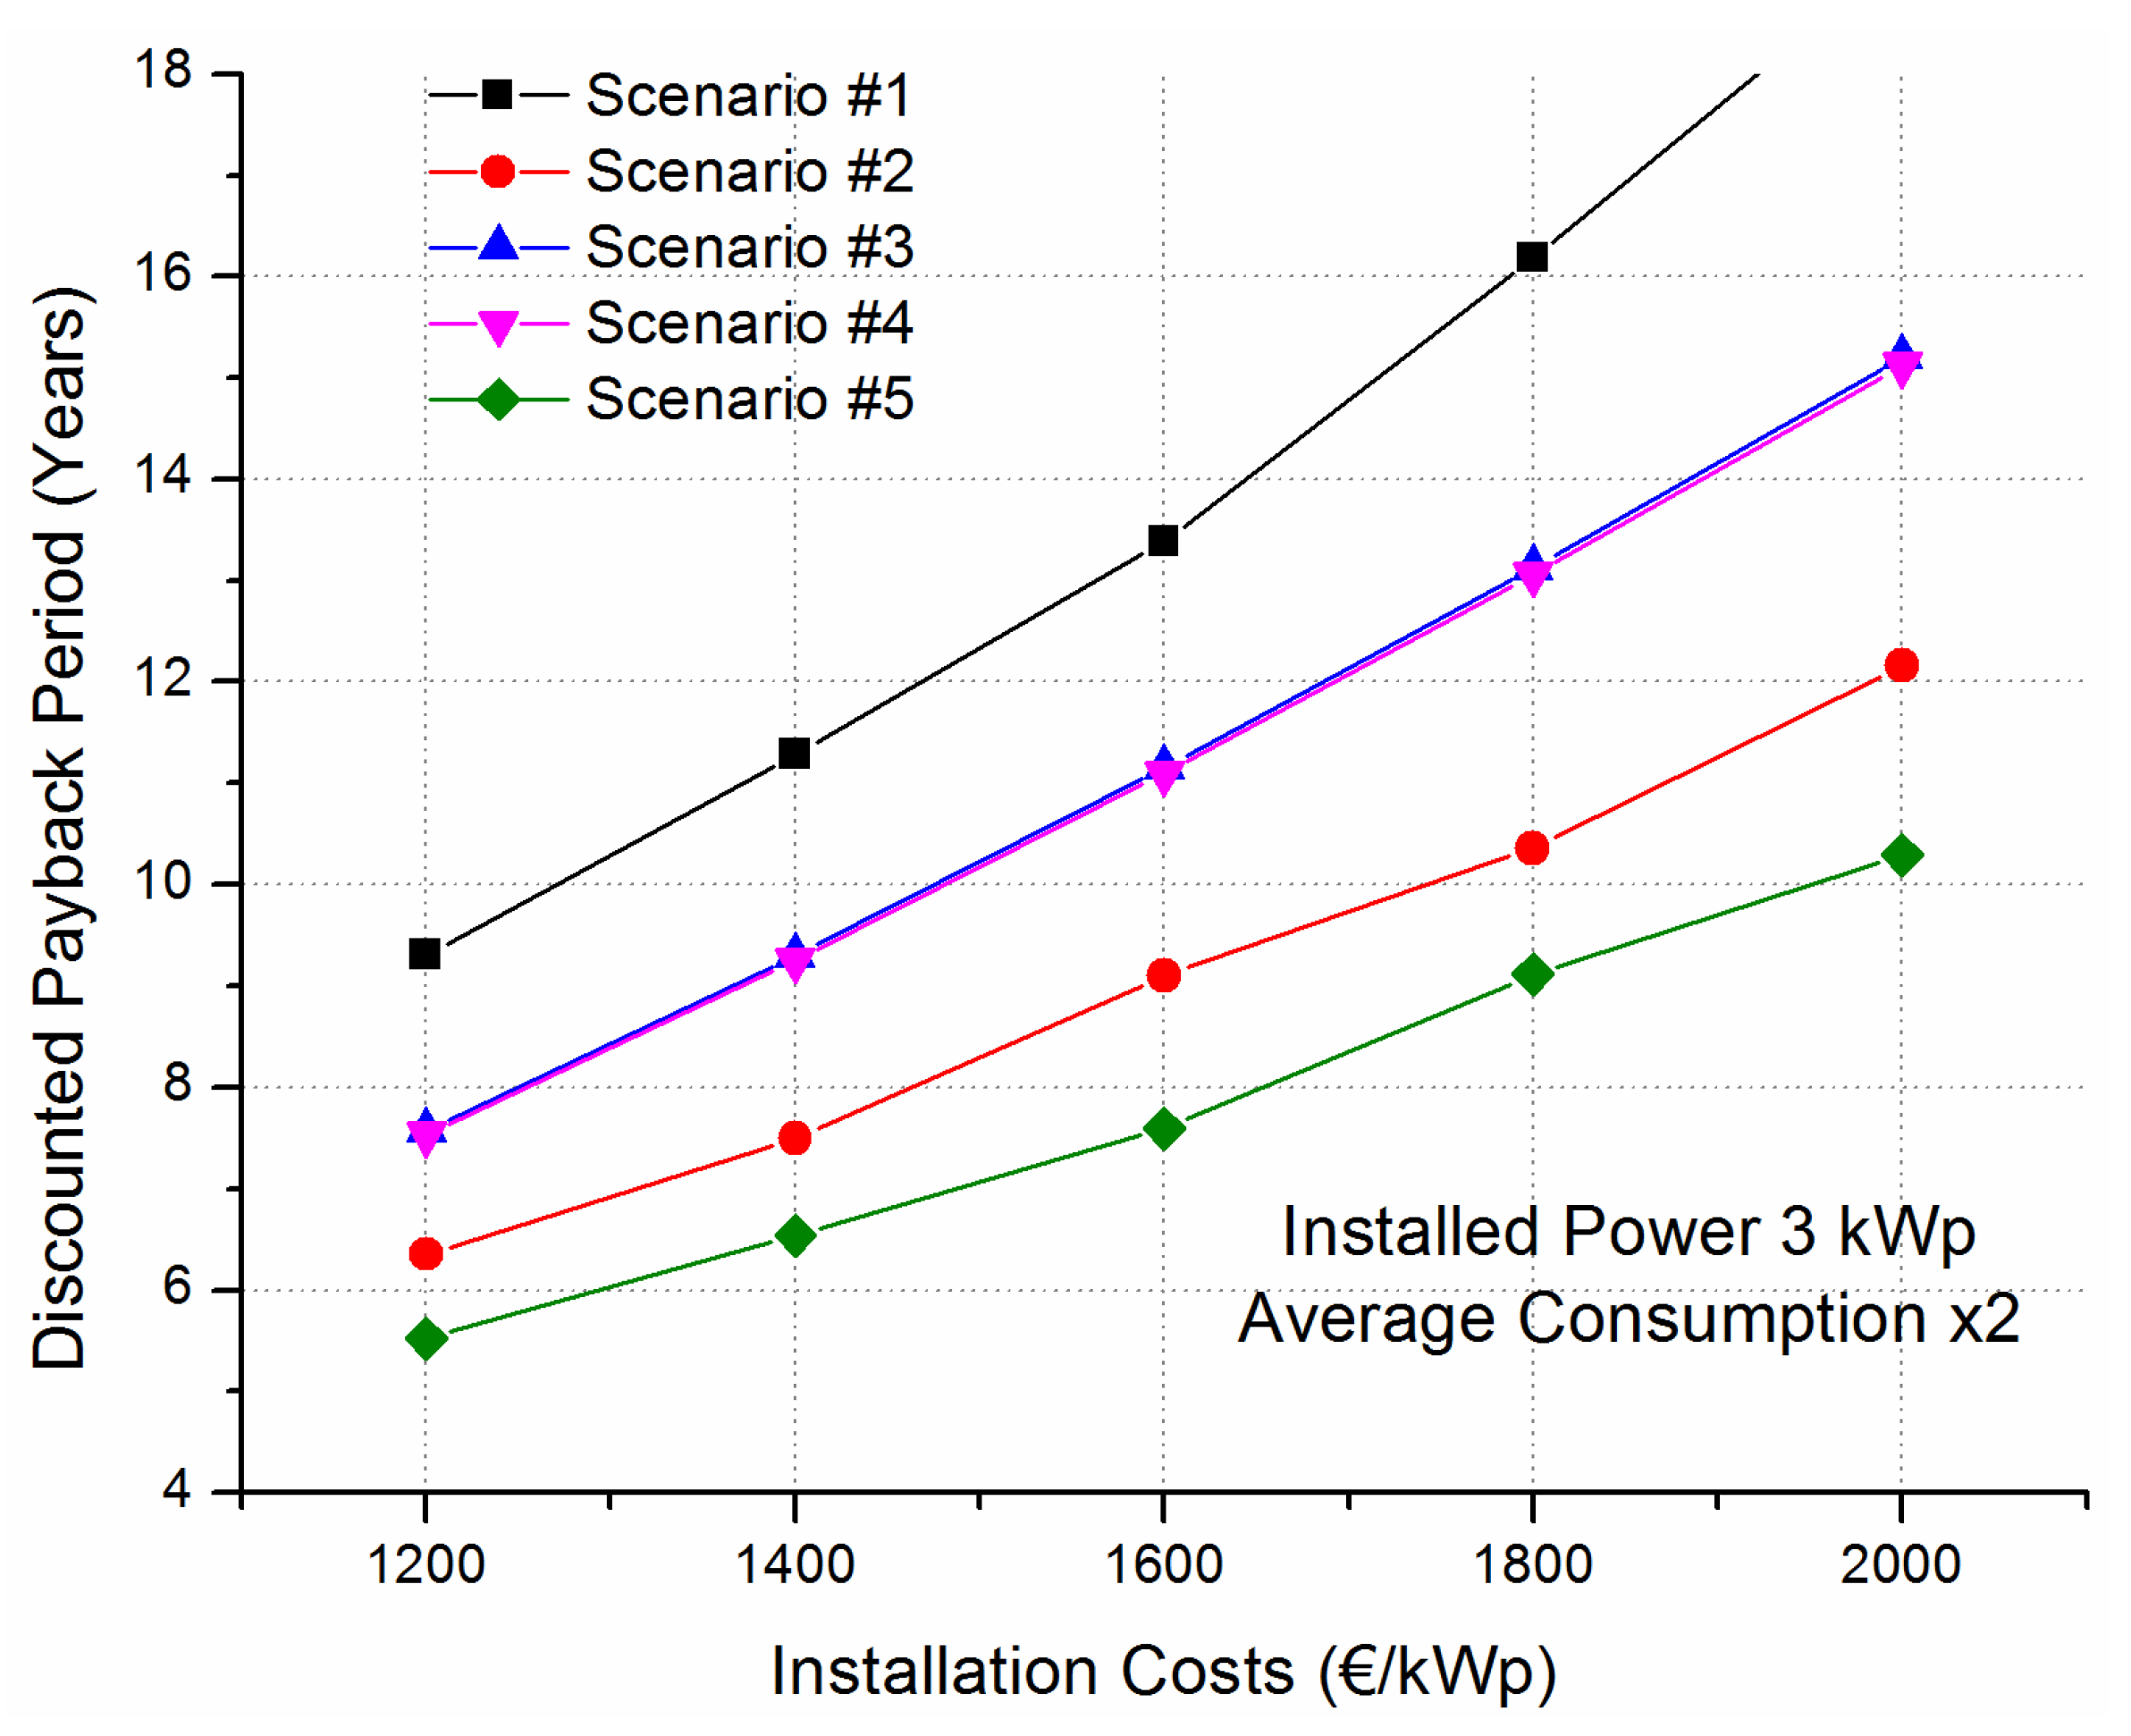
Figure 11 shows the variation of the IRR indicator for all scenarios, under varied installation costs with 200 €/kWp step. Furthermore,
Figure 12 depicts the variation of the DPP indicator using a DR of 5%. In both graphs, the installed PV power is 2 kWp and the consumption is taken as double the average profile of
Figure 6.
The results shown in both
Figure 11 and
Figure 12 indicate the heavy influence of the installation cost on the investment’s attractiveness. Further on, such graphs may be used to dictate a possible policy adaptation to a less favourable one for the prosumer when installation costs decrease, but at the same time keeping the desired investment return.
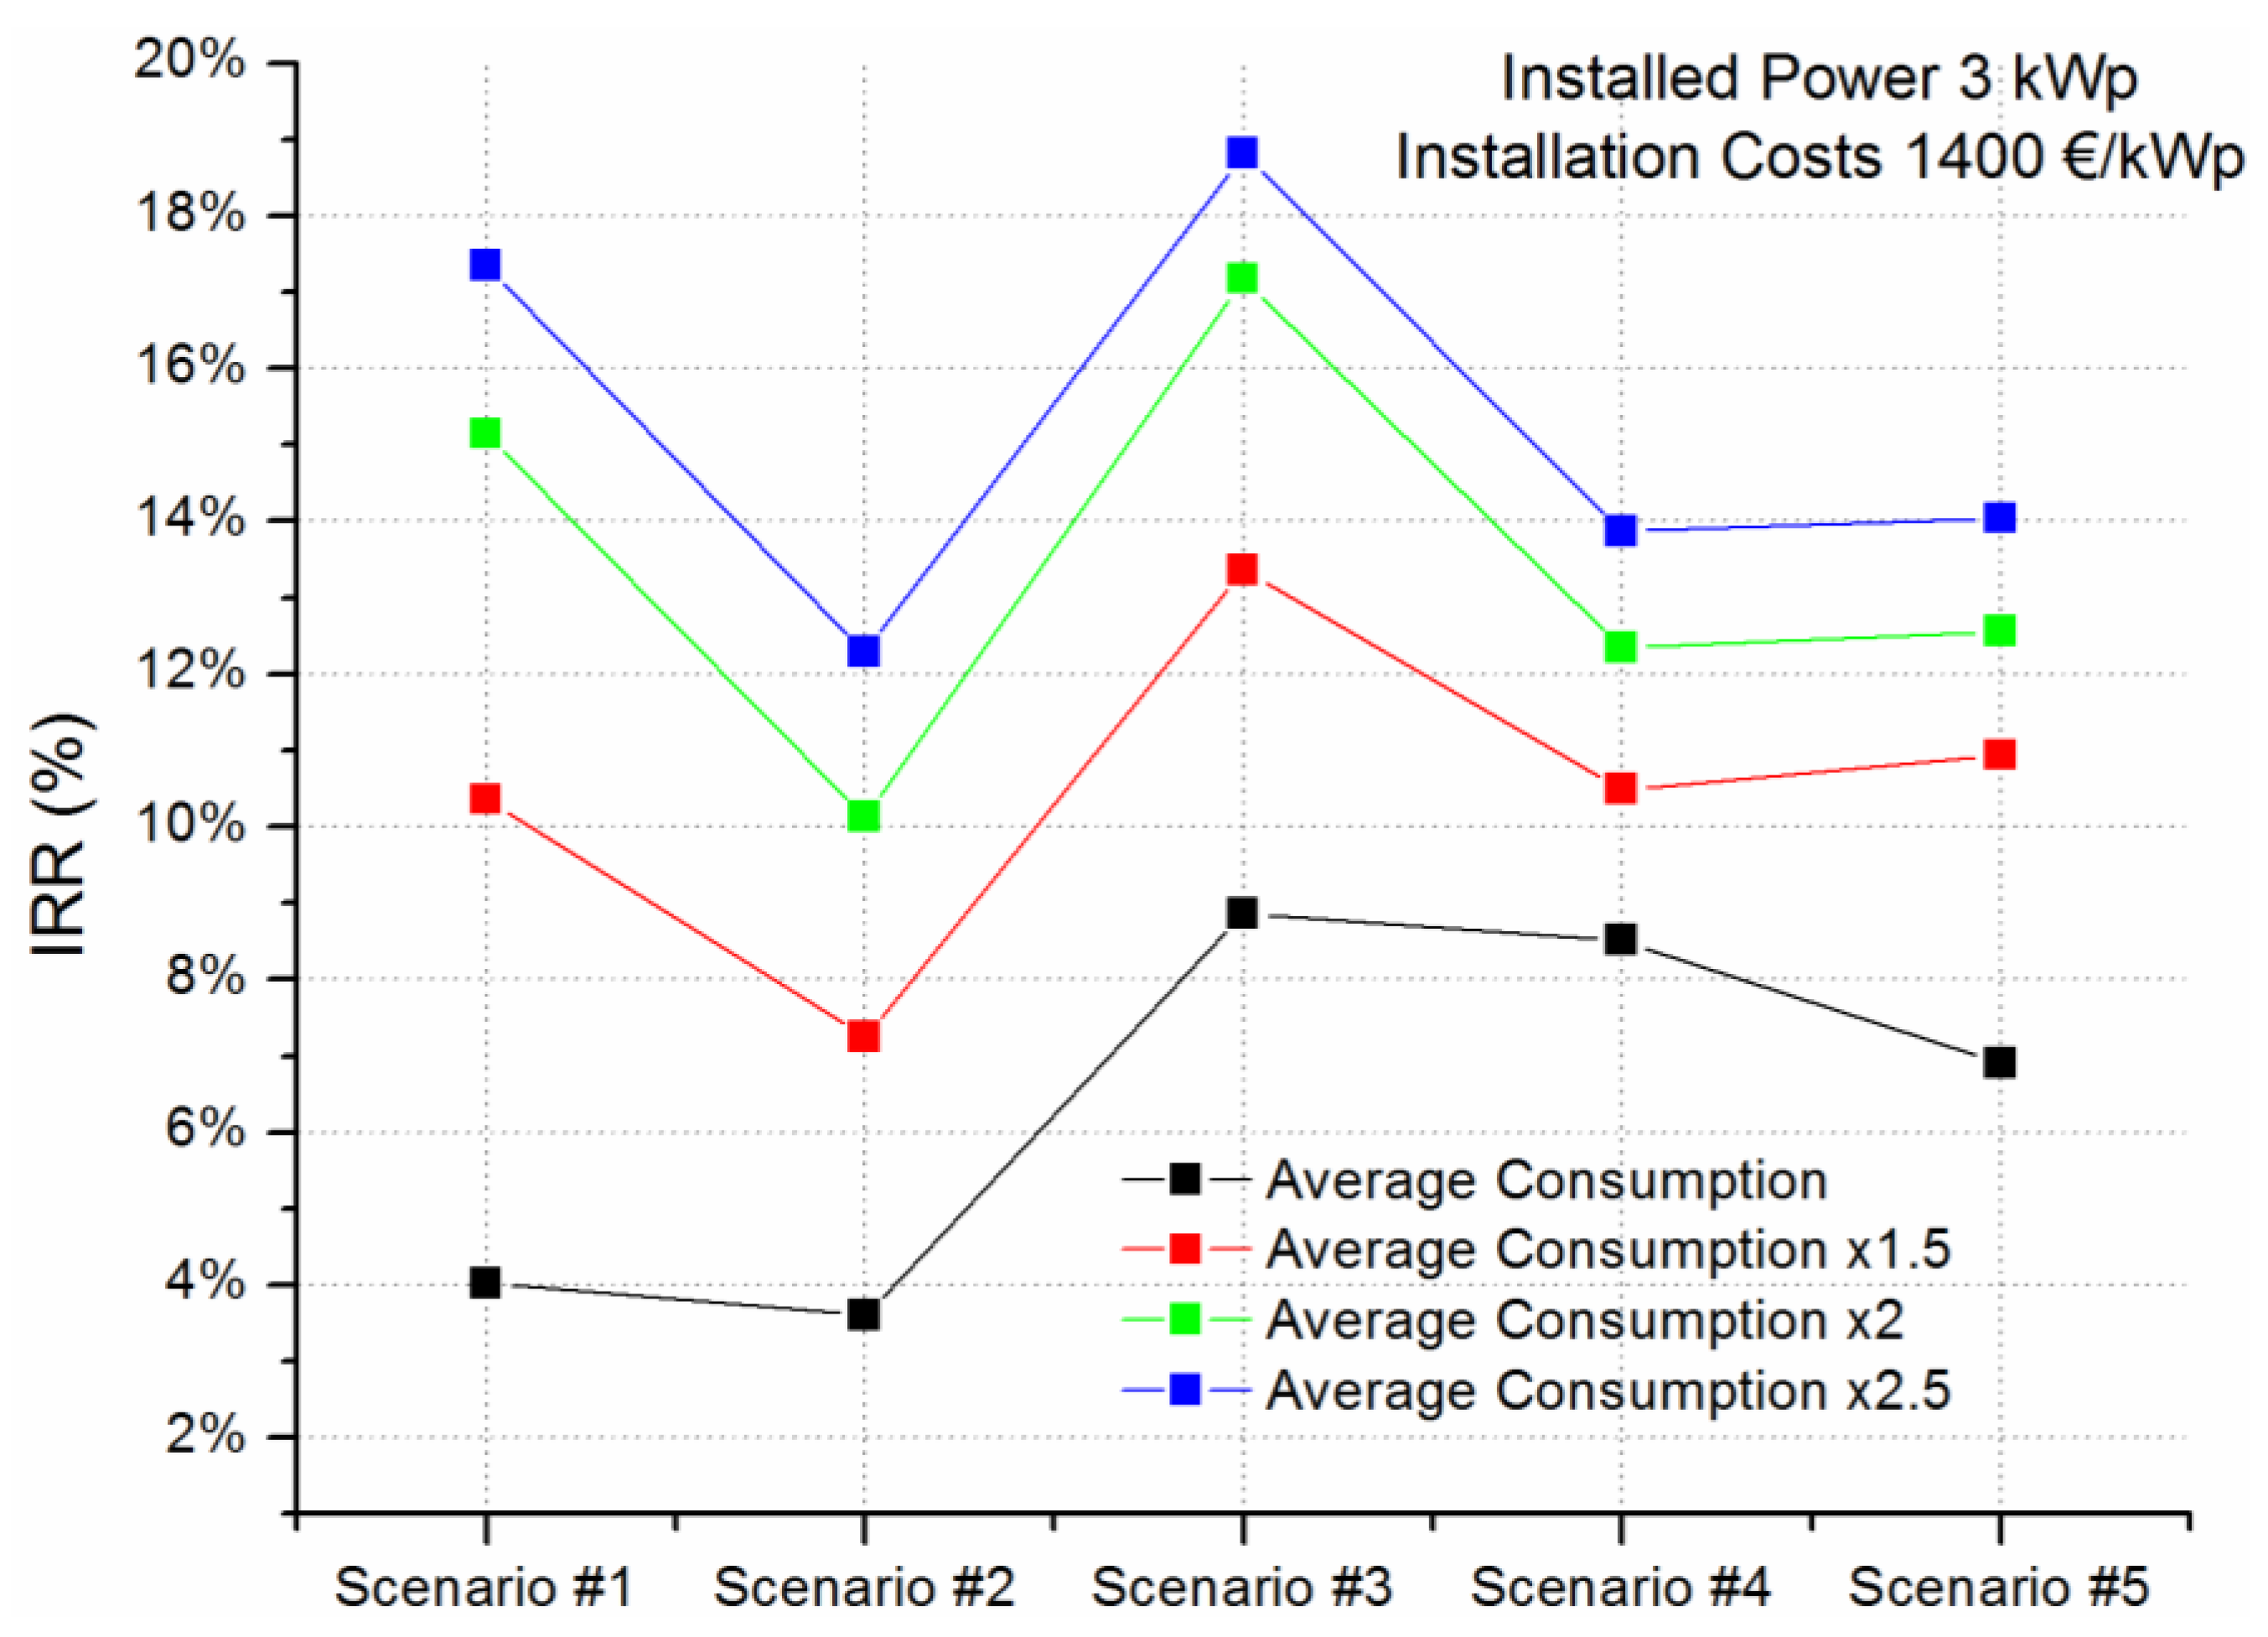
Finally,
Figure 13 shows the influence of the consumption profiles of the prosumer on the IRR indicator, with PV installed capacity of 2 kWp and installation costs at 1400 €/kWp, for each of 5 examined scenarios. As shown in
Table 8, the increased consumption leads to higher netted costs resulting from the higher electricity pricing according to the residential tariff “G1”. Here the conclusions are as expected, i.e., for all investigated scenarios higher consumption leads to increased investment rate of return. Such graphs may be used by policy makers if the aim is to target a certain prosumer consumption profile when designing a NEM policy.
6. Conclusions and Outlook
NEM can be a promising solution, especially for countries like Greece that are in the transition period after the end of an attractive FiT scenario and before the competitive involvement of storage. Various net-meeting policies have been proposed and exist worldwide, without any particular one being the norm. The main result of this paper is, therefore, the formulation of a generalized methodology for assessing variable NEM policies in terms of profitability of the prosumer. In this context, the proposed methodology is capable of investigating the influence of all relevant parameters on the attractiveness of a certain NEM policy.
In order to test this methodology, a case study was formulated that refers to a residential prosumer in the area of Thessaloniki in the northern part of Greece. The scope of the analysis was to evaluate the current NEM policy in Greece, but also to examine alternative policies using as a basis the notion of hourly net-metering, which is a policy close to self-consumption.
Concerning the existing NEM policy, the results presented show that such an investment is not necessarily attractive for all situations. Consideration of both the anticipated consumption and PV production is necessary, in order, for example, to decide on the optimal PV capacity. Important parameters that influence the attractiveness of any NEM policy and the optimally installed power are the installation costs and the consumption of the prosumer.
Furthermore, the decreasing trend in PV system costs may eventually make different policies, such as the hourly net-metering, attractive as well. This is justified in this paper under different installation costs and using as inputs on one hand the average consumption data collected from 31 consumers in the Thessaloniki area for a period of 1 year and, on the other hand, the average System Marginal Prices. It is shown that under certain conditions and lower installation costs, even such a policy that is more favored by DSO’s can be attractive for investors as well, creating a win-win situation.
Undoubtedly, though, in order for a certain policy to be successful, it needs to create a win-win situation between all interested stakeholders and not just prosumers. In this context, a macroeconomic evaluation of NEM and its implications is a challenging topic for future research. The macroeconomic impacts of NEM are country specific; they affect each economy differently. This is strengthened by the fact that NEM is currently not widespread in most countries. For example, NEM can support the PV industry by creating new markets, products, services, and jobs. A possible counter effect will be the decrease of the economic activity of the fossil fuel industry by limiting the need for fossil fuel power due to the implementation of RES technologies such as NEM. However, the aforementioned negative impact depends mainly on the size and the structure of the energy sector of each country. In the retail side, due to the income decrease of the retailer due to the limited electricity sales, the macroeconomic rebound effect will refer to the increase in the electricity rates. This fact may lead to increased costs from a prosumer perspective. Also, the benefits of NEM for the prosumer depend on demographic characteristics. If the prosumer and other electricity consumers not using the NEM mechanism have the same demographic and economic profile, the prosumer may be benefited by the decreased need for electricity purchase.
Summarizing, the macroeconomic impact assessment is a challenging task and depends on the economy of the country and the structure of the energy sector. In order to assess a macroeconomic impact in this level of decisions, NEM implementation should cover a wide range of consumers. As the number of consumers under NEM legislation increases, the influence of the aforementioned decisions becomes more distinguishable.


 ,
, 


