1. Introduction
With the outbreak and spread of the international financial crisis in 2008, the emergence of many issues, such as the reduction of international orders and the frustration of investment and trading confidence, has caused a great negative impact on the real economy of China [
1,
2,
3]. It can be obviously seen from the reduction of external demand, the falling of total import and export, and the decline of economic growth rate, which also led to the reduction of energy consumption [
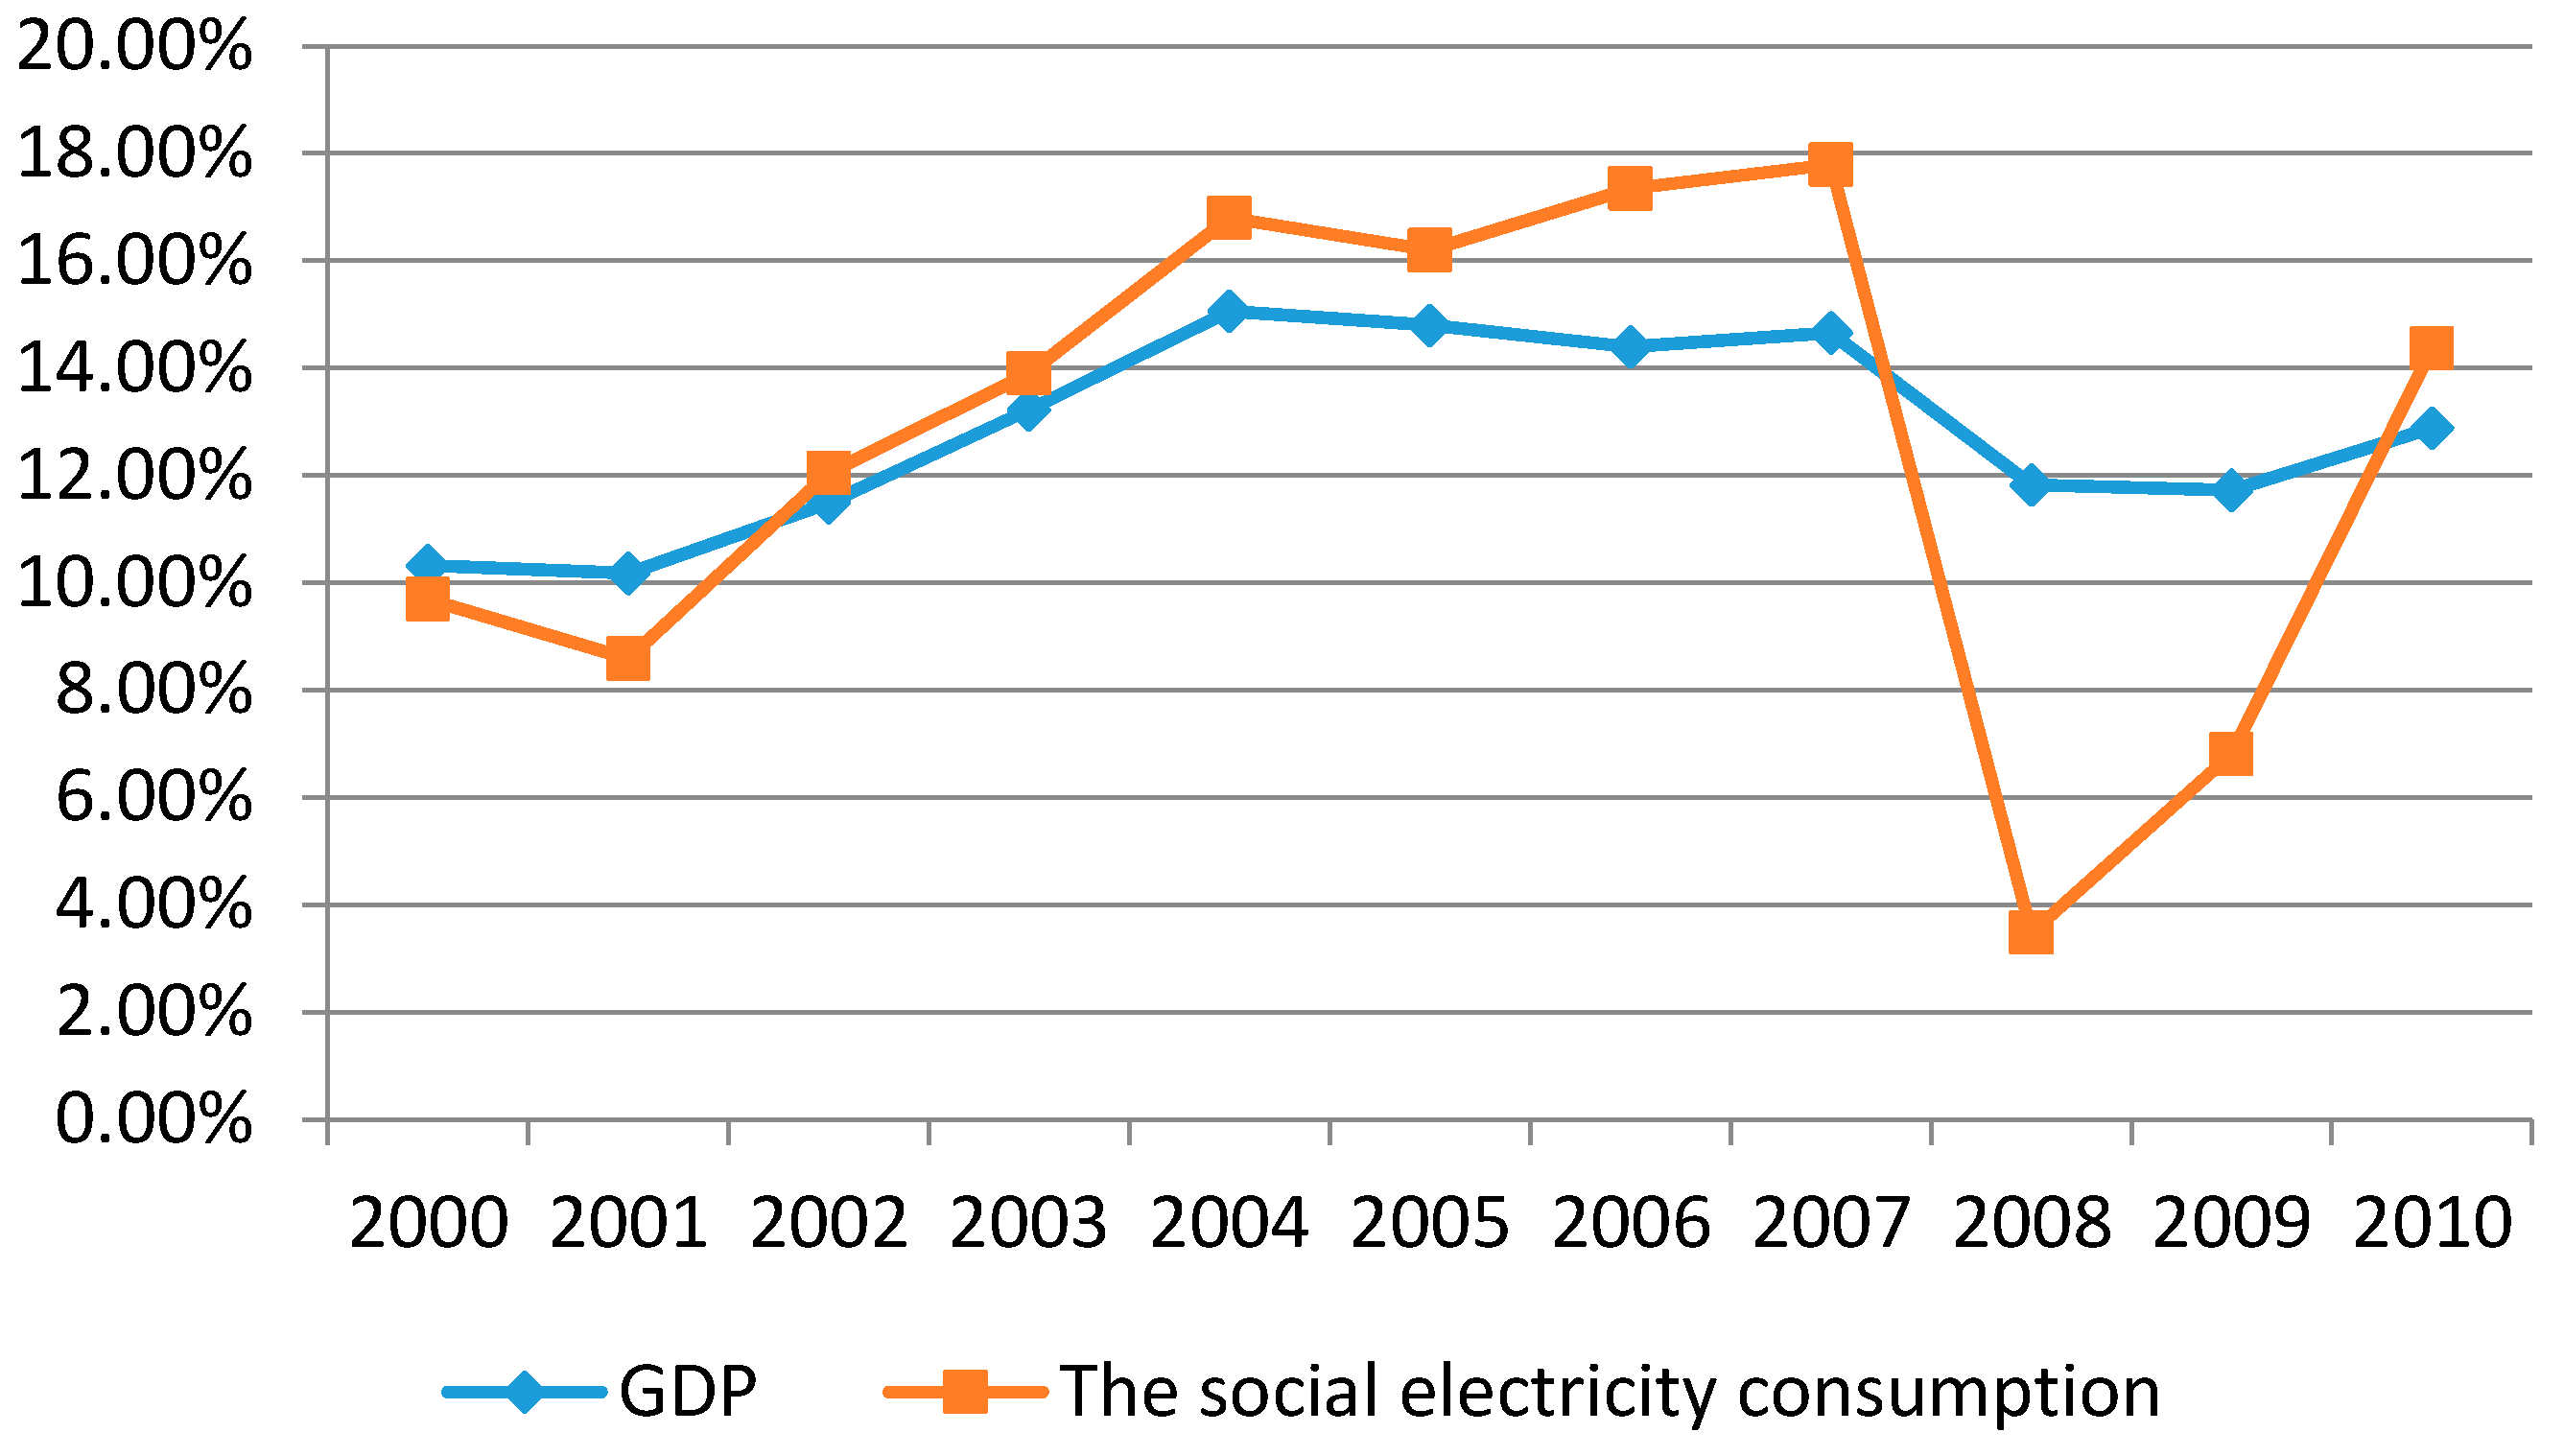
4]. During the Twelfth Five Year Plan period, the proportion of North China’s GDP accounted for 25% of the whole country. The economic growth and electricity demand of North China are affected by the financial crisis to a great extent. As can be seen from
Figure 1, the growth rate of GDP and electricity consumption of North China in 2008 dropped significantly, which were 2.83% and 14.31%, respectively. It also implied that the electricity demand had much greater fluctuation than GDP, which may be more sensitive to the impact of the financial crisis. Therefore, the impulse effect of financial crisis on electricity consumption is studied in this paper.
Modern econometrics considers that if the time series is generated by the non-stable unit root process, it can be decomposed into deterministic trend, periodic trend, and random impact components [
5]. The deterministic trend is that the time series grow stably with time, the periodic trend refers to the periodic change of the time series, and the random impact component is the impulse effect of the stochastic factors that are unpredictable.
To realize data decomposition for the first order differential stationary time series, Beveridge and Nelson firstly proposed the Beveridge-Nelson decomposition method in which they proved that the output data with the first order co-integration features can be decomposed into the sum of the permanent and transitory components. The permanent component especially consists of the deterministic trend and the stochastic trend, and the transitory component has a stationary process with a mean value of zero, namely the periodic component [
5,
6,
7,
8]. Considering that the trend term and periodic term in the Beveridge-Nelson decomposition method were difficult to be effectively calculated under the condition of infinite sum, some scholars have studied and expanded the computation principles of Beveridge-Nelson decomposition. Stock
et al. [
9] extended the linear univariate condition in the Beveridge-Nelson decomposition method to a multivariate condition. Newbold [
10], Arino and Newbold [
11] proposed an effective computation framework for single variables and multi-variables of the Beveridge-Nelson decomposition method, respectively. Beyaert and Medina [
12] extended the multi-variable Beveridge-Nelson decomposition method under the condition of first order co-integration proposed by Arino and Newbold, and drew the conclusion that the Beveridge-Nelson decomposition method was also applied to the VEC (Vector Error Correction) model under stationary conditions. Morley [
13] used the state space method to put forward a generalized computation framework for the Beveridge-Nelson decomposition method, which was suitable for the ARIMA (Auto Regressive Integrated Moving Average Model) time series model including all single variables and vectors. Clarida
et al. [
14] extended the Beveridge-Nelson decomposition method to the nonlinear process of single variables and multi variables. The presence and development of the Beveridge-Nelson decomposition method have caused it to be widely used in analyzing the random impulse effect of economic time series. Typically, Gustavo [
15] employed the Beveridge-Nelson decomposition method to analyze the occurrence of terrorist attacks. Wang
et al. [
16] used the Beveridge-Nelson decomposition method to decompose the trend of GDP in China and obtained some valuable conclusions.
A lot of literature shows that GDP contains deterministic trends, periodic components, and random trends [
16,
17,
18]. As the electricity consumption has a high correlation with GDP [
19,
20,
21,
22,
23,
24,
25], the development trends of them are similar. Therefore, Beveridge-Nelson decomposition technology can also be employed to analyze the growth tendency of electricity consumption. In accordance with the Beveridge-Nelson decomposition method, the electricity consumption of North China can be decomposed into deterministic trends, random impact components, and periodic trends in this paper. The random impact components mainly include international financial crisis, various kinds of natural disasters, and other external uncertainty factors. Within the range of January 2006 and December 2010, which is the data sample investigated in this paper, the external uncertainty factor can mainly be reflected by the international financial crisis in 2008. Therefore, the random impulse effect can effectively represent the impact of international financial crisis on electricity consumption in 2008.
On the basis of this, the Beveridge-Nelson decomposition method is employed to decompose the electricity consumption of the whole society, the secondary industry, and the tertiary industry in North China into deterministic trends, periodic trends and random impact components. Therefore, the impact of the financial crisis on electricity demand can be determined through analyzing the changes of the random impact components. With the aim of further analyzing the influence of financial crisis on electricity consumption in different provinces of the North China region, the Beveridge-Nelson decomposition method is also employed to decompose the monthly electricity consumption data of the whole society, the secondary industry, and the service sector of six provinces in the North China region, which are Beijing, Tianjin, Hebei, Shanxi, Shandong, and Inner Mongolia from January 2006 to December. 2010. Meanwhile, the decomposition results will be comparatively analyzed.
The remainder of this study is as follows. The basic theory of Beveridge-Nelson decomposition process is introduced in
Section 2.
Section 3 illustrates the characteristics of electricity consumption in North China and analyzes the decomposition results of electricity demand. A comparative analysis of the impact effect of electricity demand in six provinces of North China is given in
Section 4.
Section 5 draws the conclusions and puts forward some policy implications.
2. Beveridge-Nelson Decomposition Method
In accordance with the Beveridge-Nelson decomposition method and its computational framework, it is necessary to determine whether the time series is first order stationary before data decomposition. Under the condition that the time series satisfies the first order difference, the concrete steps of the Beveridge-Nelson decomposition method are as follows.
Set the natural logarithm value of the electricity consumption in North China as ln
Q under the first order stationary condition according to the Wold theorem:
where
,
Qt is the electricity consumption at time
t, μ is the long term mean of
, ε
t~
(
i.i.d. means independently and identically distribute),
t represents time period, and λ
i is the coefficient. The expected value of Equation (1) is:
where
E means the calculation process of expected value of each variable.
As
is the natural logarithm value of electricity consumption, its first order difference is the growth rate of electricity consumption. According to Equation (2), the mean value of the growth rate of electricity consumption is long-term growth rate. On the basis of the Beveridge-Nelson decomposition theorem, the deterministic trend term
DTt can be decomposed as:
where
DTt is the deterministic trend term at time
t, and ln
Q0 is the initial value of the natural logarithm value of electricity consumption.
Additionally, ln
Qt is defined as the forecast value based on the information of current period. Morley [
15] pointed out that this time series can be most accurately predicted by employing a stationary univariate AR (Auto Regressive) Equation (1) model for its first differences [
16], namely:
where
φ can be obtained by AR Equation (1) model, and
. By taking into account the implied Wold form from AR Equation (1) model, under the assumption of normality, the minimum mean squared error (MMSE) of
j-period ahead prediction of the first difference of Δln
Qt is:
In accordance with the decomposition definition of Beveridge and Nelson [
4],
Tt, the total trend term of time series, is defined as the MMSE prediction of the long-run level of the series. It is equivalent to the present level of the series plus the infinite sum of the MMSE of
j-period ahead first difference forecasts:
where
Tt represents the total trend term of time series.
Thus, substituting Equation (5) into (6), and using the infinite summation formula of geometric progression, the total trend term of ln
Qt for the case AR Equation (1) can be obtained, namely:
Meanwhile, the periodic term of ln
Qt can be decomposed as:
where
Ct represents the periodic trend term at time
t.
The random impulse term can be calculated with the Equations (3), (7) and (8):
where
STt represents the random trend term at time
t.
Therefore, the deterministic trend term, the periodic term, and the random impulse term of electricity consumption in North China during January 2006 and December 2010 can be obtained according to the above calculation steps.
3. Beveridge-Nelson Decomposition of Electricity Consumption in North China
3.1. Characteristics of Electricity Consumption in North China
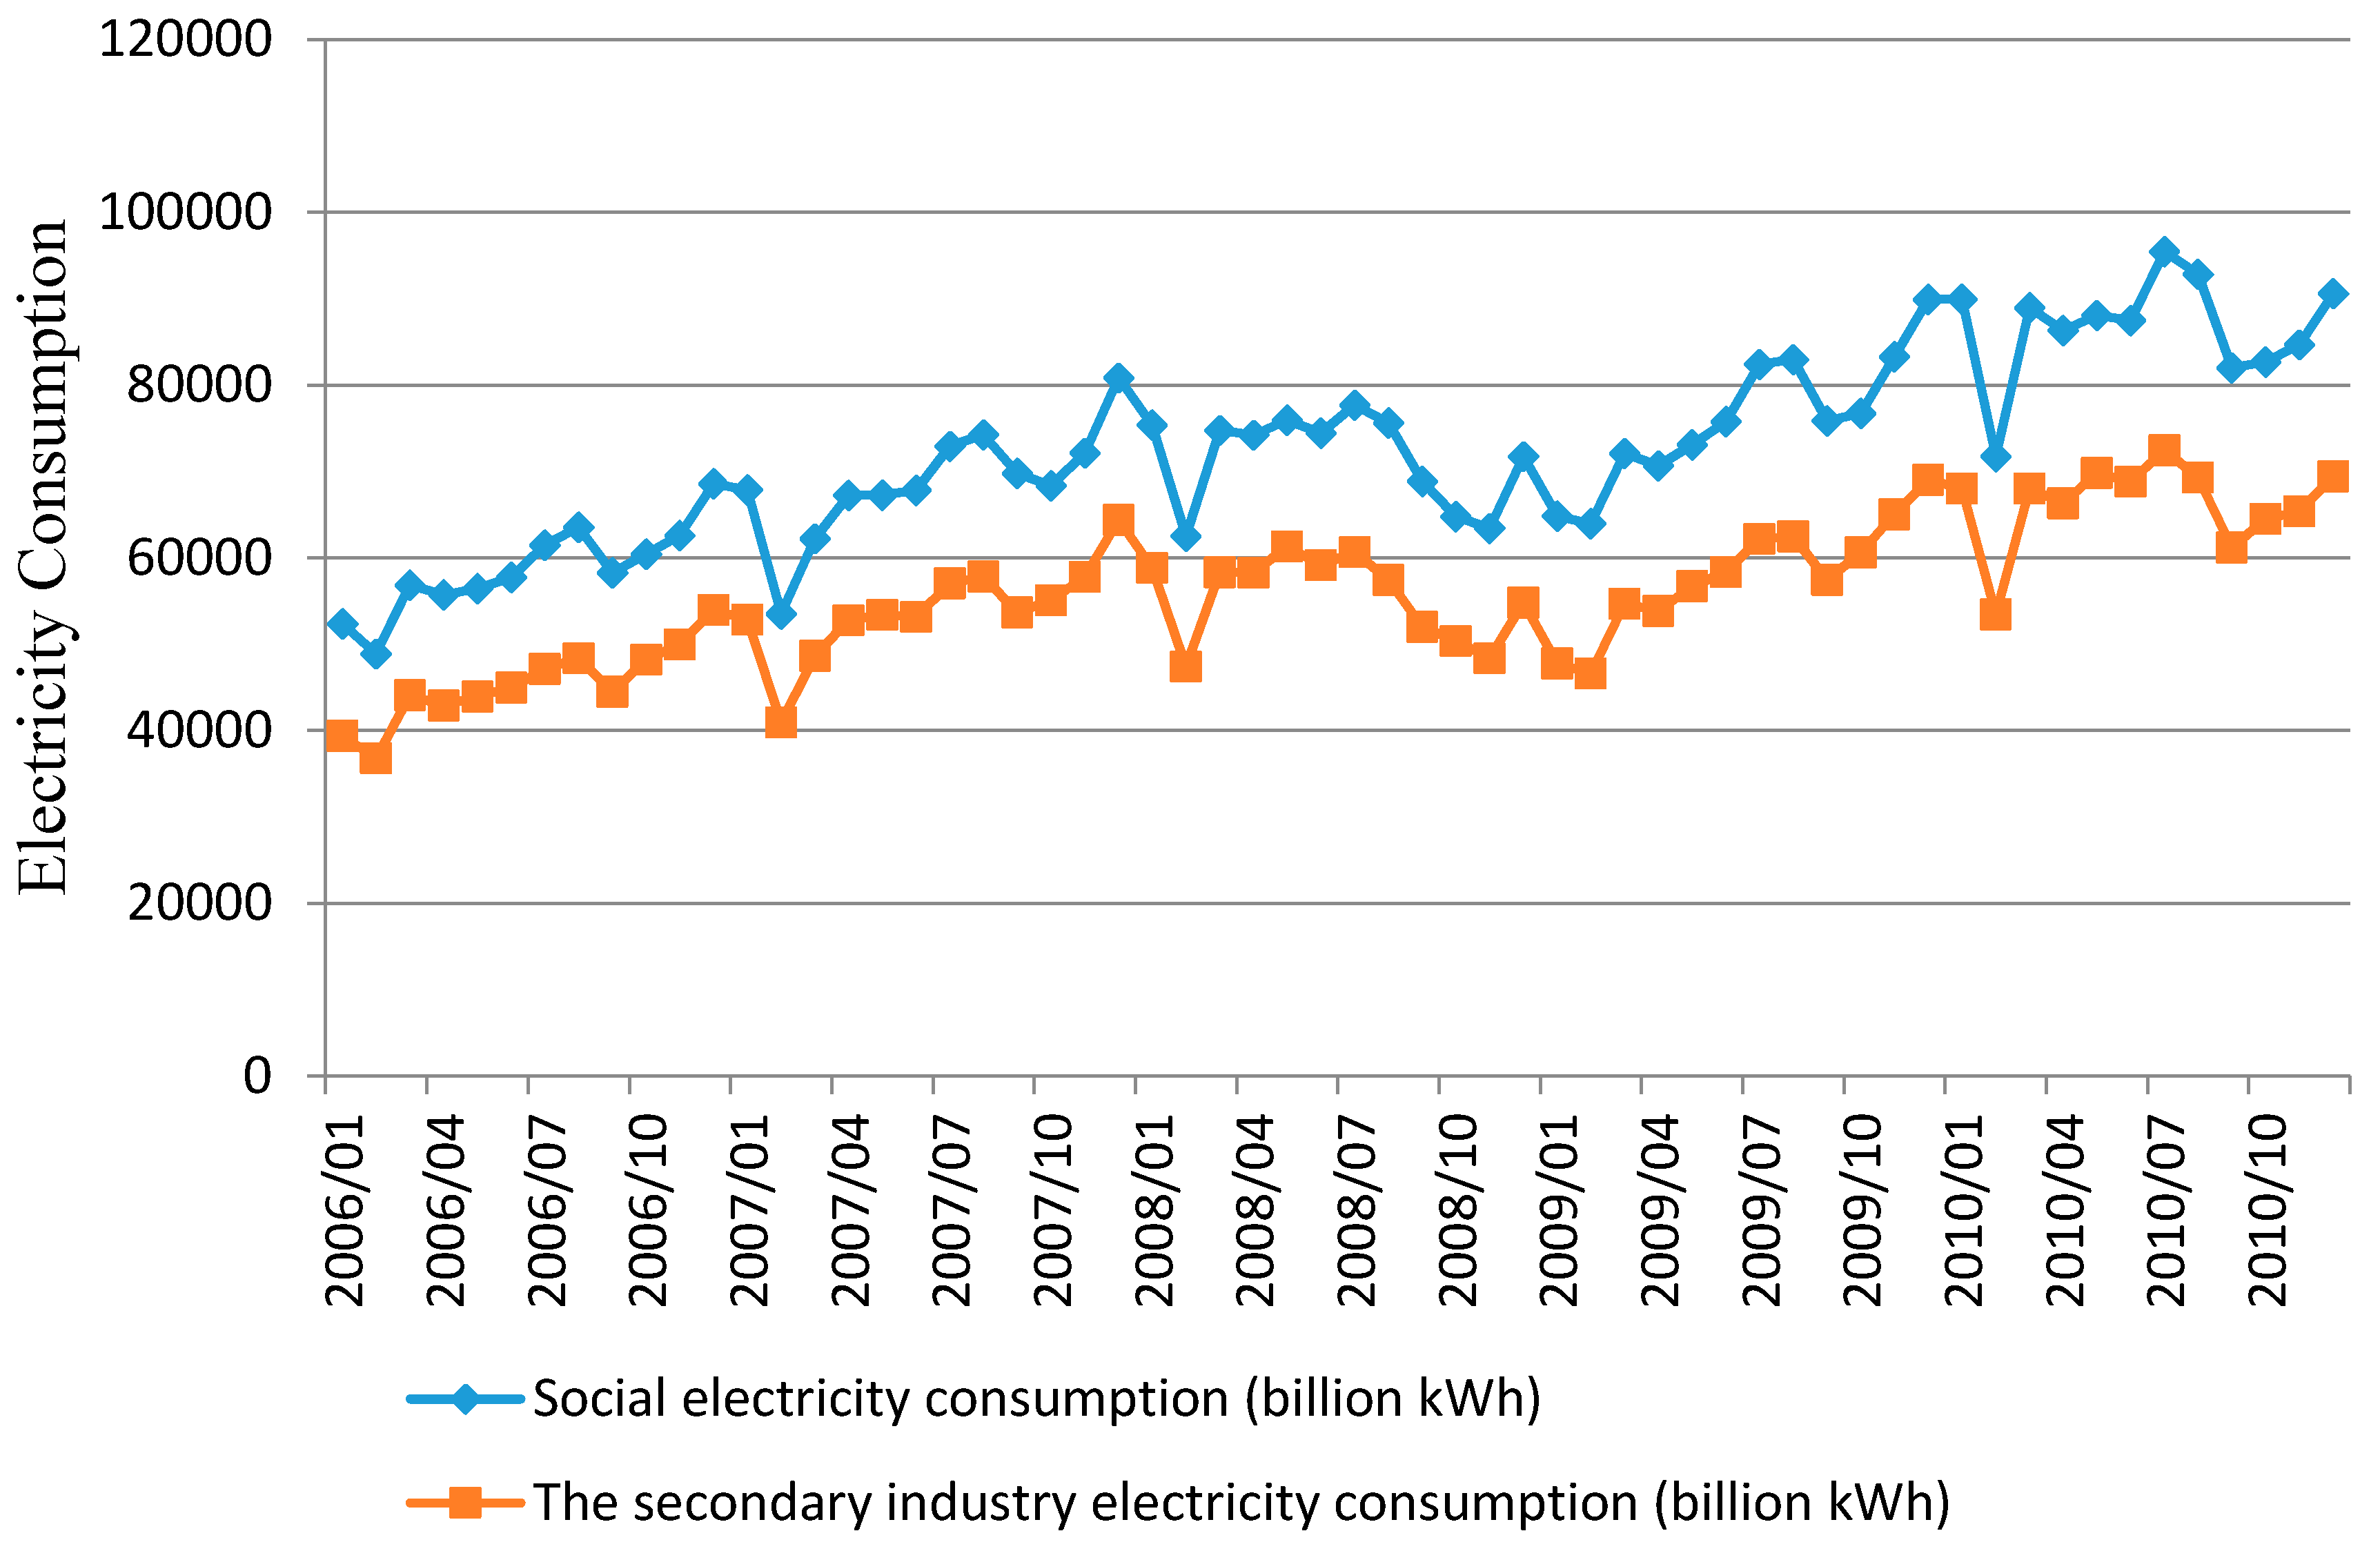
As can be seen from
Figure 2, the electricity consumption growth trends of the secondary industry and the whole society were much more consistent, which presented the fluctuating and ascending trend between January 2006 and December 2010. However, from the second half of 2008, the electricity consumption of the whole society and the secondary industry dropped sharply, and the level of electricity demand suffered downturns for nearly one year, which indicated that there may exist not only a deterministic growth trend, but also the impulse of the international financial crisis. As illustrated in
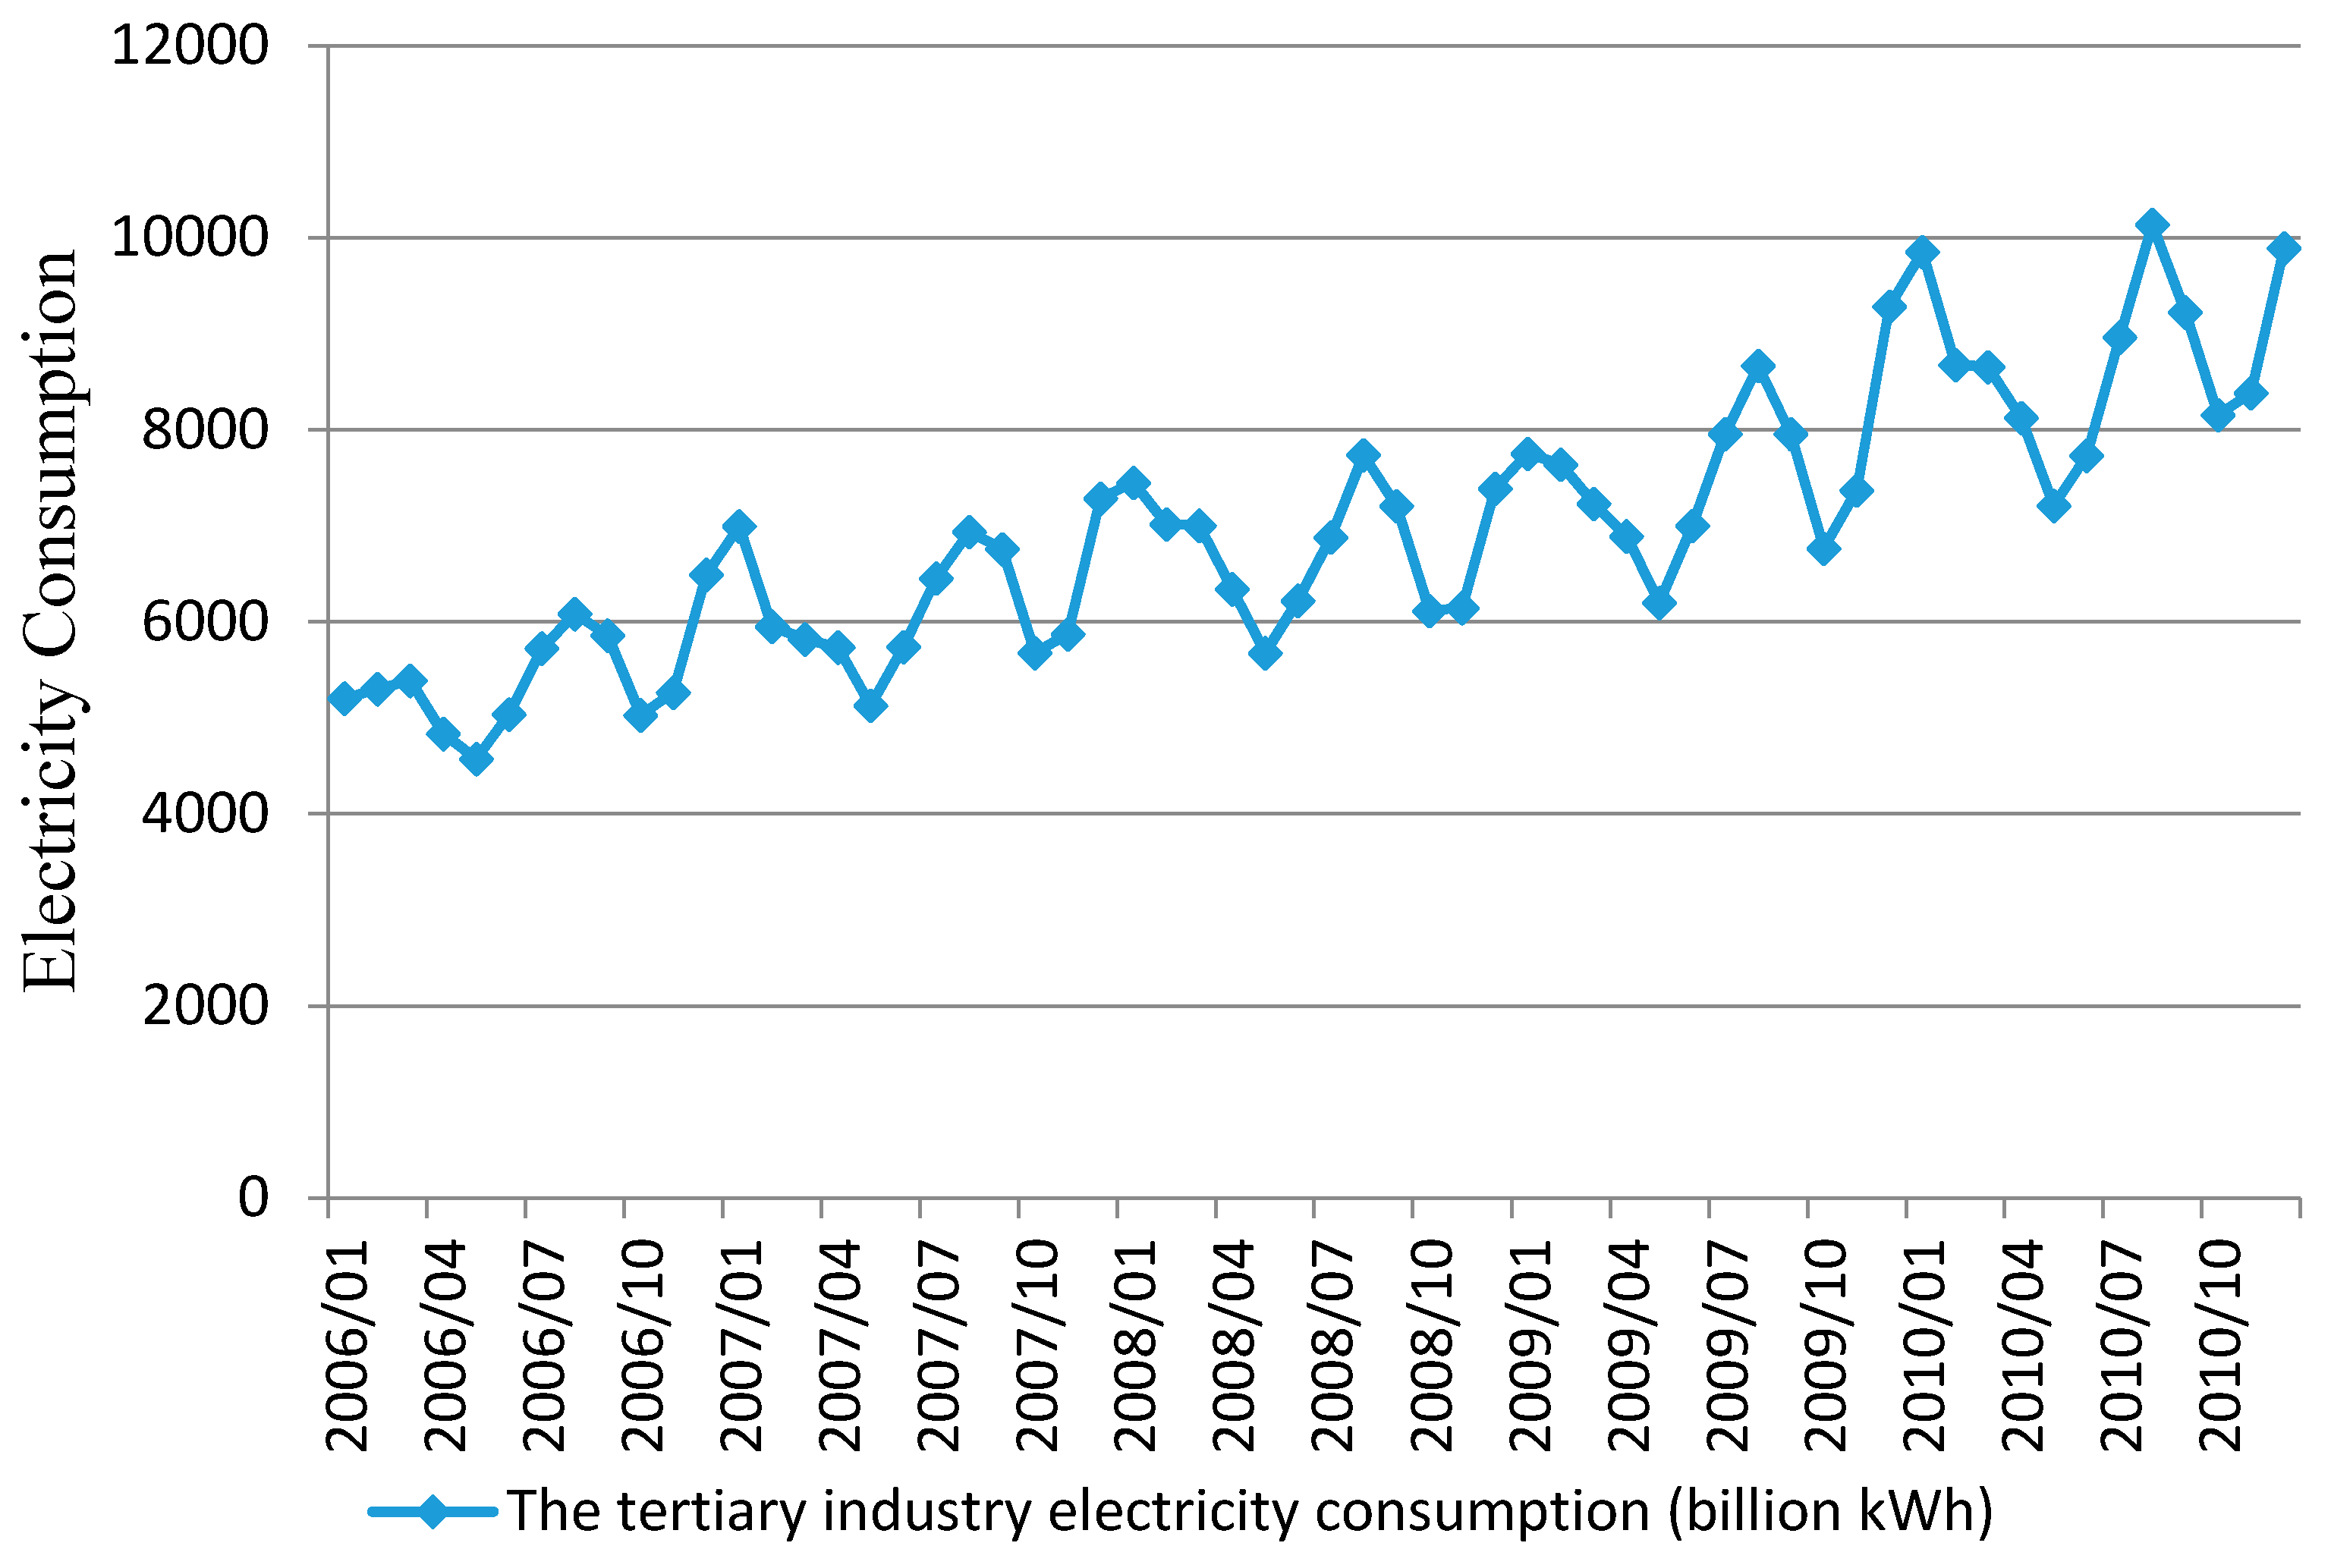
Figure 3, the electricity demand of the service sector was mainly affected by the seasonal factors, which showed a cyclical fluctuation in growth, while the international financial crisis had less effect on it.
With the aim of analyzing the impact of the financial crisis on the electricity consumption of the whole society, the secondary industry, and the service sector, the Beveridge-Nelson decomposition method is employed to comparatively analyze the deterministic trend, periodic component, and the random trend. According to the basic principles of the Beveridge-Nelson decomposition method, we firstly need to examine whether the logarithmic sequence of these three time series are generated by I (1) (first order co-integration ) process, and ADF (Augmented Dickey-Fuller) method is used to carry out the unit root test. From the test results listed in
Table 1, the time series of the electricity consumption of the whole society, the secondary industry, and the service sector are the first order co-integration, which satisfy the requirement of the Beveridge-Nelson decomposition method that the time series is I (1). Under the condition of first order co-integration, the Beveridge-Nelson decomposition method is the best method for the economic time series [
6]. Therefore, Equations (3), (8), and (9) are used to decompose these three time series, and then the deterministic trend, periodic component, and random trend can be obtained.
3.2. Decomposition Results of Electricity Consumption in North China
Based on the Beveridge-Nelson decomposition method, the decomposition results of electricity consumption of the whole society, the secondary industry, and the service sector can be obtained as follows. The decomposition results of electricity consumption of the whole society and the secondary industry from January 2008 to December 2009 are shown in
Table 2 and
Table 3.
(1) The electricity consumption growths of the whole society and the secondary industry in North China were mainly influenced by the deterministic trend between 2006 and 2010. In spite of the negative impact of the international financial crisis, the electricity demand still sustained a low-speed growth.
Since 2006, the monthly growth rates of the whole society and the secondary industry electricity consumption were, respectively, 1.31% and 1.42%, and the growth rates of deterministic trend were 0.93% and 0.96%, respectively. As can be seen from the decomposition results, the impact of the financial crisis on the electricity consumption of the whole society and the secondary industry began to manifest clearly from July 2008, and gradually weakened in June 2009. From the perspective of data decomposition, although the electricity consumption of North China was influenced by various kinds of external uncertainty factors, such as economic development and natural environment, the growth of the deterministic trend which was the major driving force of the electricity consumption growth made the electricity demand maintain superior anti-interference ability.
Since the second half of 2008, the electricity consumption of the whole society and the secondary industry had negative growth under the impact of financial crisis. From July 2008 to June 2009, the growth rate of deterministic trend were 1.31% and 0.96%, respectively, while the growth rate of electricity consumption of the whole society and the secondary industry were 0.39% and 0.23%, respectively. Precisely due to the existence of the high growth rate of the deterministic trend, the electricity consumption of the whole society and the secondary industry can still achieve positive growth at low speed.
(2) During the period of financial crisis, the electricity consumption of the whole society and the secondary industry were under great negative shocks, and the random impact of the secondary industry was more intense.
Owing to the existence of random shocks, the value of the deterministic trend may be greater or less than that of the whole society, which means the proportion of the deterministic trend in the electricity consumption may be greater or less than 100%. When the proportion is greater than 100%, it indicates the electricity demand is under negative random impact which will decrease the growth of electricity consumption. When the proportion is less than 100%, it indicates the electricity demand is under positive random impact which is conducive to the growth of electricity demand.
From January 2006 to September 2008, the proportion of deterministic trend of the whole society and the secondary industry were both less than 100%, which indicates that the random impact contributes to the electricity consumption growth. From September 2008, the proportion of deterministic trend of the whole society and the secondary industry were both greater than 100%, which implies that the financial crisis reduces the demand for electricity.
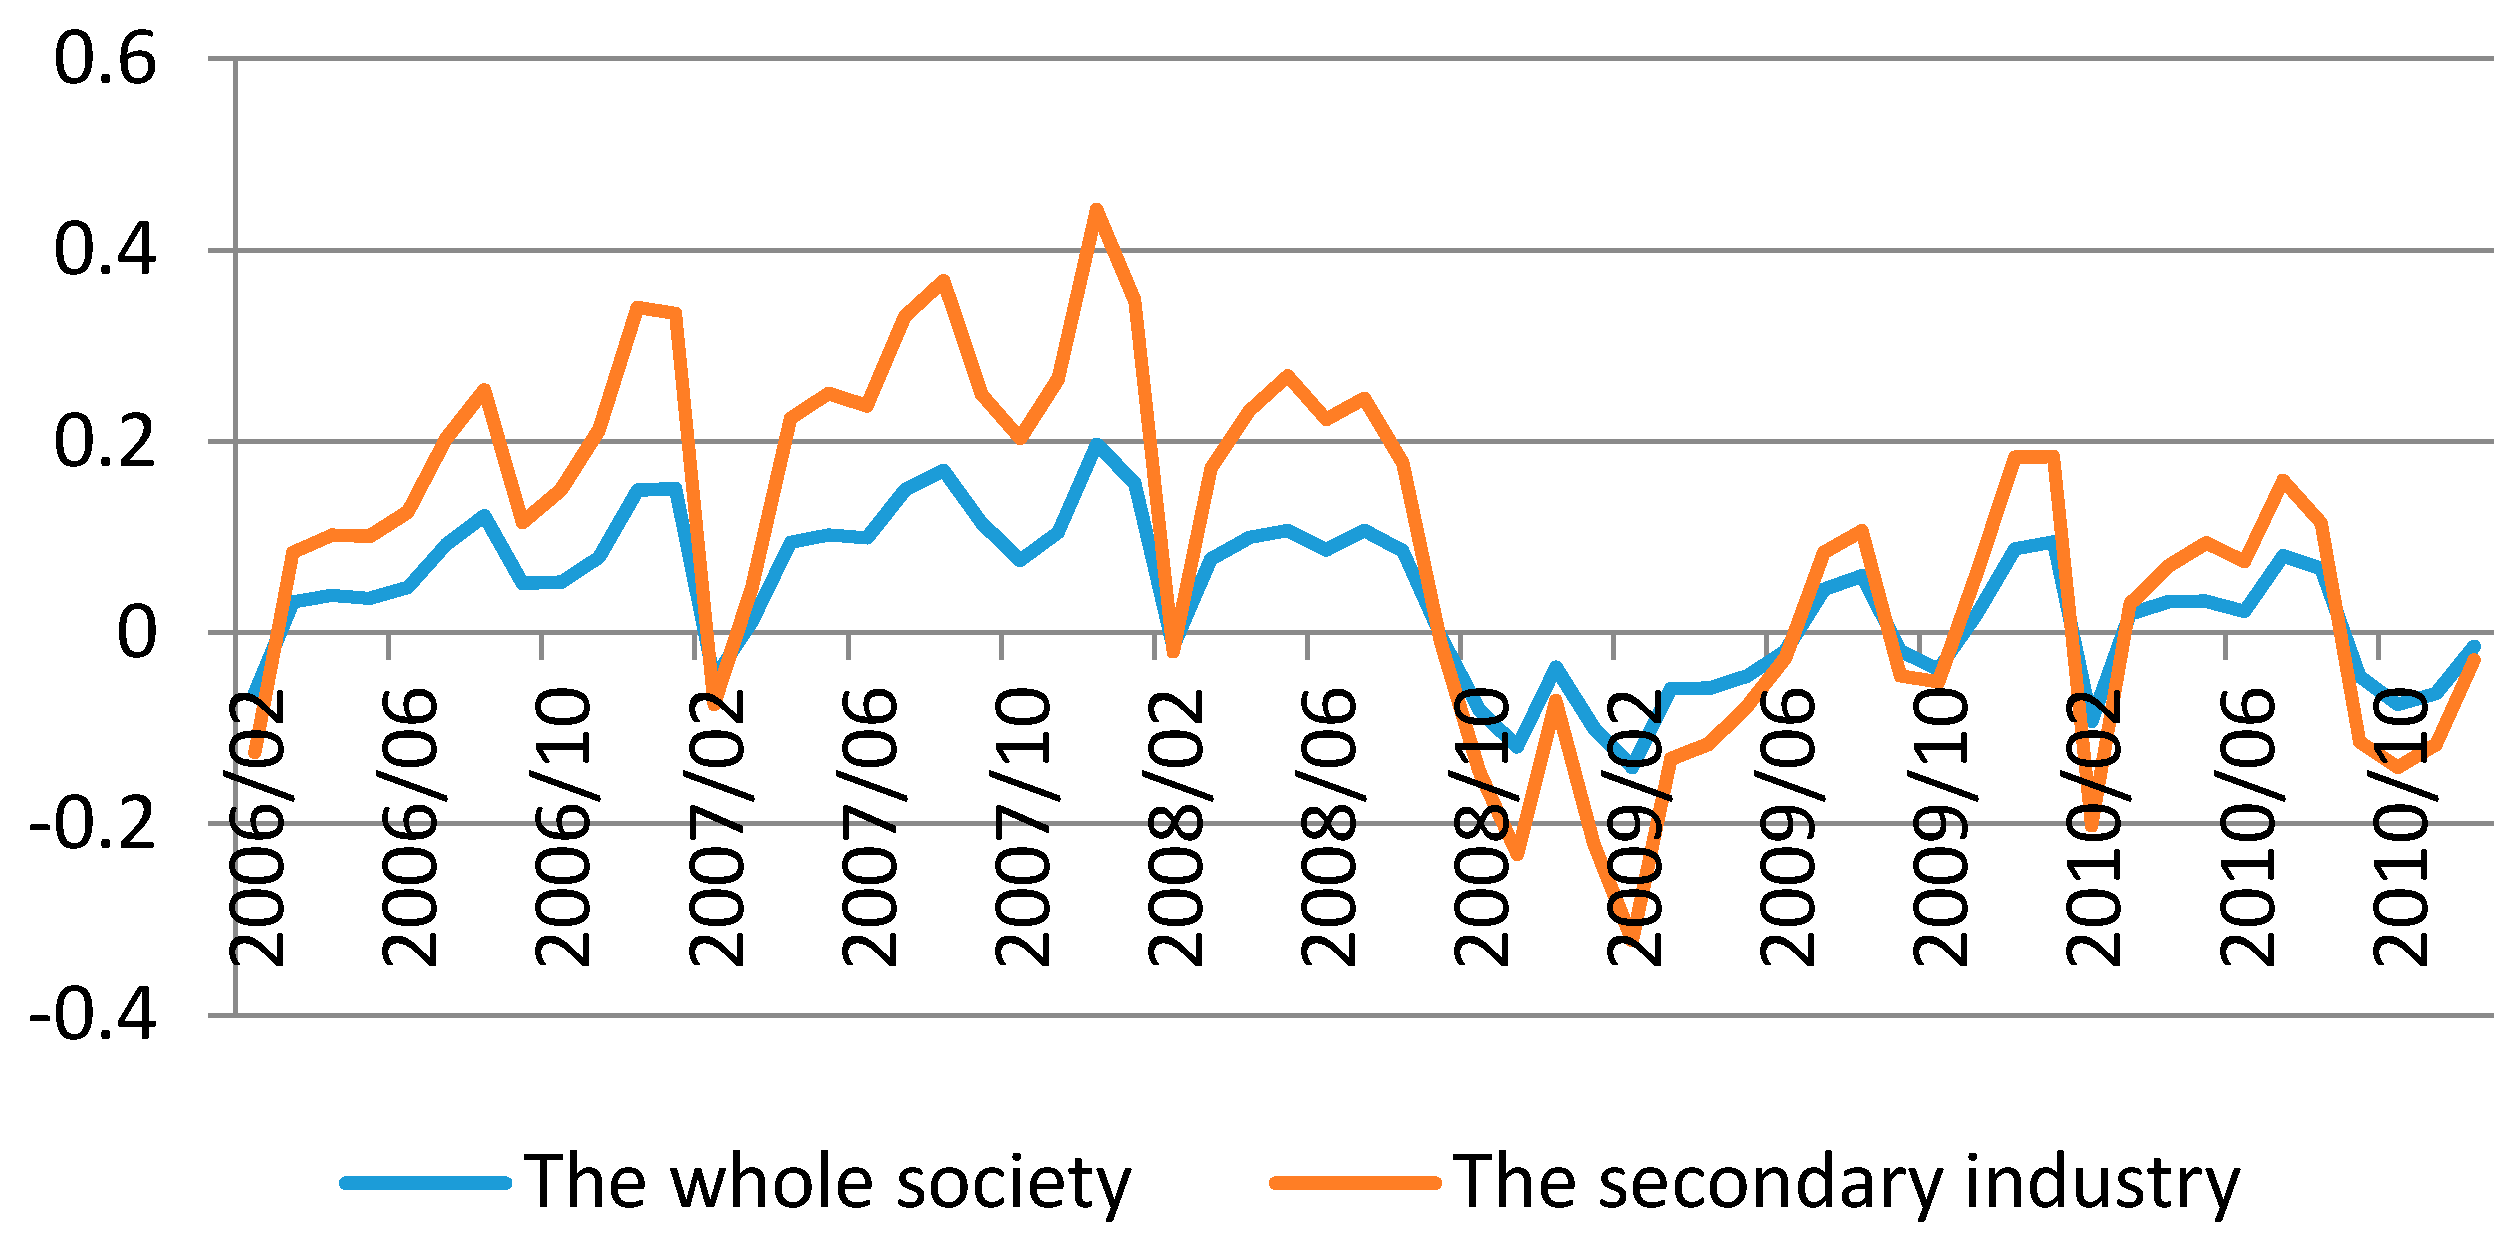
As can be seen from
Figure 4, from 2006 to the first half of 2008, although the random impacts of the whole society and the secondary industry showed large fluctuations, most of the values were above 0, and the average value were 0.082 and 0.114, respectively, and the proportion were 0.52% and 0.73%, respectively. It states clearly that the random impacts on the electricity consumption of the whole society and the secondary industry are positive and are conduced to the growth of electricity demand. However, from September 2008, the random impacts of the whole society and the secondary industry appeared to be negative values. For example, in February 2009, the values were −0.141 and −0.181, respectively, and the proportions were −0.898% and −1.179%, respectively. These imply that the financial crisis makes the electricity consumption of the whole society and the secondary industry decrease by 569.53 million and 570.08 million kWh, respectively. Overall, in the period of July 2008 to June 2009, the electricity demands of the whole society and the secondary industry in North China went through greatly negative shocks brought by the financial crisis. Specifically, the monthly average impulse values of the whole society and the secondary industry were, respectively, −0.0389 and −0.3838, and the proportions were, respectively, −0.247% and −0.248%, which indicate that the electricity consumption reduced by 173.41 million and 132.58 million kWh, respectively. Therefore, the electricity consumption of the whole society and the secondary industry experienced great negative shocks, and the random impact of the secondary industry was more intense.
With the recovery of the economy, the demand for electricity in North China was gradually getting rid of the impact of the financial crisis. From March 2009, the negative impacts of financial crisis on the whole society and the secondary industry reduced slightly. Specifically, the random impact value of social electricity consumption declined from −0.1407 in February 2009 to −0.0188 in June 2009, and the proportion dropped from −0.8979% to −0.1189%.
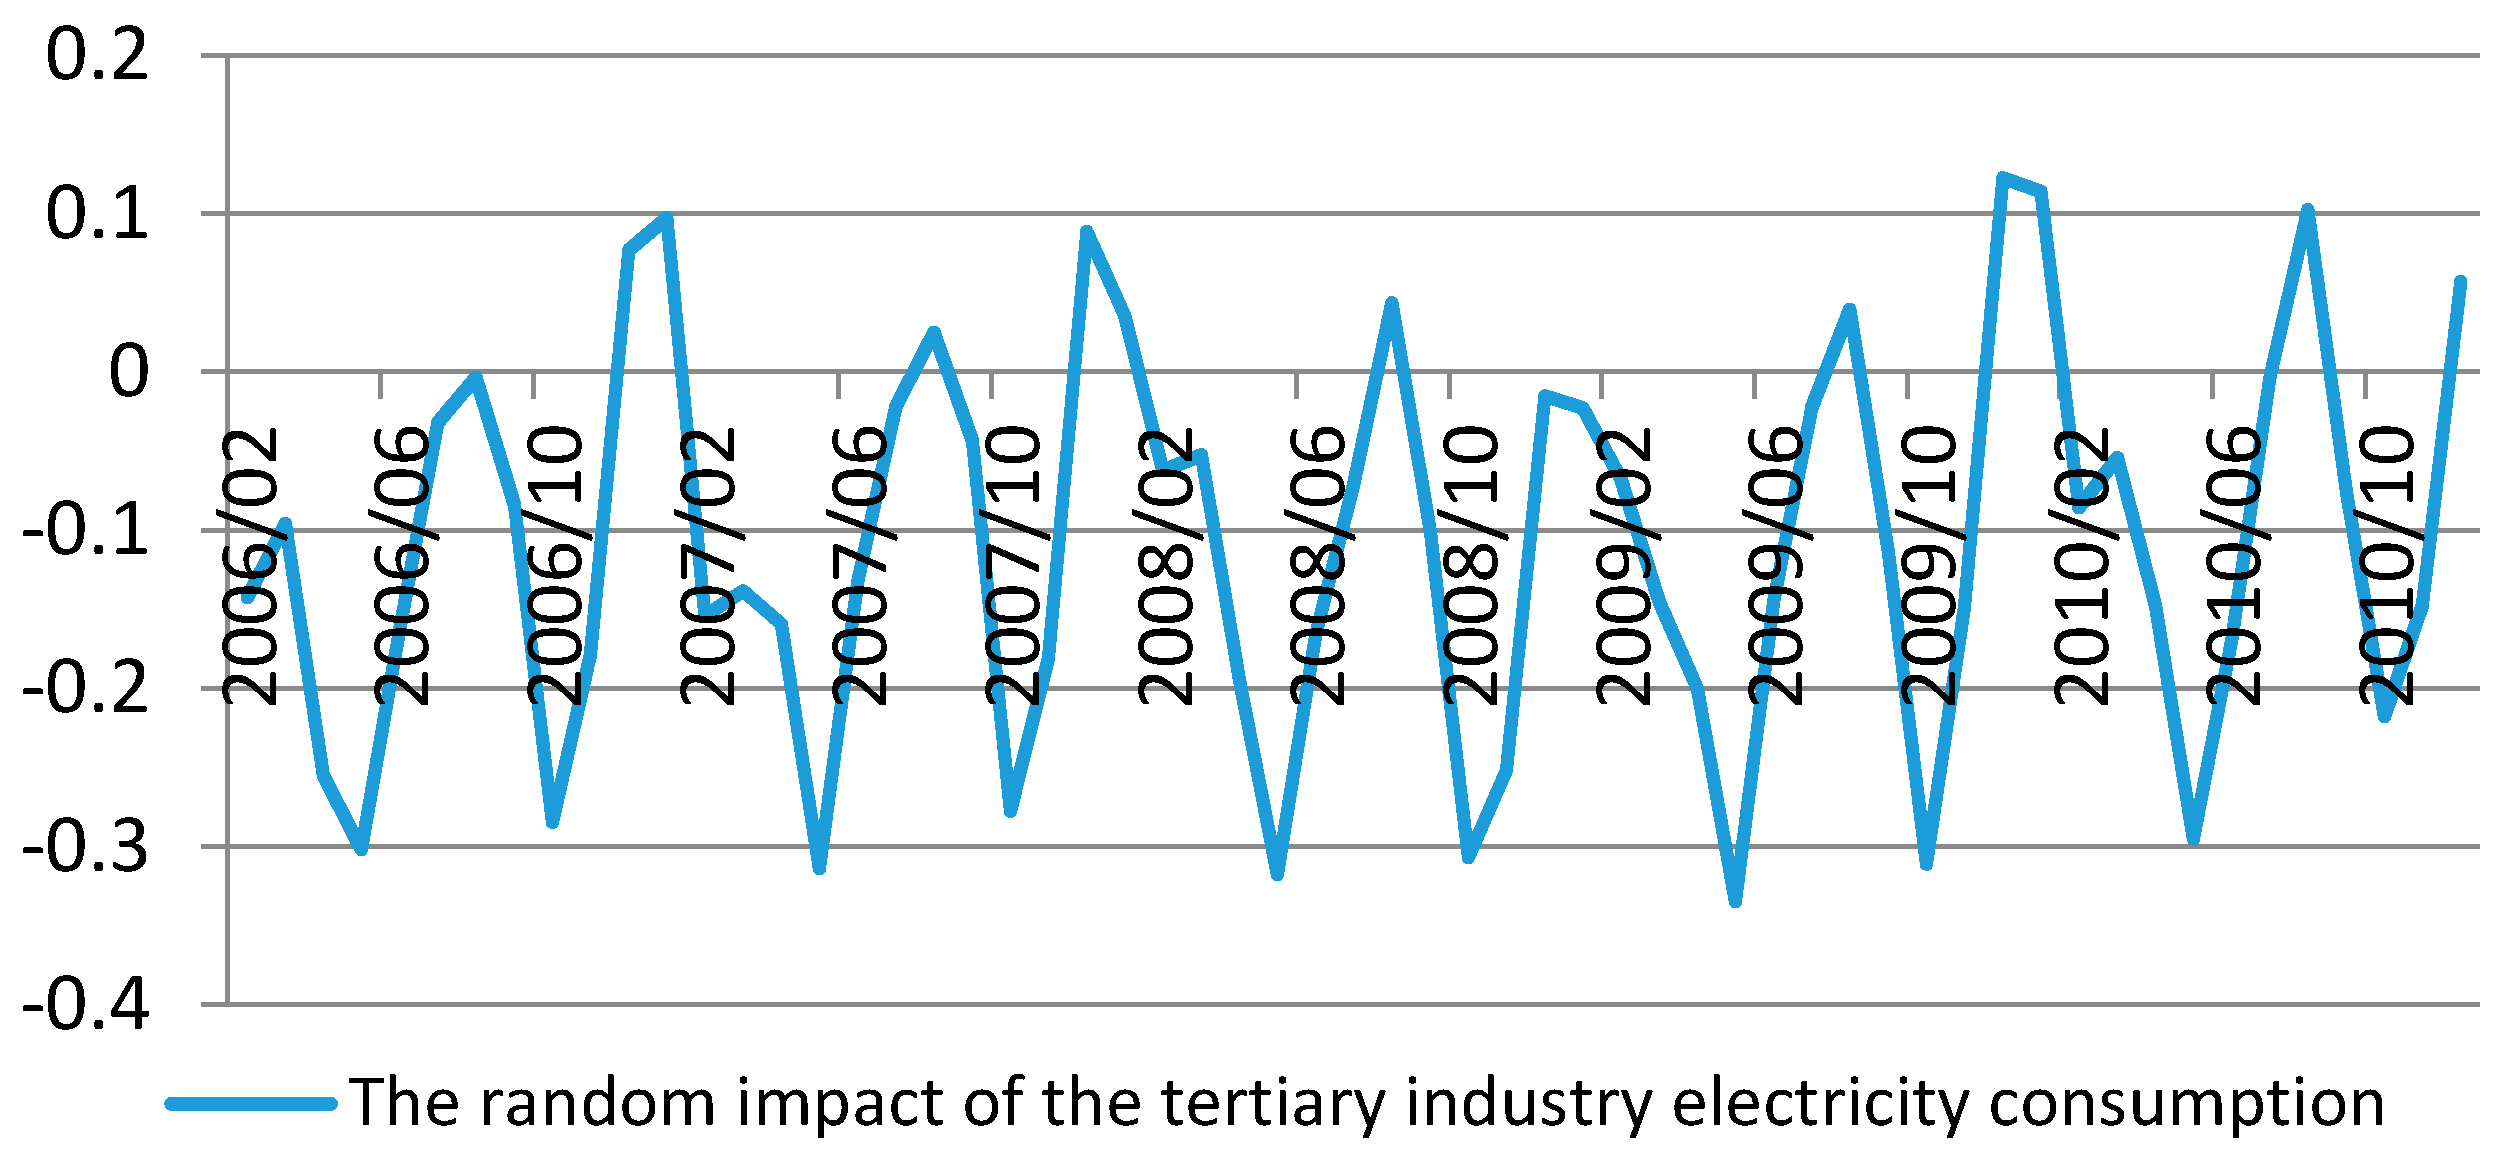
(3) The impact of financial crisis on the service sector was smaller, while the seasonal change was the main driving force of the electricity demand in this sector.
As can be seen from
Figure 5, the random impact value of the tertiary industry electricity consumption show the cyclical changes of a “W” shape. In the period of financial crisis, there was no obvious change of the random impact of the tertiary industry. However, the random impact values of the tertiary industry were negative from July 2008 to June 2009, which imply that the influence of the financial crisis on the electricity demand of the tertiary industry was negative net impact and was not conducive to the growth of electricity consumption.
4. Comparative Analysis of the Impact of Financial Crisis on Electricity Demand in Six Provinces of North China
In order to further analyze the impact of financial crisis on electricity consumption in different provinces of the North China region, the Beveridge-Nelson decomposition method is also employed to decompose the monthly electricity consumption data of the whole society, the secondary industry, and the service sector of six provinces in North China which include Beijing, Tianjin, Hebei, Shanxi, Shandong, and Inner Mongolia from January 2006 to December 2010. The decomposition results are listed in
Table 4.
By comparing the decomposition results, we can draw the conclusions as follows.
(1) The electricity demands of the whole society and the secondary industry in six provinces were mainly affected by the deterministic trend and sustained prominent anti-interference ability.
As can be seen from
Table 4, the change of the deterministic trend was the main driving force for the rapid growth of the electricity consumption of the whole society and the secondary industry in six provinces. It also indicates that, although the electricity consumption of six provinces were influenced by various kinds of external uncertainty factors, the steady growth of the deterministic trend made the electricity consumption of the whole society and the secondary industry have strong abilities to resist the negative random impact, and then realize higher growth.
(2) During the period of financial crisis, the electricity consumption of the whole society and the secondary industry in six provinces were under great negative impacts, and the random impact of the secondary industry was more intense.
The negative impact of the financial crisis on the electricity consumption of the whole society and the secondary industry of six provinces can be reflected by random shocks values and their proportions, which can be seen from
Table 5.
From January 2006 to the beginning of 2008, although the random impacts of the electricity consumption of the whole society and the secondary industry in six provinces showed large fluctuations, most of the random impact values were more than 0. However, under the impact of the financial crisis, the random impact values were less than 0 for several months, and the proportions that the random impact values accounted for the electricity consumption of the whole society and the secondary industry sustained negative values.
From August 2008 to June 2009, the electricity consumption of the whole society and the secondary industry in Beijing city were under great negative impact of financial crisis. The monthly average impact value were, respectively, −0.2118 and −0.3624, and the average proportions were, respectively, −1.61% and −0.21%, which indicate the average monthly electricity consumption reduced 92.45 million and 4.82 million kWh, respectively.
From February 2008 to May 2009, the electricity consumption of the whole society and the secondary industry in Tianjin city were under great negative impact of financial crisis. The monthly average impact value were, respectively, −0.107 and −0.115, and the average proportions were respectively −0.83% and −0.96%, which imply that the average monthly electricity consumption reduced 34.98 million and 29.39 million kWh, respectively.
From June 2008 to October 2008, the electricity consumption of the whole society and the secondary industry in Hebei province were under great negative impact of the financial crisis. The monthly average impact value were, respectively, −0.0129 and −0.0167, and the average proportions were, respectively, −0.09% and −0.12%, which mean the average monthly electricity consumption reduced 15.53 million and 15.58 million kWh, respectively.
From October 2008 to April 2009, the electricity consumption of the whole society and the secondary industry in Shandong province were under great negative impact from the financial crisis. The monthly average impact value were, respectively, −0.0621 and −0.0601, and the average proportions were, respectively, −0.43% and −0.51%, which indicate the average monthly electricity consumption reduced 93.92 million and 86.68 million kWh, respectively.
From October 2008 to November 2009, the electricity consumption of the whole society and the secondary industry in Shanxi province were under great negative impact of financial crisis. The monthly average impact value were, respectively, −0.104 and −0.113, and the average proportions were, respectively, −0.75% and −0.83%, which mean the average monthly electricity consumption reduced 77.10 million and 70.35 million kWh, respectively.
In November 2008, the electricity consumption of the whole society and the secondary industry in Inner Mongolia Autonomous Region were under great negative impact from the financial crisis. The monthly impact value were, respectively, −0.0577 and −0.0494, and the proportions were, respectively, −0.43% and −0.37%, which indicate that the average monthly electricity consumption reduced 31.19 million and 22.76 million kWh, respectively.
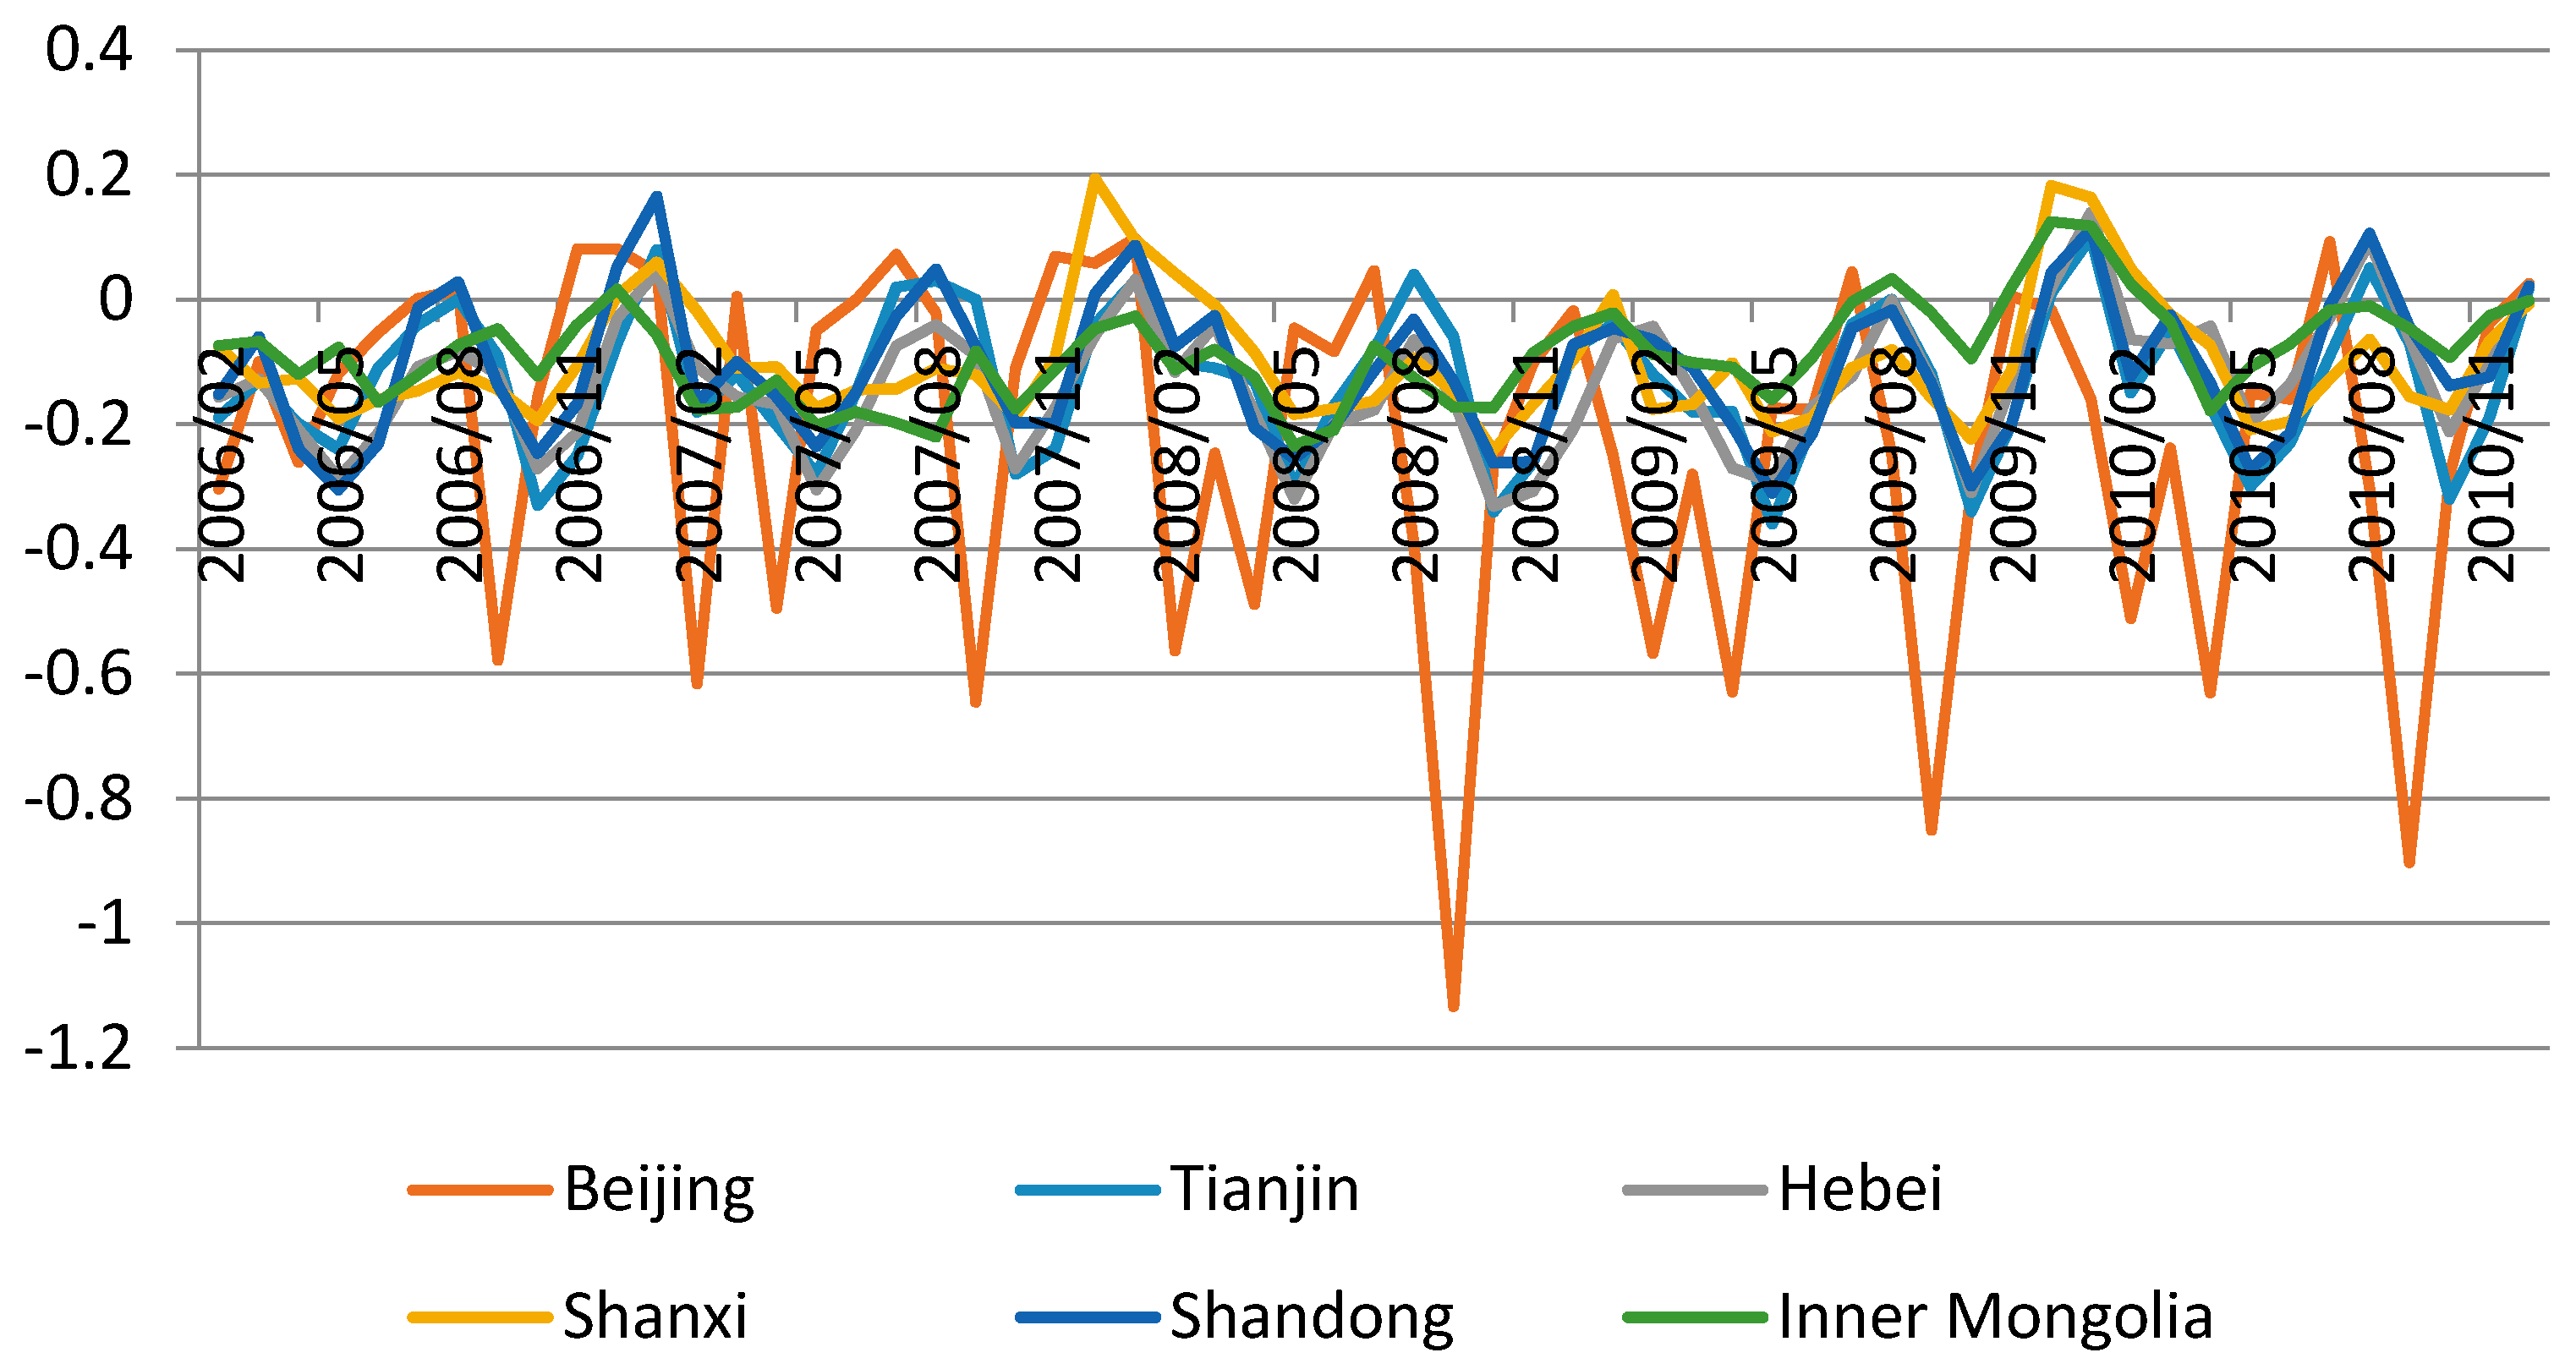
(3) The impacts of financial crisis on the service sector of six provinces were smaller, while the random impacts were primarily affected by the seasonal changes.
As can be seen from
Figure 6, the random impact value of the tertiary industry electricity consumption in six provinces showed the cyclical changes of a “W” shape due to the influences of seasonal factors. In the period that the electricity demand of the whole society and the secondary industry were under huge impacts, there were no obvious changes of the random impacts of the tertiary industry in six provinces. The impact of financial crisis on the tertiary industry was weak and did not change the cyclical fluctuation trend of random component. Therefore, the impact of financial crisis on the service sector was inferior to that on the whole society and the secondary industry.
5. Conclusions
Based on the monthly electricity consumption data of the whole society, the secondary industry, and the service sector from January 2006 to December 2010 of North China, the Beveridge-Nelson decomposition method is employed to obtain deterministic trends, periodic components, and random impact items to analyze the shock effect of the international financial crisis on electricity demand. The conclusions are as follows:
- (1)
The electricity consumption of the whole society and the secondary industry in North China had strong anti-interference abilities. Due to the existence of the deterministic trend, although the electricity demand was hit by different kinds of external uncertainty factors, it could still achieve a relatively stable growth.
- (2)
The electricity demand of six provinces were under great shock of the financial crisis, and the random impulse effect of the secondary industry performed more intensely.
- (3)
Since the second half of 2009, the impact of the financial crisis on electricity demand in North China was gradually weakened. The random impact of the social electricity consumption in North China reduced from −0.1407 in February 2009 to −0.0188 in June 2009, and the proportion declined from −0.8979% to −0.1189%. The electricity demand of six provinces gradually recovered.
- (4)
The impact of financial crisis on the service sector in North China was smaller, while the random impact was mainly influenced by the seasonal changes.
According to our numerical analysis, it can be seen that the electric power industry, as the main leading sector of the national economy, was under great impact from the financial crisis. With the aim of actively defending the impact of the global economic crisis, the following recommendations are put forward:
(1) Encouraging the industrial enterprises to use more electricity energy, aiming to substitute for coal and natural gas, so that the proportion of electricity energy in the terminal energy consumption can be improved.
The empirical analysis indicates that the electricity consumption of the secondary industry were under great negative shocks. Therefore, it is necessary to improve the electricity demand of the second industry. At present, many industrial enterprises in North China directly use coal and natural gas as the production fuels, which result in the low proportion of electricity energy in the terminal energy consumption. However, the thermal efficiencies of coal and natural gas are low and the carbon emissions are high, which do not meet the national policies of sustainable development and carbon emission reduction. Taking Inner Mongolia as an example, in 2013, the proportion of electricity energy in the terminal energy consumption was only 2.17% which was far below the average level of China, and the proportion of coal and natural gas were 87.63% and 2.46%, respectively. Obviously, the substitution of electricity for coal and natural gas in Inner Mongolia is promising. Therefore, the local governments of North China should encourage the industrial enterprises to explore the way to use electricity for achieving the substitution of coal and natural gas.
(2) The rational electricity price system needs to be formed, and the local government should adopt certain measures to encourage the industrial enterprises to consume the electricity energy at off-peak time, and then reduce the production cost.
Affected by the financial crisis, the domestic demand has fallen, and the profits of enterprises have also declined. Facing this situation, cost saving has become the new target of the majority of enterprises. From the perspective of electricity consumption, the power sector should establish the reasonable price system, and the time-of-use price, peak and valley electricity price, and differential prices should be further implemented. The local government should make the best use of price leverage to regulate the local electricity demand, and promote the factories to produce at off-peak time, which can not only reduce the production cost, but also ensure the stability of power supply.
(3) The local governments of North China should constantly promote the implementation of industrial structure adjustment policy and increase the proportion of the output value of tertiary industry in GDP.
According to the empirical results, the impacts of financial crisis on the service sector of six provinces were small. The local government should actively implement the policy of industrial structure adjustment and vigorously develop the service sector. With the adjustment and optimization of industrial structure and the improvement of residents’ living standards, the proportion of the electricity consumption of the tertiary industry in total electricity consumption will keep rising, so that the tolerance for risk induced by the financial crisis could be enhanced.


