1. Introduction
In recent years the power sector has been undergoing substantial changes which are causing a global rethinking of the system and its infrastructure. Among the reasons for this are an evolution in the criteria of consumer demand regarding, for example, energy consumption habits and the power quality levels required. At a global level, the strategic need of countries to diversify energy sources, linked to the increasing development of renewable energy sources, have led to an increase in the coexistence of conventional generation systems and Distributed Energy Resources (DERs). This rapid development of renewable energy generation within electrical systems is mainly due to the development of viable technological solutions and state policies aimed at boosting countries’ own energy resources and at reducing dependence on energy imports.
These considerations have resulted in an increased complexity in the management of the electrical system, especially in the areas of distribution where the approach of a passive energy consumption model is giving way to increased penetration of DERs and the existence of bidirectional energy flows. In fact, this trend is expected to increase in the coming years, requiring the system to evolve towards a much more intelligent, active, model, known as the Smart Grid [
1,
2,
3].
The economic costs of renewable energy installations are becoming more competitive, leading to a growing penetration of supply. In the particular case of photovoltaic (PV) systems, the low cost of panels means that PV installations are proliferating, especially among domestic users. A question that has become relevant in recent times is that, since by its very nature photovoltaic generation is intermittent, a high penetration of PV resources can lead to grid instability if PV generation is not regulated properly. According to some authors, these effects begin to be significant in distribution areas where PV energy penetration reaches between 10 and 15 percent [
4]. This means that those areas where solar energy is an important part of the grid find themselves exposed to greater economic costs due to outages and increased maintenance needs.
The approach to solving this increasing problem is to make inverters smarter. This could be a low-cost way for mitigating voltage changes caused by fluctuating solar generation, thus preventing potential power quality problems. To achieve this goal, inverters should be able to generate both active and reactive power, and be able to control the injection or absorption of reactive power in the Point of Common Coupling (PCC) in line with electricity supply needs [
5,
6]. This type of active management can mitigate the consequences of solar, wind or other factors which cause intermittent variations in power generation output.
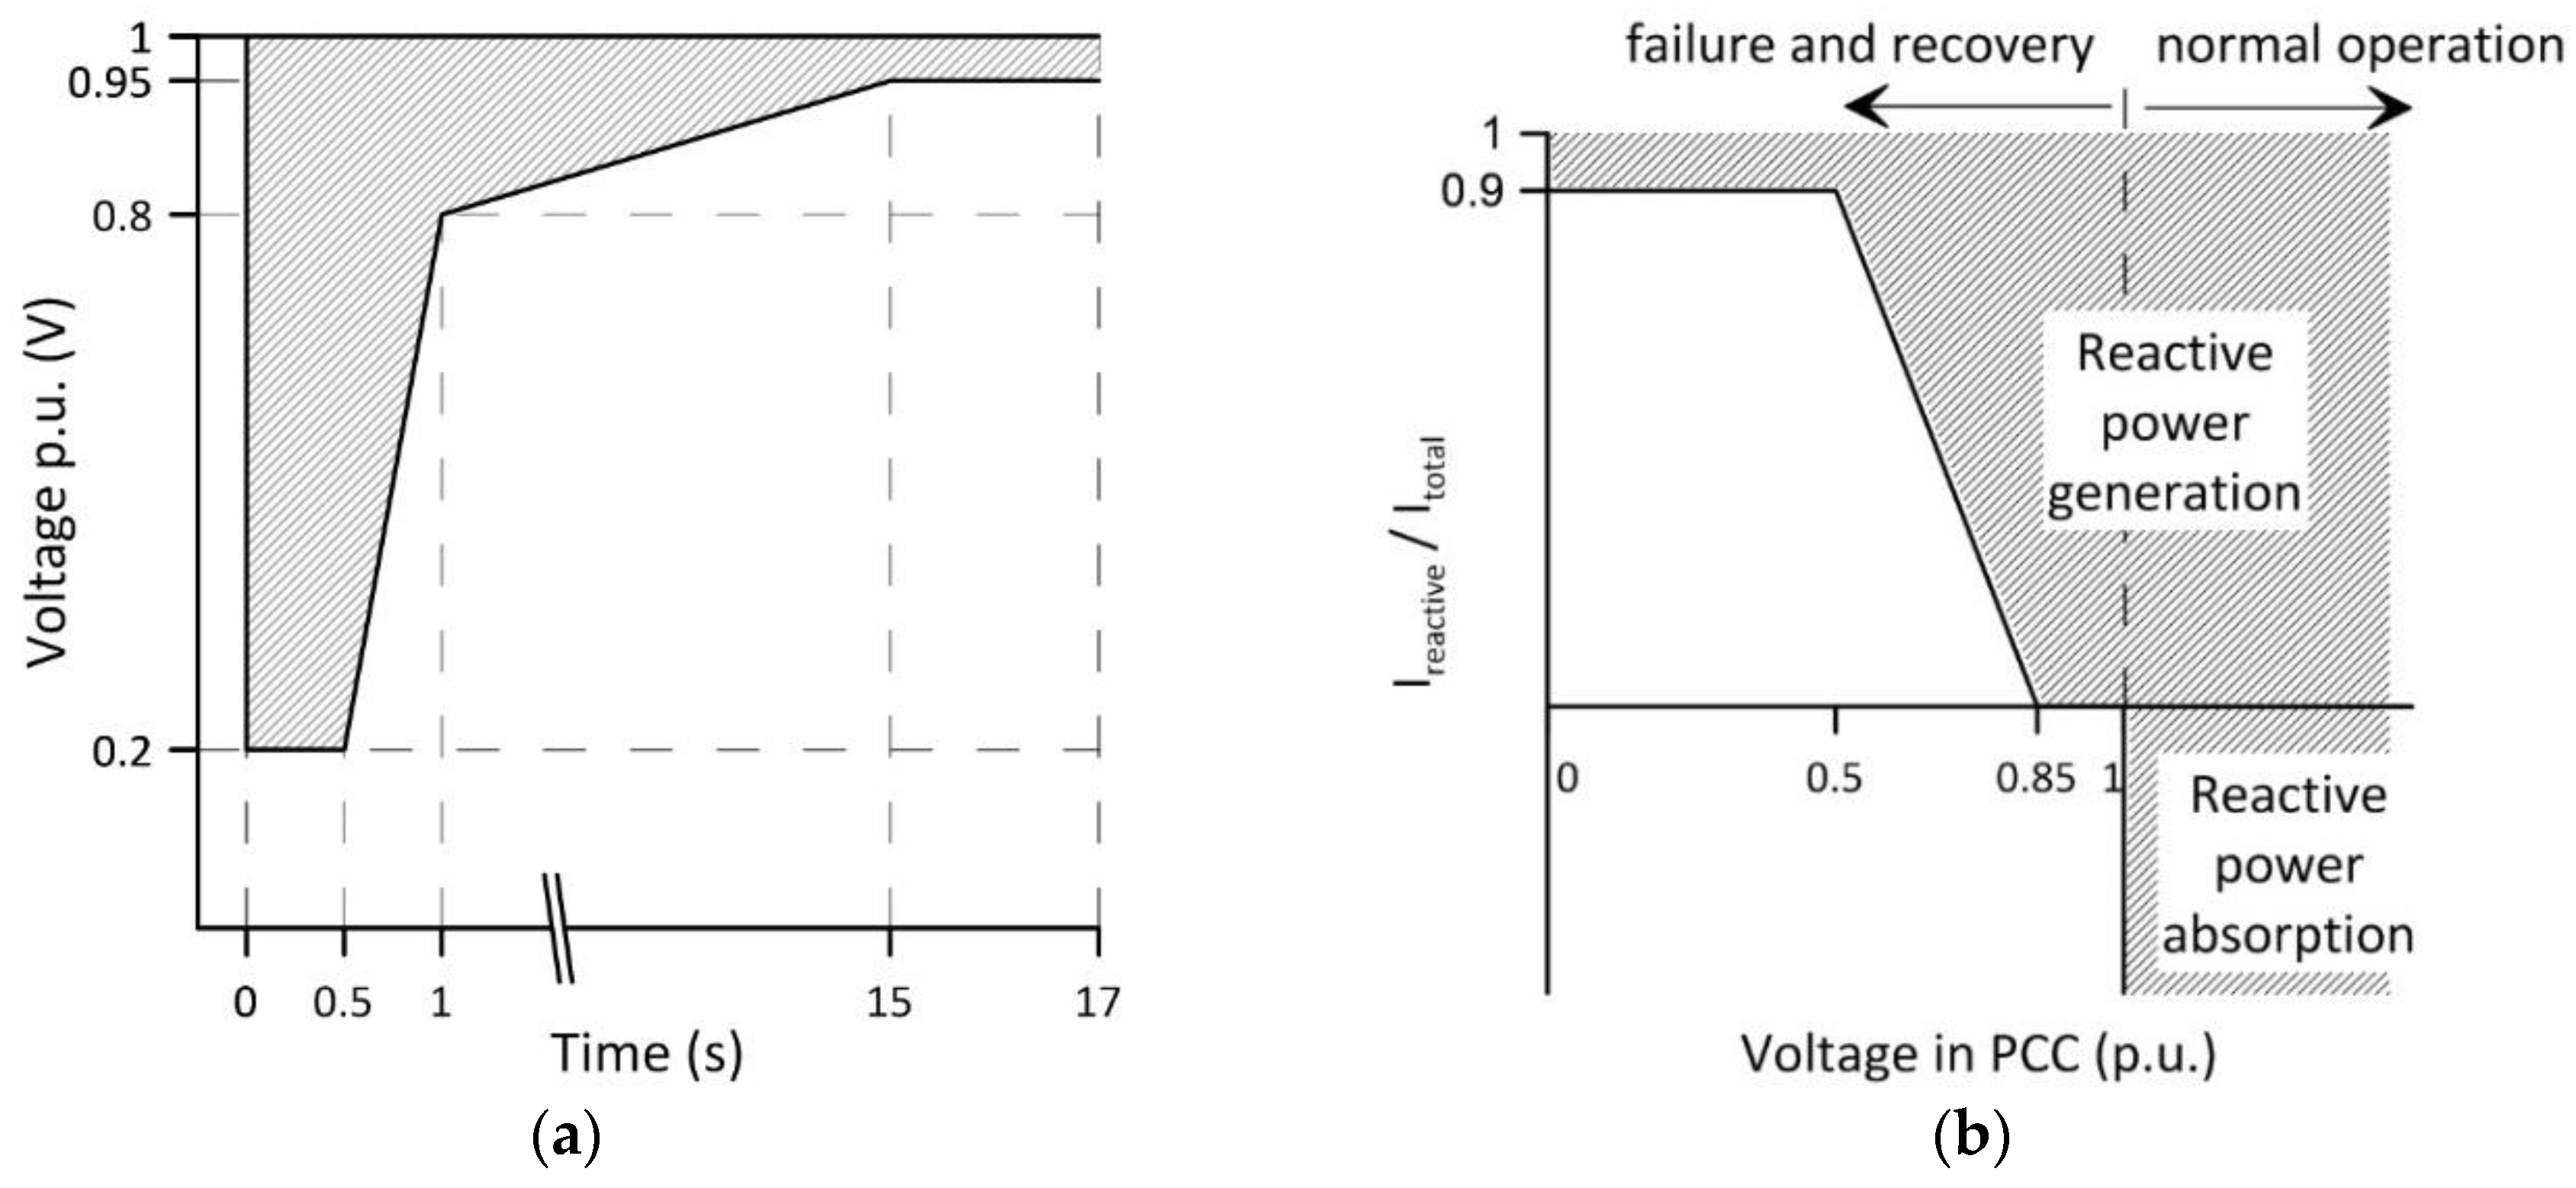
As an example,
Figure 1 shows two graphs representing the approach of Spanish legislation in addressing this scenario [
7,
8]. One is a voltage-time graph showing the area in which the inverter must operate when a fault occurs in the grid. The second graph shows the area of operation for reactive current, generated or absorbed, according to the voltage at the interconnection point. At present, Spanish legislation is under review and will be modified, introducing more stringent requirements with regard to inverters. In fact, at this moment, similar changes are taking place in other international standards.
Because these new criteria are precisely the opposite to the line of action that such regulations have followed to date, such approaches are rethinking the main international standards that regulate the operation of DERs. Traditionally, these regulations have forced inverters to disconnect from the grid at the first sign of problems. But in current grid scenarios this simple security measure can be counterproductive, since disconnection can cause even more instability.
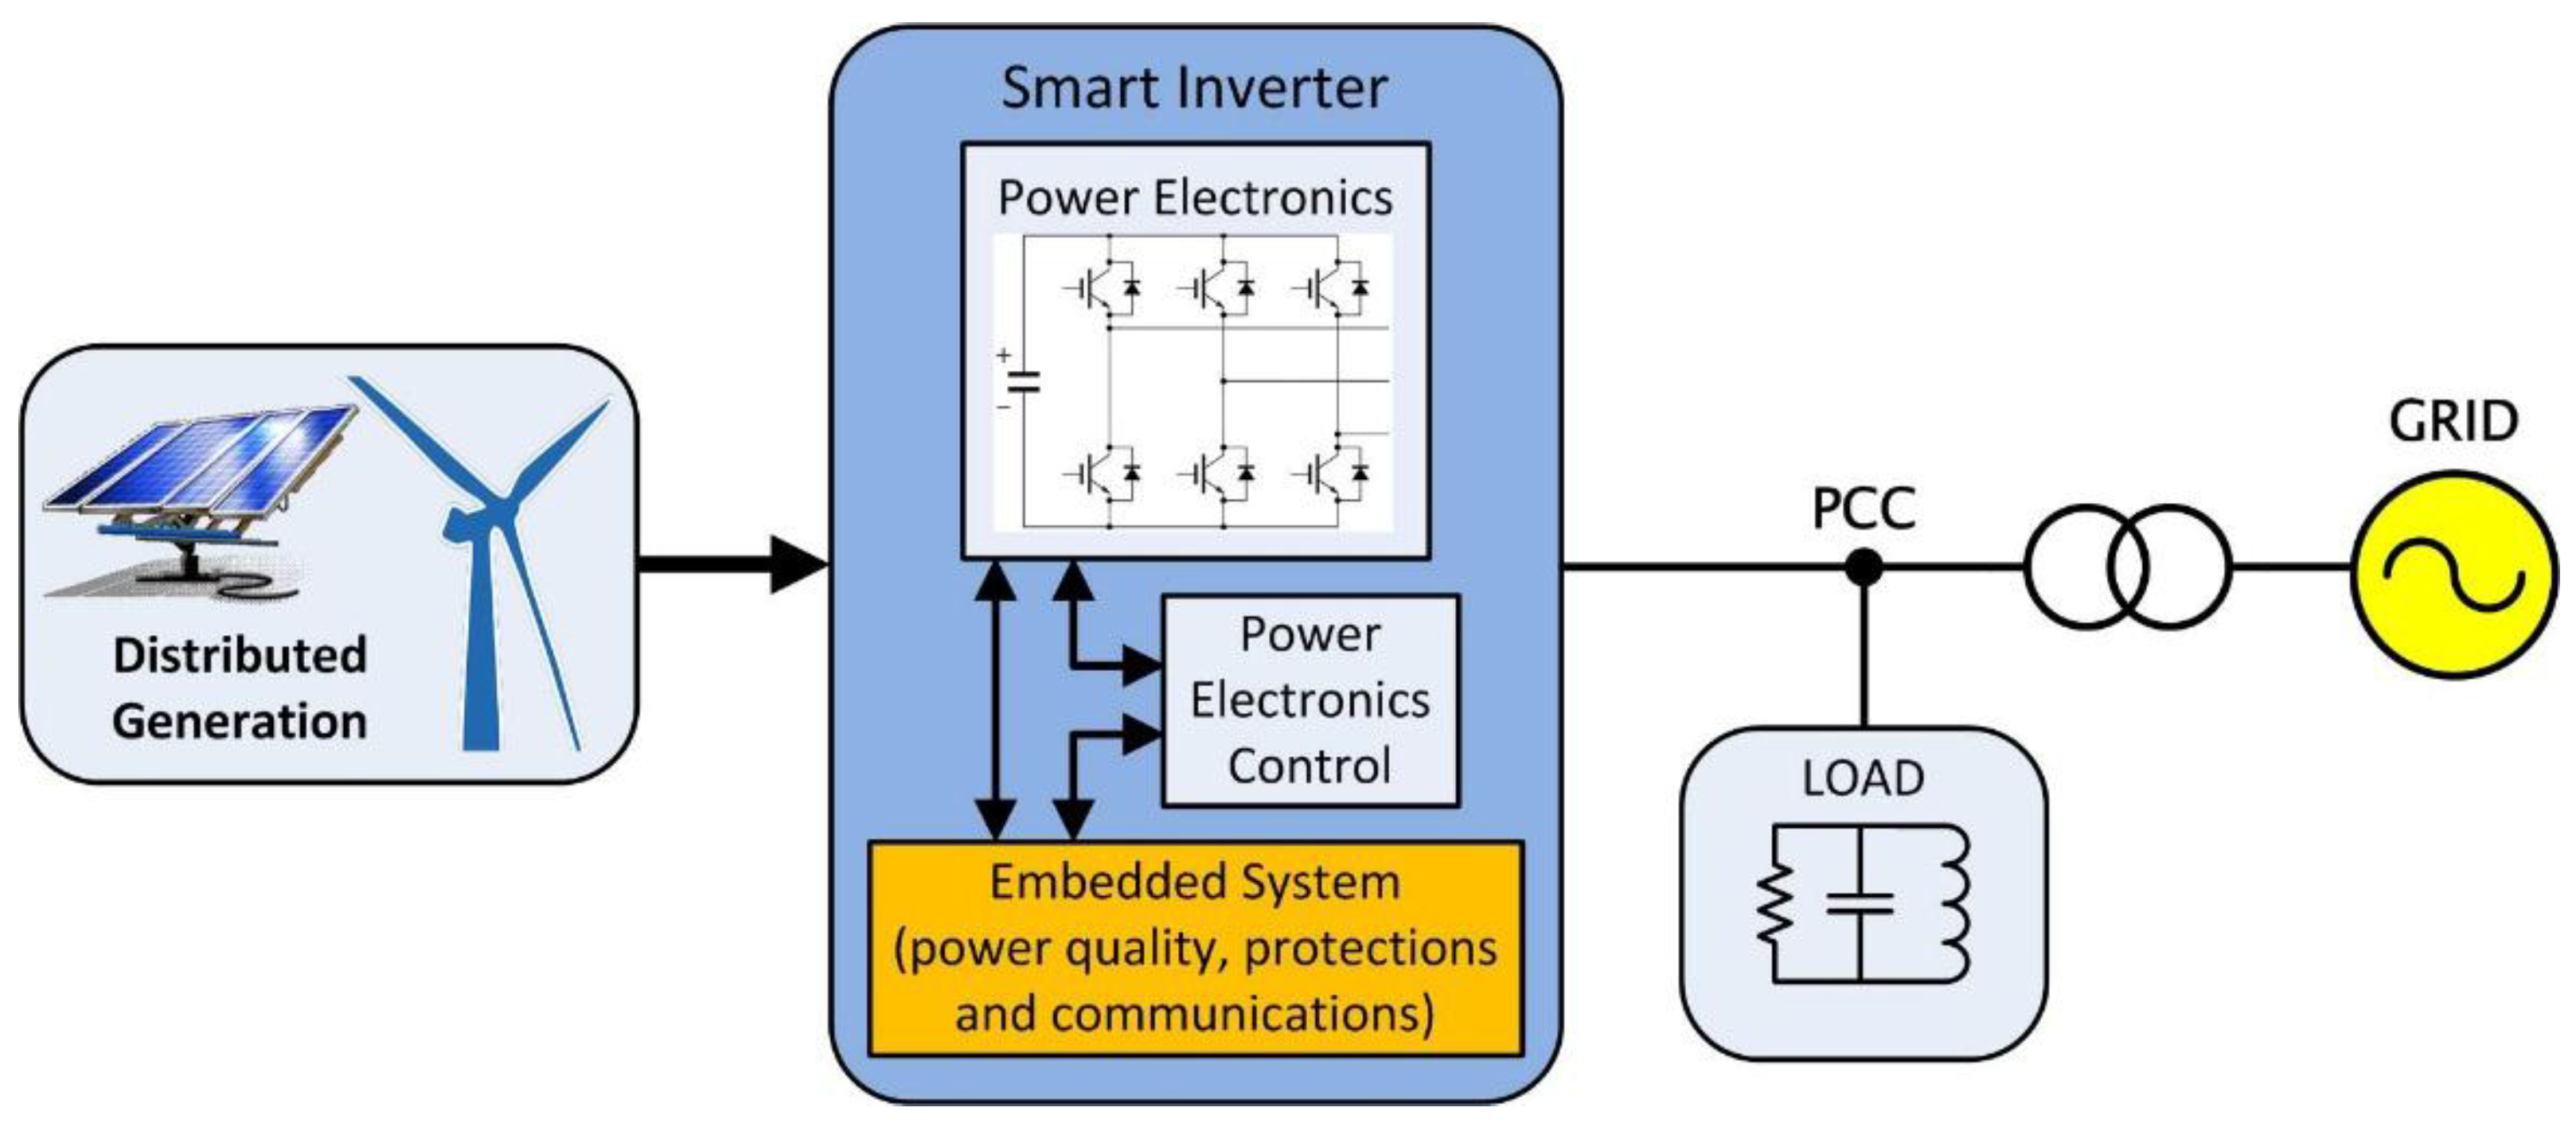
In this new context of intelligent grids, the control of electrical interconnection in PCC between DER equipment, loads and the rest of the system becomes critical. Therefore, the equipment will be obliged to meet the new requirements. This often involves an increase in the intelligence of its electronic systems. It is in this scenario where the Embedded Systems (ES) and Intelligent Electronic Devices (IED) play an important role, either by integrating them into new equipment coming onto the market, or improving the preexisting installed equipment and adapting it to the emerging scenarios (
Figure 2).
There are several important aspects to consider when addressing the design of an ES for controlling the electrical interconnection between DERs and the grid. Primarily, there is a need for real-time interaction between the equipment and the remote system management units [
9,
10,
11]. Other important aspects are the temporal determinism in the communications and time stamping of the data in order to establish the state of the interconnection interface with precision [
12,
13]. The synchrophasor schemes and the use of synchronism based on Precision Time Protocol (PTP) are examples of this type of solutions [
14]. Also important is the existence of temporal behavior specifications that, as well as monitoring parameters, can undertake protective action based on the regulations in force. Multifunctionality is another aspect to consider because the ES will have to operate in different scenarios, monitoring the electrical parameters that will enable decisions to be taken based on the information they provide. This in turn, enables power quality and protection functions to be covered either individually or simultaneously [
5]. For example, when monitoring power quality, an ES will behave as a data logger, while in the protection domain it must have a decision capability in order to send alarm signals or to actuate a certain switch. Finally, and because of the need to integrate heterogeneous equipment, modularity is also important [
15]. The latest generation products have already integrated these intelligent devices, although currently they are quite a low percentage of total installed equipment. The real problem arises when integrating ESs into conventional equipment in order to upgrade it to the new needs and demands of the electrical system.
The continuous development of system-embedded technologies, as well as the reduction in their design and production cost, implies important benefits when using these devices for the interconnection control between DERs and the grid. Today, however, it is difficult to find such systems integrated into a single device. Selecting the correct architecture when designing an ES will enable a balance between the processing and storing resources to be struck.
In this work the design and development of a prototype of a multifunctional ES is presented. This prototype contributes supply and protection functions in DER devices that need to adapt or expand their functionality to meet the demands of new operating or regulatory contexts. It aims to control and manage interconnections between a smart inverter and the grid. It has been designed taking into consideration the temporal intervals suitable for the measurements defined in standard IEC 61000-4-30. From the perspective of protection functionality, the operation ranges for the different electrical parameters and the response time under abnormal conditions are compliant with the most representative regulations. The modular design of the device, based on subsystems, allows for it to be adapted to the regulatory changes taking place in interconnection management, mainly with regard to the integration of photovoltaic inverters. Moreover, not only can this system be integrated into new devices, but its real potential is its ability to expand the functionalities of inverters that are already installed and which need to be adapted to a new regulatory framework.
The methodology followed in the prototype tests is explained in the experimental section. The tests were undertaken in order to determine the quality of the prototype when measuring the parameters, as well as its temporal response. Finally, a brief summary of the Smart Inverter for Distributed Energy Resources (SIDER) projects is included. This project has been sponsored by the Spanish Ministry of Science and Innovation and deals with the real integration of the prototype with a photovoltaic inverter in order to operate it within the context of a Smart Grid.
2. Description of the System
2.1. Design and Architecture
One of the key aspects when designing this kind of device is the suitability of the temporal requirements, as determined by the operating needs and the specific regulations. Being able to adapt to a series of temporal interval measurements is necessary. This depends on the stationary nature of the parameters to be monitored. Furthermore, and according to processing speed, the architecture of the system must be compatible with the temporal response required by the different protection devices.
In order to control the quality of the electrical interface, ES functionality must be compliant with the requirements of standard IEC 61000-4-30. This standard defines the methodology for measuring quality parameters in the power supply for 50 and 60 Hz systems, describing the temporal intervals and aggregations needed for each type of measurement [
16,
17]. Two classes of measurement method are included in IEC 61000-4-30: class A and class S methods. Class A methods are required when a high-precision measurement is needed. These methods imply the use of high-quality instrumentation equipment. From the inception of the prototype presented in this paper, this has been taken into account when developing it. Our development is oriented to be class A compliant. This implies demanding characteristics in the data acquisition and processing stages in order to obtain measurements with a level of uncertainty within the limits established by the standard.
With regard to the protection functionality, the system must provide its commands and alarms according to the response times specified in the pertinent regulation. In our case, a set of subsystems have been established for supervising the operating conditions of the grid-connected device. The appropriate commands and signals are generated and sent when the corresponding thresholds are exceeded. The reference standards used here are IEC 61727, IEC 62116, VDE 0126-1-1, IEEE 1547 and IEEE 929.
It is necessary to define a proper architecture for measuring the electrical parameters. According to IEC standard 61000-4-30 there are two types of parameters, those computed at cycle level and those computed at 10/12 cycles (200 ms). However, a detailed analysis of the regulation shows that most of the temporal response requirements are above 1 cycle and below 10 or 12 cycles. That is, 50 ms for the voltage window according to IEC 61727, or 160 ms for the frequency window according to IEEE 1547. The initial plan was to base this work on the 1-cycle measurements for these parameters. This, however, could lead to an increase in false positives when detecting signals outside the operating range due to the fact that measurements always include a certain amount of random components. This has led to a compromise solution by which a new measurement interval of 2 cycles has been defined and team has been termed as quasi-stationary. This has a sufficiently rapid response and it provides the stationarity needed for filtering very fast non-critical random phenomena. Therefore, the data architecture of the system requires three processing routes:
Processing at cycle level, where the parameters related to power quality with strong non-stationary characteristic such as voltage dips, swells and sags are extracted.
A second route for processing for two-cycle based measurements, with the aim of providing a quick response by the protection devices, minimizing the false positives.
The third route is dedicated to the purely stationary parameters which are computed based on 200 ms intervals. This is appropriate in the case of power and energy measurements, symmetrical components, phase unbalance measurements, etc.
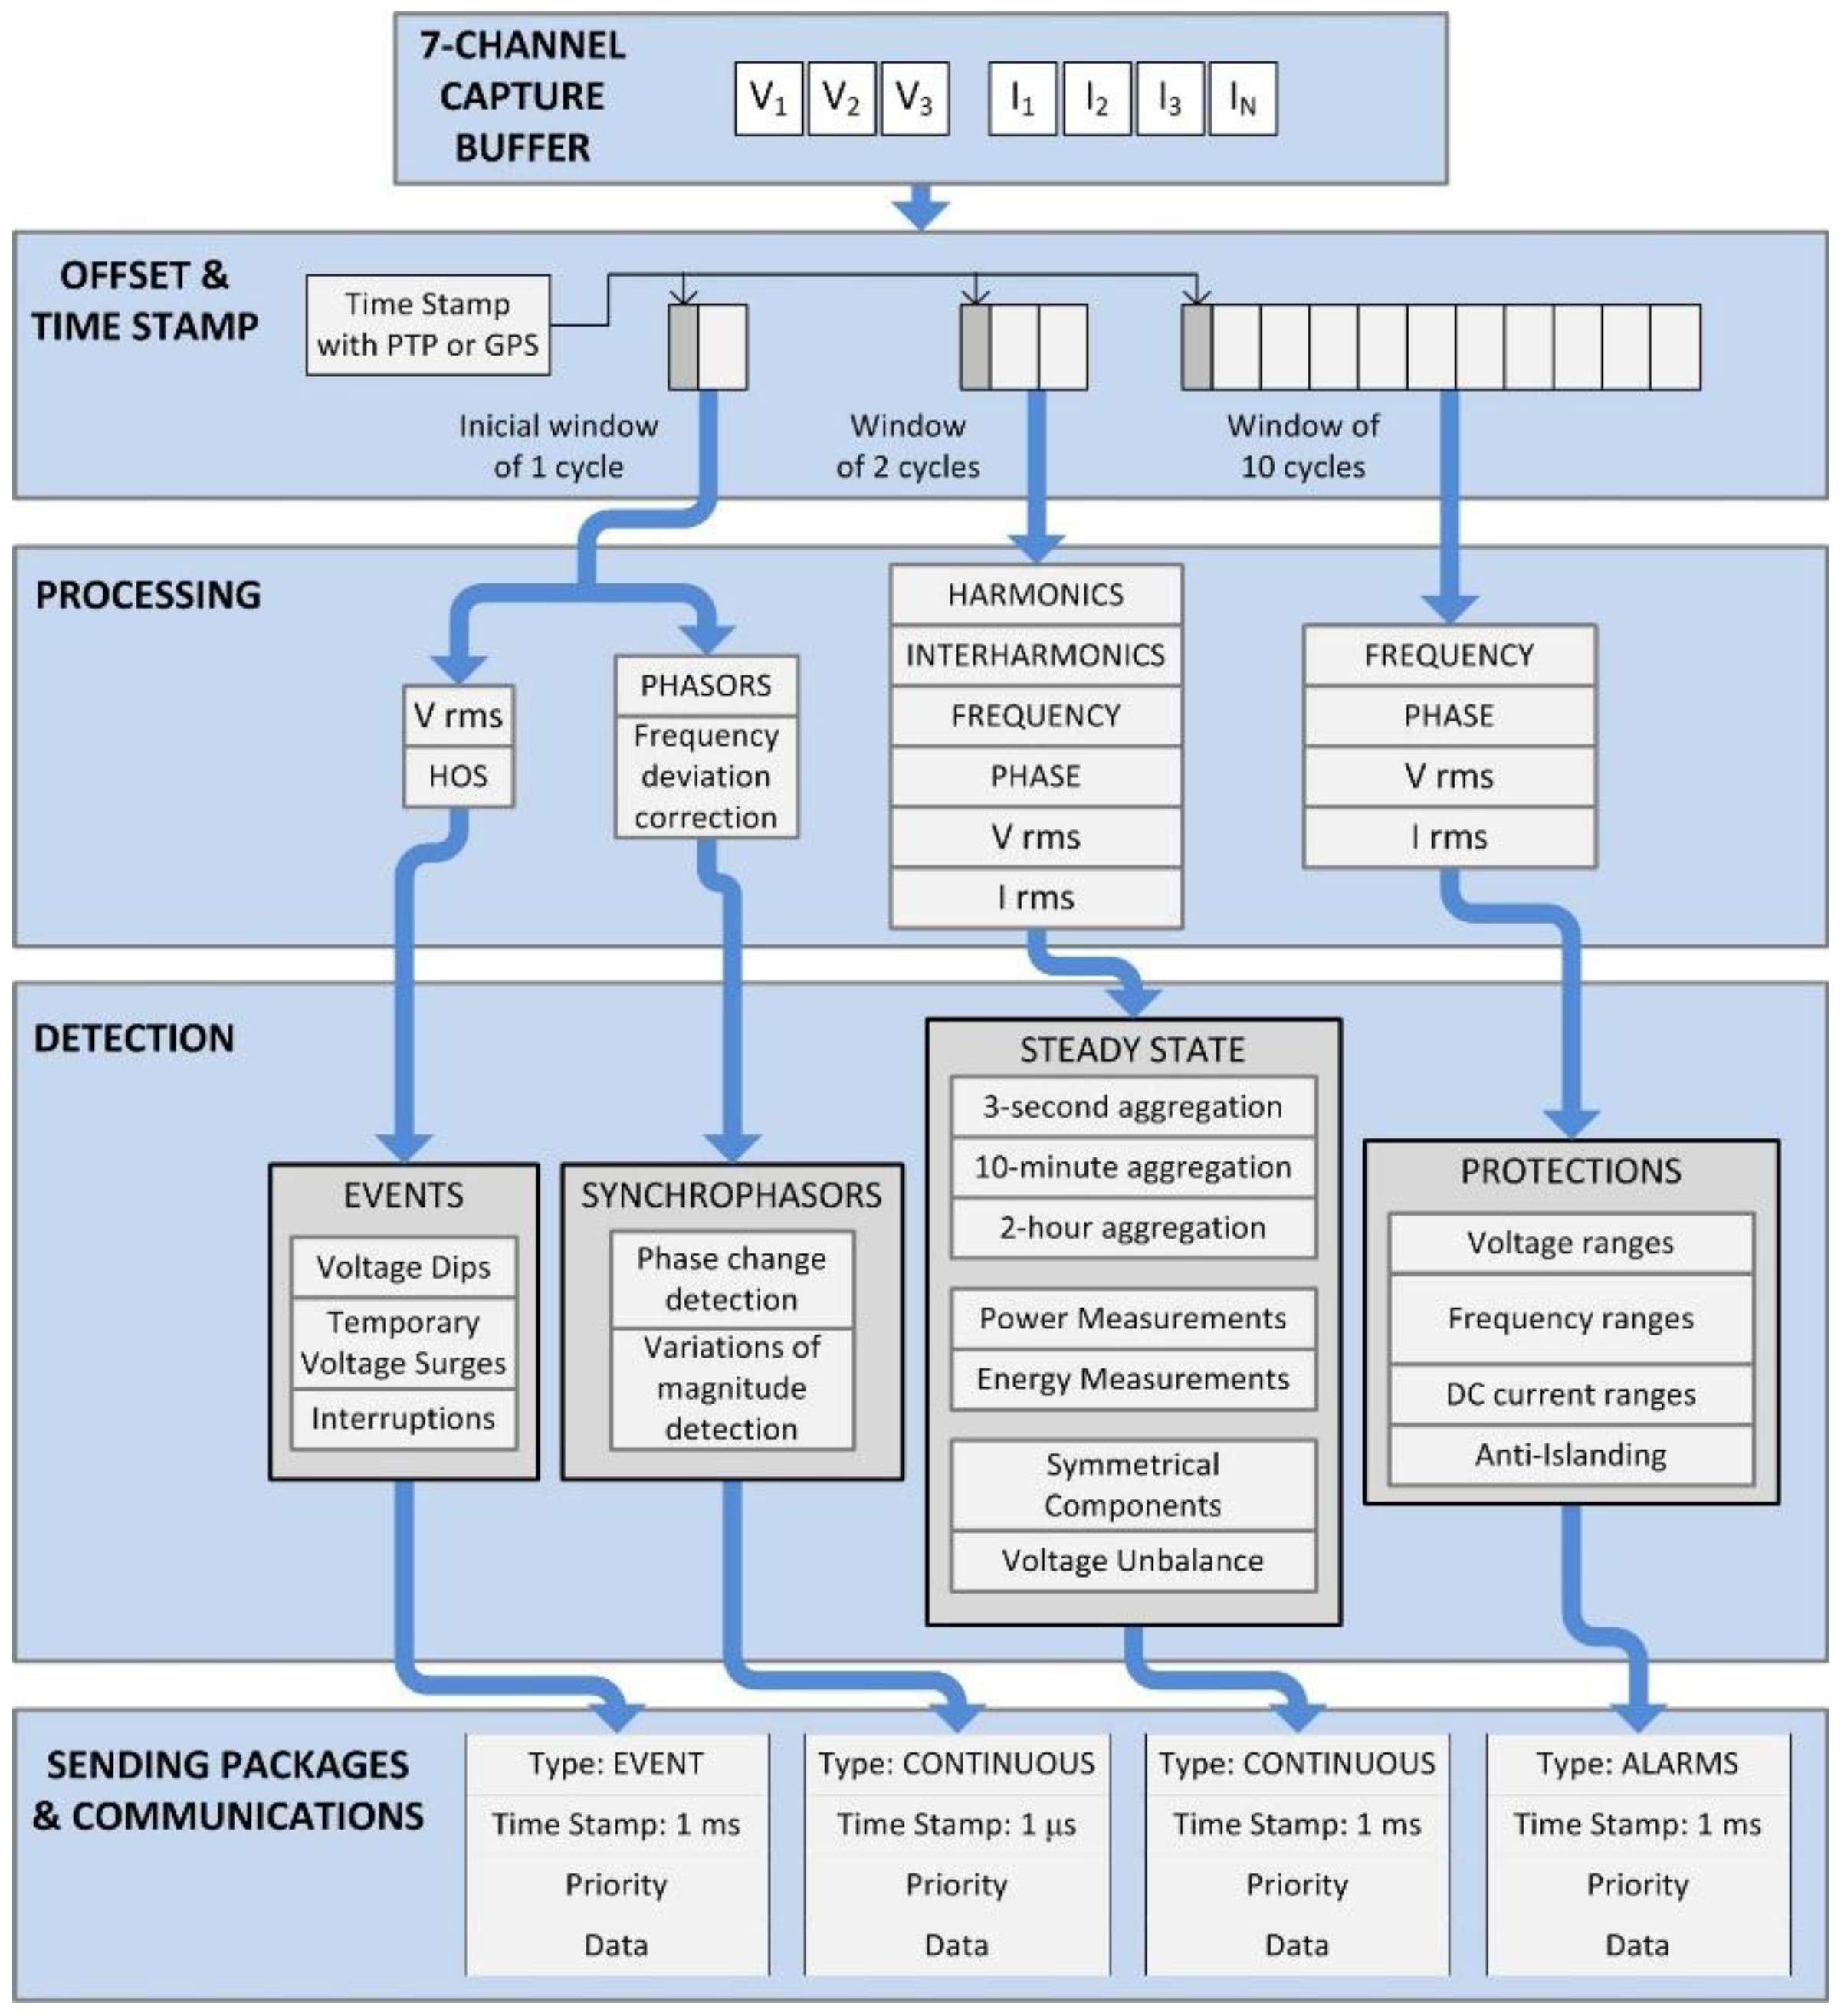
The system architecture is based on an acquisition of three-phase system voltage and current values. Seven data channels were implemented—three for voltage and four for current (one of them for the neutral current). Having obtained these data, the measurement intervals are adjusted in order to obtain the parameters and time stamping needed. These data are processed according to the required functionality. For example, events detection is based on the quick reading at cycle level and the processing of High Order Statistics (HOS) [
18]. The 2-cycle window is used for protection applications, with a detection system which supervises the operation ranges needed. These operating ranges are completely reconfigurable in order to adapt to changes in regulations. Moreover, all of the stationary power quality parameters are associated with the 10-cycle windowing, obtaining aggregations of greater duration, according to parameters and needs. Finally, the data are classified and packaged in such way that it can be communicated to other devices or network entities. The frame structure has fields for classification, time stamping and priority.
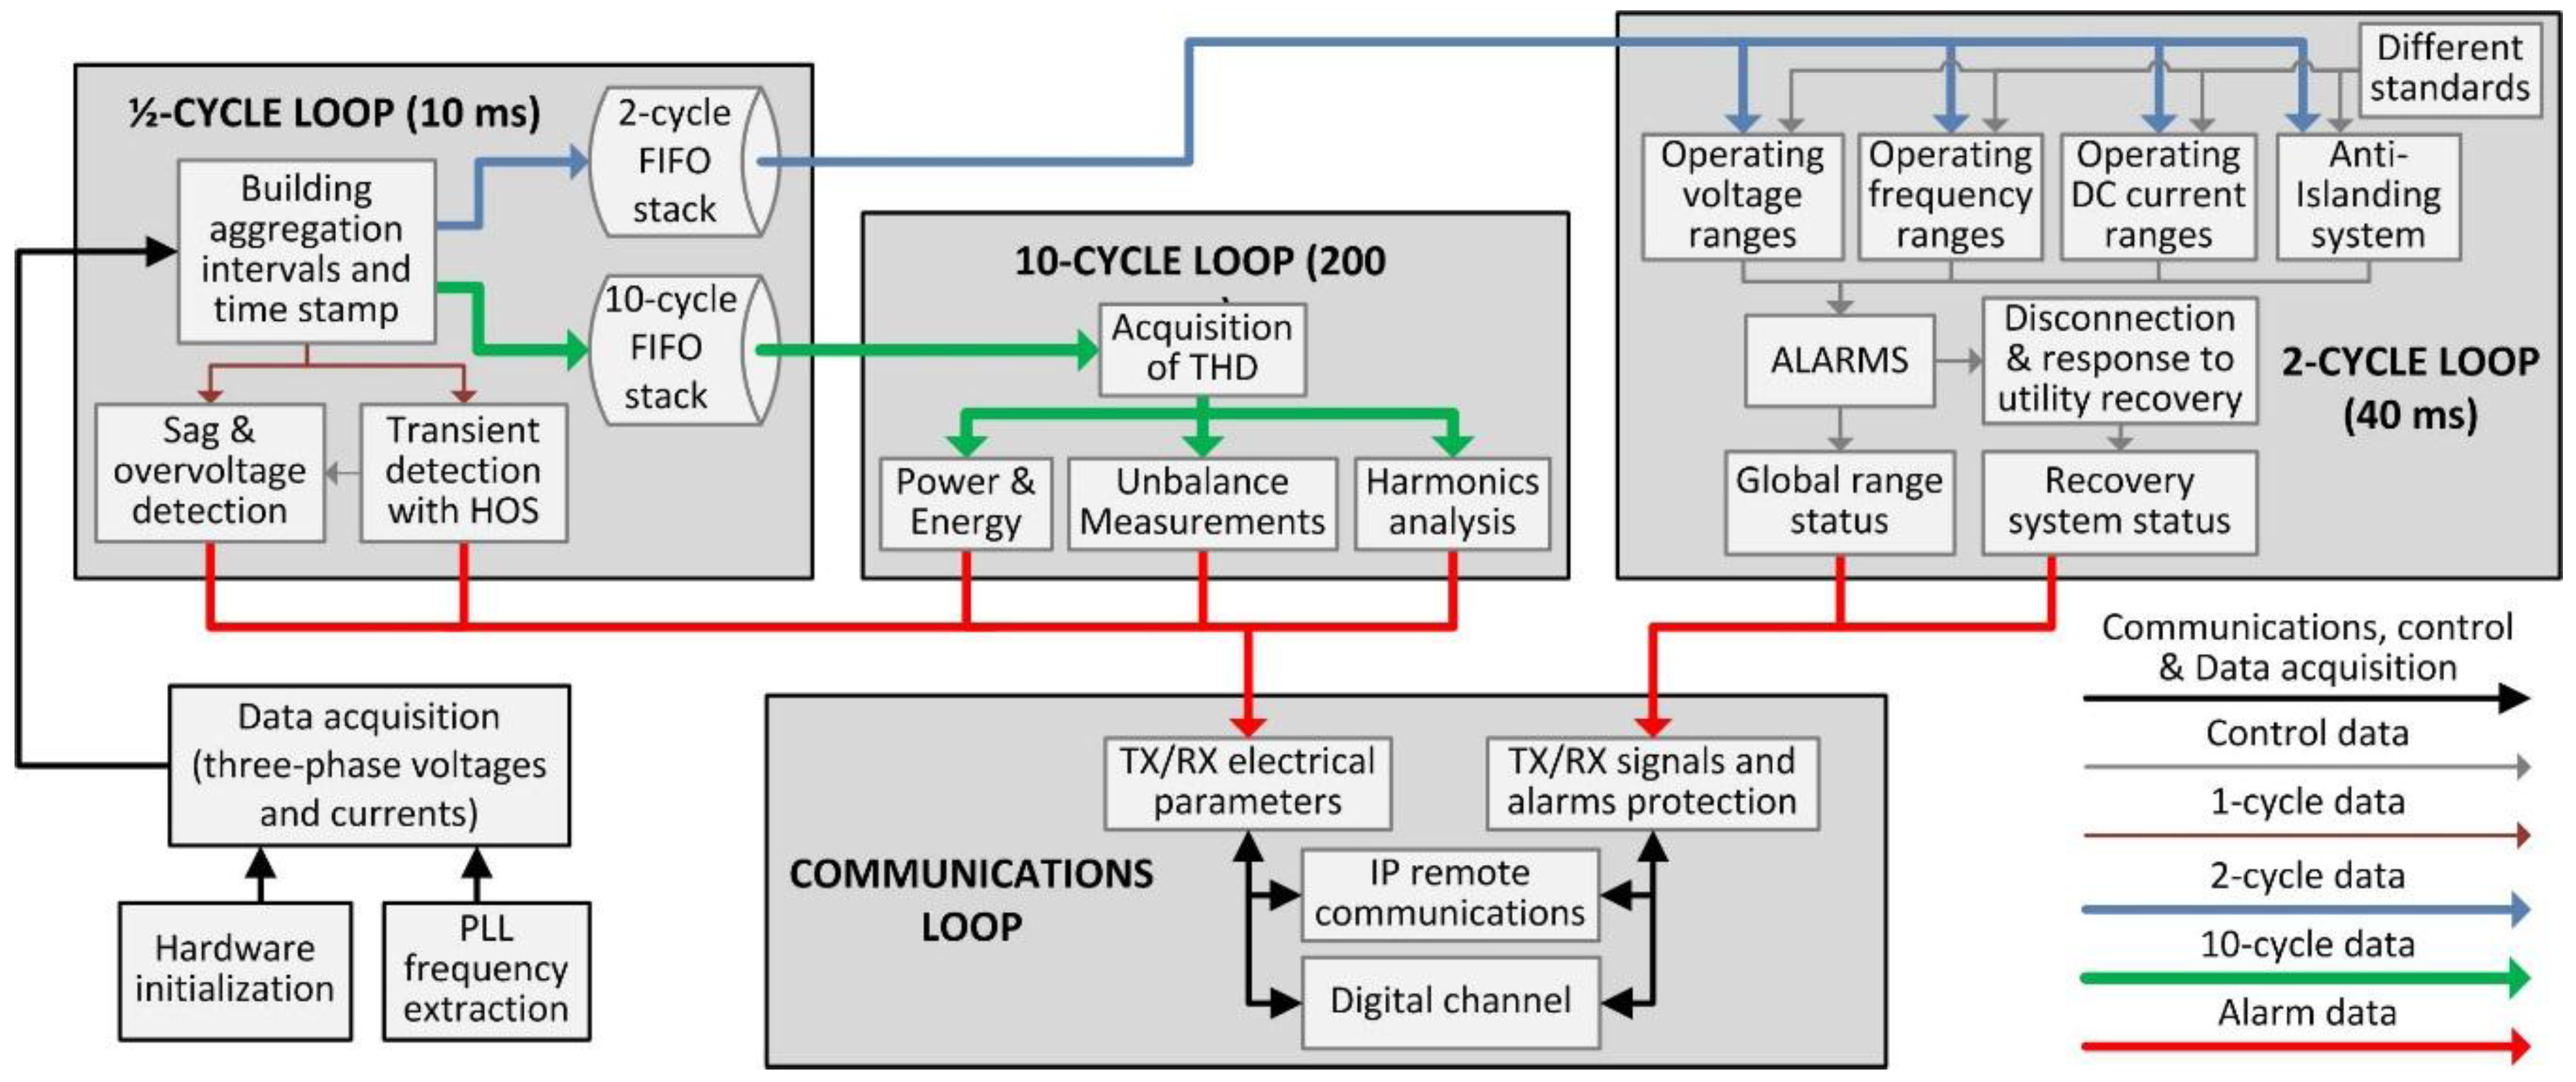
Figure 3 presents the architecture of the ES developed, with a scheme of the functionality, as well as the three processing routes.
To achieve this processing architecture, three critical loops with temporal determinism are used: half-cycle, 2-cycle and 10-cycle loops. Each of the functionalities of the ES is implemented in the corresponding loop according to the temporal requirements. The data transfer is undertaken from the quicker loops to the slower ones, using two FIFO stacks, one for 2-cycle data processing and the other for the 10-cycle data. Both stacks are managed by the real-time operating system. Cycle level data processing is performed in the half-cycle loop, in order to minimize delays and information loss.
Figure 4 shows a block diagram of the system.
For analyzing nonstationary parameters with a strong random component, the system uses data directly from the half-cycle loop (with parameters calculated at cycle level). For the rest of the parameters 2- and 10-cycle loop data from stacks, where such data is synchronized in real time, are used. Depending on the response time required in the system, data from one stack or the other will be used.
Data from 10-cycle loops have a higher stationarity, and therefore more stable values, but are associated with a greater delay due to the processing loop. They are used in non-critical operating conditions and for response times with some relaxation (over 400 ms).
Data from 2-cycle loops, which the team has termed quasi-stationary, are much faster and also have a certain rejection of random phenomena that may increase the probability of false positives in decision-making algorithms. This approach is advantageous when operating conditions are critical and protections have to act quickly.
A CompactRIO-9024 platform (National Instruments, Austin, TX, USA), programmable with LabVIEW (National Instruments, Austin, TX, USA), with a floating point PowerPC processor and a Field Programmable Gate Array (FPGA) were used, working with the real-time operating system VxWorks (Wind River, Alameda, CA, USA). Two data acquisition modules (NI 9225 and NI 9227, National Instruments, Austin, TX, USA) with a sampling capacity of 50 KSps were utilized in order to acquire three voltage and four current channels. These modules have a 24-bit resolution and Delta Sigma conversion with analogue prefiltering. A nominal sampling speed of 12.5 KSps was chosen in order to equilibrate the sampling for all of the channels. In our case, these acquisition modules are directly connected to the FPGA which is responsible for the samples’ synchronization and sequencing. It allows for a system response with almost no latency. Communication between the FPGA and the PowerPC for deterministic real-time applications is via a high speed PCI bus. Below is a description of some of the system’s functionalities, focusing on those that are oriented towards protections and power quality.
2.2. Protection Functionalities
As mentioned, this device works with a wide variety of standards (IEC 61727, IEC 62116, VDE 0126-1-1, IEEE 1547 and IEEE 929). Furthermore, its design provides it with the ability to adapt to the regulatory changes taking place. The algorithms used enable the device to work with different standards simultaneously, sending advice on protection and alarms according to the most restrictive standard activated within the equipment at a given time. An analysis of the state of alarm is performed in the subsystems responsible for generating signals for protection applications where the standards enabled within the equipment and the alarm signals which must be generated are verified. The alarm status always corresponds to the most restrictive standard which is enabled on the device at any given moment.
2.2.1. Operating Ranges Protections
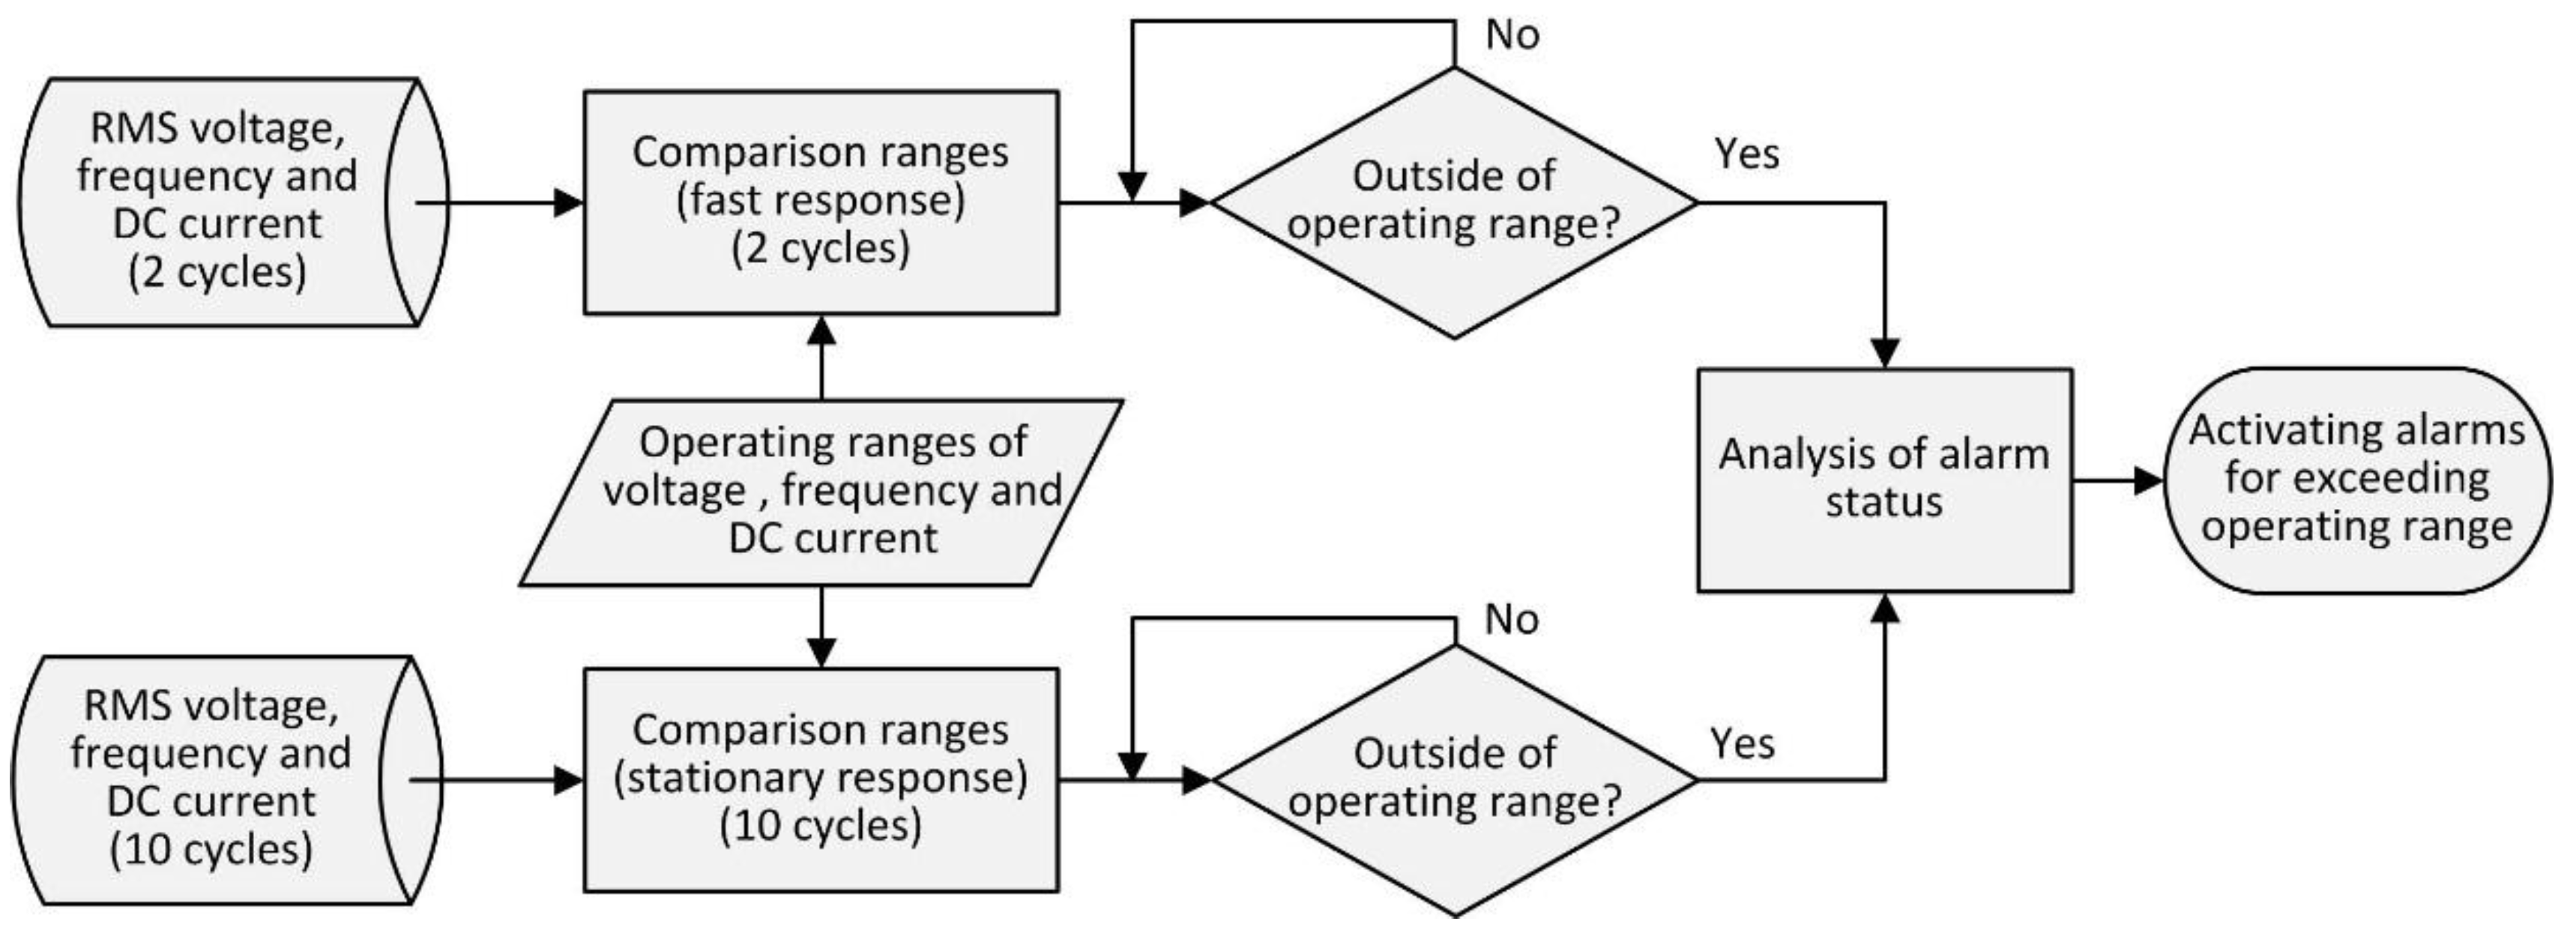
The IED is provided with a subsystem that simultaneously detects the voltage and frequency operating values in all three phases while also comparing these values to the range of operating values stipulated in a large number of regulations. Once these ranges are exceeded, the appropriate protections will be activated. In the case of the device being integrated into an inverter for photovoltaic applications, it is necessary to control the level of direct current (DC) injected into the grid by the equipment to ensure that it is below a maximum value which is defined by the regulations as a percentage of the nominal inverter current (typically around 1%) under all operating conditions.
The standards used in this subsystem are IEC 61727, VDE 0126-1-1, IEEE 1547 and IEEE 929. As already mentioned, the system presented here enables new regulatory changes to be introduced easily. The algorithm in
Figure 5 checks whether the voltage, frequency and DC current injection are within the operating windows. If not, it generates alarm signals directed to the maneuver equipment. Data from the 2-cycle stack are used for faster protection actions, while the 10-cycle data are used for alarms with a less demanding time response. At all times a display informs the user on the evolution of the signals of the electrical parameters and the alarms that are active. These data are classified as high-priority protection alarms and they are communicated to other entities or equipment.
2.2.2. Anti-Islanding Protection
Islanding is a situation that arises when the mains is switched off but distributed generation continues feeding power lines. This scenario, if not controlled, is potentially dangerous for both people and equipment. Therefore the DERs should be able to detect and take appropriate action by activating protective systems within a time slot, something which traditionally implied disconnecting distributed generation from the mains affected [
19,
20,
21].
The most efficient operational situation is where island scenarios are detected at the fault’s point of origin and entities and equipment in the affected areas are informed of this via communications networks. The communications infrastructure in power systems is increasing significantly, and in the medium-term future the grid itself might be able to self-diagnose the islanding situation. The equipment presented in this paper is pre-enabled to receive and transmit such alarm signals using communication channels.
However, at present, this communications systems-based diagnosis of islanding is not widespread and a redundant system based on local detection is required in which the device itself detects the island status. The anti-islanding system implemented in the ES is based on passive local detection because it is a less problematic approach than active detection [
22]. Active methods inject current distortion within the grid to assess if the primary generation is active or not. This causes an increase in harmonic distortion which especially affects several remote devices operating simultaneously in close proximity; in scenarios, for example, where there are multiple photovoltaic inverters.
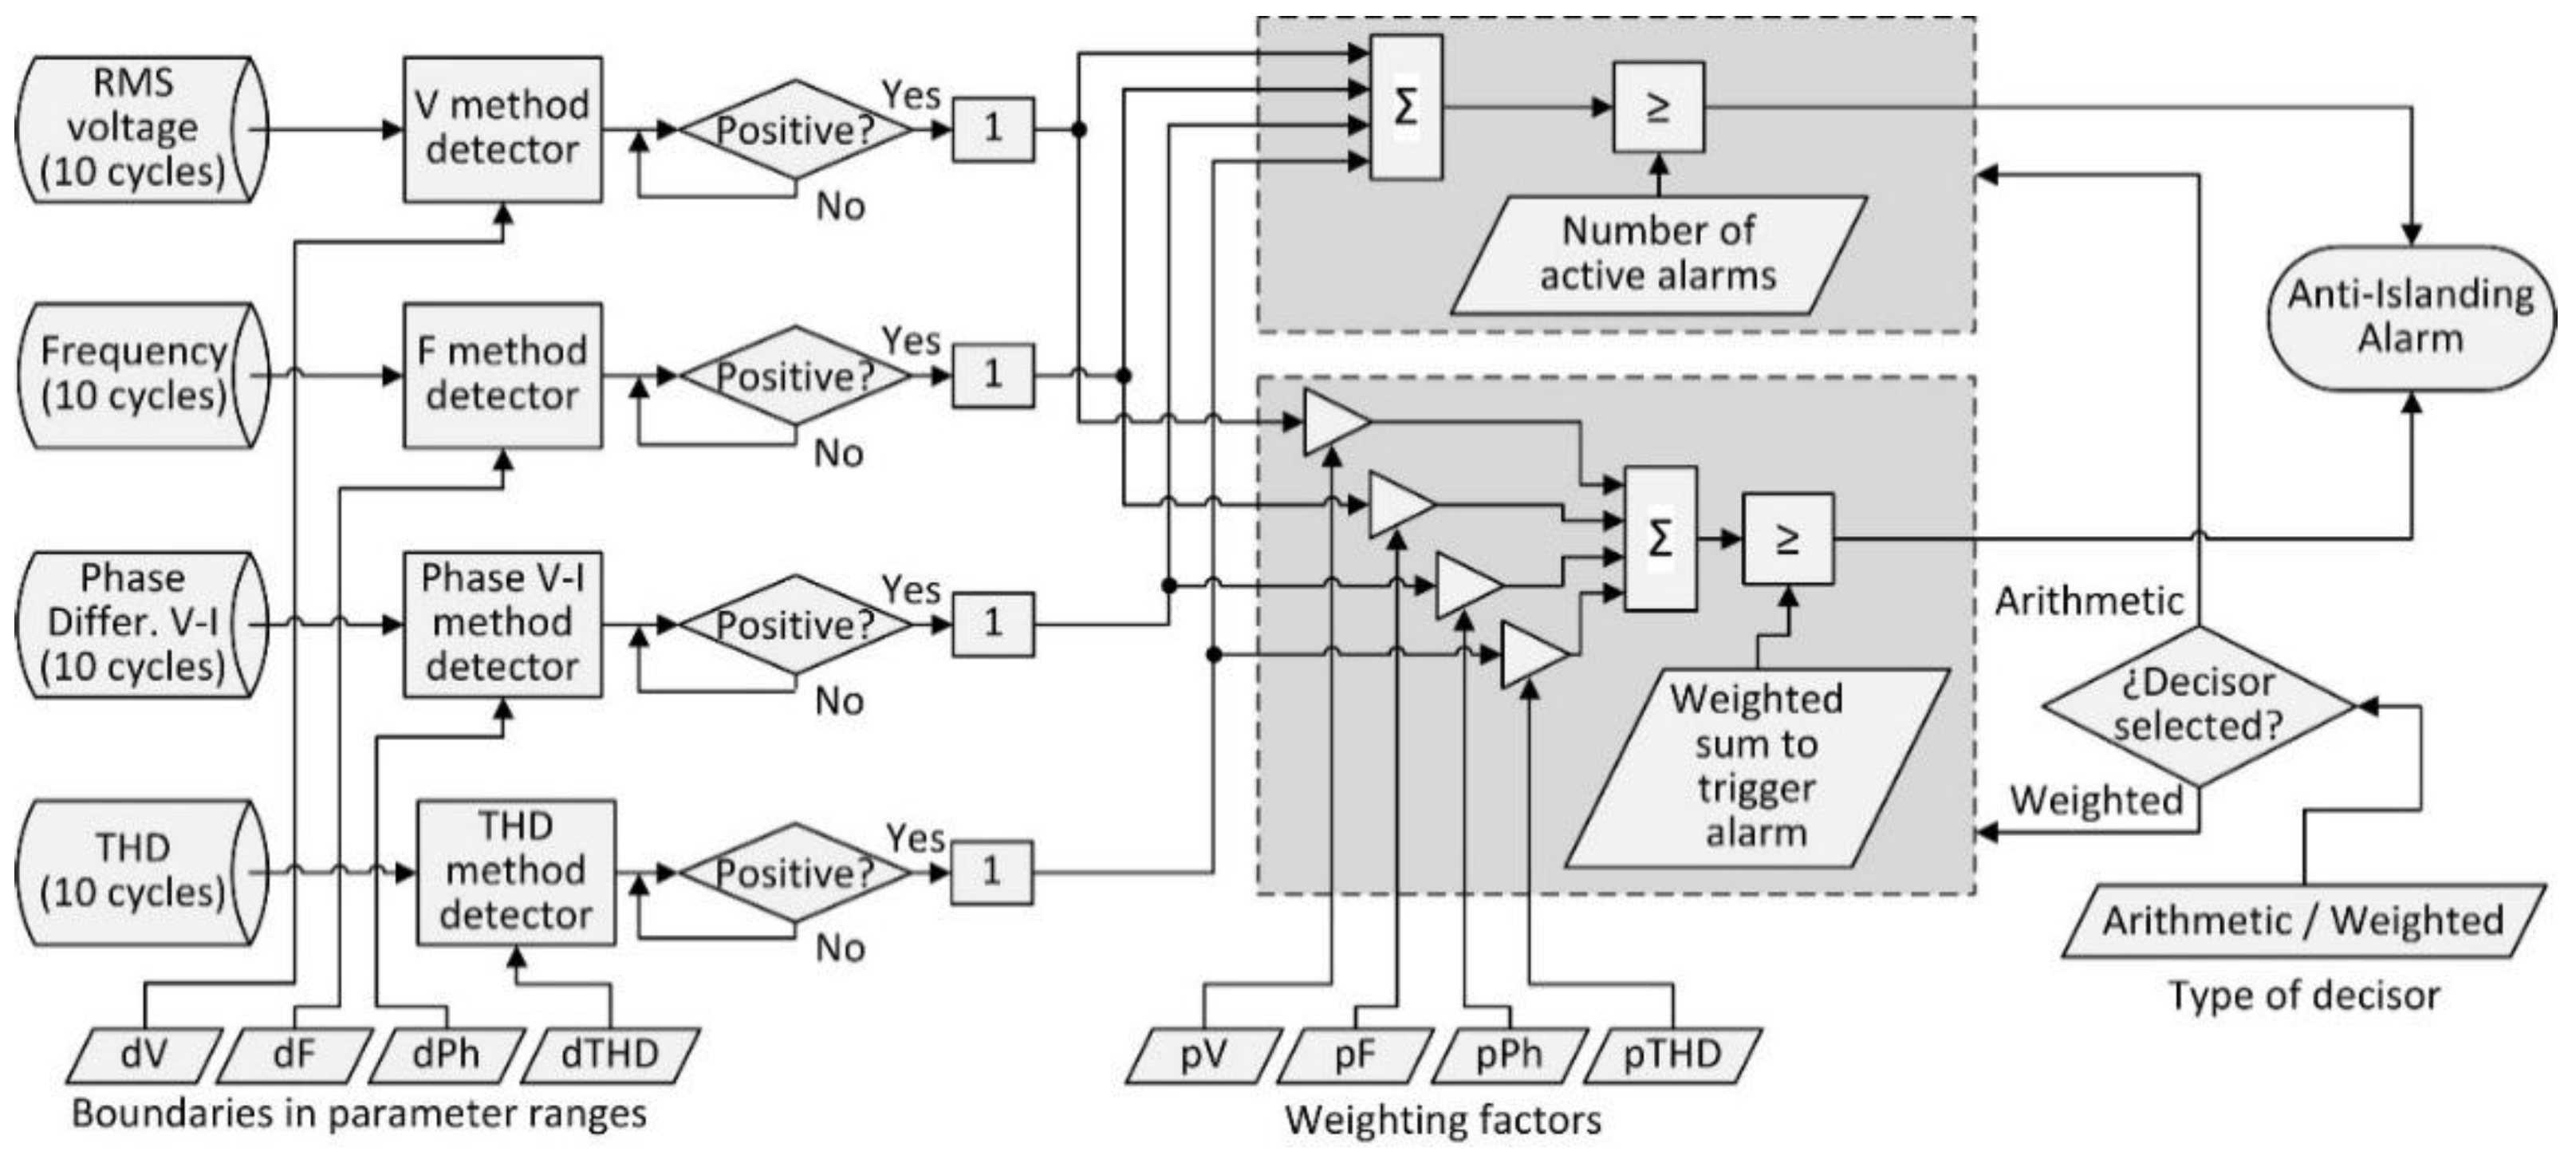
The approach of this local anti-islanding system is original. This passive autonomous detection is multiple because four simultaneous detection methods are used to minimize the uncertainty window problem of false positives [
22,
23].
Figure 6 shows the block diagram for this subsystem. Detection methods used include: voltage windowing, frequency windowing, Jump Phase Detection (JPD) and THD threshold detection. In addition, the system enables: (a) the detection range for each method to be configured; (b) the number of methods to decide on the status of islanding (arithmetic decider) to be configured; (c) different weights to be assigned to each method (weighted decisor), so that it can establish an order of priorities among them and improve the efficiency of detection.
This subsystem is based on 10-cycle parameter data, since they present more stationarity and allow enough time margins for the required response times by anti-islanding actions. The data of the four parameters (RMS voltage, frequency, phase difference between voltage and current, and voltage THD) apply to a specific detector for each. These detectors compare each set of a parameter’s 10-cycle data with this parameter’s medium- to long-term average value. This value, averaged over the medium to long term for voltage and frequency is taken from the 10-minute aggregation described in standard IEC 61000-4-30. In the case of THD and phase between voltage and current, an average of 2 min was decided upon because there is greater variability depending on the load conditions. Therefore, a stationary estimate of the parameter with which to compare the samples to 10 cycles is obtained and since the islanding situation causes a progressive increase in spacing from this average value, a relatively simple and effective method of detection is achieved. To define a positive detection, the user can choose the threshold distance between the data at 10 cycles and the average value.
The system also allows the user to choose between a weighted or an unweighted decisor. The unweighted decisor acknowledges the alarm when a number of positive detections for different methods occur simultaneously. On the other hand, the weighted decisor takes into account the relevance of each detection method to achieve a finer adjustment of the subsystem. In the first case, the active detection number (integer from 1 to 4) is selected to activate the alarm. In the second case, the system calculates the contribution of each detection according to its weight and the alarm is triggered if the calculated value exceeds a user-configurable value.
2.3. Power Quality
The most relevant functionalities of the system in relation to power quality (PQ) are described below. These PQ functions of the equipment are based on standard IEC 61000-4-30, which defines the power quality parameter measurement methods in 50/60 Hz power grids and how to interpret the results. Below is a description of these subsystems.
2.3.1. Spectral Analysis, Imbalance Measurements, Power and Energy
This subsystem is synchronized in a temporary 10-cycle loop, with voltage and current data from the 10-cycle stack. This means that every 200 ms the system has spectral information of at least the first 50 harmonics and 50 interharmonics of the signal monitored at the interconnection point. Due to the large amount of spectral information, this is one of the subsystems that generate the greatest computational load. In addition to giving information about the voltage harmonic spectrum, it also shows the values of the harmonic groupings and sub-groupings according to IEC standard 4100-4-7. The subsystem also calculates the THD of voltage and current.
For imbalance measurements, the subsystem presents the components of sequence zero, positive and negative and unbalanced relationships of sequence zero and negative sequence for both the voltage and current.
The values of apparent active and reactive power in the signal, the values of active and reactive power in the fundamental component and the power factor are presented. It also reports on similar values in terms of energy: the energies of positive and negative sequence, as well as inductive and capacitive reactive energy.
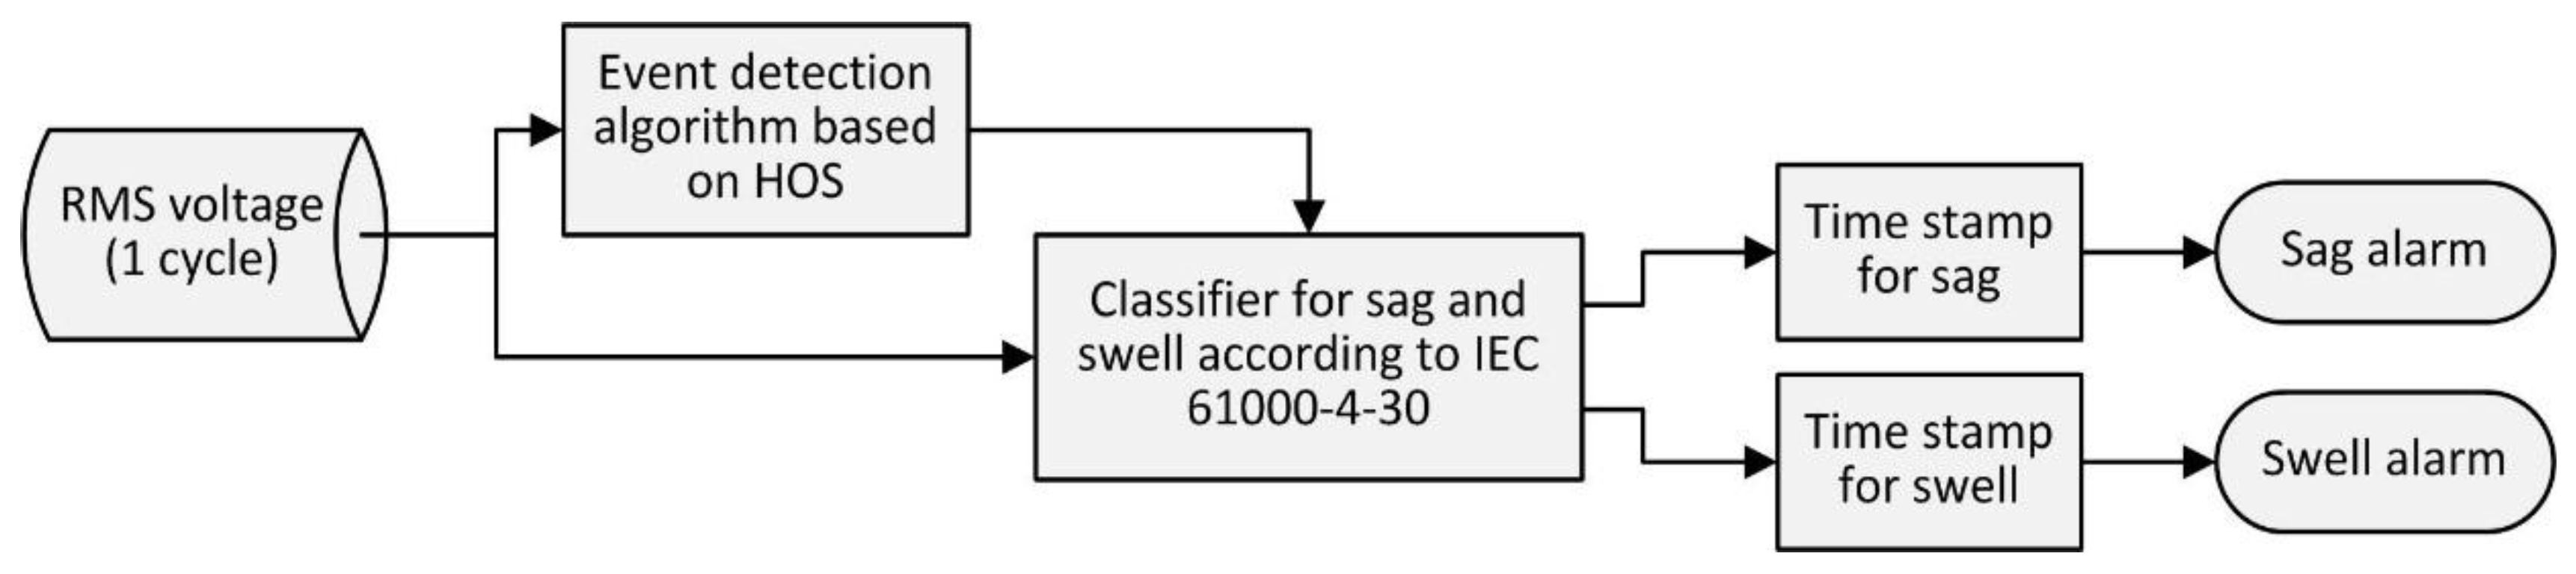
2.3.2. Event Detection
Higher-order statistics (HOS) have shown their potential to deal with impulsive and non-linear time-series in the PQ analysis frame [
18,
24]. In fact, HOS take into account an extended set of features that enhance detection and make the decision-making stage feasible. More precisely, the work [
25], where second and higher-order features are combined to take a decision on the event under study, has been adopted to implement the detection algorithm, this time on an autonomous platform.
With regard to the use of estimators applied to the signals being tested, the results are obtained by using sliding cumulants, i.e., a moving window in the time domain over which to compute each cumulant (3rd- and 4th-order cumulants for zero time-lag). The hypothesis of robustness (repeatability) for the HOS estimators is satisfied throughout the whole measurement process, so pre-normalizing signals is compulsory. This stage is considered as an in situ calibration and allows the instrument to adapt to different power-generation systems. Thus, normalized values (for a healthy signal) correspond to unit amplitude and variance of 0.5.
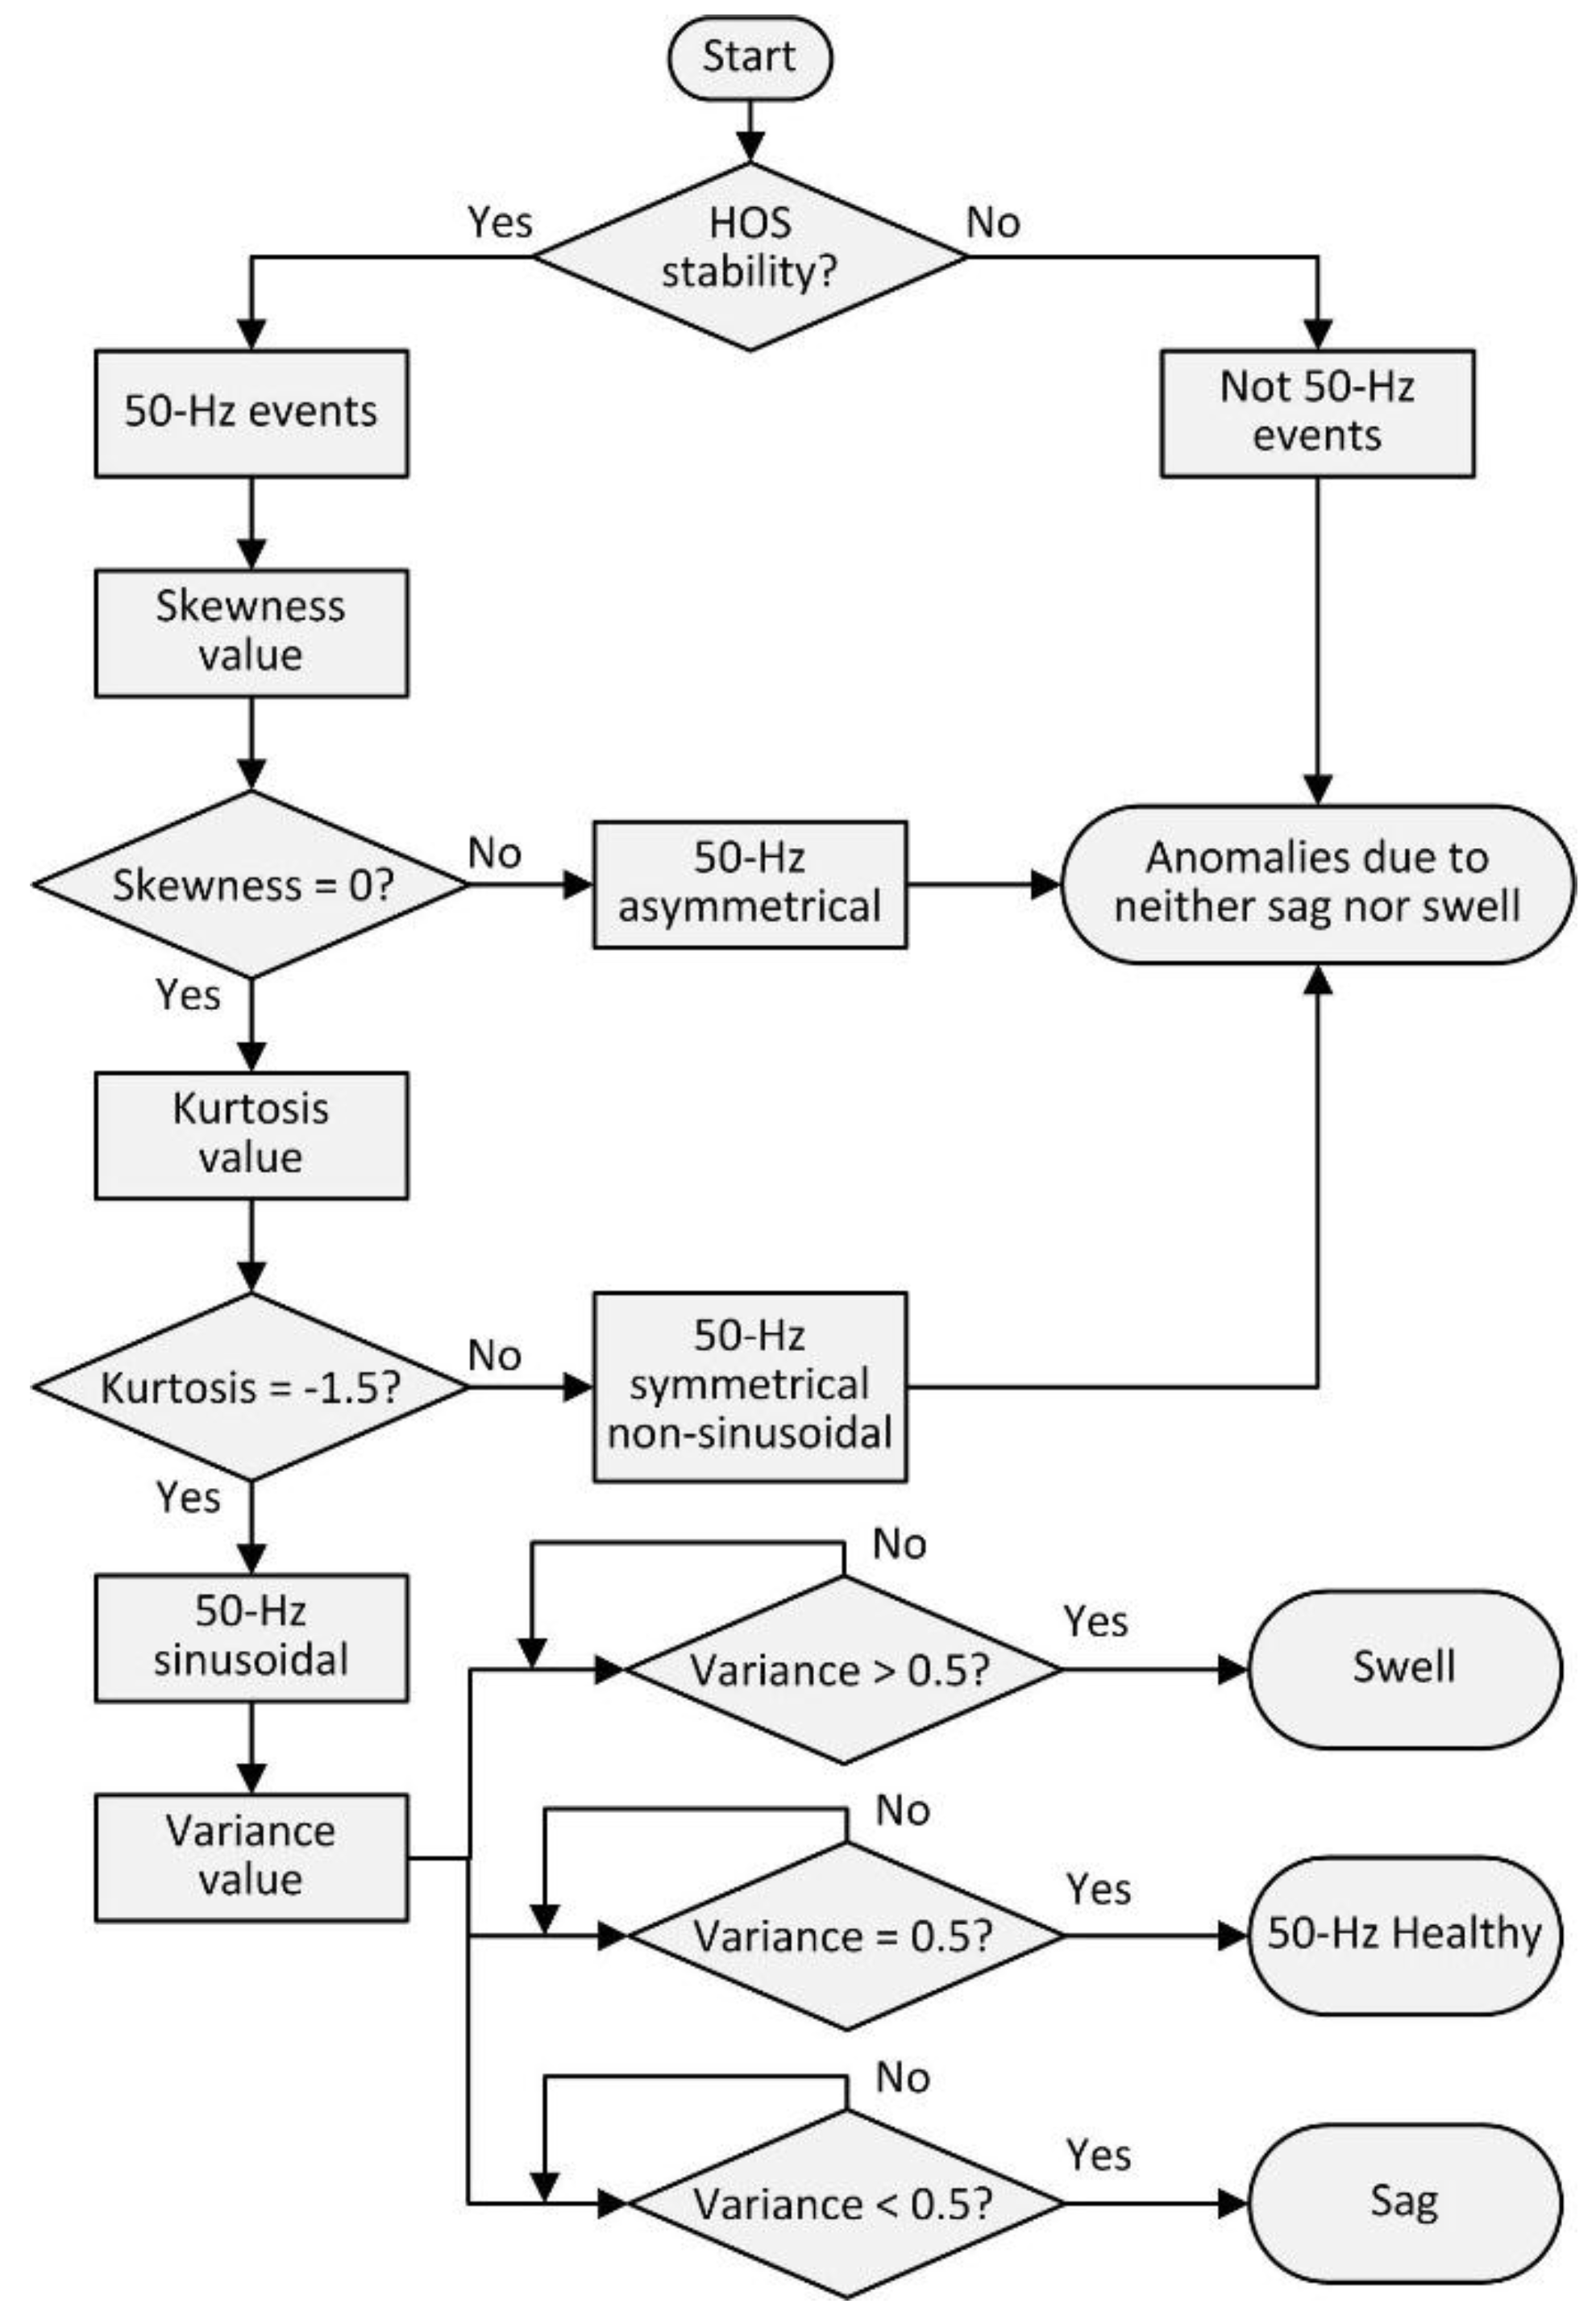
Based on the former premise, the detection strategy is described below. The expected 50-Hz voltage waveform exhibits constant statistical behavior (stationarity), i.e., with concrete, stable statistical parameters as the sliding windows check it. Therefore, any disturbance that alters these nominal values while conserving their frequency (50 Hz), would exhibit another stable statistical state, being characterized this time by a new set of statistical parameters, different from the ones with regard to the undistorted steady-state. Those which do not maintain their frequency will be targeted, but will not exhibit constant statistical parameters.
The logical reasoning process, shown in
Figure 7, represents all the possible cases resulting from the calculation of the estimators (for each position of the sliding window) and the interpretation that the Case-Based Reasoning (CBR) module performs on the triplet vector.
Once the events have been detected and identified with the HOS-based algorithm, this subsystem also classifies the sag and swell levels according to the criteria of standard IEC 61000-4-30. Finally, a time stamp is applied to event data and the corresponding alarm is triggered.
Figure 8 shows the block diagram of the event detection subsystem.
3. Testing and Experimental Results
Based on the design defined above, the ES prototype has been developed and tested to validate its behavior. From the point of view of electrical parameters monitoring, tests to verify the quality of the measurements have been carried out. The systems that generate orders and alarms related to protections were also tested by measuring the temporal response to critical events. Below, the experimental tests and results are presented and discussed.
3.1. Tests for Quality on Electrical Parameters Measurements
In order to confirm the quality of electrical parameters measurements carried out following the methodology of IEC standard 61000-4-30, the prototype has been subjected to testing protocols according to standard IEC 62586-2, both Class A and Class S. In these tests the measurement uncertainty is calculated and verified so that it is below the limits proposed at different operating points. How certain influencing quantities affect uncertainty was also shown.
The methodology used was based on the analysis of central tendency and dispersion statistics applied to the data series of experimental measurements obtained with the prototype. This analysis used graphical statistical tools such as histograms and boxplots, and also calculated the probability density plots of the series using non-parametric estimation based on kernel [
26]. The results of the tests of uncertainty are related to a normal Gaussian distribution, with coverage factor k = 2, and a confidence level of p = 95%.
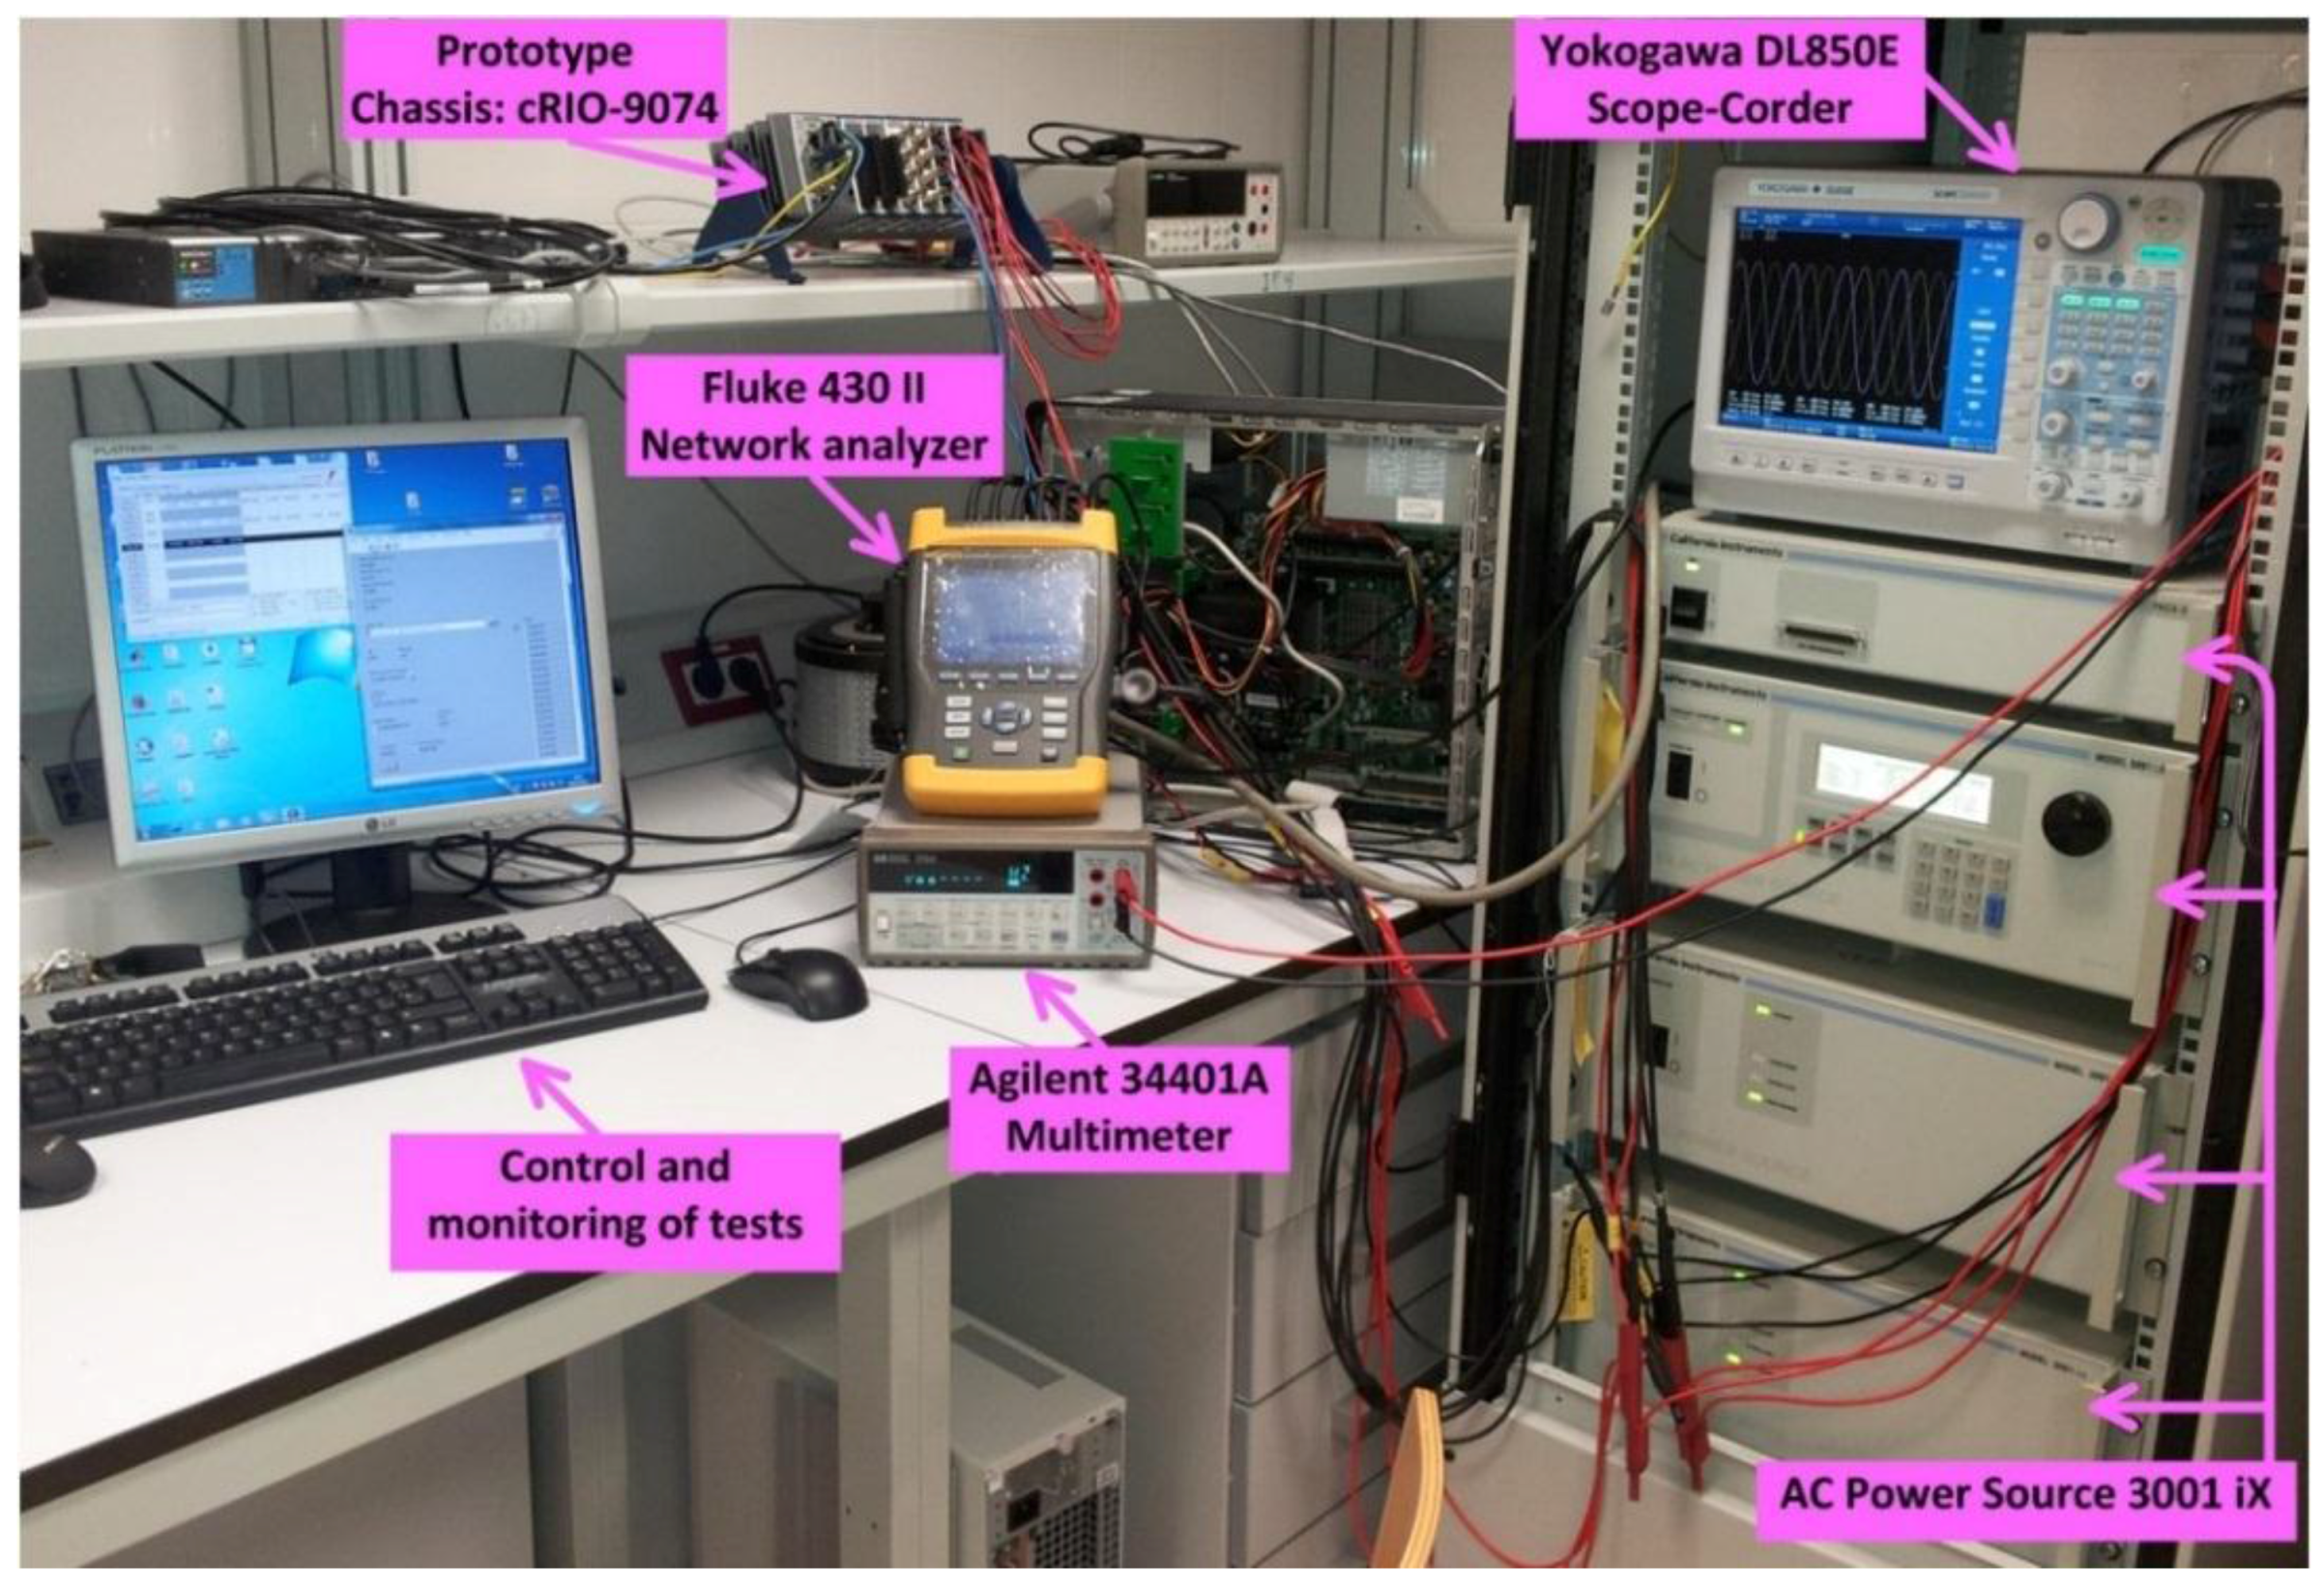
A three-phase power source, AC iX 3001 from California Instruments (AMETEK Programmable Power Inc., San Diego, CA, USA), was used to perform these tests. To contrast the measurements taken with the prototype, a 430 II analyzer grid (Fluke Corporation, Everett, WA, USA) and a 34401A multimeter (Agilent, Santa Clara, CA, USA) with 6½ digits, was used together with a DL850E ScopeCorder oscilloscope-recorder (Yokogawa Electric Corporation, Tokyo, Japan). In all tests a nominal reference voltage of 230 V was used. The series of measurement data on the prototype have been built with a 5-min observation period, samples being taken every 200 ms.
Figure 9 shows an image of the scene during these tests.
Given the extent of the applied testing protocol, this paper will only present a summary of the most important results. This paper will focus on measurements of fundamental parameters such as frequency and voltage, and the results of harmonics measurements. Furthermore, given their greater relevance, only the results for the A class tests will be discussed here, although the prototype was also tested with the class S protocol, passing it with a wide margin.
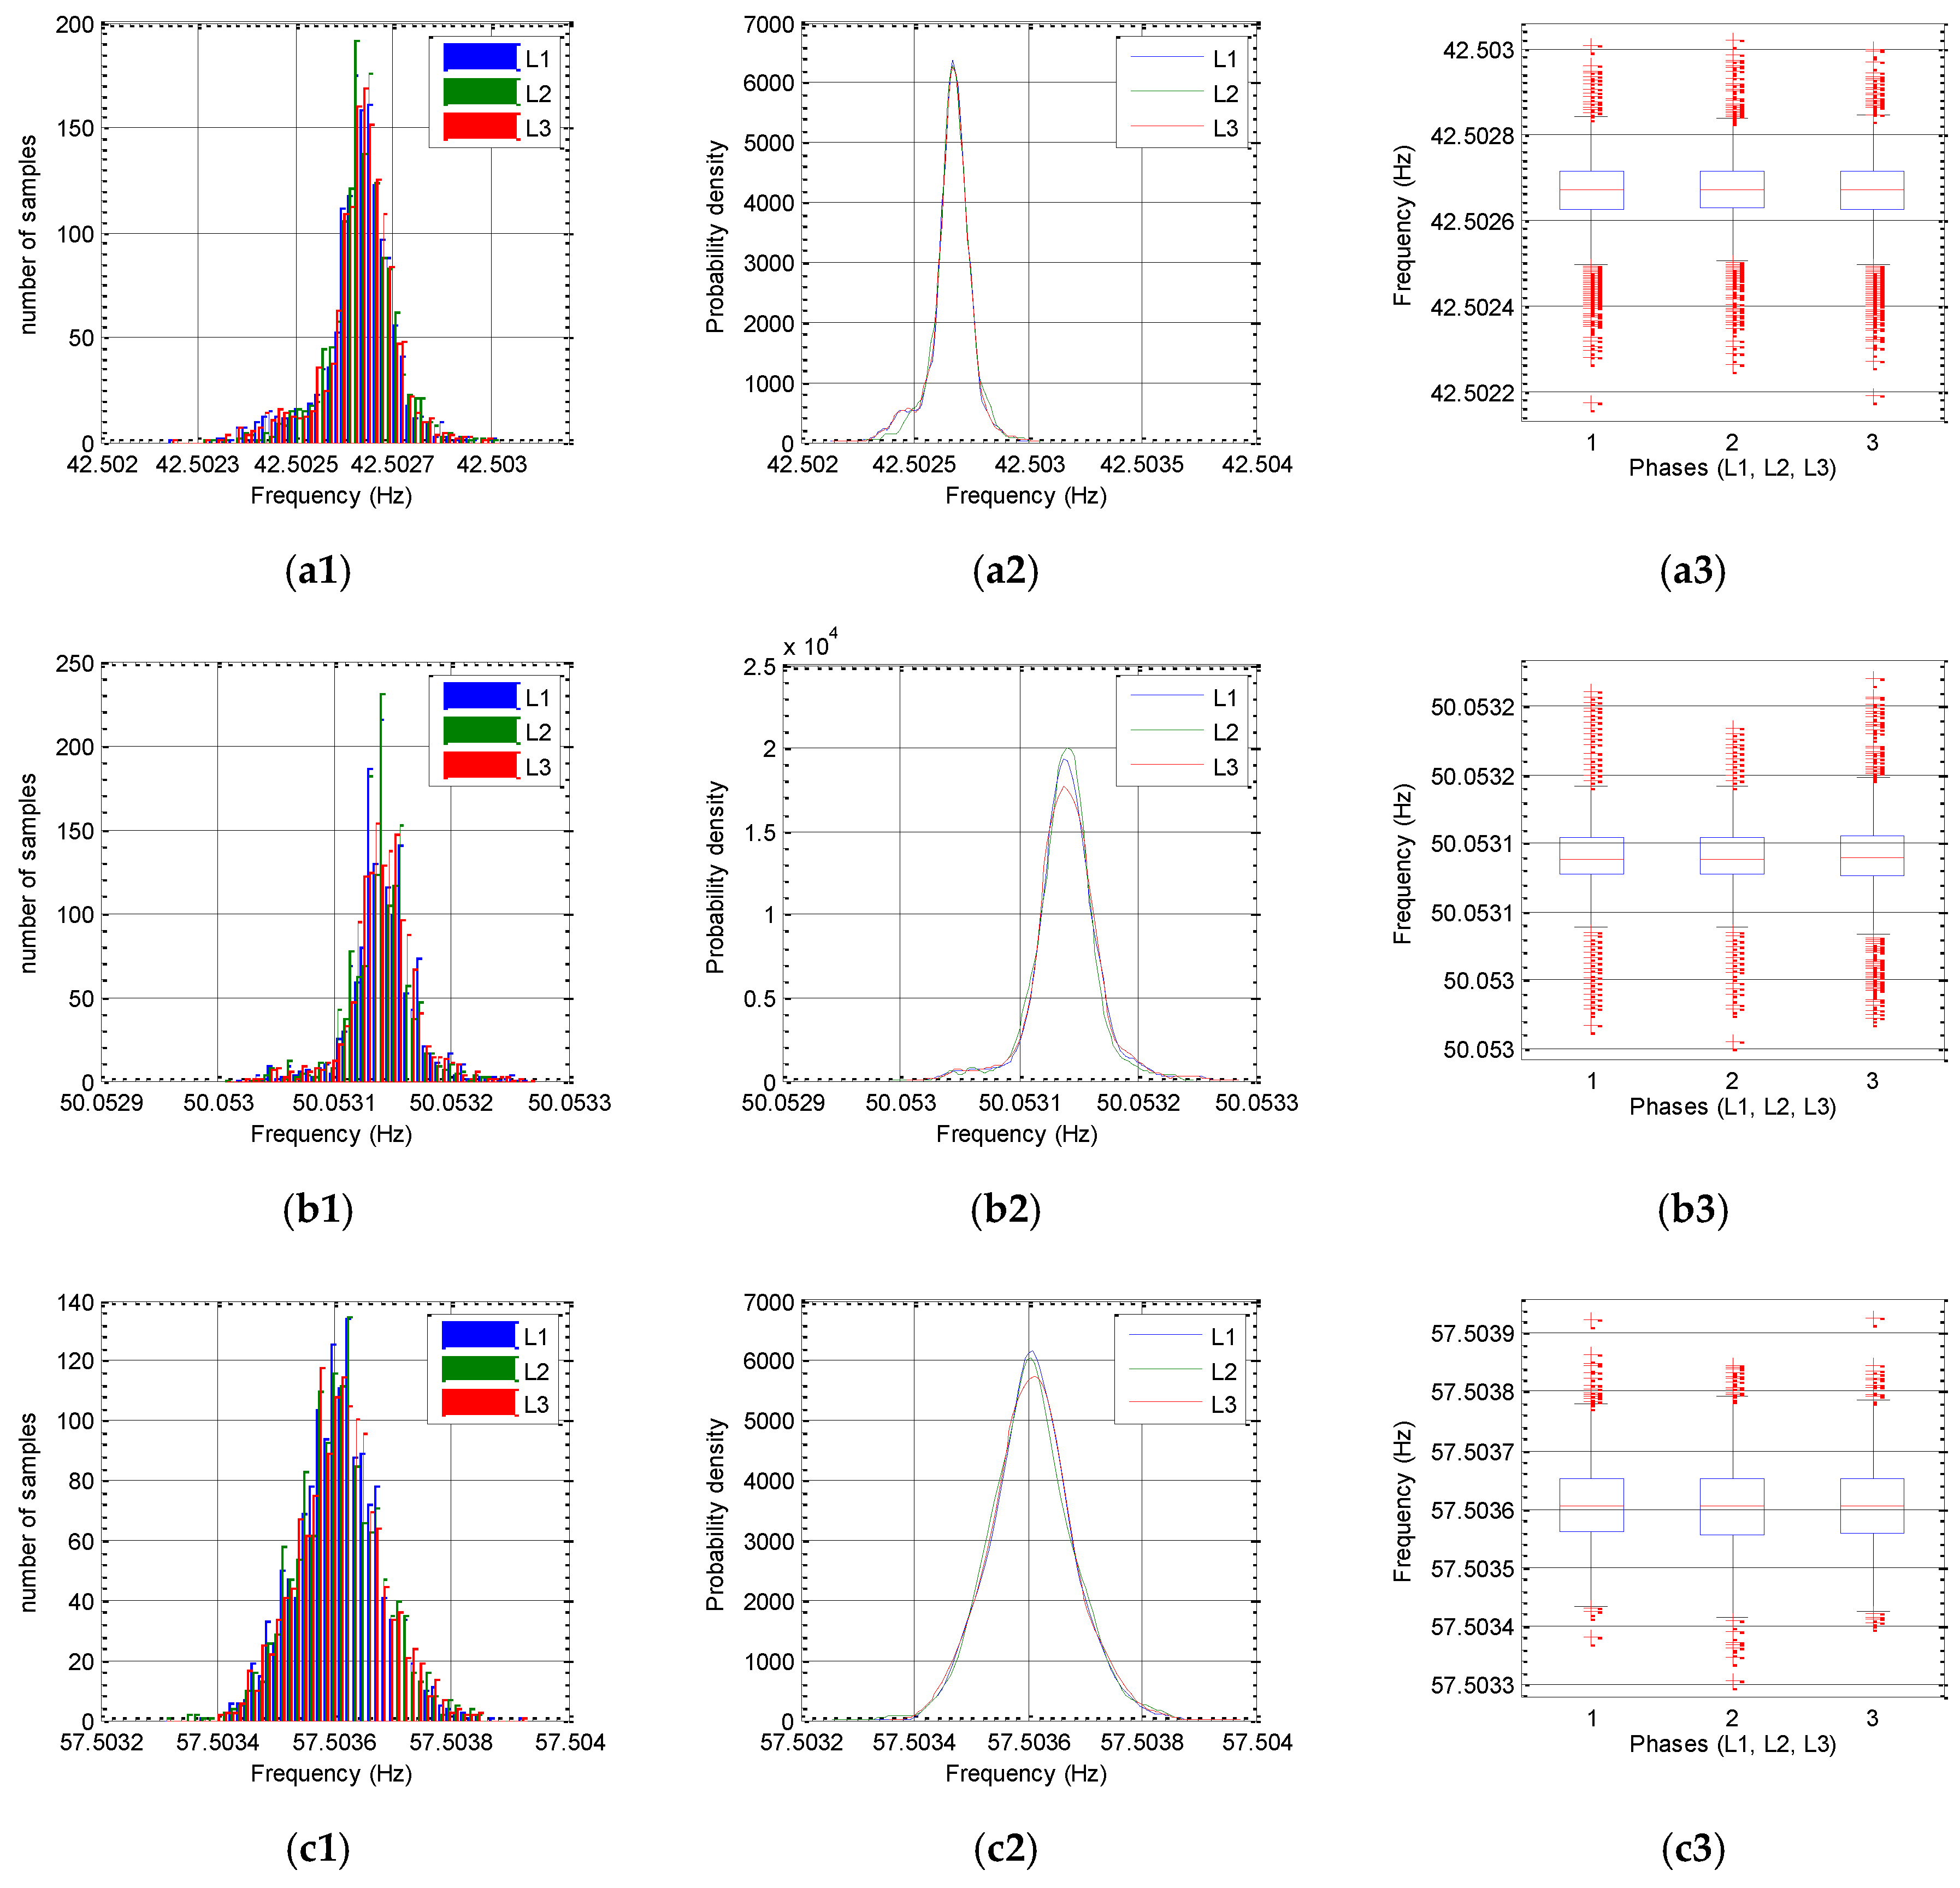
Table 1 shows a summary of the tests performed to check the uncertainty in frequency measurements carried out with the prototype.
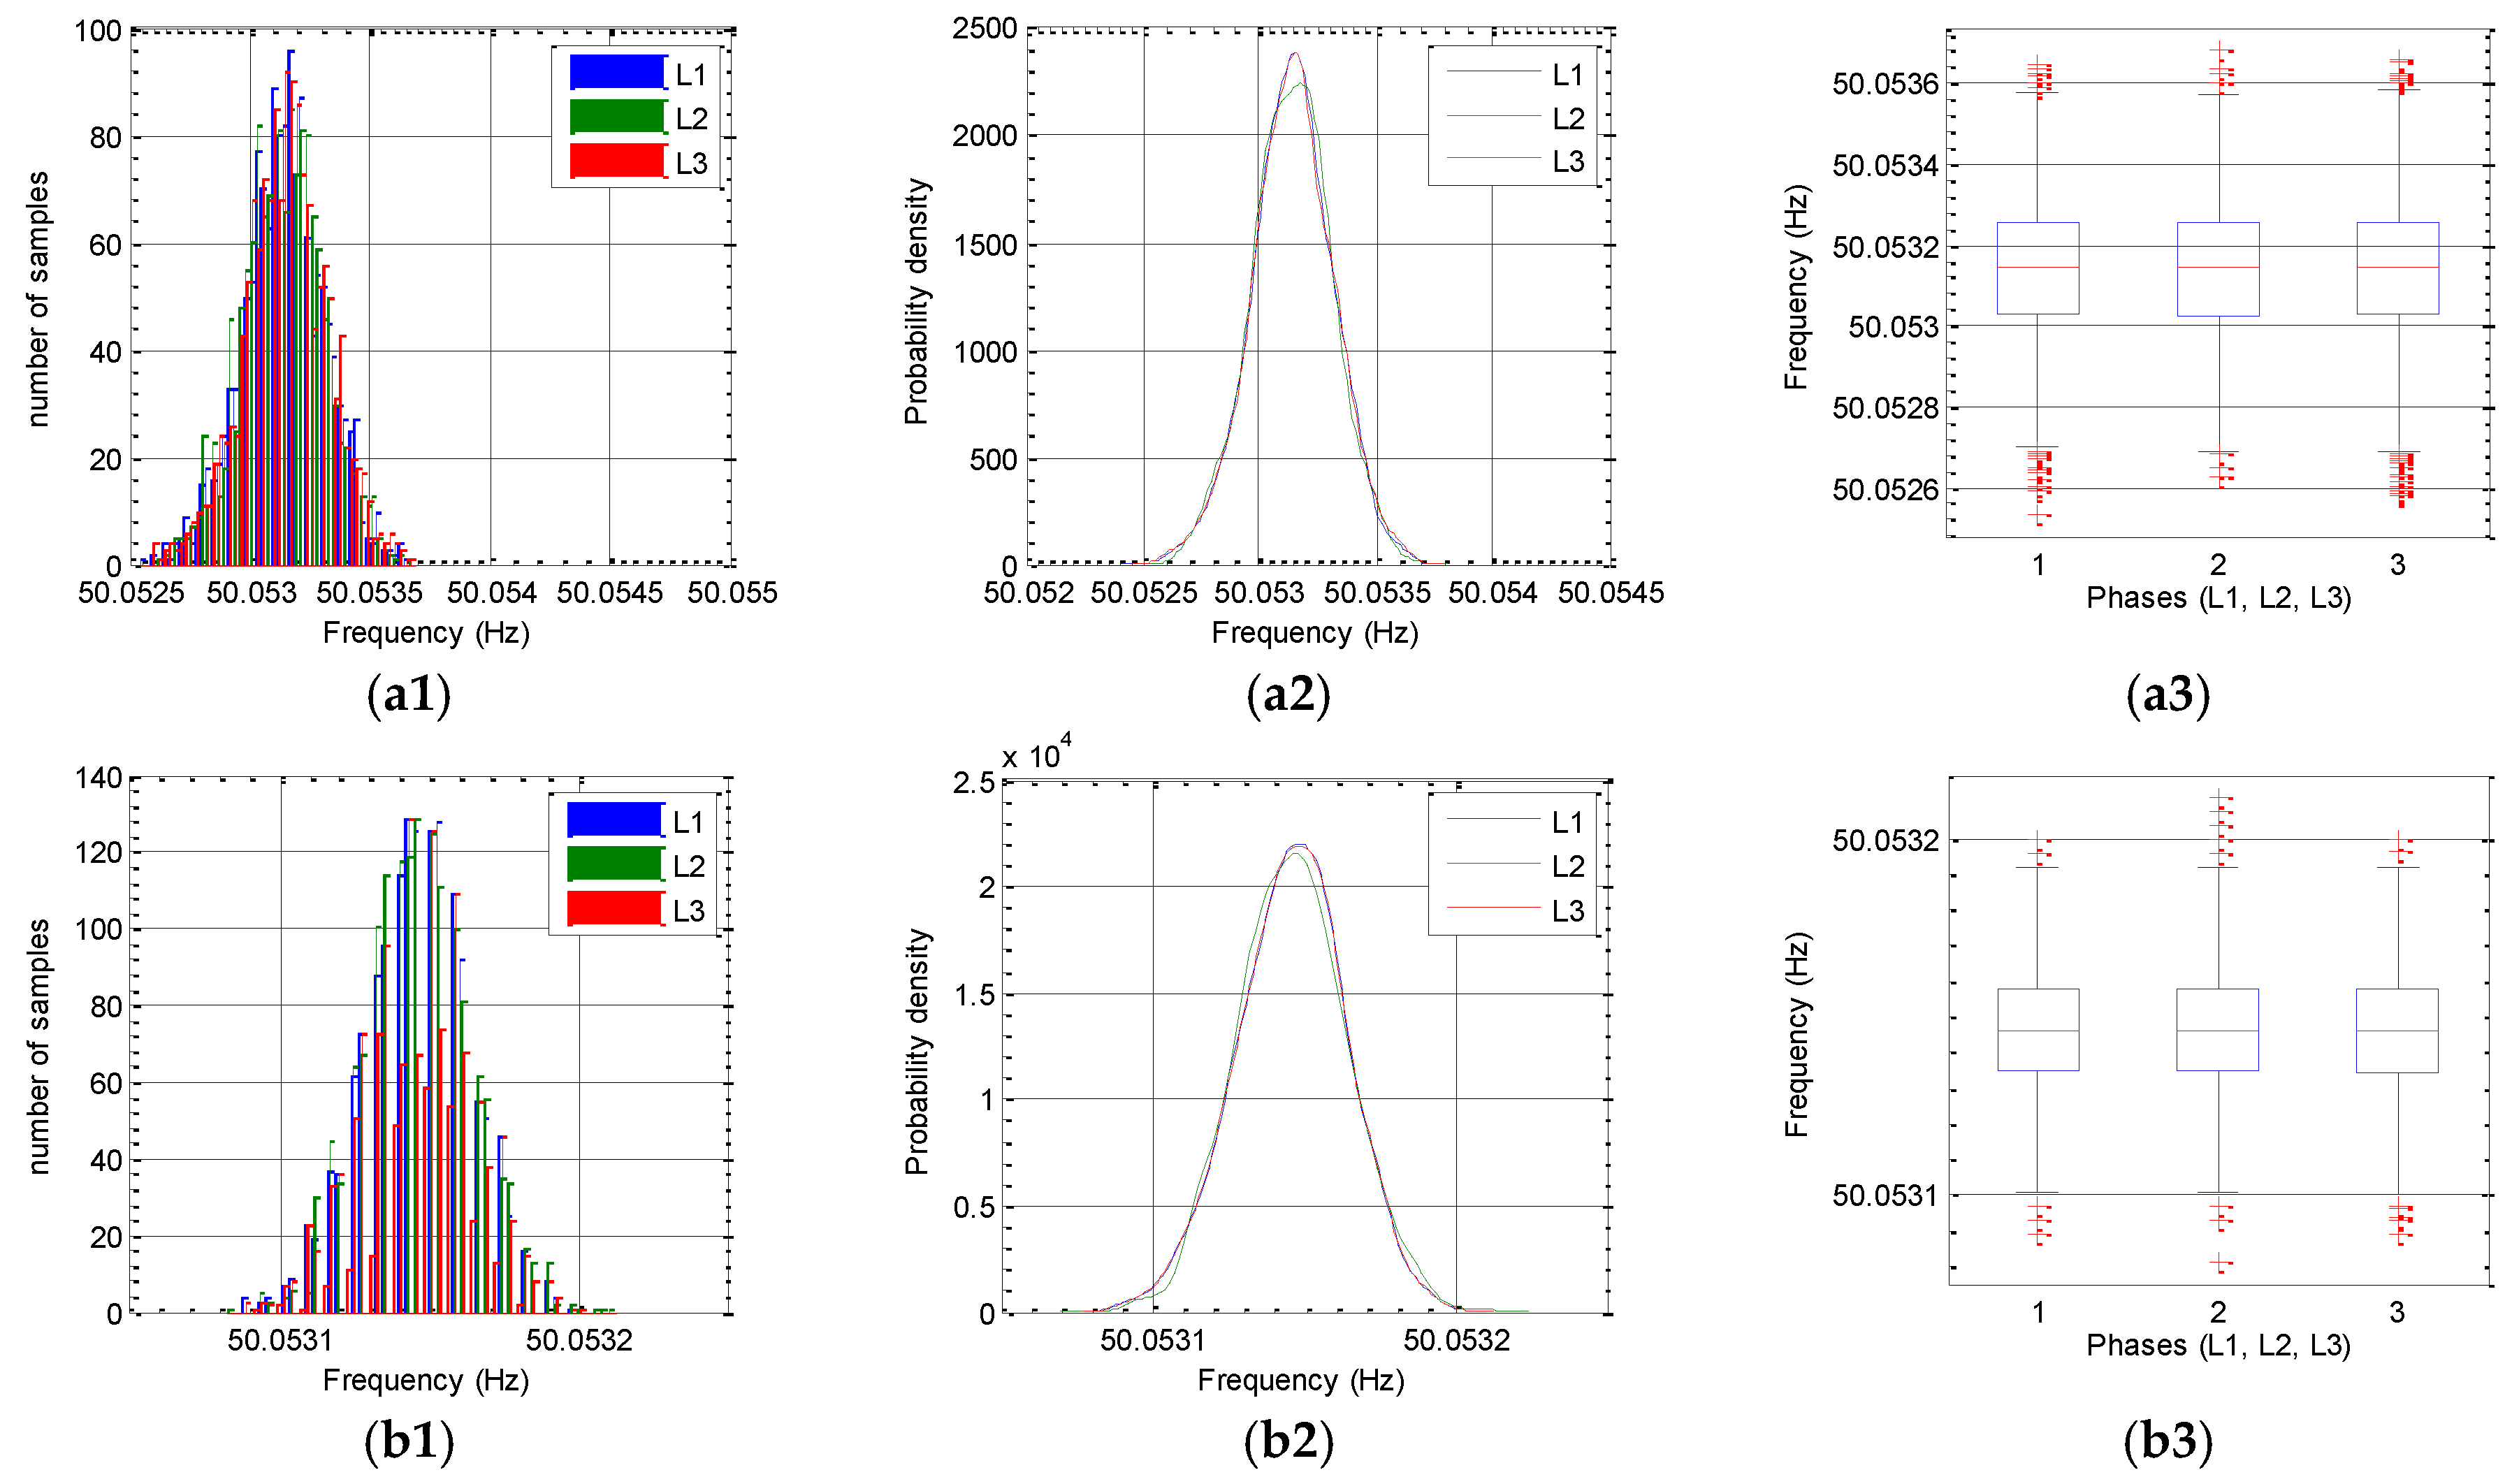
Figure 10 and
Figure 11 show the statistical behavior of the measurements performed in these tests. A high measurement quality with low levels of dispersion in the series of measured data can be observed, is associated with very low uncertainties in the measurements, with values of less than ±0.4 mHz, far behind the limit of ±10 mHz required by standard IEC 62586-2.
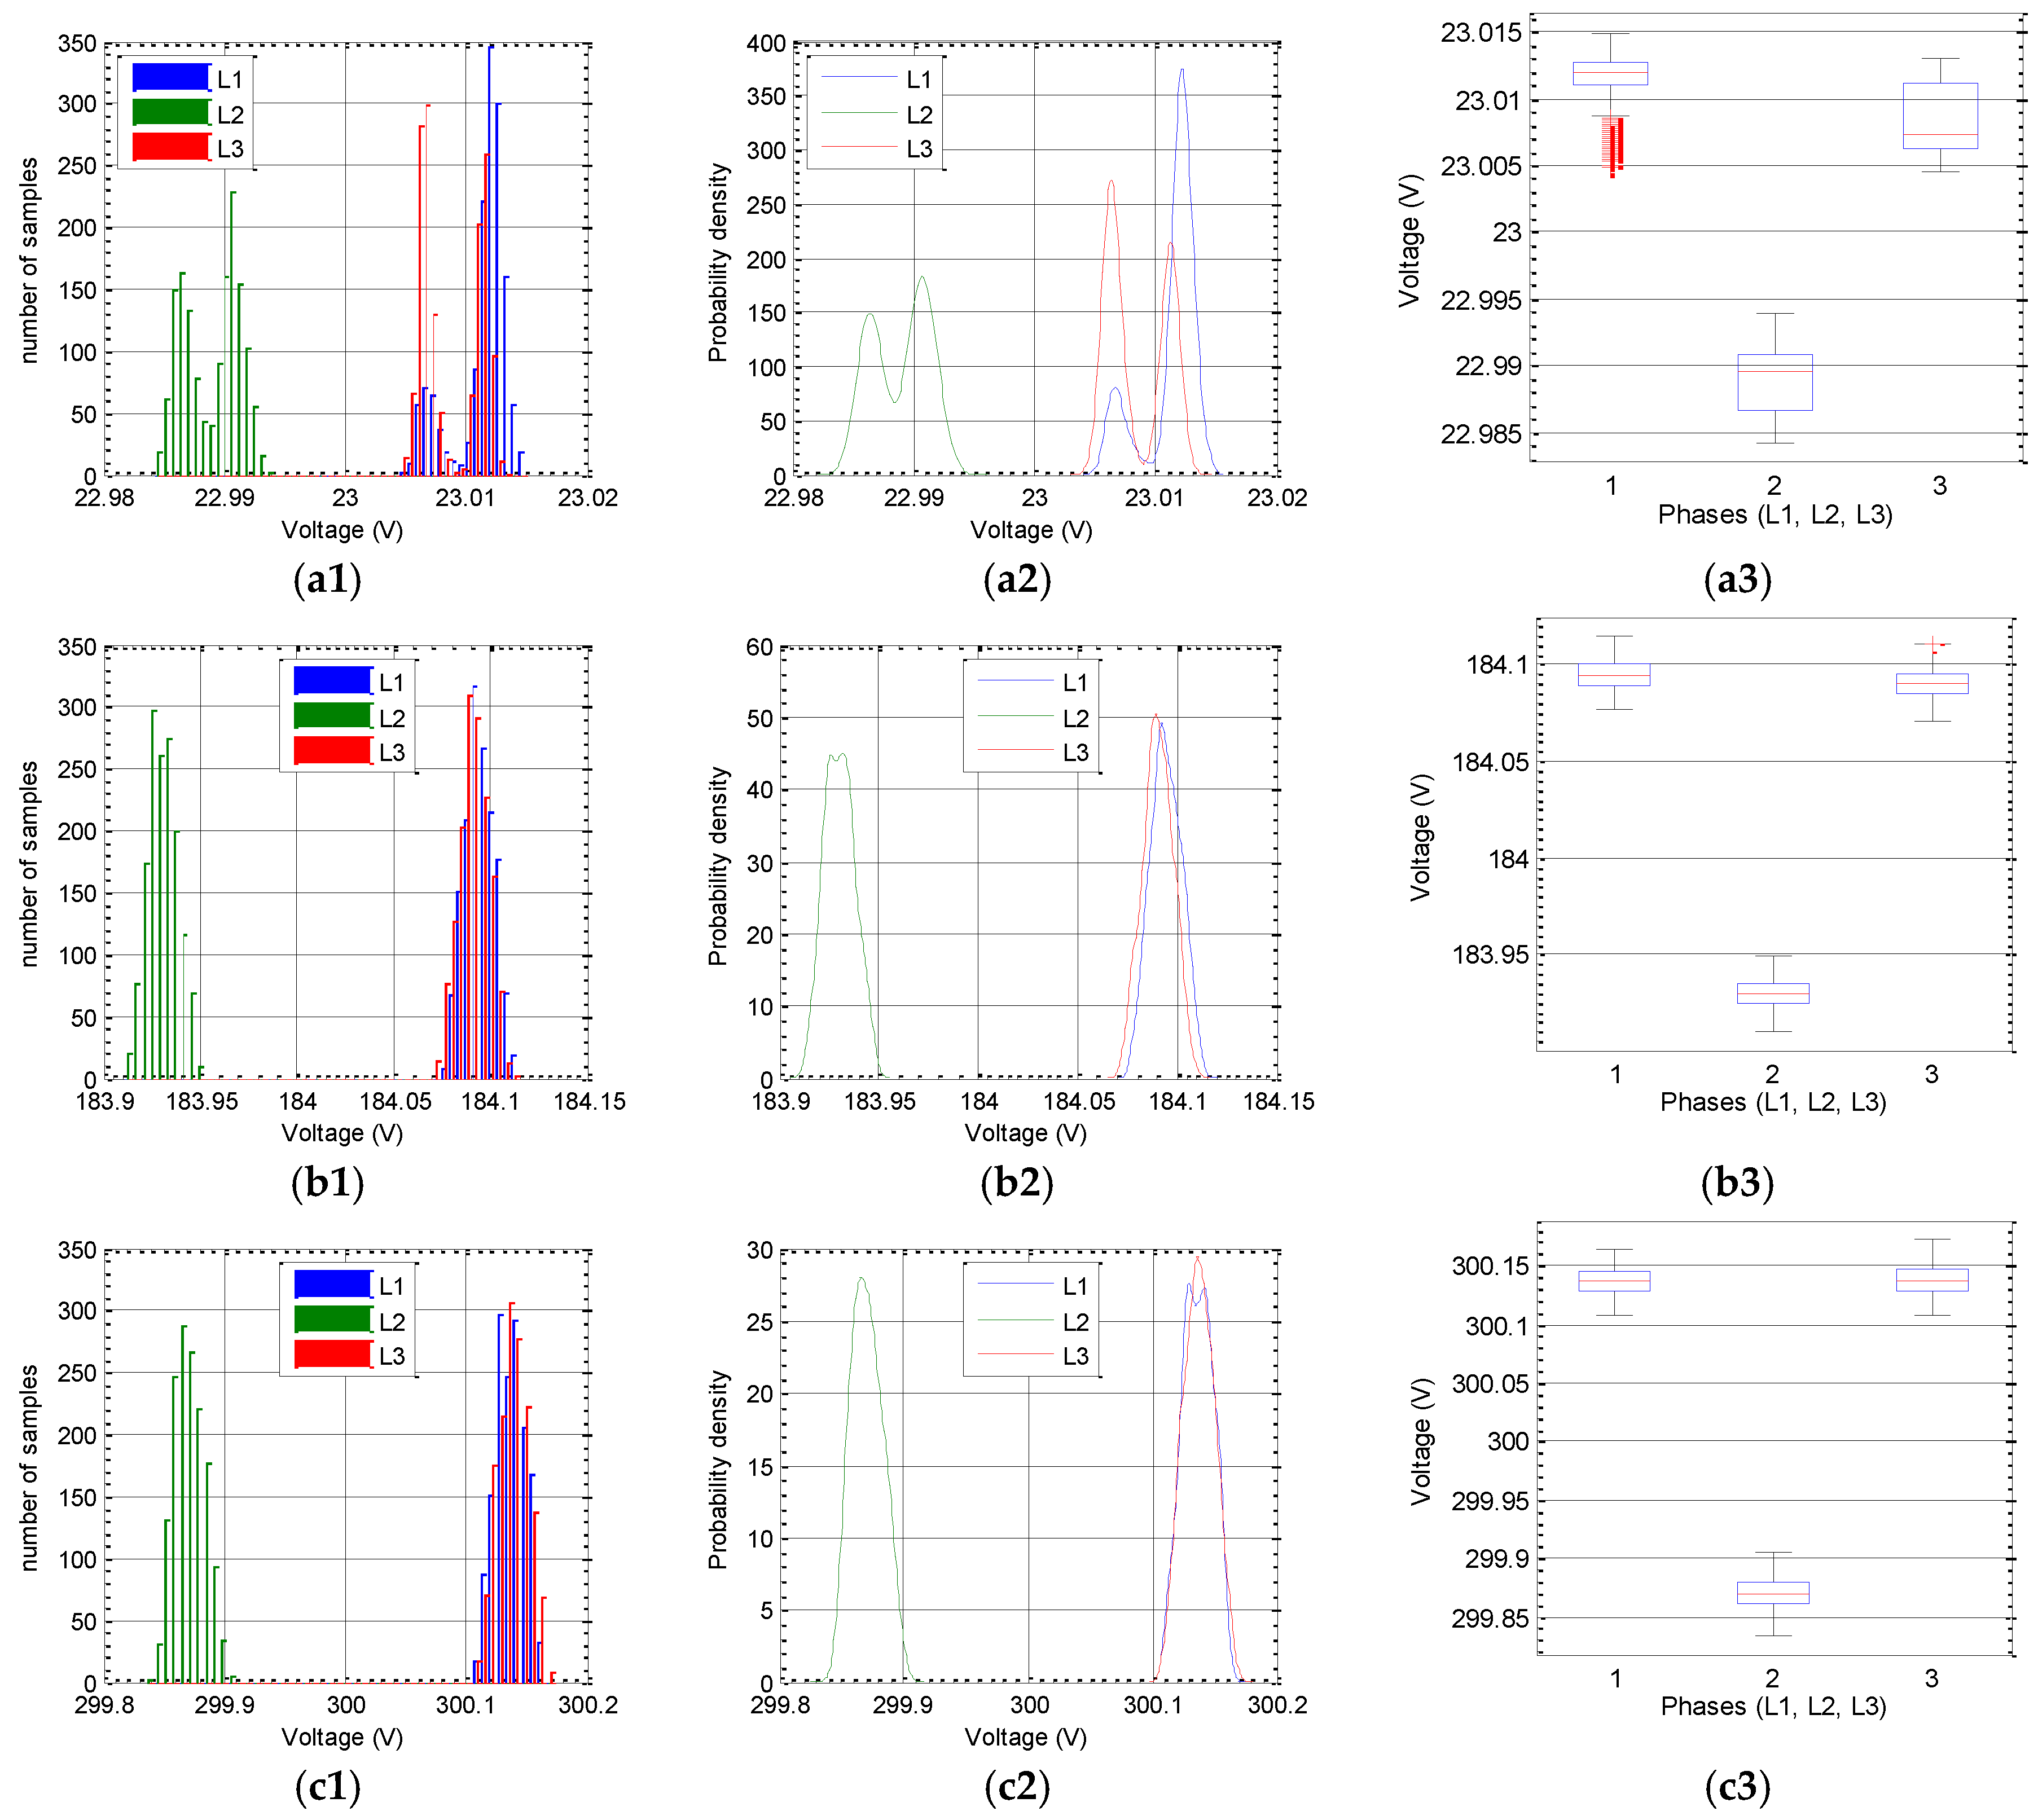
The tests used for voltage measurements also achieved good uncertainty results. As can be seen in
Table 2, in all cases the values of uncertainty are below ±100 mV, well below the 0.1% of the reference voltage specified by the standard.
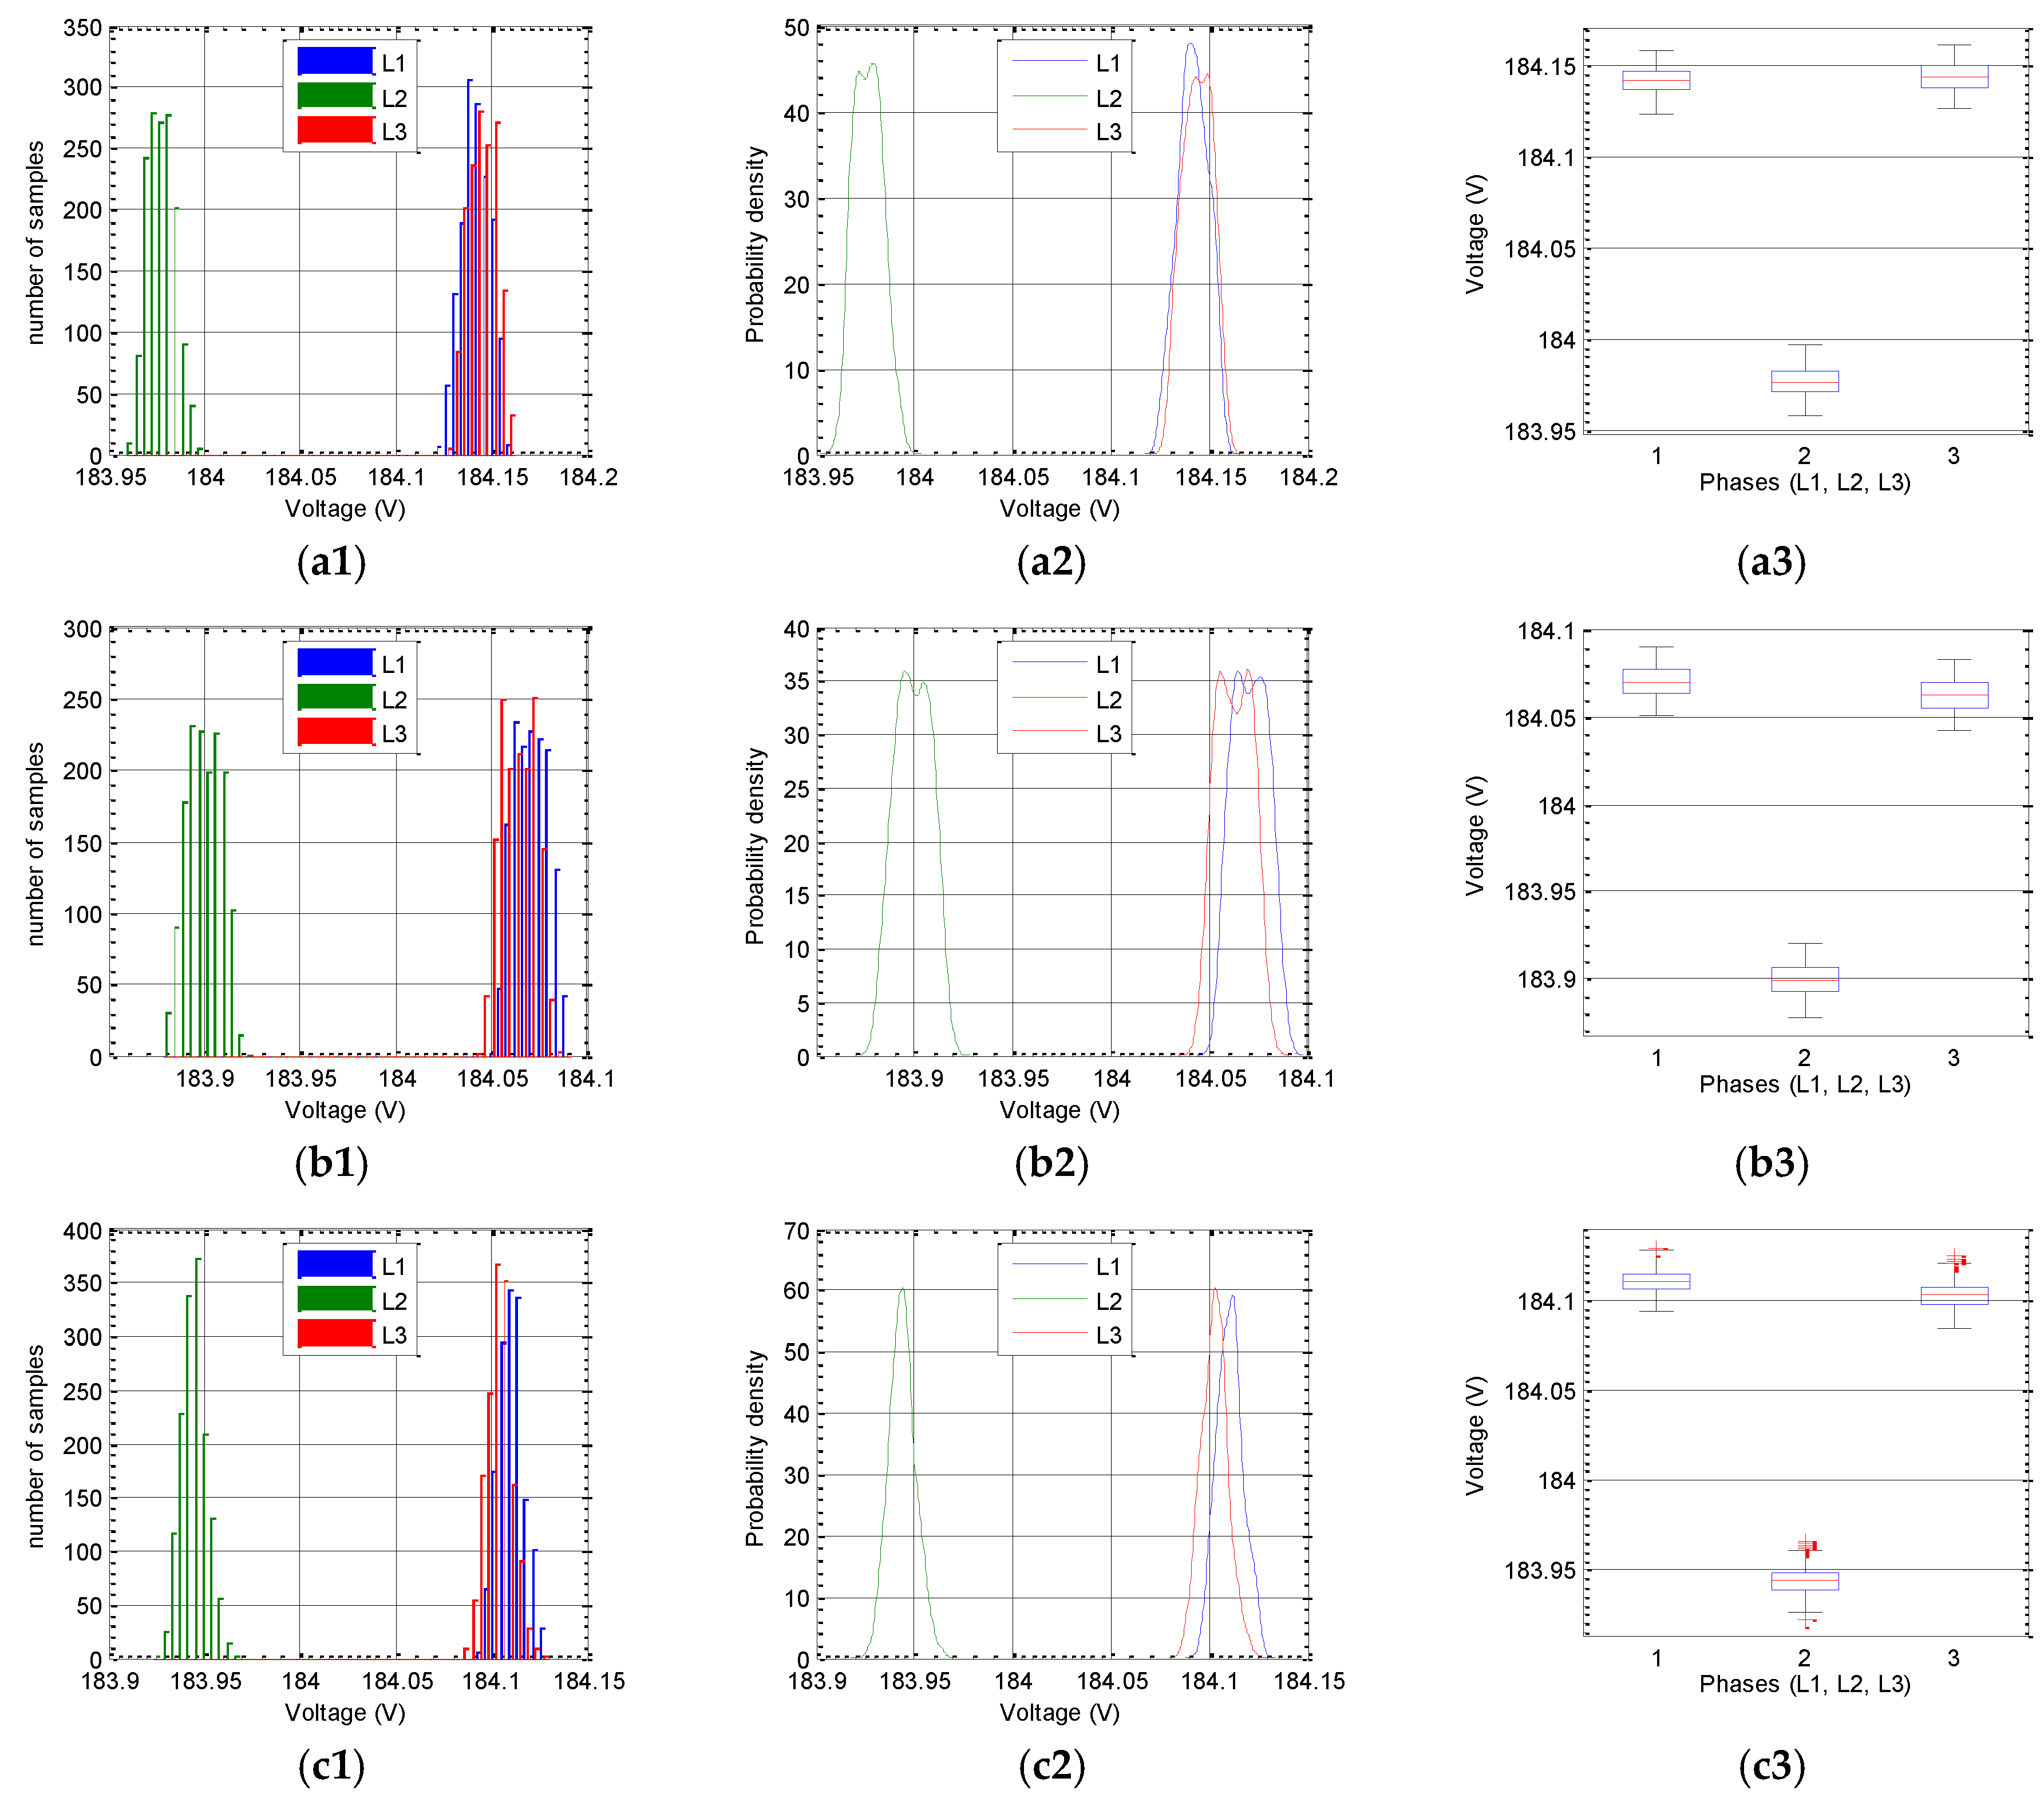
Figure 12 and
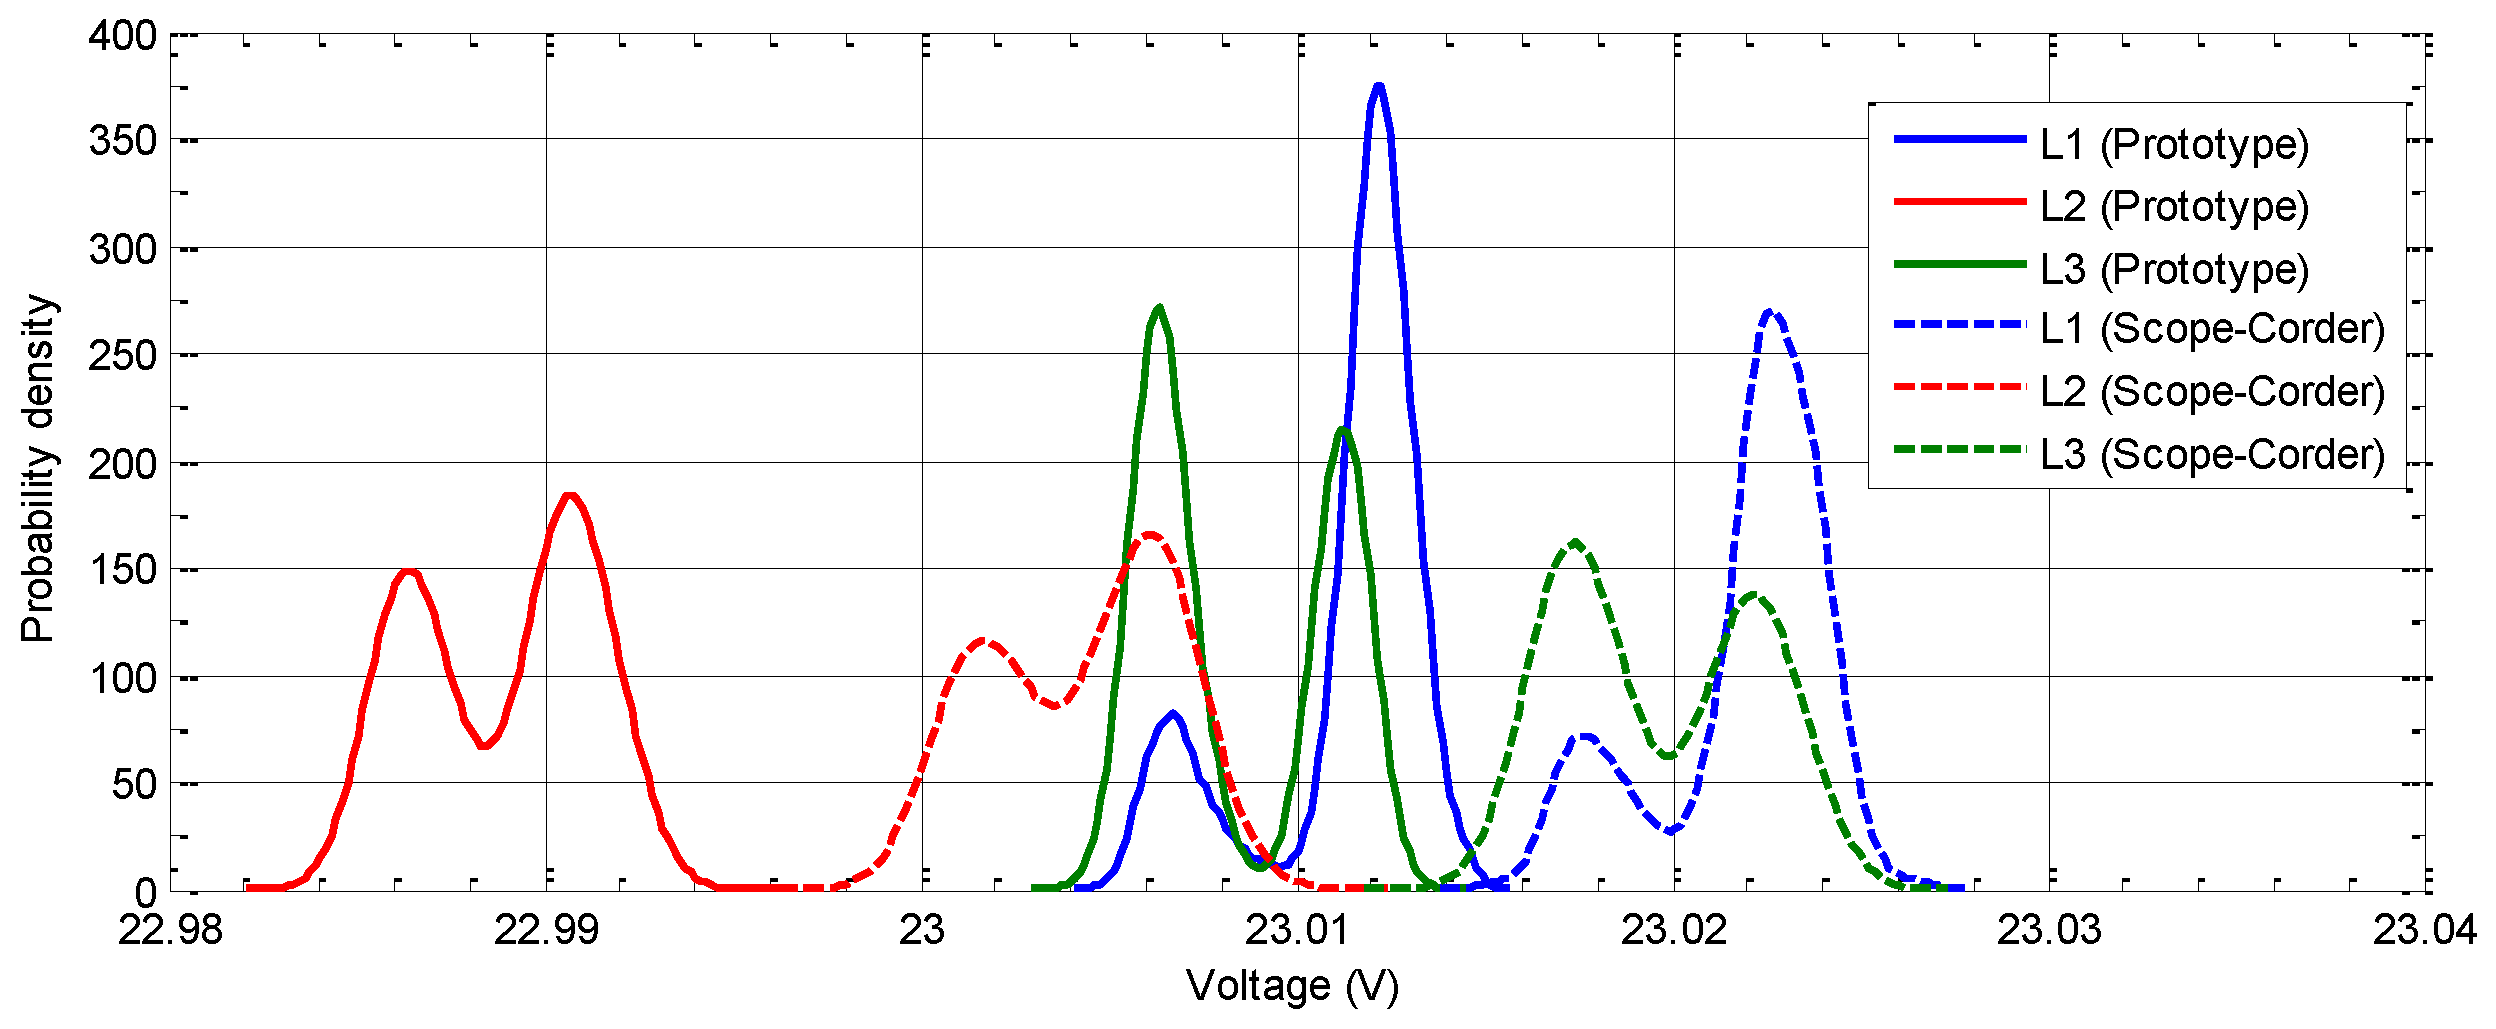
Figure 13 show the statistical results of the voltage measurements on the test points. In these graphs two features, explained below, can be observed. First, the histogram, and much more clearly the probability density functions of statistical distributions of the measured data, show bimodal behavior. This feature becomes more marked as the measuring points move away from the nominal voltage (230 V) or when influence quantities are introduced (by varying the frequency or by introducing harmonics). The second feature that can be clearly seen is a deviation in the central values of voltage in all three phases. Both features can also be observed in measurements using the rest of the support instruments used in the tests. Therefore, it can be concluded that the cause of this behavior is not due to the measurement made by the prototype tested in the study.
Figure 14 compares the probability density functions of the data sets of the three phases measured in test point P1 (10% V
nom = 23 V) with the prototype and with the Yokogawa DL850E ScopeCorder. Comparing these data can corroborate that both instruments confirm the existence of a deviation between the central values of the phase voltages as well as behavior of the density function denoting a bimodal distribution. With regard to these behavior characteristics, our conclusion points to the programmable power source as the root cause. In this case, the operating manuals of the AC iX 3001 power source state that these effects are compatible with the source output resolution provided by the manufacturer.
We have tried to follow the guidelines for the class A protocol, as reflected in IEC 62586-2, as closely as possible. Sometimes, however, it was necessary to adapt to the constraints of the laboratory resources available. These limitations are mainly given in the programmable power source, due to it having a maximum 300-V output voltage. In fact, the test point in the measurements had to be adapted to 150% of nominal voltage (345 V), as indicated by the standard, and reduce it to 130% of nominal voltage (300 V) due to the above limitation in the source output voltage. This circumstance has also caused linearity problems in the harmonic spectrum of the output source when operational limits have been forced. Therefore, the results of these tests are not intended to be conclusive in the sense of certifying the prototype’s class A category. However, these tests do indeed validate a high quality in the prototype, and may give an idea of its capacity to pass the rigorous class A certification.
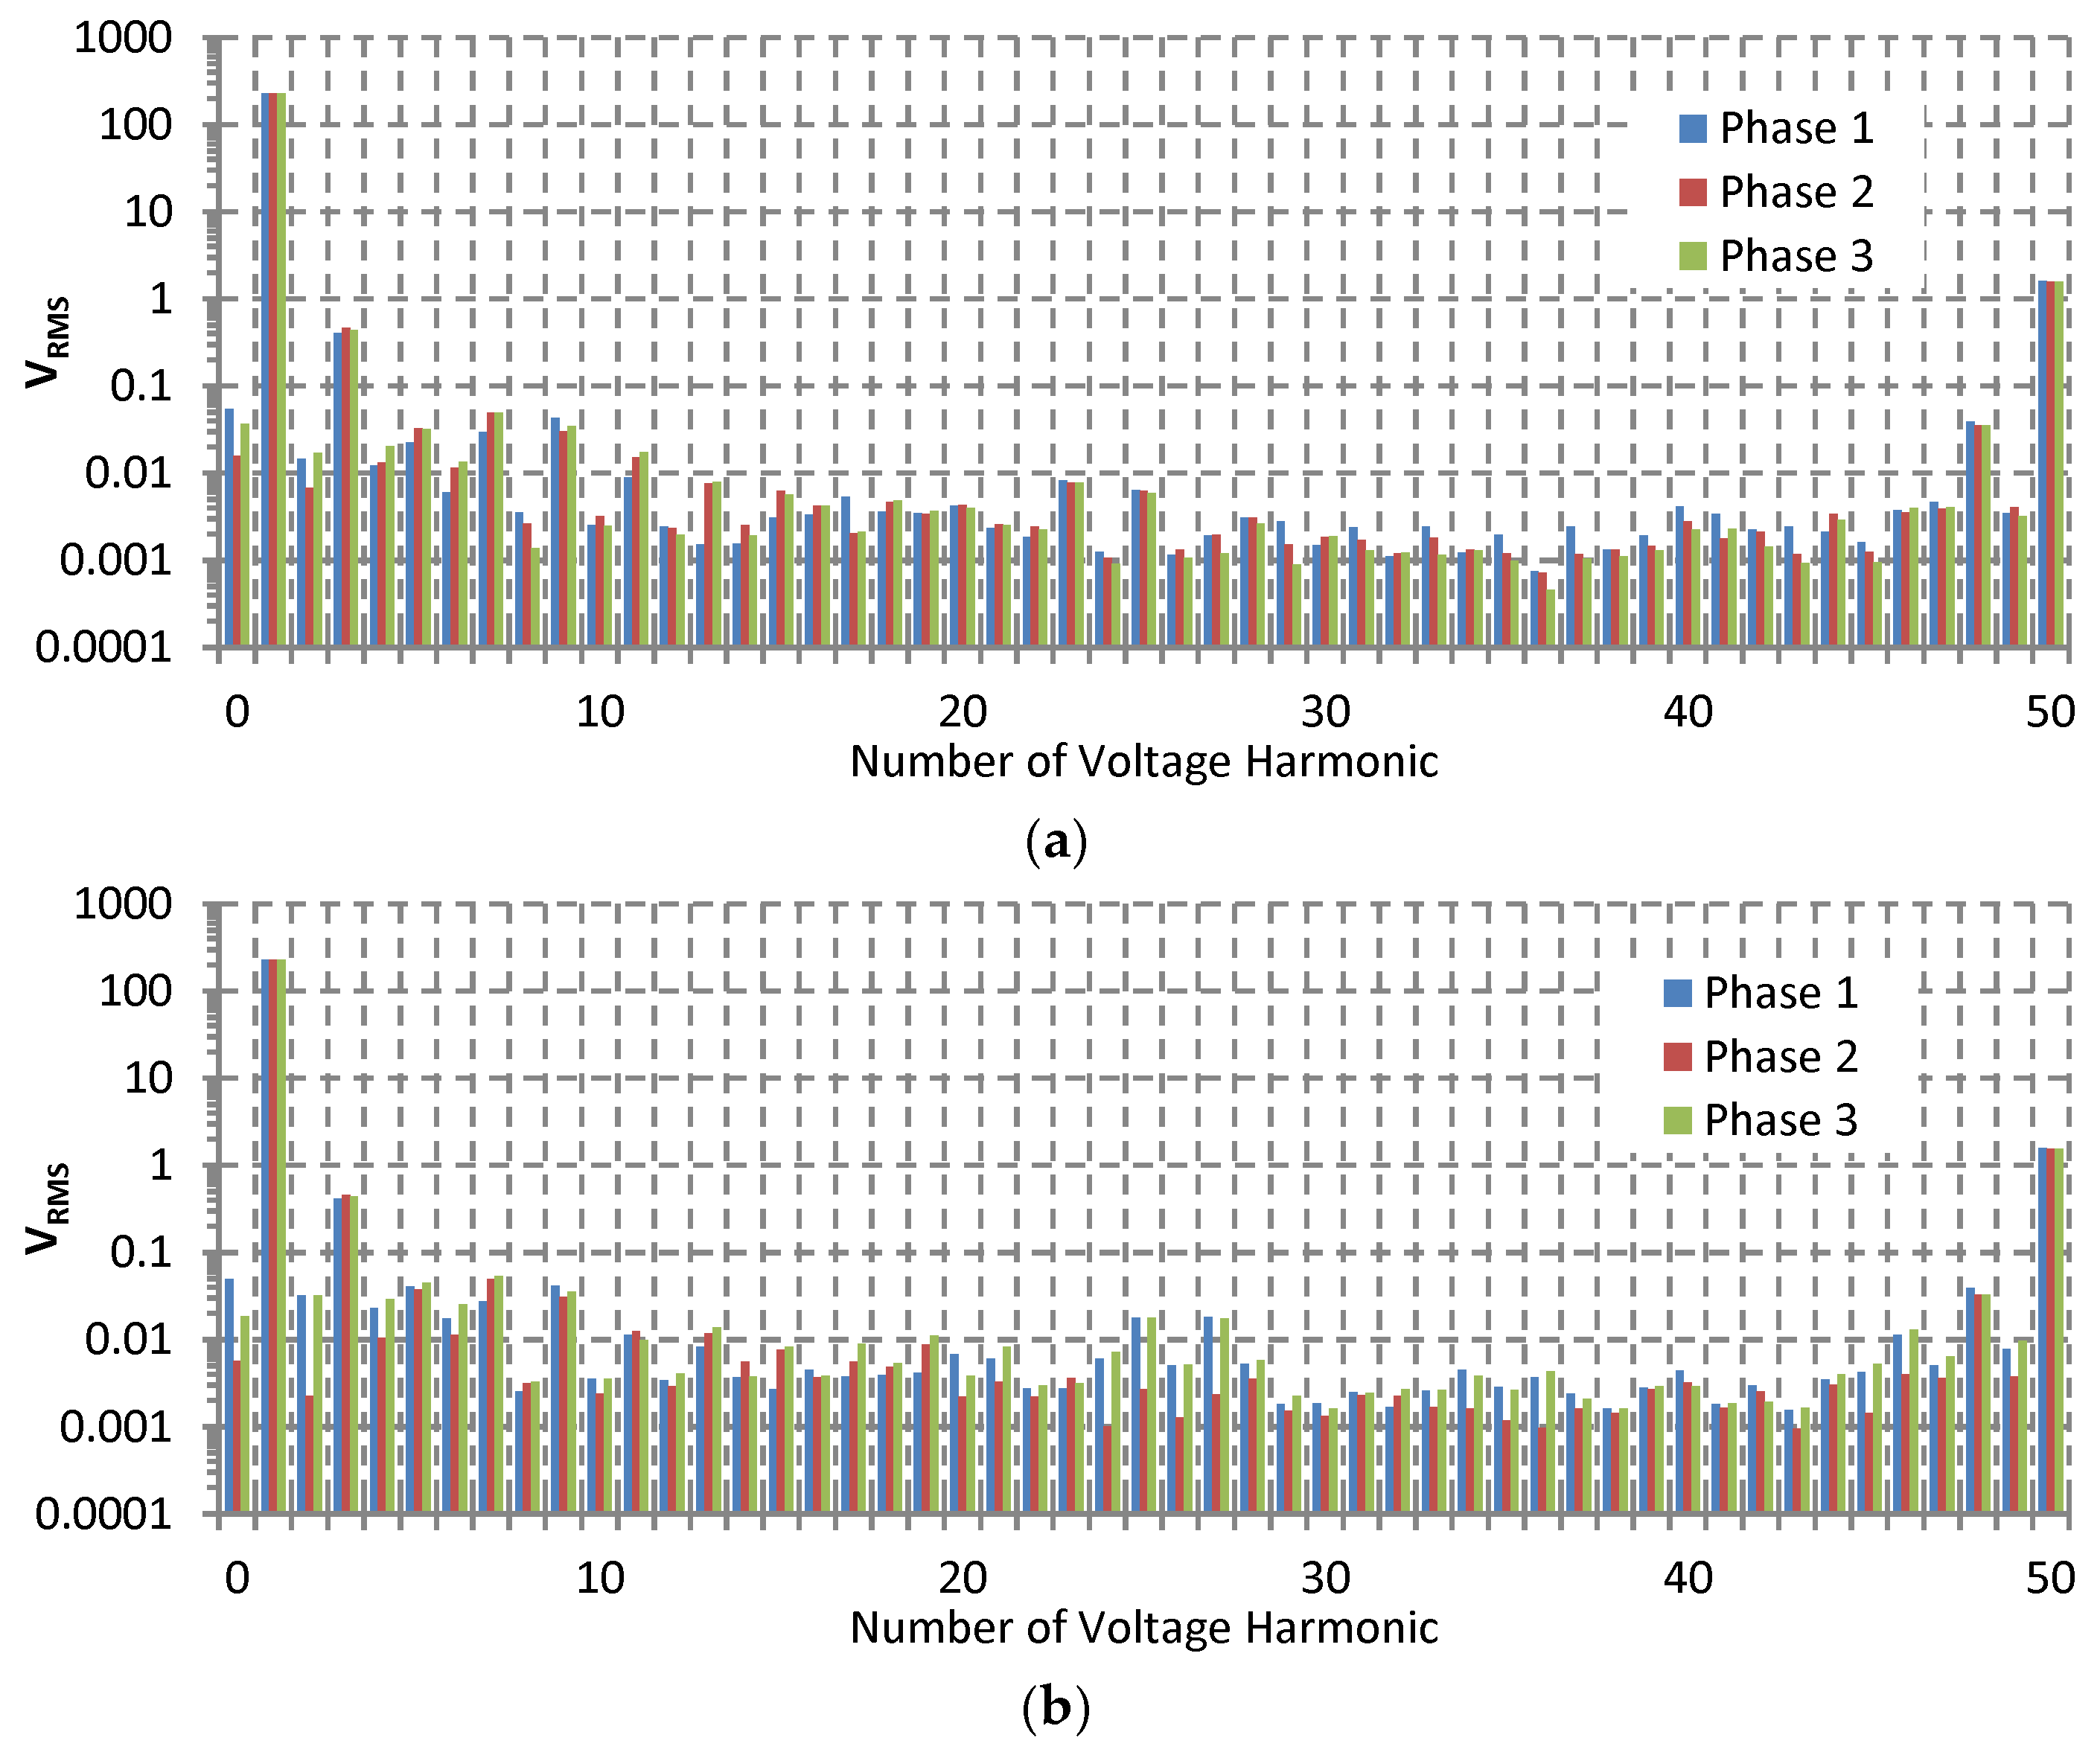
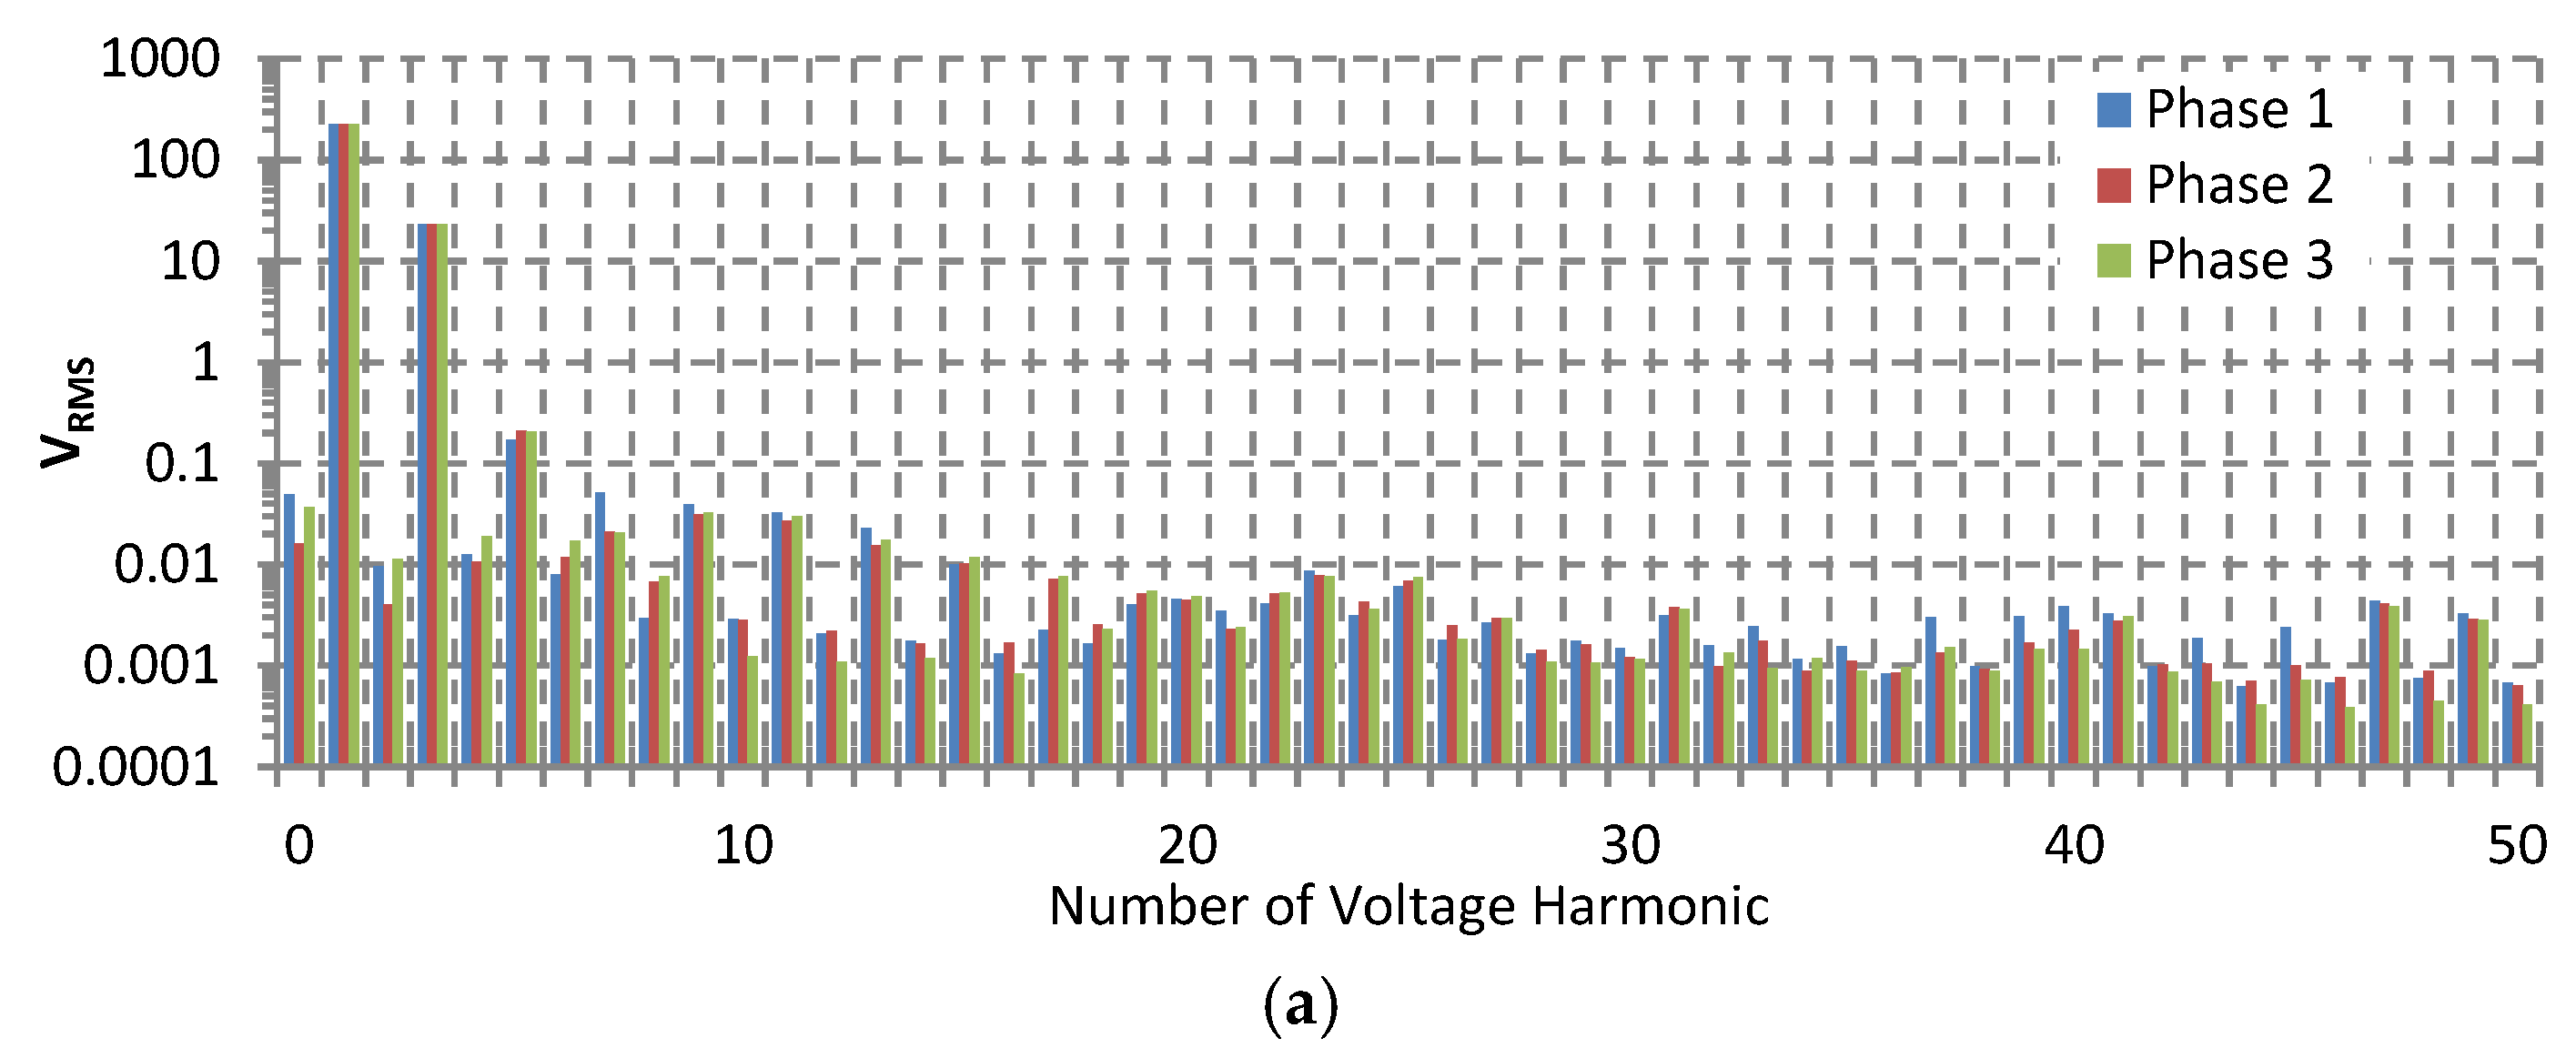
With regard to the uncertainty in voltage harmonics measurement,
Table 3 shows a summary of the tests performed. In general, all measurements of uncertainty presented values below ±20 mV, confirming compliance with the requirements of IEC standard 62586-2, except for a problem due to the power source in the test at point P5 (test for all harmonics with high level). IEC 62586-2 refers to standard IEC 61000-2-4 on some tests that need to cover the whole harmonic spectrum, specifically at point P5, which requires 200% of class 3 compatibility levels from this standard. Although an attempt was made to perform the harmonic test at point P5 by forcing the source with the highest levels of harmonics that it was able to generate, a high instability with a significant nonlinear behavior was, however, detected in generation levels. This behavior could be detected with both the prototype and the grid analyzer, with both providing highly unstable readings. Therefore, the results of this test were discarded.
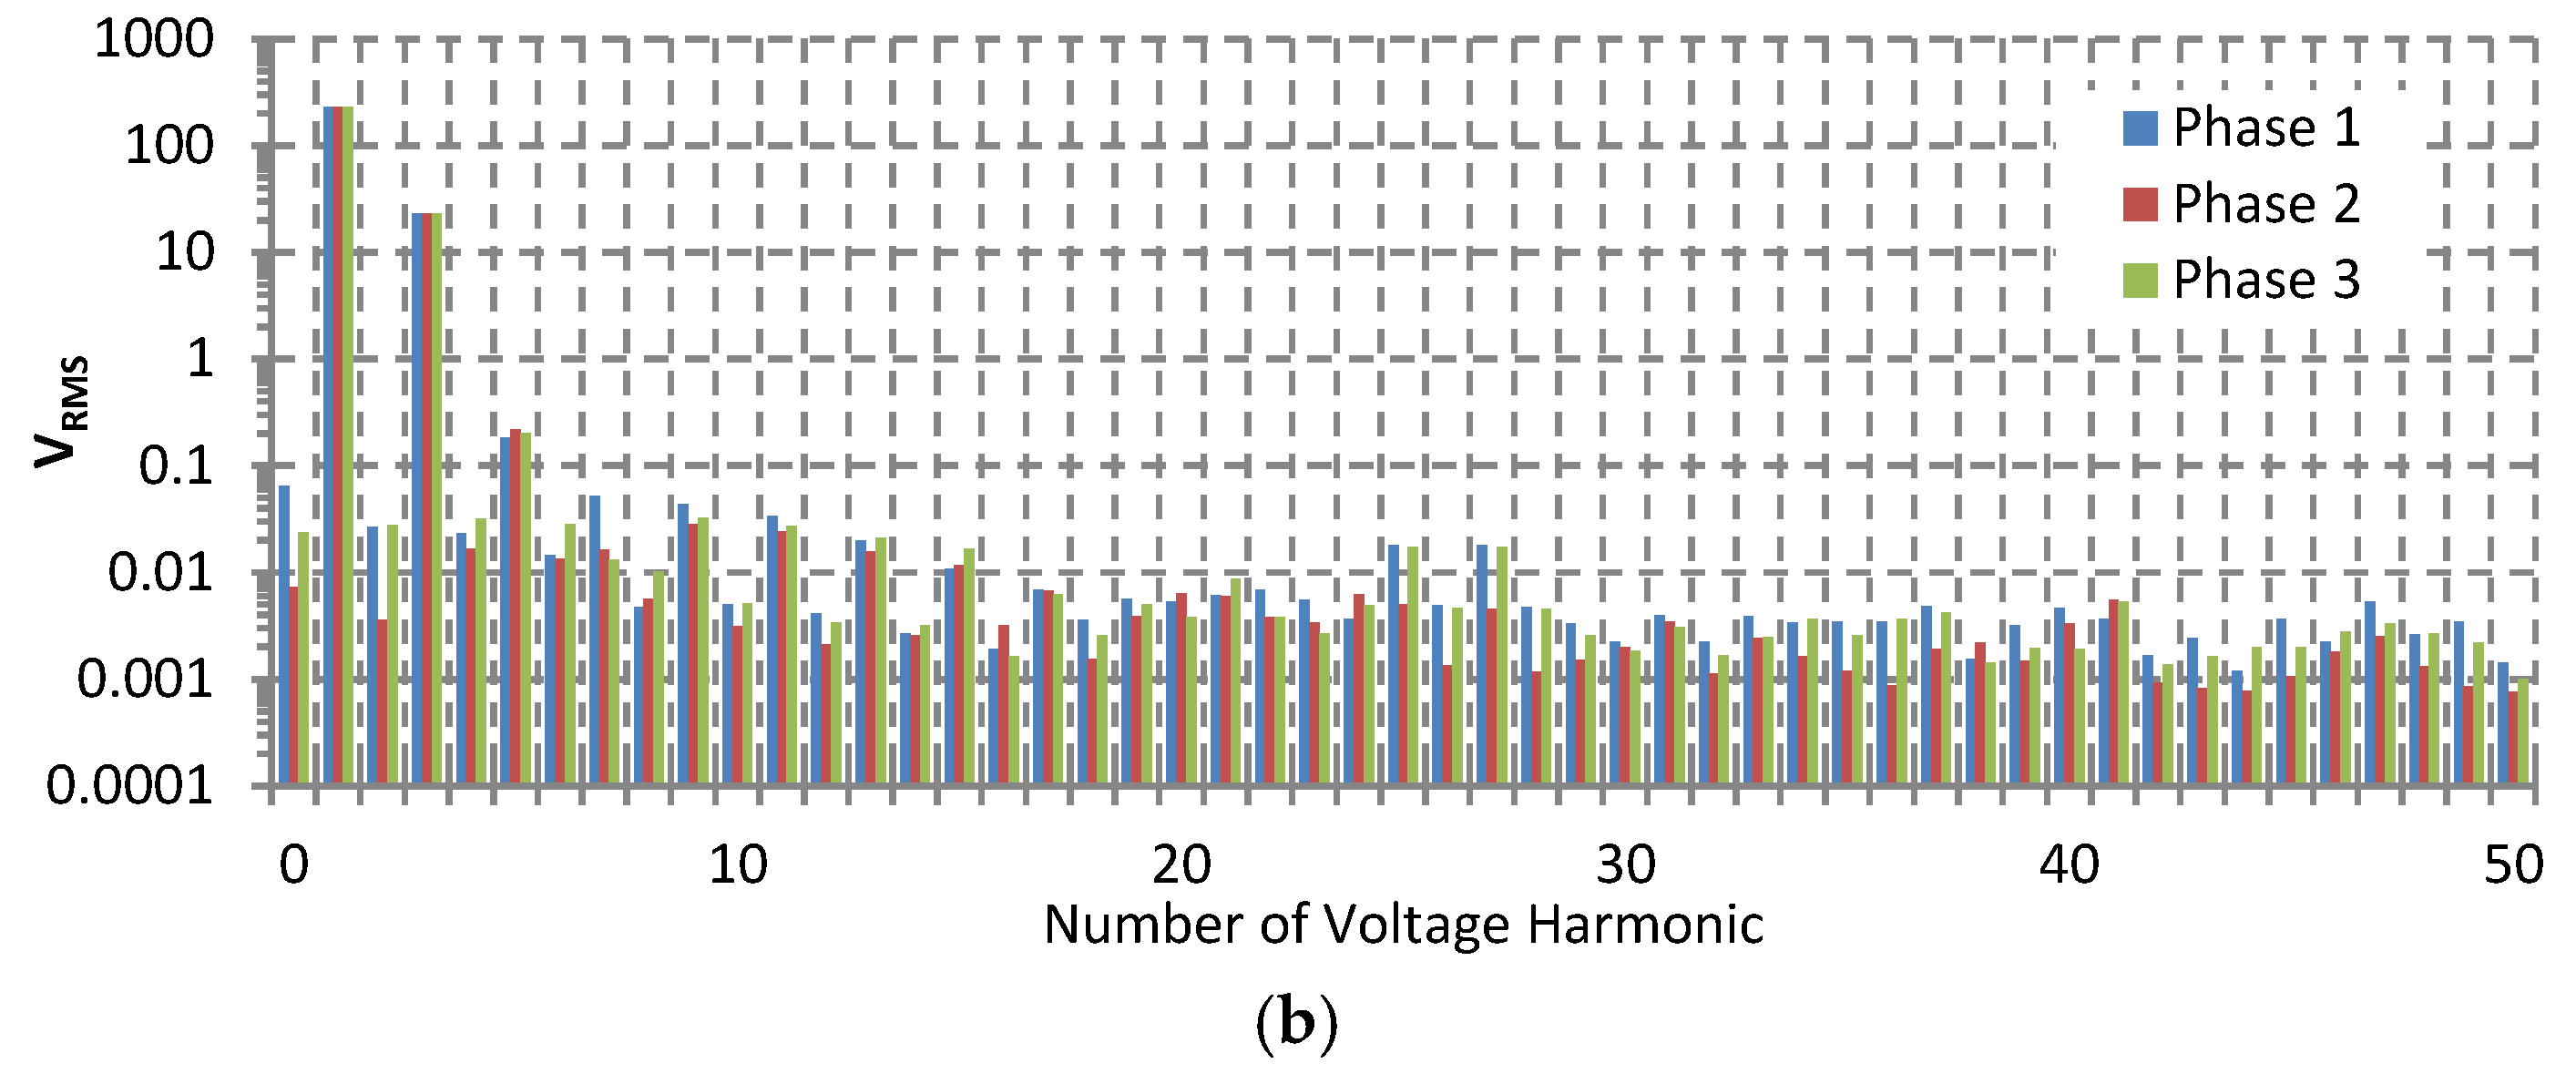
When comparing the results of measurements using the prototype and the Fluke 434-II analyzer, greater stability was observed in our prototype in the harmonic spectrum readings in all three phases than in the Fluke 434-II analyzer. This fact can be seen in the following figures, which compare harmonic spectrum readings taken with both the prototype and the analyzer.
Figure 15 shows the measured results in the point P2 (150 Hz, 10% V
nom) and
Figure 16 shows the results in P3 (2500 Hz, 1% V
nom).
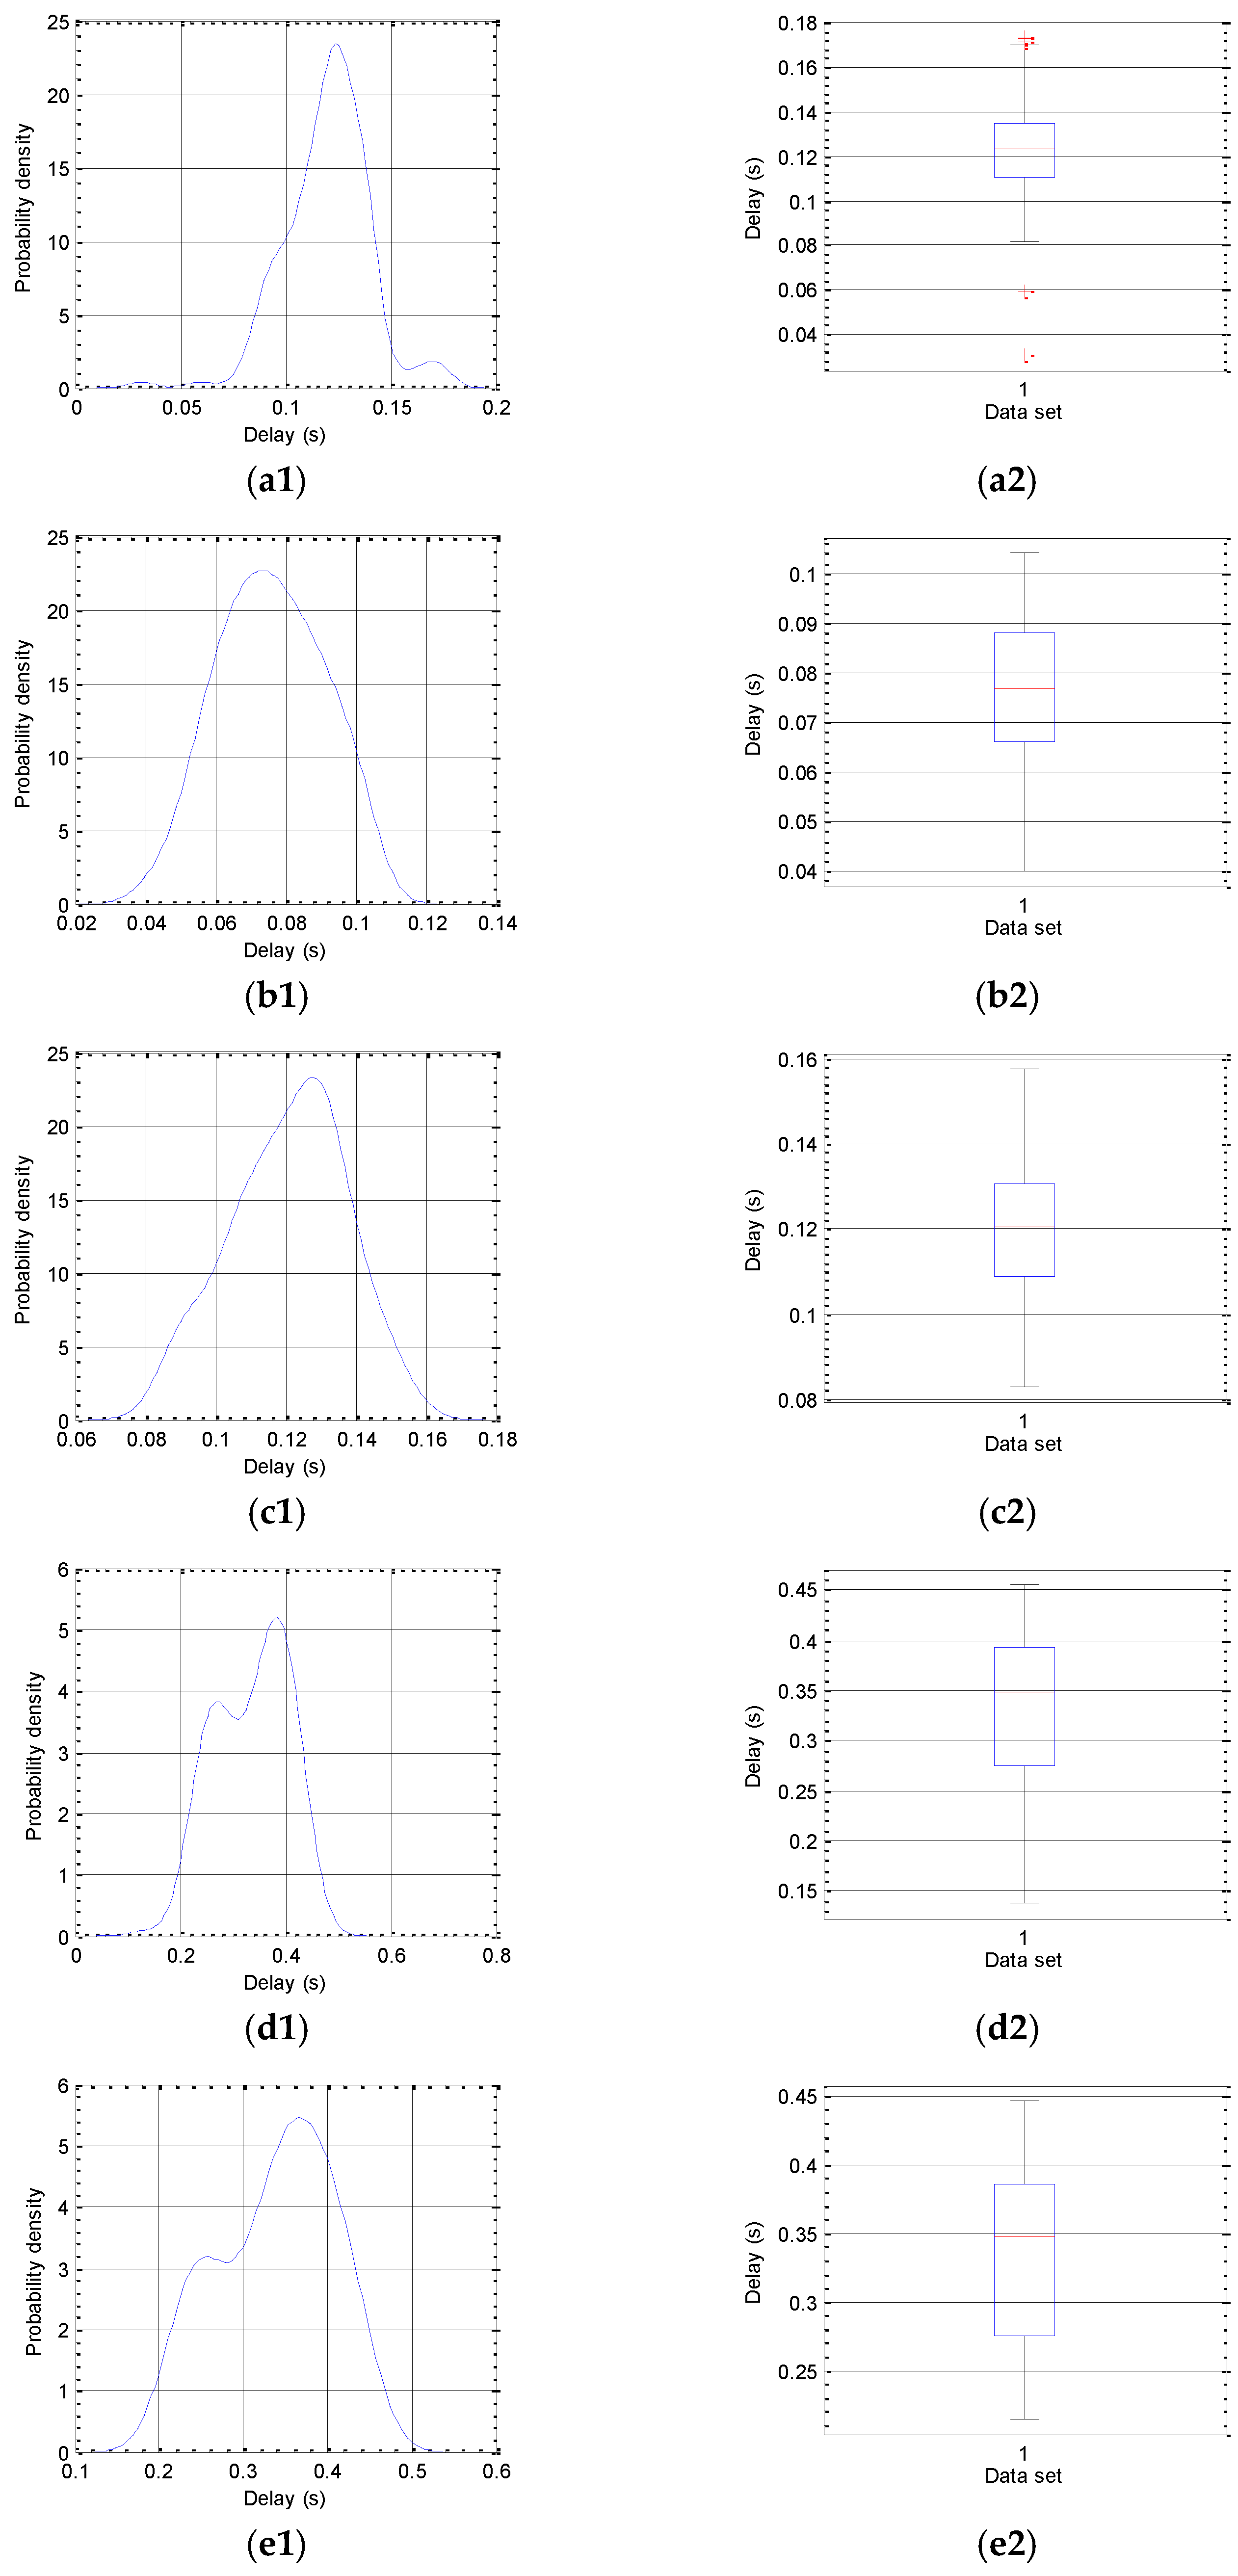
3.2. Time Response Testing for Alarm Generation Systems
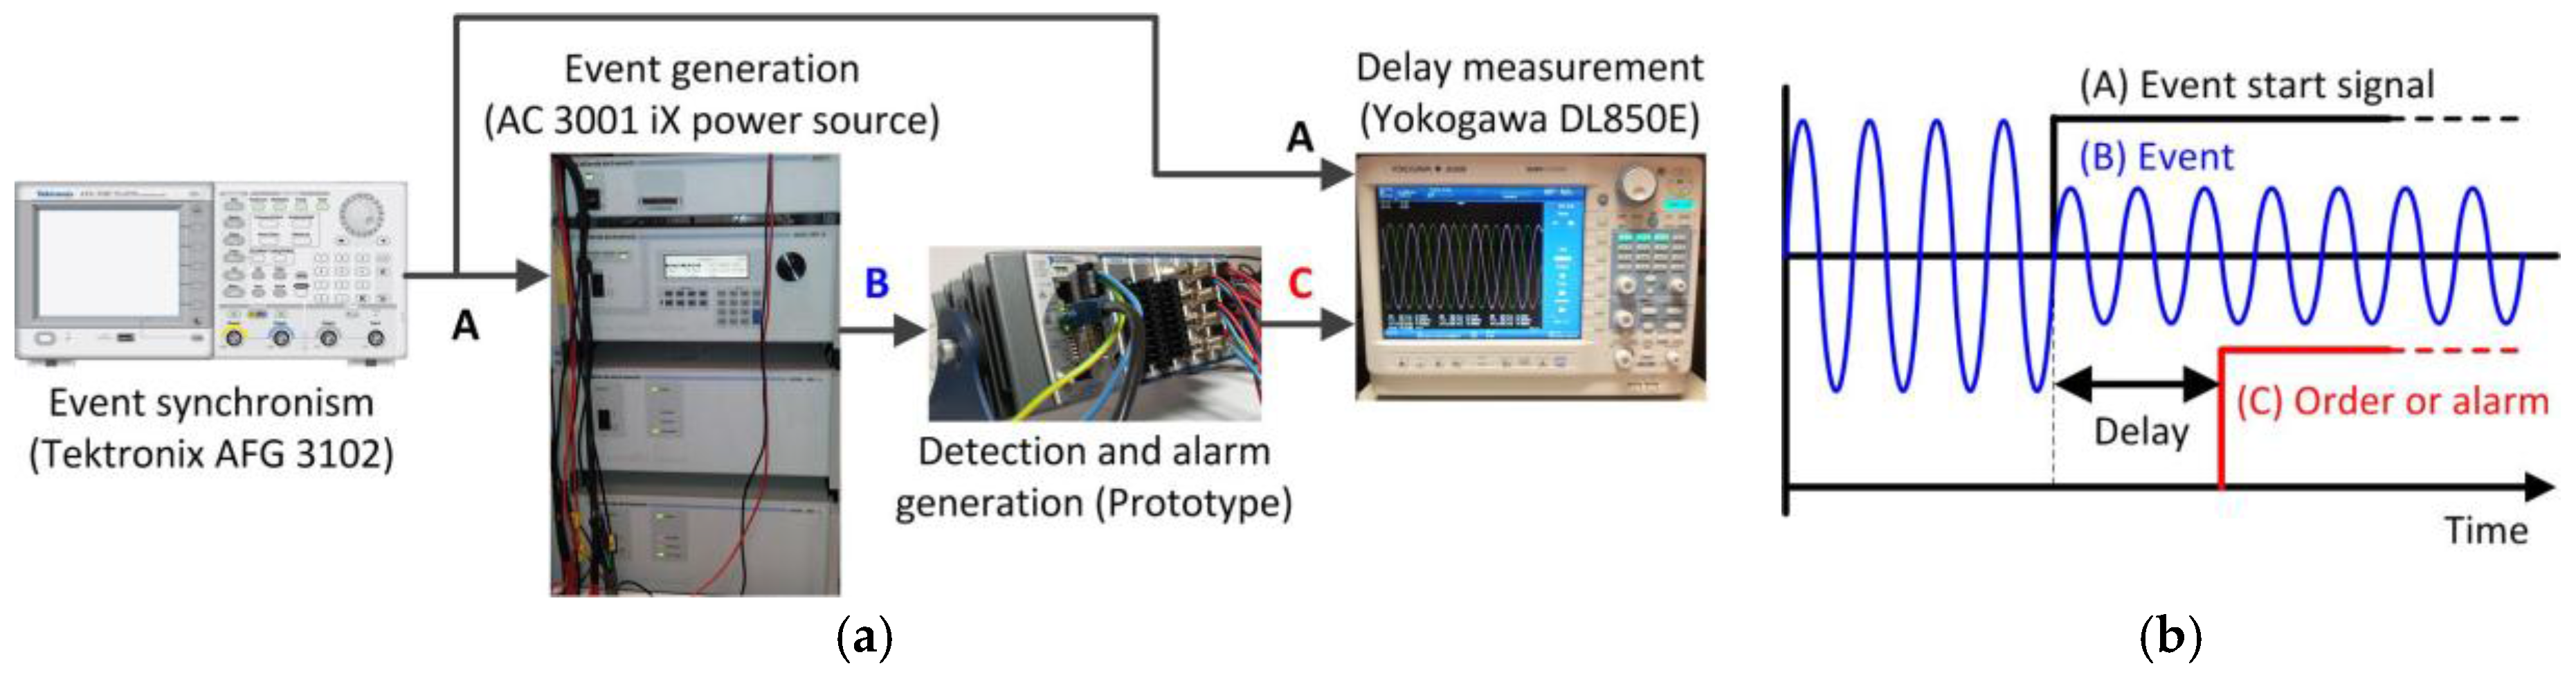
The purpose of these tests is to measure the time between the occurrence of the event and the generation of the alarm signal. The setting of the test is shown in
Figure 17. An external sync signal is used to trigger the event with the programmable source. Once the prototype detects the nature of the event, it will trigger the alarm or order signal being analyzed. This delay is estimated by comparing the start of the synchronizing signal of the event with the start of the alarm signal generated. Note that the delay being analyzed is solely that which is produced by the prototype. This includes processing time for acquisition, event detection and classification, and the generation time of the alarm. This analysis does not include considerations external to the prototype, such as the delay due to communication or due to detection of the alarm on remote equipment. In these tests the synchronization signal triggered the event every 2 s, causing the prototype to generate alarm signals consecutively.
In order to obtain sets with 150 samples each test lasted 5 min. An AFG 3102 waveform generator (Tektronix, Inc., Beaverton, OR, USA) was used for the synchronizing signal and a DL850E Yokogawa oscilloscope was used for measuring the delay. The subsystems analyzed in the time response tests were those related to generating orders and alarm signals. A summary of the tests performed are described in
Table 4 and the results are shown in
Figure 18.
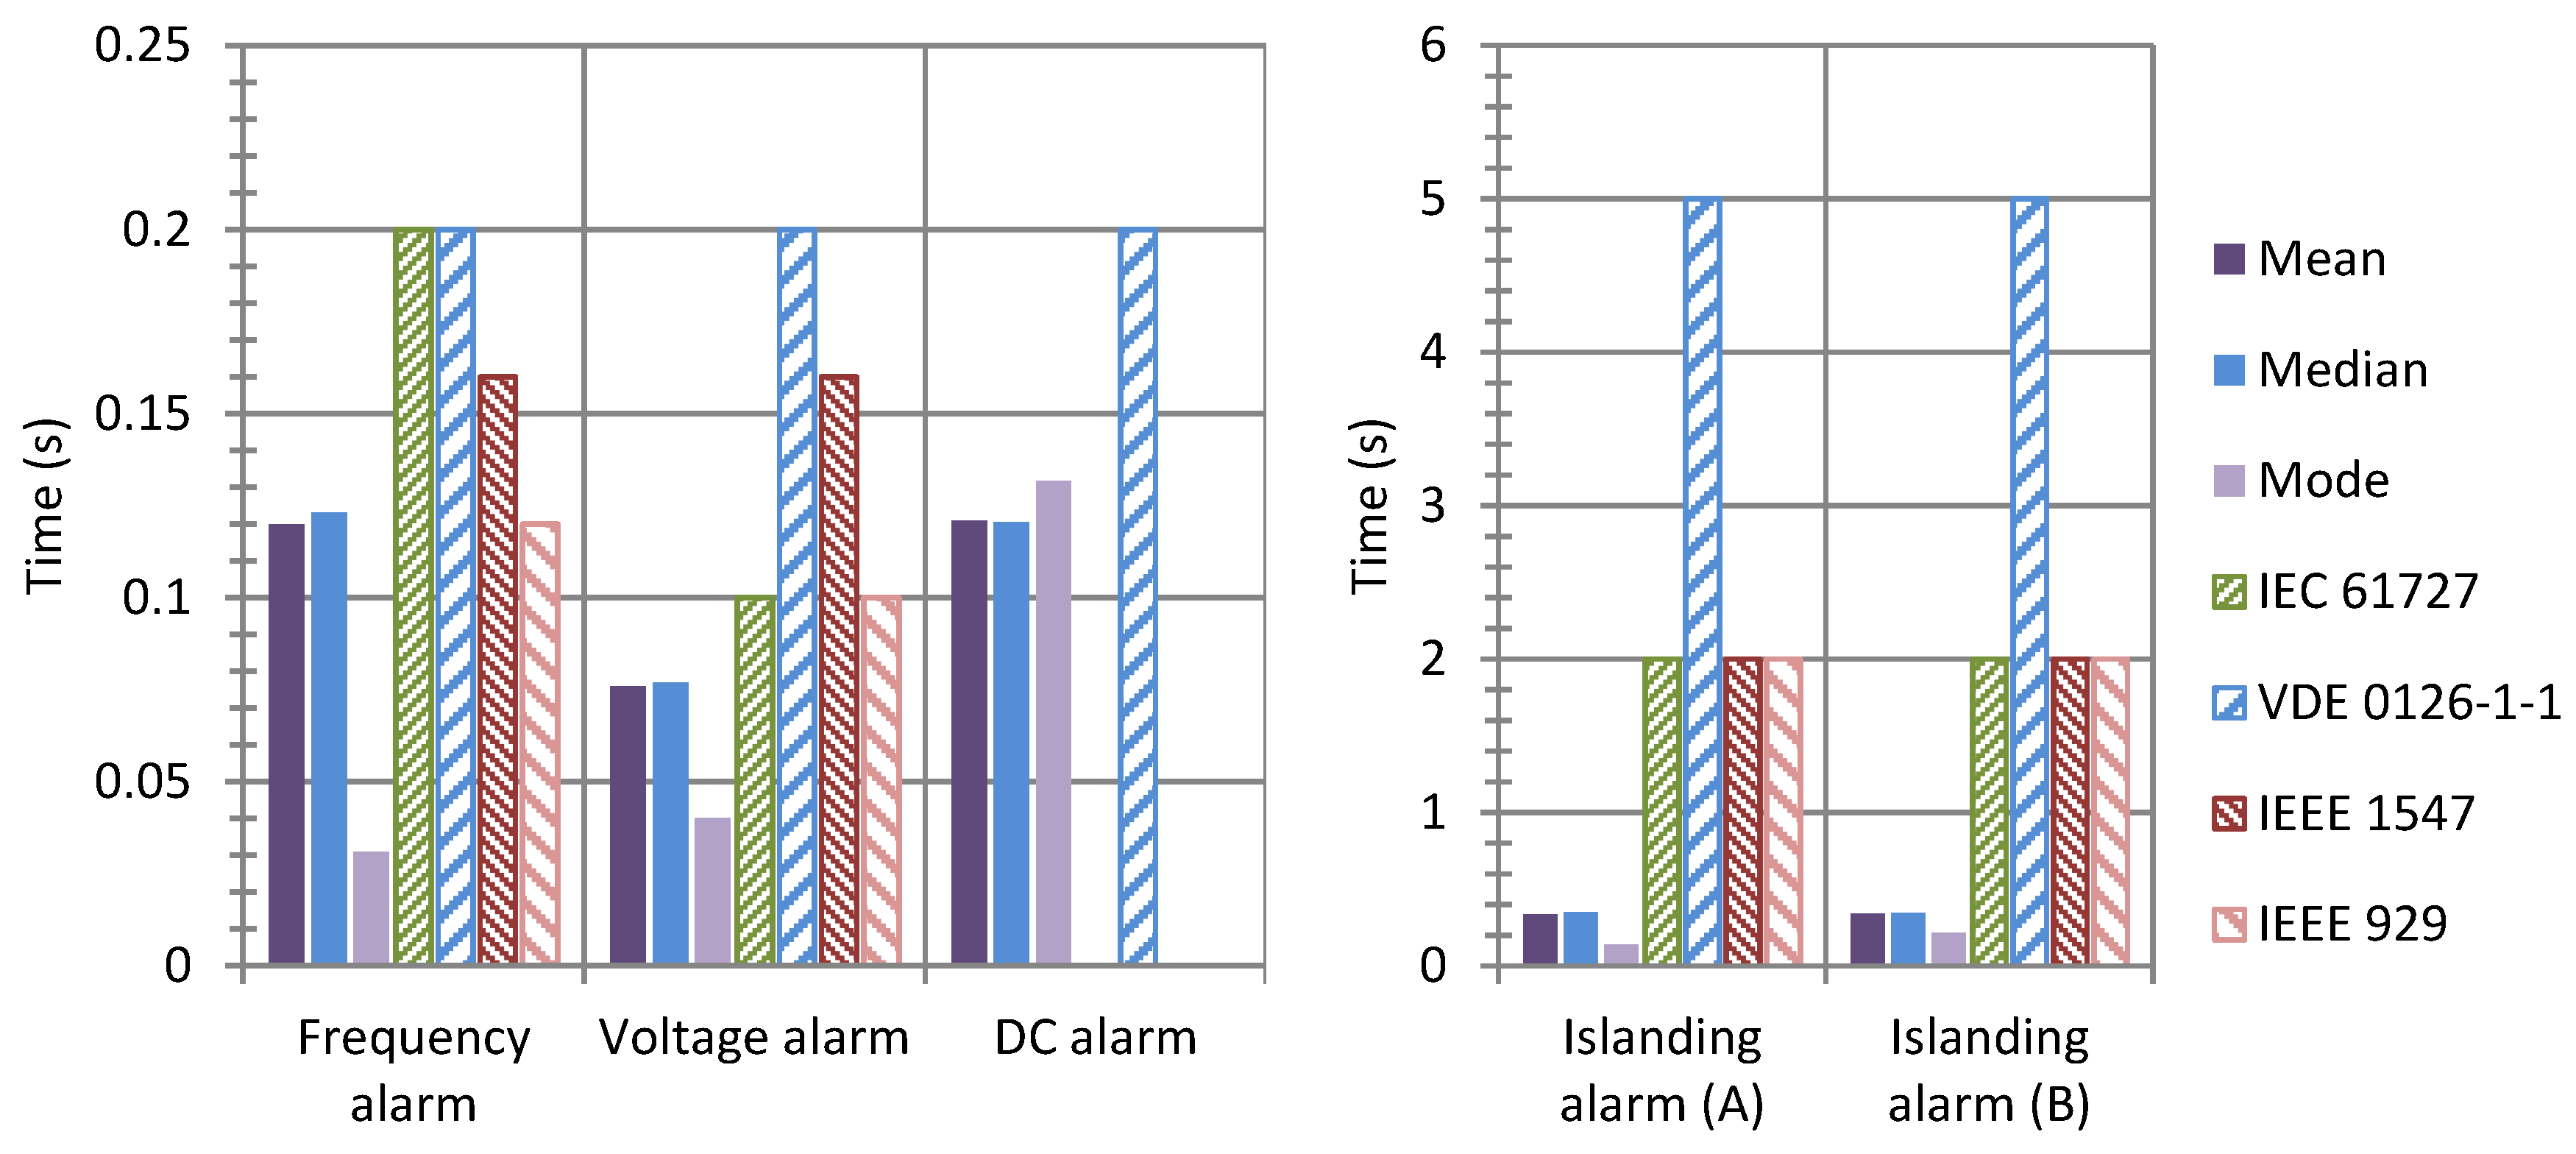
The results show behavior consistent with the architecture of the global system. Subsystems that depend on the two-cycle data stack and process basic parameters (voltage and frequency ranges, and DC injection) are much faster, with median delay values under 130 ms. In the case of the anti-islanding system, operating at 10 cycles and with more complex processing, the delay increases obtaining median values under 0.4 s.
Figure 19 shows a comparison between the statistics of central tendency obtained in the tests and the delay values permitted by different standards.
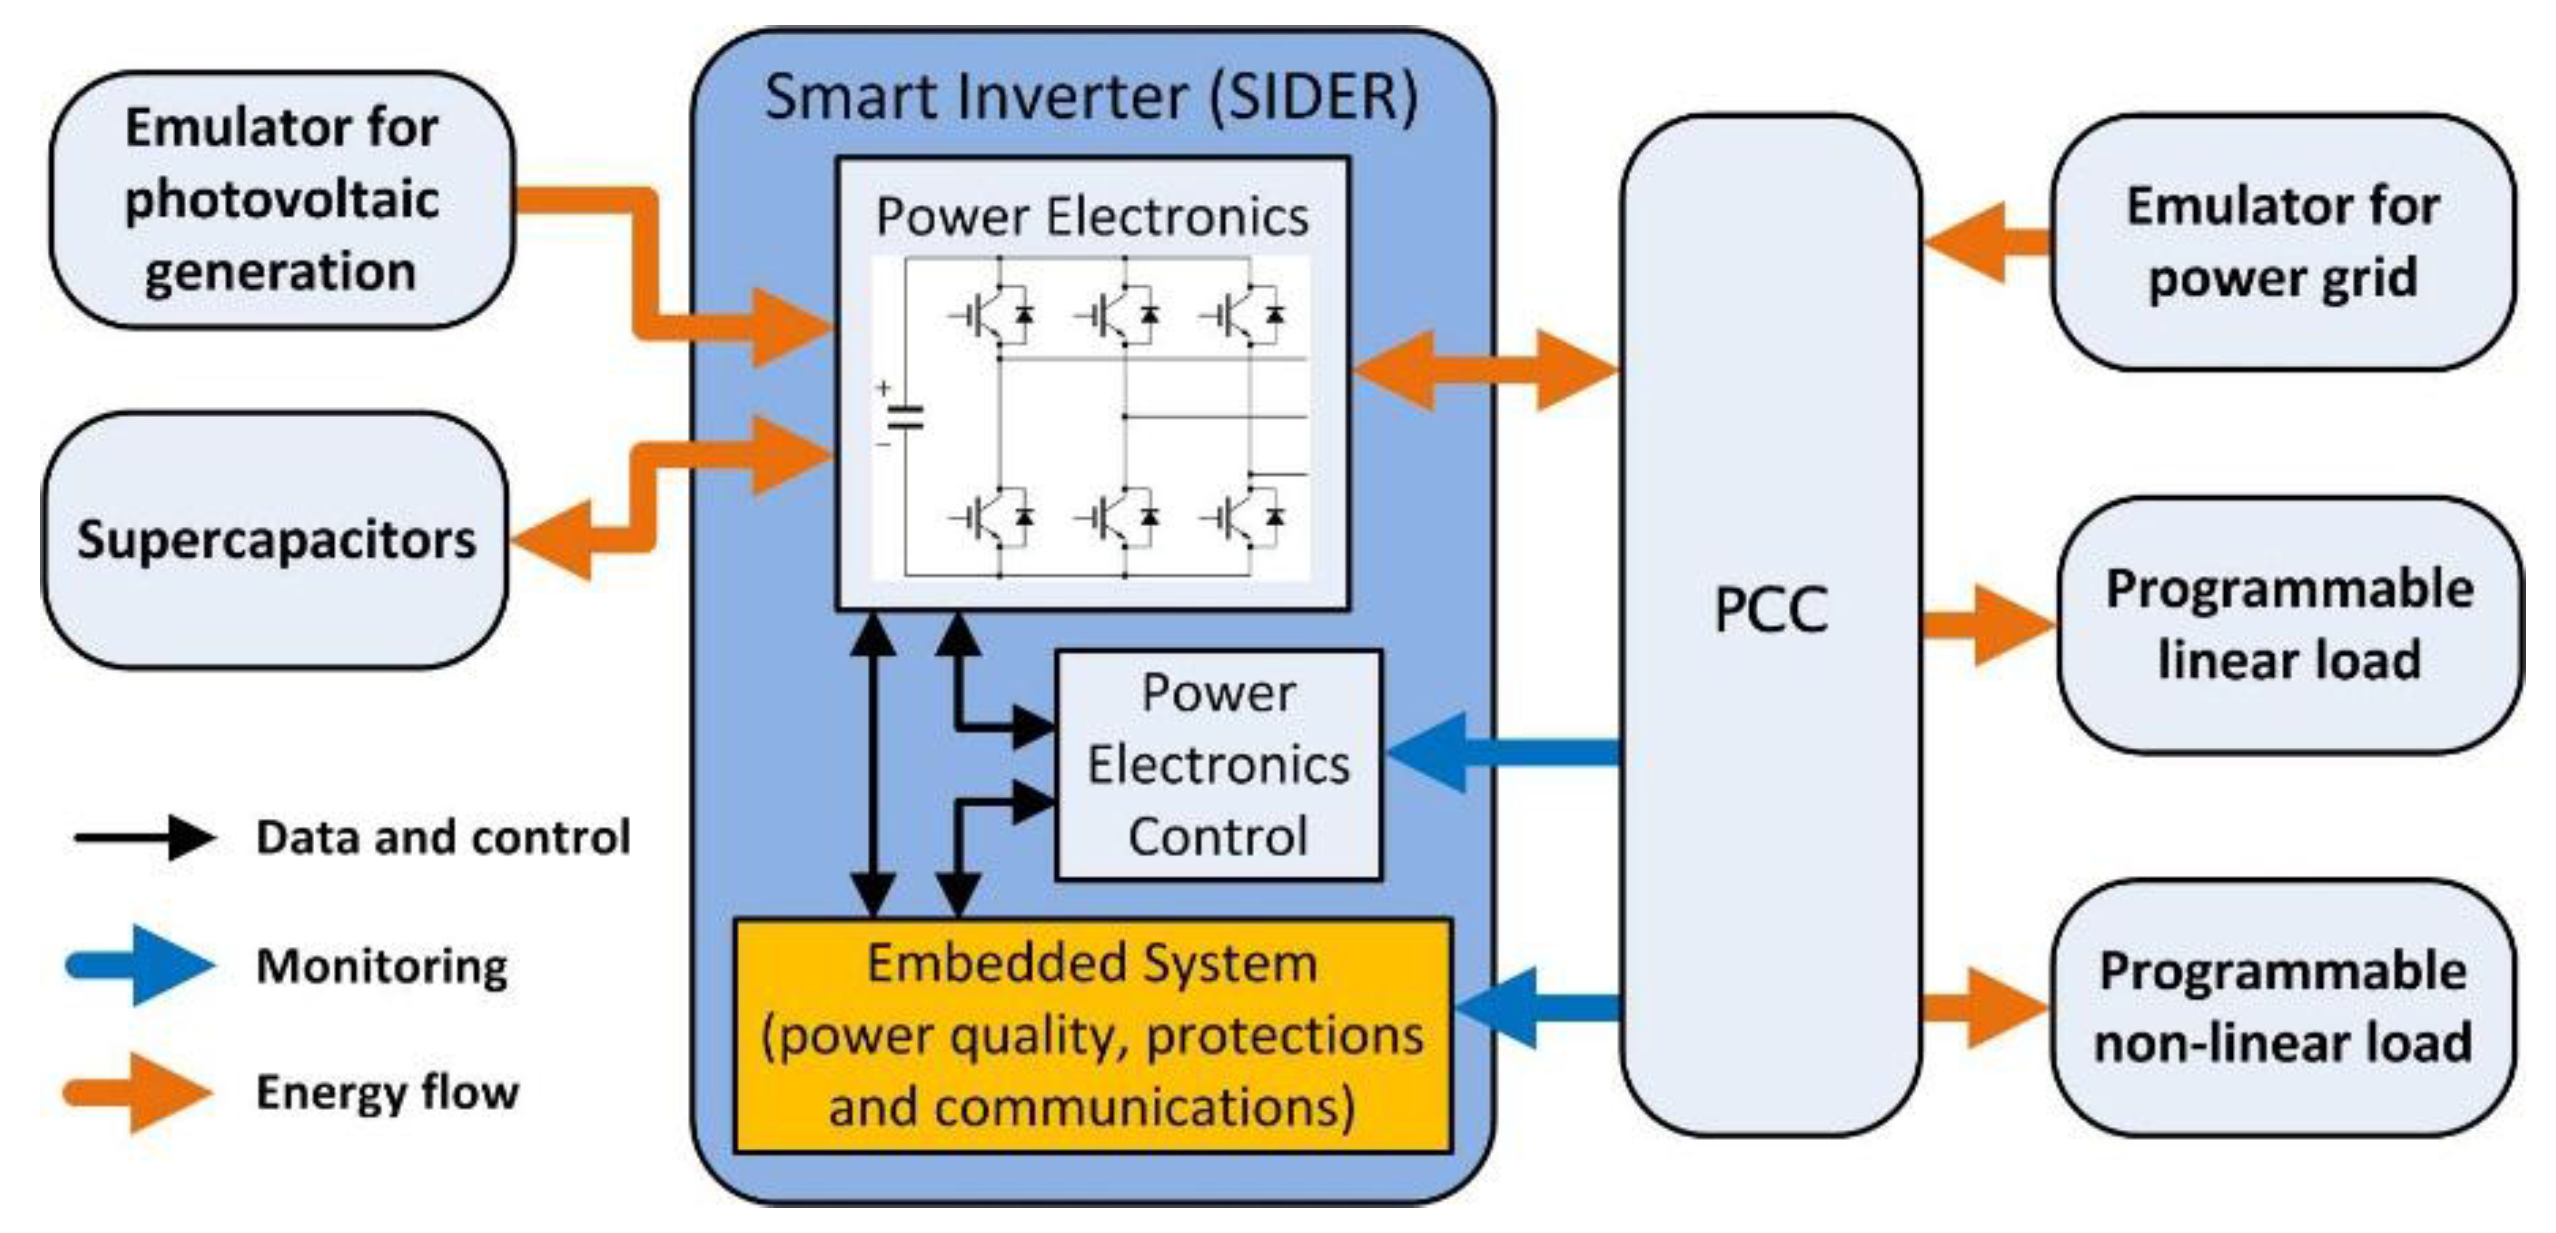
4. Integrating of the Experimental Prototype into a Photovoltaic Inverter
One of the objectives of the device presented in this paper was to integrate it into power electronic systems, so that they expand their features and functions, achieving an increase in value within the set. Next some descriptive aspects concerning this integration, performed experimentally in the context of the Smart Inverter for Distributed Energy Resources (SIDER) project, promoted as a national research project by the Spanish Ministry of Science and Innovation and supervised by companies from the electricity sector, are discussed. This project is based on the development of an inverter with active management capacity within a Smart Grid environment. The present ES was developed under the PROCOM-SIDER subproject, reference code TEC2010 19242-C03-02, whose purpose was to provide the inverter with a parameter and events analysis functionality, as well as protection and communication, according to the scenario depicted in
Figure 20.
In this scenario, the prototype is responsible for continuously analyzing the operational context of the inverter and grid, so as to indicate the most suitable service status operating conditions at all times. This implies that the inverter, in addition to fulfilling its role as DC/AC converter, can manage energy storage when there is falling demand, or inject reactive power to compensate an event that degrades the quality of electricity service.
Table 5 indicates the information exchanged between the PROCOM prototype and the SIDER environment. This active and adaptive management with regard to the electricity grid is considered a priority in terms of research and development within the framework of the European Technology Platform for Smart Grids [
27].
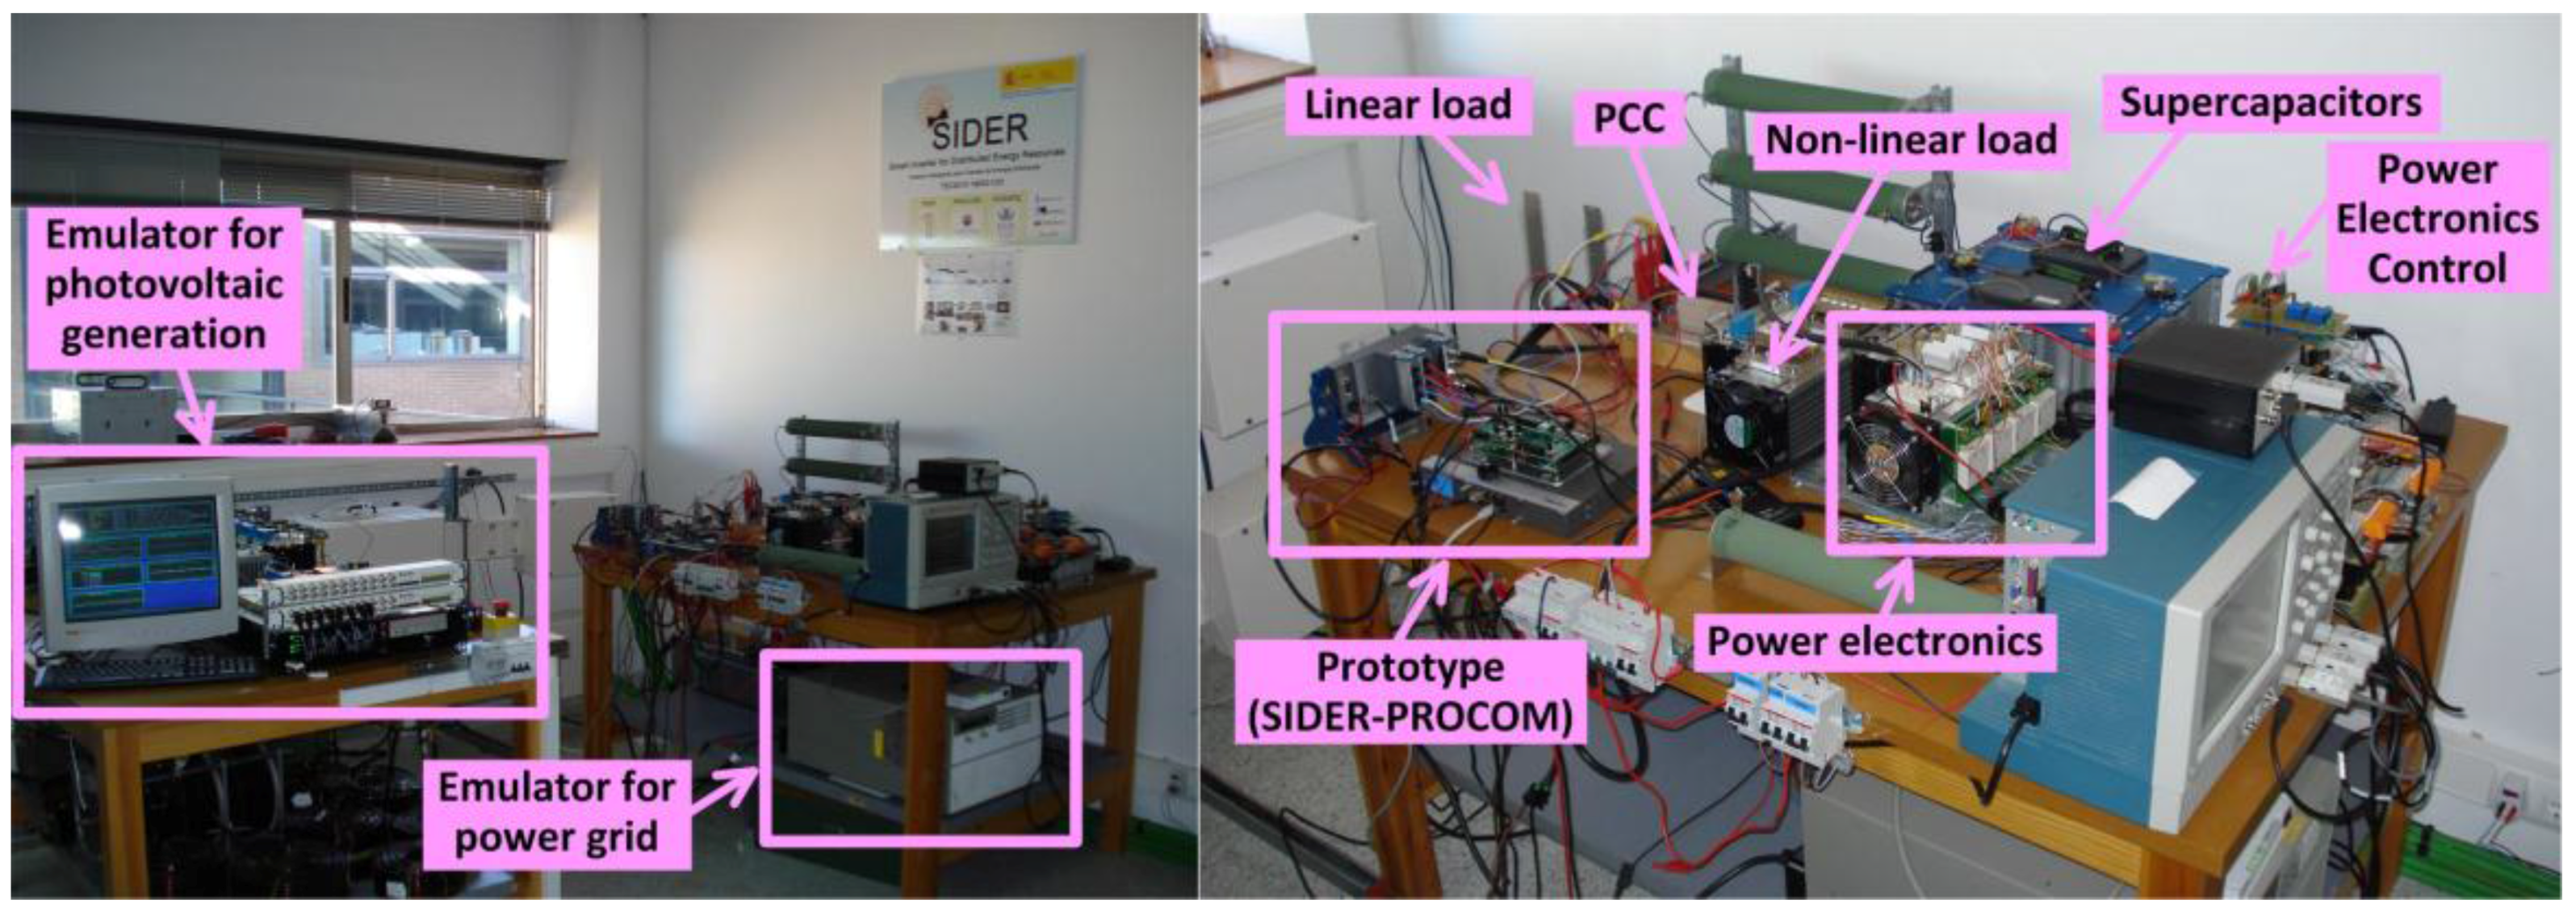
The SIDER project is an experimental context where the PROCOM prototype has demonstrated its flexible integration into other power electronics systems, as well as its ability to manage the interface with the grid connection [
28,
29]. Although the tests conducted in prototype confirmed its good behavior, the SIDER experience has served to confirm the proper functioning of ES within a context of real integration.
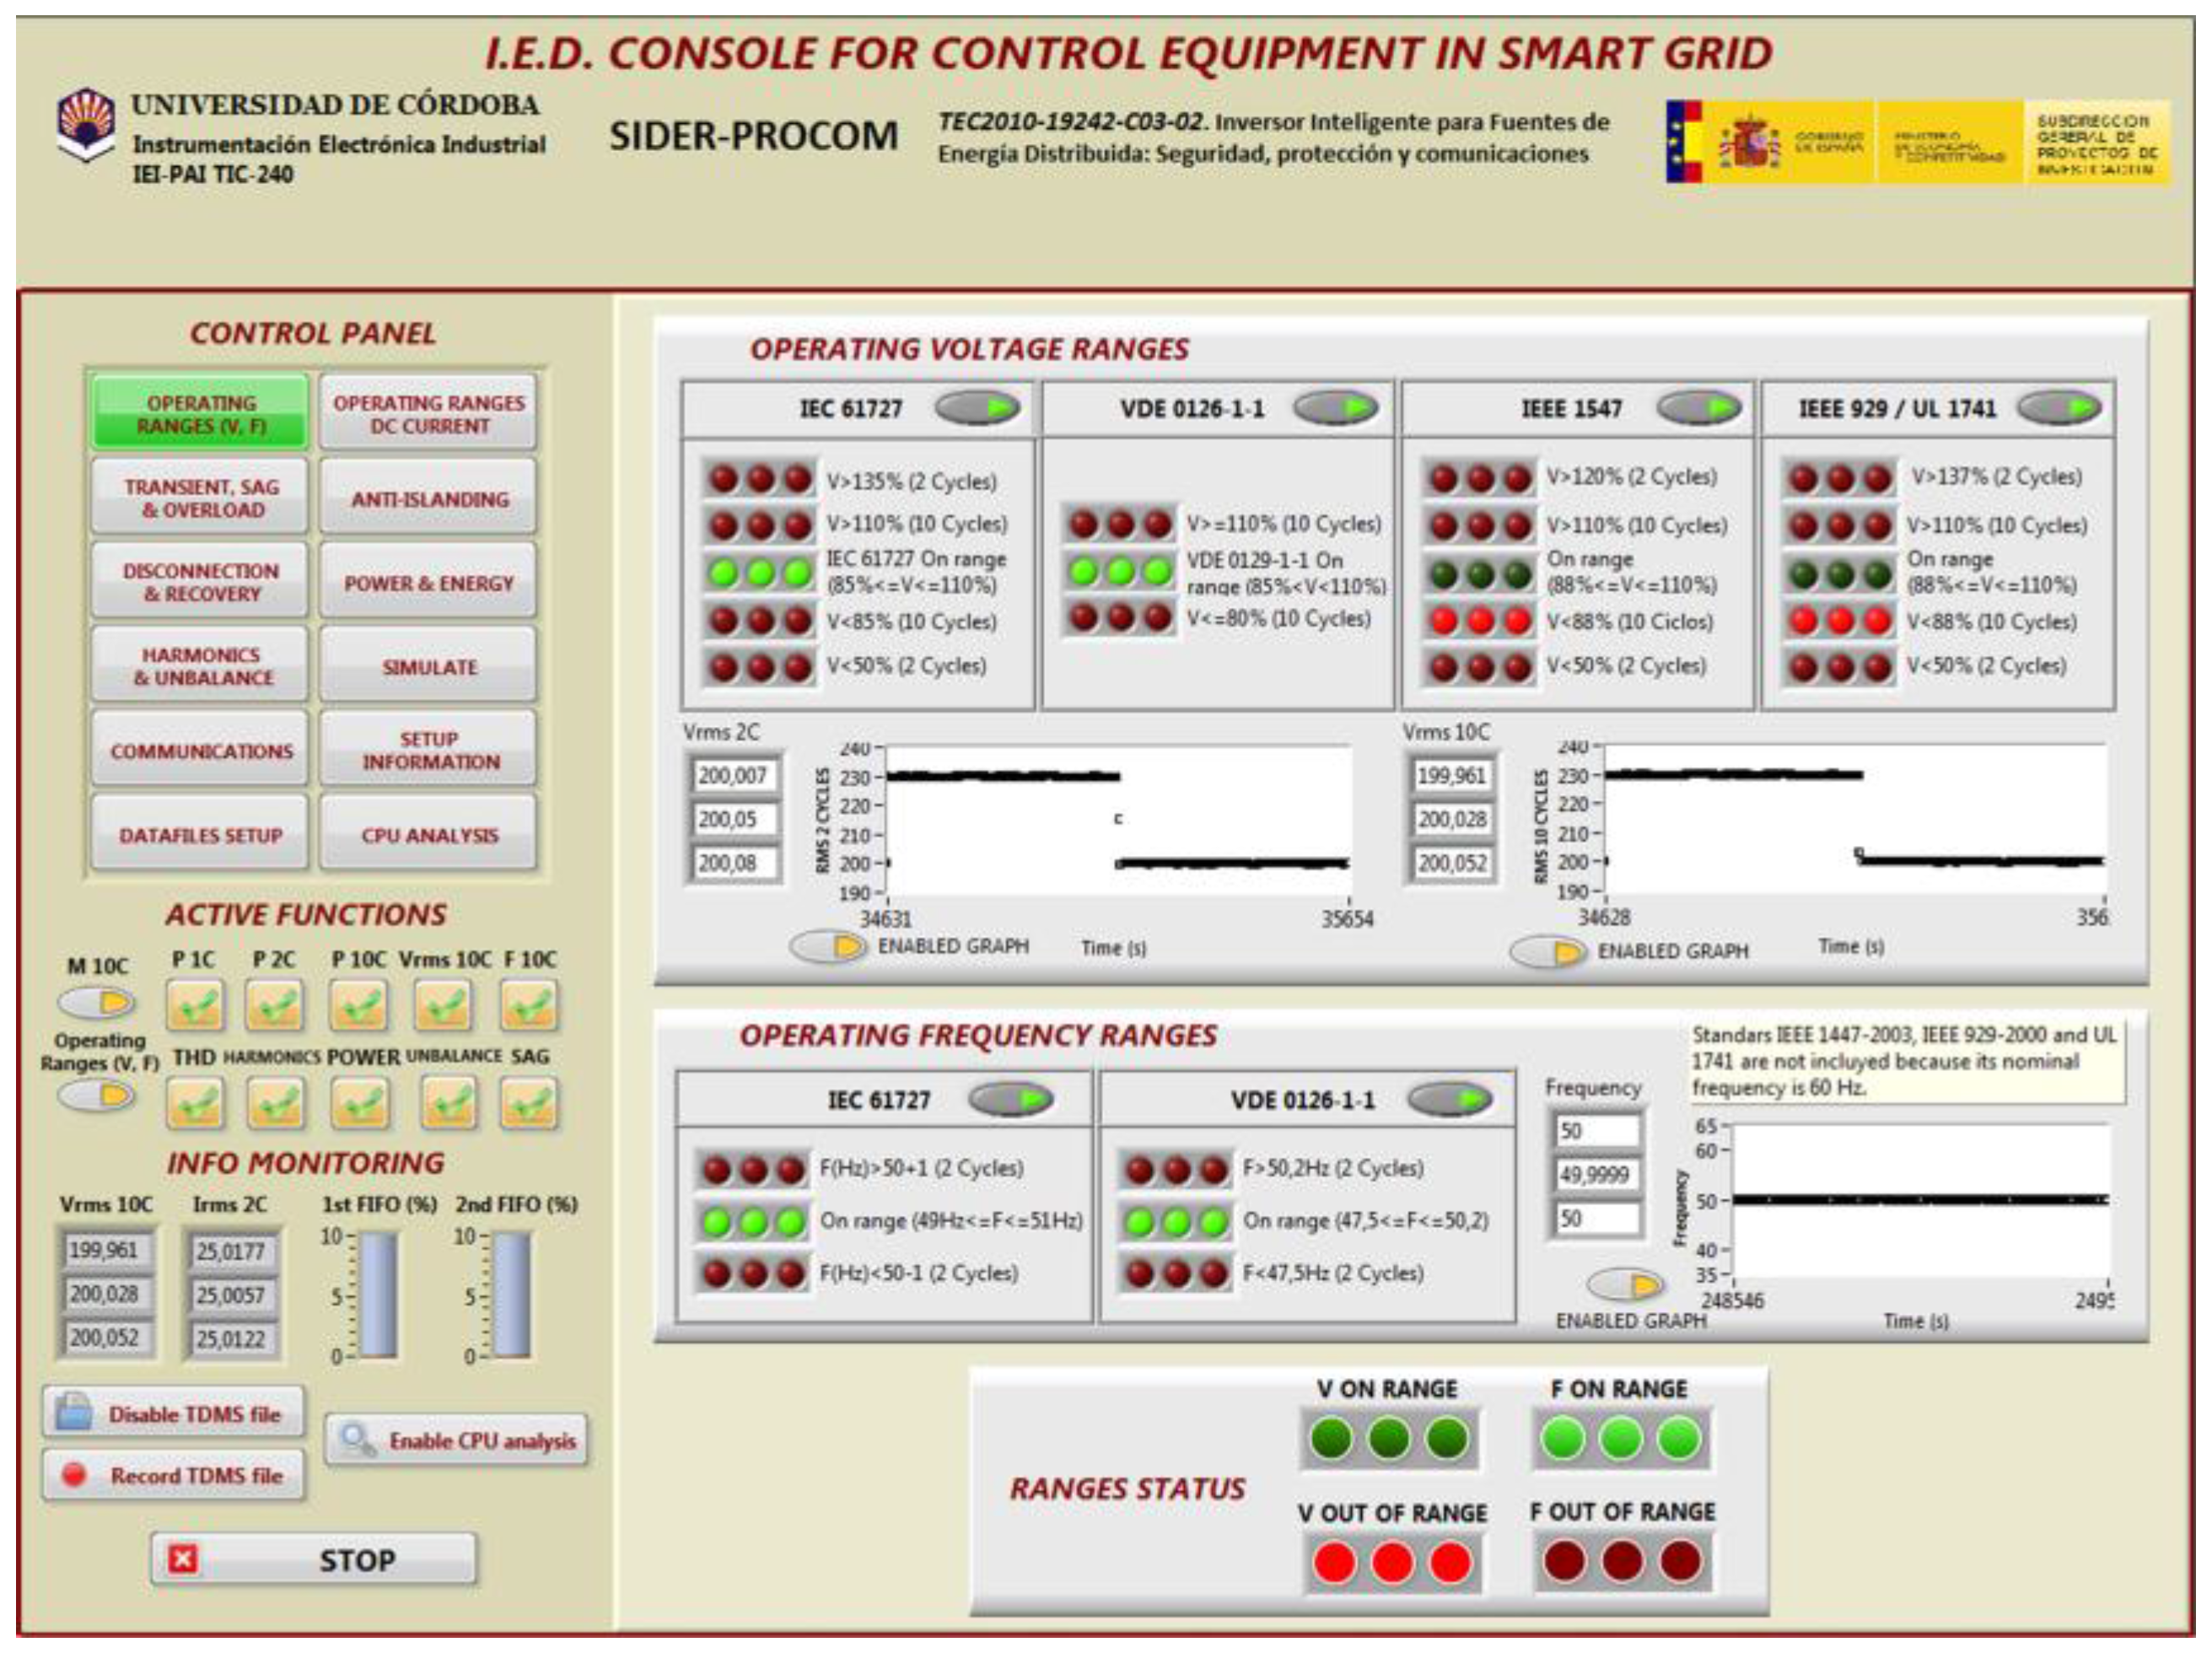
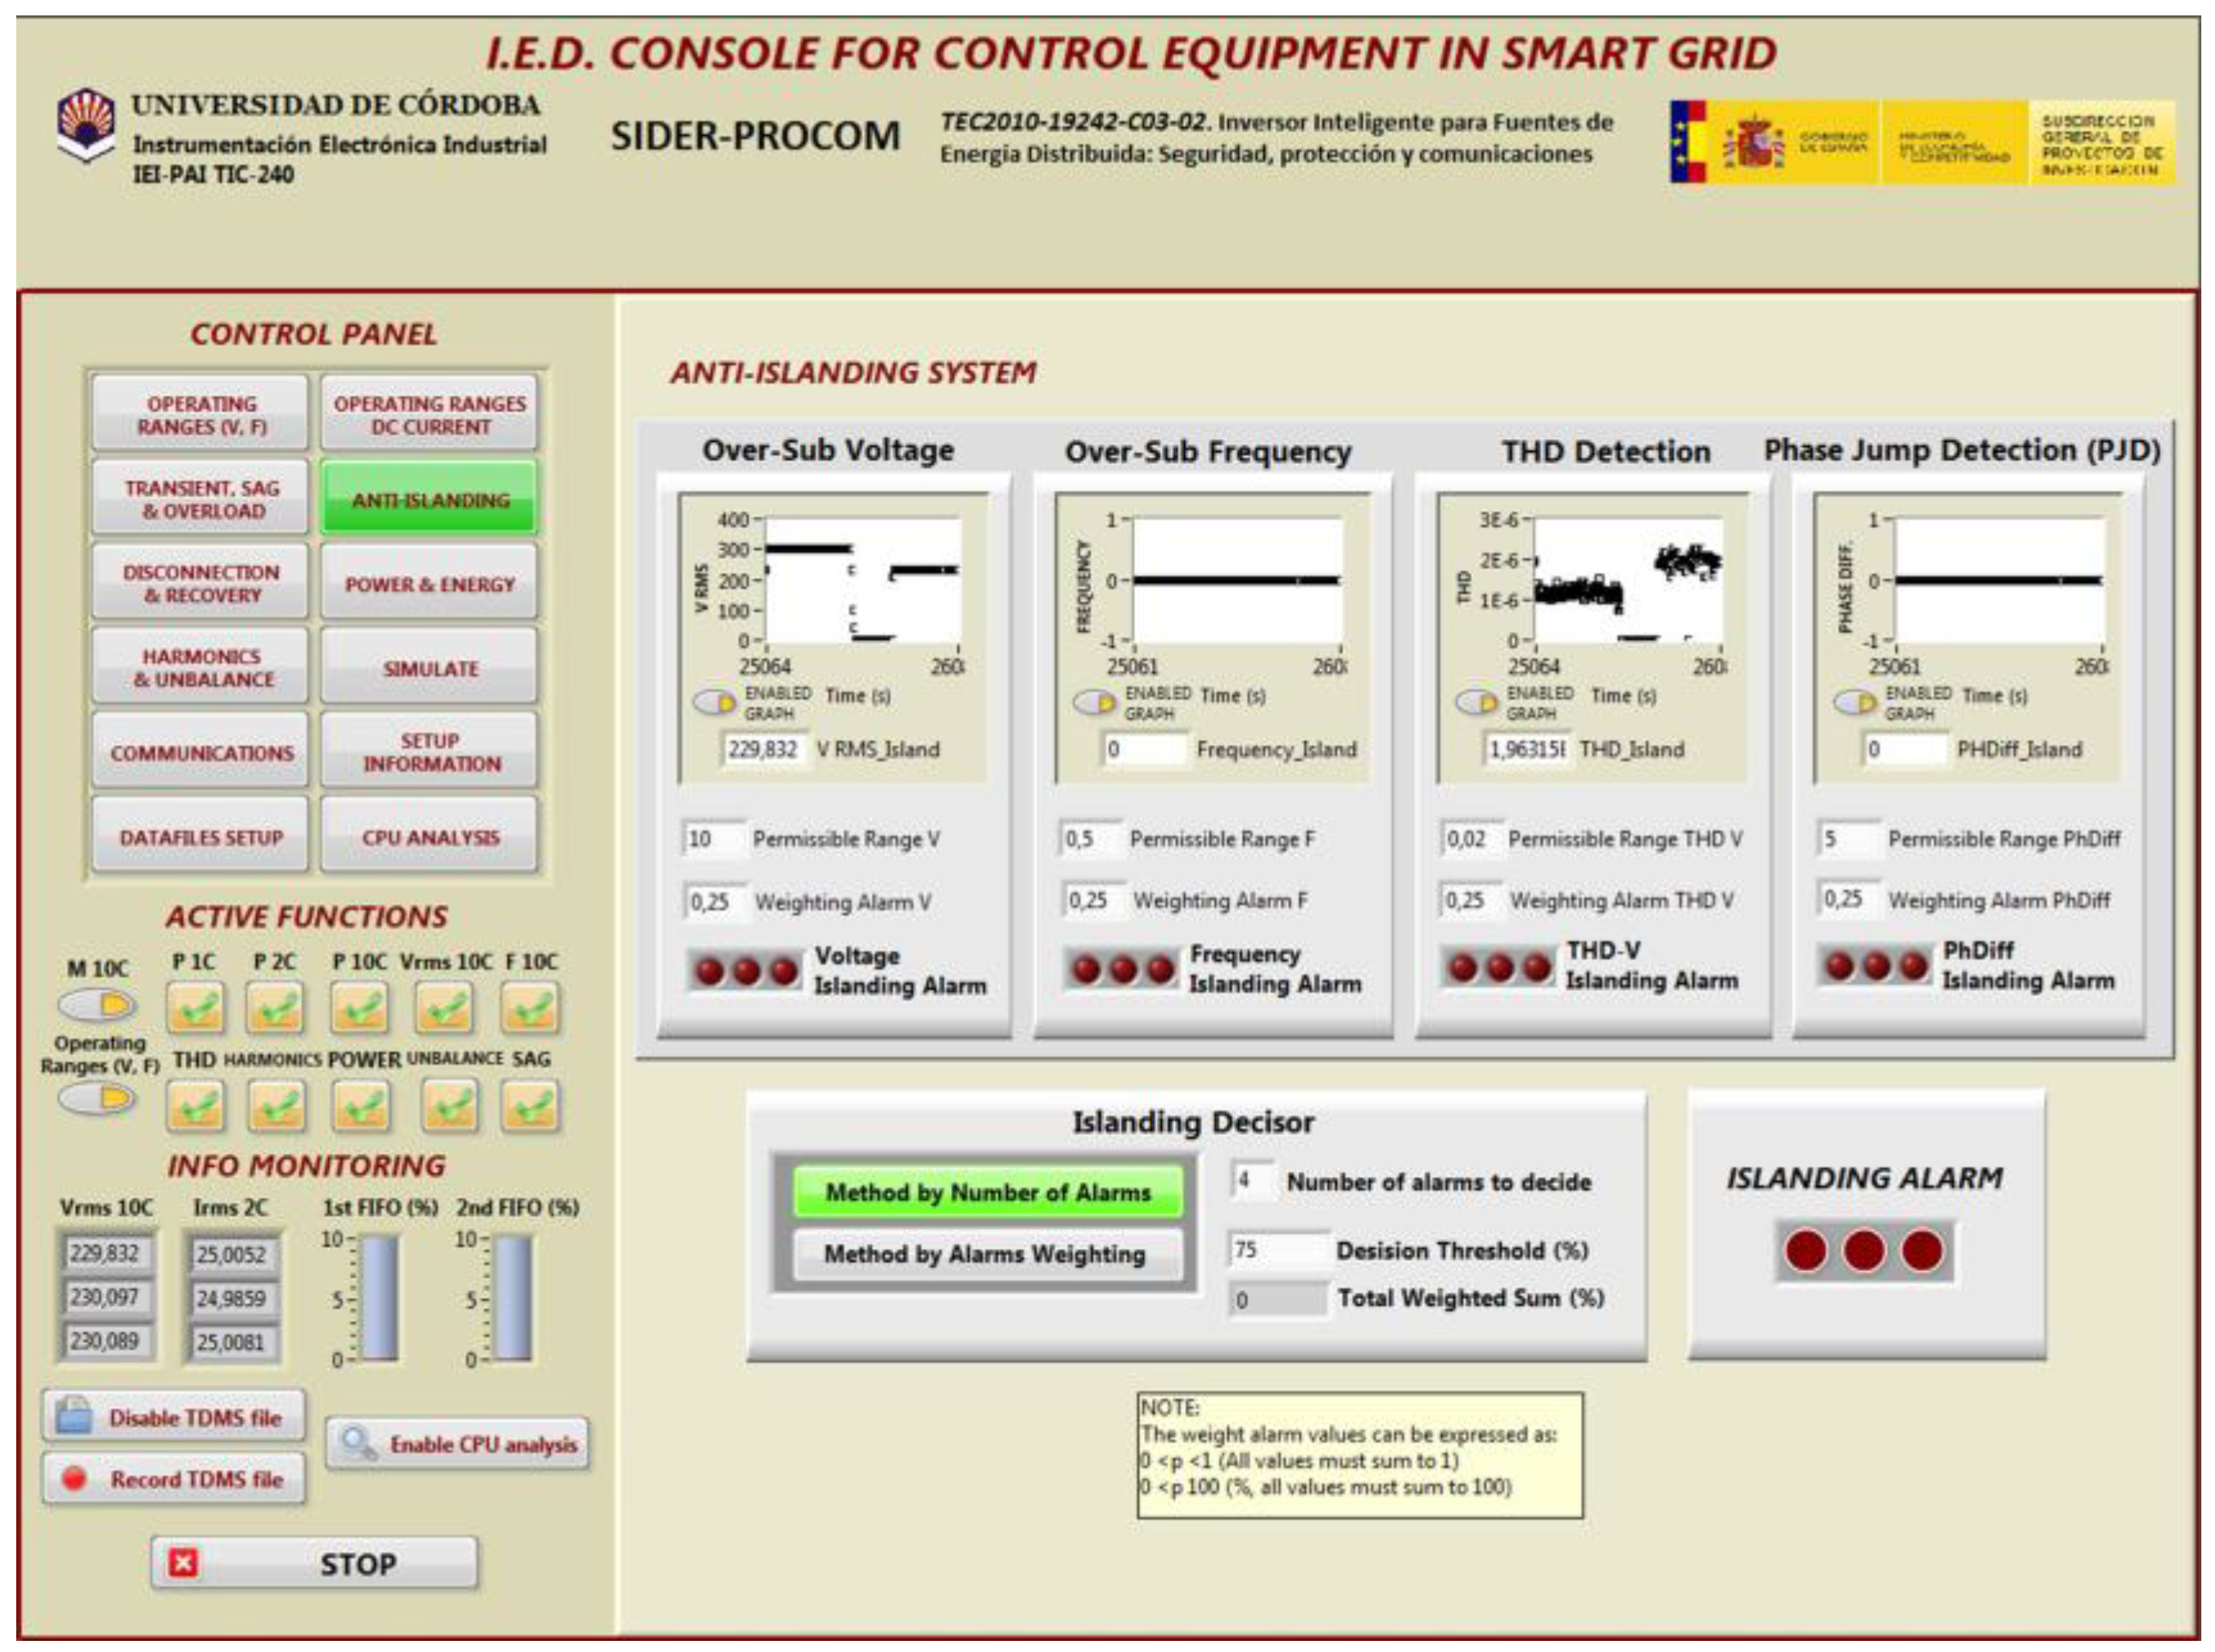
Figure 21 shows the final result of integrating the prototype during the tests within the SIDER context. Finally, some screens of the prototype’s control console are shown in
Figure 22 and
Figure 23.
5. Conclusions
This paper has presented the design and development of a prototype multifunctional ES for controlling and managing the interface between a smart inverter and the electricity grid in a Smart Grid context. The design has focused upon the appropriate timing requirements for measurements defined in IEC 61000-4-30. These requirements have led to a data architecture design based on a set of critical temporary loops, where the various groups of equipment functions are processed: A half-cycle loop that directly processes the data acquisition for transient events or those of a highly random nature. A two-cycle loop, which has been implemented on this equipment in an original manner, which the team has termed quasi-stationary is used for rapid measurements with some stationarity, where the protection functions are processed. Finally, a 10-cycle loop dedicated to processing functions of purely stationary power quality parameters. The data exchange is carried out by two deterministic FIFO stacks, managed from the fastest half-cycle loop, and synchronized to two and ten cycles.
It is important to emphasise the great functional capacity of the prototype at the Power Quality level, where it is able to endow the inverter with great added value, transforming it Power Quality Analyzer (PQA). In order to do this, ultimate-generation event-detection algorithms, such as those based on Higher-order statistics (HOS), have been incorporated, as well as other, original algorithms for passively detecting islanding, based upon multiple-method weighting.
The equipment has been subjected to Class A and Class S testing procedures, according to standard IEC 62586-2, obtaining good results in all of the tests whose conditions were within the limitations of our laboratory resources. Unfortunately, due to these limitations it was impossible to address all test scenarios, so it cannot be concluded that the equipment can be considered Class A, but everything indicates that it could pass a rigorous certification of this kind. In addition, based on the tests of uncertainty in measurements and temporary response to alarms, a positive validation in system behavior can be concluded. Furthermore, its proper functioning under the SIDER project, sponsored by the Ministry of Science and Innovation of Spain and supervised by companies in the electricity sector, where the prototype’s suitability for being integrated into the power electronics of a photovoltaic inverter has been proven.
The experimental part of this paper has concentrated on testing the prototype’s functionalities. However, it is worth considering the study of the protoype’s interaction with the inverter in different response modes and with regard to different regulations. Another future improvement to the prototype, and one on which this team is now working, is implementing functionalities hosting capacity.


 ,
, 


