
Improving the Eco-Efficiency of High Performance Computing Clusters Using EECluster


Abstract
:1. Introduction
2. Eco-Efficiency
- Dependence between QoS and primary consumption of energy. The primary savings are about 370 g of CO for each kWh of electrical energy that is saved during the operation of the HPC.
- Dependence between the QoS and the lifespan of the equipment. According to our own experience, the average life of a compute node in an HPC cluster is between 4 and 5 years. The number of failures of a given node during its whole lifetime is typically two or three. A rough estimation of the average number of failures of a single node during a year is 0.5 failures/year (thus 0.5 failures/year * 5 years = 2.5 failures). Both the life extent and the quantity of failures depend on the number of power-on and power-off cycles. Heavily loaded nodes might suffer from 0.75 failures/year and a shorter lifespan of 3 years. Assuming that the most common failures are power supplies, motherboards, and disk drives, the typical cost of a reparation can be estimated in 5% of the acquisition cost, i.e., about 20 kg of CO are saved for each failure that is prevented. Each additional year of use of a compute node saves more than 80 kg of CO (approx. 22% of the total manufacturing emissions if the life is between 4 and 5 years, as mentioned). This includes the primary energy used for manufacturing a new node and the recycling costs of the discarded equipment.
- Dependence between the QoS and the lifespan of the support equipment. An additional 1% was added for each saved kWh (2.2 g CO) and 1 g CO for each saved power cycle. In the first case, this models the improved failure rate of support equipment such as cooling fans and air conditioning. The second case models different failures in the datacenter that may be caused by current surges when a large number of compute nodes are powered on or off at the same time.
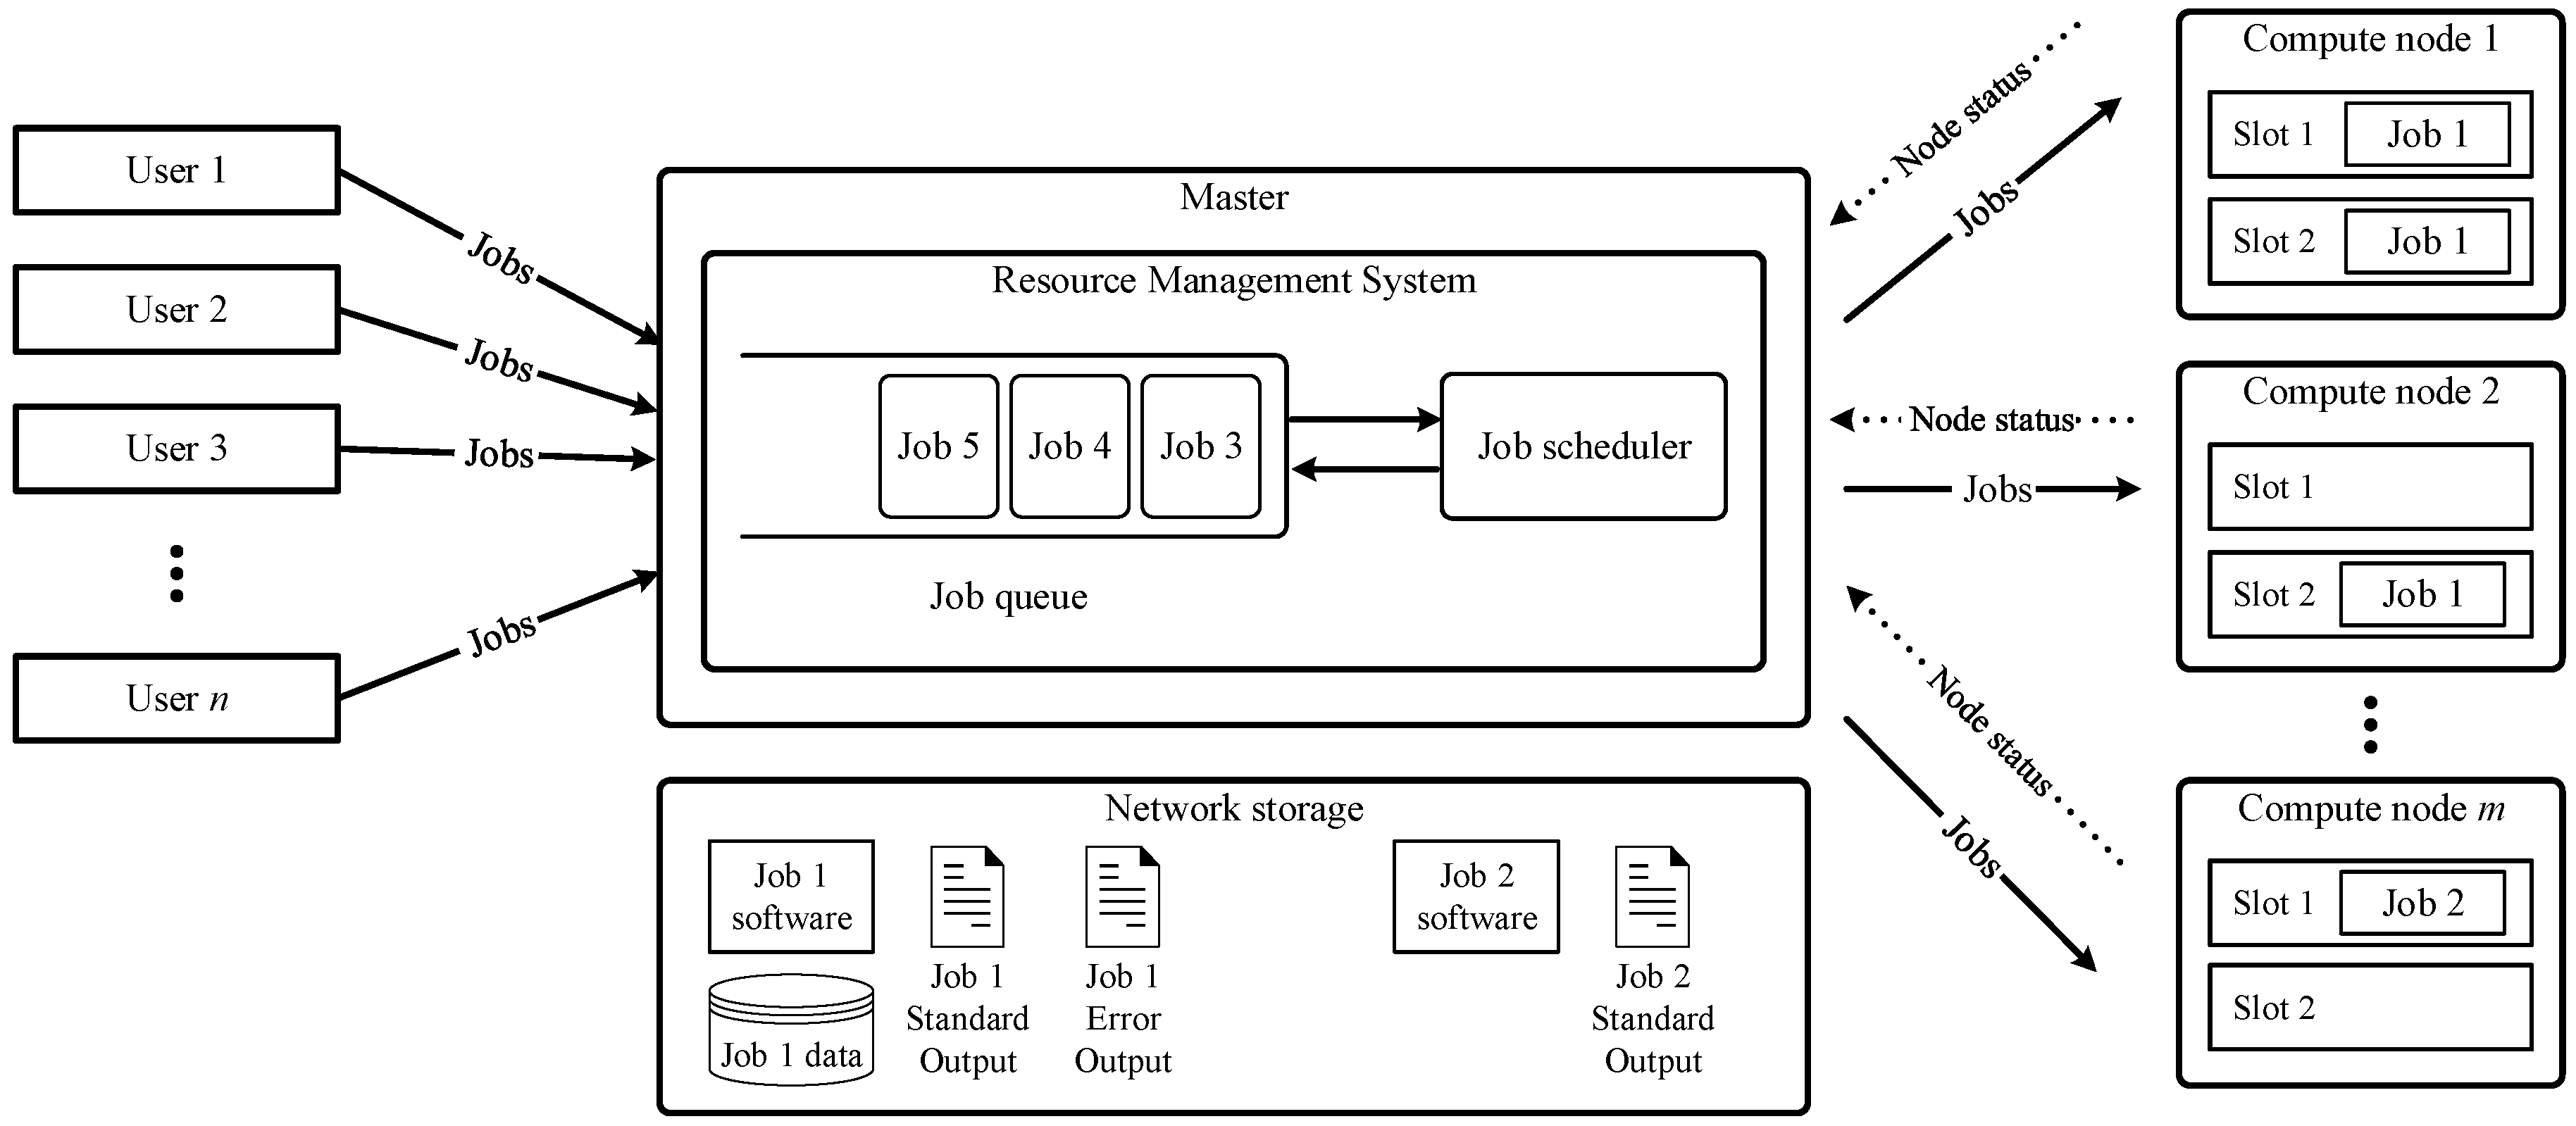
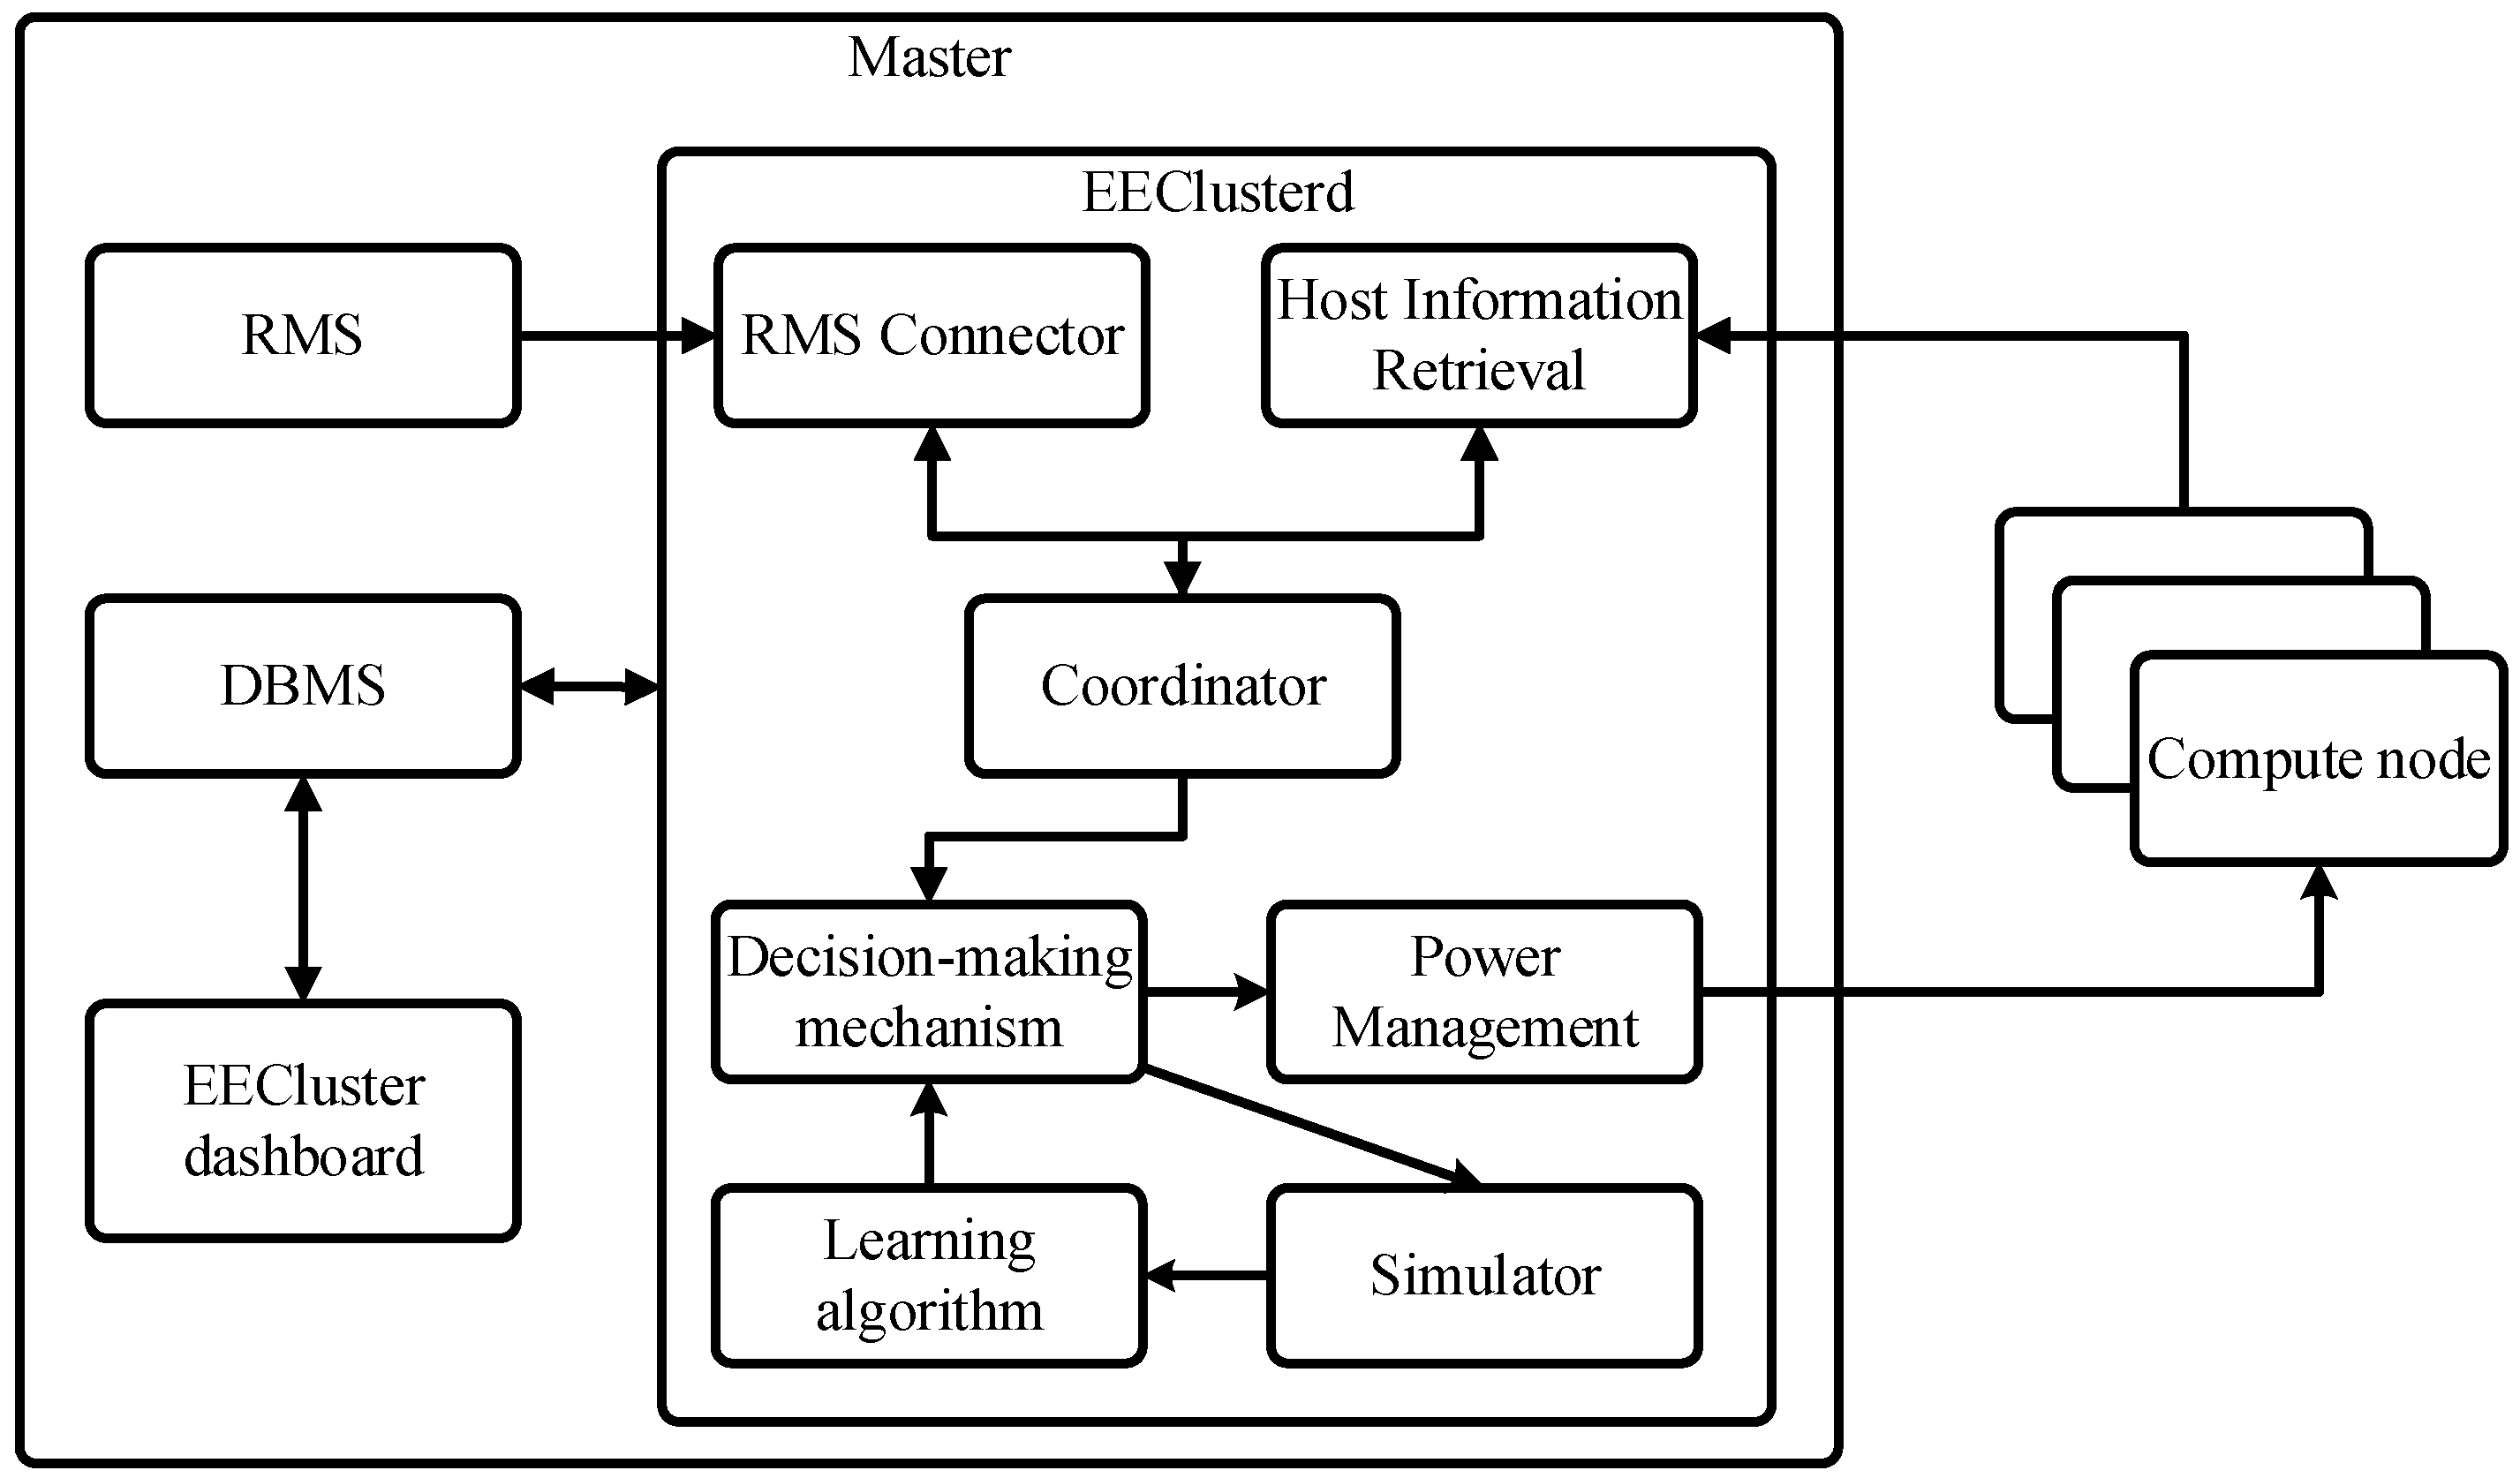
3. Architecture
4. Decision-Making Mechanism
- If the current number of resources are insufficient to run every queued job in a sequential manner, then keep powered on at least the highest number of slots requested by any queued job, as long as that amount does not exceed the total number of slots in the cluster.
- If the average waiting time for the queued jobs is higher than a given threshold or if the number or queued jobs is higher than a given threshold , then power on one slot.
- If the average waiting time for the queued jobs is lower than a given threshold or if the number of queued jobs is lower than a given threshold , then power off one slot.
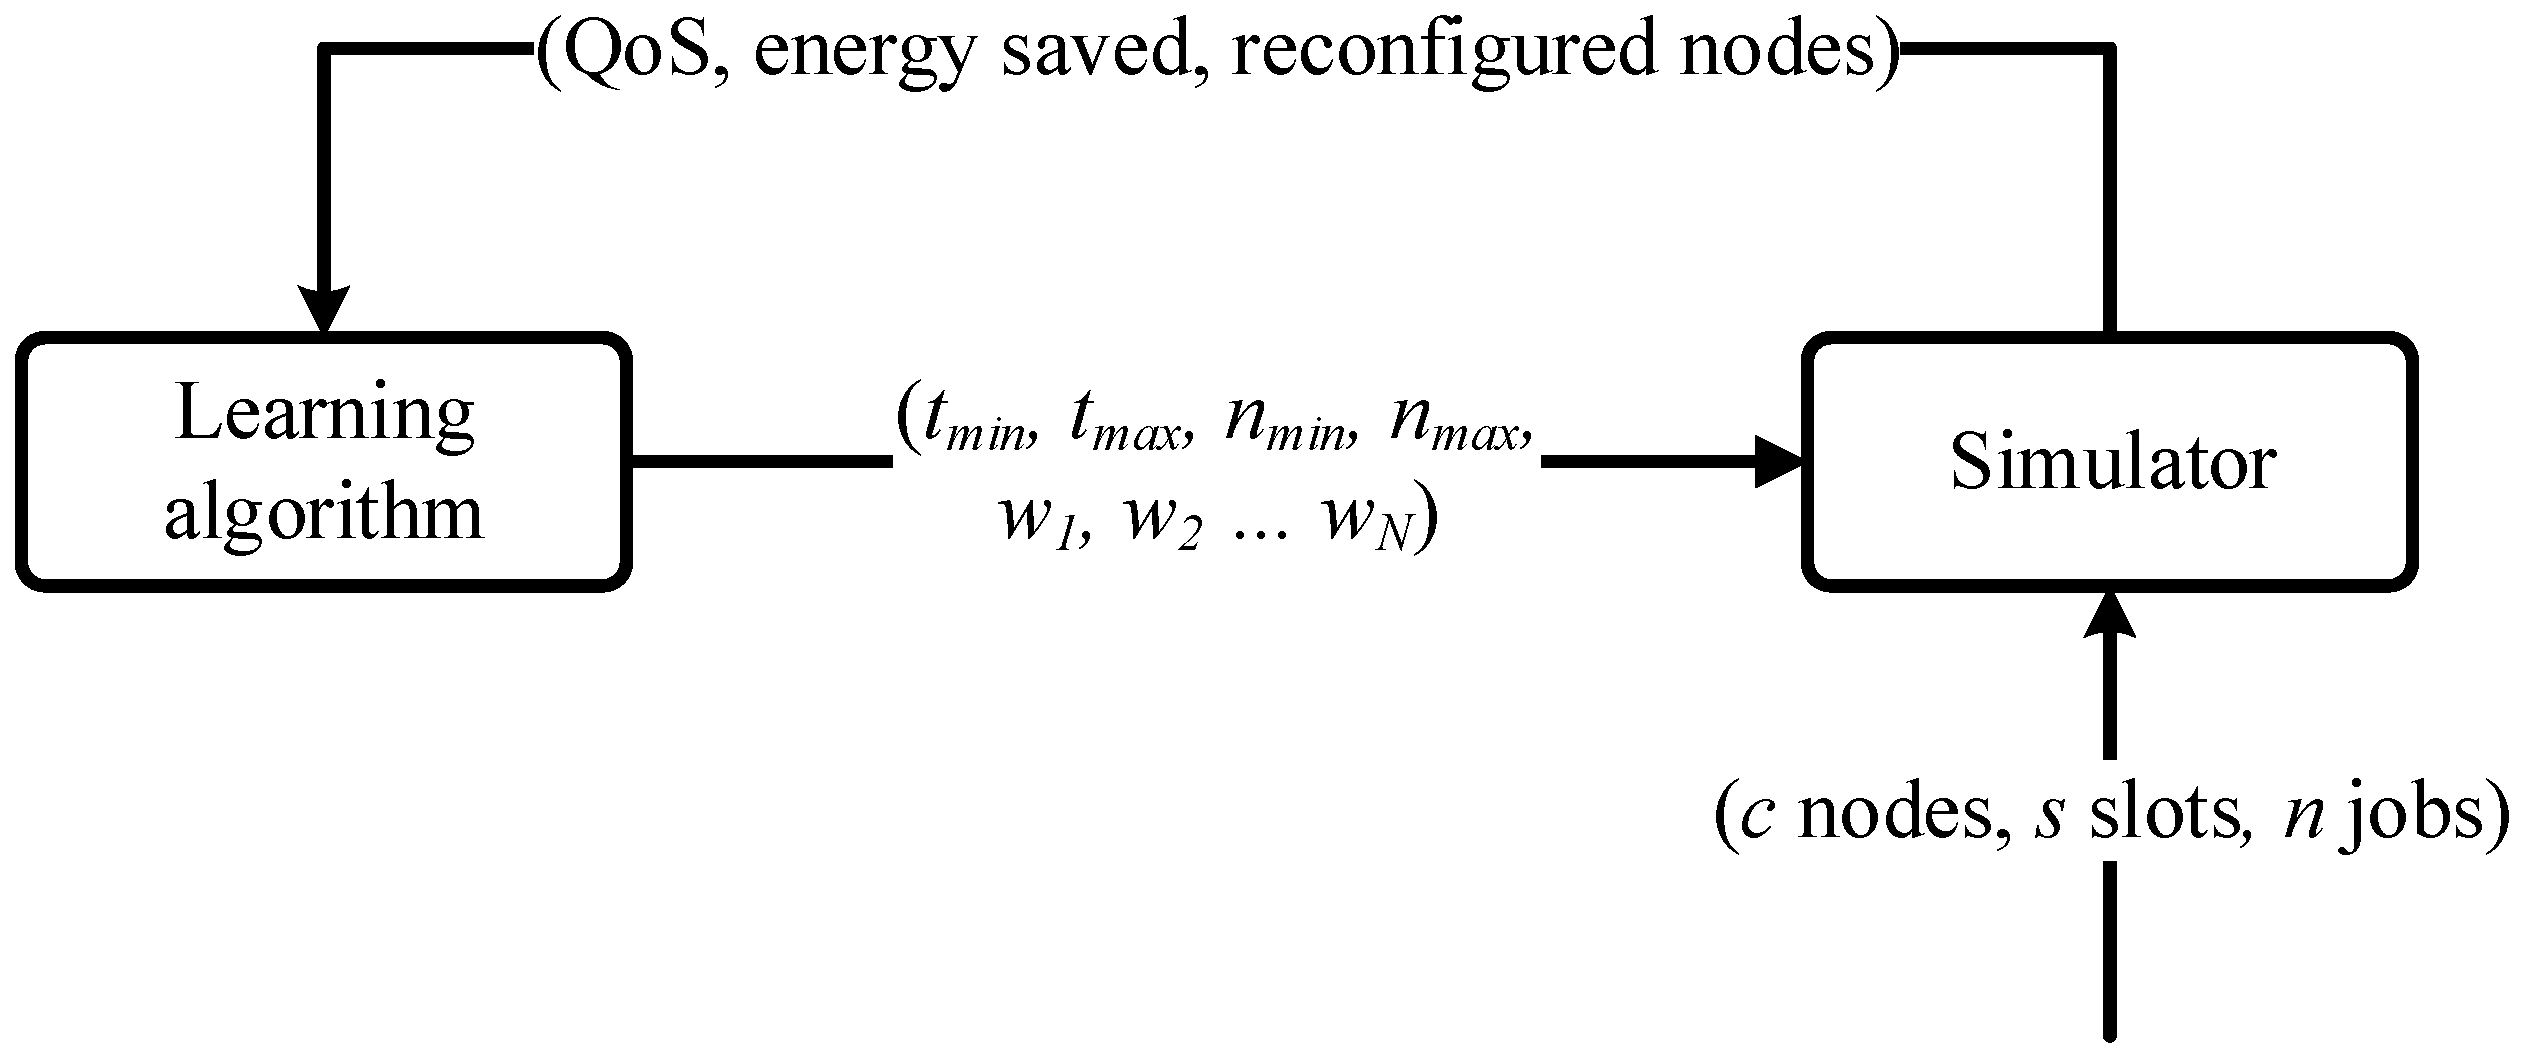
5. Learning Algorithm
6. Experimental Results
7. Concluding Remarks
Acknowledgments
Author Contributions
Conflicts of Interest
Acronyms
| HPC | High Performance Computing |
| RMS | Resource Management System |
| OGE | Oracle Grid Engine/Open Grid Engine |
| SGE | Sun Grid Engine/Son of Grid Engine |
| PBS | Portable Batch System |
| TORQUE | Terascale Open-source Resource and QUEue Manager |
| DBMS | Database Management System |
| IPMI | Intelligent Platform Management Interface |
| WOL | Wake On Lan |
| SSH | Secure SHell |
| HGFS | Hybrid Genetic Fuzzy System |
| TSK | Tagaki-Sugeno-Kang |
| QoS | Quality of Service |
| NSGA-II | Non-dominated Sorting Genetic Algorithm-II |
| MOEAs | MultiObjective Evolutionary Algorithms |
References
- Delforge, P.; Whitney, J. Issue Paper: Data Center Efficiency Assessment Scaling up Energy Efficiency across the Data Center Industry: Evaluating Key Drivers and Barriers; Technical Report; Natural Resources Defense Council (NRDC): New York, NY, USA, 2014. [Google Scholar]
- U.S. Environmental Protection Agency. Report to Congress on Server and Data Center Energy Efficiency Public Law 109-431; Technical Report; ENERGY STAR Program: Washington, DC, USA, 2007.
- Ebbers, M.; Archibald, M.; Fonseca, C.F.F.D.; Griffel, M.; Para, V.; Searcy, M. Smarter Data Centers: Achieving Greater Efficiency; Technical Report; IBM Redpaper: Research Triangle Park, NC, USA, 2011. [Google Scholar]
- The Economist Intelligence Unit. IT and the Environment: A New Item on the CIO’s Agenda? Technical Report; The Economist: London, UK, 2007. [Google Scholar]
- Gartner. Gartner Estimates ICT Industry Accounts for 2 Percent of Global CO2 Emissions; Gartner: Stamford, CT, USA, 2007. [Google Scholar]
- Forrest, W.; Kaplan, J.M.; Kindler, N. Data Centers: How to Cut Carbon Emissions and Costs; Technical Report; McKinsey & Company: New York, NY, USA, 2008. [Google Scholar]
- Valentini, G.L.; Lassonde, W.; Khan, S.U.; Min-Allah, N.; Madani, S.A.; Li, J.; Zhang, L.; Wang, L.; Ghani, N.; Kolodziej, J.; et al. An overview of energy efficiency techniques in cluster computing systems. Clust. Comput. 2013, 16, 3–15. [Google Scholar] [CrossRef]
- Haring, R.; Ohmacht, M.; Fox, T.; Gschwind, M.; Satterfield, D.; Sugavanam, K.; Coteus, P.; Heidelberger, P.; Blumrich, M.; Wisniewski, R.; et al. The IBM blue gene/Q compute chip. IEEE Micro 2012, 32, 48–60. [Google Scholar] [CrossRef]
- IBM Systems and Technology Group. IBM System Blue Gene/Q; Technical Report; IBM: Somers, NY, USA, 2011. [Google Scholar]
- Hsu, C.H.; Kremer, U. The design, implementation, and evaluation of a compiler algorithm for CPU energy reduction. ACM SIGPLAN Not. 2003, 38, 38–48. [Google Scholar] [CrossRef]
- Hsu, C.H.; Feng, W.C. A Power-Aware Run-Time System for High-Performance Computing. In Proceedings of the ACM/IEEE SC 2005 Conference (SC ’05), Seattle, WA, USA, 12–18 November 2005; IEEE: Washington, DC, USA, 2005; p. 1. [Google Scholar]
- Freeh, V.W.; Lowenthal, D.K.; Pan, F.; Kappiah, N.; Springer, R.; Rountree, B.L.; Femal, M.E. Analyzing the Energy-Time Trade-off in High-Performance Computing Applications. IEEE Trans. Parallel Distrib. Syst. 2007, 18, 835–848. [Google Scholar] [CrossRef]
- Lim, M.; Freeh, V.; Lowenthal, D. Adaptive, Transparent Frequency and Voltage Scaling of Communication Phases in MPI Programs. In Proceedings of the ACM/IEEE SC 2006 Conference (SC ’06), Tampa, FL, USA, 11–17 November 2006; IEEE: Tampa, FL, USA, 2006; p. 14. [Google Scholar]
- Chen, Y.; Zeng, Y. Automatic energy status controlling with dynamic voltage scaling in poweraware high performance computing cluster. In Proceedings of the Parallel and Distributed Computing, Applications and Technologies (PDCAT), Gwangju, Korea, 20–22 October 2011; IEEE: Gwangju, Korea, 2011; pp. 412–416. [Google Scholar]
- Ge, R.; Feng, X.; Feng, W.C.; Cameron, K.W. CPU MISER: A Performance-Directed, Run-Time System for Power-Aware Clusters. In Proceedings of the 2007 International Conference on Parallel Processing (ICPP 2007), Xi’an, China, 10–14 September 2007; IEEE: Xi’an, China, 2007; pp. 18–25. [Google Scholar]
- Huang, S.; Feng, W. Energy-Efficient Cluster Computing via Accurate Workload Characterization. In Proceedings of the 2009 9th IEEE/ACM International Symposium on Cluster Computing and the Grid, Shanghai, China, 18–21 May 2009; IEEE: Shanghai, China, 2009; pp. 68–75. [Google Scholar]
- Chetsa, G.L.T.; Lefrvre, L.; Pierson, J.M.; Stolf, P.; Da Costa, G. A Runtime Framework for Energy Efficient HPC Systems without a Priori Knowledge of Applications. In Proceedings of the 2012 IEEE 18th International Conference on Parallel and Distributed Systems, Singapore, 17–19 December 2012; IEEE: Singapore, 2012; pp. 660–667. [Google Scholar]
- Zong, Z.; Ruan, X.; Manzanares, A.; Bellam, K.; Qin, X. Improving Energy-Efficiency of Computational Grids via Scheduling. In Handbook of Research on P2P and Grid Systems for Service-Oriented Computing; Antonopoulos, N., Exarchakos, G., Li, M., Liotta, A., Eds.; IGI Global: Hershey, PA, USA, 2010; Chapter 22. [Google Scholar]
- Zong, Z.; Nijim, M.; Manzanares, A.; Qin, X. Energy efficient scheduling for parallel applications on mobile clusters. Clust. Comput. 2007, 11, 91–113. [Google Scholar] [CrossRef]
- Bash, C.; Forman, G. Cool job allocation: Measuring the power savings of placing jobs at cooling-efficient locations in the data center. In Proceedings of the 2007 USENIX Annual Technical Conference on Proceedings of the USENIX Annual Technical Conference, Santa Clara, CA, USA, 17–22 June 2007; USENIX Association: Berkeley, CA, USA, 2007; pp. 29:1–29:6. [Google Scholar]
- Tang, Q.; Gupta, S.K.S.; Varsamopoulos, G. Energy-Efficient Thermal-Aware Task Scheduling for Homogeneous High-Performance Computing Data Centers: A Cyber-Physical Approach. IEEE Trans. Parallel Distrib. Syst. 2008, 19, 1458–1472. [Google Scholar] [CrossRef]
- Alonso, P.; Badia, R.M.; Labarta, J.; Barreda, M.; Dolz, M.F.; Mayo, R.; Quintana-Orti, E.S.; Reyes, R. Tools for Power-Energy Modelling and Analysis of Parallel Scientific Applications. In Proceedings of the 2012 41st International Conference on Parallel Processing, 10–13 September 2012; IEEE: Pittsburgh, PA, USA; pp. 420–429.
- Schubert, S.; Kostic, D.; Zwaenepoel, W.; Shin, K.G. Profiling software for energy consumption. In Proceedings of the 2012 IEEE International Conference on Green Computing and Communications, GreenCom 2012, Besancon, France, 20–23 November 2012; IEEE: Besancon, France; pp. 515–522.
- Freeh, V.W.; Lowenthal, D.K. Using multiple energy gears in MPI programs on a power-scalable cluster. In Proceedings of the Tenth ACM SIGPLAN Symposium on Principles and Practice of Parallel Programming—PPoPP ’05, Chicago, IL, USA, 15–17 June 2005; ACM Press: New York, NY, USA, 2005; pp. 164–173. [Google Scholar]
- Li, D.; Nikolopoulos, D.S.; Cameron, K.; de Supinski, B.R.; Schulz, M. Power-aware MPI task aggregation prediction for high-end computing systems. In Proceedings of the 2010 IEEE International Symposium on Parallel & Distributed Processing (IPDPS), Atlanta, GA, USA, 19–23 April 2010; IEEE: Atlanta, GA, USA, 2010; pp. 1–12. [Google Scholar]
- Xian, C.; Lu, Y.H.; Li, Z. A programming environment with runtime energy characterization for energy-aware applications. In Proceedings of the 2007 International Symposium on Low Power Electronics and Design—ISLPED ’07, Portland, OR, USA, 27–29 August 2007; ACM Press: New York, NY, USA, 2007; pp. 141–146. [Google Scholar]
- Pinheiro, E.; Bianchini, R.; Carrera, E.V.; Heath, T. Load balancing and unbalancing for power and performance in cluster-based systems. In Proceedings of the Workshop on Compilers and Operating Systems for Low Power, Barcelona, Spain, 9 September 2001; Volume 180, pp. 182–195.
- Das, R.; Kephart, J.O.; Lefurgy, C.; Tesauro, G.; Levine, D.W.; Chan, H. Autonomic multi-agent management of power and performance in data centers. In Proceedings of the 7th International Joint Conference on Autonomous Agents and Multiagent Systems: Industrial Track—AAMAS ’08, Estoril, Portugal, 2008; International Foundation for Autonomous Agents and Multiagent Systems: Richland, SC, USA, 2008; pp. 107–114. [Google Scholar]
- Elnozahy, E.; Kistler, M.; Rajamony, R. Energy-efficient server clusters. In Power-Aware Computer Systems; Springer-Verlag: Berlin/Heidelberg, Germany, 2003; pp. 179–197. [Google Scholar]
- Berral, J.L.; Goiri, Í.; Nou, R.; Julià, F.; Guitart, J.; Gavaldà, R.; Torres, J. Towards energy-aware scheduling in data centers using machine learning. In Proceedings of the 1st International Conference on EnergyEfficient Computing and Networking—e-Energy ’10, Passau, Germany, 13–15 April 2010; ACM Press: New York, NY, USA, 2010; Volume 2, p. 215. [Google Scholar]
- Lang, W.; Patel, J.M.; Naughton, J.F. On energy management, load balancing and replication. ACM SIGMOD Rec. 2010, 38, 35–42. [Google Scholar] [CrossRef]
- Entrialgo, J.; Medrano, R.; García, D.F.; García, J. Autonomic power management with self-healing in server clusters under QoS constraints. In Computing; Springer: Vienna, Austria, 2015; pp. 1–24. [Google Scholar]
- VMware. VMware Distributed Power Management Concepts and Use. Available online: http://www.vmware.com/files/pdf/Distributed-Power-Management-vSphere.pdf (accessed on 1 March 2016).
- Citrix Systems. XenServer - Server Virtualization and Hypervisor Management. Available online: http://www.citrix.com/products/xenserver/overview.html (accessed on 1 March 2016).
- Alvarruiz, F.; de Alfonso, C.; Caballer, M.; Hernández, V. An Energy Manager for High Performance Computer Clusters. In Proceedings of the 2012 IEEE 10th International Symposium on Parallel and Distributed Processing with Applications, Leganes, Spain, 10–13 July 2012; IEEE: Leganés, Spain, 2012; pp. 231–238. [Google Scholar]
- Dolz, M.F.; Fernández, J.C.; Iserte, S.; Mayo, R.; Quintana-Ortí, E.S.; Cotallo, M.E.; Díaz, G. EnergySaving Cluster experience in CETA-CIEMAT. In Proceedings of the 5th Iberian GRID Infrastructure Conference, Santander, Spain, 8–10 June 2011.
- Kiertscher, S.; Zinke, J.; Gasterstädt, S.; Schnor, B. Cherub: Power Consumption Aware Cluster Resource Management. In Proceedings of the 2010 IEEE/ACM International Conference on Cyber, Physical and Social Computing (CPSCom) Green Computing and Communications (GreenCom), Hangzhou, China, 18–20 December 2010; pp. 325–331.
- Cocaña-Fernández, A.; Ranilla, J.; Sánchez, L. Energy-efficient allocation of computing node slots in HPC clusters through parameter learning and hybrid genetic fuzzy system modeling. J. Supercomput. 2014, 71, 1163–1174. [Google Scholar] [CrossRef]
- Cocaña-Fernández, A.; Sánchez, L.; Ranilla, J. Leveraging a predictive model of the workload for intelligent slot allocation schemes in energy-efficient HPC clusters. Eng. Appl. Artif. Intell. 2016, 48, 95–105. [Google Scholar] [CrossRef]
- Cocaña-Fernández, A.; Ranilla, J.; Sánchez, L. Energy-Efficient Allocation of Computing Node Slots in HPC Clusters through Evolutionary Multi-Criteria Decision Making. In Proceedings of the 14th International Conference on Computational and Mathematical Methods in Science and Engineering, CMMSE 2014, Cádiz, Spain, 3–7 July 2014; pp. 318–330.
- Hendrik, A.; Bidwell, V.R. Measuring Eco-Efficiency: A Guide to Reporting Company Performance; World Business Council for Sustainable Development: Geneva, Switzerland, 2000. [Google Scholar]
- Deng, L.; Babbitt, C.W.; Williams, E.D. Economic-balance hybrid LCA extended with uncertainty analysis: Case study of a laptop computer. J. Clean. Prod. 2011, 19, 1198–1206. [Google Scholar] [CrossRef]
- Ministerio de Agricultura, Alimentación y Medio Ambiente. Factores de Emisión: Registro de Huella de Carbono, Compensación y Proyectos de Absorción de Dióxido de Carbono; Technical Report; Ministerio de Agricultura, Alimentación y Medio Ambiente: Madrid, Spain, 2015. [Google Scholar]
- Yeo, C.S.; Buyya, R.; Hossein, P.; Rasit, E.; Graham, P.; Sommers, F. Cluster Computing: High- Performance, High-Availability, and High-Throughput Processing on a Network of Computers. In Handbook of Nature-Inspired and Innovative Computing; Zomaya, A., Ed.; Springer US: New York, NY, USA, 2006; pp. 521–551. [Google Scholar]
- National Science Foundation. Advisory Committee for Cyberinfrastructure Task Force on Grand Challenges; Technical Report; National Science Foundation: Arlington, VA, USA, 2011.
- Cacheiro, J. Analysis of Batch Systems; Technical Report; CESGA: Santiago de Compostela, Galicia, Spain, 2014. [Google Scholar]
- IRPC Group. EECluster: A Software Tool to Efficiently Manage the Energy Consumption of HPC Clusters. Available online: http://pirweb.edv.uniovi.es/eecluster (accessed on 1 March 2016).
- SourceForge. EECluster download | SourceForge.net. Available online: http://sourceforge.net/projects/eecluster/ (accessed on 1 March 2016).
- Cocaña-Fernández, A.; Sánchez, L.; Ranilla, J. A software tool to efficiently manage the energy consumption of HPC clusters. In Proceedings of the 2015 IEEE International Conference on Fuzzy Systems (FUZZ-IEEE), Istanbul, Turkey, 2–5 August 2015; pp. 1–8.
- Ishibuchi, H.; Nakashima, T.; Nii, M. Classification and Modeling with Linguistic Information Granules: Advanced Approaches to Linguistic Data Mining (Advanced Information Processing); Springer-Verlag New York, Inc.: Secaucus, NJ, USA, 2004. [Google Scholar]
- Takagi, T.; Sugeno, M. Fuzzy identification of systems and its applications to modeling and control. IEEE Trans. Syst. Man Cybern. 1985, SMC-15, 116–132. [Google Scholar] [CrossRef]
- MOEA Framework, a Java library for multiobjective evolutionary algorithms. Available online: http://moeaframework.org/ (accessed on 1 March 2016).
- Deb, K.; Pratap, A.; Agarwal, S.; Meyarivan, T. A fast and elitist multiobjective genetic algorithm: NSGA-II. IEEE Trans. Evol. Comput. 2002, 6, 182–197. [Google Scholar] [CrossRef]
- University of Oviedo. Scientific Modelling Cluster. Available online: http://cms.uniovi.es (accessed on 1 March 2016).


| Scenario | Day of Week | Hour Range | Week of Year | λ Value |
|---|---|---|---|---|
| 1 | All | All | All | s |
| 2 | Monday–Friday | 8:00–20:00 | All | s |
| Saturday–Sunday | 8:00–20:00 | All | s | |
| Monday–Sunday | 20:00–8:00 | All | s | |
| 3 | Monday–Friday | 8:00–20:00 | s | |
| s | ||||
| s | ||||
| s | ||||
| s | ||||
| Monday–Sunday | 20:00–8:00 | All | s | |
| Monday–Friday | 8:00–20:00 | All | s | |
| 4 | Monday–Friday | 8:00–20:00 | s | |
| s | ||||
| s | ||||
| s | ||||
| s | ||||
| Monday–Sunday | 20:00–8:00 | All | s | |
| Monday–Friday | 8:00–20:00 | All | s |
| Scenario 1 Test Set | |||||
|---|---|---|---|---|---|
| QoS | Energy Saved (%) | Energy Saved (MWh) | Carbon Reduction (MtCO) | Reconfigurations | |
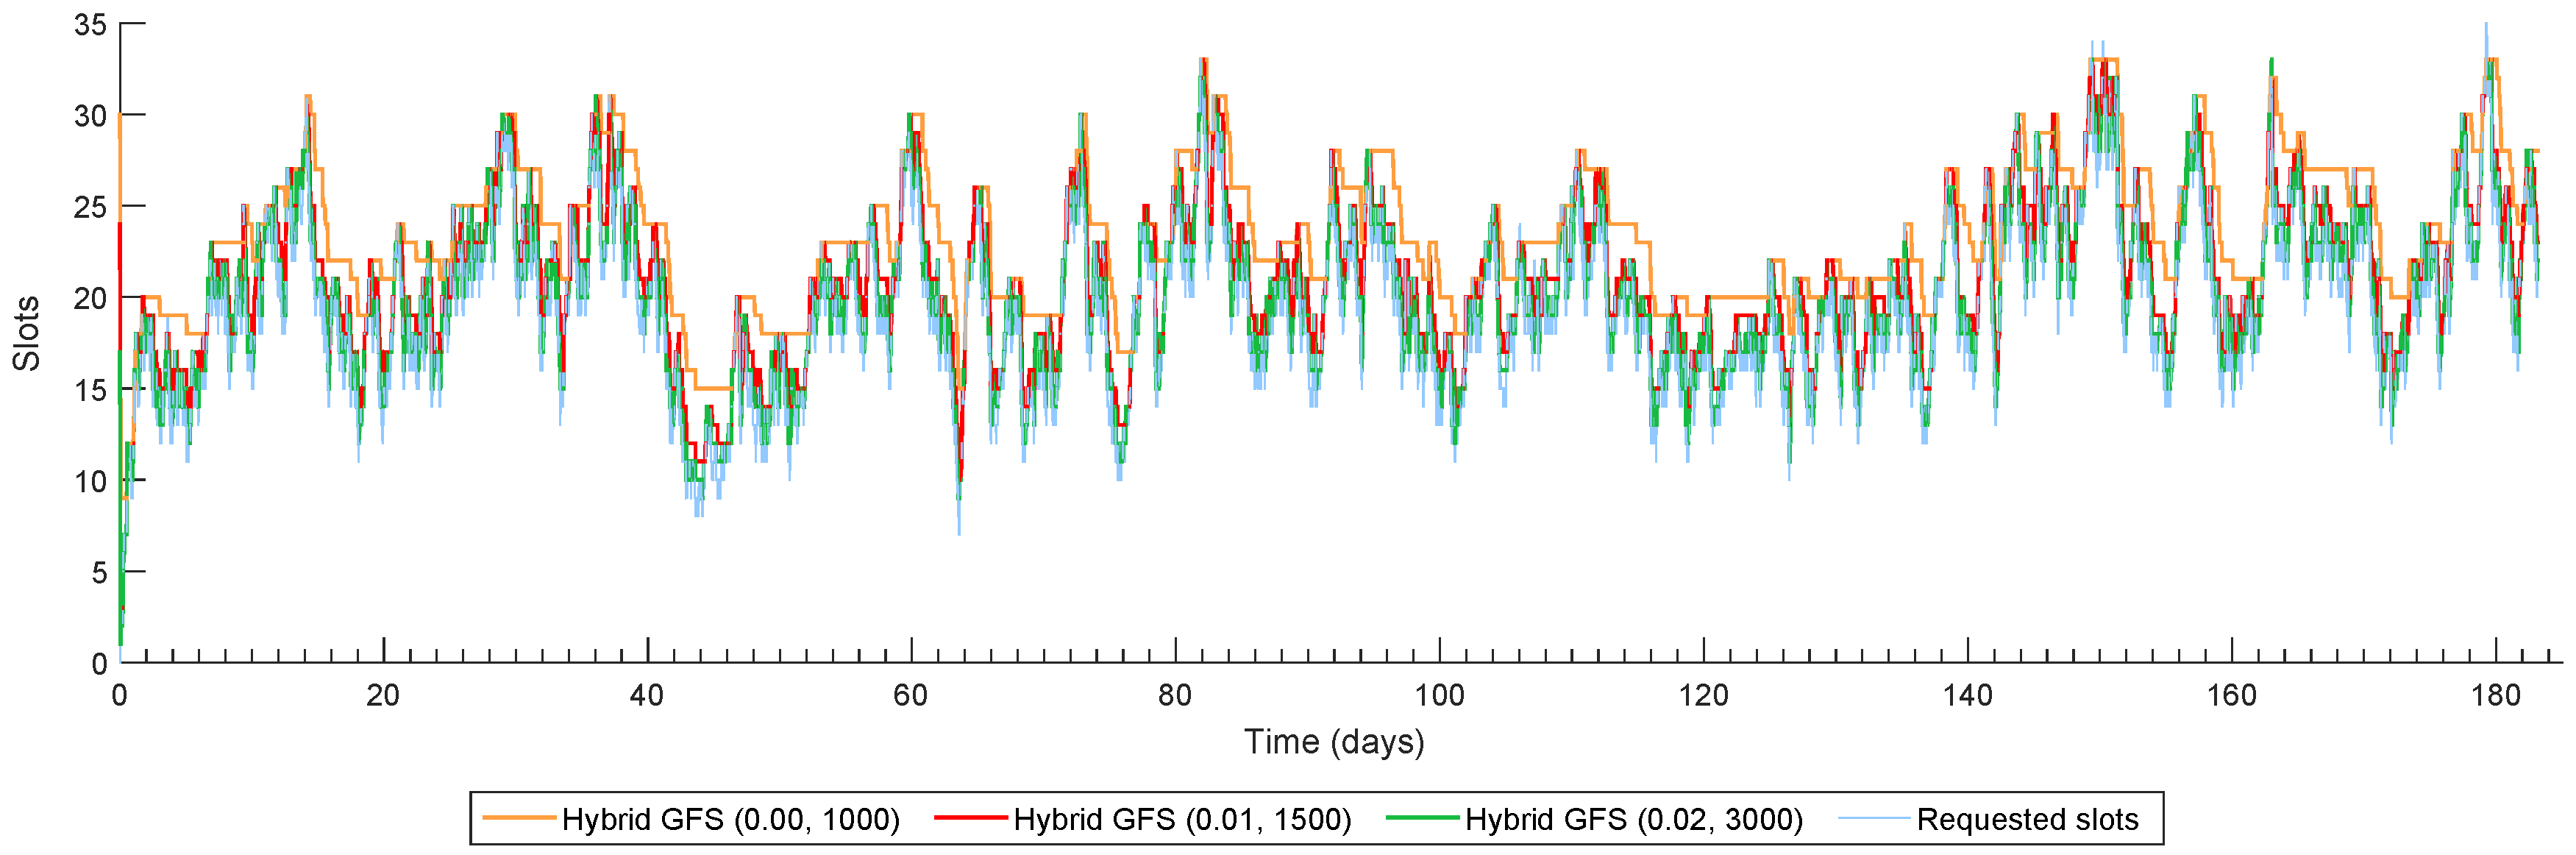
| Hybrid GFS (0.00, 1000) | 0.00 × 10 | 28.62% | 8.30 | 3.07 | 487 |
| Hybrid GFS (0.005, 1250) | 4.25 × 10 | 33.19% | 9.63 | 3.56 | 945 |
| Hybrid GFS (0.01, 1500) | 9.32 × 10 | 35.63% | 10.34 | 3.82 | 1412 |
| Hybrid GFS (0.015, 2000) | 1.35 × 10 | 37.16% | 10.78 | 3.99 | 1921 |
| Hybrid GFS (0.02, 3000) | 1.92 × 10 | 38.50% | 11.17 | 4.13 | 2835 |
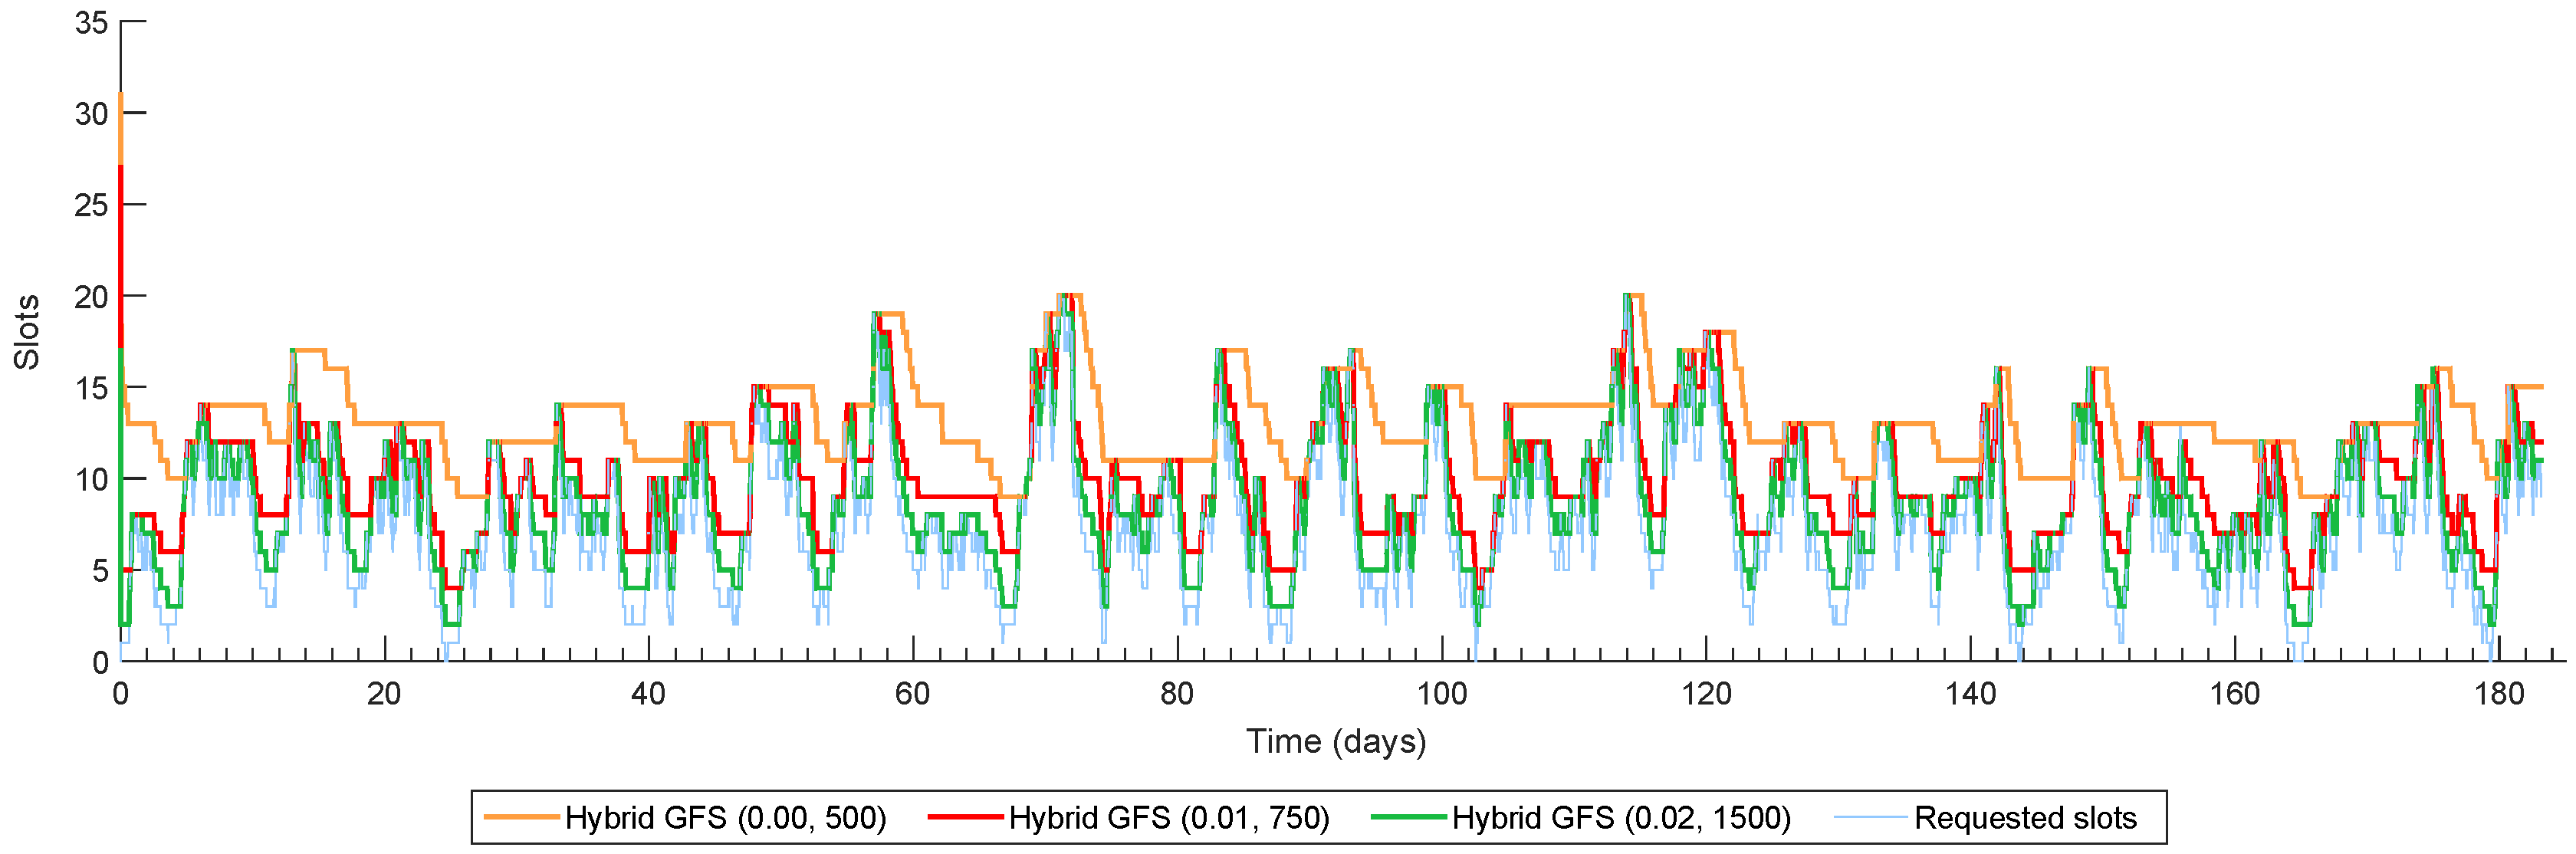
| Scenario 2 Test Set | |||||
|---|---|---|---|---|---|
| QoS | Energy Saved (%) | Energy Saved (MWh) | Carbon Reduction (MtCO) | Reconfigurations | |
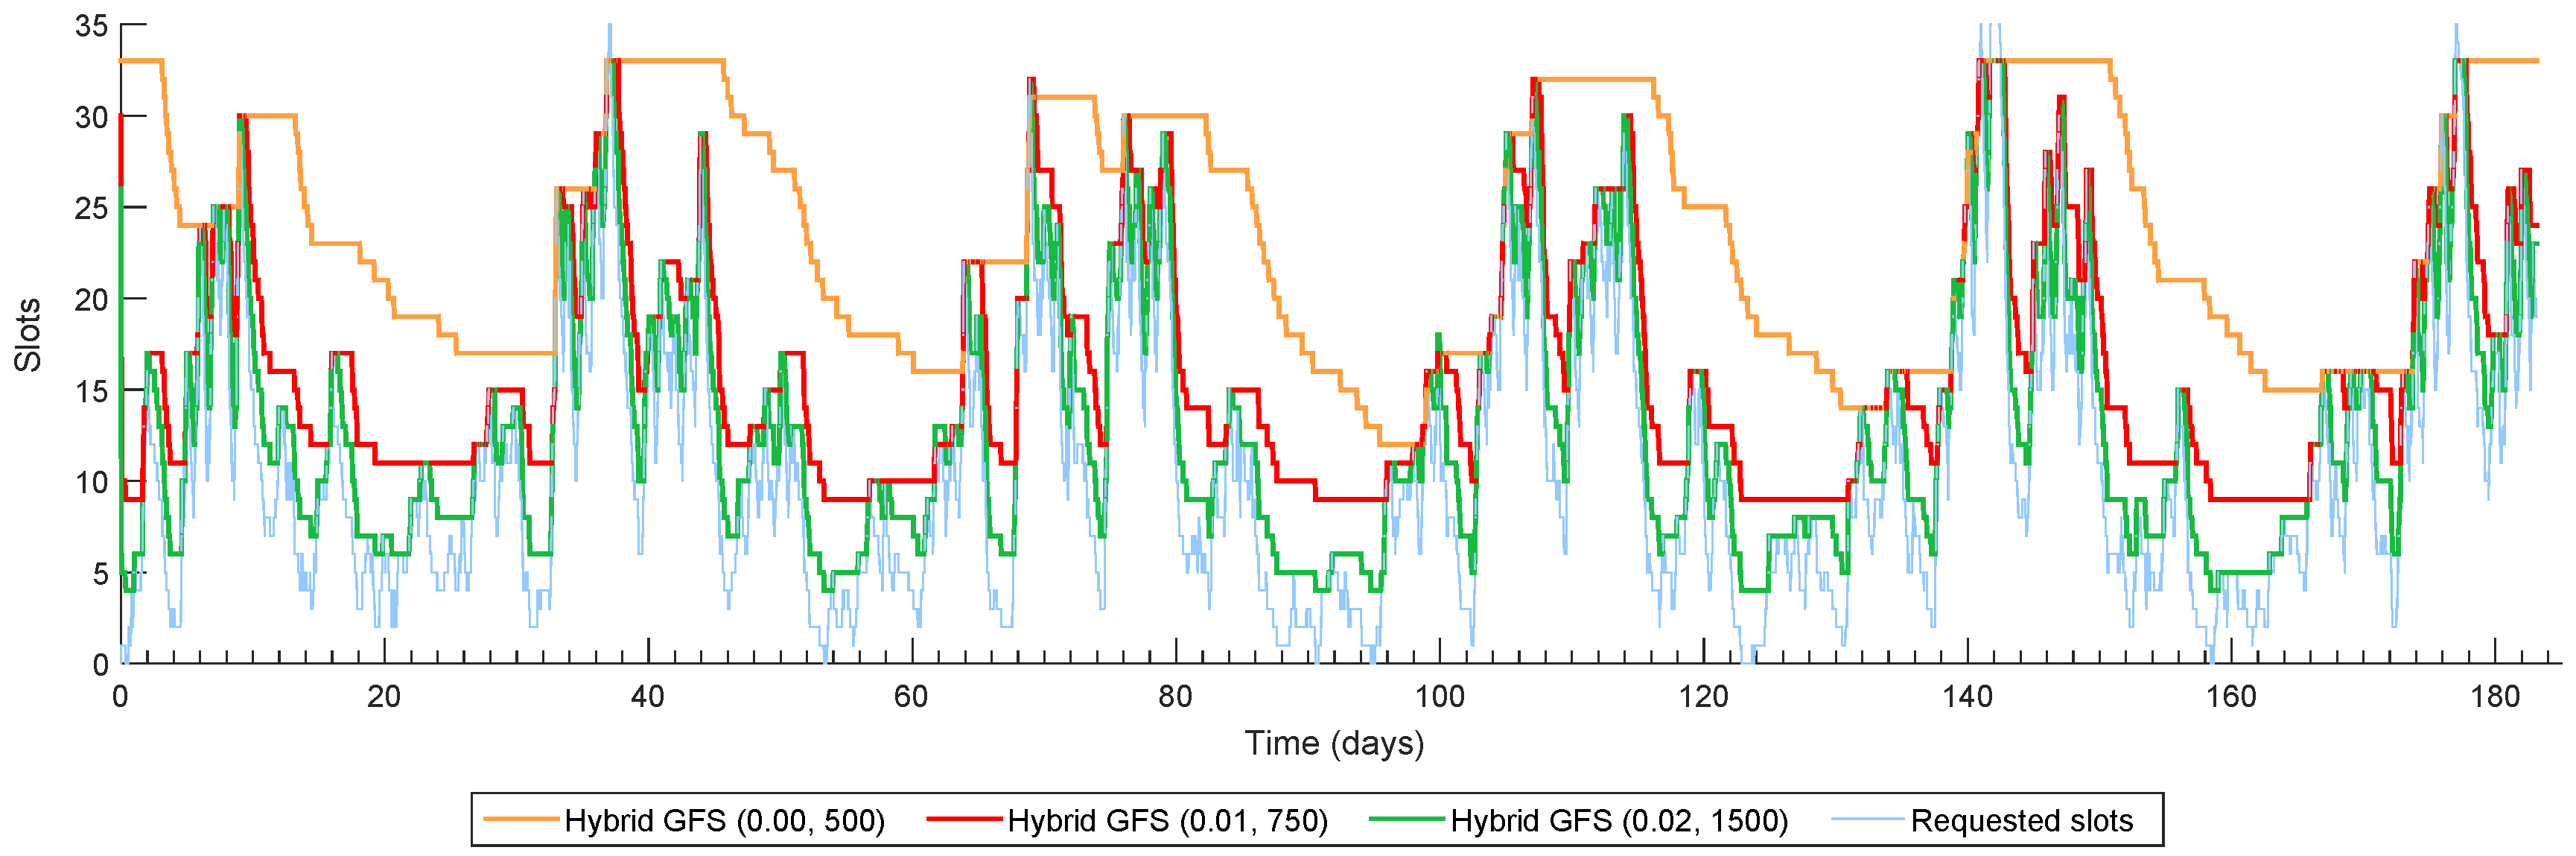
| Hybrid GFS (0.00, 500) | 0.00 × 10 | 60.07% | 17.43 | 6.45 | 218 |
| Hybrid GFS (0.005, 500) | 4.88 × 10 | 65.46% | 18.99 | 7.03 | 384 |
| Hybrid GFS (0.01, 750) | 9.45 × 10 | 69.50% | 20.17 | 7.46 | 635 |
| Hybrid GFS (0.015, 1000) | 1.43 × 10 | 71.61% | 20.78 | 7.69 | 838 |
| Hybrid GFS (0.02, 1500) | 1.84 × 10 | 73.44% | 21.31 | 7.88 | 1082 |
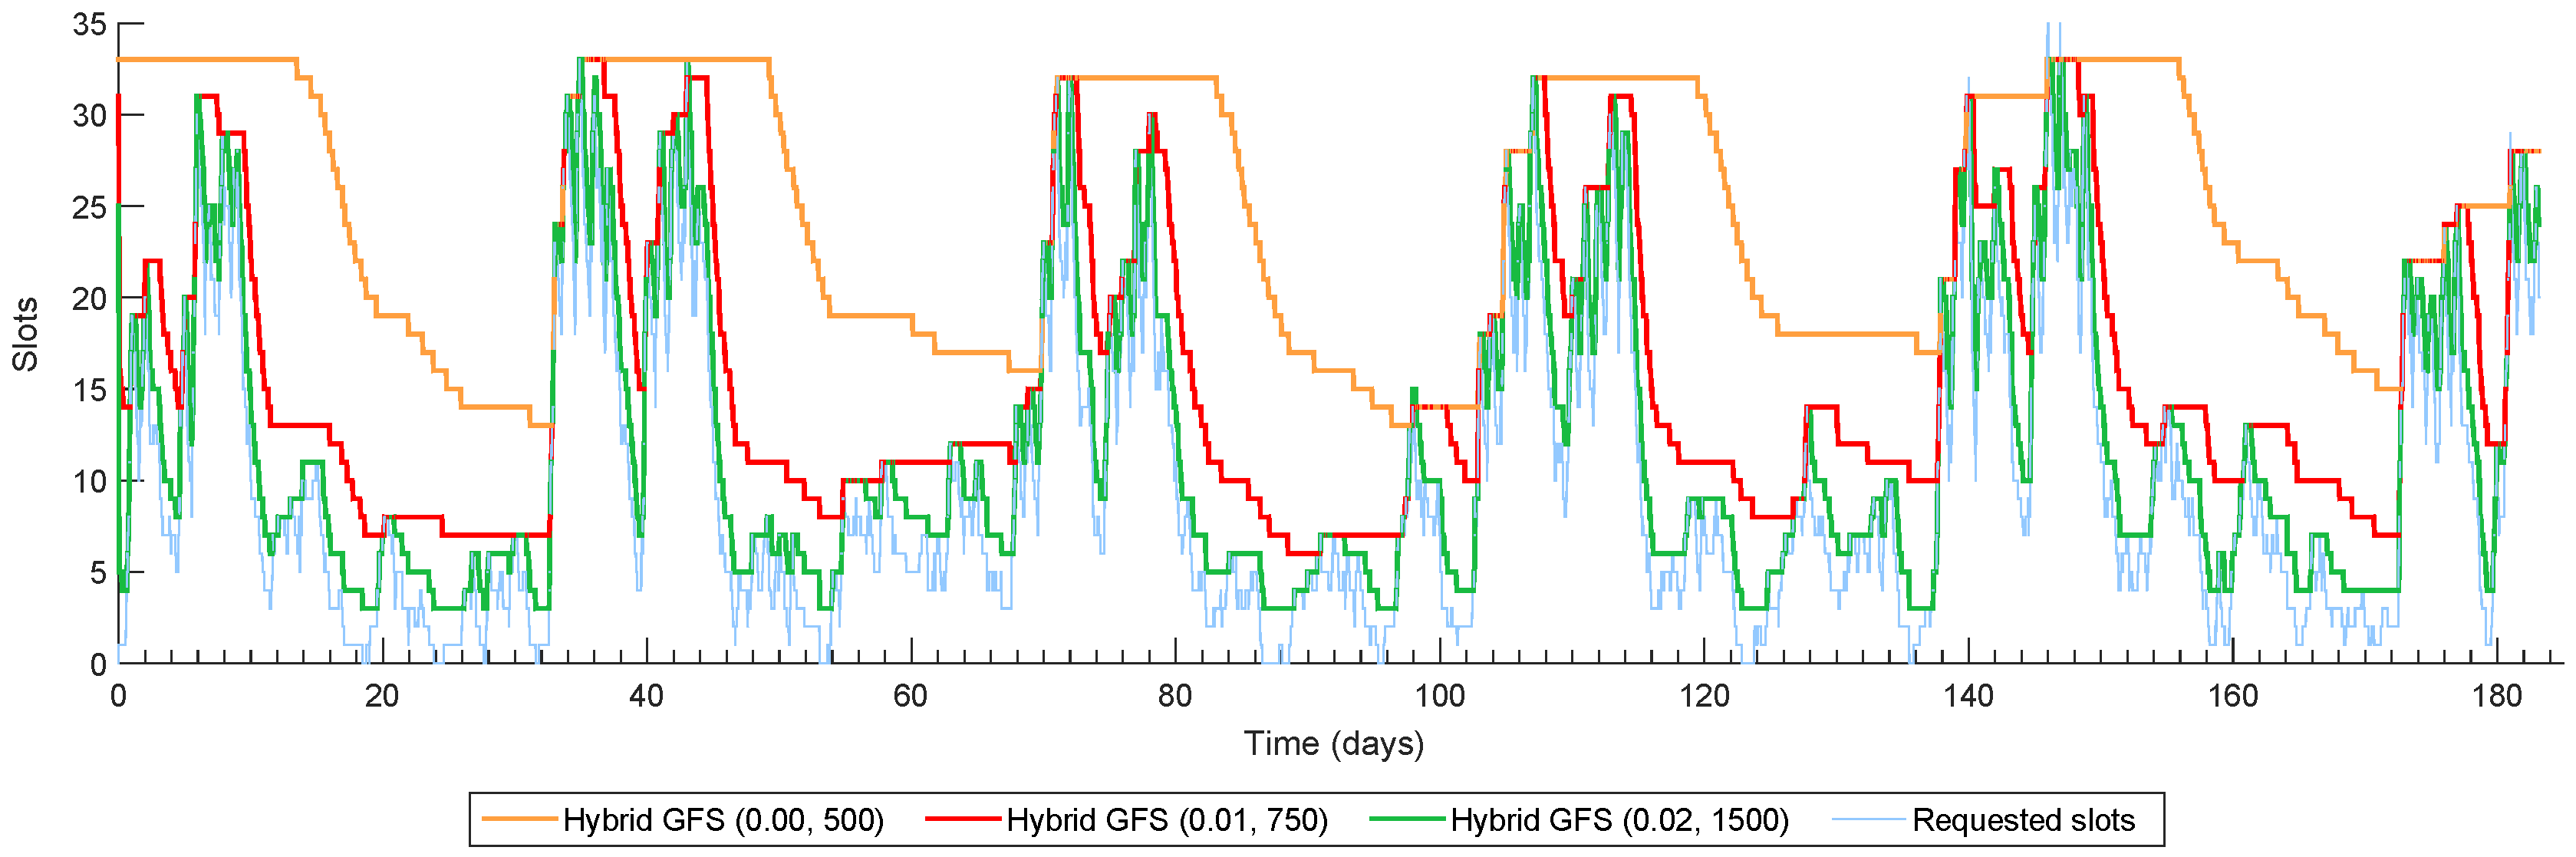
| Scenario 3 Test Set | |||||
|---|---|---|---|---|---|
| QoS | Energy Saved (%) | Energy Saved (MWh) | Carbon Reduction (MtCO) | Reconfigurations | |
| Hybrid GFS (0.00, 500) | 0.00 × 10 | 27.99% | 8.12 | 3.00 | 194 |
| Hybrid GFS (0.005, 500) | 2.19 × 10 | 41.53% | 12.05 | 4.46 | 342 |
| Hybrid GFS (0.01, 750) | 8.12 × 10 | 50.73% | 14.72 | 5.45 | 671 |
| Hybrid GFS (0.015, 1000) | 1.17 × 10 | 56.02% | 16.25 | 6.01 | 1006 |
| Hybrid GFS (0.02, 1500) | 1.69 × 10 | 59.44% | 17.25 | 6.38 | 1334 |
| Scenario 4 Test Set | |||||
|---|---|---|---|---|---|
| QoS | Energy Saved (%) | Energy Saved (MWh) | Carbon Reduction (MtCO) | Reconfigurations | |
| Hybrid GFS (0.00, 500) | 0.00 × 10 | 25.00% | 7.25 | 2.68 | 173 |
| Hybrid GFS (0.005, 500) | 2.48 × 10 | 46.09% | 13.37 | 4.95 | 367 |
| Hybrid GFS (0.01, 750) | 4.23 × 10 | 51.50% | 14.94 | 5.53 | 473 |
| Hybrid GFS (0.015, 1000) | 1.43 × 10 | 60.06% | 17.42 | 6.45 | 1010 |
| Hybrid GFS (0.02, 1500) | 1.92 × 10 | 63.51% | 18.43 | 6.82 | 1253 |
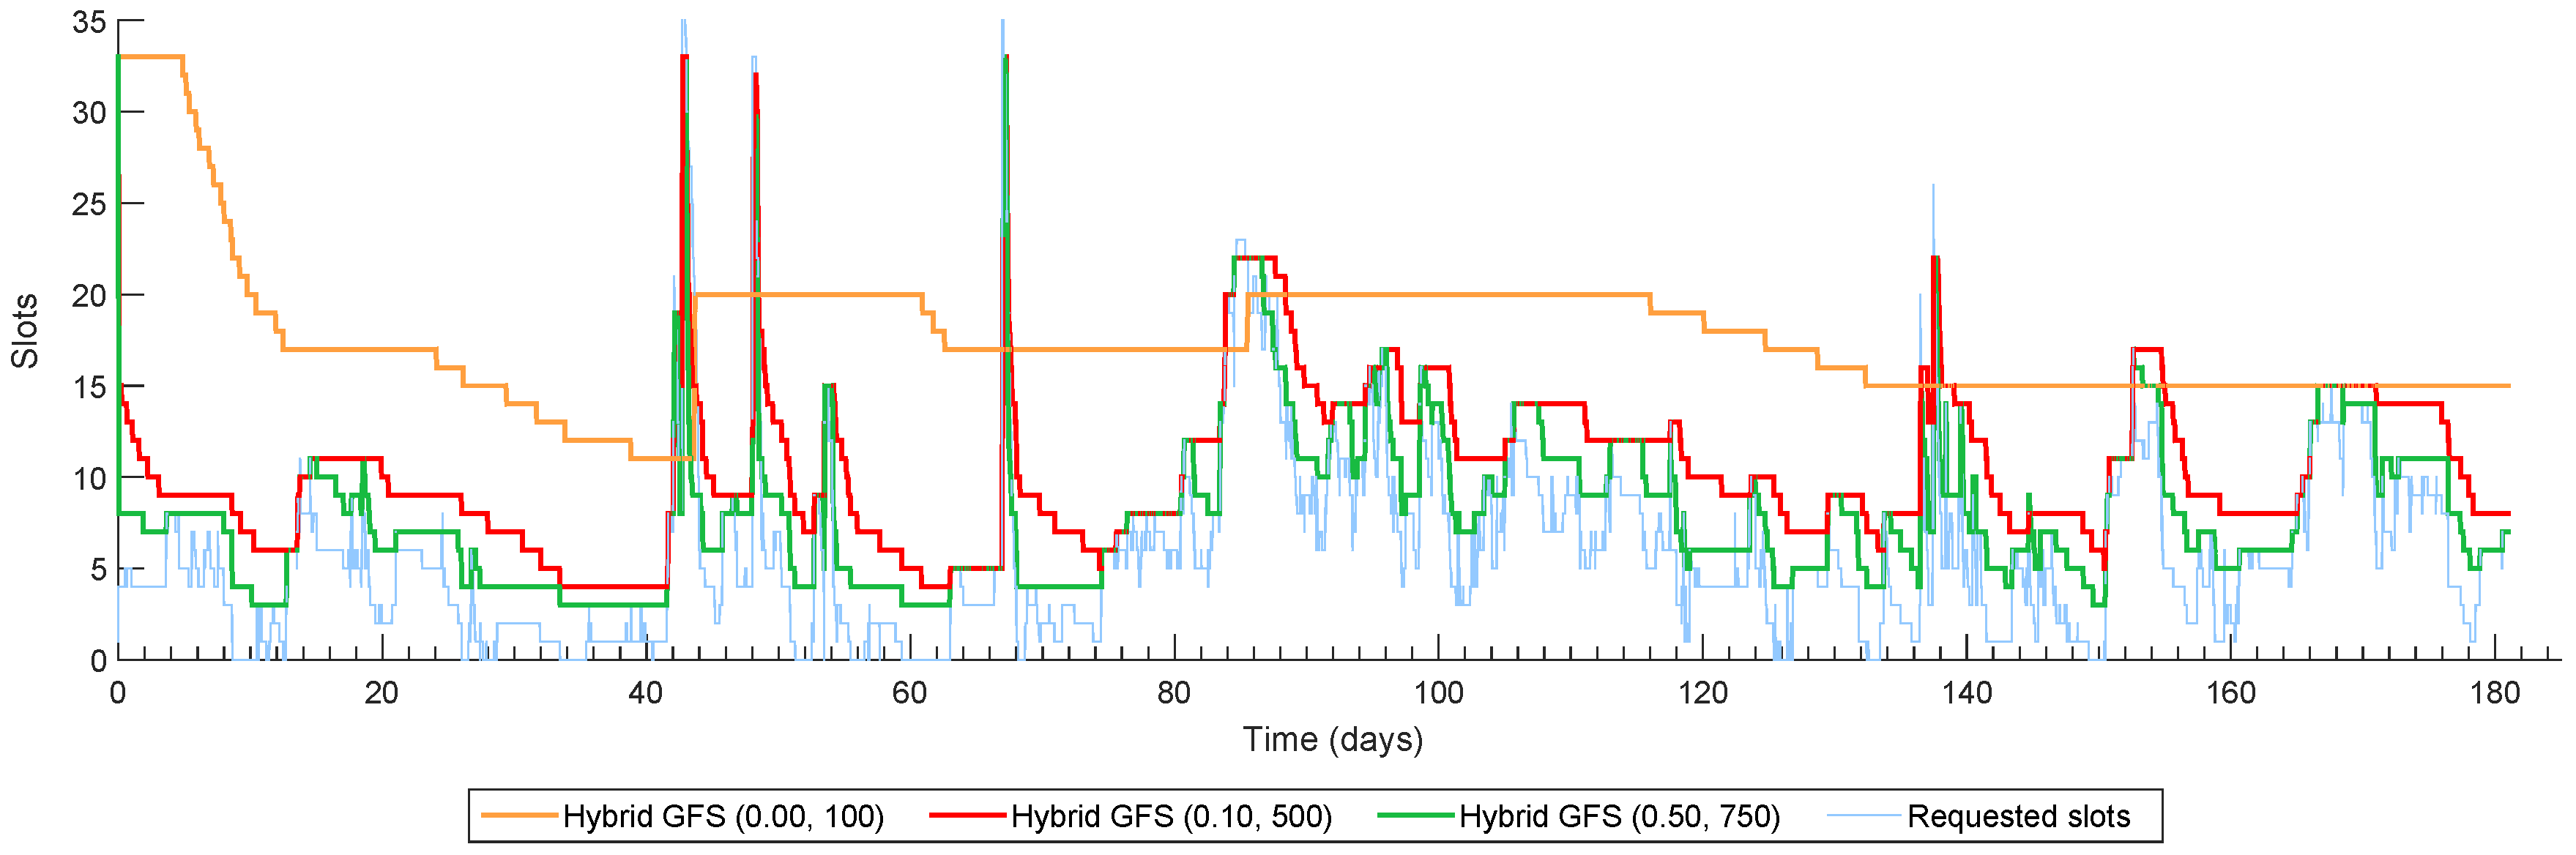
| CMS Cluster Test Set | |||||
|---|---|---|---|---|---|
| QoS | Energy Saved (%) | Energy Saved (MWh) | Carbon Reduction (MtCO) | Reconfigurations | |
| Hybrid GFS (0.00, 100) | 0.00 × 10 | 46.67% | 13.38 | 4.95 | 42 |
| Hybrid GFS (0.05, 500) | 4.46 × 10 | 64.26% | 18.42 | 6.82 | 293 |
| Hybrid GFS (0.10, 500) | 6.82 × 10 | 68.60% | 19.67 | 7.28 | 361 |
| Hybrid GFS (0.25, 750) | 1.49 × 10 | 70.34% | 20.17 | 7.46 | 363 |
| Hybrid GFS (0.50, 750) | 1.95 × 10 | 75.54% | 21.66 | 8.01 | 590 |
© 2016 by the authors; licensee MDPI, Basel, Switzerland. This article is an open access article distributed under the terms and conditions of the Creative Commons by Attribution (CC-BY) license (http://creativecommons.org/licenses/by/4.0/).
Share and Cite
Cocaña-Fernández, A.; Sánchez, L.; Ranilla, J. Improving the Eco-Efficiency of High Performance Computing Clusters Using EECluster. Energies 2016, 9, 197. https://doi.org/10.3390/en9030197
Cocaña-Fernández A, Sánchez L, Ranilla J. Improving the Eco-Efficiency of High Performance Computing Clusters Using EECluster. Energies. 2016; 9(3):197. https://doi.org/10.3390/en9030197
Chicago/Turabian StyleCocaña-Fernández, Alberto, Luciano Sánchez, and José Ranilla. 2016. "Improving the Eco-Efficiency of High Performance Computing Clusters Using EECluster" Energies 9, no. 3: 197. https://doi.org/10.3390/en9030197
APA StyleCocaña-Fernández, A., Sánchez, L., & Ranilla, J. (2016). Improving the Eco-Efficiency of High Performance Computing Clusters Using EECluster. Energies, 9(3), 197. https://doi.org/10.3390/en9030197