Article

Effect of the Coordinative Optimization of Interruptible Loads in Primary Frequency Regulation on Frequency Recovery

1
School of Electrical Engineering and Automation, Harbin Institute of Technology, Harbin 150001, China
2
State Grid Electric Power Research Institute, Nanjing 210003, China
3
School of Electrical Engineering, Southeast University, Nanjing 210096, China
*
Author to whom correspondence should be addressed.
Energies 2016, 9(3), 167; https://doi.org/10.3390/en9030167
Submission received: 23 December 2015 / Revised: 20 February 2016 / Accepted: 29 February 2016 / Published: 5 March 2016

Abstract

:
When faults and disturbances occur in power systems, backup power resources respond to maintain the system’s frequency, and the frequency recovery effect is related to the primary frequency regulation of the reserve capacity provided by and the response speeds of the system’s generating units and interruptible loads. The relationships between a system’s frequency and the frequency regulation capacity of the generating units and the interruptible loads are different. In this paper, an index for the frequency recovery effect is proposed based on the static frequency adjustment coefficient of the interruptible load and the adjustment coefficients of the generating units, and an optimization model of an interruptible load participating in primary frequency regulation is built with the objective of minimizing the cost of the primary frequency regulation reserve that uses the system’s frequency recovery effect as a constraint. The simulation results verify the validity of the model.

1. Introduction

In a power system, there is a great deal of uncertainty due to stochastic changes in the load, random unit outages and unpredictable faults in power lines [1,2]. When disturbances and faults occur, there could be fluctuations or drops in the frequency, and backup power resources that can respond instantly play a significant role in frequency maintenance and recovery. The main instantly responding backup power resources include spinning reserves for primary frequency regulation on the generation side and direct load control, which can respond within seconds. The use of interruptible loads in a primary frequency regulation reserve can reduce the investment in reserve capacity on the generation side [3,4], optimize the reserve’s capacity [5,6,7,8,9], guarantee an adequate amount of generation [10,11] and decrease the cost of operating the system [12,13].
Based on the time-scales of their responses, the stages of frequency recovery can be divided into primary, secondary and tertiary frequency regulation, the time-scales of which are seconds, minutes and hours, respectively, as shown in Figure 1. The traditional primary frequency regulation method is drop control, which is accomplished by governing the speed of the generators. Secondary frequency regulation is non-error regulation, which is accomplished using automatic generation control (AGC). Tertiary frequency regulation is the optimal distribution of the load curves provided by the dispatching department [14].
With the demand-side management (DSM), demand response (DR) resources are also able to participate in system frequency regulation; they make up approximately 30% of the frequency response resources in the British electricity market [15]. Previous papers [16,17] discuss strategies for allowing DR energy storage resources to participate in secondary frequency regulation. Previous papers [18,19,20] discuss control strategies for allowing DR resources to participate in peak load shifting and analyze their economic effects. However, the aforementioned studies are based on DR resources with response times of minutes or longer, and resources that can respond within seconds are not discussed. Load aggregators (LAs) [21], load agents [22,23], etc. can be used to realize real-time responses of DR resources and enable their participation in primary frequency regulation. The resources that can respond in real time mainly fall under direct load control (DLC).
The remainder of this paper is organized as follows. Section 2 discusses the costs of different sources of backup capacity. An index representing the effects of DLC and generating units on frequency recovery based on the static frequency adjustment coefficient of an interruptible load and the adjustment coefficients of generating units is proposed in Section 3. An optimization model that coordinates the participation of the interruptible load in primary frequency regulation and considers the frequency recovery effect is built in Section 4. Finally, the proposed methods are validated using simulations and the impacts of various factors are demonstrated in Section 5.

2. The Cost of Using Direct Load Control (DLC) for Primary Frequency Regulation

2.1. The Cost of DLC

The DLC project studied in this paper refers to those in which the power supply corporation or organization that operates the system is allowed to regulate or turn off users’ electrical appliances remotely when an emergency affects the power system or regional distribution network without advance notice, and users can receive rewards or discounted electricity prices. There are two approaches to compensating users for the use of DLC: discounted electricity prices and invocation compensation. The cost of direct load control is described by:
C DLC = t s m N DLL β m p 0 P m DLL + z N c q z n N DLH β n p 0 P n , z DLH
where CDLC denotes the cost of DLC and ts denotes the term of the DLC contract signed by the power supply corporation or organization that operates the system and the users. That is, for this duration, the power supply corporation or organization that operates the system can regulate or turn off users’ electrical appliances remotely according to the requirements of the power grid. P m DLL is the DLC capacity provided by the m-th user. NDLL is the set of users who receive lower electricity prices for participating in DLC. βm is the electricity price discount given to the m-th user, and usually, β m = μ m + d m P m DLL , where μm and dm are the electricity price discount coefficients. p 0 is the selling price of electricity. Nc is the set of active power shortage scenarios, and q z is the probability of active power shortage scenario z occurring. N DLH is the set of users who receive high compensation for participating in DLC, and βn is the invocation compensation of the n-th user; usually, β n = α n + c n P n DLH , where α n and c n are the invocation compensation coefficients. P n , z DLH is the capacity that the n-th user receiving high compensation for participating in DLC can provide during active power shortage scenario z. Each user participating in DLC can only choose one type of compensation; therefore, N DLL and N DLH are independent and do not intersect.

2.2. The Cost of a Primary Frequency Regulation Reserve

The cost of a primary frequency regulation reserve consists of two parts, namely, the capacity cost and the invocation cost; it is described by
C SR = α i P i t + z N c q z β P , i P i z
where C SR denotes the cost of the primary frequency regulation reserve on the generation side, α i P i t is the capacity cost of the spinning reserve on the generation side, and α i is the purchase bid for the spinning reserve capacity of the i-th unit. Usually, α i = η i + c i P i t , where η i and c i are the purchase bid coefficients. P i t is the purchased spinning reserve capacity of the i-th unit at time t. z N c q z β P , i P i z is the invocation cost of the spinning reserve on the generation side, β P , i is the invocation price of the spinning reserve capacity of the i-th unit, and P i z is the spinning reserve capacity provided by the i-th unit during active power shortage scenario z.

3. Impacts of the Primary Frequency Regulation Reserve Provided by DLC and Generating Units on Frequency Recovery

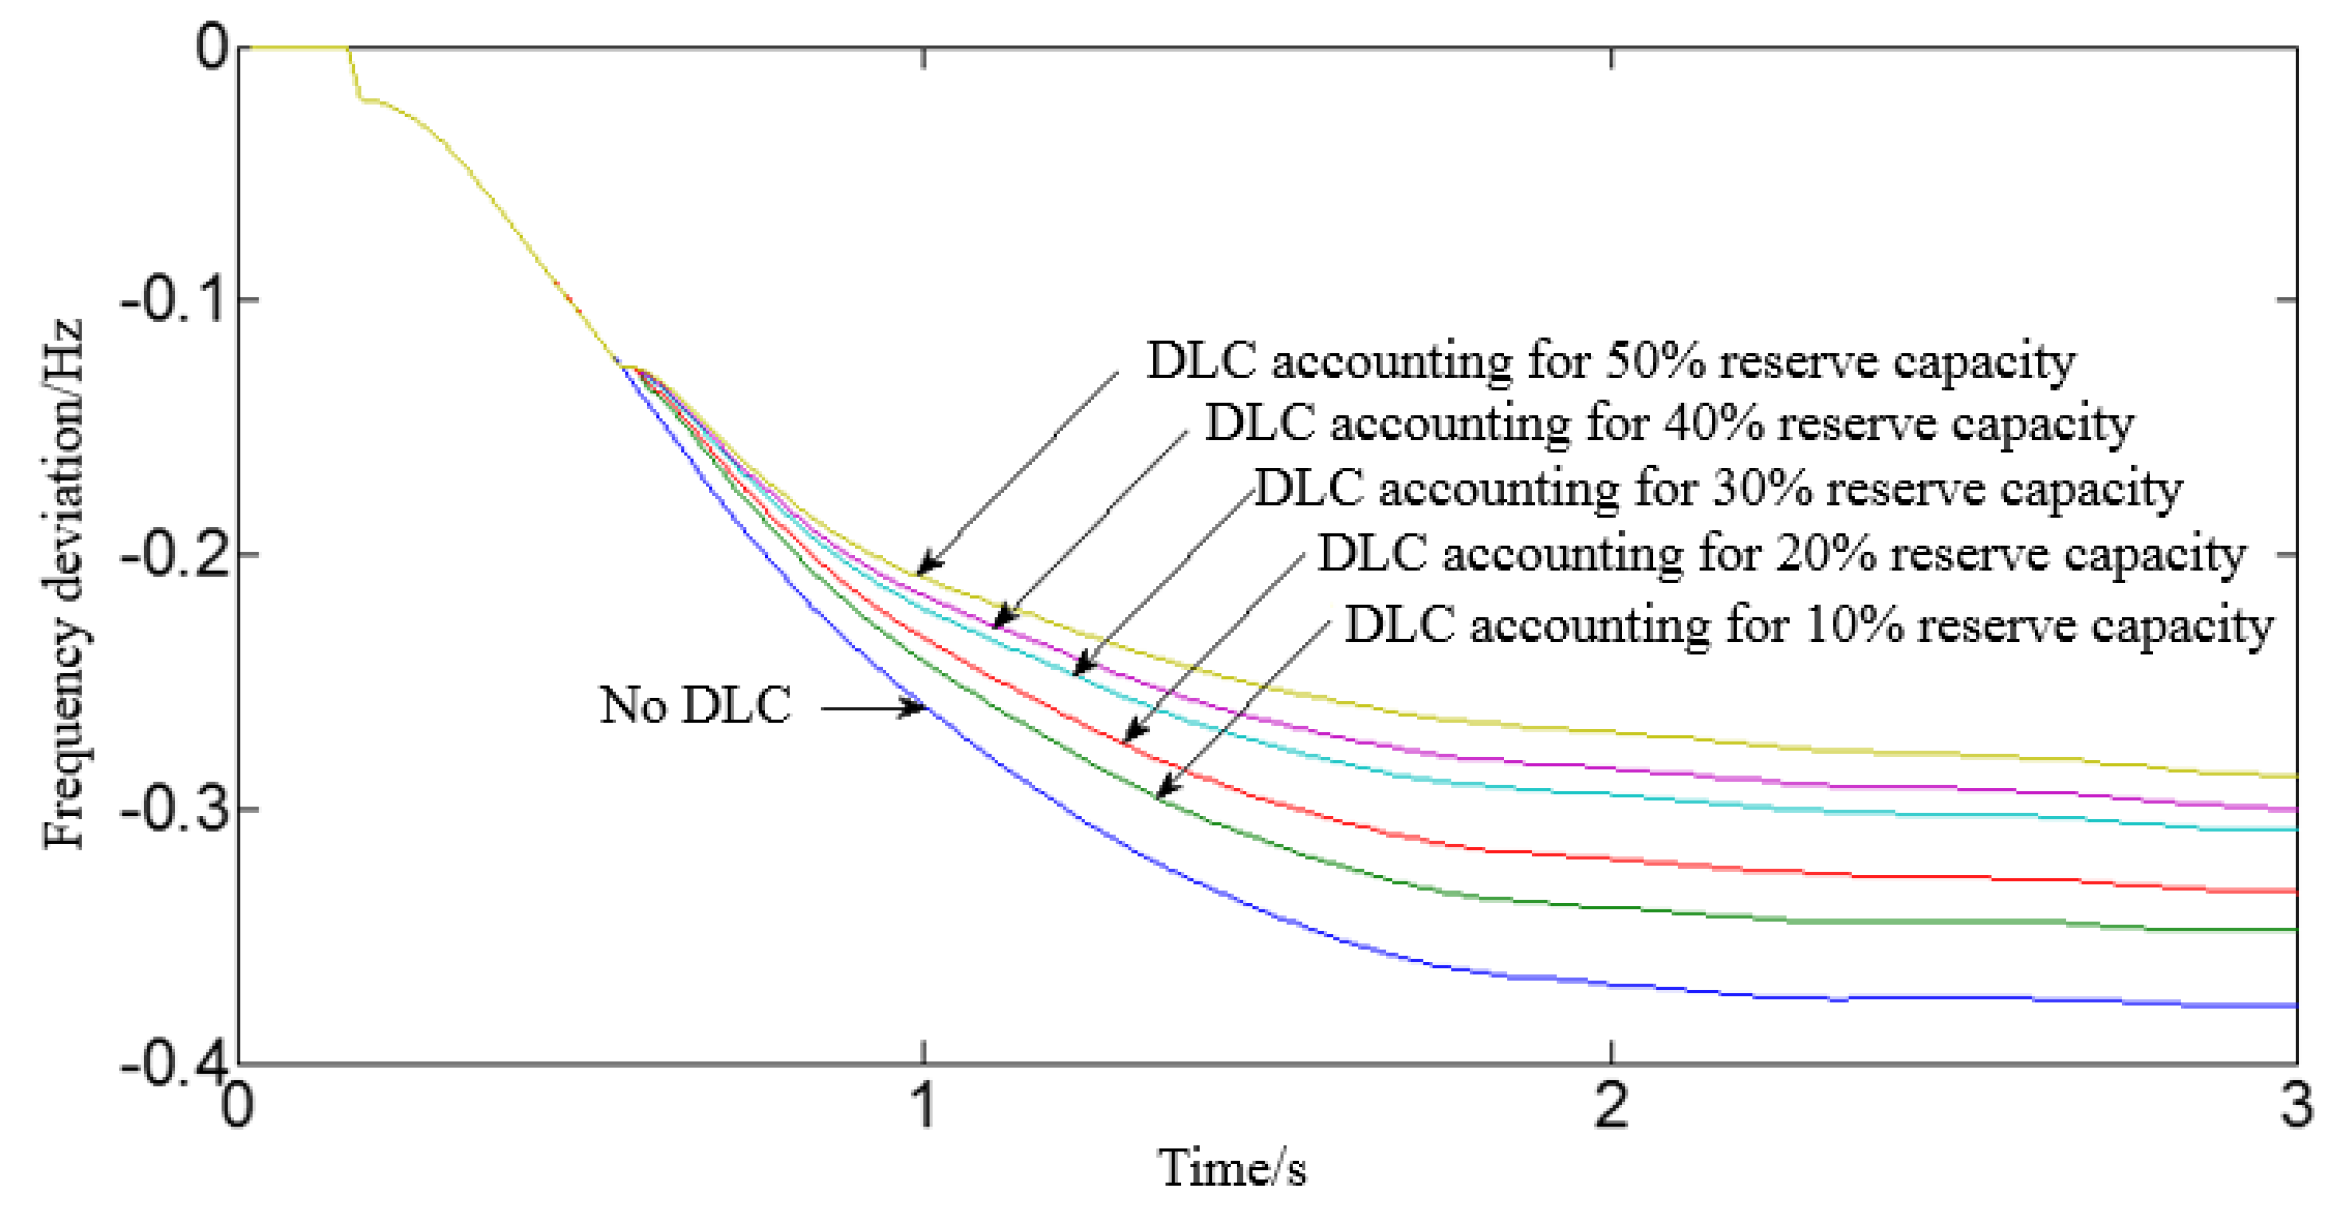
3.1. Impacts of DLC on Frequency Recovery

Regardless of fluctuations in the power system’s voltage, the relationship between the active power provided by DLC and the system’s frequency can be represented using the following Equation [24]:
P = P N [ a 0 + a 1 ( f f N ) + a 2 ( f f N ) 2 + + a n ( f f N ) n ]
where f N is the system’s rated frequency, f is the actual frequency of system, P N is the rated power, and a i (i = 0, 1, 2, …, n) is the portion of the active power proportional to i-th power of the system’s rated frequency. Usually, only a small amount of active DLC power is proportional to the fourth or a higher power of the rated frequency; therefore, it is negligible. Using per-unit value normalization, the following equation is derived:
P DLC * = F ( f * ) = a 0 + a 1 f * + a 2 f * 2 + a 3 f * 3
Taking the derivative of the above equation results in
K DLC = d P DLC * d f * = a 1 + 2 a 2 f * + 3 a 3 f * 2
where K DLC is the static interruptible load frequency adjustment coefficient used in DLC; its value is related to the composition and frequency of the DLC method used. Because it is assumed that the active power shortage scenarios discussed in this paper do not require emergent load shedding and that the frequency fluctuates within ±0.5 Hz [25] and, therefore, has little impact on K DLC , K DLC is assumed to be constant. When system’s frequency drops due to a fault or a disturbance, DLC, when invoked with a smaller value of K DLC , has a better effect on the frequency recovery, and the final system frequency recovered is higher [26]. According to this analysis, the impact of DLC on frequency recovery during an active power shortage scenario can be represented as follows:
R DLC = z N c q z ( m N DLL P m , z DLL / K m DLL + n N DLH P n , z DLH / K n DLH )
where R DLC reflects the impact of DLC on frequency recovery, K m DLL is the adjustment coefficient of the active power of the m-th user enrolled in low-price DLC, K n DLH is the adjustment coefficient of the active power of the n-th user enrolled in high-compensation DLC, and P m , z DLL and P n , z DLH refer to the response capacity of the m-th and n-th user, respectively, when low-price DLC or high-compensation DLC are invoked during fault scenario z. It can be concluded that during a fault or disturbance, frequency recovery works better if a DLC allocation scheme with a larger value of R DLC is deployed.

3.2. Impacts of the Generating Units on Frequency Recovery

As for the generating units, a fluctuation in the frequency can result in a fluctuation in the active power output; the relationship between the two is described by:
K gen = d f * d P gen *
where K gen is the adjustment coefficient of the generating unit, f * is the nominal value of the system’s frequency, and P gen * is the nominal amount of active power provided by the generating unit. The smaller Kgen is, the larger the impact the generating unit has on the system’s frequency recovery is. When there is a fault, increasing the active power output of such generating units can improve the results of system frequency recovery. Therefore, the effect of the generating units on frequency recovery in an active power shortage scenario can be described as follows:
R gen = z N c q z P i z / K gen , i
where R gen represents the impact of the generating units on frequency recovery, K gen , i is the adjustment coefficient of the i-th unit, and P i z is the reserve capacity for frequency regulation in active power shortage scenario z.

4. Optimization Model

Most traditional optimization models of backup resources use the cost as the objective function and the generating unit capacity and the minimal backup capacity as constraints to achieve an optimal or more economical scheme for purchasing backup capacity, and the resulting frequency recovery is rarely considered. The impacts of DLC and generation-side spinning reserves on frequency recovery can illustrate their impacts. If those factors have greater impacts on frequency recovery for the same active power shortage, then, the frequency drop is smaller and the frequency recovery is more effective. Considering the economy of the system, the total cost of purchasing and invoking DLC and a generation-side spinning reserve is described by:
C = t s α i P i t + t s α m p 0 P m DLL + z N c q z t z [ β P , i P i z + β n p 0 P n , z DLH ]
where C is the cost of purchasing and invoking DLC and a generation-side spinning reserve, ts is the period studied, which, in this paper, is set to 24 h, and t z is the duration of fault z.
After incorporating the effect of recovering the system’s frequency and combining Equations (6) and (8), Equation (10) is proposed as a frequency recovery constraint for the optimization model:
z N c q z ( m N DLL P m , z DLL / K m DLL + n N DLH P n , z DLH / K n DLH + P i z / K gen , i ) K
where the symbols have the same meanings as they do in the previous equations. The left side of the inequality is the sum of the factors modelling the impacts of DLC and a generation-side spinning reserve on frequency recovery; larger values of these denote better frequency recovery after a fault or disturbance. On the right side of the inequality, K represents the required effect of recovery, which ranges from one to three times the expectation of an active power shortage. This range is based on consideration of the system’s economy and reliability as well as experiential methods [27]. To guarantee the universality of the impacts of DLC and generation-side spinning reserves, in this paper, the reciprocals of the static interruptible load frequency coefficient used in DLC and the adjustment coefficients of the generators are normalized to range from one to three.
The other constraints are as follows:
Constraint on the active power shortage:
P m , z DLL + P n , z DLH + P i z = P z
where P z is the active power shortage in scenario z.
Constraint on the spinning reserve capacity:
0 P i t P i , max
where P i , max is the maximum spinning reserve capacity that the i-th unit can provide.
Constraint on the spinning reserve capacity that can be invoked:
0 P i z P i t
Constraint on the responding capacity of low-price DLC:
0 P m DLL P m , max DLL
where P m , max ILL is the maximum responding capacity that the m-th user of low-price DLC can provide.
Constraints on the invoked capacity of DLC:
{ P m DLL = P m , z DLL 0 P n DLH P n , max DLH
where P n , max DLH is the maximum responding capacity that the n-th user of high-compensation DLC can provide.
Constraint on the proportion of backup capacity provided by DLC:
P m DLL + P n , z DLH P m DLL + P n , z DLH + P i z a
where a is the maximum proportion of the primary frequency regulation reserve capacity that DLC accounts for, which is determined by the rules governing the operation of the different power grids.
An optimization model that aims to increase the performance-price ratio is established by Equation (9), which serves as an objective function, and by Equations (10)–(16), which serve as constraints. This is a mixed-integer nonlinear programming problem that is solved using CPLEX 12.6.

5. Case Study

5.1. Parameters of the Case Study

The case study adopts data collected from the power grid in the Panzhihua district, Sichuan, China, where the installed capacity of generating units is 980 MW, the tie-line received active power is 500 MW, and the total load is 1060 MW. It is assumed that a, which denotes the ratio of the DLC responding capacity to the total primary frequency regulation reserve capacity, is up to 0.5. Generating units 1–3 are, respectively, Units 4, 6 and 7 at Hemenkou, and users participating in DLC #1–6 are in the Tongzilin, Qinglong, Tuanshan, Madianhe, Yinjiang and Hemenkou districts, respectively. The normal price of electricity is $61.9/MWh, and the studied period is 24 h long. The upper and lower limits, purchase bid, and active power adjustment coefficients of the spinning reserve on the generation side are given in Table 1, and those of low-price DLC and high-compensation DLC are given in Table 2 and Table 3, respectively. The purchase bid for the spinning reserve is c i P i t . The fault scenarios are shown in Table 4.

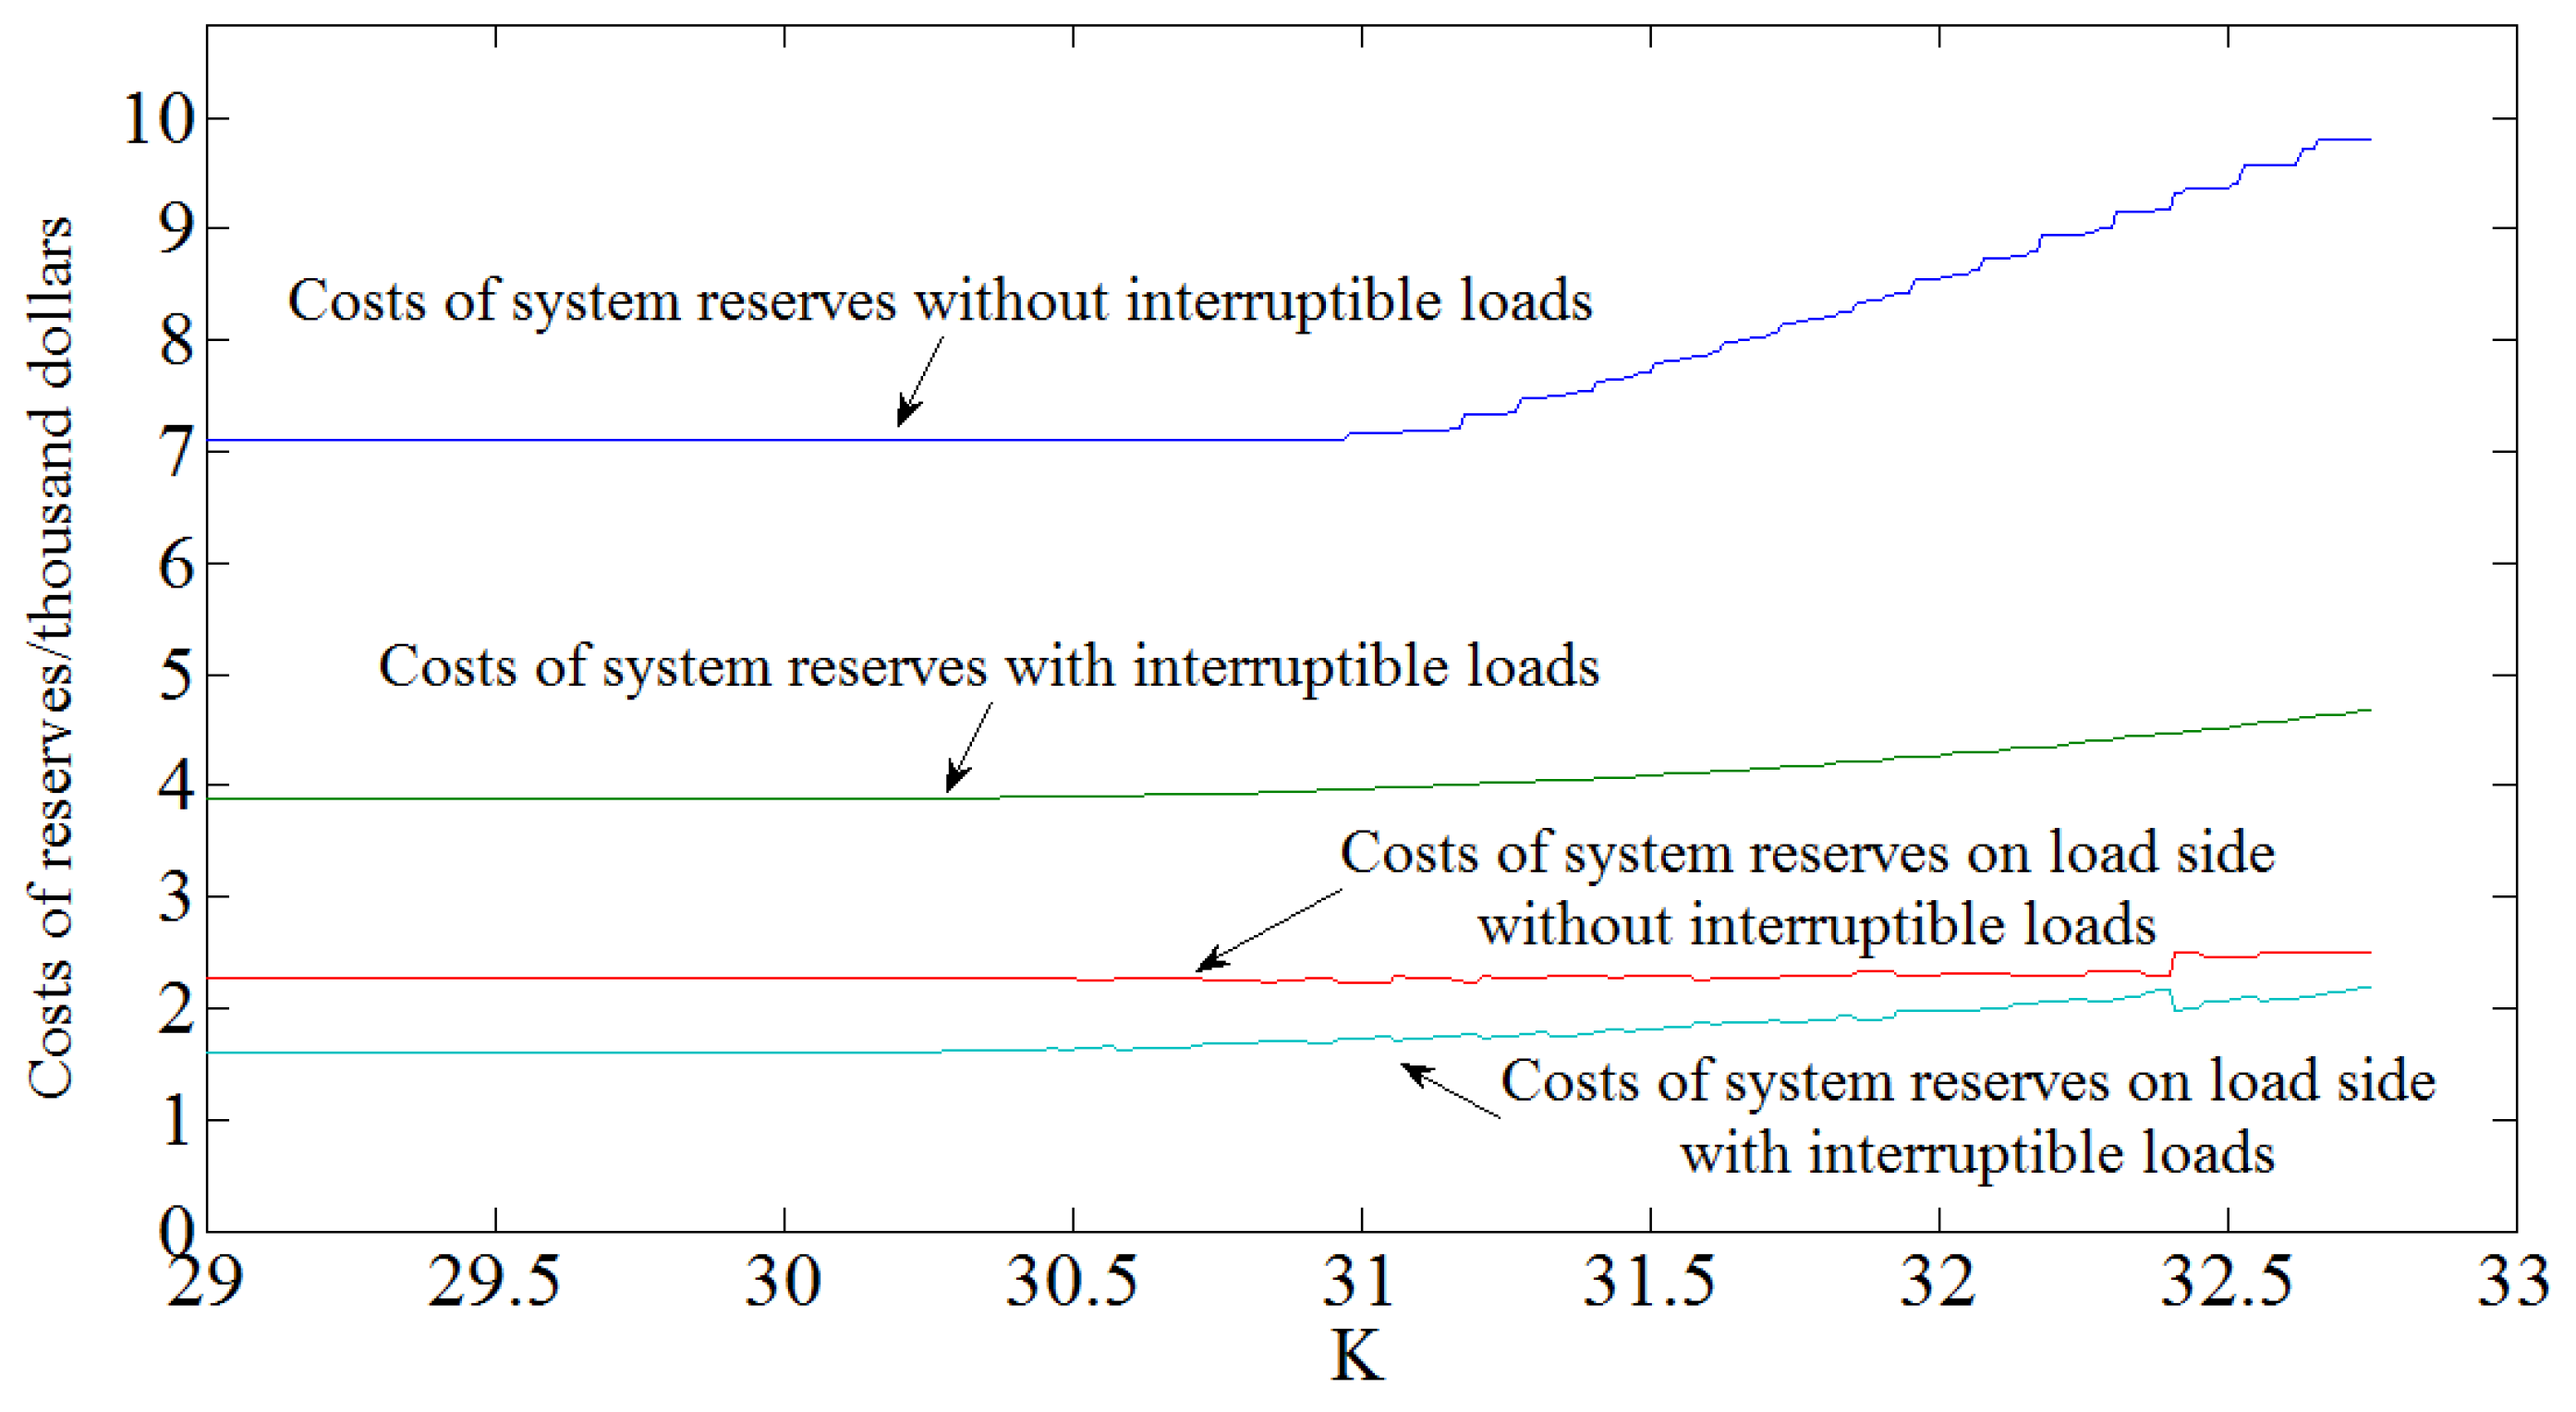
5.2. Comparison of Economy under Circumstances with and without DLC

Figure 2 depicts the cost of the system’s reserve as a function of K with and without DLC, and it can be seen that using interruptible loads as part of primary frequency regulation lowers the cost. In Equations (1) and (2), note that the purchasing bid functions for DLC and the generating units are linear, which means the price increases with the purchased and invoked capacity. Without DLC, the primary frequency regulation reserve is provided only by the generating units, which results in a high unit price for primary frequency regulation reserves. With DLC, part of the primary frequency regulation reserve is provided by DLC, and its marginal cost is reduced, which decreases the cost of the primary frequency regulation reserve for the entire system.

5.3. Comparison of Frequency Recovery Effects under Circumstances with and without DLC

Figure 3 shows the frequency recovery for different proportions of interruptible loads in primary frequency regulation. A fault occurs at the 10th cycle, and the active power shortage is 100 MW. DLC begins in the 25th cycle and participates in primary frequency regulation. Figure 3 shows that the higher the proportion under DLC is, the slower the frequency decreases and the higher the stabilized frequency is. That is because the response speeds of DLC and traditional spinning reserves are significantly different. DLC responds as soon as an order is received, but the responses of traditional spinning reserves are governed by the speed at which the generators respond to changes in the system’s frequency, which is slower than the response rate of DLC, and therefore, the frequency recovers more slowly than it does when DLC is used.

5.4. Impacts of Different Factors on the Optimization Results

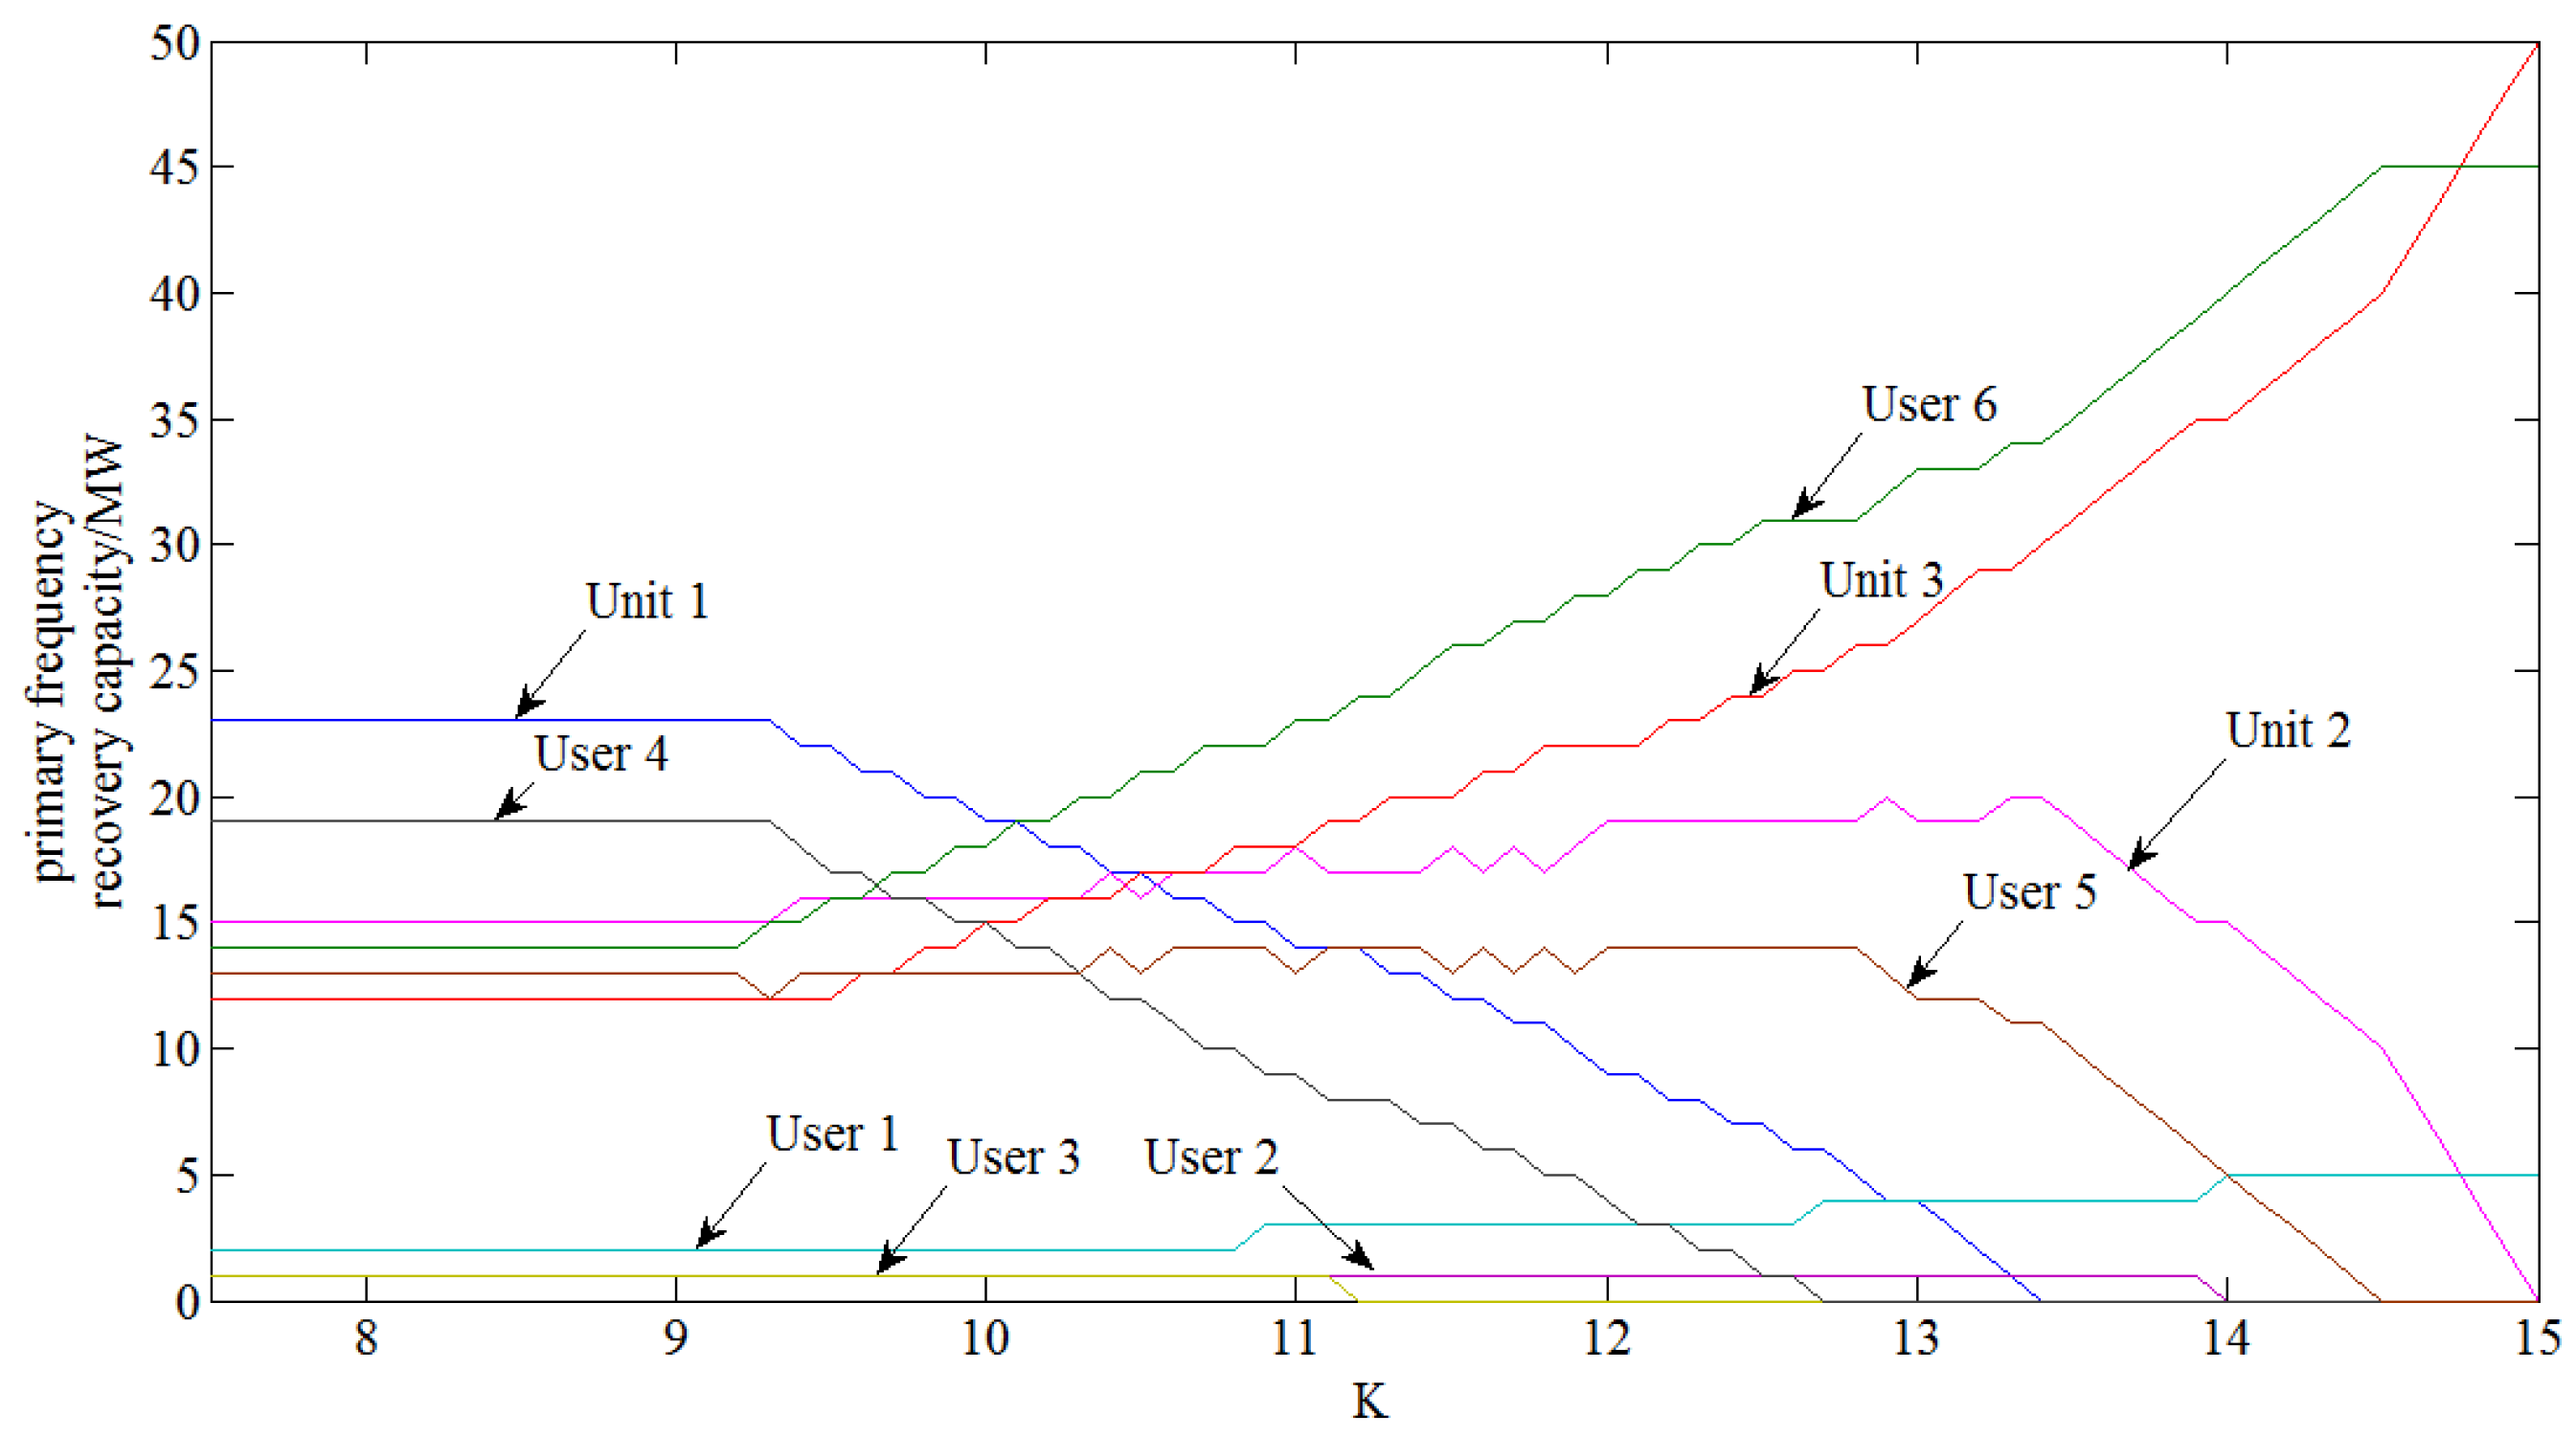
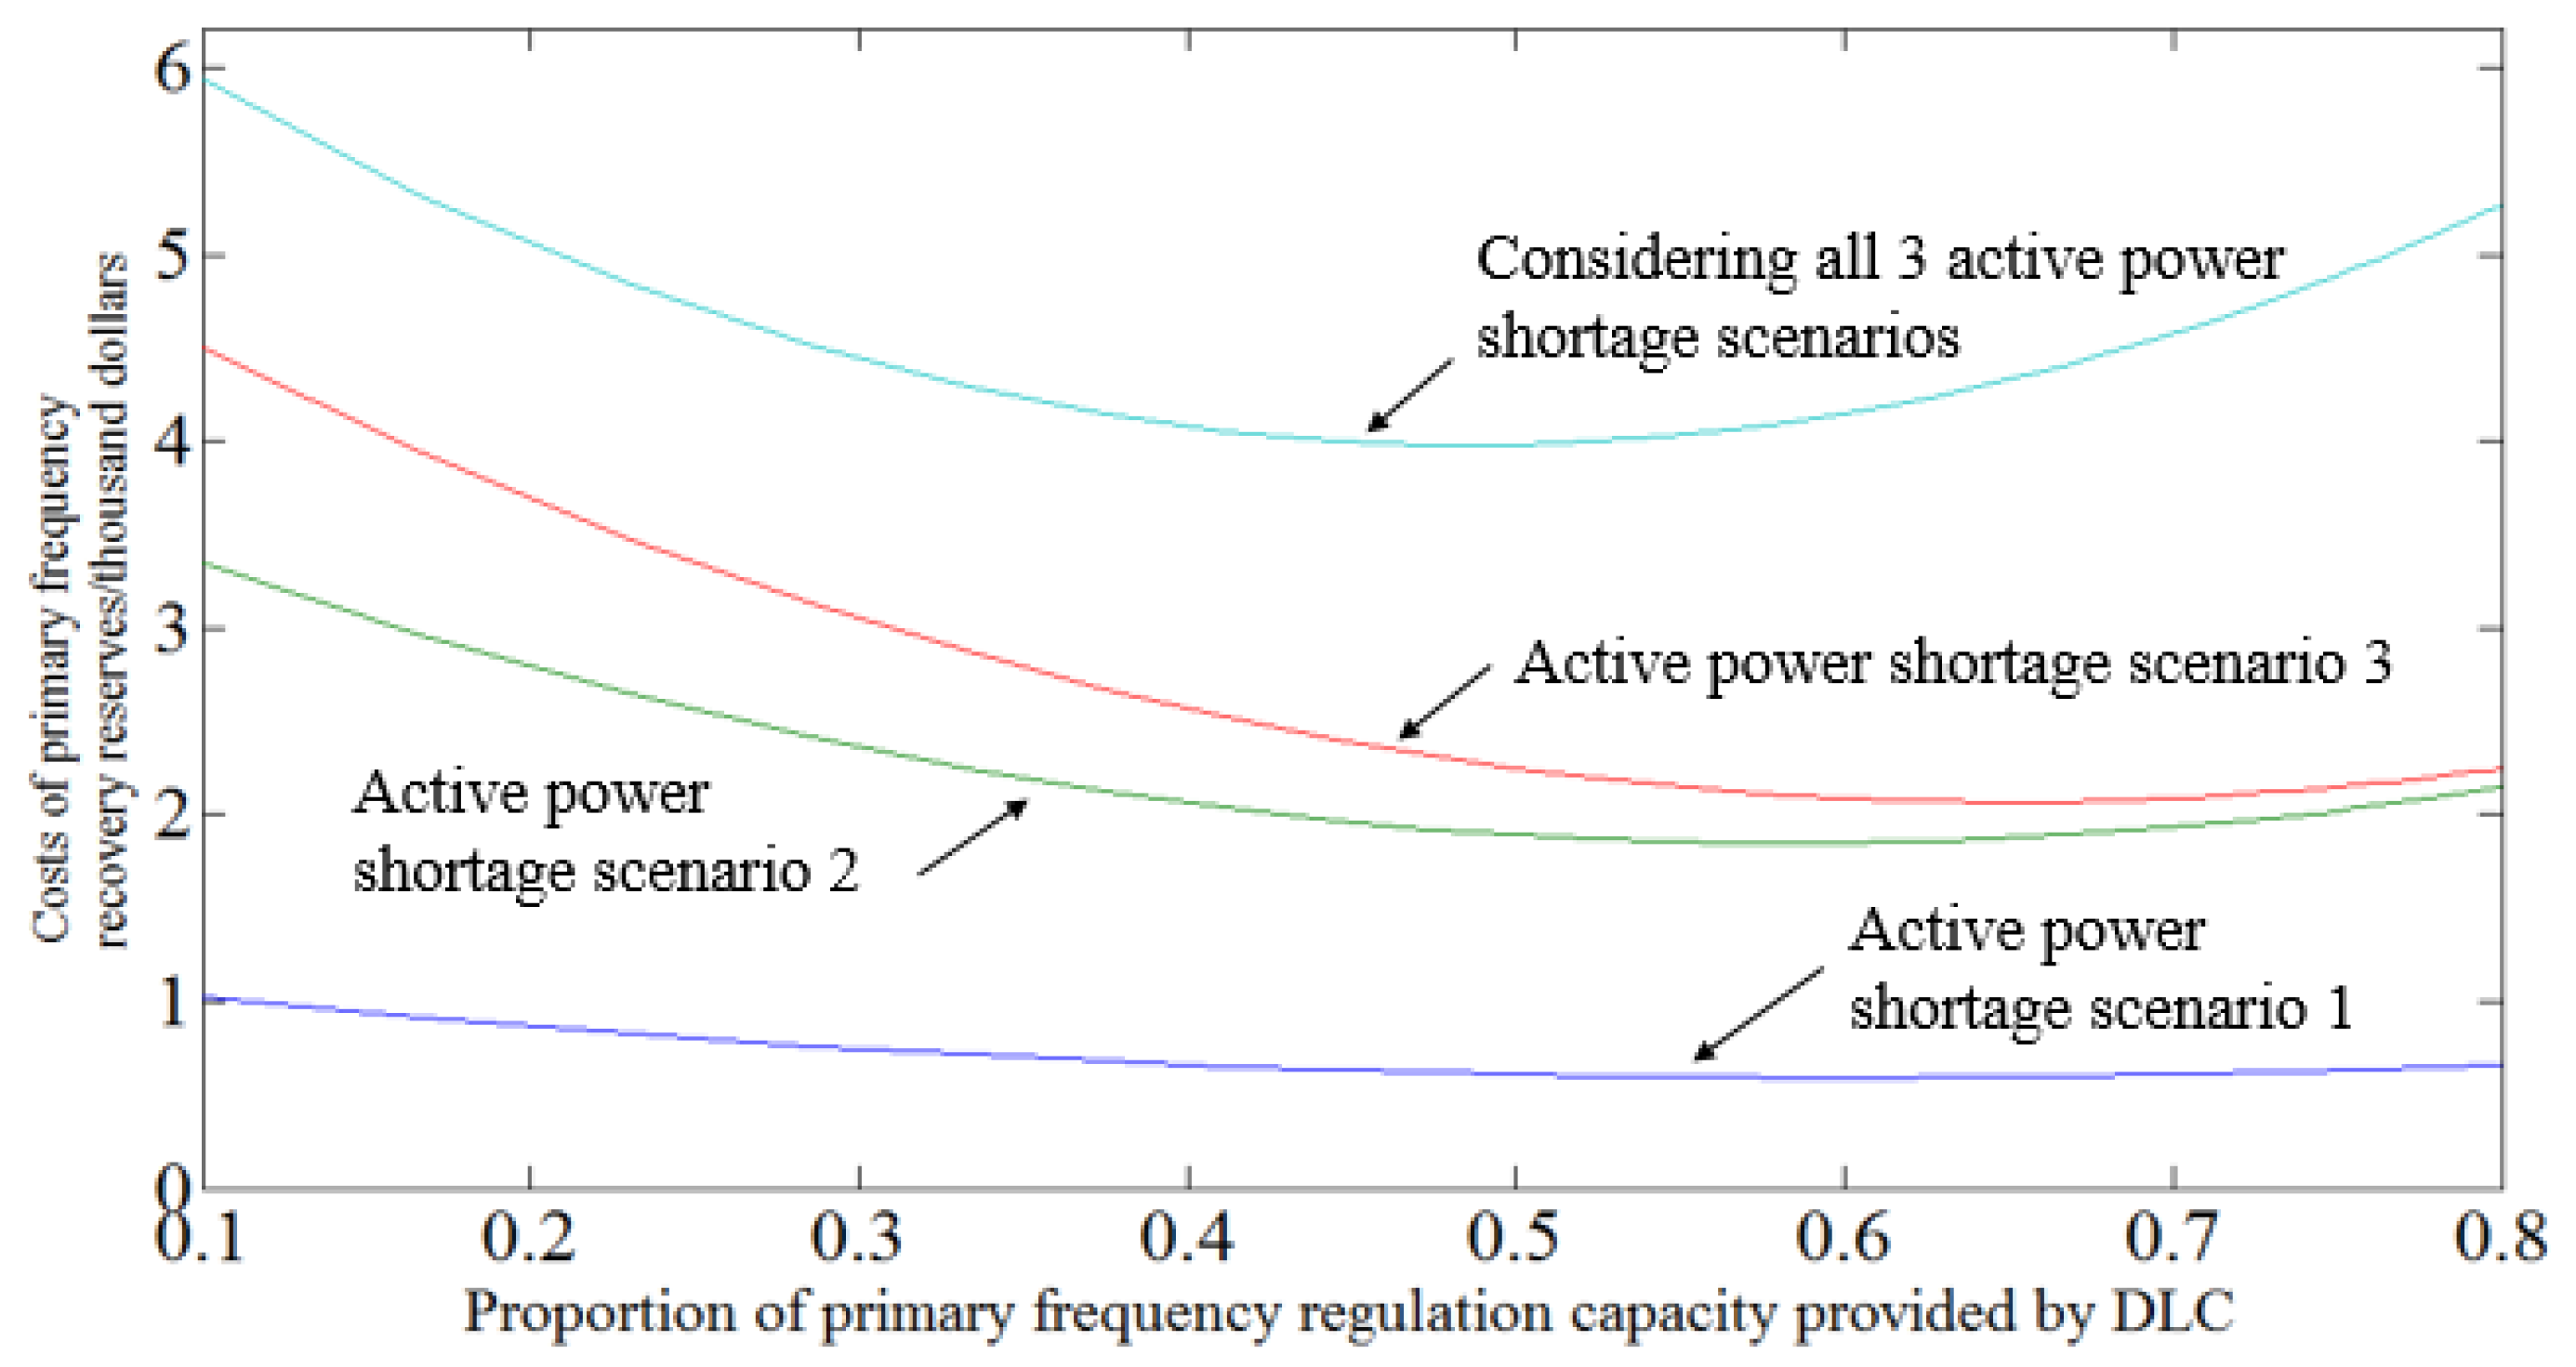
5.4.1. Impacts of the Proportion of DLC on the Optimization Results

Figure 4 shows the cost of the primary frequency regulation reserve in different fault scenarios with different proportions of DLC. The cost of the primary frequency regulation reserve in Scenario 1, which has the smallest active power shortage, is reduced by at most $448.8, while the cost of the primary frequency regulation reserve in Scenario 3, which has the largest active power shortage, is reduced by at most $2476.13. The improvement in the system’s economy resulting from its use of DLC is greater when there is a larger shortage of active power.
Furthermore, a difference in the proportion of the primary frequency regulation reserve provided by DLC result in a different amount of improvement in the system’s economy. In this case, the system is economically optimal when DLC makes up 60% of primary frequency regulation reserve in a single active power shortage scenario and 50% of primary frequency regulation reserve when all the active power shortage scenarios are considered.

5.4.2. Impacts of the DLC and Generator Parameters on the Optimization Results

Figure 5 shows the allocation of the primary frequency regulation reserve for different frequency recovery effects in Scenario 2. With a lower requirement, Unit 1 and User 4 provide the highest primary frequency regulation reserve capacity. When the requirements for the frequency recovery effect are increased, i.e., K increases, the primary frequency regulation reserve capacity provided by Unit 1 and User 4 decreases. The reason for this is that the costs of Unit 1 and User 4 are low, but their impacts on frequency recovery are small. Unit 3 and Users 1 and 6, which have higher purchasing bids and greater impacts on the frequency effect, provide more primary frequency regulation reserve capacity as K increases. The optimal allocation of the primary frequency regulation reserve is related not only to the costs of the generators and DLC but also to their impacts on frequency recovery.

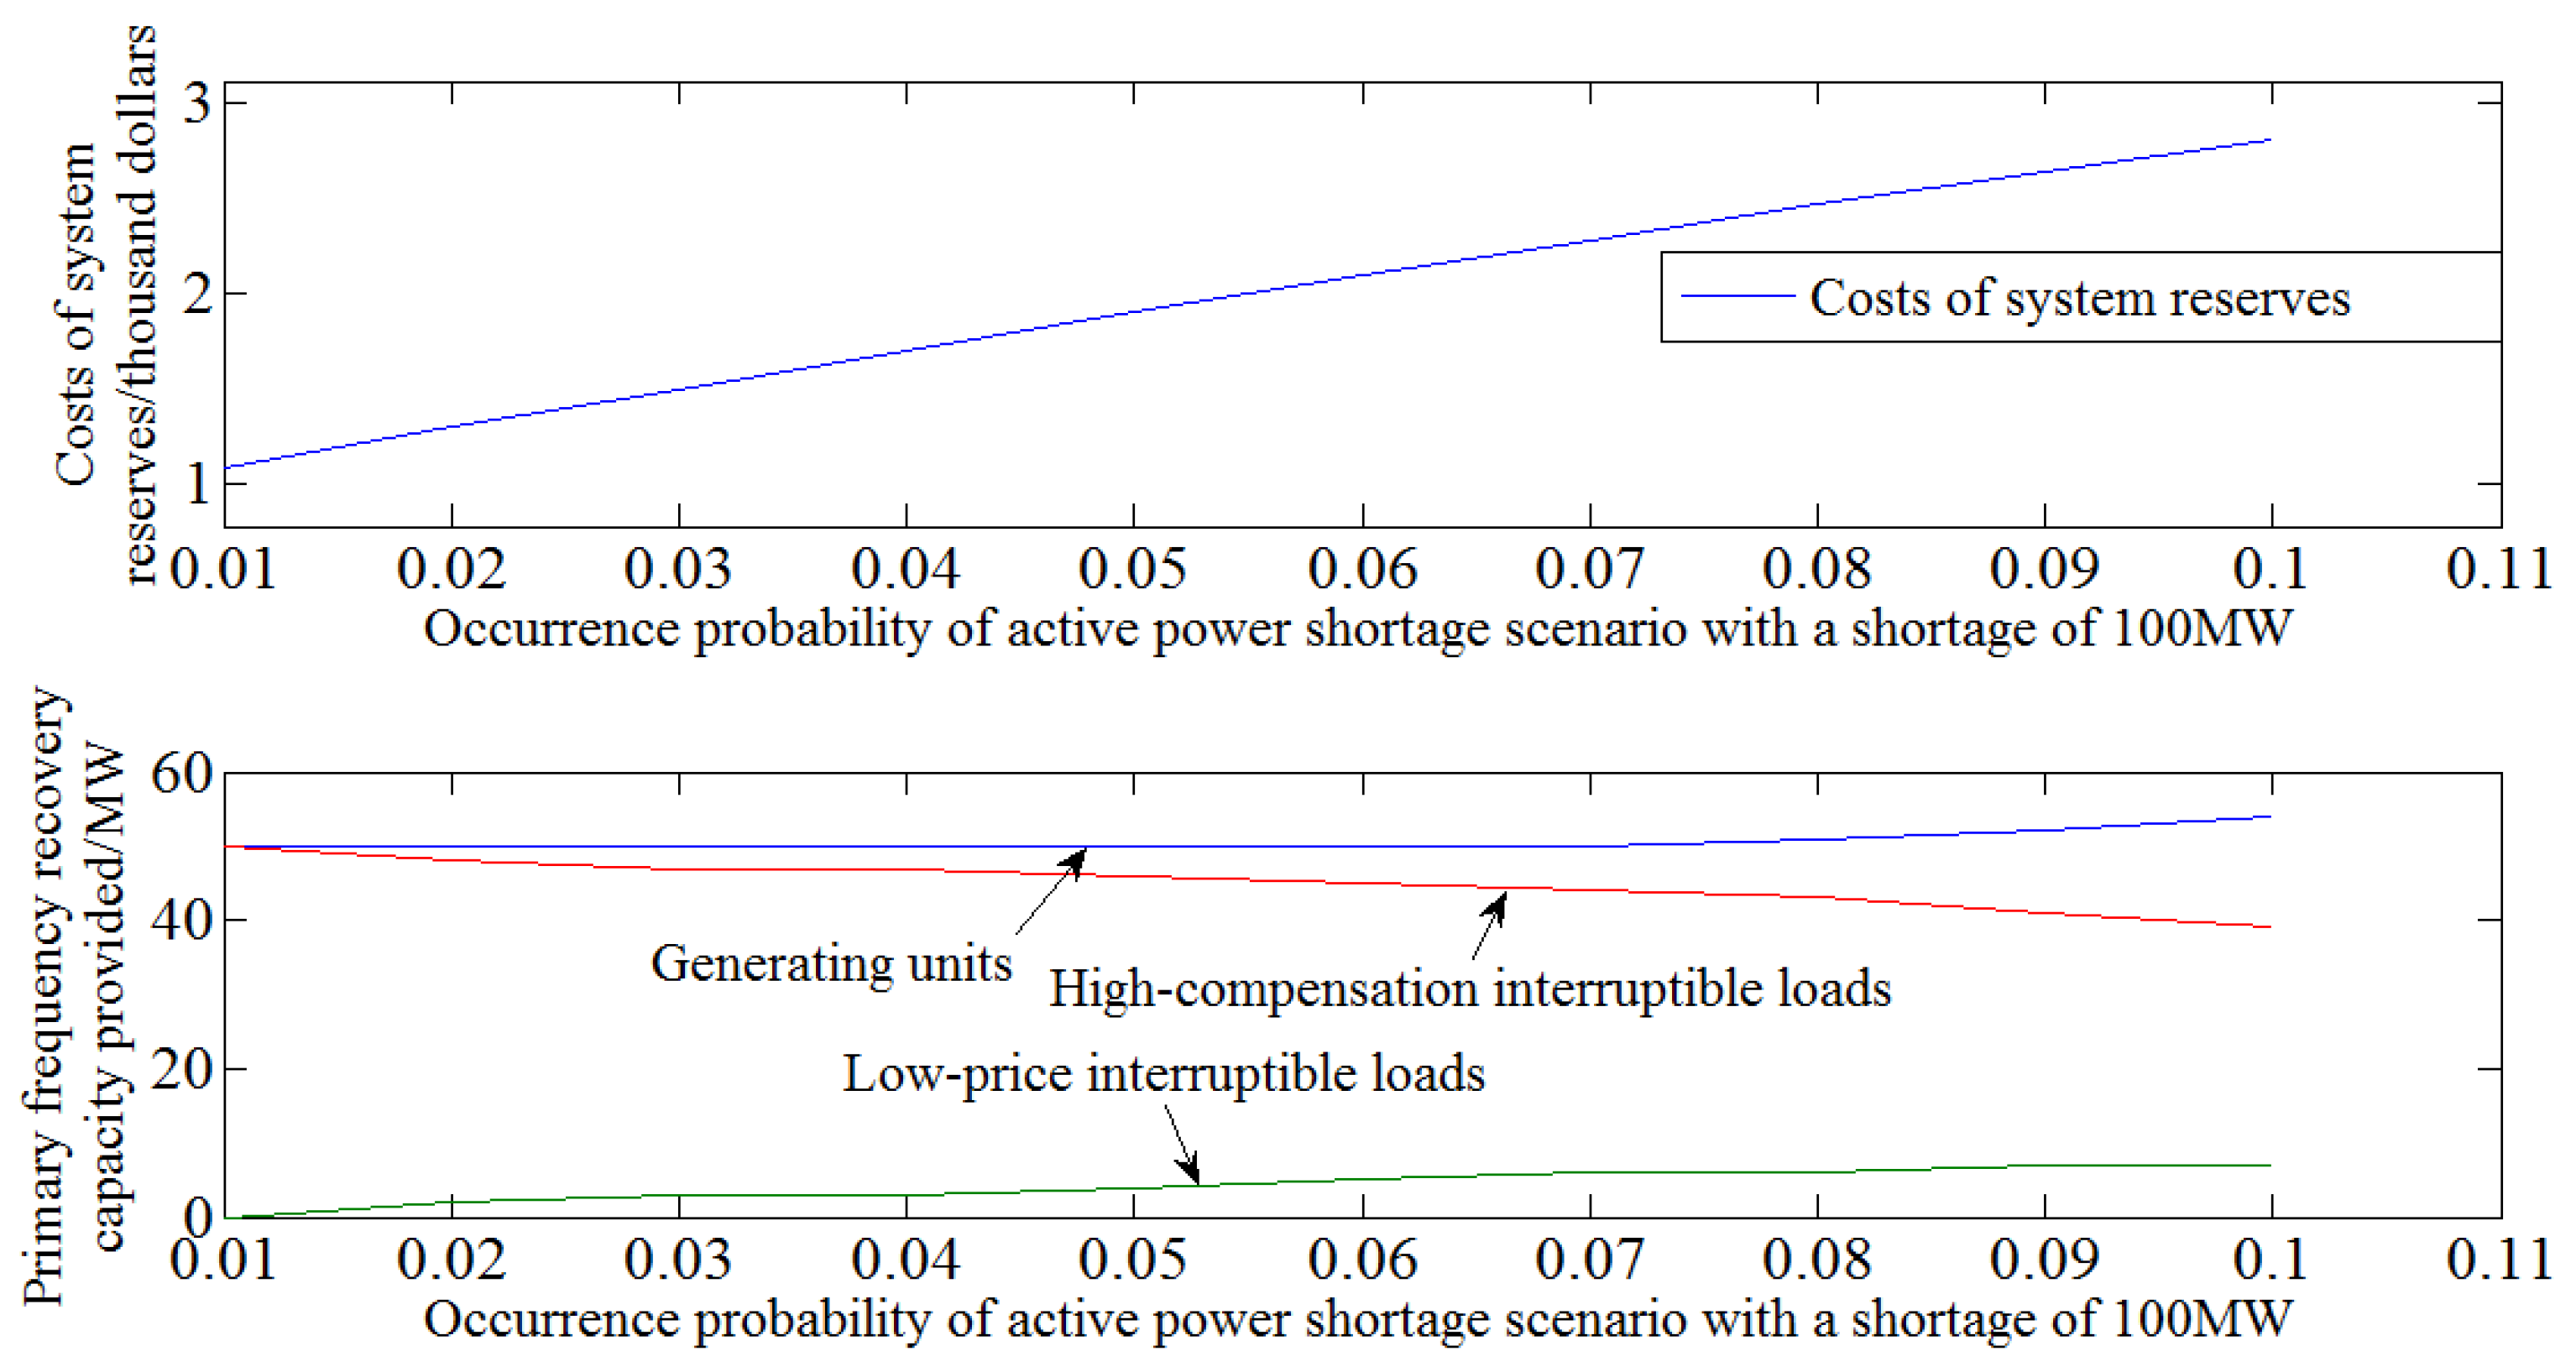
5.4.3. Impacts of the Probabilities of the Active Power Shortage Scenarios on the Optimization Results

The economy of high-compensation DLC is related not only to the purchasing bid but also to the probability of each active power shortage scenario because the extra cost of this type of compensation only occurs when there is an active power shortage. When the probability of an active power shortage scenario increases, the economy of high-compensation DLC decreases, which results in an increase in the primary frequency regulation reserve provided by the generating units and by low-price DLC and a decrease in the reserve capacity provided by high-compensation DLC. In Scenario 2, when there is an active power shortage of 100 MW, the impacts of the probability on the cost and allocation of the system’s reserve are illustrated in Figure 6.

6. Conclusions

In this paper, an index representing the effect of DLC and generating units on frequency recovery is proposed; it is based on static interruptible load frequency coefficients and the adjustment coefficients of the generating units, and a coordinative optimization model of the use of DLC in primary frequency regulation is built. The results indicate that the optimal primary frequency regulation scheme is related not only to the pricing and parameters of DLC and the generating units but also to the proportion of the primary frequency regulation reserve’s capacity that is allowed to be provided by DLC, the requirements for frequency recovery and the probability of each active power shortage scenario. The proposed index can reflect the impact of the primary frequency regulation scheme on the system’s frequency recovery, and the coordinative optimization model incorporates both economy and security, which allows it to be used as a reference for power system operators and designers.

Acknowledgments

The work is supported by the National Natural Science Foundation of China (Grant No. 51577030) and the Science and Technology Project “Key Technology Research and Application of Sending Network which Transmits Large-scale of New Energy by UHVDC Considering Receiving Network Constraints”.

Author Contributions

The main ideas, model and general research approaches in this paper were proposed by Xia Zhou, who also designed the case study and drew the conclusions. The framework of the research was supplemented by Chaohai Zhang. Wei Li provided the necessary data and assisted by running the simulation, and Jilai Yu analysed the results. Mengya Li finished the paper and edited the figures and tables. Qian Chen reviewed and refined the paper. All the authors read and approved the final manuscript.

Conflicts of Interest

The authors declare no conflicts of interest. The funding sponsors had no role in the design of the study, in the collection, analysis, or interpretation of the data, in the writing of the manuscript, or in the decision to publish the results.

References

  1. Peng, C.; Lei, S.; Hou, Y.; Wu, F. Uncertainty management in power system operation. CSEE J. Power Energy Syst. 2015, 1, 28–35. [Google Scholar] [CrossRef]
  2. Hong, Y.-Y.; Lai, Y.-M.; Chang, Y.-R.; Lee, Y.-D.; Liu, P.-W. Optimizing capacities of distributed generation and energy storage in a small autonomous power system considering uncertainty in renewables. Energies 2015, 8, 2473–2492. [Google Scholar] [CrossRef]
  3. Park, H.-G.; Lyu, J.-K.; Kang, Y.; Park, J.-K. Unit commitment considering interruptible load for power system operation with wind power. Energies 2014, 7, 4281–4299. [Google Scholar] [CrossRef]
  4. Khorsand, M.A.; Heydari, H.; Zakariazadeh, A. Interruptible load participation as operating reserve in joint energy and spinning reserve markets using stochastic security analysis. In Proceedings of the 2nd International Conference on Computer and Automation Engineering, Singapore, 26–28 February 2010; pp. 8–12.
  5. Aminifar, F.; Fotuhi-Firuzabad, M.; Shahidehpour, M. Unit commitment with probabilistic spinning reserve and interruptible load considerations. IEEE Trans. Power Syst. 2009, 24, 388–397. [Google Scholar] [CrossRef]
  6. Nouri, A.; Afkousi-Paqaleh, M.; Hosseini, S.H. Probabilistic assessment and sensitivity analysis of marginal price of different services in power markets. IEEE Syst. J. 2013, 7, 873–880. [Google Scholar] [CrossRef]
  7. Shen, J.; Jiang, C.; Li, B. Controllable load management approaches in smart grids. Energies 2015, 8, 11187–11202. [Google Scholar] [CrossRef]
  8. Aunedi, M.; Kountouriotis, P.; Calderon, J.E.; Angeli, D.; Strbac, G. Economic and environmental benefits of dynamic demand in providing frequency regulation. IEEE Trans. Smart Grid 2013, 4, 2036–2048. [Google Scholar] [CrossRef]
  9. Paterakis, N.G.; Erdinc, O.; Bakirtzis, A.G.; Catalao, J.P.S. Qualification and quantification of reserves in power systems under high wind generation penetration considering demand response. IEEE Trans. Sustain. Energy 2015, 6, 88–103. [Google Scholar] [CrossRef]
  10. Ma, L.L.; Yang, J.; Fu, C.; Liu, P.; Sun, Y.Z. Review on impact of electric car charging and discharging on power grid. Power Syst. Prot. Control 2013, 3, 140–148. [Google Scholar]
  11. Zhao, H.; Liu, G.; Jia, H.; Yang, Z.; Fan, S. Analysis of demand response program based on refined models. Power System Protection and Control 2014, 1, 62–69. (In Chinese) [Google Scholar]
  12. Yoo, T.H.; Park, H.; Lyu, J.K.; Park, J.K. Determining the interruptible load with strategic behavior in a competitive electricity market. Energies 2014, 8, 257–277. [Google Scholar] [CrossRef]
  13. Douglass, P.J.; Garcia-Valle, R.; Nyeng, P.; Ostergaard, J.; Togeby, M. Smart demand for frequency regulation: Experimental results. IEEE Trans. Smart Grid 2013, 4, 1713–1720. [Google Scholar] [CrossRef]
  14. Chen, H.; Chen, Y.; Wan, Q.; Gao, S. Steady-State Analysis of Power System, 3rd ed.; China Electric Power Press: Beijing, China, 2007; pp. 201–218. (In Chinese) [Google Scholar]
  15. Wang, D. Theory and Empirical Research on Electric Power Demand Response. Ph.D. Thesis, North China Electric Power University, Beijing, China, 2011. [Google Scholar]
  16. Hu, Z.; Xie, X.; Zhang, F.; Zhang, J.; Song, Y. Research on automatic generation control strategy incorporating energy storage resources. Proc. CSEE 2014, 29, 5080–5087. (In Chinese) [Google Scholar]
  17. Lei, B. Research on Application of Battery Energy Storage System in Power System Frequency Regulation. Ph.D. Thesis, Hunan University, Changsha, Hunan, China, 2014. [Google Scholar]
  18. Yao, J.; Yang, S.; Wang, K.; Zeng, D.; Mao, W.; Geng, J. Framework and strategy design of demand response scheduling for balancing wind power fluctuation. Autom. Electr. Power Syst. 2014, 9, 85–92. (In Chinese) [Google Scholar]
  19. Zhang, W.; Lian, J.; Chang, C.Y.; Kalsi, K. Aggregated modelling and control of air conditioning loads for demand response. IEEE Trans. Power Syst. 2013, 28, 4655–4664. [Google Scholar] [CrossRef]
  20. Xiao, X.; Zhou, Y.; Zheng, K.; Chen, J.; Zhang, N.; Zhou, Y. Research on strategy of interruptible price and its cost-benefit model aimed at peak load shifting in Taiwan. Proc. CSEE 2014, 22, 3615–3622. (In Chinese) [Google Scholar]
  21. Wu, D.; Aliprantis, D.C.; Ying, L. Load scheduling and dispatch for aggregators of plug-in electric vehicles. IEEE Trans. Smart Grid 2012, 3, 368–376. [Google Scholar] [CrossRef]
  22. Xu, Y.; Liu, W.; Gong, J. Stable multi-agent-based load shedding algorithm for power systems. IEEE Trans. Power Syst. 2011, 6, 2006–2014. [Google Scholar]
  23. Daneshfar, F.; Bevrani, H. Load-frequency control: A GA-based multi-agent reinforcement learning. IET Gener. Transm. Distrib. 2010, 4, 13–26. [Google Scholar] [CrossRef]
  24. Wang, K.; Yao, J.; Yao, L.; Yang, S.; Yong, T. Survey of Research on Flexible Loads Scheduling Technologies. Autom. Electr. Power Syst. 2014, 20, 127–135. (In Chinese) [Google Scholar]
  25. China National Energy Administration. DL/T 428-2010 Technical Rules for Power System Automatic Under-Frequency Load Shedding; Electric Power Press: Beijing, China, 2011; pp. 1–2. [Google Scholar]
  26. Lin, Y.; Chen, X.; Zheng, X.; Bie, Z. Estimation of spinning contingency reserve capacity in power systems. Autom. Electr. Power Syst. 2014, 19, 114–121. (In Chinese) [Google Scholar]
  27. Wang, D. Application of incentive demand response in USA. Power Demand Side Manag. 2010, 1, 74–77. [Google Scholar]
Figure 1. The relationships between means of frequency control and demand responses.
Energies 09 00167 g001
Figure 2. The cost of the system’s reserve with and without interruptible loads before and after primary frequency regulation.
Energies 09 00167 g002
Figure 3. The frequency recovery process.
Energies 09 00167 g003
Figure 4. The impact of the power system’s operating rule on the optimization results.
Energies 09 00167 g004
Figure 5. Primary frequency regulation reserve allocation in fault Scenario 2.
Energies 09 00167 g005
Figure 6. The impacts of the probability of an active power shortage on the cost and allocation of the primary frequency regulation reserve.
Energies 09 00167 g006
Table 1. The parameters of the generating units.
Generating Unit iLower Limit of Spinning Reserve Capacity (MW)Upper Limit of Spinning Reserve Capacity (MW)Purchase Bid ciInvocation Price ($/MWh)Adjustment Coefficient
10500.223.370.06
20500.323.520.04
30800.423.680.02
Table 2. The parameters of low-price interruptible service.
User mLower Limit of Interruptible Load (MW)Upper Limit of Interruptible Load (MW)Discount Rate of the Electricity Price, bmFrequency Adjustment Coefficient
10400.006250.01
20400.00750.02
30600.00830.03
Table 3. The parameters of high-compensation interruptible service.
User nLower Limit of Interruptible Load (MW)Upper Limit of Interruptible Load (MW)Compensation Coefficient, dnFrequency Adjustment Coefficient
40400.050.03
50400.0750.02
60600.0670.01
Table 4. Active shortage scenarios.
Fault zOccurrence ProbabilityActive Power Shortage (MW)Duration (h)
10.1503
20.051005
30.0251207

