1. Introduction
The increasing energy demand, the decay in finite traditional energy resources and the growing concerns from environmental pollution brought considerable challenges on energy and electricity supply industry [
1]. Many measures have been taken so far to overcome these challenges or at least mitigate their effect on electricity supply industry with the deregulation of electricity markets across developed countries, the investments in renewable energy deployments, the developments in electricity distribution networks and the legislation of new energy policies to be at the core of those measures [
2].
The developments in distribution networks had major impact on the diffusion of distributed generation (DG). The traditional principle of distribution networks where electricity used to travel long distances from distant centralized power generation plants through radial passive networks to supply the end users has changed. It became active networks that support more dynamic energy flows with real-time management. Information technology and power electronics have facilitated the control of these new active networks in order to withstand the increasing number of DG units connected at the low and medium voltage level of distribution networks [
3].
The size of system support that DG can bring to electricity networks’ operators is huge, as it contributes in: network loss reduction, improved voltage support, transmission and distribution congestion relief, deferment in capital investments for transmission and distribution networks infrastructure, and the overall improved system security, efficiency, and reliability [
4].
Despite the promising benefits DG brought for distribution networks much work has been done to reveal the adverse effect resulting from DG penetration on utility grid. Those operational effects can be summarized into the following: increased thermal constraints on utility’s assets when DG capacity exceeds the utility upstream firm capacity, voltage level control issues as DG may interfere with the standard utility voltage control causing abnormal voltage levels at downstream loads, reversed power flows since DG have changed the traditional power flow from unidirectional flow to bidirectional flow, and network protection issues which form a significant challenge against further DG deployment [
5,
6,
7,
8].
Protection challenges arise from the fact that DG penetration may pose serious issues on the normal operation of utility protection schemes, such challenges include: false tripping of feeders, blinding of protection, increased or decreased fault levels, unintentional islanding, unsynchronized reclosing, and prevention of automatic reclosing [
9].
There is a close relationship between islanding and reclosing problems, as unwanted islands may lead eventually to unsynchronized reclosing. Due to the unpredicted behavior of power systems with unintentional islanding many technical standards state that any DG unit installed at a distribution feeder must be automatically tripped should the feeder become disconnected from the network, this situation is called: “Anti-Islanding Protection” [
9,
10].
Anti-islanding may reduce DG units’ efficiency as well as network reliability if DG units were prevented operation despite their supply support benefits [
3]. New developments in DG technologies such as gas turbines, diesel engines, hydro turbines, and wind energy conversion system (WECS) promise more efficient and greener power production [
11]. Many studies have been conducted on distributed generation in terms of generation technology, generation resources availability, supply quality and reliability, as well as protection. While previous work on islanding phenomenon in power systems focused on many different aspects those in particular to this study were related to intentional (planned) and unintentional islanding, anti-islanding detection, and protection from islanding.
Those studies examined the dynamic and steady state behavior of selected systems during grid-connected and islanding operation, hence certain conclusions about islanding whether or not it was a viable option will be made depending on the proposed control strategies as well as the existing DG capacity. While some studies focused on allowing islanding, others aimed to address the problems related to islanding protection and tried to suggest new methods for islanding detection [
12,
13].
The results revealed that although wind turbines accounted for small portion of the installed DG capacity, most wind turbines needed to be disconnected in order to preserve system frequency within the permissible range if islanding operation was considered, this is related to the insufficient reserve and inertia issues of intermittent energy sources [
13]. The study also suggested a new approach to enable successful islanding with the presence of wind generation and results were promising. This approach was based on demand as frequency controlled reserve (the DFR technology). This technology provides support to islanding frequency at the presence of intermittent generation by performing demand side management on many end-users loads. Since it was found that disconnecting large number of end-users loads such as electric heating, freezers, and refrigerators for short period of time not affecting those loads performance but it returns considerable benefit in terms of load reduction to preserve frequency [
13].
The unintentional islanding was investigated as a part of an islanding study proposed a power sharing approach to improve the dynamic behavior of an islanded micro-grid system [
14]. The dynamic behavior of the islanded part was studied by means of PSCAD/EMTDC software package. The control strategy capability in providing frequency and voltage control to the islanded system was observed. Due to the major contribution from the primary frequency control units, the gas unit added a smoother regulation to the island frequency by injecting less real power. Furthermore, voltage regulation was successful in bringing the bus voltage to the permissible range after unplanned islanding has been detected [
14].
A new anti-islanding detection method was proposed [
15] as part of new requirement for utilities in order to provide protection from islanding negative impacts such as: out-of-phase reclosing, electric shocks from supposedly de-energized islands, and power quality degradation. The new proposed anti-islanding method detects islanding by calculating frequency slip and acceleration between two systems using time synchronized measurements. This method was referred to as islanding detection scheme based on wide-area measurement (IDS_WA) [
15]. Results showed that islanding detection scheme based on local area measurement method (IDS_LA) detects islanding successfully if the existing power mismatch between utility grid and DG connected network is large. Meanwhile, IDS_LA failed to establish reliable detection within certain period of time when the power mismatch was small. IDS_WA method managed to detect islanding regardless of the existing power mismatch as simulation results revealed [
15].
The current paper aims to contribute the current studies on the distributed generation islanding effect on distribution networks and end user loads. The paper studies the feasibility of planned islanding operation to provide support at the event of utility outages using the load sharing islanding method for controlling the distributed generation units during grid-connected and islanding operation. Furthermore the paper investigates the effect an unplanned islanding on a realistic MV network. The obtained simulation results were validated through various case studies and have shown that properly planned islanding transition could provide support to critical loads at the event of utility outages. The presented work contributes the conducted worldwide research on islanding phenomenon aiming to increase the DG units and the power distribution networks’ efficiency.
2. Islanding Phenomenon in Power Systems
2.1. Islanding Definition
Islanding phenomenon (or power islands) is an electrical condition exists in power distribution networks containing distributed generation when a zone or an area of distribution network supplied by both power grid and the DG gets isolated from grid supply due to any reason, thus DG units continue to energize some or the entire load presented within the isolated section. This implies that the distribution utility loses control over supply in the island and cannot guarantee supply quality neither its stability [
16,
17].
Traditionally, distribution networks used to be passive networks and it did not have any power sources injecting power into grid, therefore any fault used to occur in the network was dealt with by utilities’ protection schemes on that basis. However the introduction of DG at distribution level made this assumption void and further investigation and research were needed to address the issue of islanding in power systems [
18].
In other words, when the amount of power generated by multiple DG units connected at the LV grid matches the absorbed amount of power by loads connected to the same network; utility protection units may fail to detect this situation as no power is flowing through utility grid and that may indicate islanding situation, bearing in mind that DG units may self-disconnect following islanding occurrence without any consideration to the loads presented in the island [
17].
2.2. Unintentional Islanding
Islanding situation may pose threat to the distribution system especially if it occurs accidentally to part of the system that was not designed to operate in such conditions. Below are some of the most potential hazards unintentional islanding may bring to a system if it occurs [
16,
19]:
- (1)
Power quality degradation: Voltage and frequency levels in an unintentional island may severely vary and usually will exceed the permissible limits which will put end user loads, DG units, and utility assets at risk.
- (2)
Out of phase re-closure: Utility protection equipment are designed usually to auto-reclose after fault clearance in order to reconnect service, however unintentional islands will cause voltage on both sides being out of phase if reclose occurred. This will pose serious risk on rotational machines’ prime movers due to currents and high mechanical torques produced as result of out of phase re-closure.
- (3)
Loss of grounding: Power systems usually have the earthling point at the utility side, thus unintentional islanding will likely leave the existing DG units and loads within the island to be improperly grounded.
- (4)
Safety concerns: Unwanted islanding will pose health risk on utility’s maintenance teams, since they work on a network being thought de-energized when it is actually still energized.
2.3. Islanding Detection
Concept of islanding detection is based on monitoring the DG units’ output parameters and sometimes the grid parameters to notice any change in them, and then conclude whether or not islanding has occurred. On that basis, islanding detection techniques can be categorized into remote and local techniques, while the latter can be divided into passive, active, and hybrid technique [
18].
Islanding detection techniques face three main challenges. The first challenge is related to the range in power difference between the DG output power and that absorbed by the load in which islanding condition may not be detected; this is referred to as the non-detection zone (NDZ). The second challenge comes from the amount of degradation the detection technique may pose upon DG output power quality and stability; this is related mainly to active techniques that aim to inject certain disturbances to detect islanding [
20]. Finally, the type of loads presented in power islands play an important role in islanding detection techniques success, since certain types of loads that can be modelled as parallel RLC circuits form some obstacles against detection methods, while constant power loads or current harmonics generating nonlinear loads make it easier for detection techniques to detect islanding [
20].
A brief description and some examples for each one of the islanding detection techniques mentioned previously are as follow:
- ➢
Local techniques: the main principal here works by measuring the main electrical parameters (voltage, current, frequency, etc.) at the DG side [
20], local techniques are sub-categorized into:
Passive techniques: those techniques specifically monitor the electric parameters at DG side and compare them with predefined values; despite their ease of implementation and non-harmful effect on DG stability those techniques suffer from wide NDZ. Such techniques include: Over/under-voltage and over/under-frequency, phase jump detection (PJD), detection of voltage and current harmonics [
18,
20].
Active techniques: active techniques work by injecting certain disturbances at the output of the DG unit and depending on the amount of change in the electric parameters, islanding might be detected if that amount was considerable. The NDZ of active techniques is very small or almost negligible compared to passive techniques; however the amount of degradation they may produce is significant. Such techniques include: impedance measurement, active frequency drift, sandia frequency shift [
18,
20].
Hybrid techniques: these methods employ a combination of both active and passive techniques, where active techniques are used when passive techniques suspect islanding situation. Those techniques include: positive feedback and voltage imbalance, voltage and reactive power shift [
18,
20].
- ➢
Remote techniques: these techniques use certain communication between utility substation and DG. Remote techniques detect islanding with high degree of reliability and accuracy, however their implementation costs are quite expensive compared to the local techniques. These techniques include: impedance insertion and power line carrier communications [
18,
20].
3. Methodology
3.1. Conditions for Islanding and Grid-Connected Operation
For the sake of system control and protection, DG units are not usually set to participate in regulating the frequency of the grid neither the voltage during a grid-connected mode. They are set to operate in a constant power mode and that is to provide fixed level of real power at high power factor (PF), while the grid frequency and voltage levels are determined by the utility control systems. The governor system attached with those DG units is responsible for providing that constant level of real power, while the excitation and automatic voltage regulation system ensures the constant reactive power output through automatic voltage regulation reference [
14,
21].
However, when there is a transition from the grid-connected mode to the islanding mode whether it was for intentional or unintentional reasons, these external power control systems are bypassed and new control systems take over depending on the islanding method agreed upon by the utility and the DG units’ operators. If this is not the case, then existing governor and excitation control systems remain operating at a predefined reference values chosen according to international standards for safe and stable operation whilst in the islanding mode [
14,
21].
Moreover, operating part of the distribution networks in islanding mode needs to take into consideration certain limits for frequency, voltage and harmonics. These limits must be derived from international standards such as those listed in
Table 1, and that ensure a safe, reliable, and standard quality supply to all end users loads existing within the island [
22].
According to the IEEE 1547-2003 standard, distributed generation units are required to cease energizing the part of the network they supply during certain clearing times should the voltage across the system falls within the correspondent voltage ranges illustrated in
Table 2. Clearing time is defined as the time taken by the DG unit to de-energize its supplied part of the network completely after an abnormal condition has occurred [
23,
24].
As for the system frequency, according to the same IEEE standard and IEEE 1547.2-2008, DG units are required to cease energizing their supplied part of the network within a pre-defined clearing times should the system frequency lies within the specified frequency ranges of
Table 3. Depending on the DG unit capacity the frequency limits and their correspondent clearing times may be fixed or field adjustable. For instance, DG units with capacity over 30 kW those limits need to be field adjustable, while for capacity less than or equal to 30 kW those limits can be either field adjustable or fixed [
23].
If those abnormal operating situations listed above were avoided via properly implemented and secured protection scheme, then there is no reason why islanding should not be utilized. Since it helps increasing the reliability of the distribution networks besides the many other benefits of the distributed generation mentioned earlier. In order to make the islanding mode a feasible option, two key states need to be addressed, studied, and planned fully and completely. Those states are: (1) The transition from grid-connected into islanding mode; and (2) island operation after disconnection from utility control [
25].
3.2. Load Sharing Islanding Method
Under this islanding strategy all DG units within an island are compelled to participate in the islanding transients as well as to serve the existing load by sharing it in an active way [
21,
26,
27]. This strategy can be achieved by forcing all DG units’ control systems following the islanding occurrence to switch from fixed power control mode (P-Q) to fixed frequency and voltage regulation control mode (V-f), these changes are based upon voltage following and frequency adjustments using pre-defined voltage and frequency characteristics. This implies that as the island frequency increases then the total real power output from all of the DG units decrease or vice versa, while the change in the voltage level at any DG unit’s terminal causes the change in its reactive power control in order to regulate the voltage across the islanded network.
4. Distribution System Description
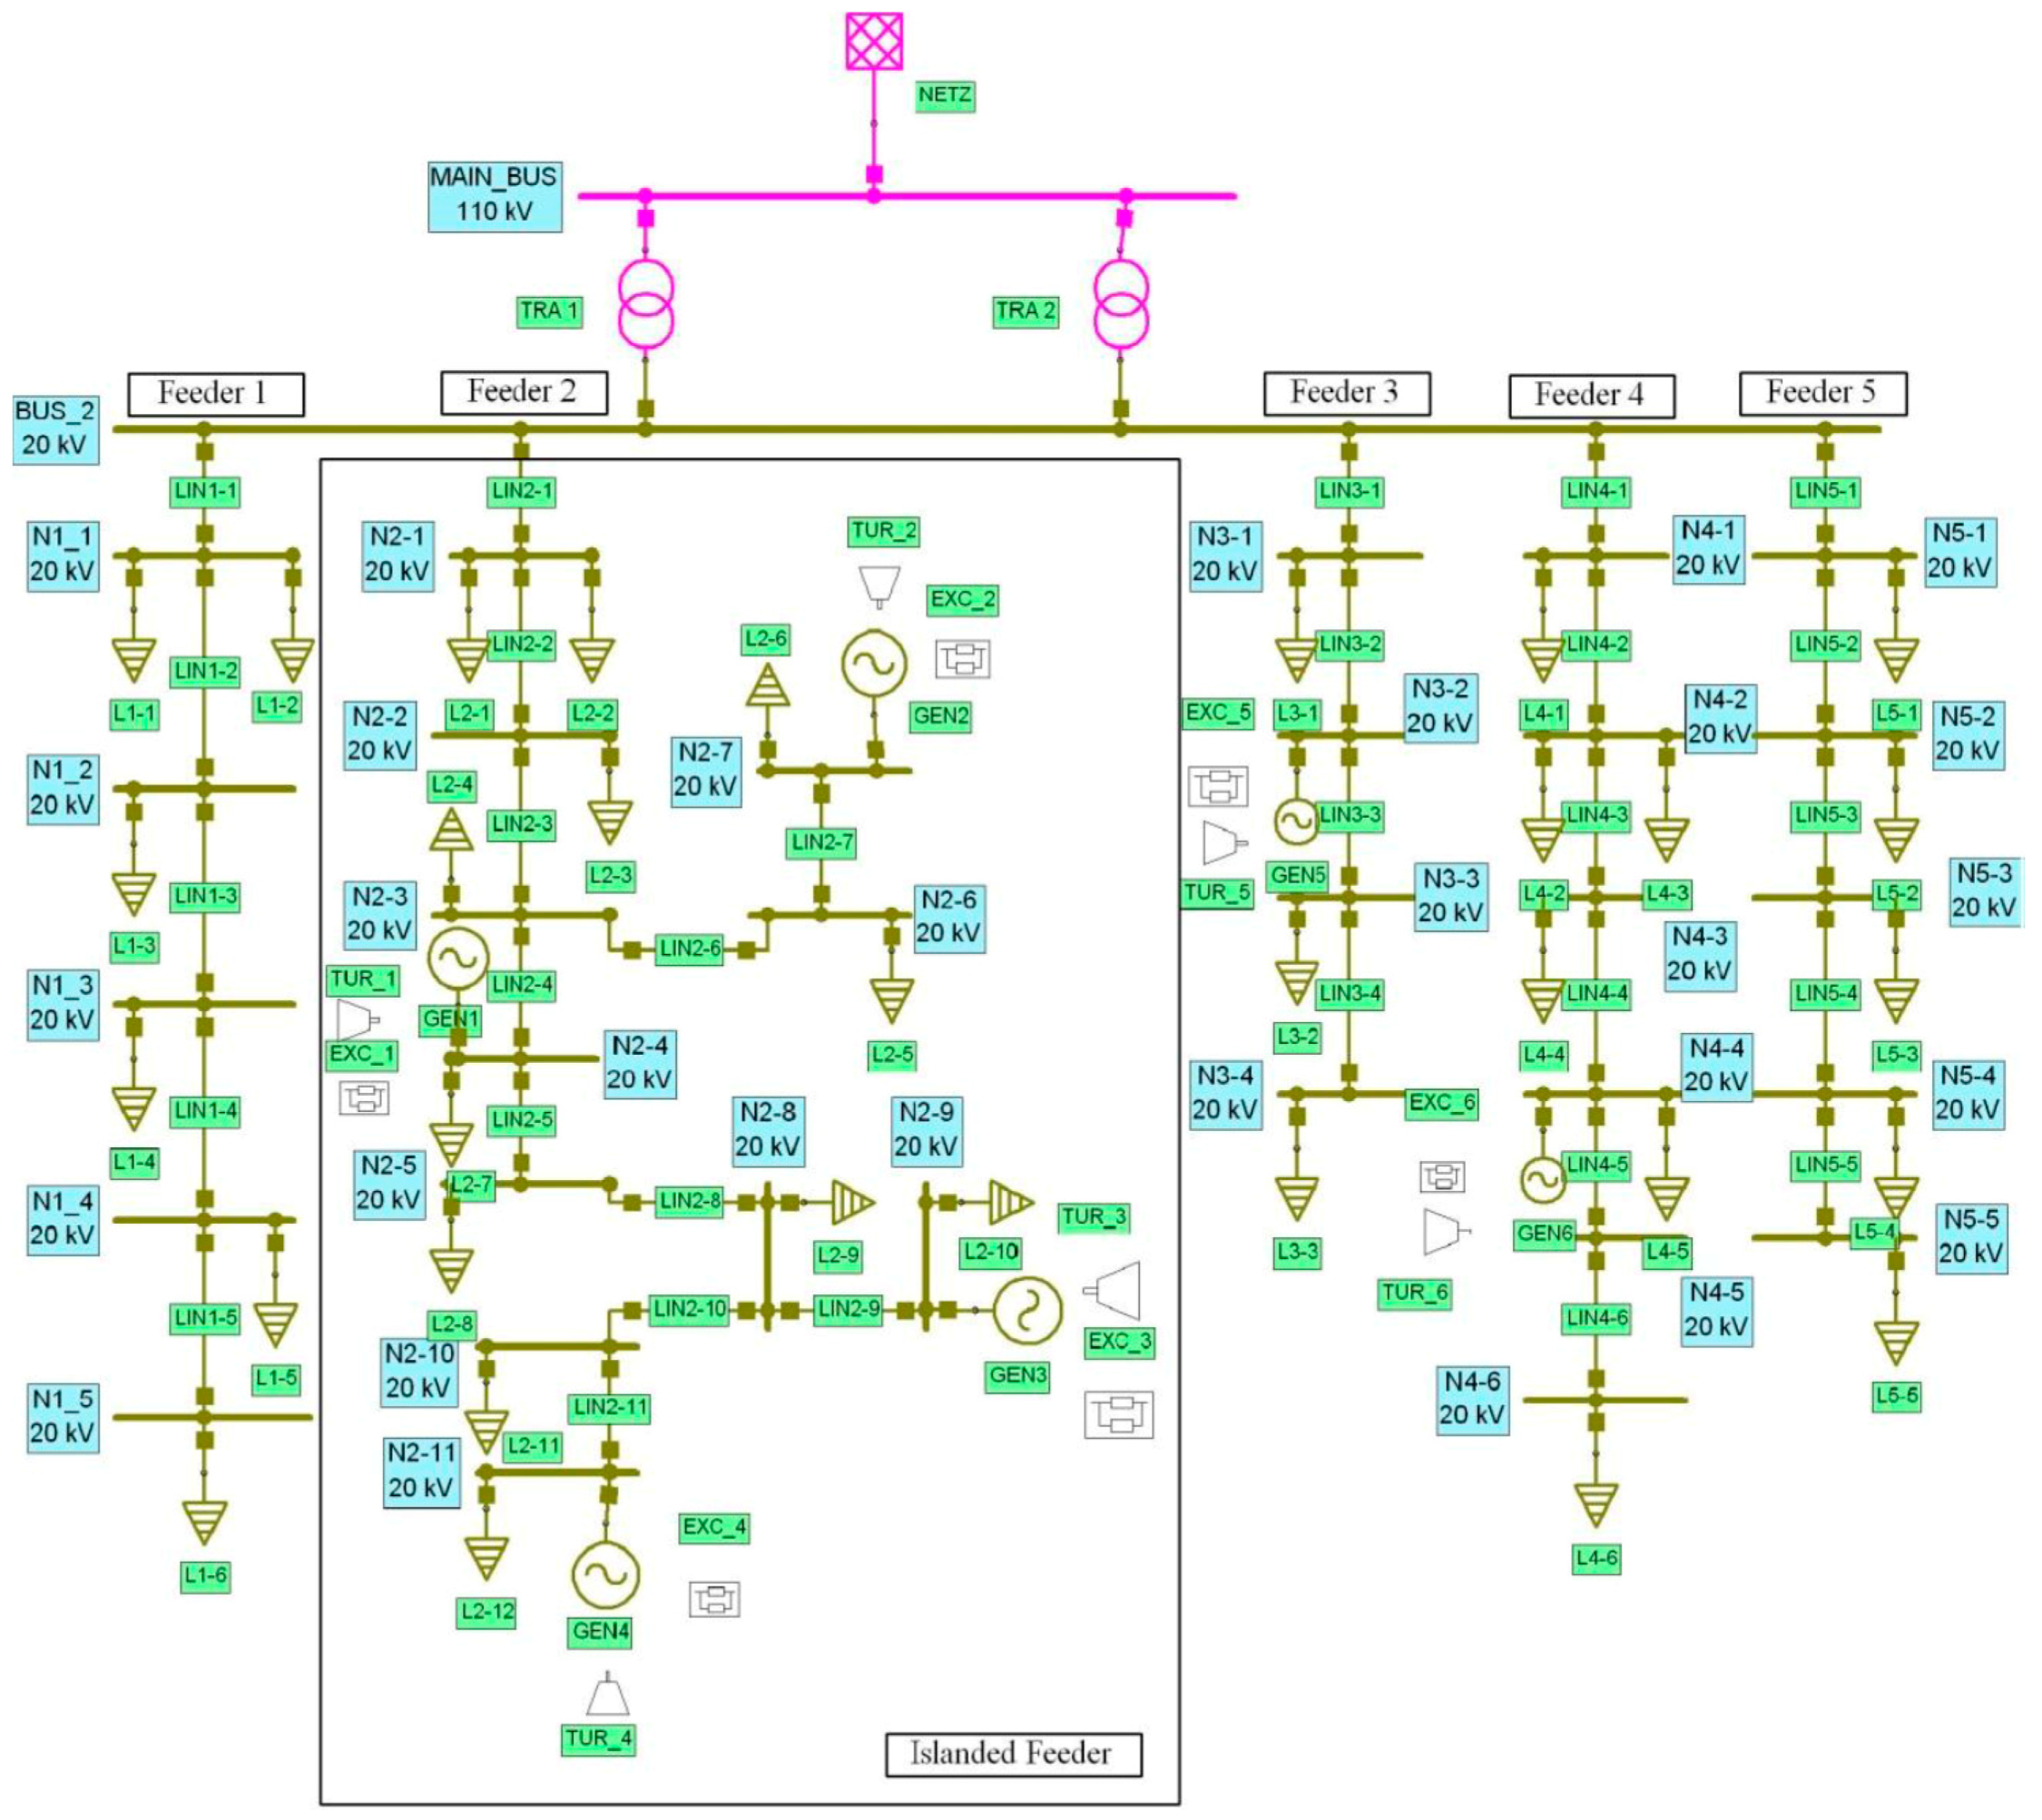
The test network used for this study, shown in
Figure 1, is part of a realistic MV network with a nominal voltage of 20 kV [
28]; it consists of the utility main feeder NETZ rated at 110 kV, with (2000–1000) MVA for max–min initial symmetrical short circuit apparent power. The HV/MV part of the network consists of two transformers each rated at 110/20 kV, and 30 MVA rated apparent power.
The MV network consists of five feeders, while the investigated part of that network Feeder#2 is connected to the MV network at the point of common coupling (PCC); this feeder consists of four generators which is the scope of interest for the case studies. The remaining two generators are connected to Feeders#3 and 4 respectively. Technical data of the six distributed generators can be found in
Table 4.
Bearing in mind that all generators were ungrounded in order to prevent stator damage caused by fault currents from utility grid, moreover high resistive grounding or ungrounded systems are used where allowed when the continuity of supply to loads during single line earth fault is desired. All of the feeders’ lines are made of copper cable lines with a cross-sectional dimension of 3 × (1 × 95) mm
2, the corresponding lengths for all the lines in the MV network are illustrated in
Table 5 [
28].
The remaining part of the MV network, the loads, is as follows: Loads L1-1 to L1-5, L3-1 to L3-3, L4-1 to L4-6, and L5-1 to L5-5 are all with 0.8 MVA apparent powers with 0.95 lagging PF [
28]. As for loads on the studied Feeder#2, they are as follows: L2-1, L2-2, L2-5, L2-8, L2-9, L2-11, and L2-12 are rated at 0.4 MVA, while loads L2-3, L2-4, L2-6, L2-7, and L2-10 are rated at 0.8 MVA; all loads are with 0.95 lagging PF [
28].
5. Dynamic Models of the Network Components
5.1. The Load Model
The load model selected for the purpose of the dynamic simulation of this study is a static exponential load model. Naturally, loads consist of static and dynamic components which are derived from the nature of the load whether it was residential, commercial, or industrial. Static load models describe the dependency of load active and reactive power as a function of the system voltage and/or frequency at one specific instant of time. While on the other hand dynamic load models describe this relation at any instant of time, hence static load models are not time dependent [
29].
However, static load models have been sufficient enough to be used for a very long time to study load behavior for both the static and dynamic components [
29], therefore and for the sake of simplicity the static exponential load model has been used throughout this study to describe the static components for all the loads presented in the island and to approximate their dynamic components based on the facts explained earlier.
An equation that can describe the load power dependency as a function of system voltage and frequency under the static exponential load model is as follows [
30,
31]:
where:
P: is the ongoing active power of the load
Q: is the ongoing reactive power of the load
: is the nominal active power of the load
: is the nominal reactive power of the load
U: is the magnitude of ongoing node voltage
: is the nominal system voltage
: is the rated system frequency
Δf: is frequency difference from rated frequency
nP: is the dependence of load active power on voltage
nQ: is the dependence of load reactive power on voltage
: is the dependence of load reactive power on frequency
: is the dependence of load reactive power on frequency
Typical values for the loads used for all four case studies dynamic simulation were [
29]: nP = 1, nQ = 2, = 0 and = −1.
5.2. DG Units
The diesel, gas and hydraulic DG units are modeled as a single-mass synchronous machine. The machine electrical system is represented in the d-q-0 frame with two rotor windings on each axis. The excitation and governor systems of the machine are also included in the simulation model. The parameters for the diesel, gas and hydraulic units dynamic model used in this study are shown in
Table 6.
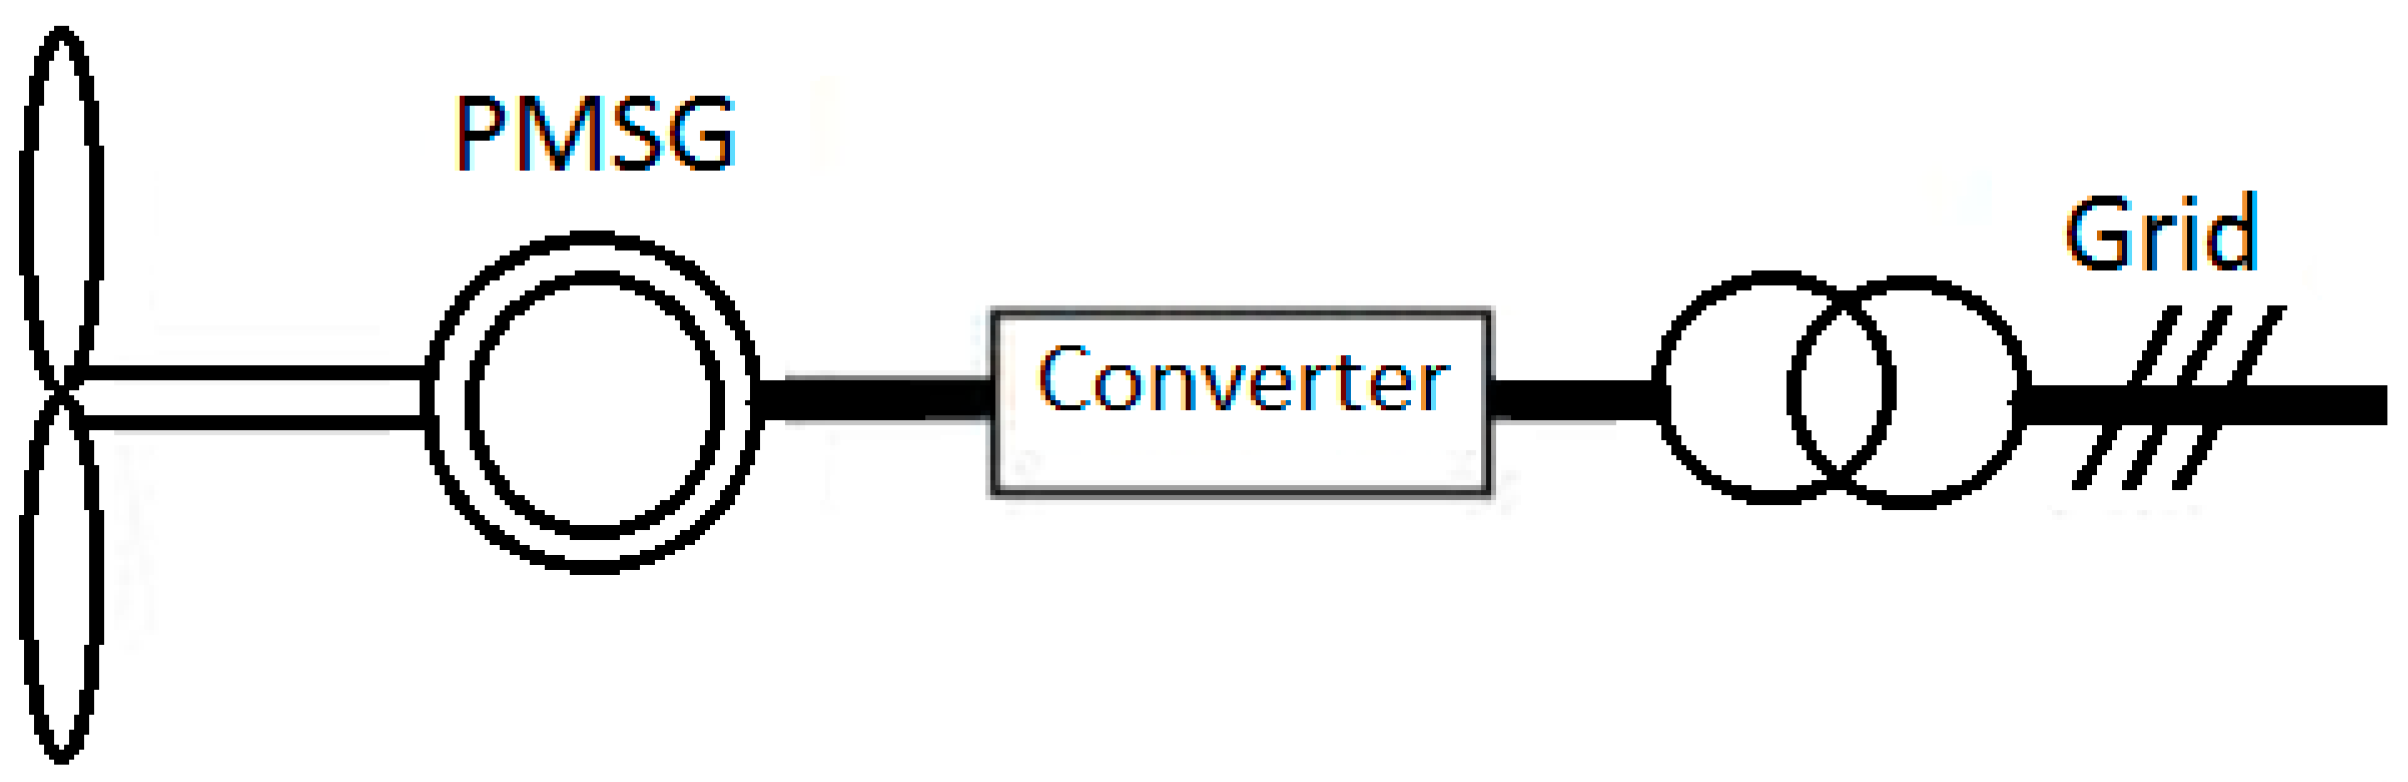
The wind DG unit is modeled as a direct drive synchronous generator. Rotor and generator shafts are mounted to the same shaft without gear-box. The generator is a permanent magnet synchronous generator designed for low speed. The permanent magnet machine dynamic model used for this study is the one embedded in Neplan simulation tool and has the parameters of
Table 6. Permanent magnet synchronous generator (PMSG) output is injected to the utility grid through back-to-back pulse width modulator (PWM) converter. The converter system ensures that both generator and grid currents are sinusoidal and it can enable for variable speed control. To achieve regulation of the current components for the grid side PWM, the regulator used ensures regulation for both d-axis and q-axis of the current components in a very fast inner control loop. Meanwhile, the slower outer control loop that regulates the reactive and active powers is used to define the current references [
32].
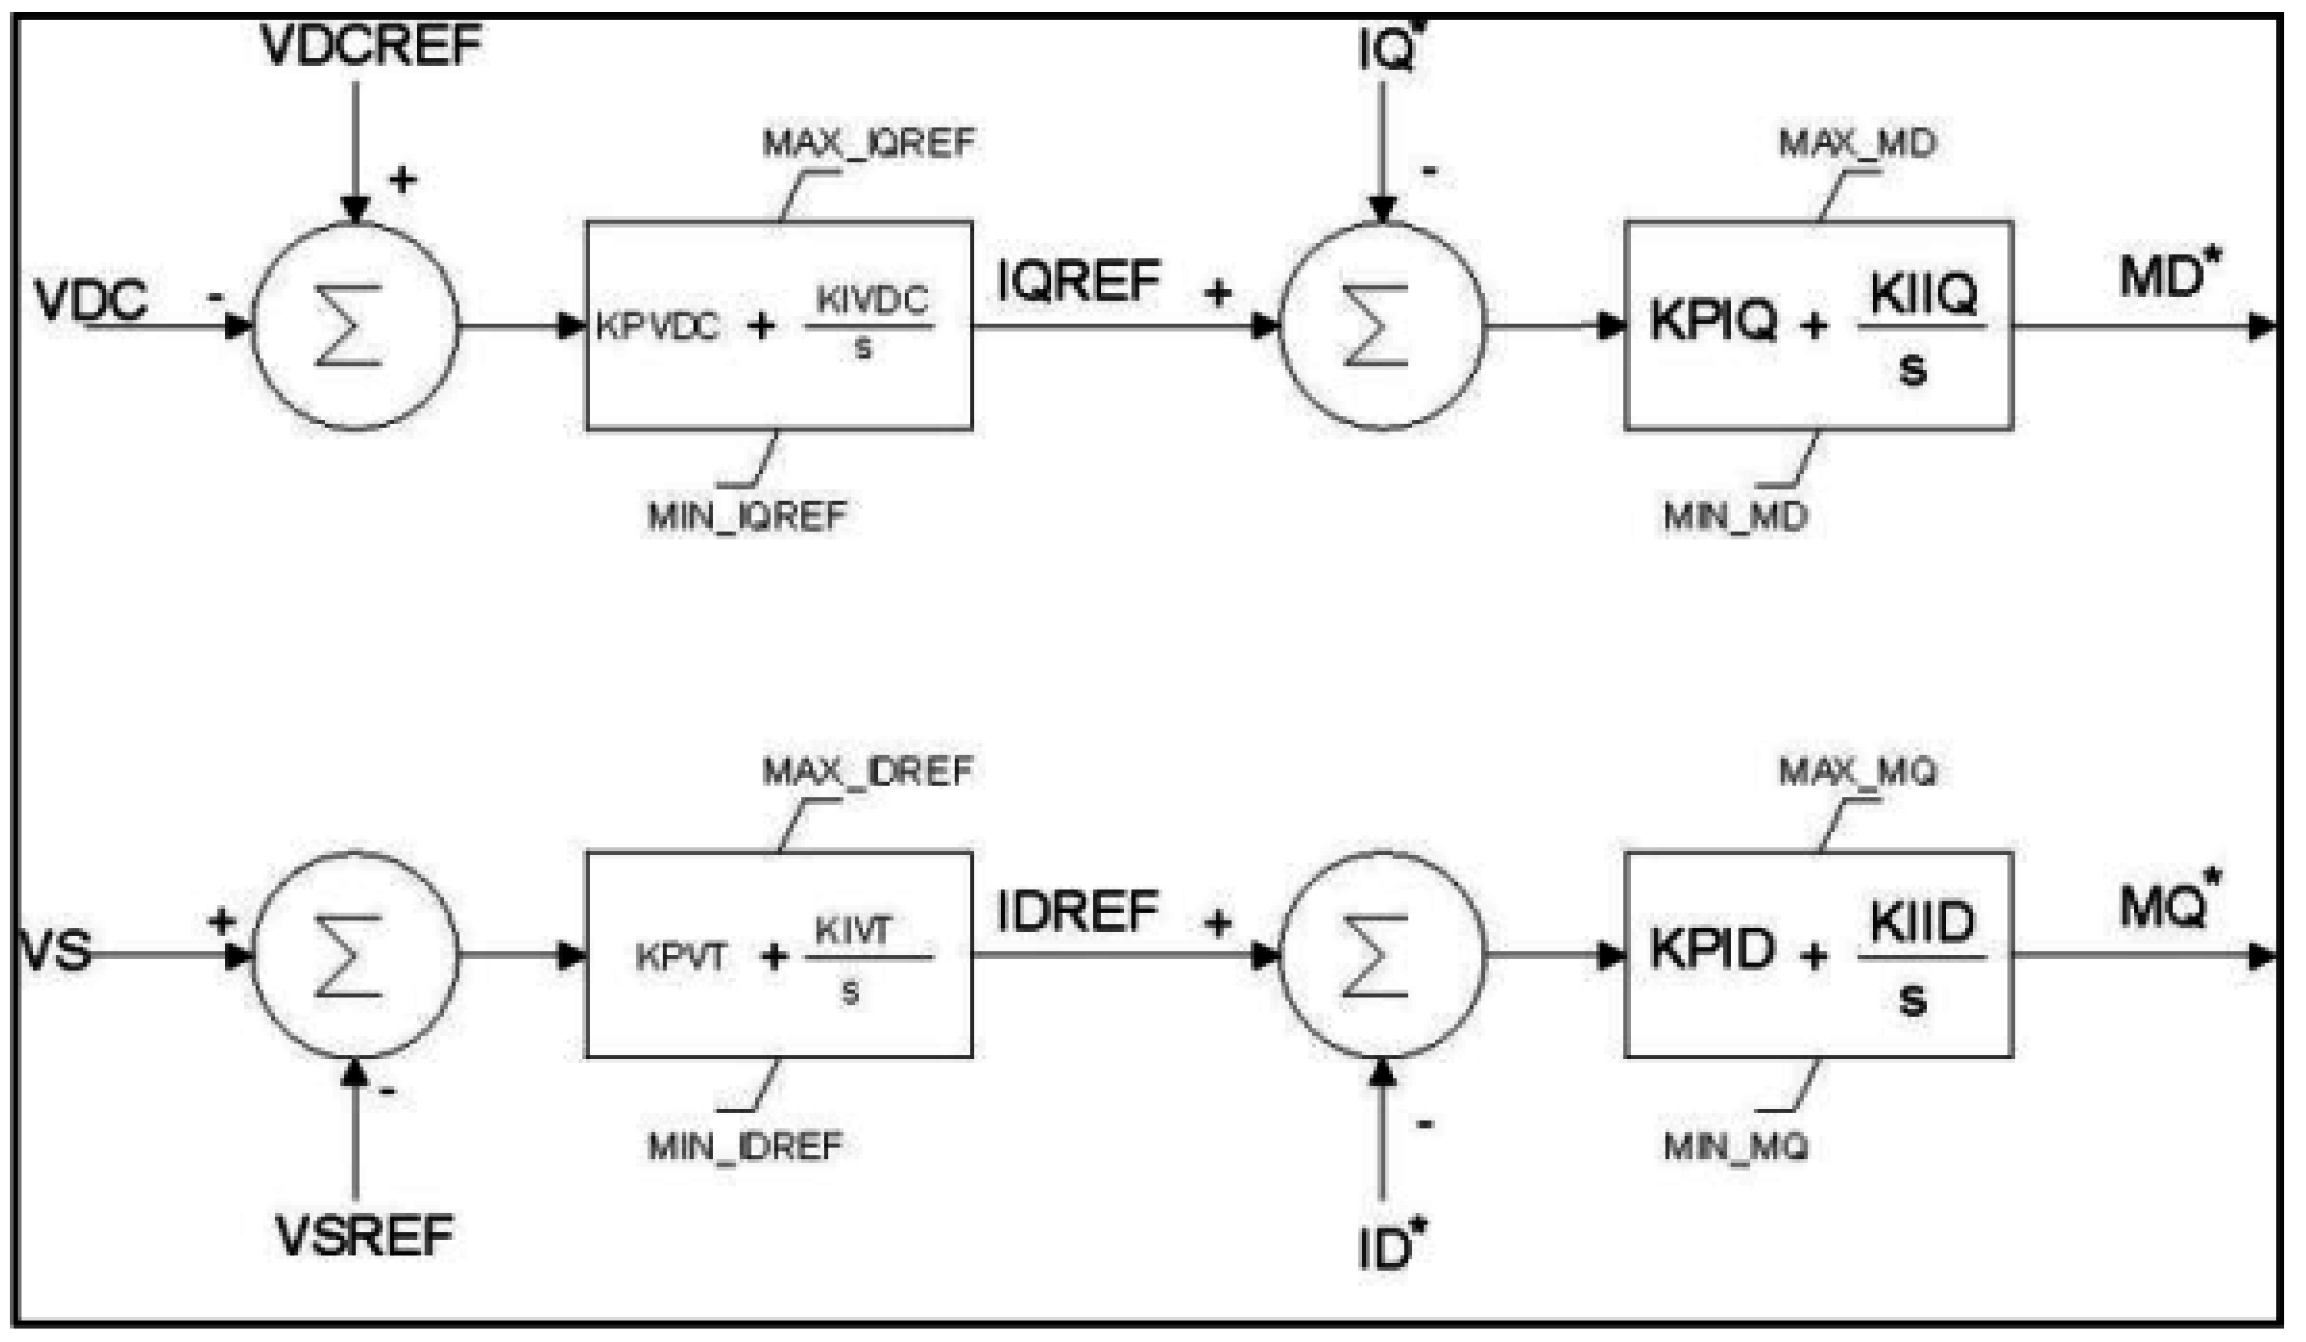
5.3. Voltage and Power Control
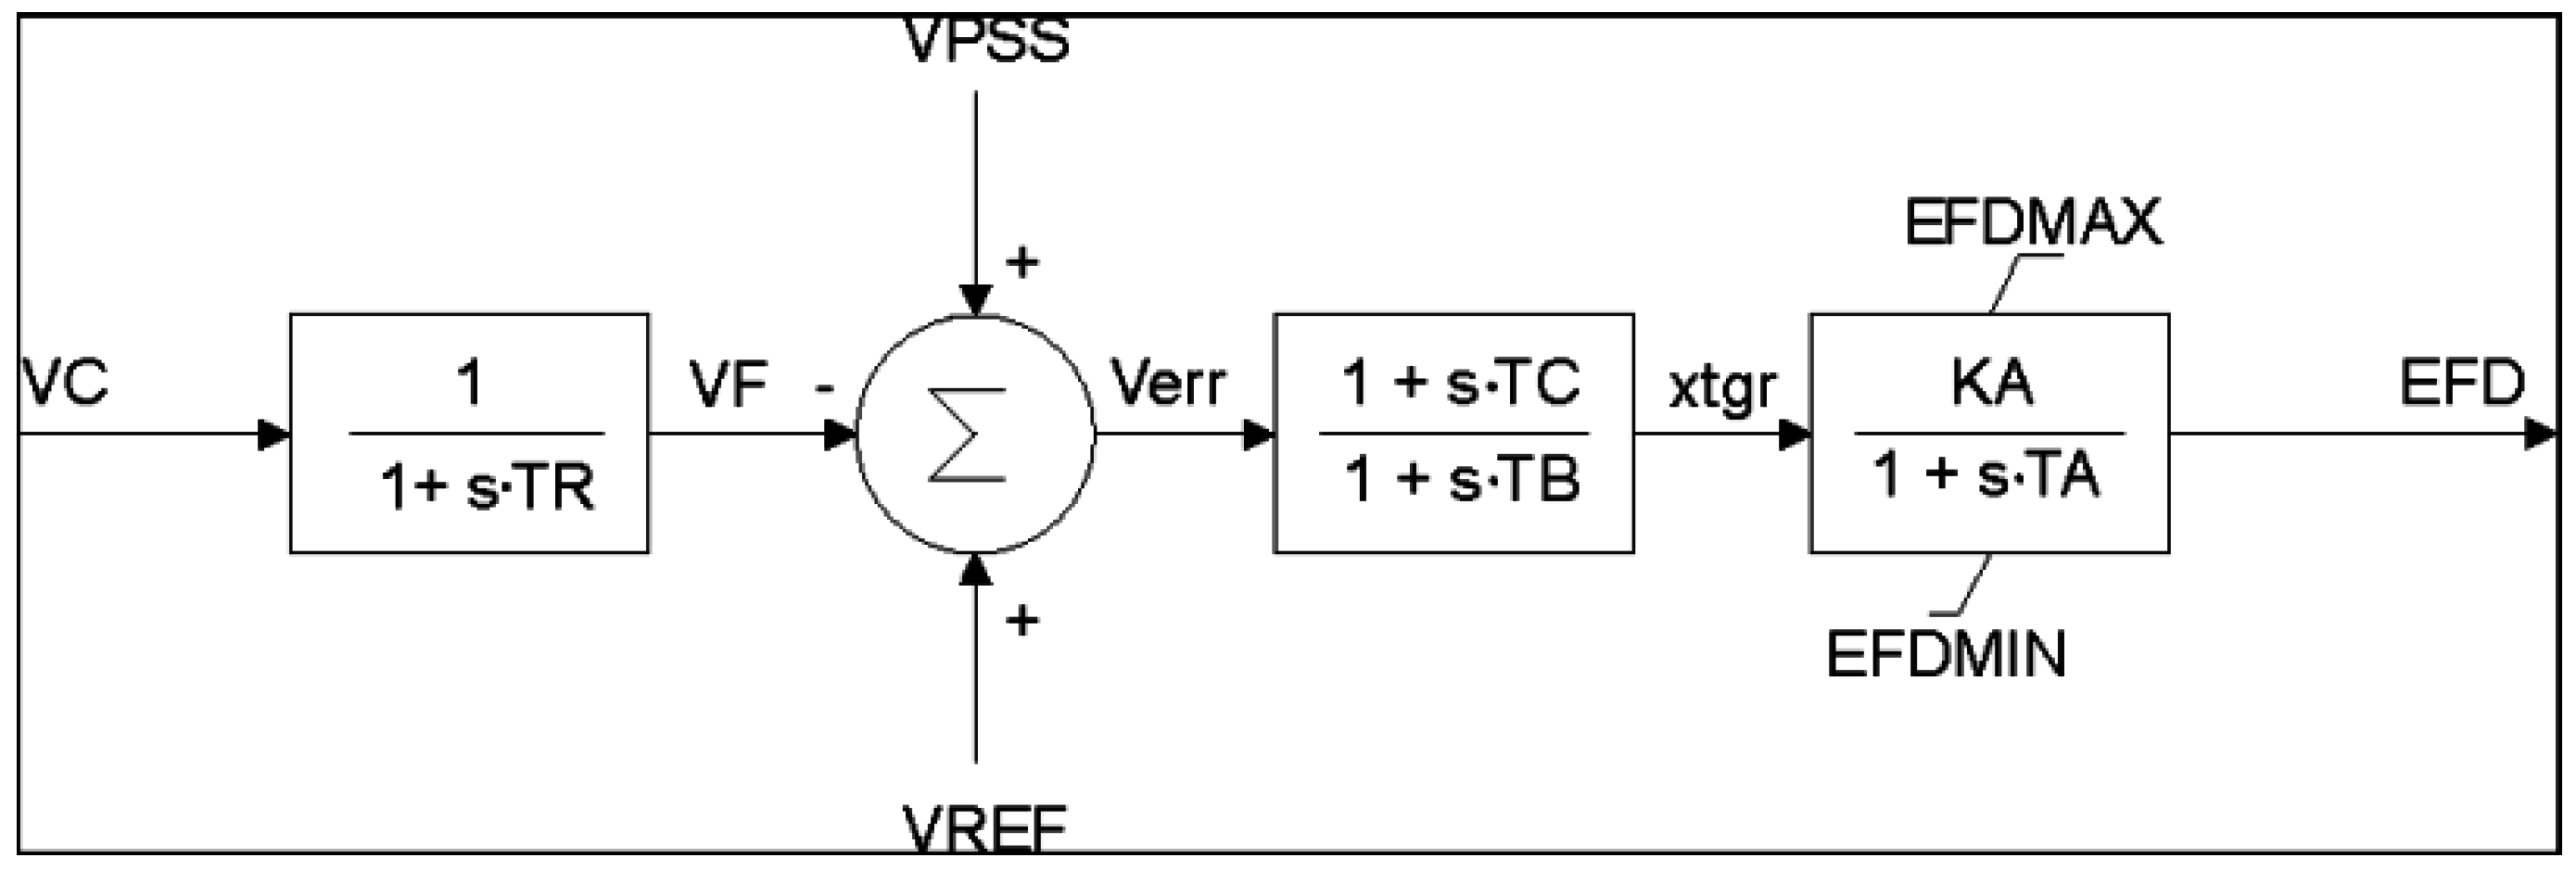
The automated voltage regulator (AVR) and excitation system used for diesel, gas and hydro units is modeled using the block diagram shown in
Figure 2 [
33]. For simplicity this model is selected from the pre-defined exciter models in Neplan under the name Simple Exciter Model with Limits. Moreover, the excitation and AVR model parameters are provided in
Table 7.
Figure 3 shows a simplified schematic of the proposed wind energy conversion system (WECS) that has been used for the purpose of wind DG units modeling [
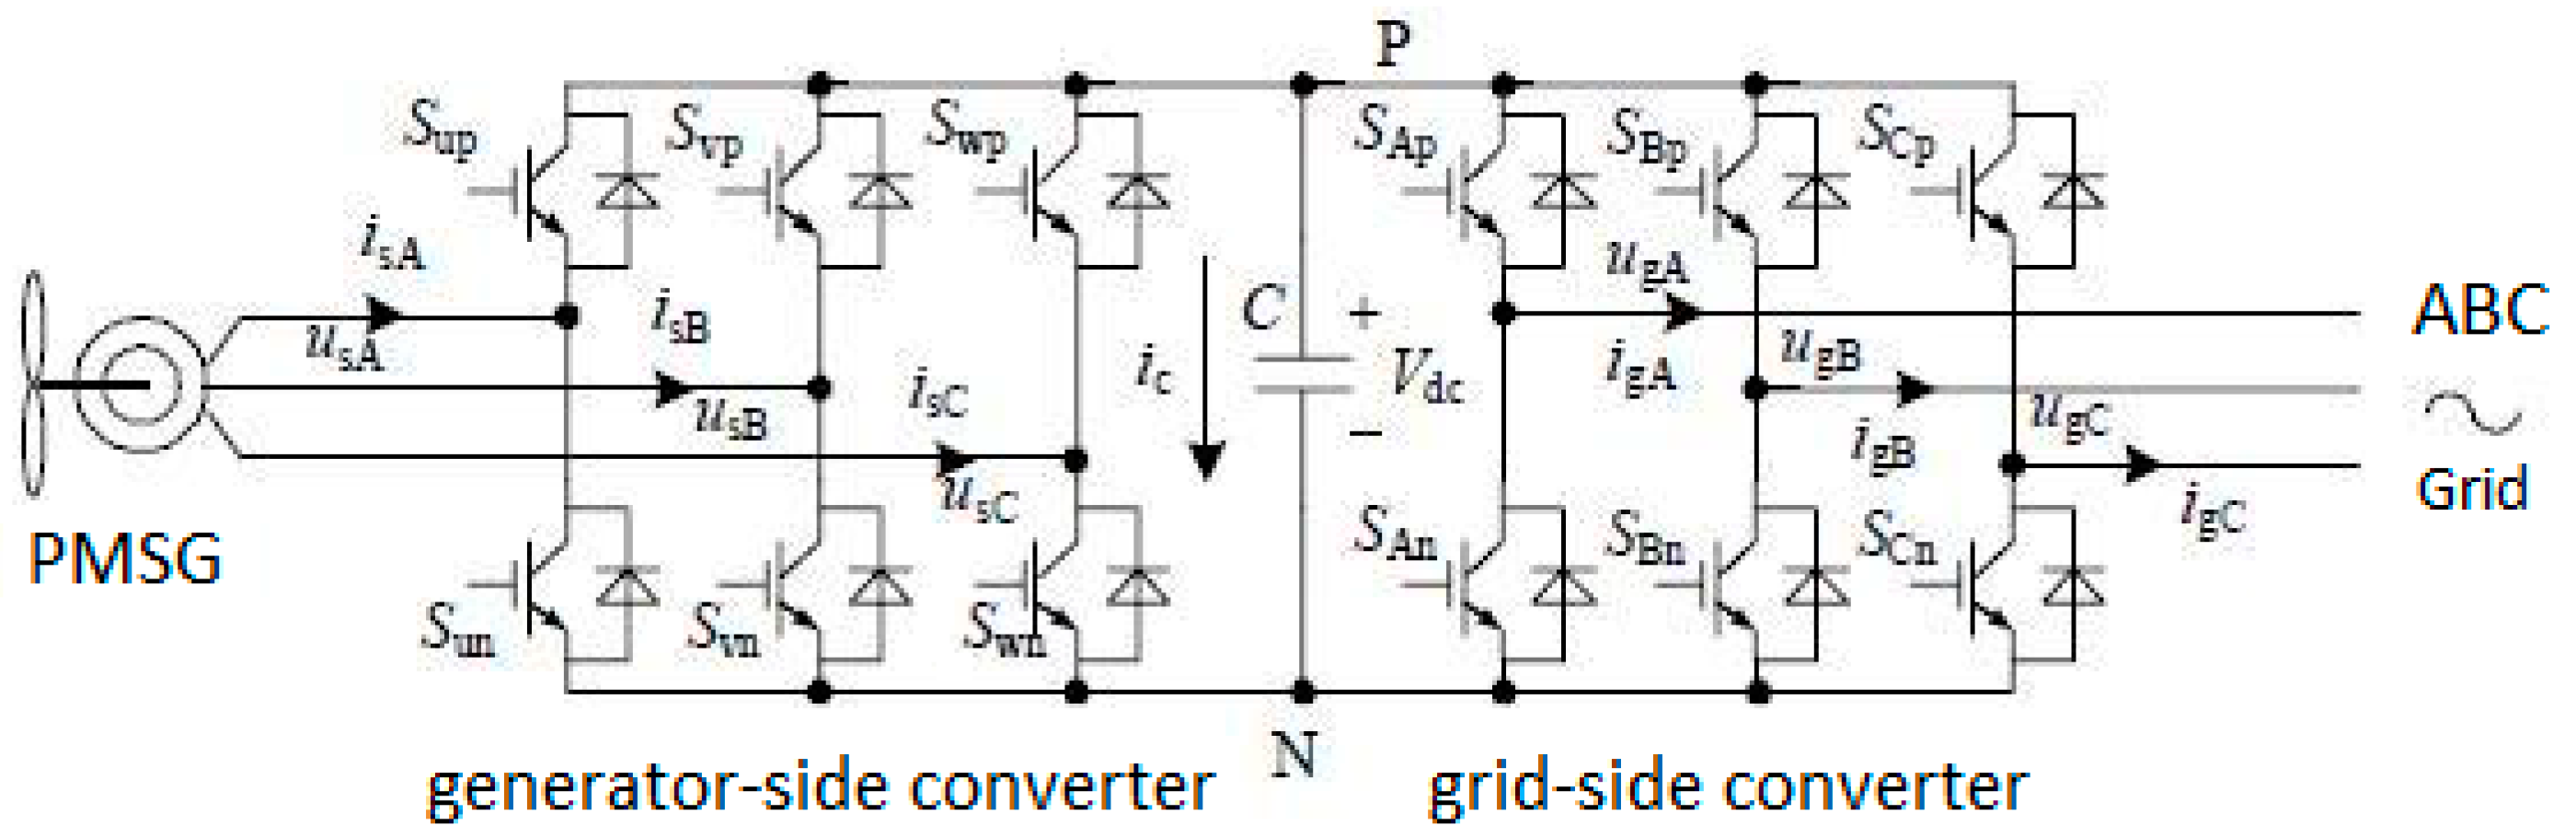
34]. Permanent magnet synchronous generator (PMSG) output is injected to the utility grid through back-to-back pulse width modulator (PWM) converter. The converter system ensures that both generator and grid currents are sinusoidal and it can enable for variable speed control. This converter system circuit topology as shown in
Figure 4 consists of two PWM converters connected together via a common DC link. Information about the principle and design of back-to back PWM used in WECS can be found in [
34,
35].
The converter to the PMSG side acts as a PWM rectifier while the converter connected to the grid side acts as PWM inverter. PWM rectifier converts the terminal voltage of PMSG into DC voltage, while an LC filter is used at the DC link in order to achieve smooth DC output. The two converters are isolated by a capacitor connected at the DC link which acts as a stiff voltage source [
36]. To achieve a settlement between both the generator and the converter ratings as well as to minify saturation, phase angle of generator current needs to be adjusted to ensure that stator terminal voltage and internal induced voltage are equal in magnitude [
34]. To achieve regulation of the current components for the grid side PWM, the regulator of
Figure 5 is used. It ensures regulation for both d-axis and q-axis of the current components in a very fast inner control loop. Meanwhile, the slower outer control loop that regulates the reactive and active powers is used to define the current references [
32].
The generator side PWM regulation is achieved through the regulator of
Figure 6. This regulator is fitted with fast current controllers as the grid side PWM regulator to ensure the regulation of both DC and AC voltages; however DC and AC voltage regulators are used to define the current references [
32].
The parameters used with the WECS components: wind turbine model, grid side PWM regulator, and generator side PWM regulator are provided in
Table 8.
6. Case Studies
The distribution network was built using Neplan Desktop power systems simulation tool and according to each case study the correspondent distributed generation technology is injected to the network on Feeder#2 to enable the study of the dynamic behavior of each DG technology following an islanding occurrence under the same operational values for the rest of the network components.
The current IEEE standards prevent the operation of distribution system in islanded conditions, where the DG unit is still supplying part of the total load within an island at the event of utility outage. This is related to system control, protection, and personnel safety issues [
25]. The current control scheme in the network normally trips the DG units within 2 s as indicated earlier in the standard voltage and frequency clearing times (
Table 2 and
Table 3). However it is assumed that those clearing times were adjusted and relaxed to enable the planned and unplanned islanding operation to run smoothly without interruption by the utility’s protection units during the tests for all of the four case studies.
The total rated system load distributed throughout Feeder#2 for the following four case studies is set to be (6.46 + j2.125) MVA, however depending on the dynamic response of the load this rated value may undergo slight changes according to the type of units presented in the island as well as the islanding method used.
For the purpose of this study, it is assumed that the DG units are considered for autonomous operation at the planning stage. This implies that all the used DG units in this study have the capability by working together for each case study within the range of their rated power to supply the total load in the islanded part of the network without affecting the island desirable operational voltage and frequency limits. This level of power redundancy ensures that no loads in the islanded part of the network have to be disconnected during the islanding mode to re-establish the generation with demand balance in real time [
36,
37].
The dynamic response of the system is studied in the four case studies by observing the changes in frequency, voltage, real power, and reactive power across the islanded section following the transition from utility connected mode to islanded mode using the load sharing islanding method.
Two transition conditions were used throughout the first three case studies using the disturbances of the dynamic transient stability module inside the used power simulation tool Neplan, these are: CB opening (in Neplan by opening a logical switch on the upper or lower side of line LIN2-1) and that demonstrated the planned islanding transition condition, while the other transition condition, the unplanned islanding, was achieved by triggering a three phase short circuit fault at line (LIN2-1) at a certain distance on the line (again by using the disturbances of dynamic transient stability module in Neplan) and that caused the line to be tripped from both sides after some deci-seconds due to the assumed protection scheme used by the local utility. As for the forth case study, only one transition condition was used in order to less complicate the case, hence only the planned islanding transition was used.
6.1. Case Study A: Islanding of Diesel Only Units
In this case study all four DG units (GEN1, GEN2, GEN3, GEN4) are diesel based units connected to buses N2_4, N2_7, N2_9, and N2_11 respectively as illustrated in
Figure 1. Tests were carried out and results were obtained according to the following sub-case scenarios:
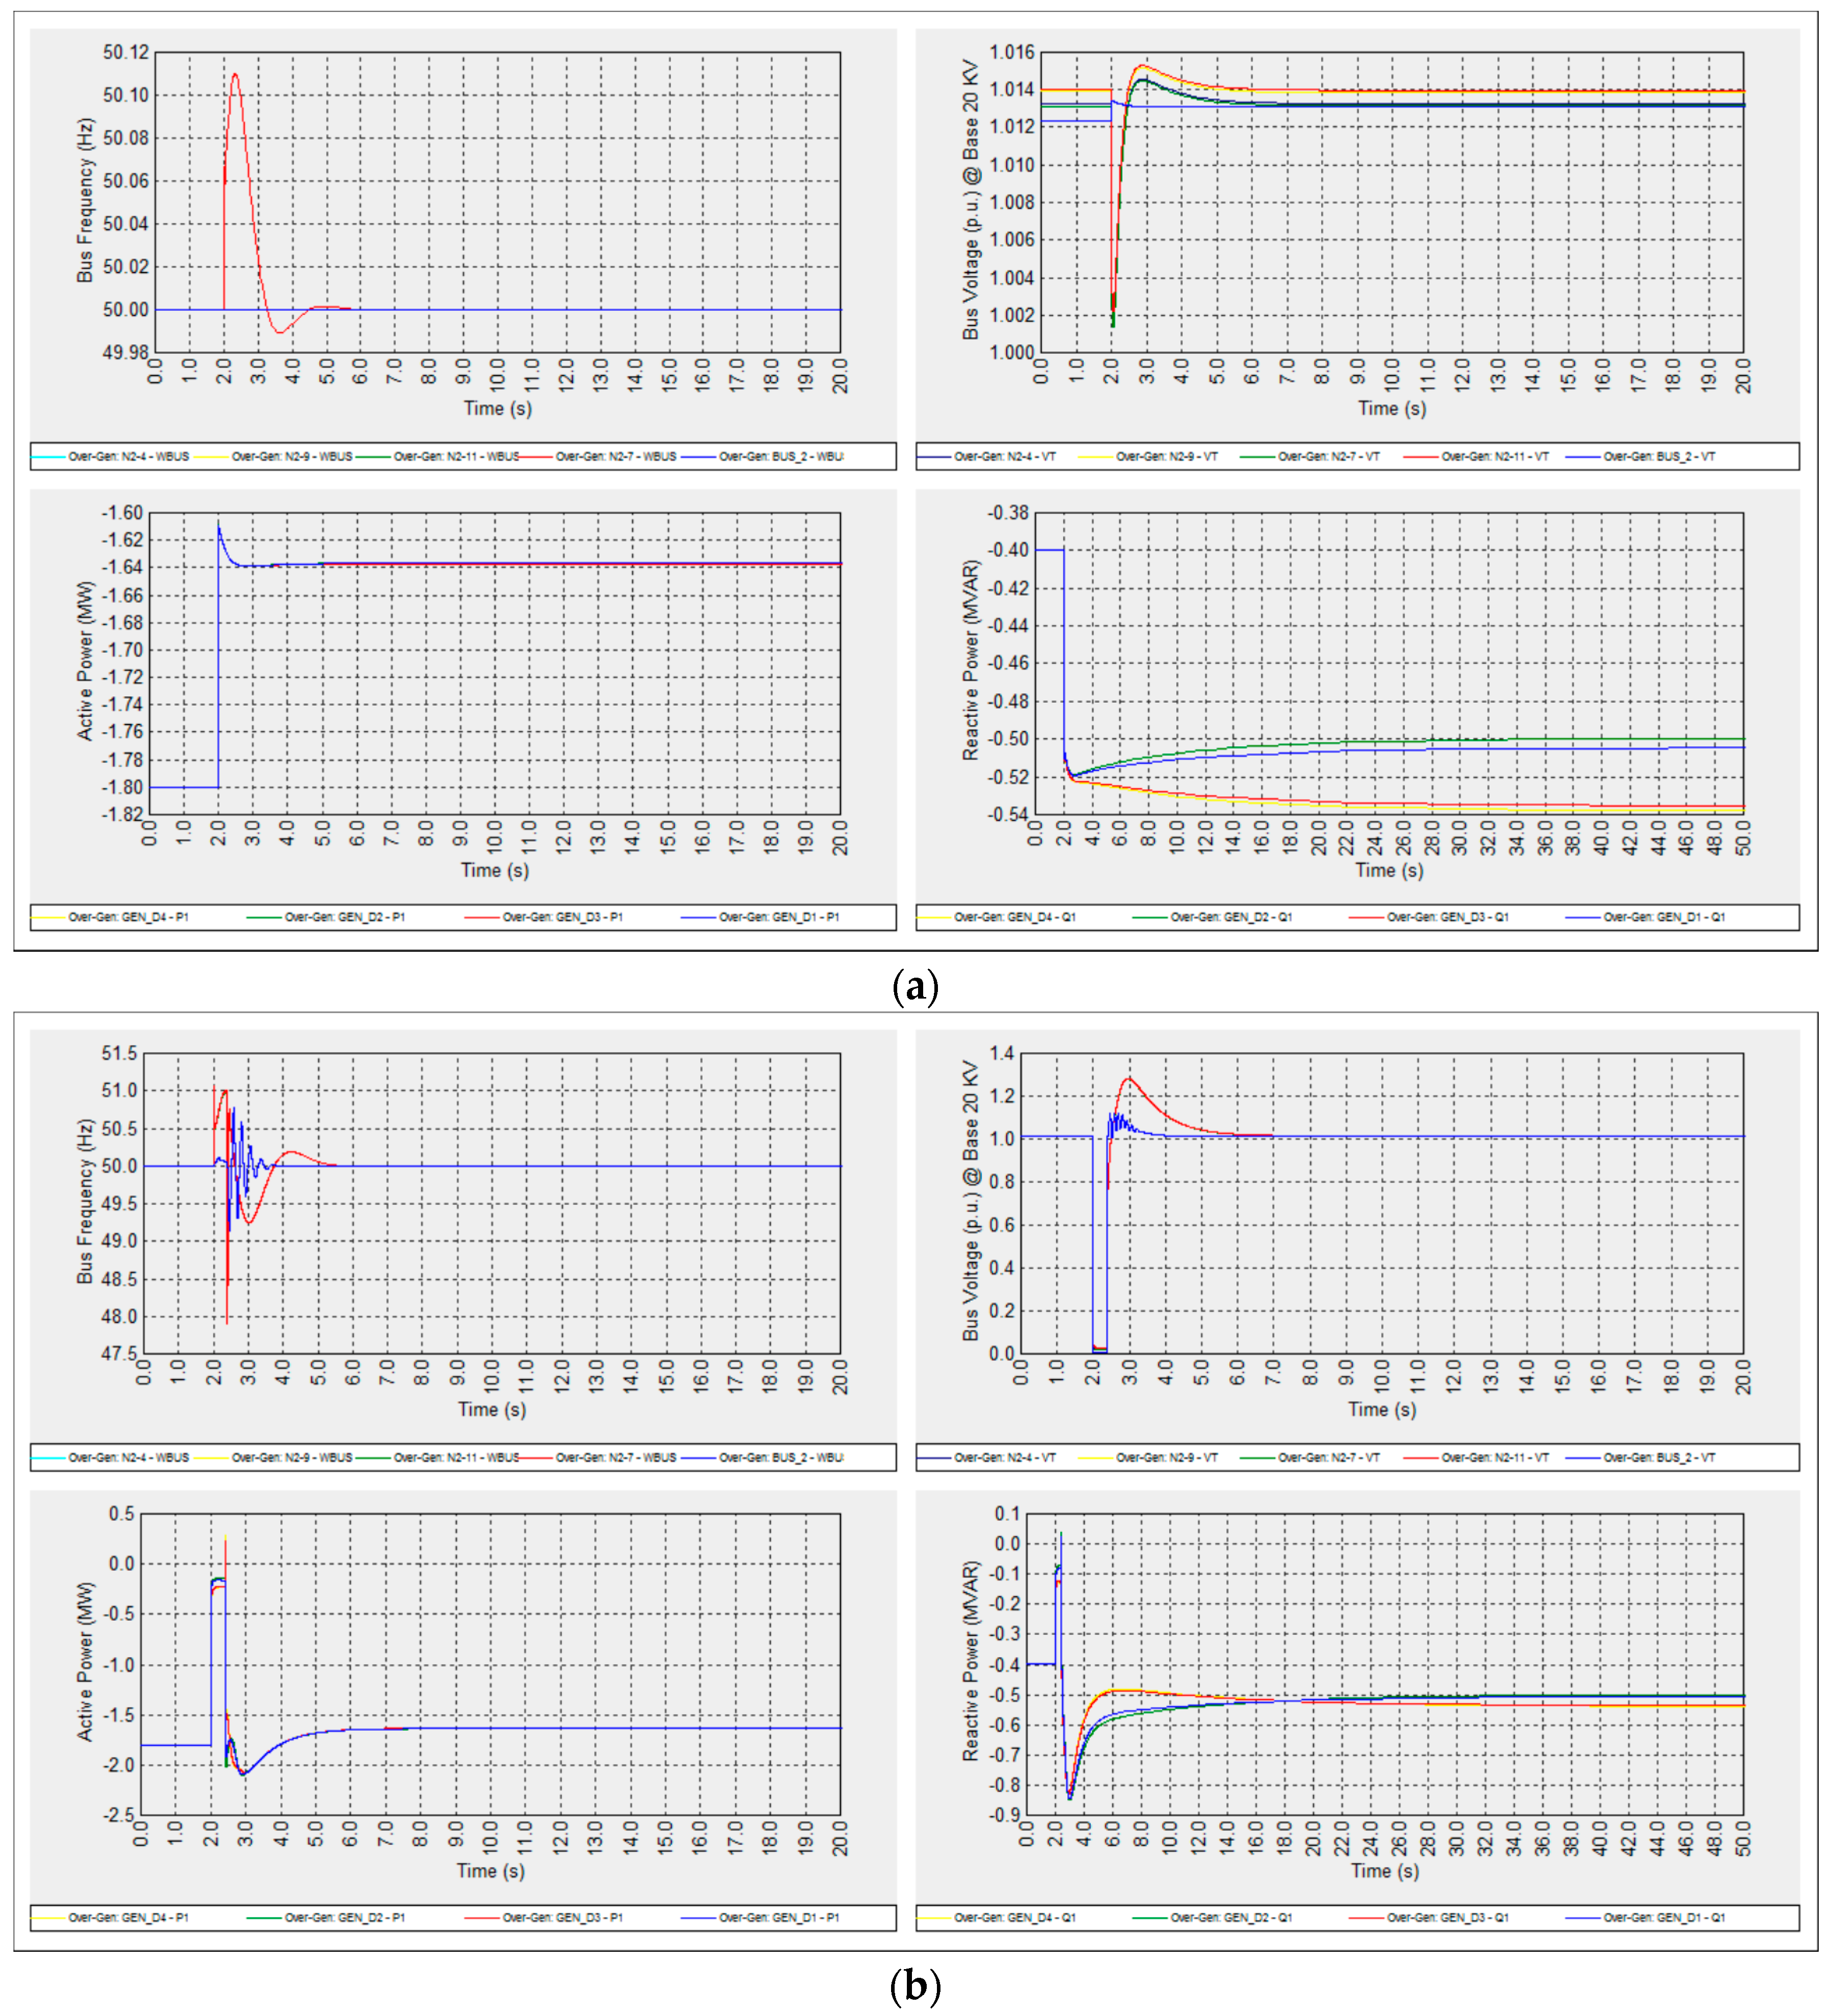
6.1.1. Over-Generation Mode (11.45% Power Mismatch) (Case A1)
This case was with 60% of their rated capacity at almost 0.98 PF (i.e., (1.8 + j0.4) MVA), this situation made the islanded section of the network to operate in the over-generation level with (7.2/6.46 MW) Generation to load ratio with around 11.455% real power mismatch, that residual power was exported to the utility grid during grid-connected mode. There are two sub-case scenarios, the planned islanding of the diesel units (case A1.1) and the unplanned islanding of the diesel units (case A1.2), whose results are shown in
Figure 7a,b, respectively.
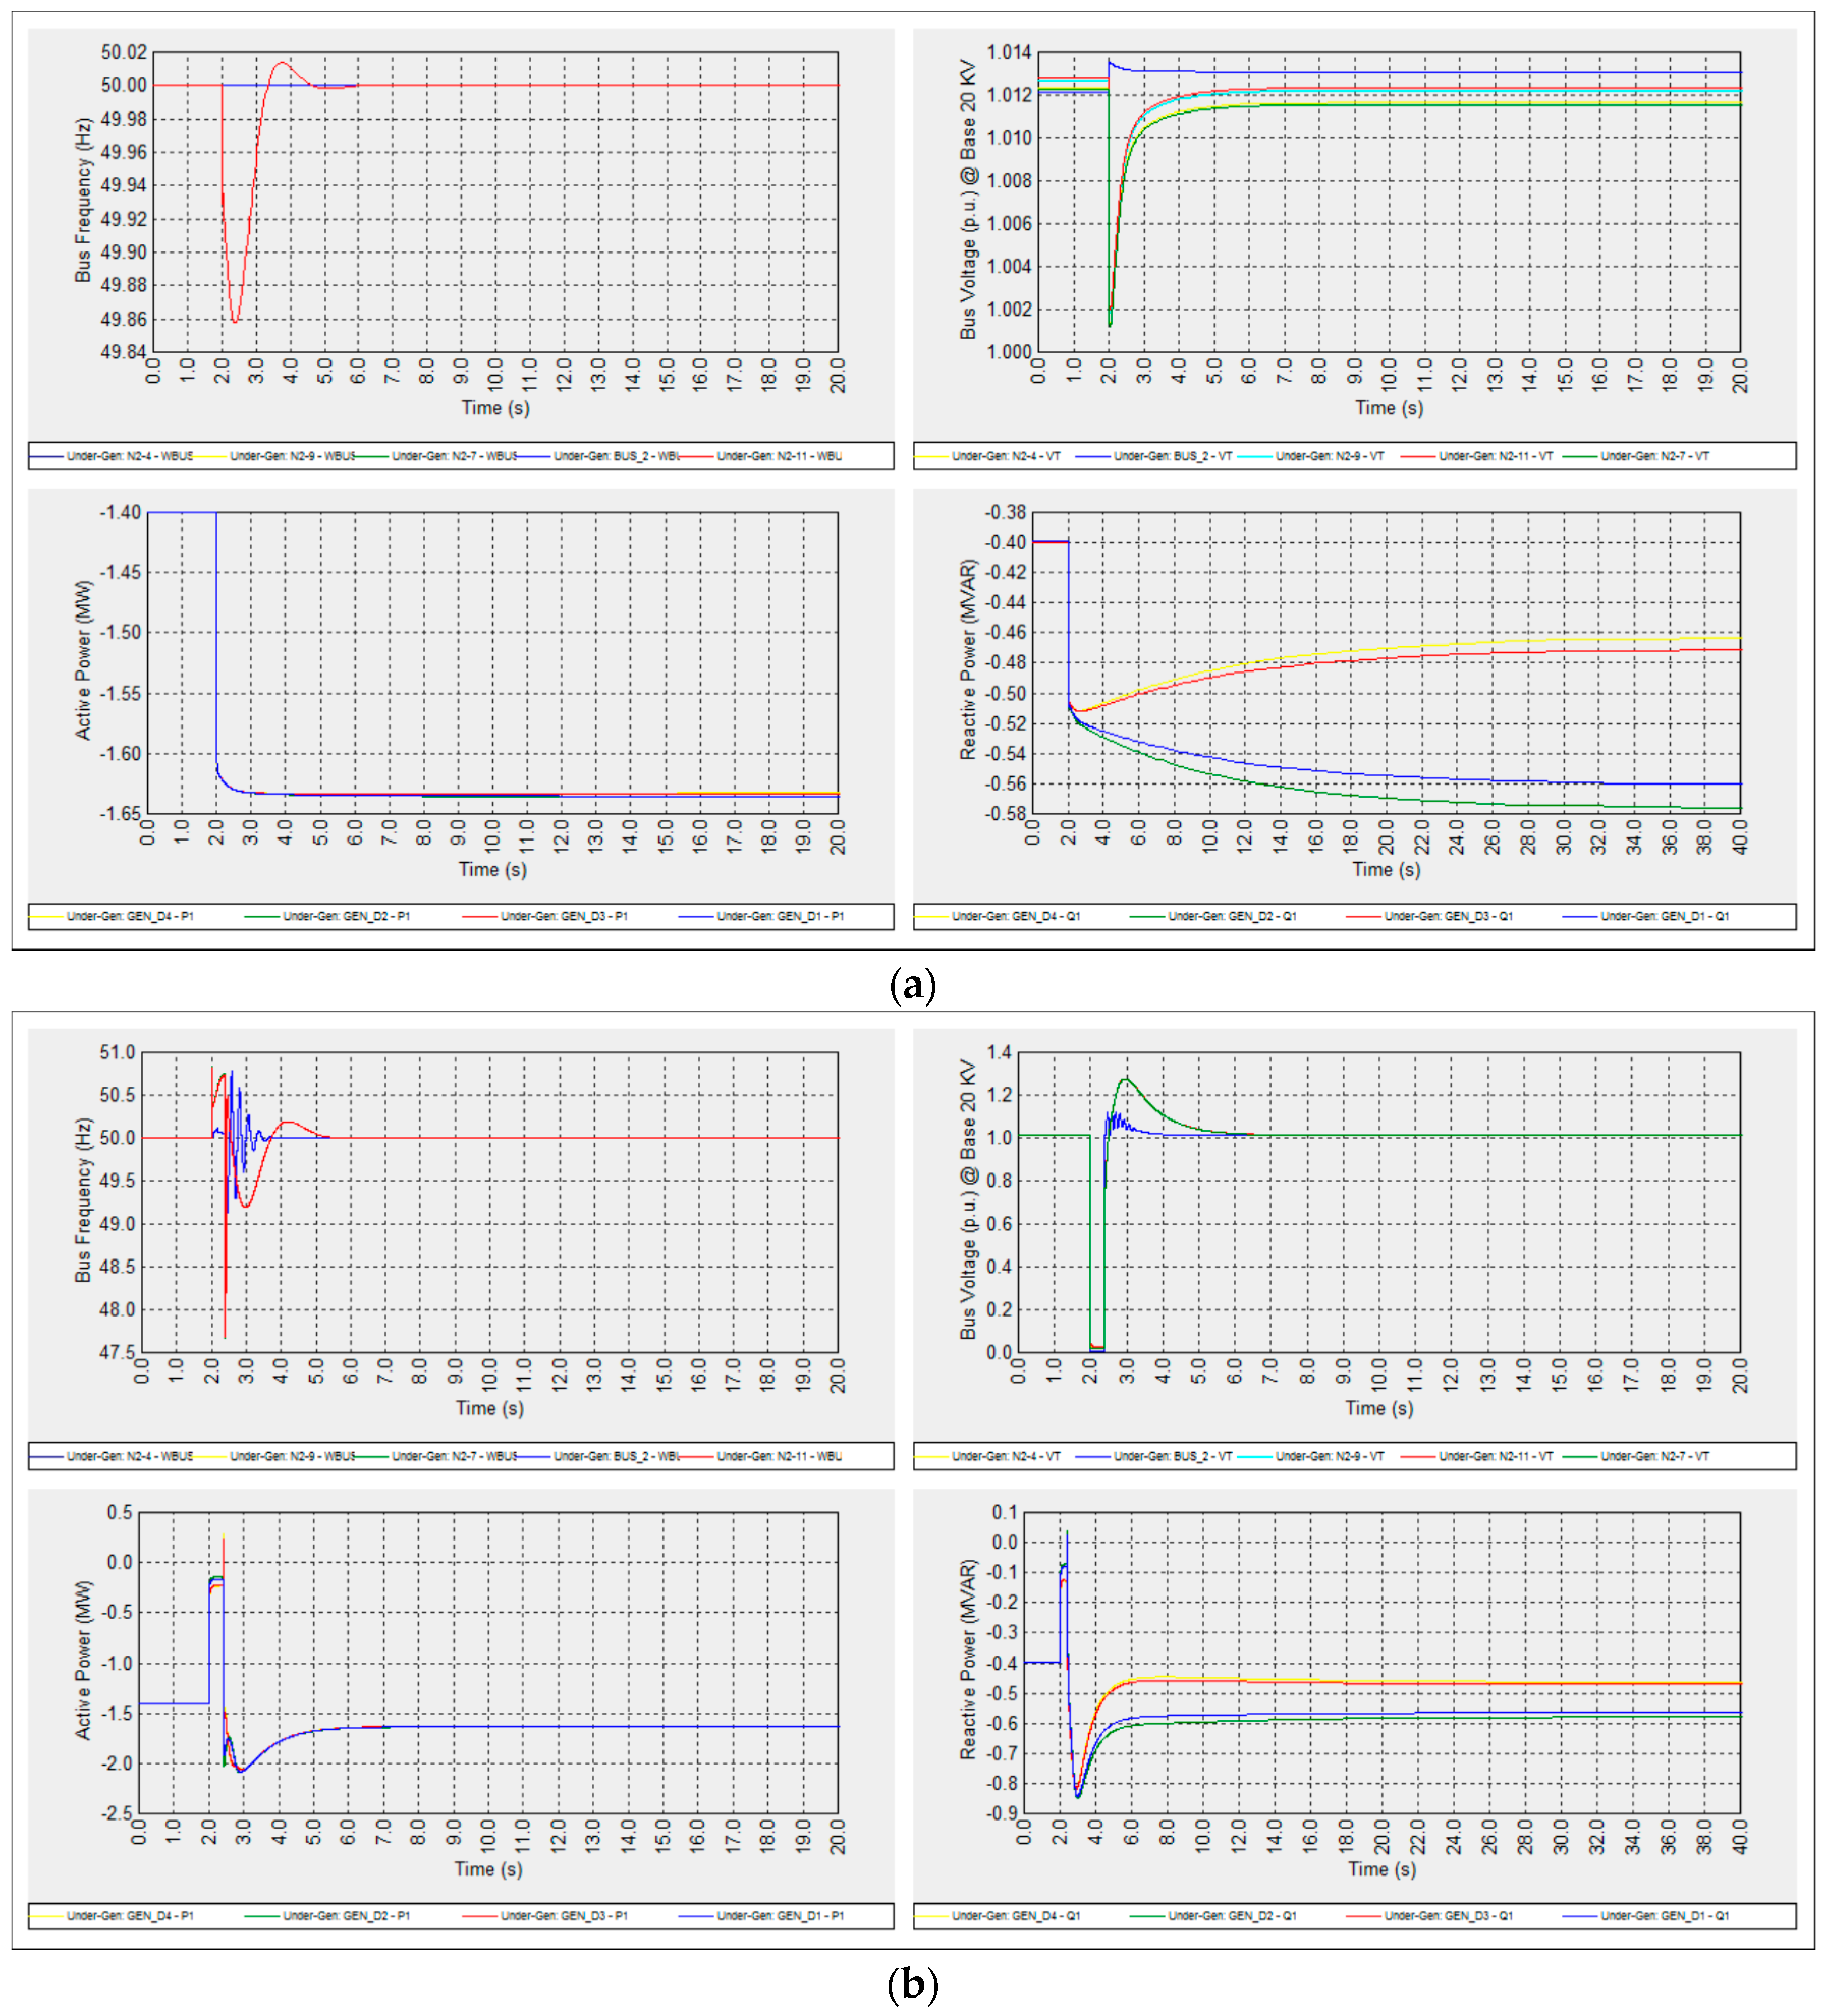
6.1.2. Under-Generation Mode (13.31% Power Mismatch) (Case A2)
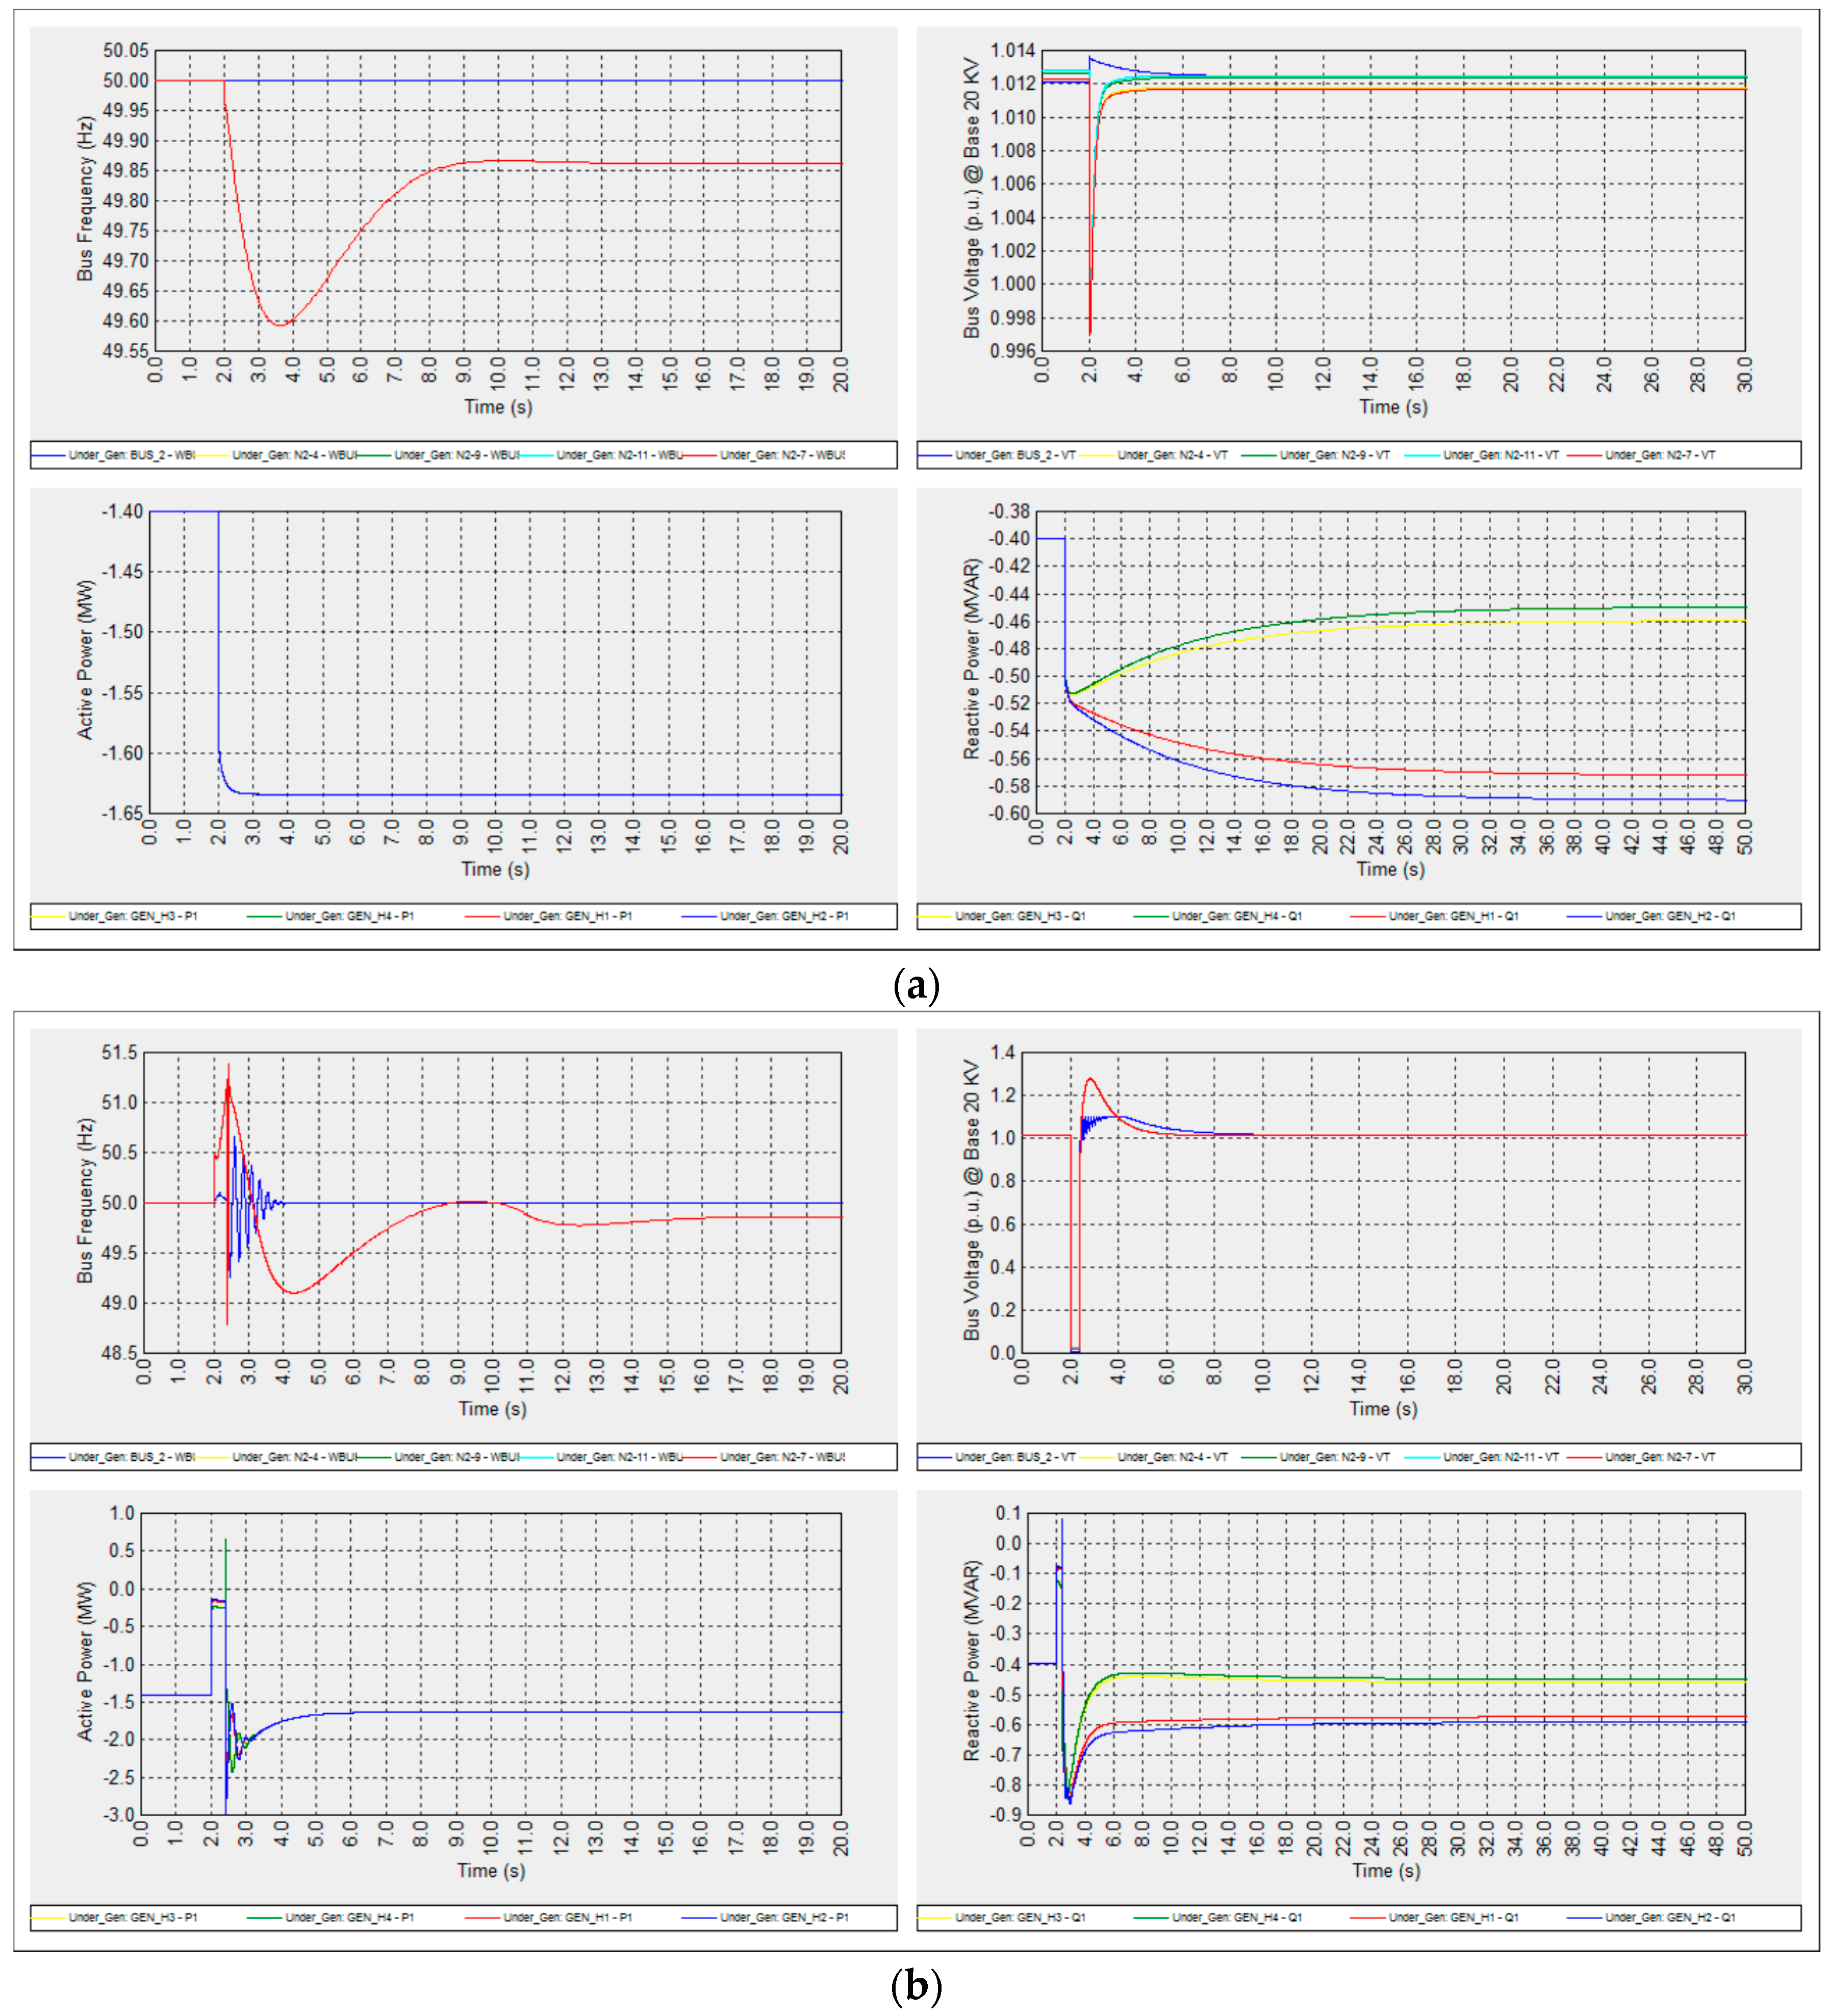
In this loading case the diesel units were with 46.66% of their rated capacity at approximately 0.96 PF (i.e., (1.4 + j0.4) MVA), this loading level ensured that the islanded section operated in the under-generation level with (5.6/6.46 MW) generation to load ratio. This situation enforced Feeder#2 to import the remaining gap in real power from the utility grid whilst still operating in the grid-connected mode since there was a 13.31% real power mismatch between generation and load. There were two sub-case scenarios, the planned islanding of the diesel units (case A2.1) and the unplanned islanding of the diesel units (case A2.2), whose results are shown in
Figure 8a,b, respectively.
6.2. Case Study B: Islanding of Gas Only Units
In this case study all four DG units (GEN1, GEN2, GEN3, GEN4) are gas type units connected to buses N2_4, N2_7, N2_9, and N2_11 respectively as illustrated in
Figure 1. Tests were carried out and results were obtained according to the following sub-case scenarios.
6.2.1. Over-Generation Mode (11.45% Power Mismatch) (Case B1)
Similar to the case A1 there was a generation to load ratio with around 11.455% real power mismatch. There were two sub-case scenarios, the planned islanding of the diesel units (case B1.1) and the unplanned islanding of the diesel units (case B1.2), whose results are shown in
Figure 9a,b respectively.
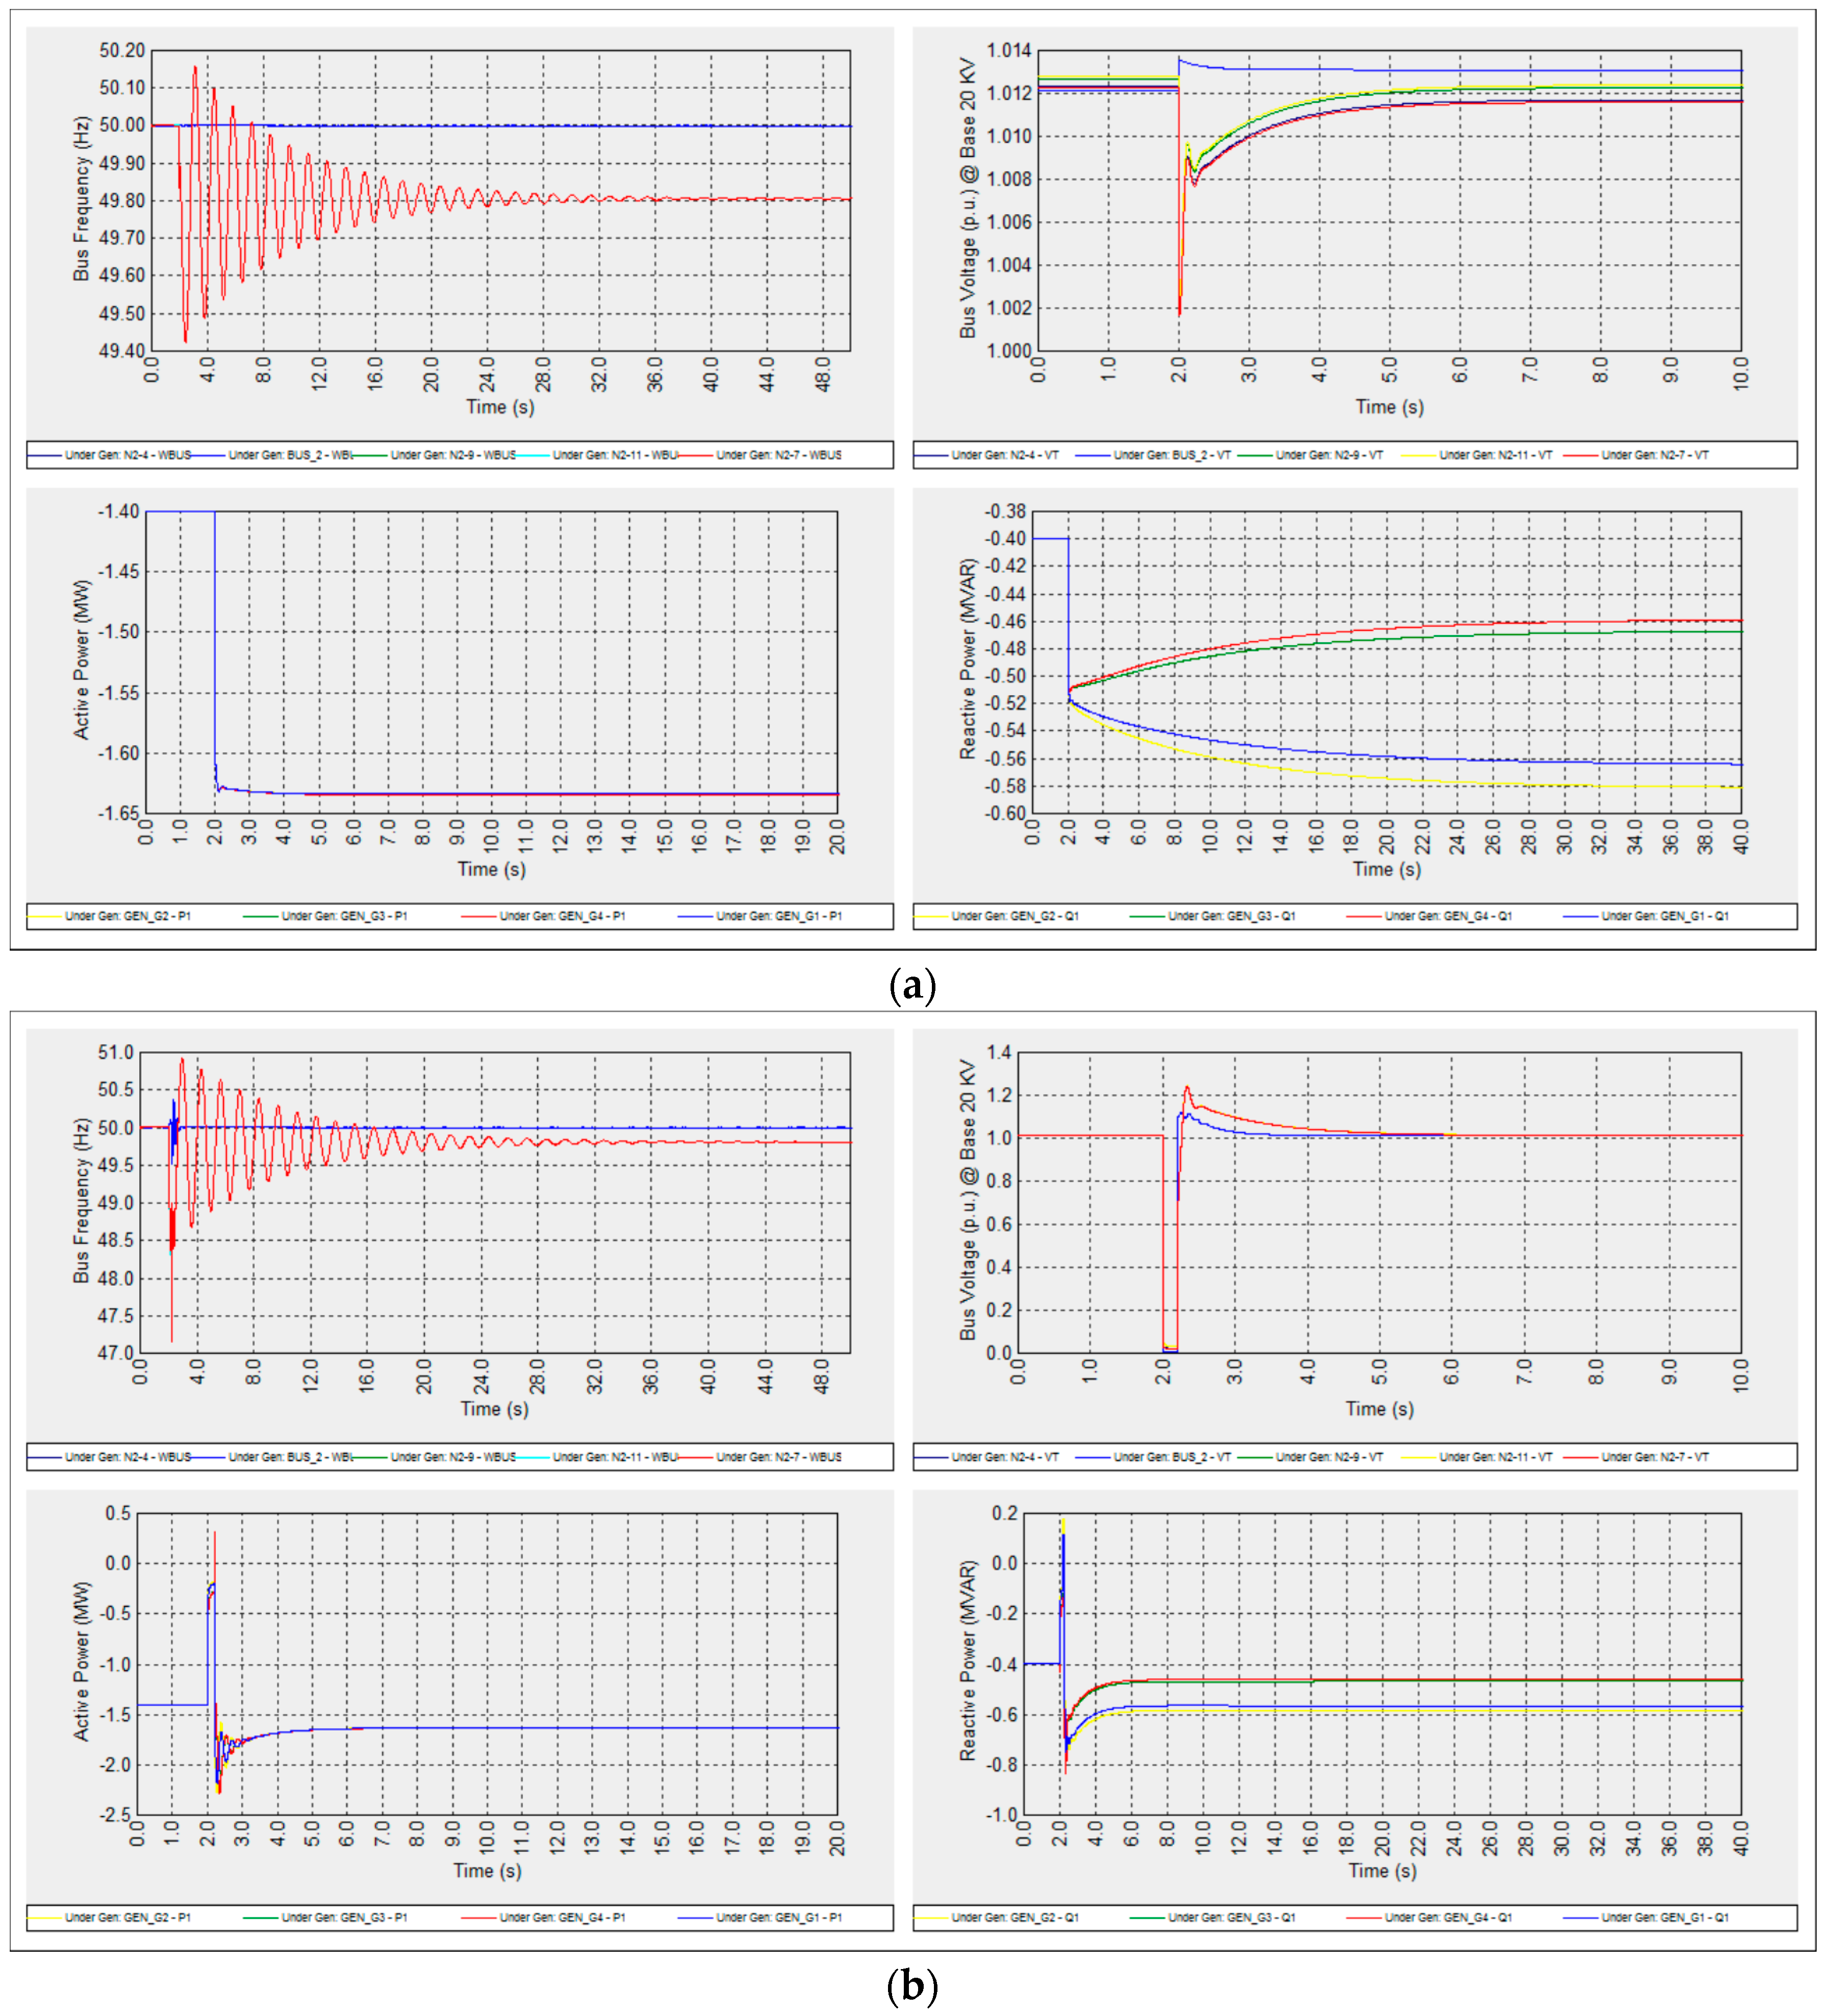
6.2.2. Under-Generation Mode (13.31% Power Mismatch) (Case B2)
Similar to the A2 case there was a 13.31% real power mismatch between generation and load. There were two sub-case scenarios, the planned islanding of the diesel units (case B2.1) and the unplanned islanding of the diesel units (case B2.2), whose results are shown in
Figure 10a,b, respectively.
6.3. Case Study C: Islanding of Hydro Only Units
In this case study all four DG units (GEN1, GEN2, GEN3, GEN4) are hydroelectric units connected to buses N2_4, N2_7, N2_9, and N2_11 respectively as illustrated in
Figure 1. Tests were carried out and results were obtained according to the following sub-case scenarios:
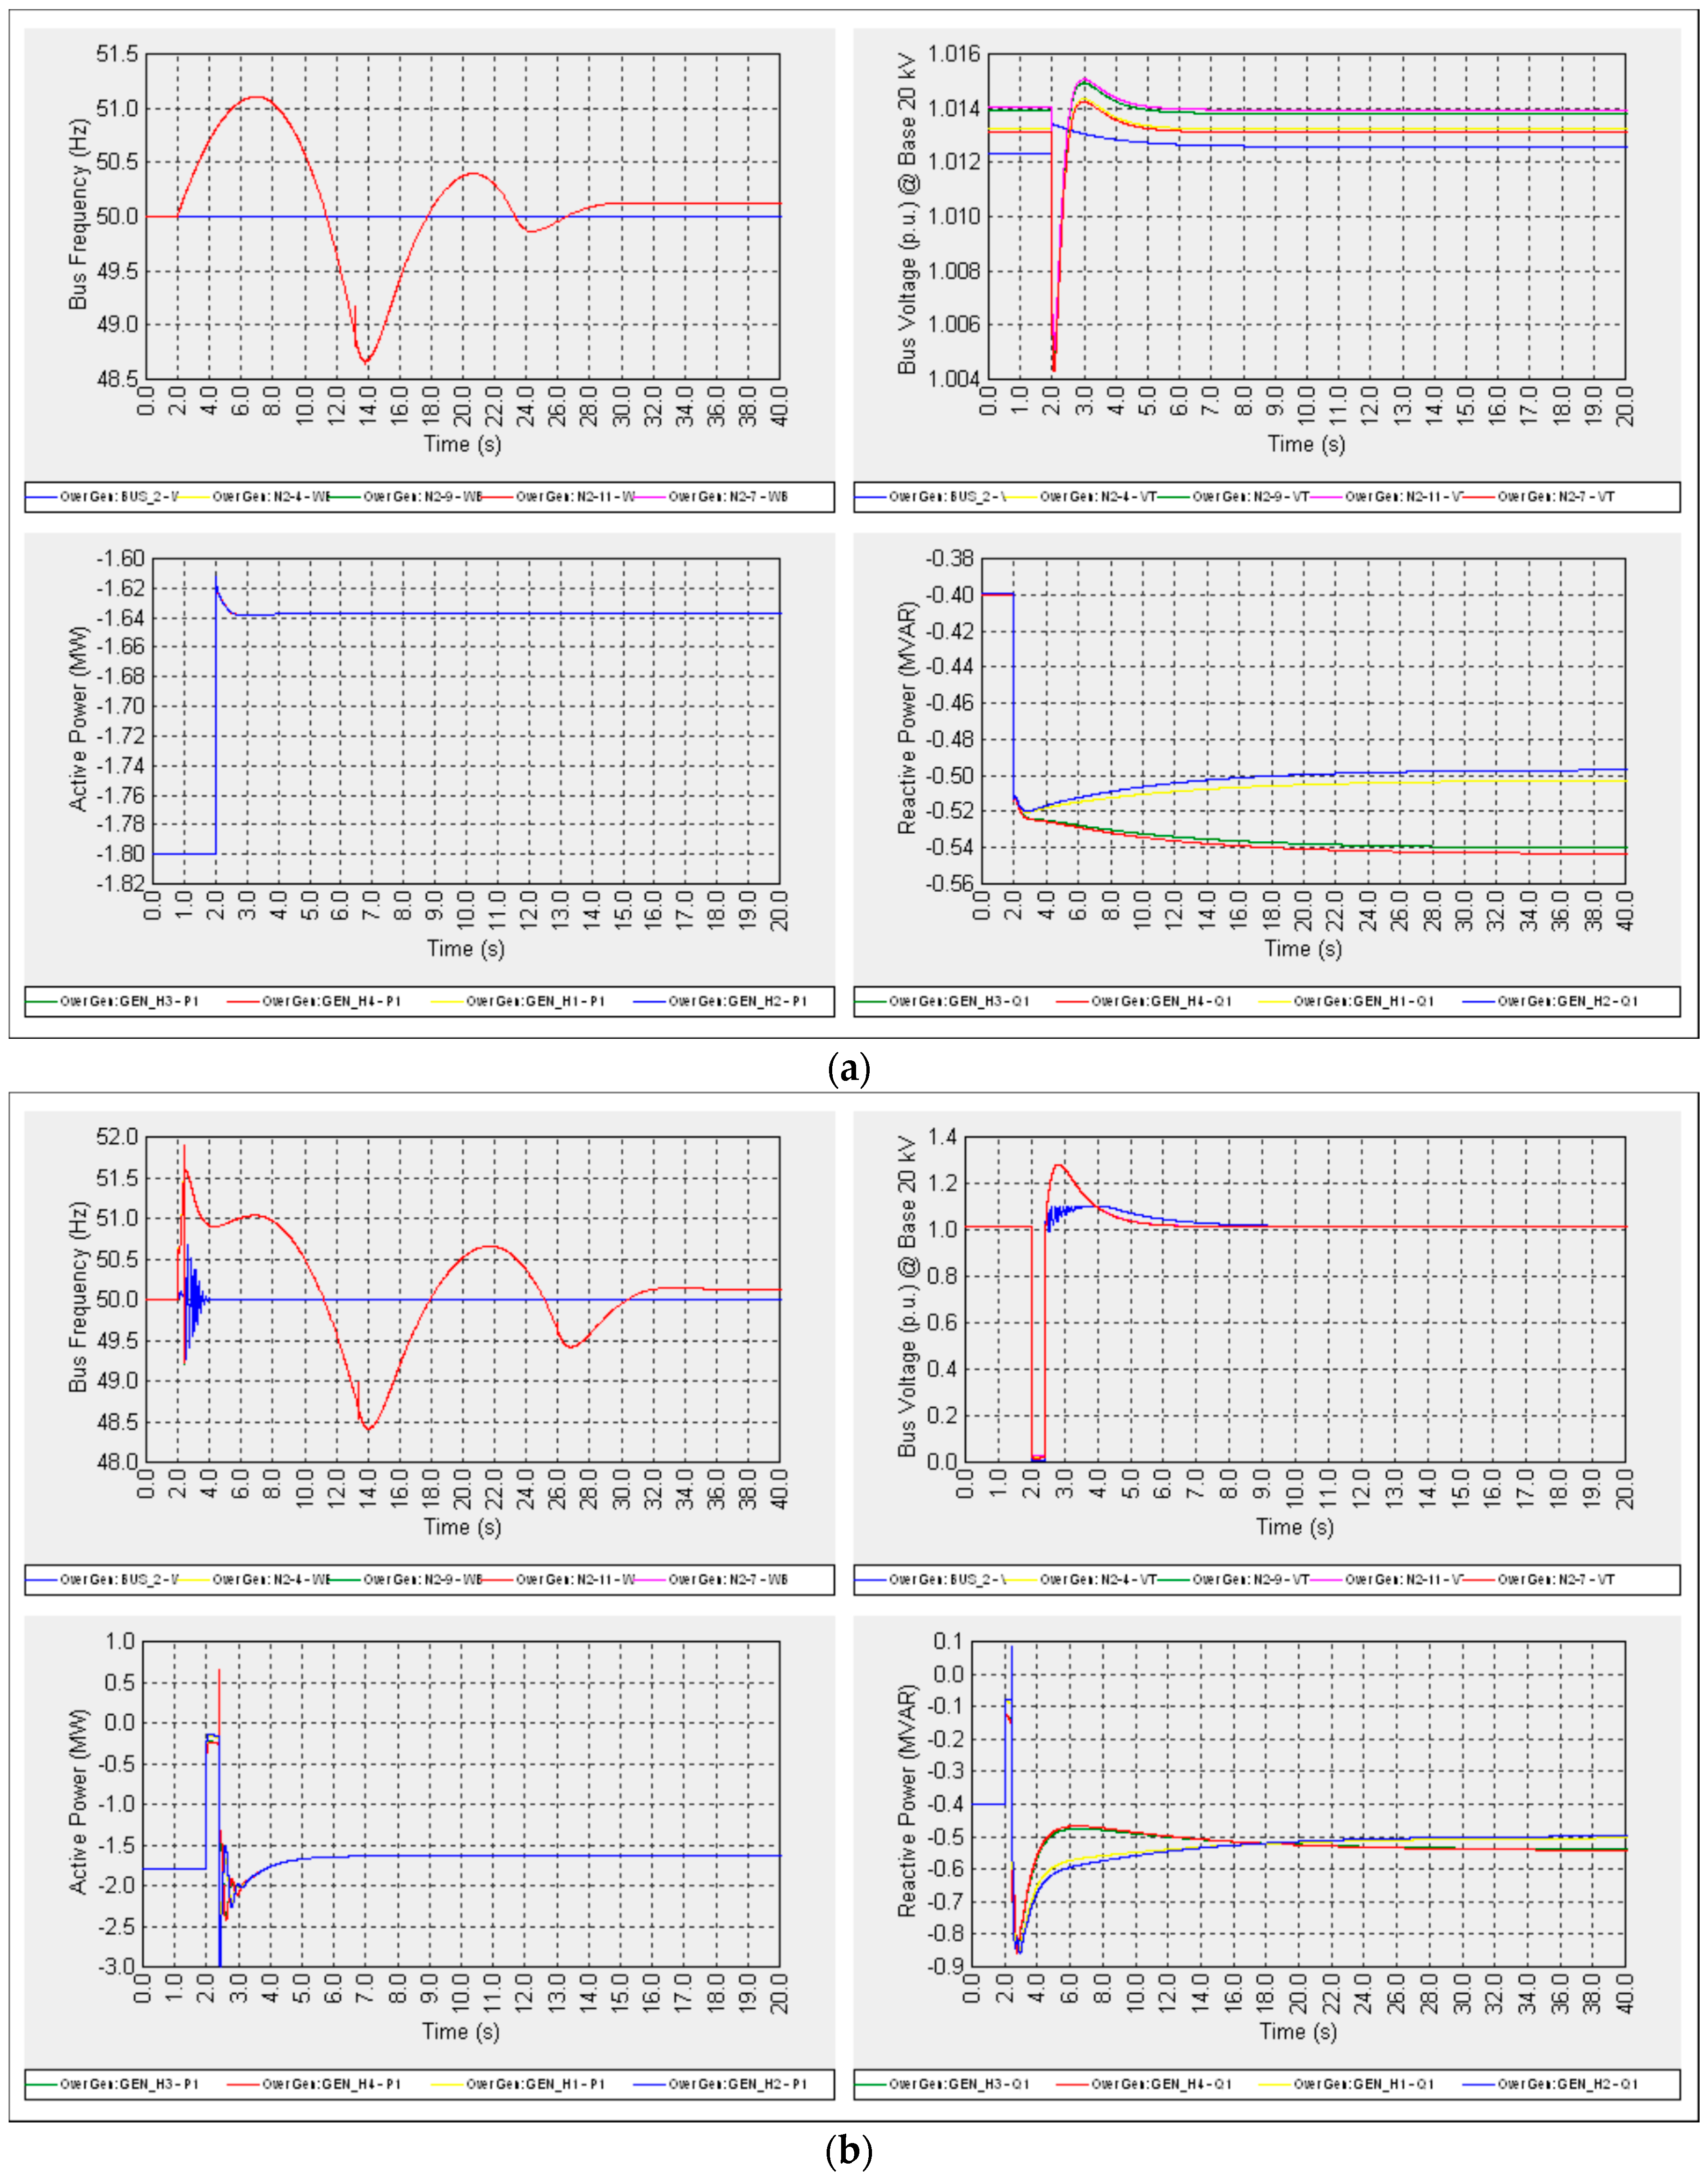
6.3.1. Over-Generation Mode (11.45% Power Mismatch) (Case C1)
Similar to the case A1 there was a generation to load ratio with around 11.455% real power mismatch. There were two sub-case scenarios, the planned islanding of the diesel units (case C1.1) and the unplanned islanding of the diesel units (case C1.2), whose results are shown in
Figure 11a,b, respectively.
6.3.2. Under-Generation Mode (13.31% Power Mismatch) (Case C2)
Similar to the A2 case there was a 13.31% real power mismatch between generation and load. There were two sub-case scenarios, the planned islanding of the diesel units (case C2.1) and the unplanned islanding of the diesel units (case C2.2), whose results are shown in
Figure 12a,b, respectively.
6.4. Case Study D: Islanding of Mixed Units
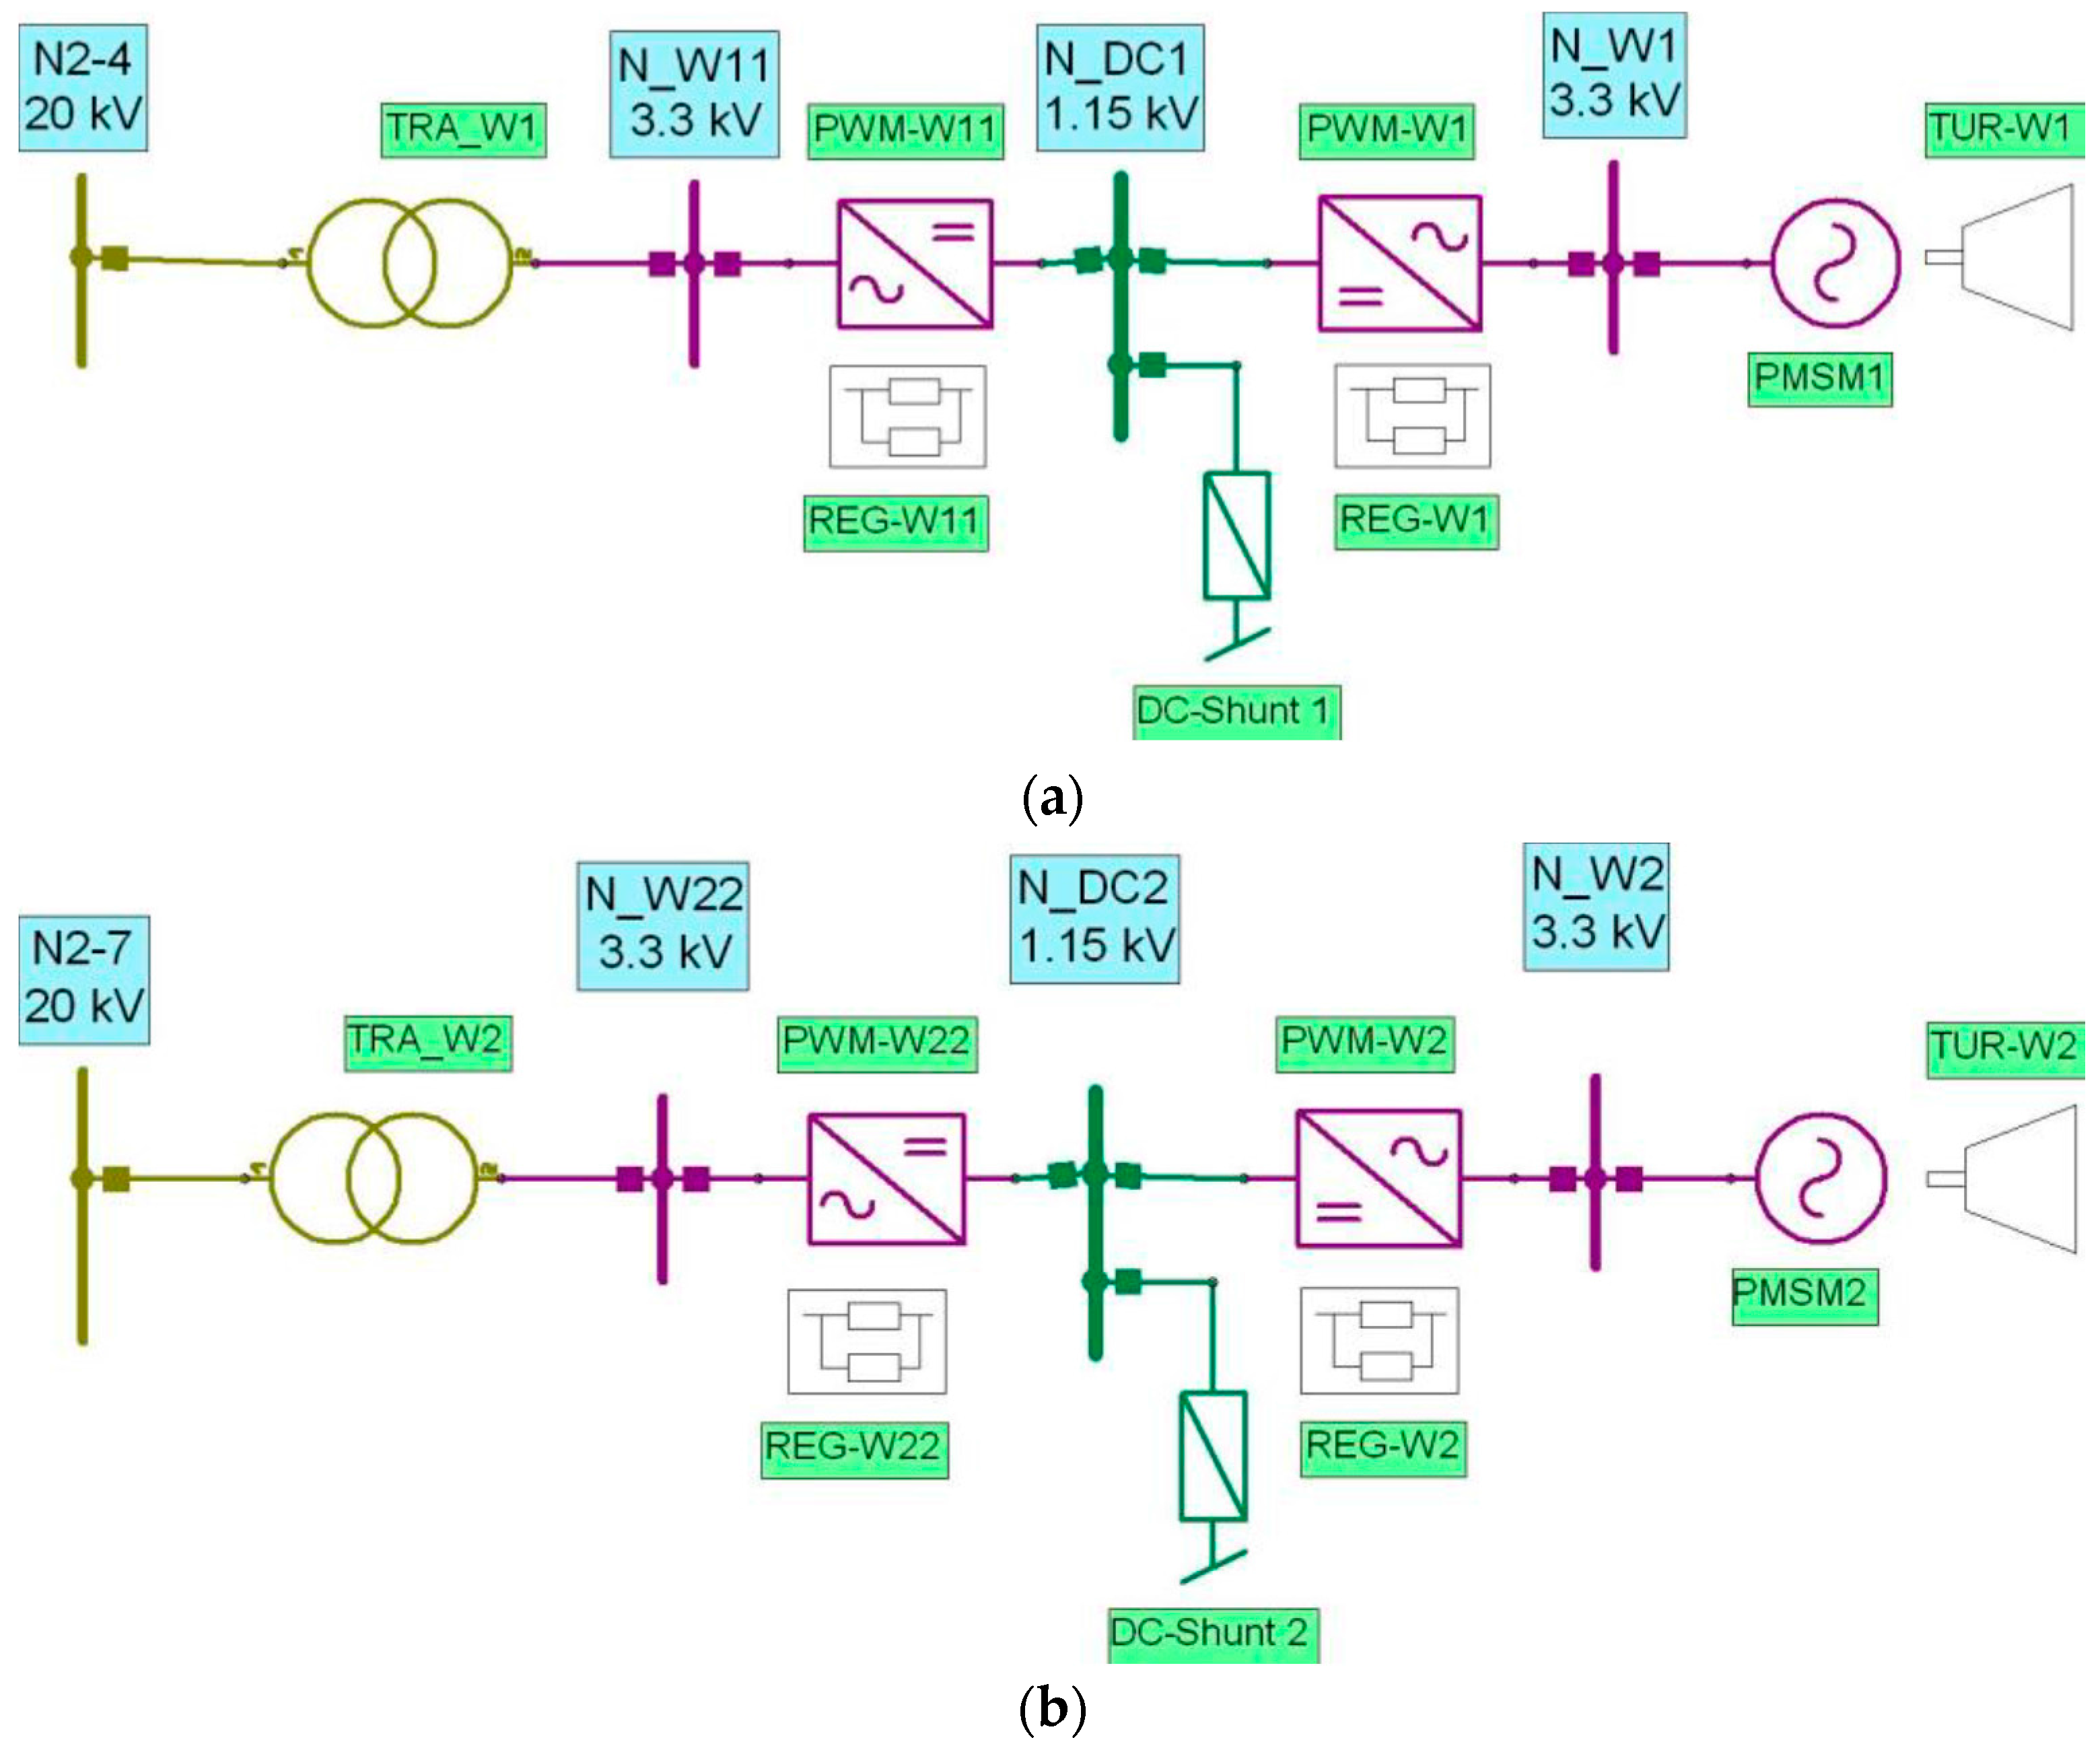
In this case study two WECS were modelled via Neplan. The single line diagram that relates to each WECS is shown in
Figure 13a,b. Each wind DG unit has a rated capacity of 2 MVA and 3.3 kV rated voltage, and were connected to the investigated feeder via a (20/3.3) kV, 2 MVA transformer at the correspondent bus. Each wind DG unit has a rated capacity of 2 MVA and 3.3 kV rated voltage, and were connected to the investigated feeder via a (20/3.3) kV, 2 MVA transformer at the correspondent bus as shown in
Figure 13a,b. WECS single line diagrams were built under different network lawyer in Neplan and were shortened at the main network diagram as Gen_W1 and Gen_W2 to avoid congestion on the main diagram. Both WECS’s were connected to Feeder#2 at buses N2-4 and N2-7 respectively, this WECS layout and point of connection were the same for the following three sub-case studies. Generators PMSM1 and PMSM2 were configured to operate in (P-Q) mode before and after islanding, and were loaded at 75% of their rated capacity with a unity PF (i.e., (1.5 + j0) MVA).
Meanwhile, islanding methods were applied to the remaining other DG technologies (diesel, gas, and hydro), however no changes occurred to those units in terms of unit ratings. Therefore, each unit had 3 MVA rated capacity and a 20 kV rated voltage.
The situation mentioned above regarding the four DG technologies remained unchanged during the simulation of the following three sub-case studies, moreover
Table 9 demonstrates DG units arrangements for the purpose of the mixed case.
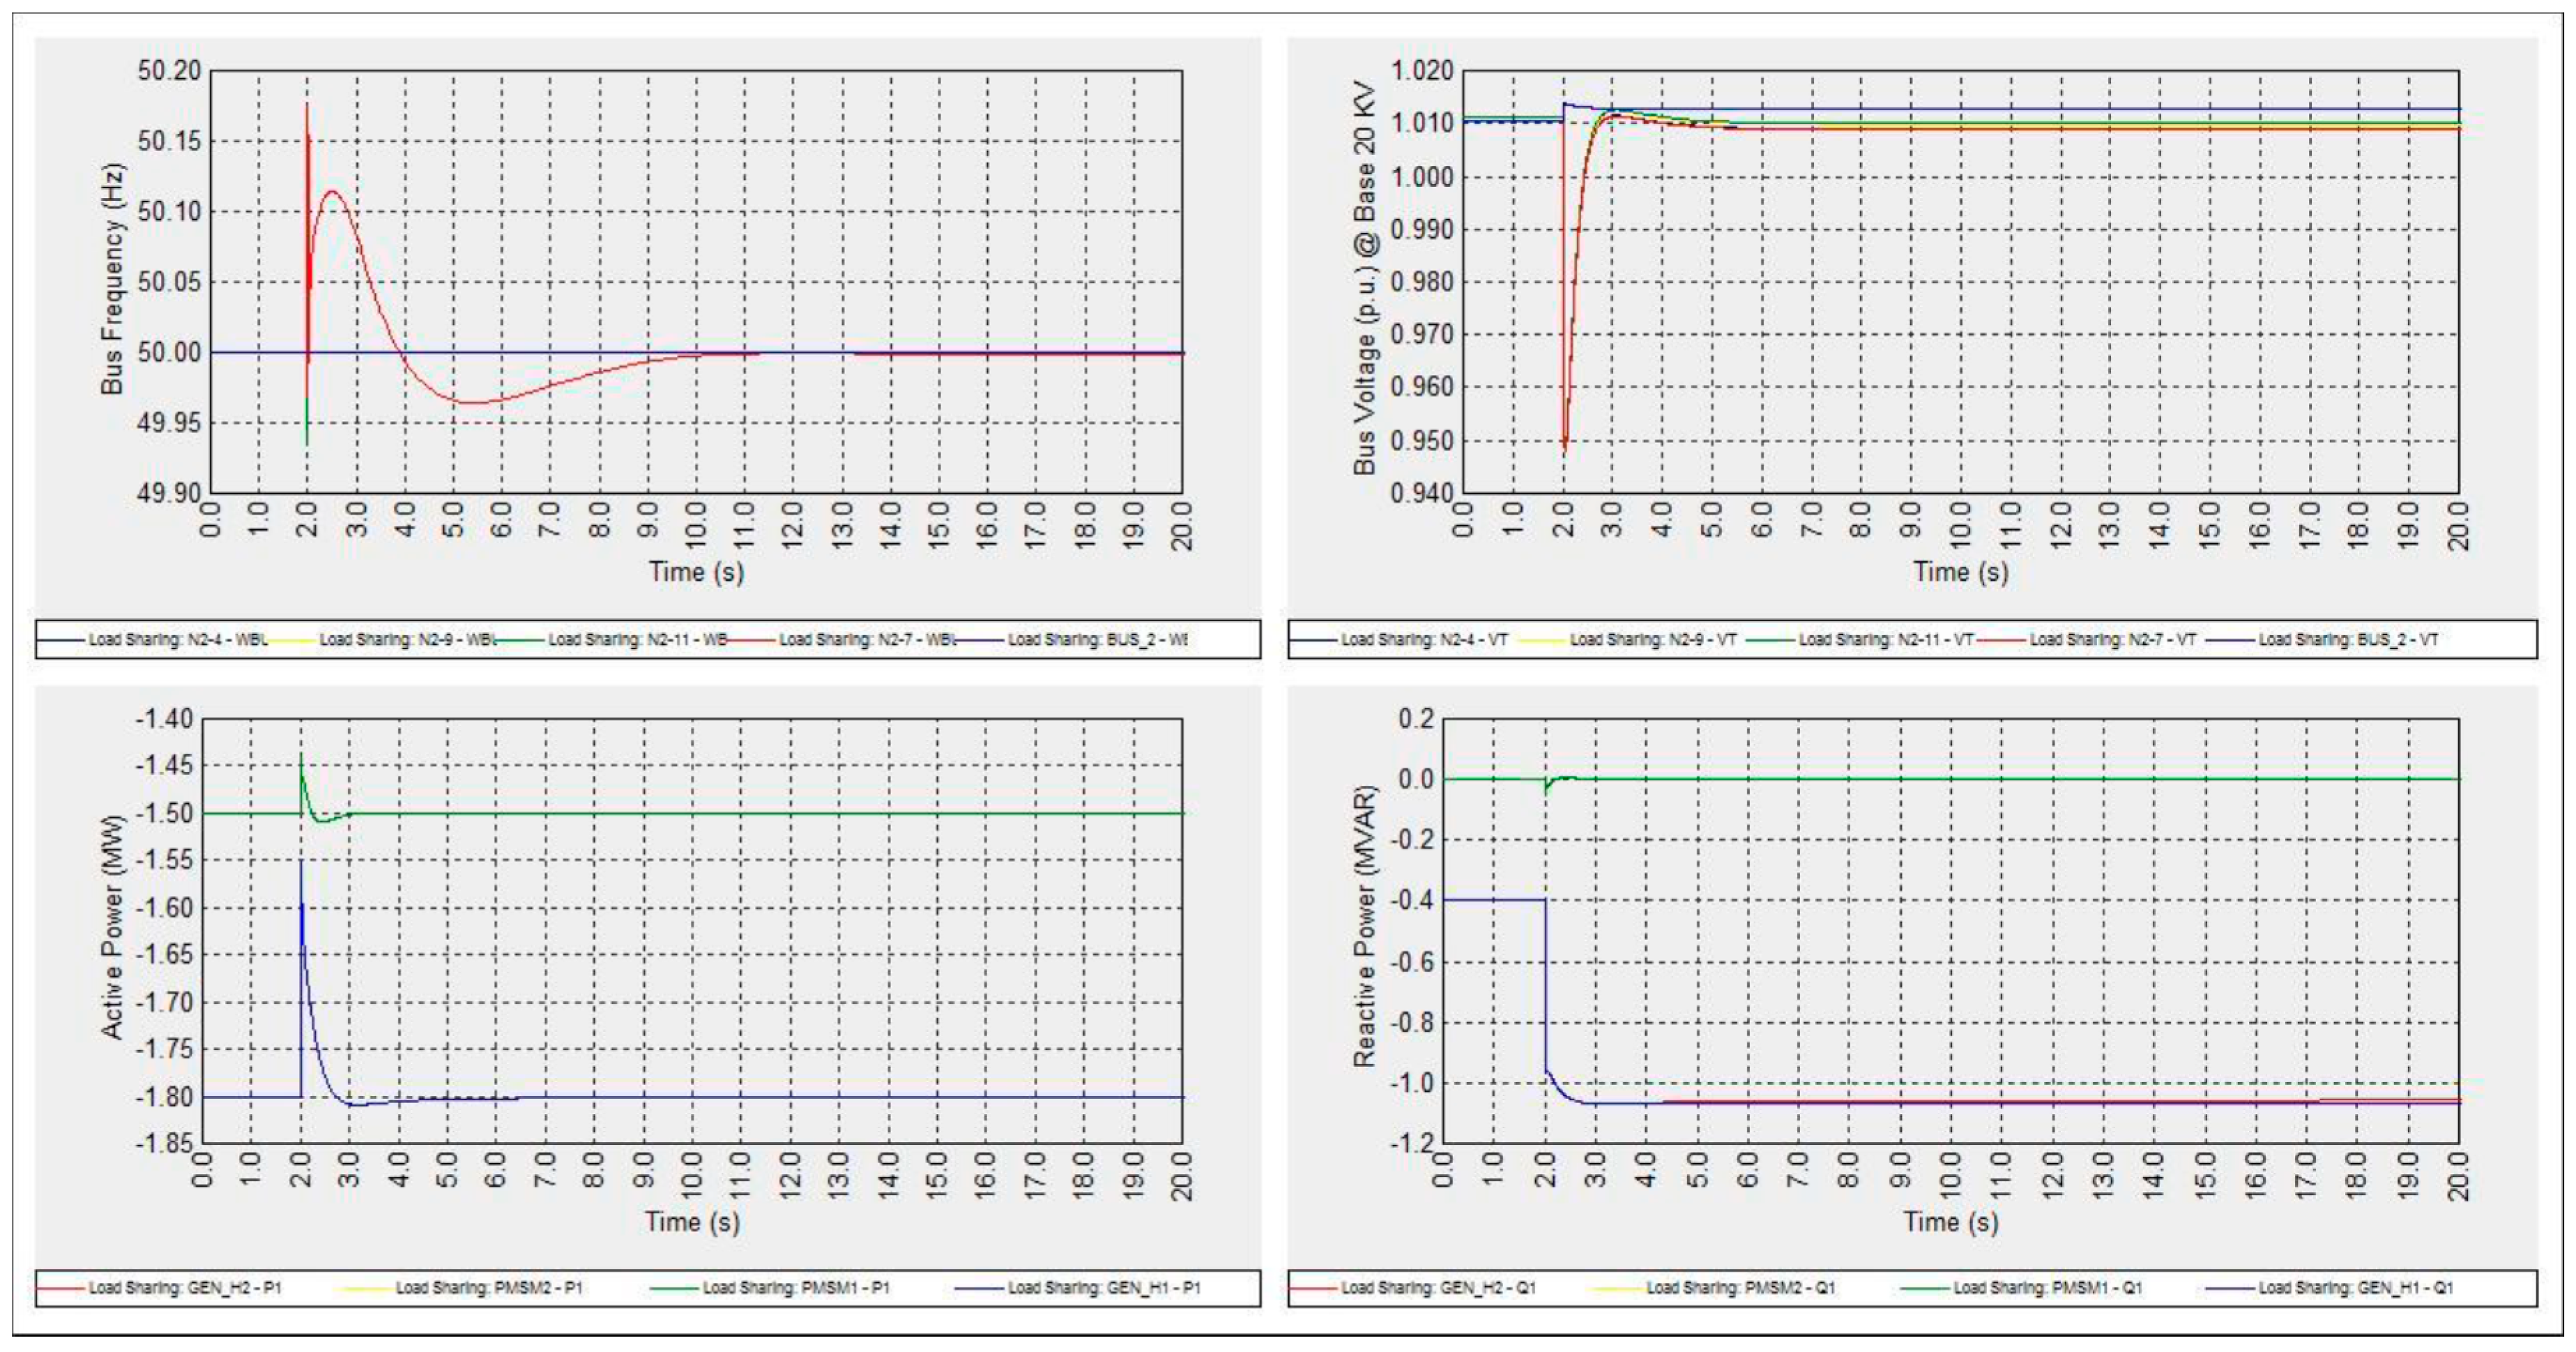
6.4.1. Planned Islanding of Two Diesel & Two Wind Units (Case D1)
In this sub-case two DG units (Gen_W1, Gen_W2) are two wind based units connected to buses N2-4 and N2-7 respectively, while the other two DG diesel based units (Gen_D1 and Gen_D2) are connected to buses N2-9 and N2-11, respectively of the scheme in
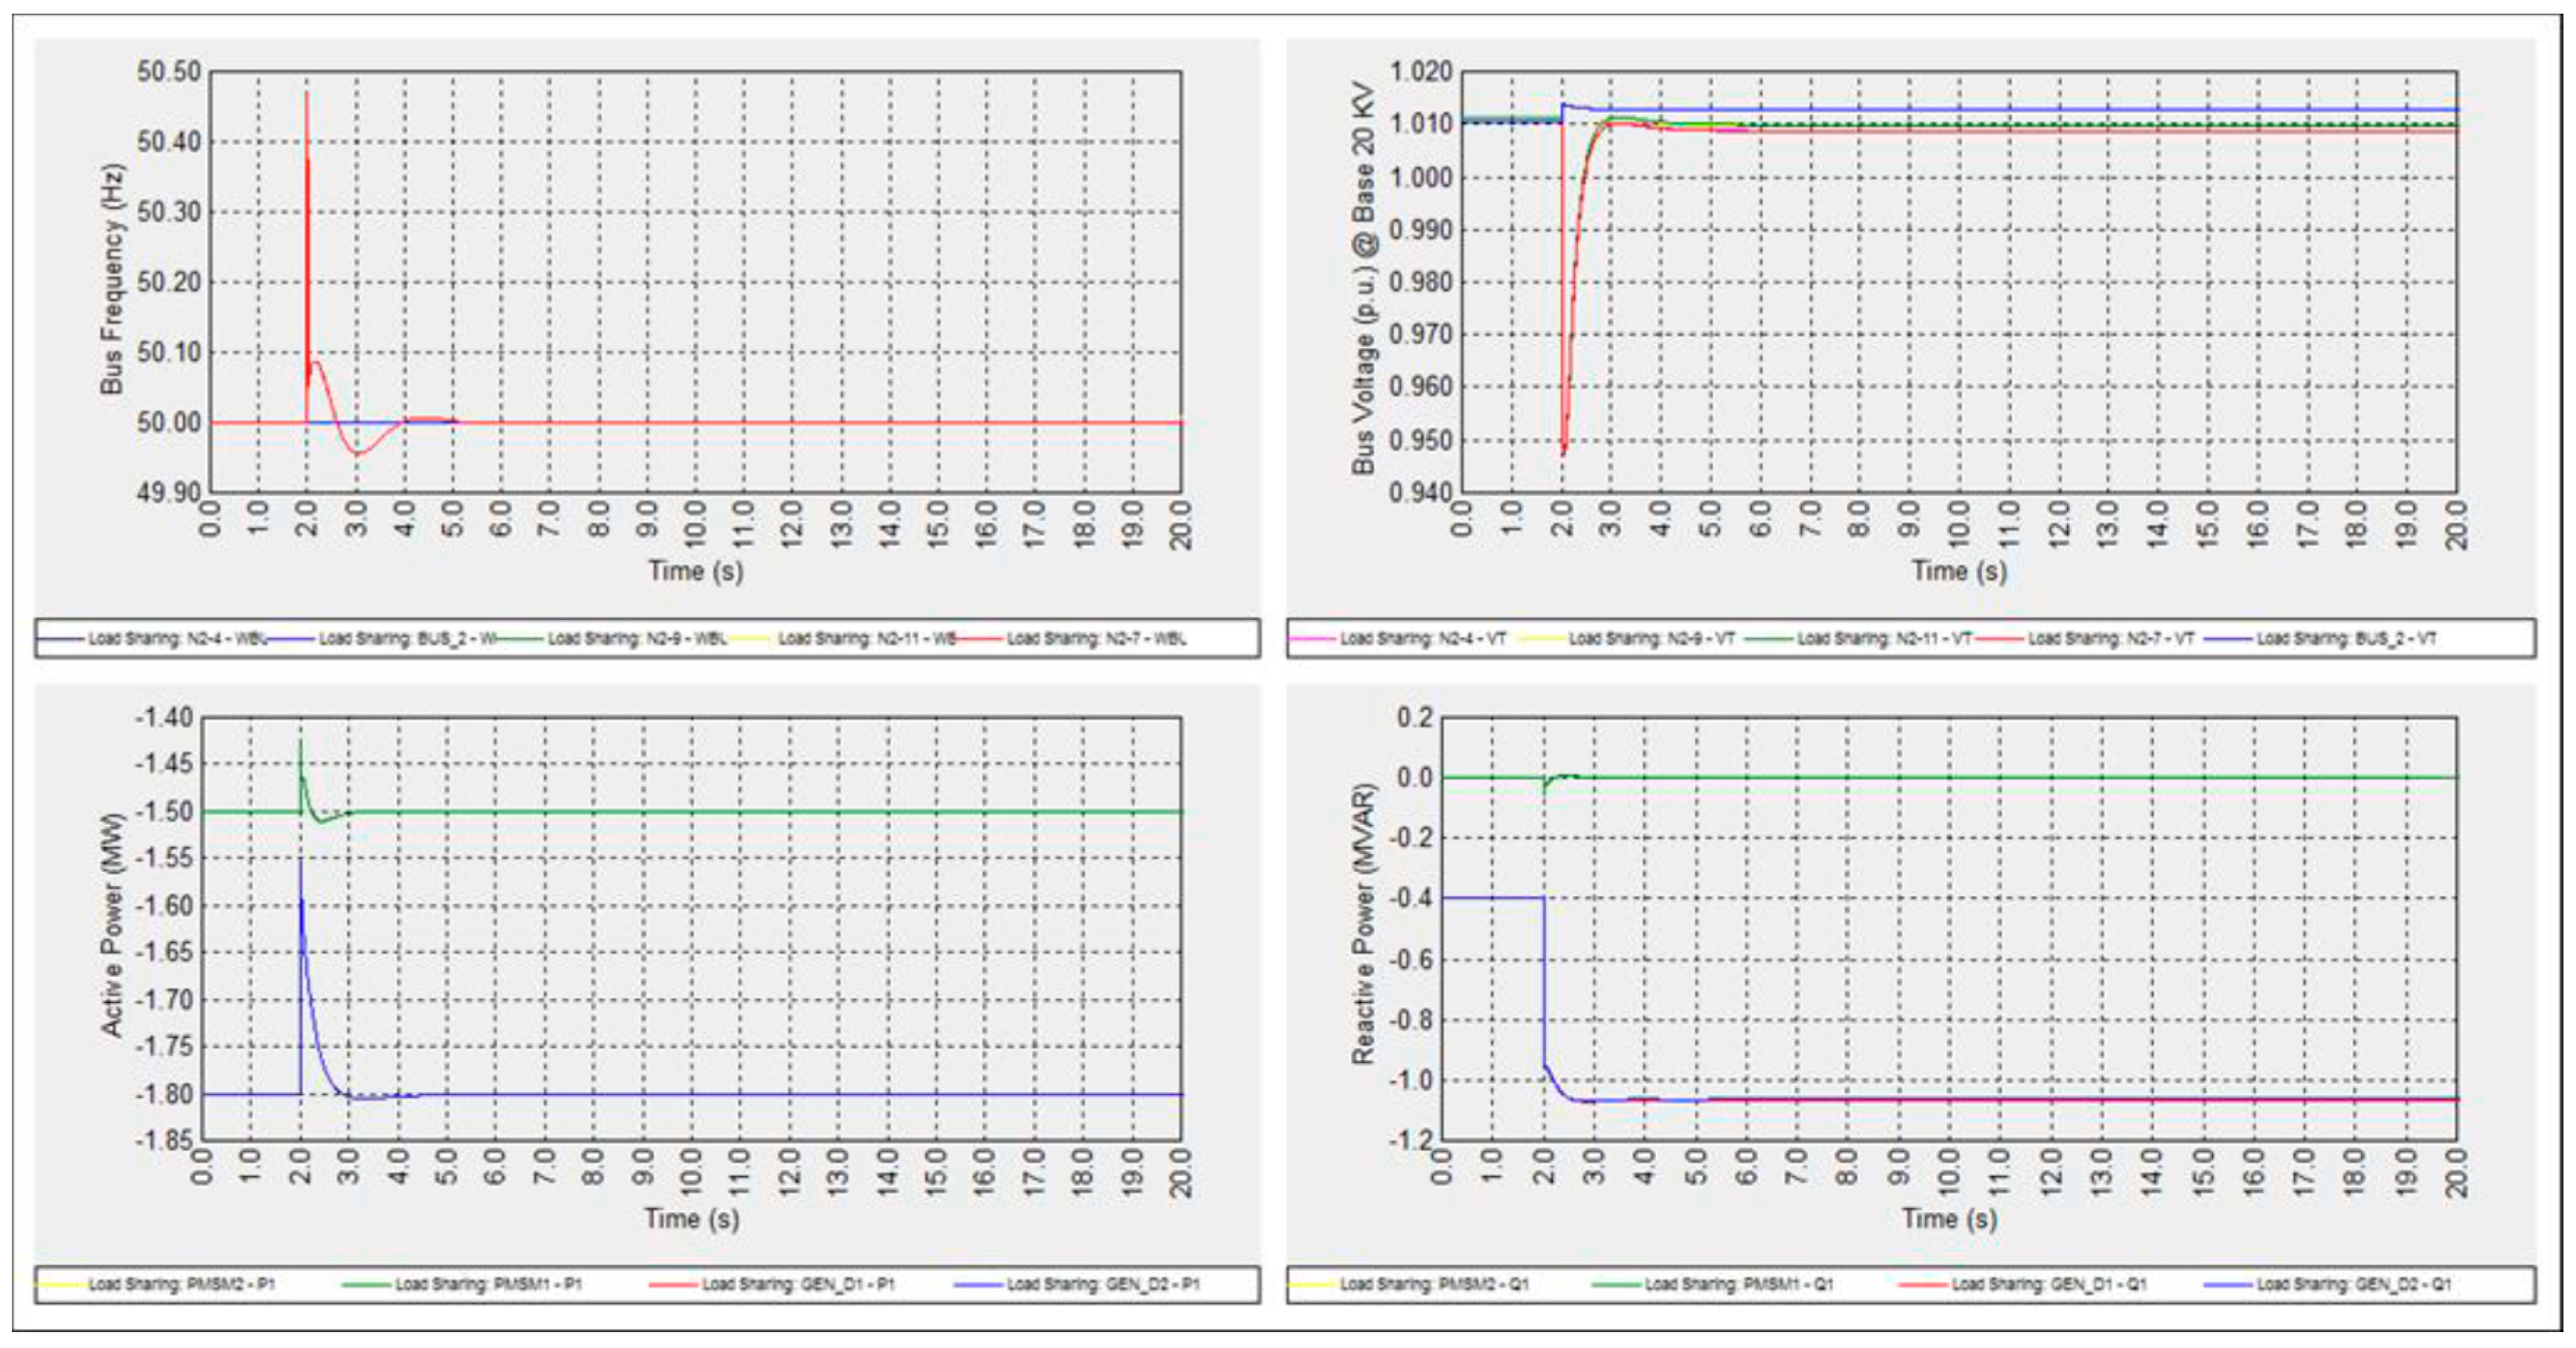
Figure 1. For simplicity only one generation situation were investigated (over-generation) during this sub-case and the following two load sharing sub-cases. Prior to the islanding mode, the two diesel units Gen_D1 and Gen_D2 were loaded at (1.8 + j0.4) MVA, while wind units were loaded at (1.5 + j0) MVA. Hence, the existing generation to load ratio was (6.6/6.46) MW prior to islanding, this implies a 2.16% over-generation power mismatch. The results are shown in
Figure 14.
6.4.2. Planned Islanding of Two Gas & Two Wind Units (Case D2)
In this sub-case, loading of the gas and wind units followed sub-case D1 exactly. The results are shown in
Figure 15.
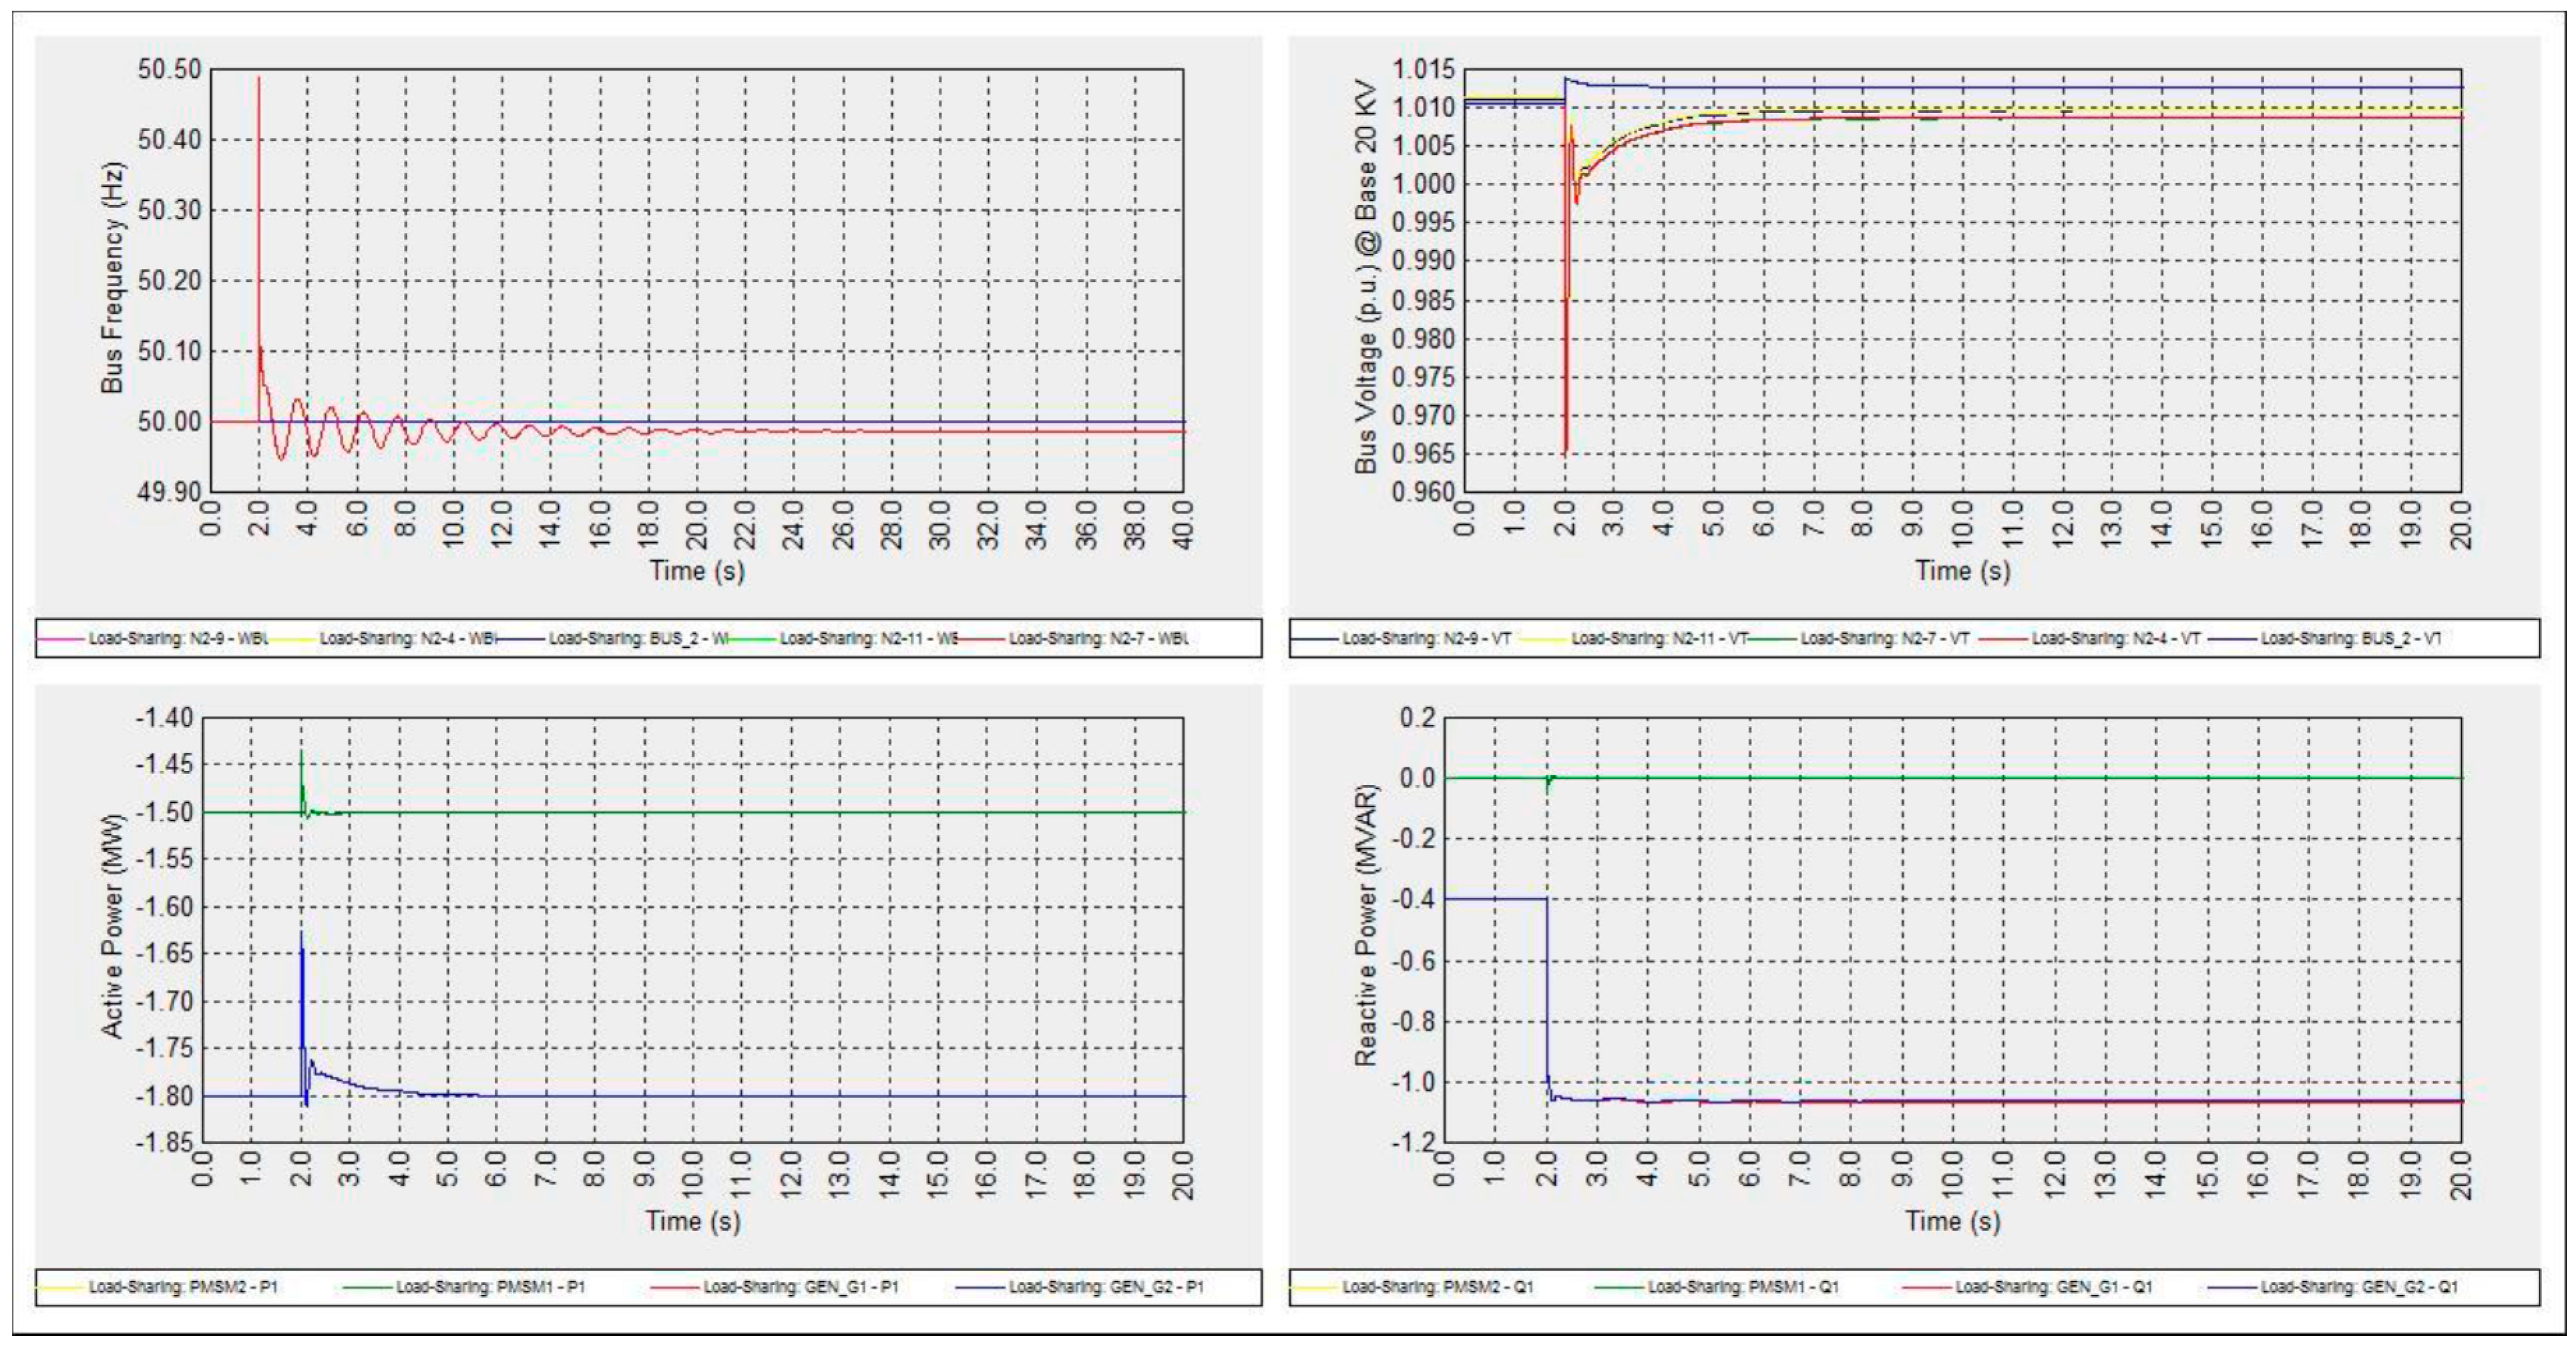
6.4.3. Planned Islanding of Two Hydro & Two Wind Units (Case D3)
In this sub-case, loading of the gas and wind units followed sub-case D1 exactly. The results are shown in
Figure 16.
7. Discussion of the Results
Table 10 summarizes the main points and outcomes obtained from this work, hence they give a brief picture of the problem and the key index to understand it. In this table there are comments about the reasons that the islanding attempt has failed. Voltage and frequency is compared to the limits that are introduced in
Table 1.
The planned islanding proved to be feasible option for most of the cases investigated, however some cases’ islanding feasibility needed certain agreements between utility and DG units’ operators. Besides the unstable behavior of the system following unplanned islanding for all cases tested, it could also lead to DG units’ rotor damage, according to the power variations recorded from the individual unplanned sub-case studies.
There is indeed a pivotal role for the anti-islanding protection schemes embedded within distribution networks, since the unintentional islanding effect brings severe outcomes on end users’ loads, DG units, and utility assets. This was clear from all of the examined unplanned islanding sub-cases, where DG units were given the permission to operate freely without interruption. That was only to demonstrate the size of negative impact it could leave on real distribution systems with DG units, whenever unintentional islanding occurs without having the proper anti-islanding detection and protection schemes.
Frequency variations were related directly to the existing active power mismatch prior to islanding, and implicitly to the islanding method used, the type of DG technology, and the governor system associated with them. While voltage variations were function of the existing reactive power mismatch prior to islanding, islanding method used, and the type DG unit technology; however only one excitation system was used therefore it was not enough to determine the effect of different excitation systems on voltage behavior.
Since among the nine investigated planned sub-cases five out of six over-generation sub-cases and one out of three under-generation sub-cases returned reliable islanding results. While two under-generation sub-cases required certain agreement between utility and DG units’ operators and only one over-generation sub-case failed to satisfy the standard islanding operating conditions.
Among the four DG technologies, diesel units alone had the best planned islanding response, while gas units had the longest response time, and hydro units had the most variation levels. Moreover, loads had an impact on the frequency response of the system prior islanding and that was obvious in the three mixed units load sharing sub-cases, while voltage variations had the direct impact on load dynamic behavior.
The droop characteristic of the gas turbine in gas sub-cases had the advantage of preserving the system stability during the load sharing method. Meanwhile, a slight improvement on frequency droop response was observed after using wind with gas and with hydro during the mixed case; however the stable diesel units’ response were reduced after mixing with wind. This was not the case for voltage since all mixed cases had stronger voltage dips compared to individual cases.
8. Conclusions
The dynamic behavior of a realistic MV network with existing distributed generation following a planned and unplanned islanding has been investigated. Four different distributed generation technologies (diesel, gas, hydro and wind) along with their excitation and governor control systems have modelled and simulated. Furthermore an exponential model was used to represent the loads in the network, while the load sharing islanding method has been used for controlling the distributed generation units during grid-connected and islanding operation. The obtained simulation results were validated through various case studies and have shown that properly planned islanding transition could provide support to critical loads at the event of utility outages. The current work contributes the conducting research on intentional and unintentional islanding in an effort to increase the DG units and the power distribution networks’ efficiency.


