
Dependency-Aware Clustering of Time Series and Its Application on Energy Markets


Abstract
:1. Introduction
2. Similarity and Distance Measures Based on Permutations
3. Applications to Electricity Markets
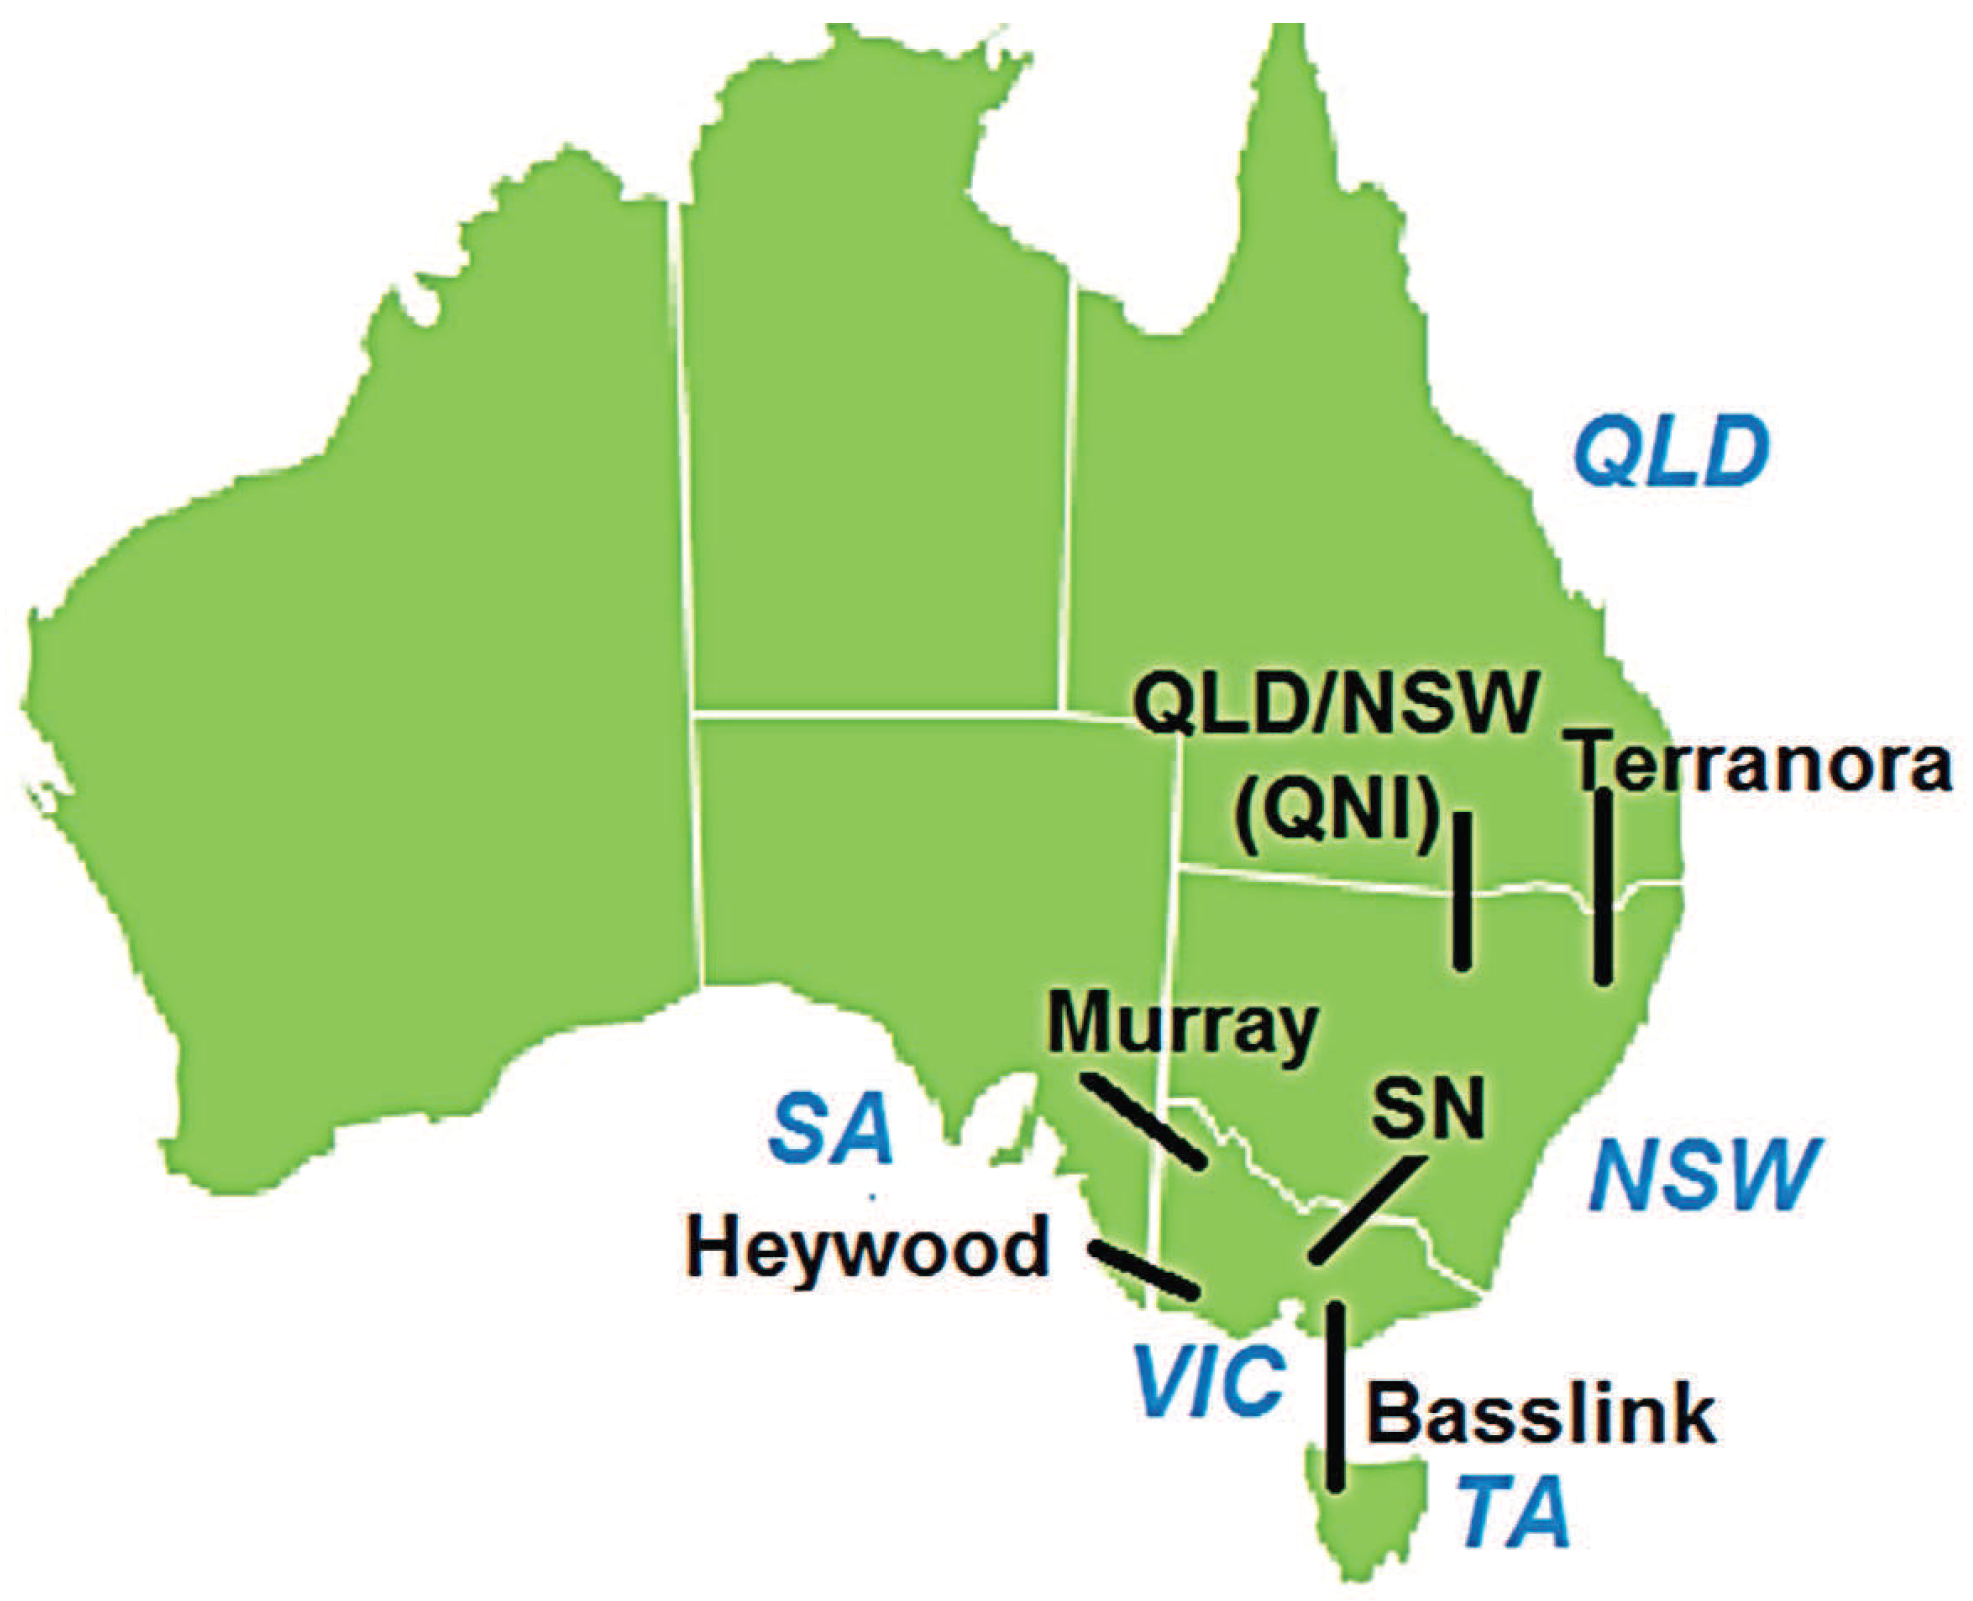
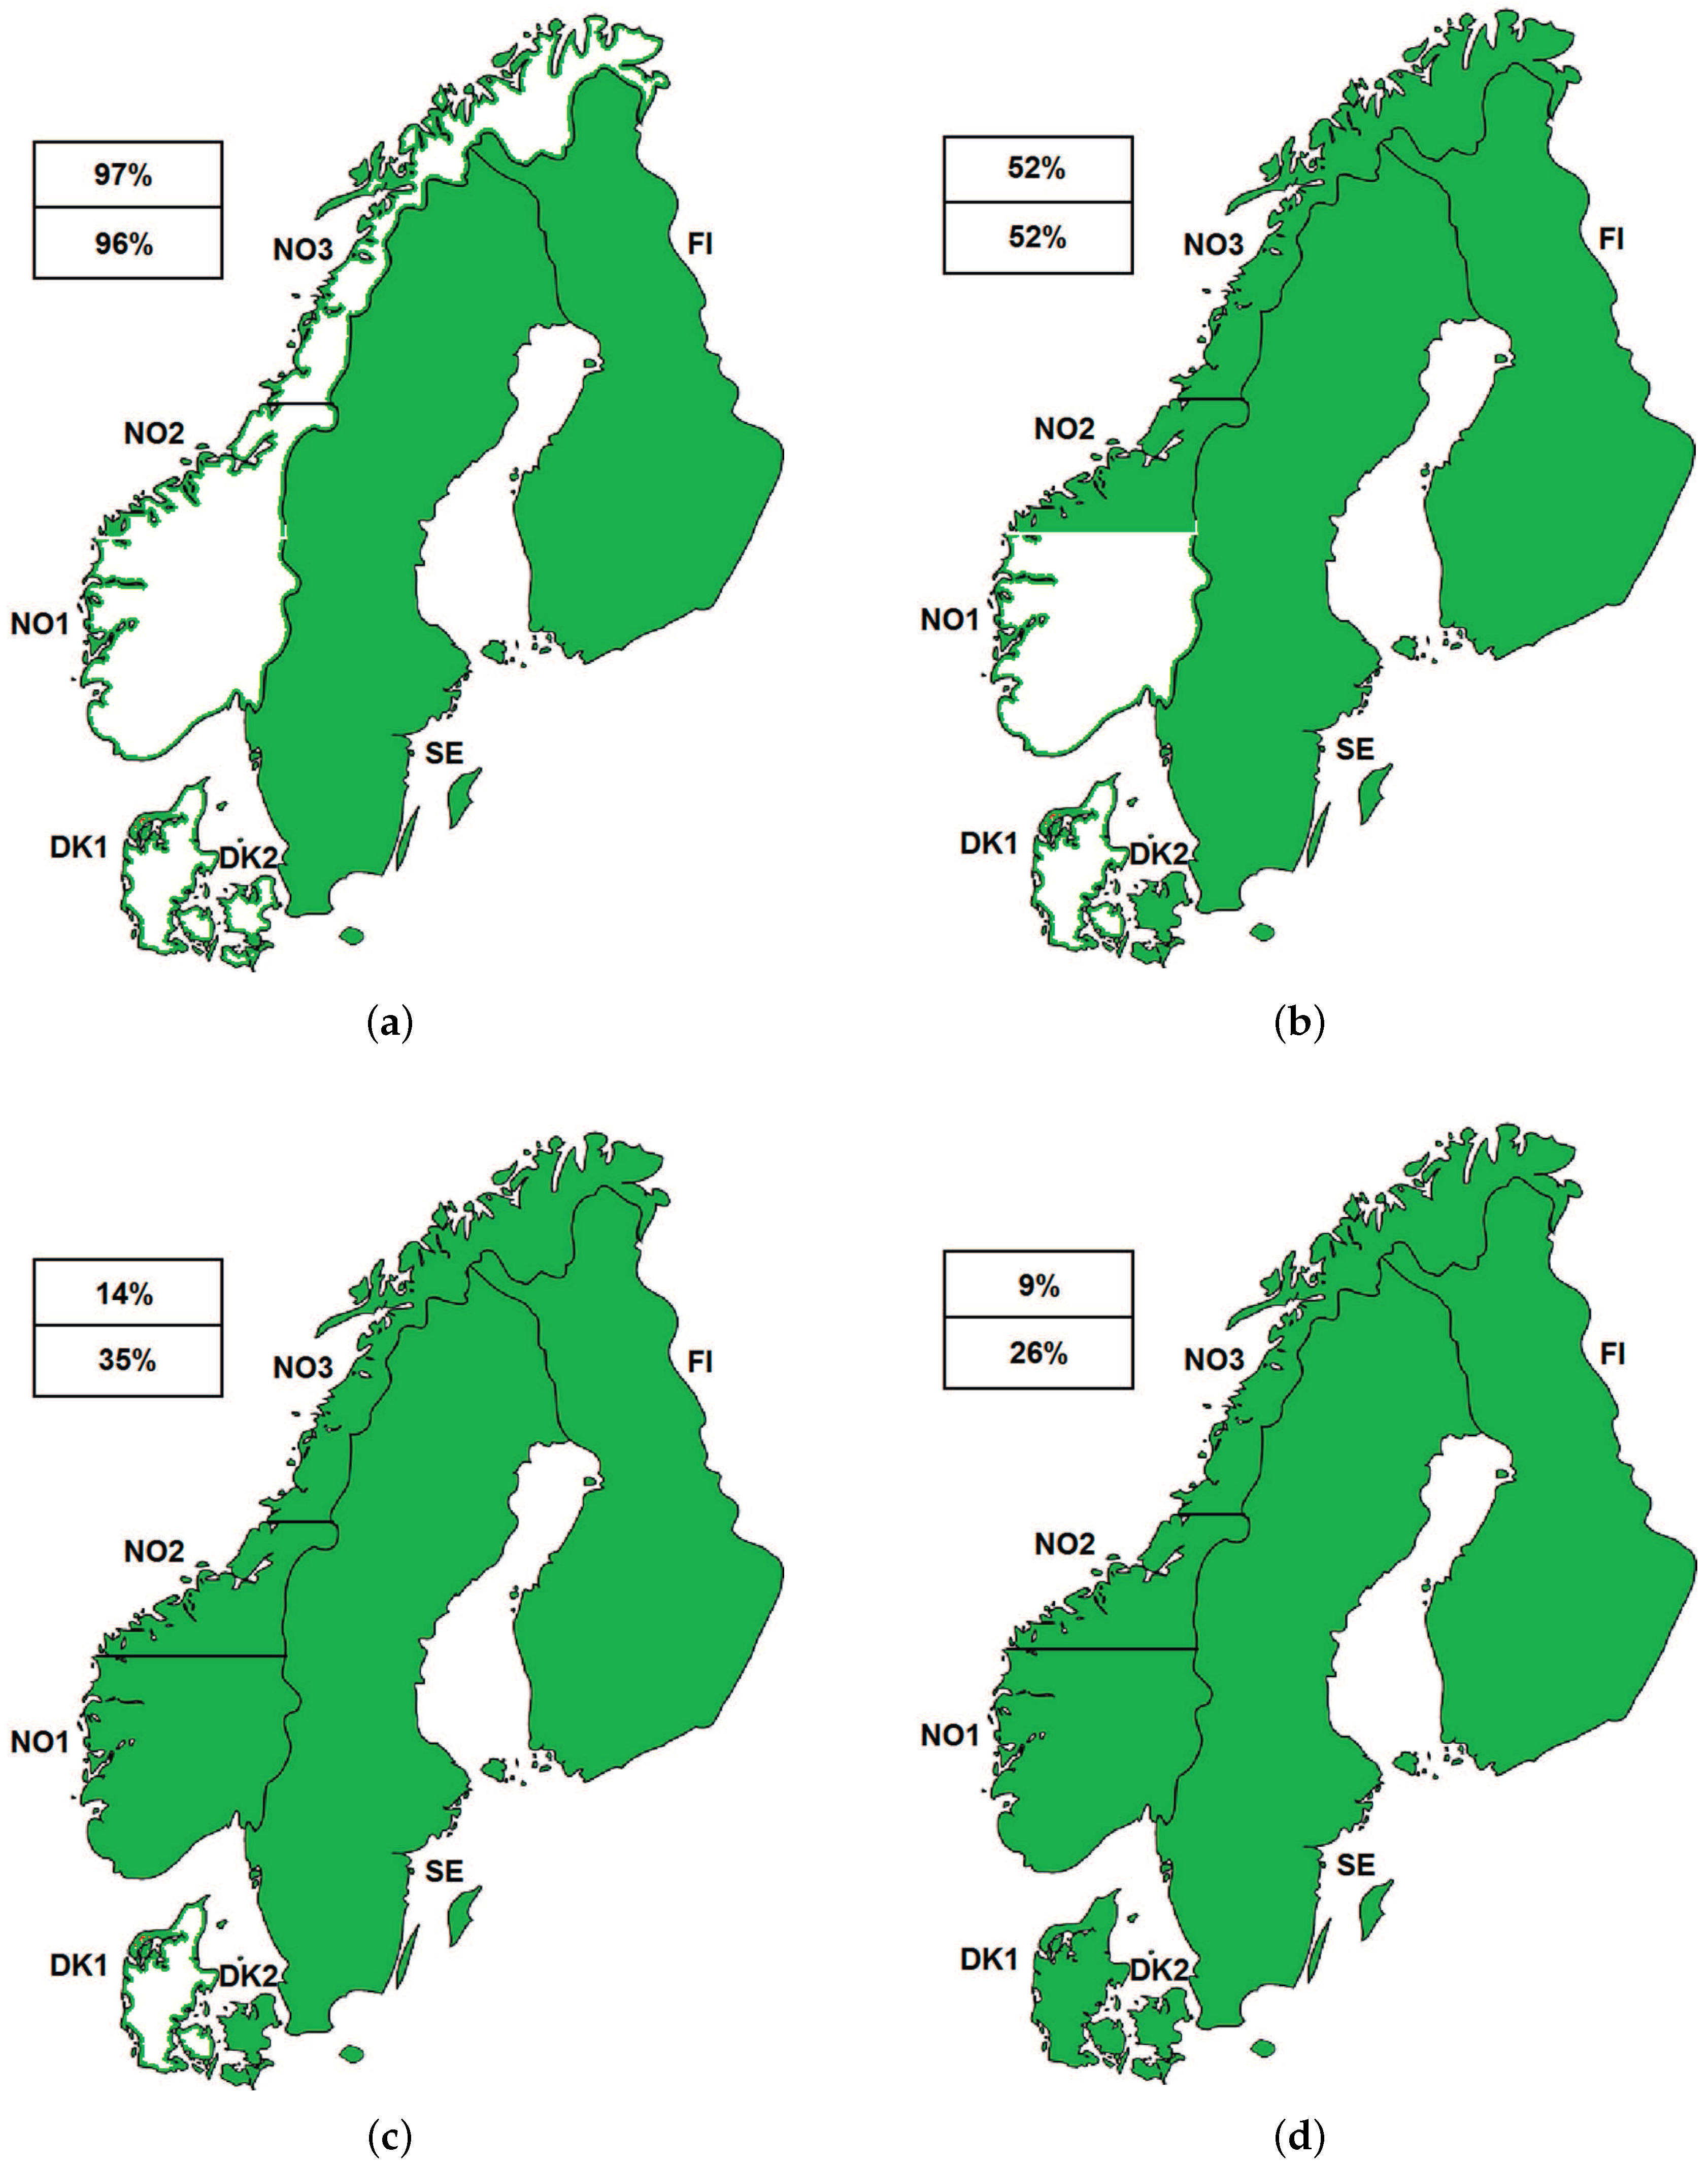
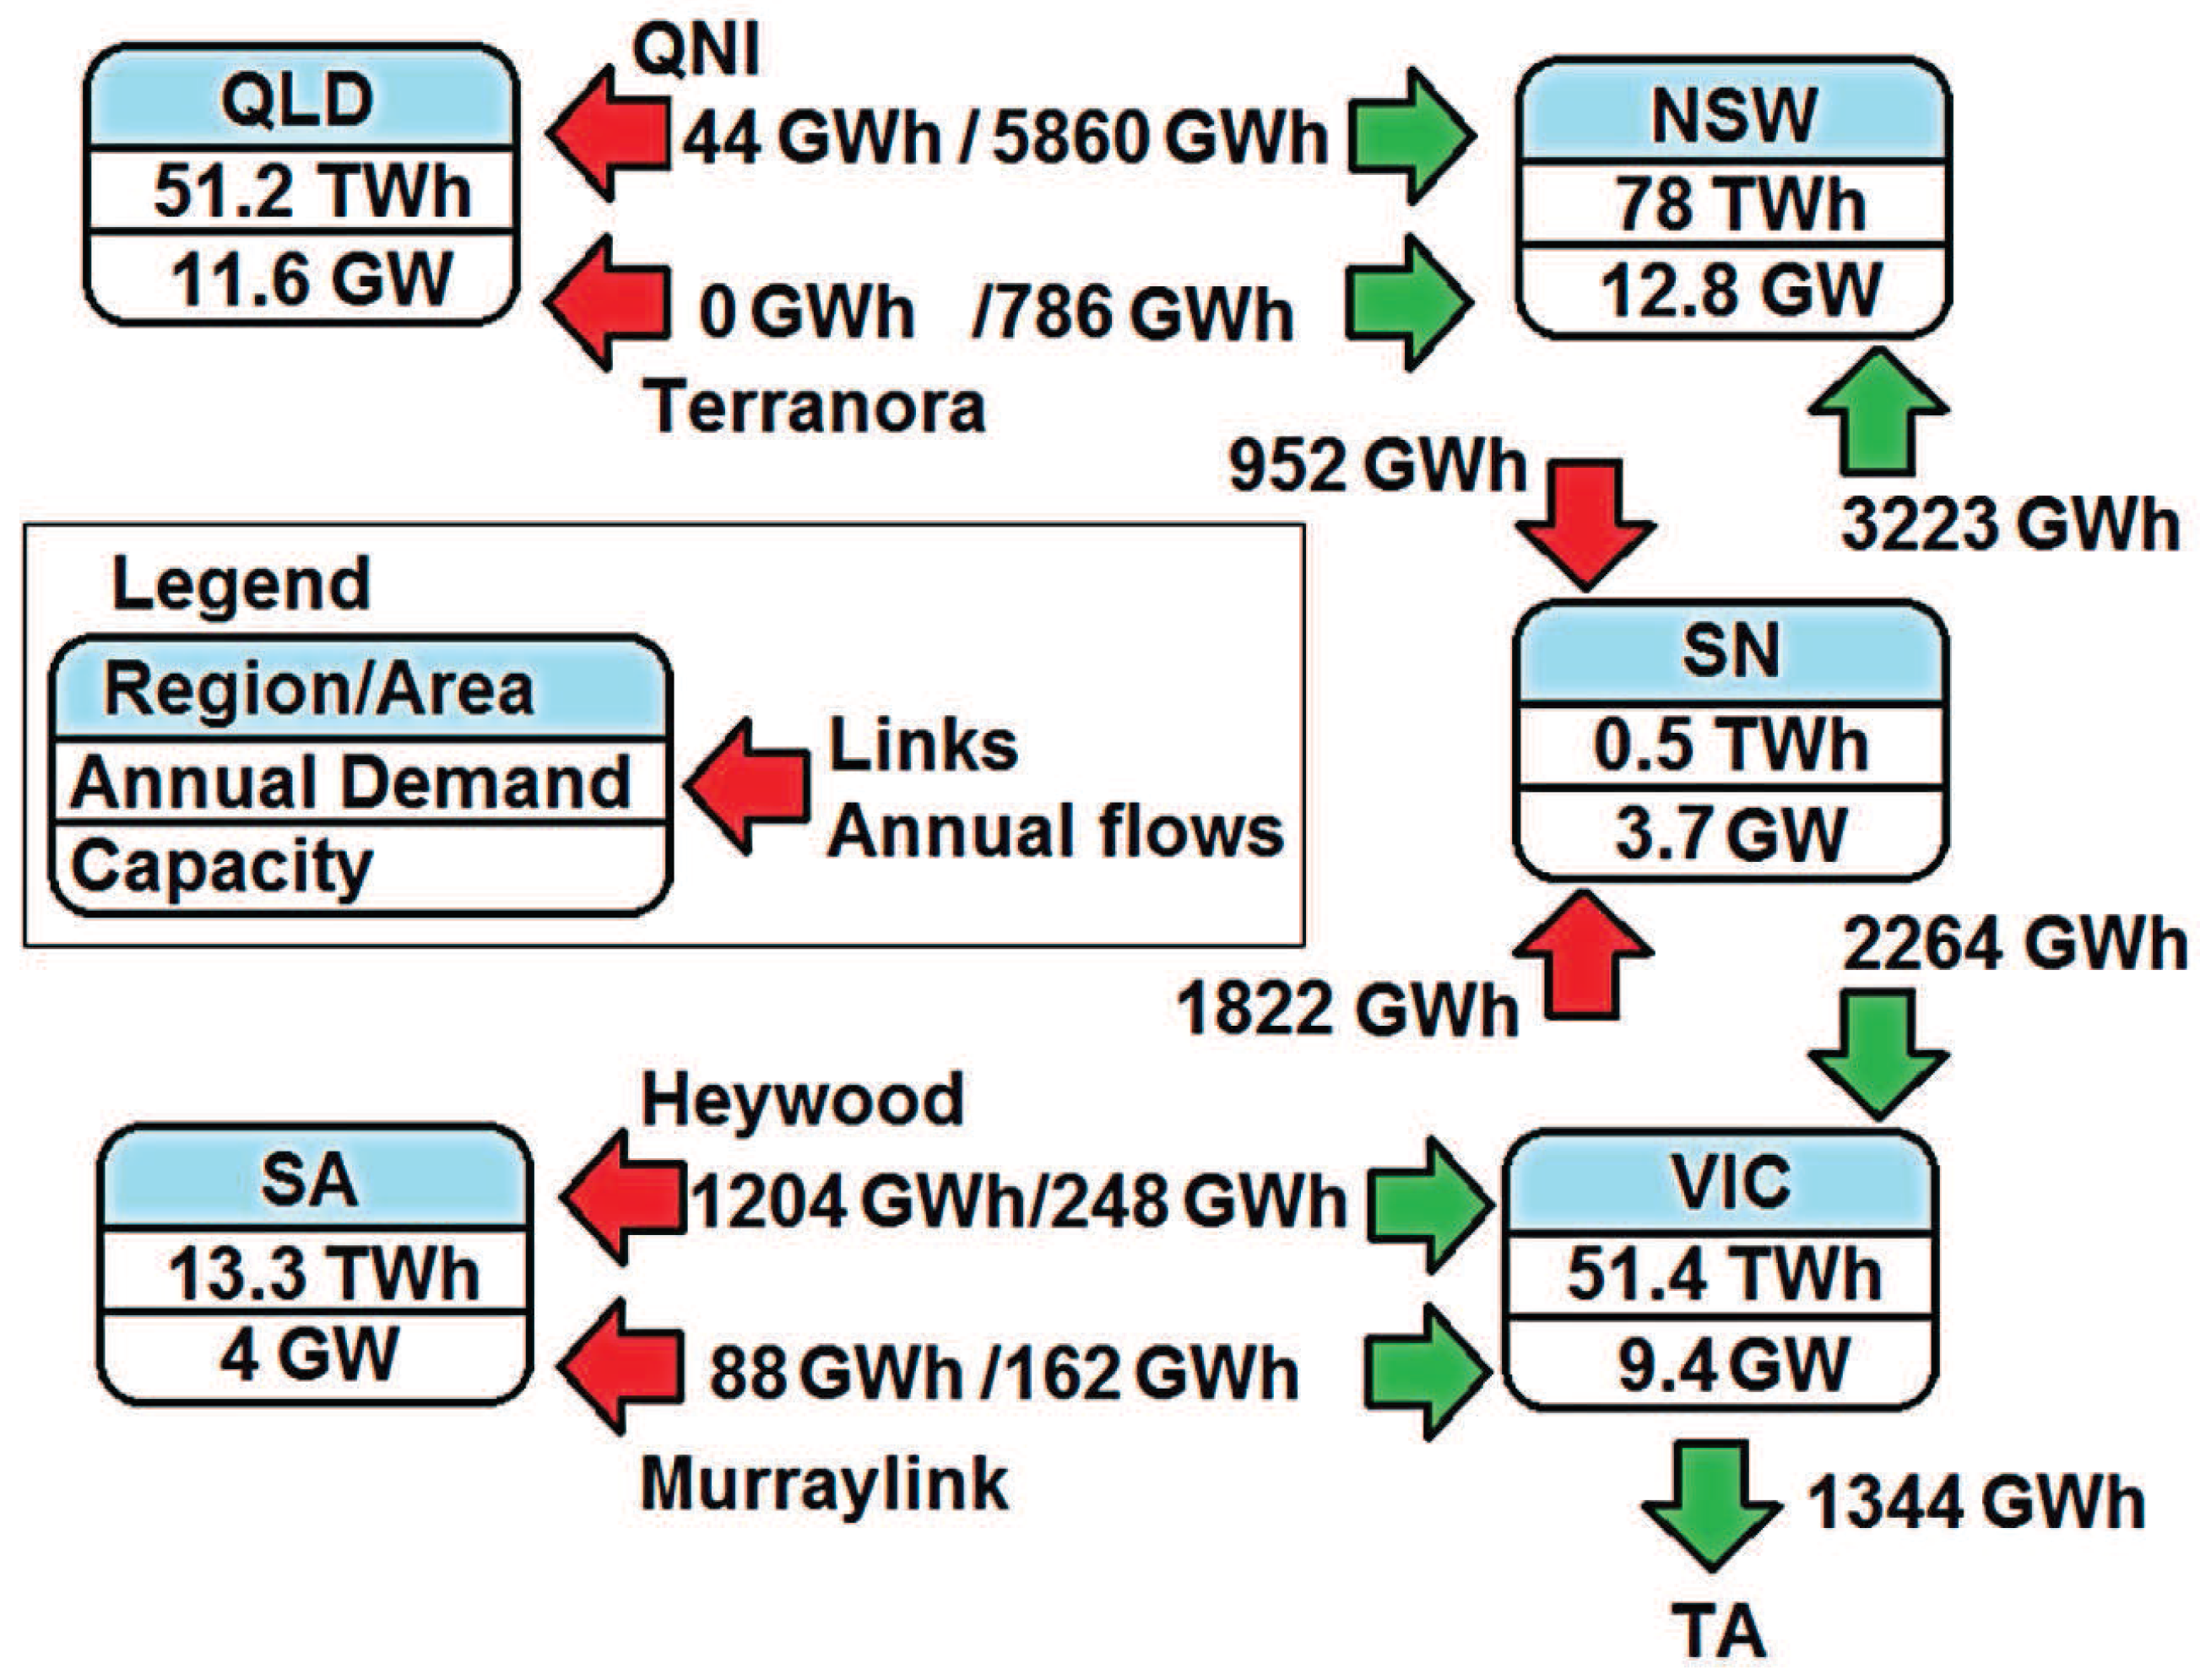
3.1. Description of Some Electricity Markets Analyzed
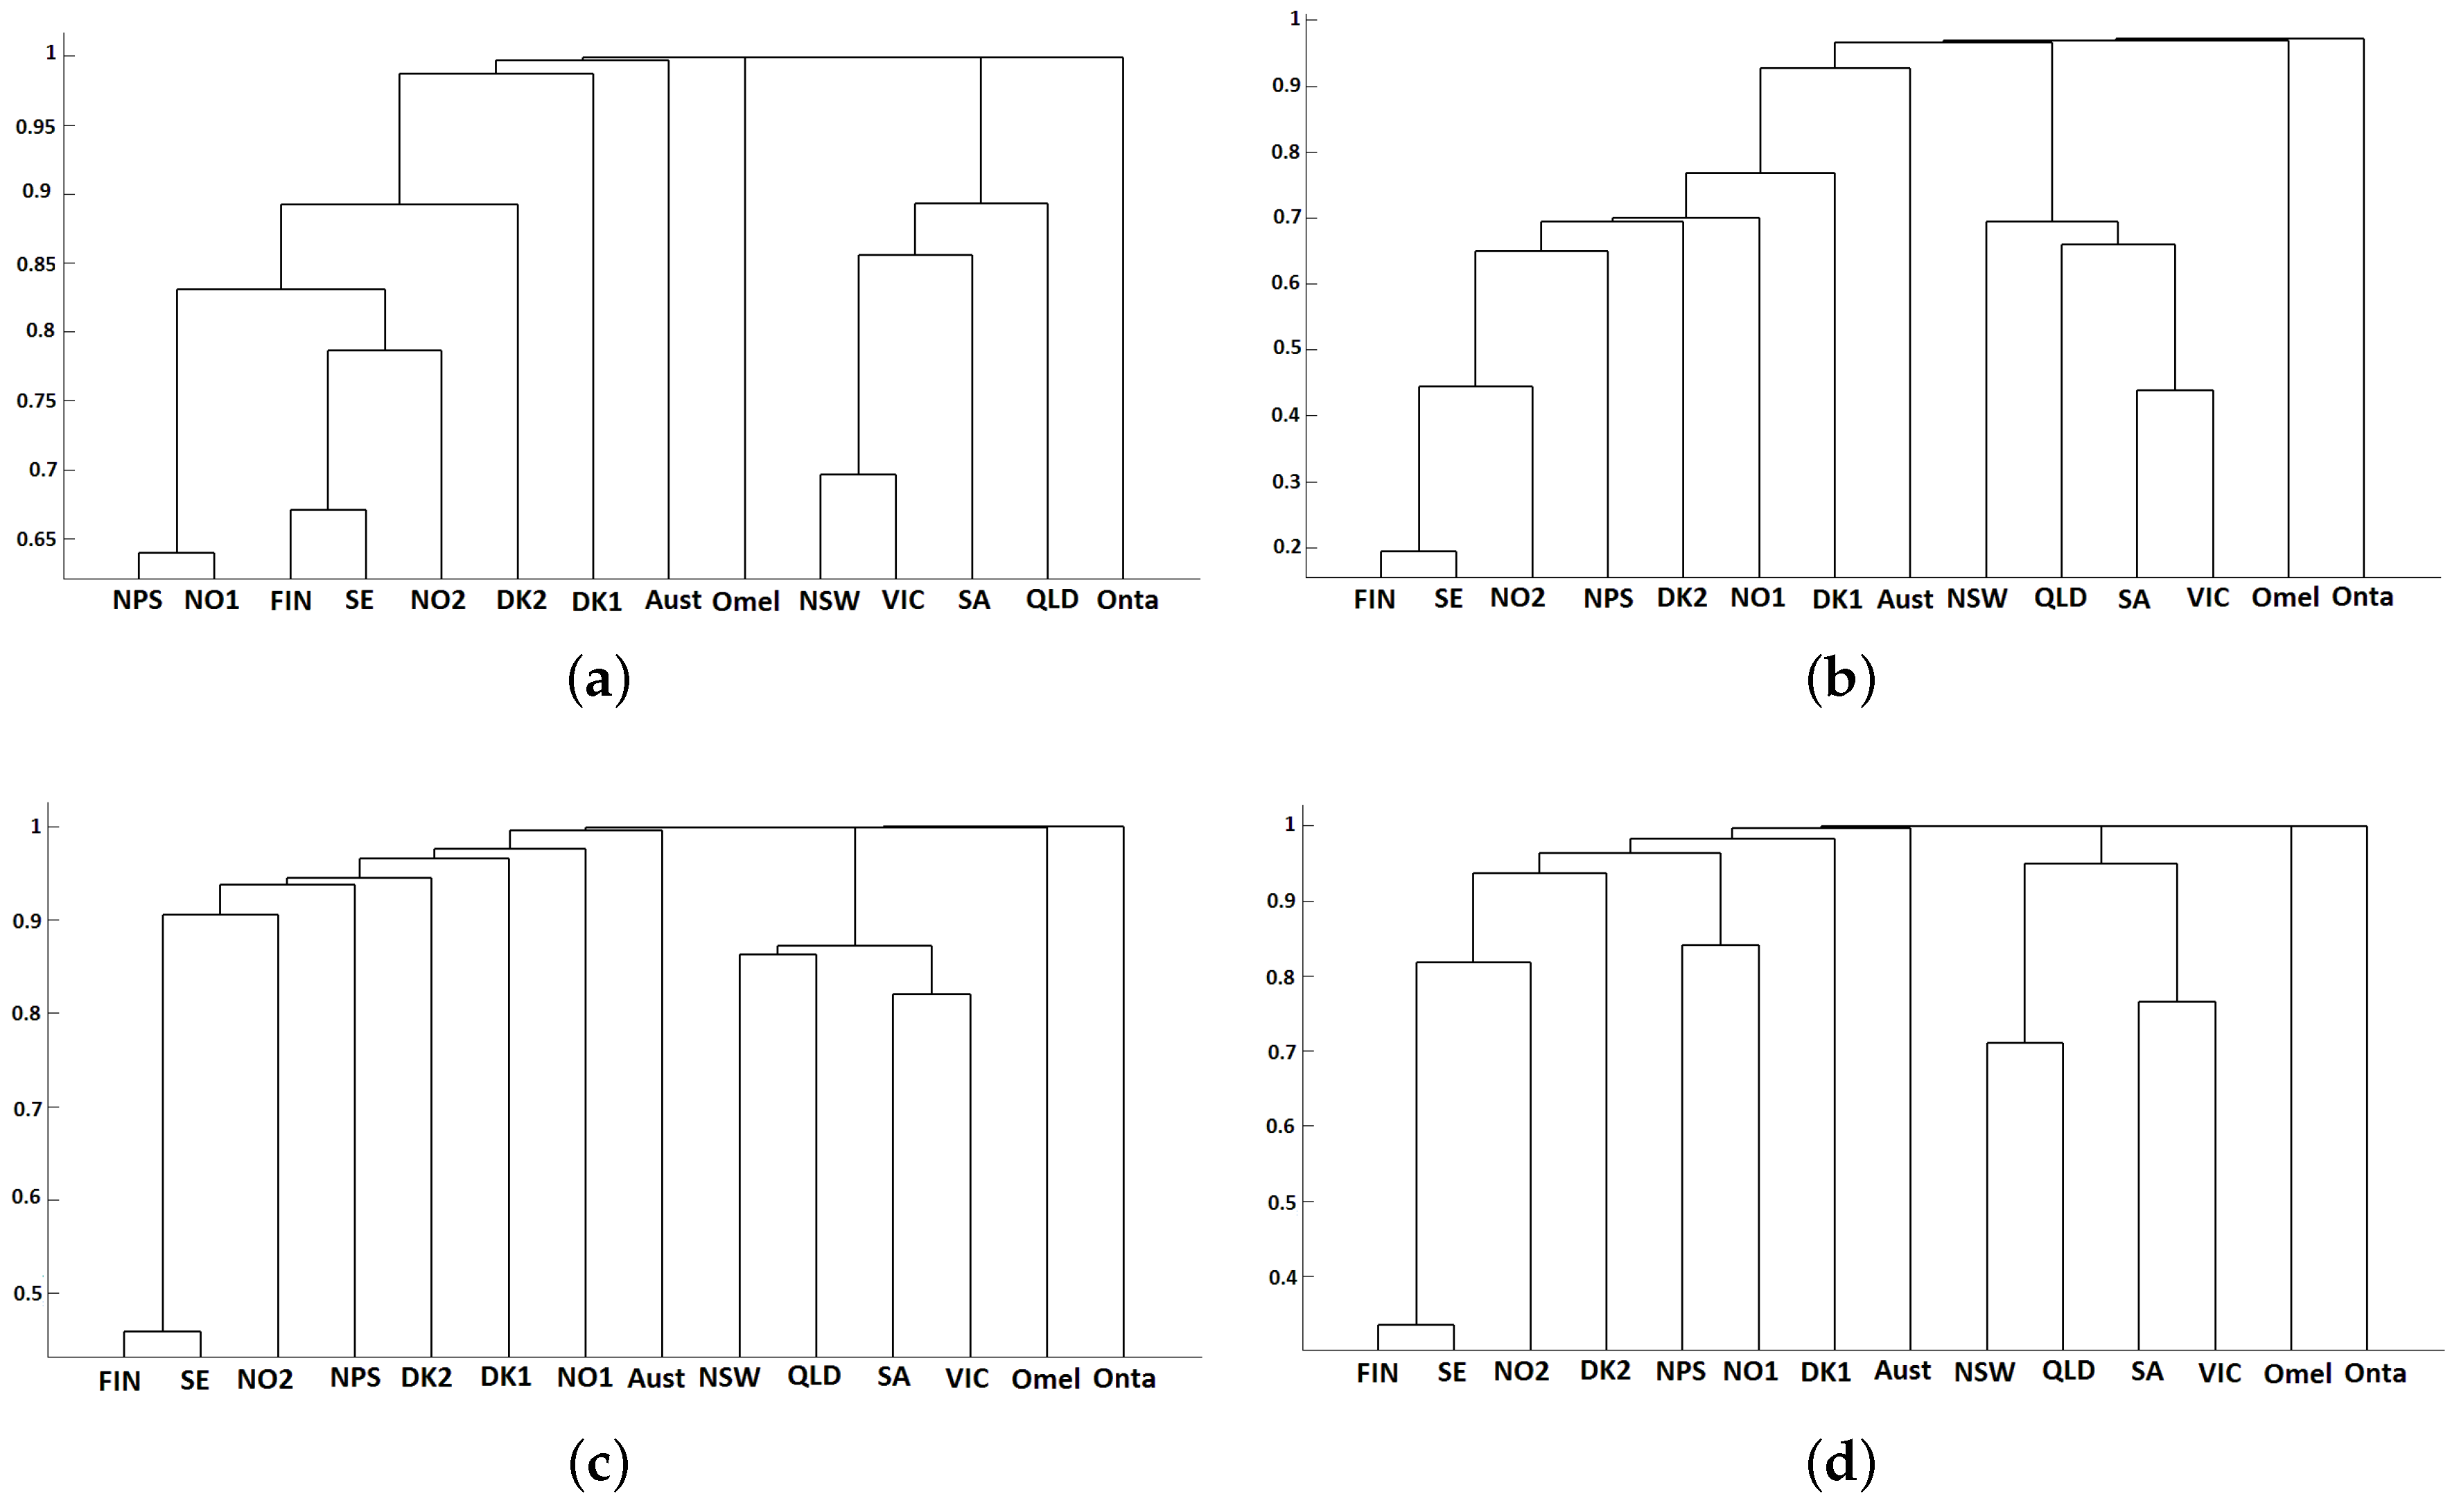
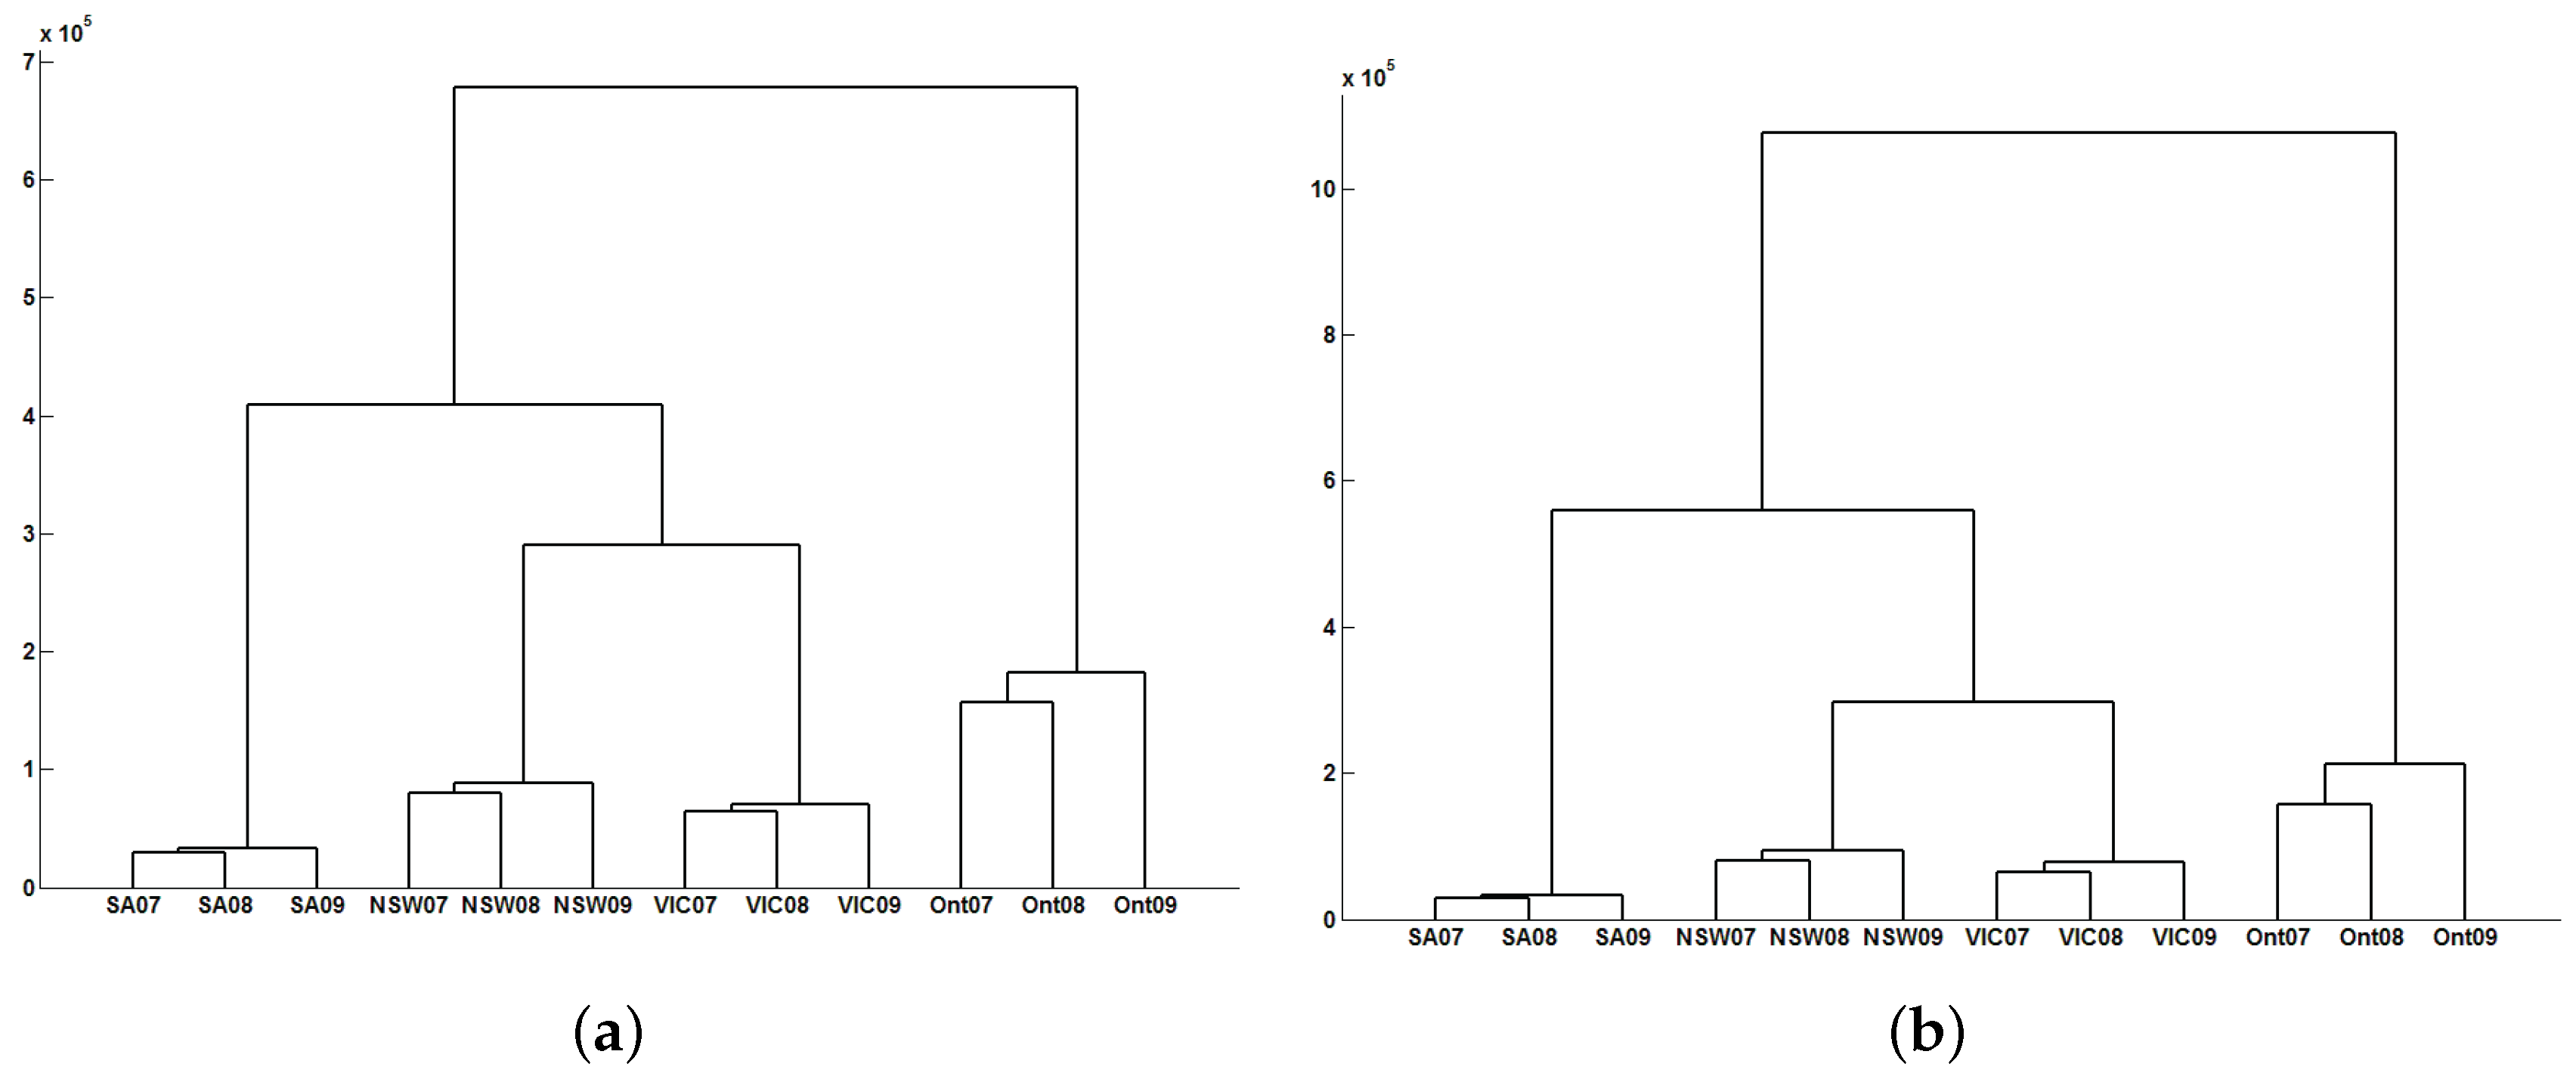
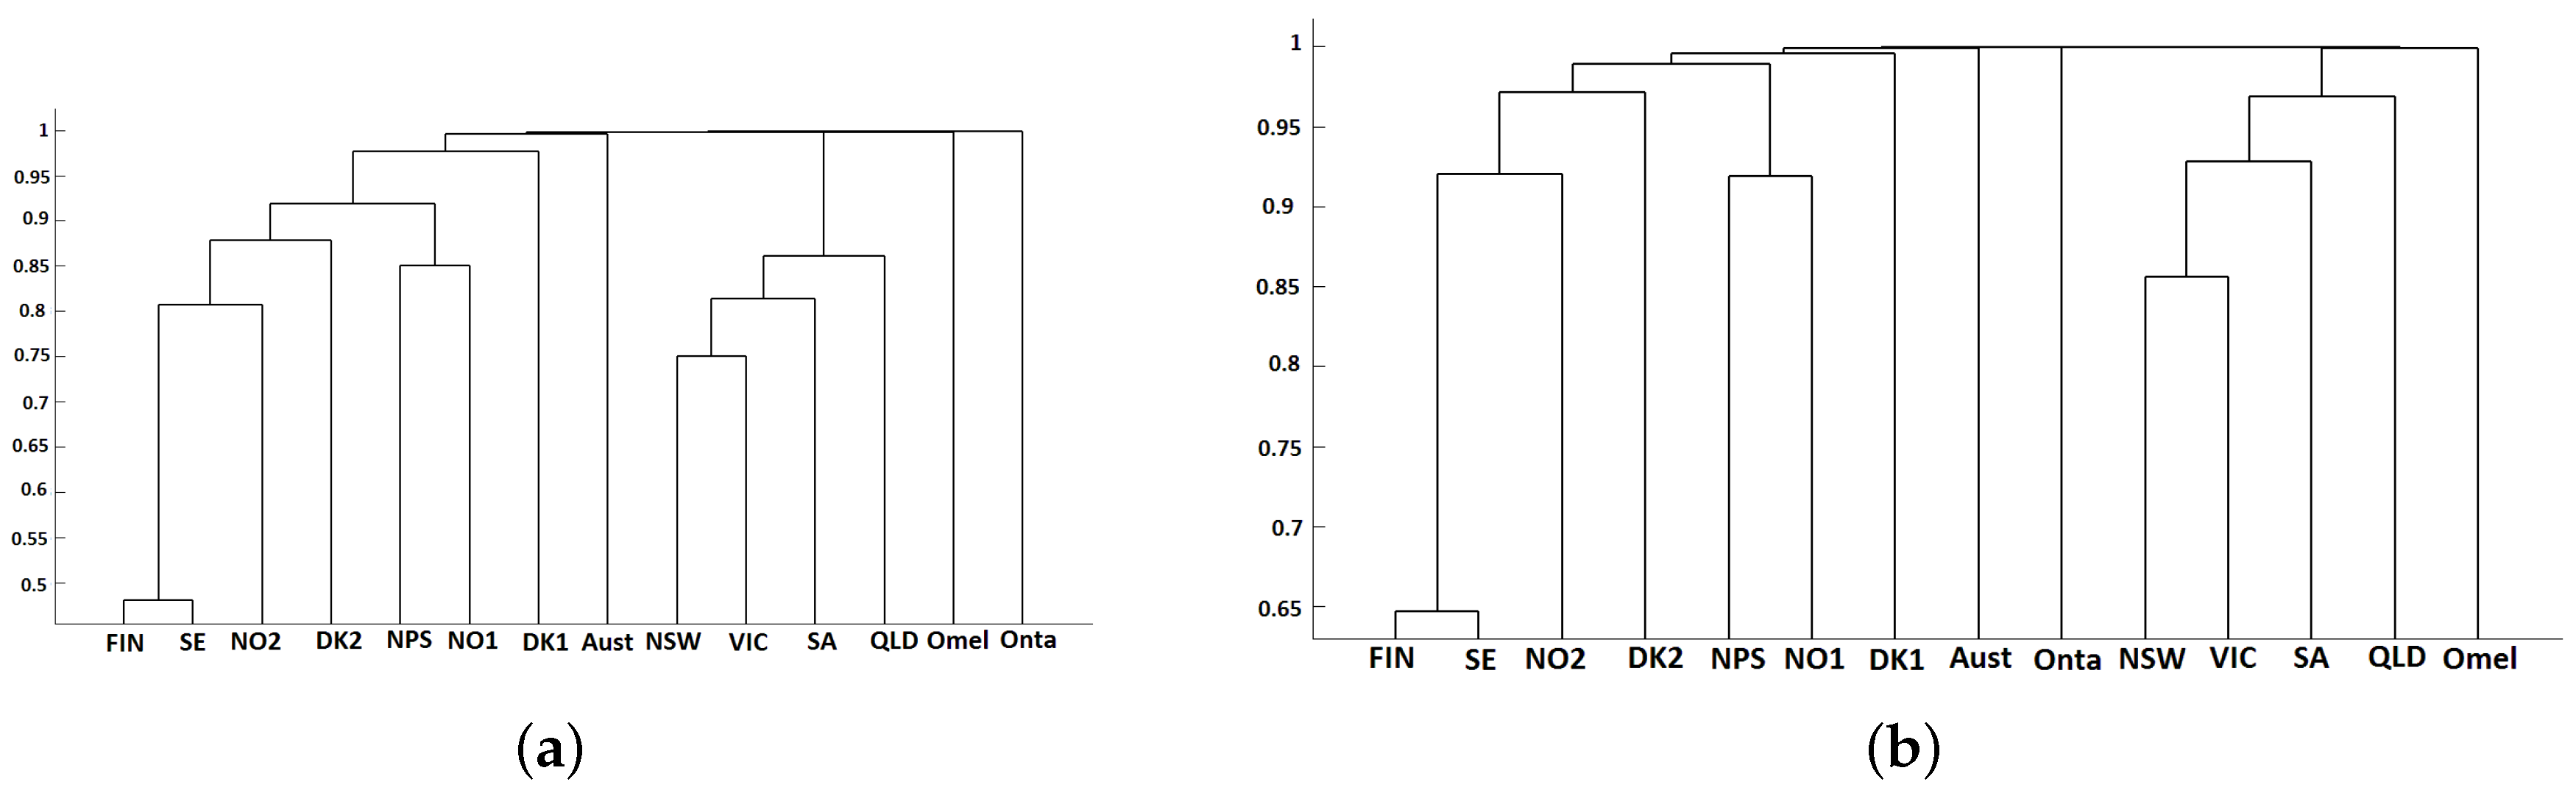
3.2. Classification Results
- Taking weekly seasonal differences:
- First taking weekly seasonal differences and then daily differences:
- Using the method proposed in [37]:where is the number of weeks used for calibration. This approach is more popular among practitioners because it combines differencing at various lags with moving average smoothing.
- First, the seasonal component of the time series must be removed. We suggest using Weron’s method given in (27), but other techniques can be applied.
- Secondly, the resulting time series (after removing the seasonal component) are codified by means of permutations. For that, the researcher has to choose the embedding dimension.
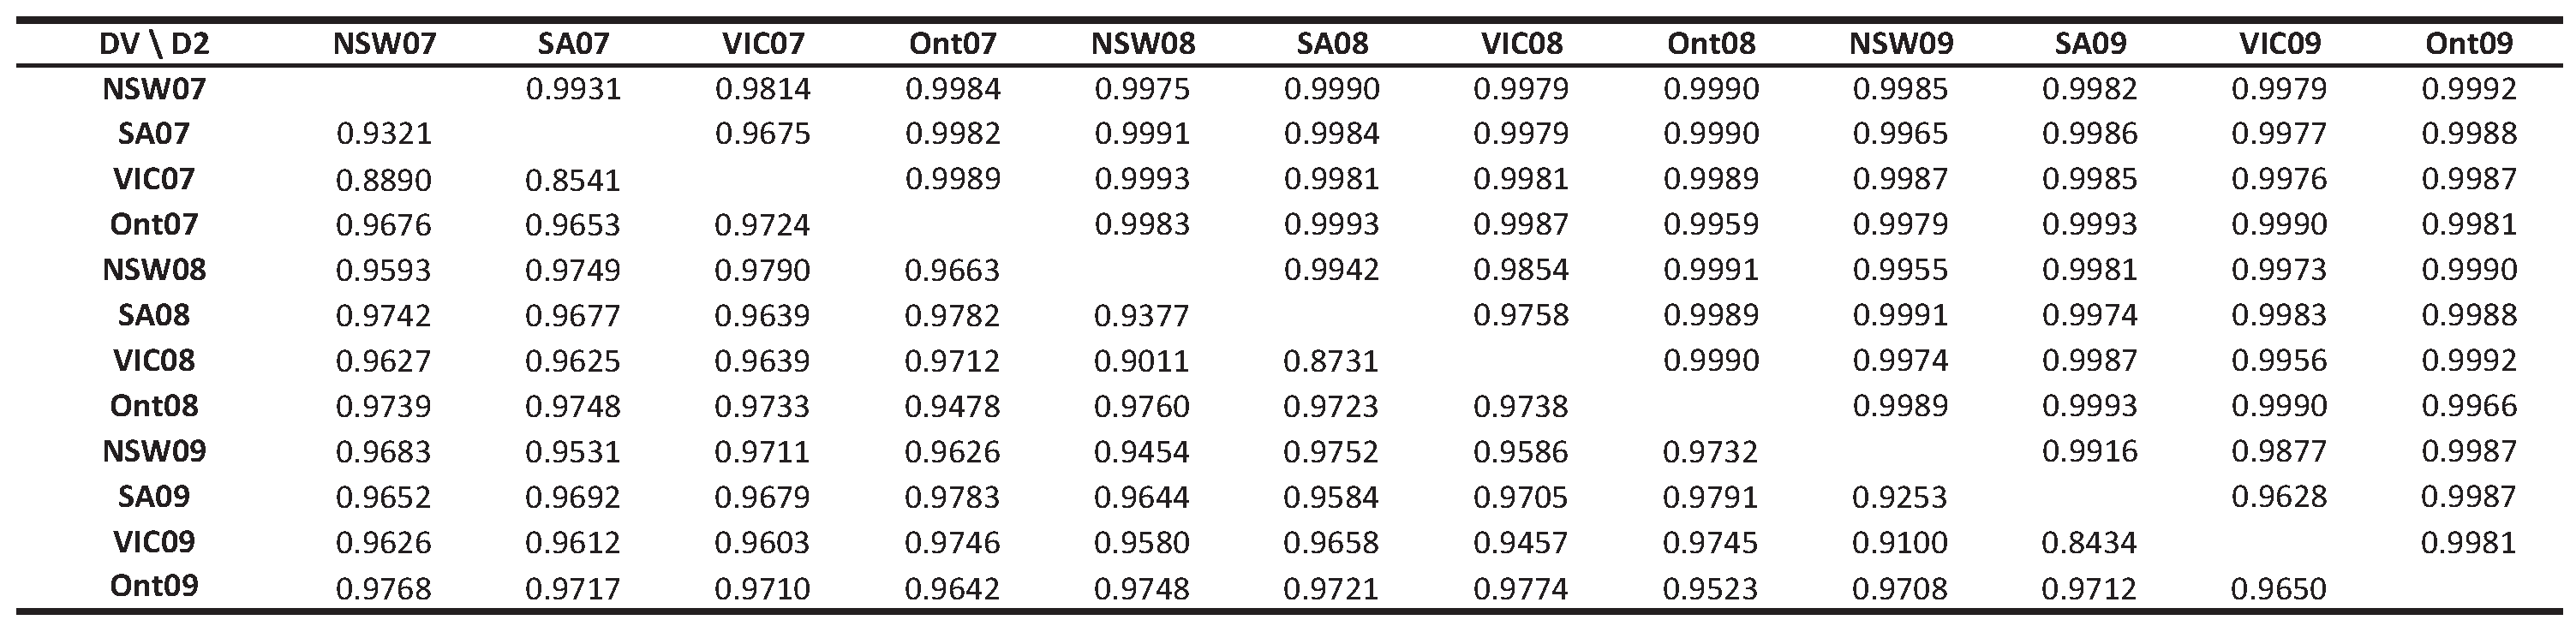
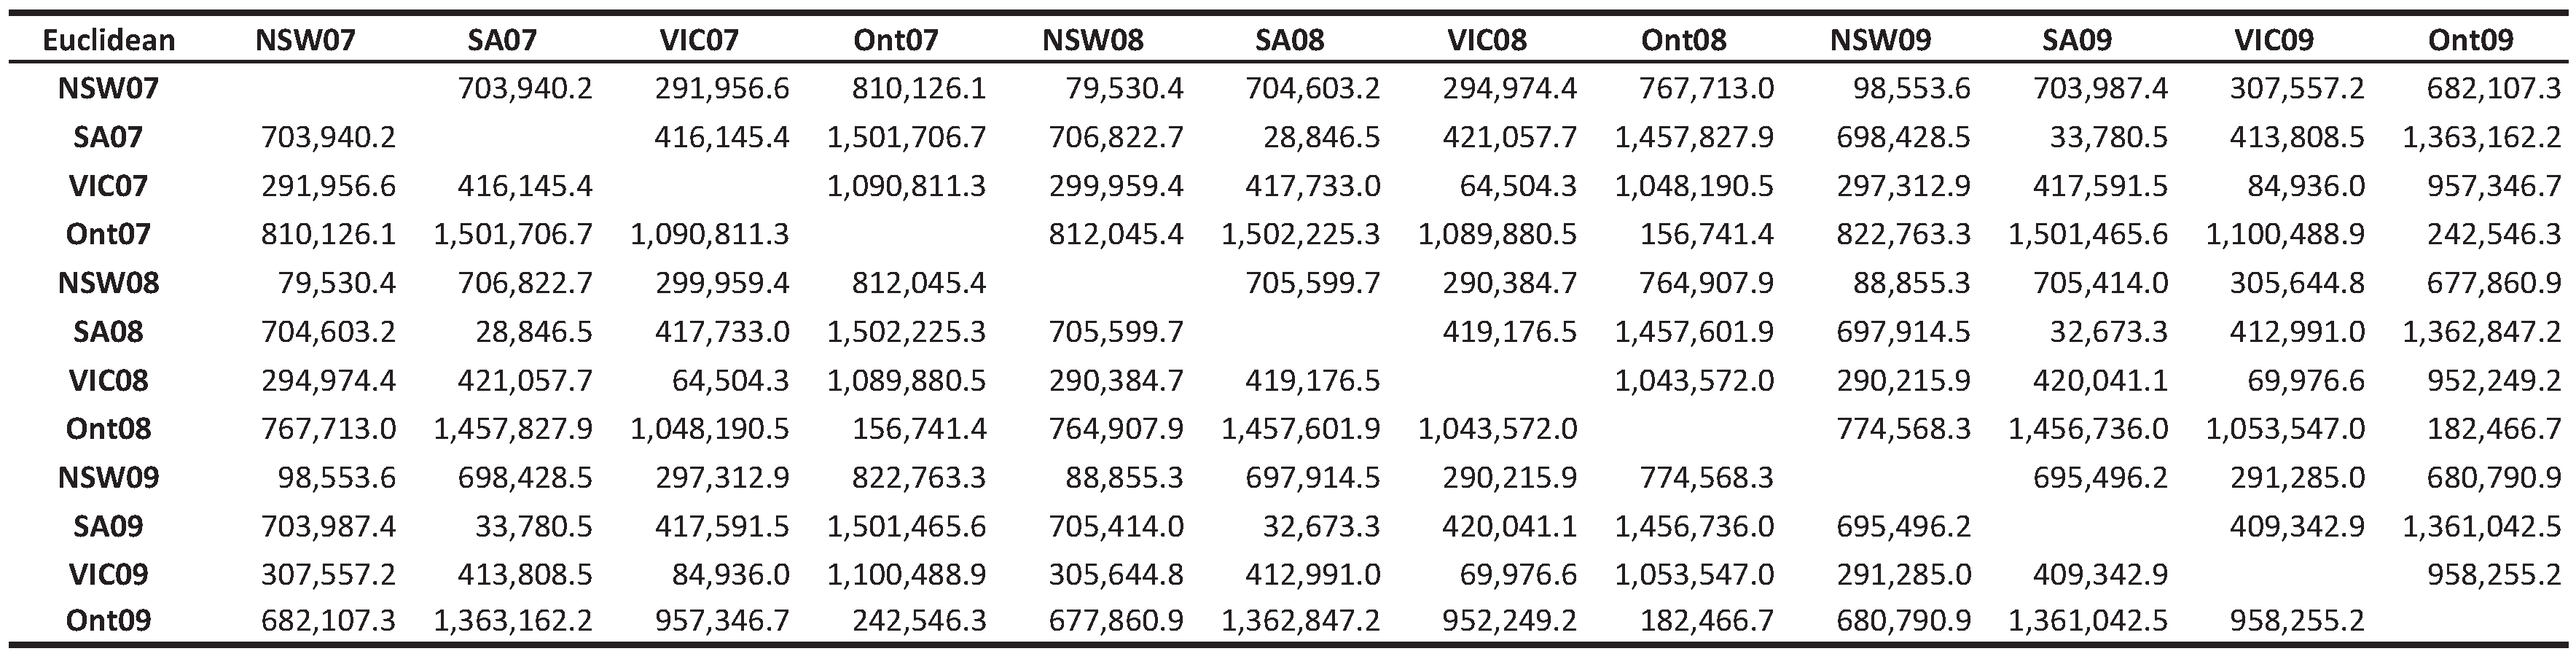
- Thirdly, the distance between each pair of time series (through their codes) is computed, and the corresponding distance matrix is obtained. In this step, we propose using four different dissimilarity measures (, , and ).
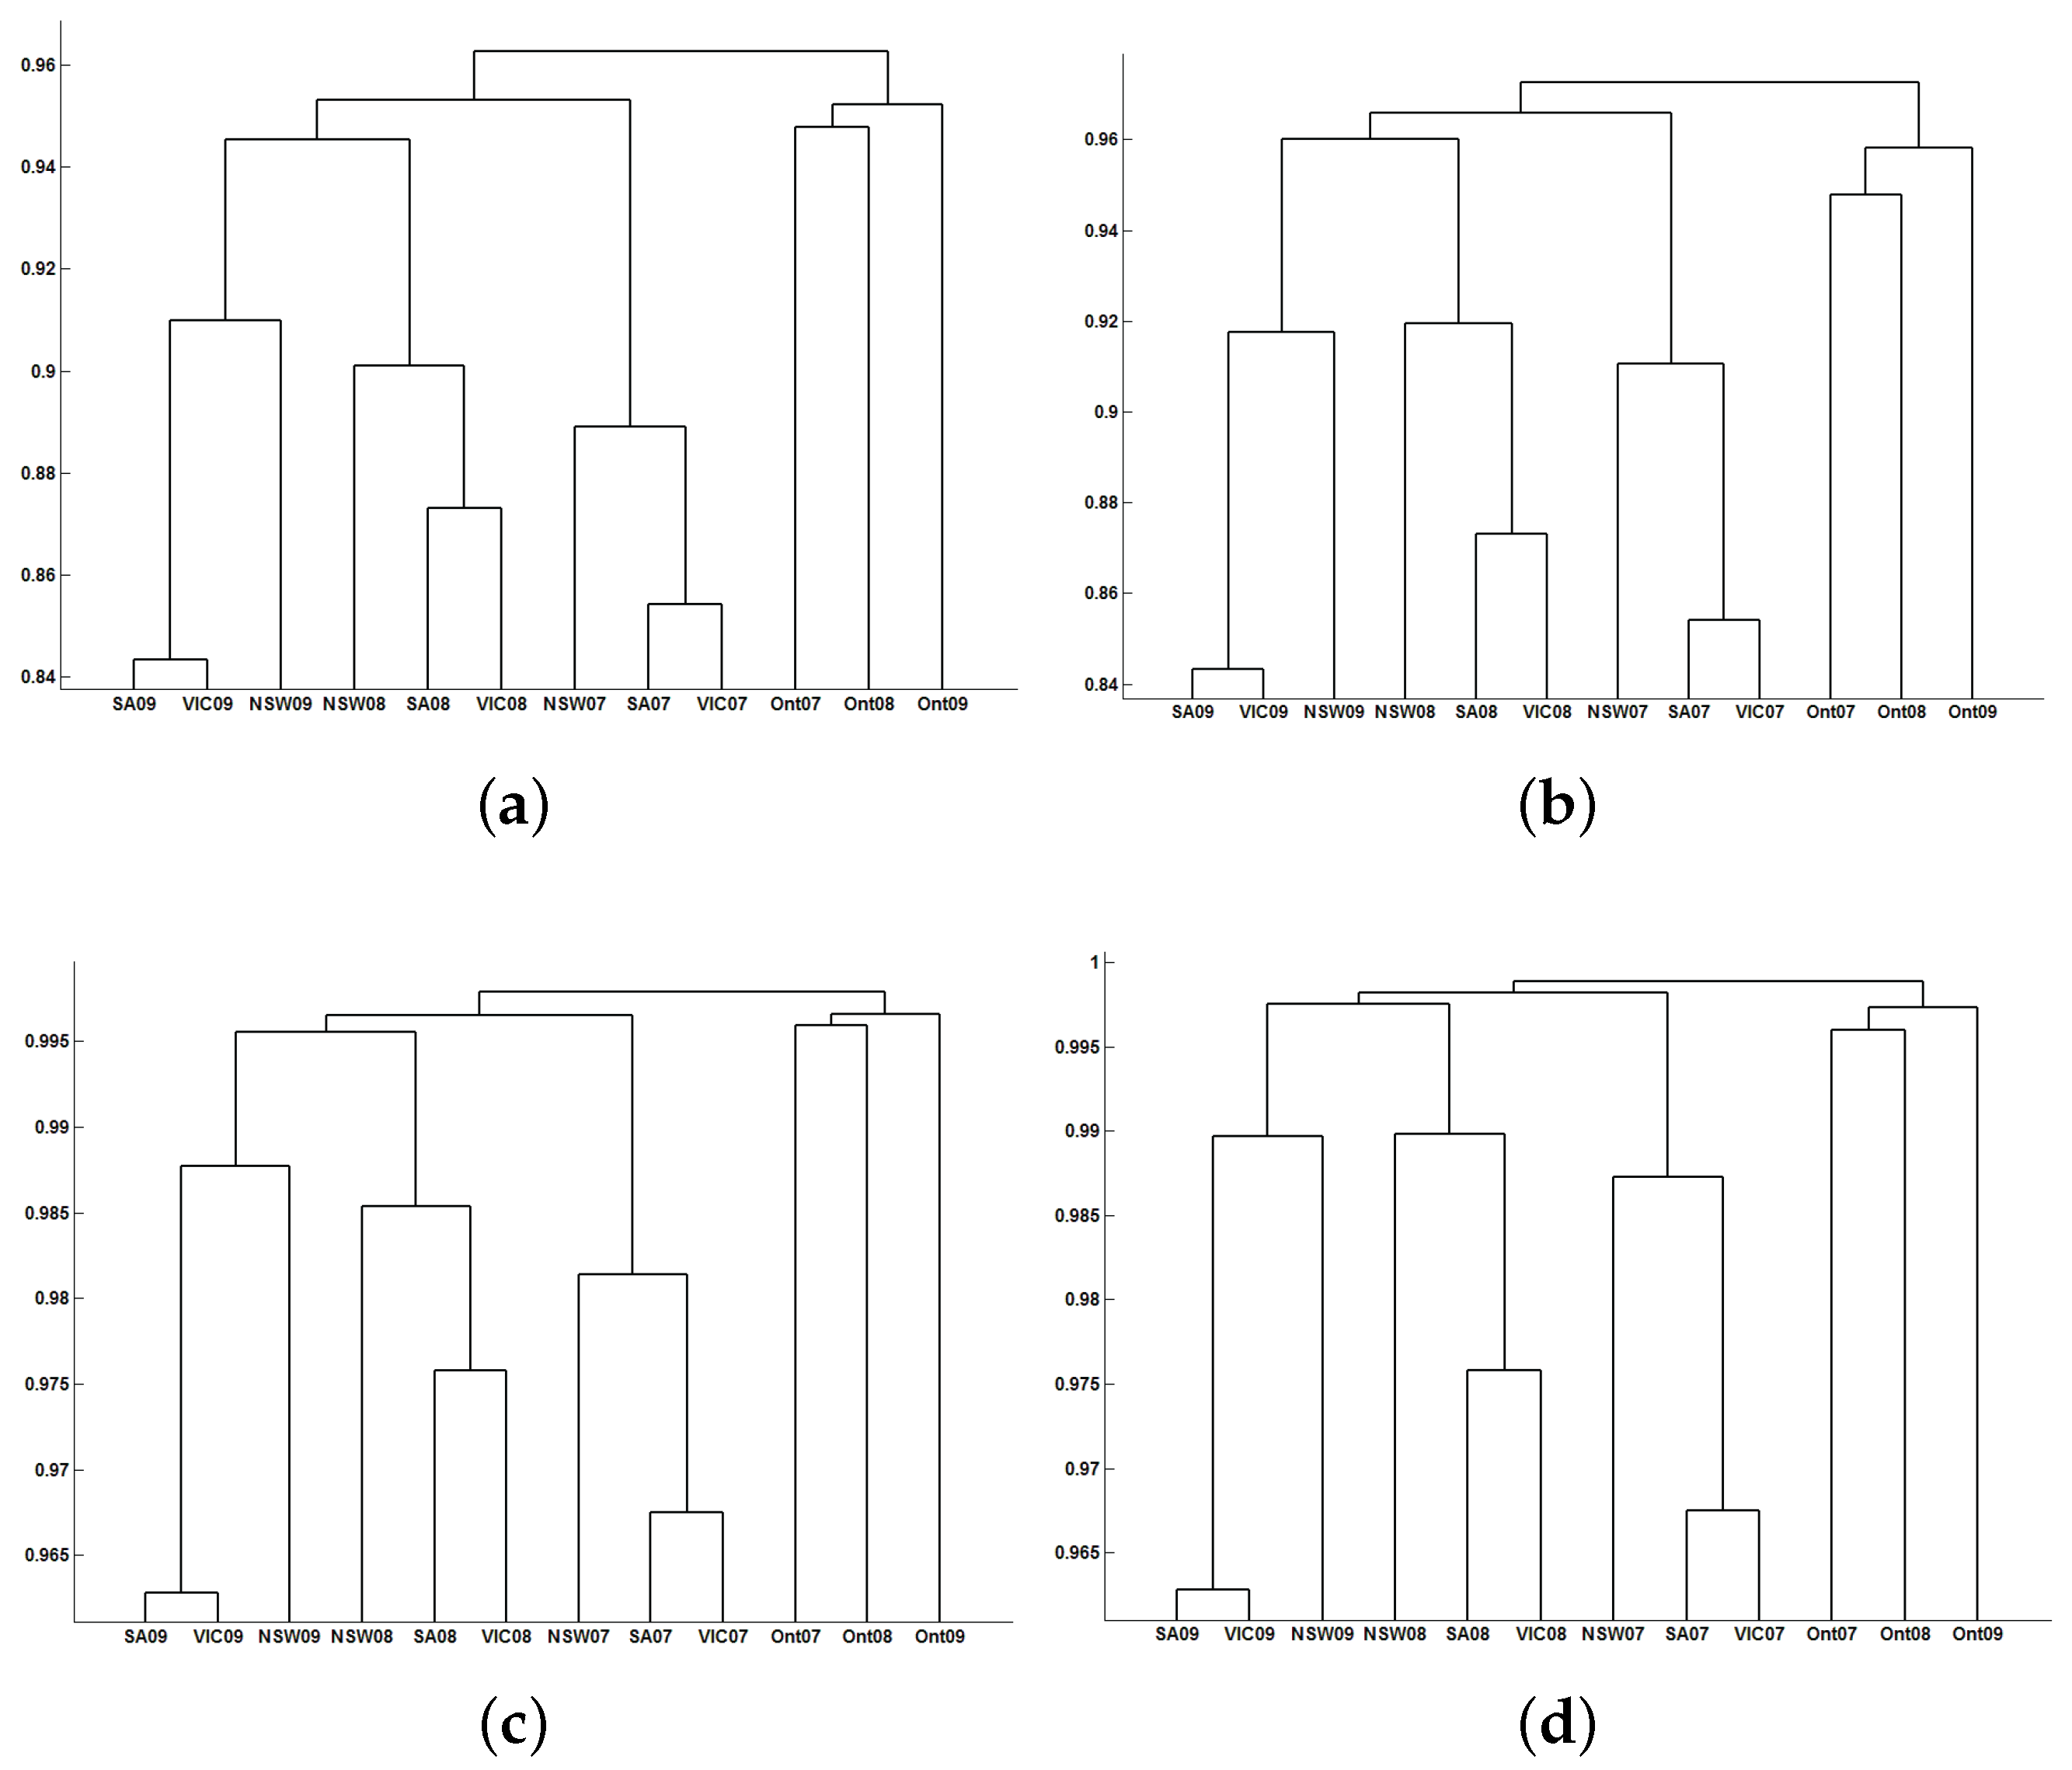
- Finally, the dendrogram is computed obtaining the clustering results. For that, the researcher has to choose the distance measure and the linkage of the hierarchical method.
4. Conclusions
Acknowledgments
Author Contributions
Conflicts of Interest
References
- European Added Value Unit (European Parliamentary Research Service, PE 536.364). Mapping the Cost of Non-Europe, 2014–2019 (April 2015). Available online: http://www.europarl.europa.eu (accessed on 22 May 2016).
- European Added Value Unit (European Parliamentary Research Service, PE 504.466). Cost of Non-Europe in the Single Market for Energy. Annex IV. Benefits of an Integrated European Electricity Market: The Role of Competition (June 2013). Available online: http://www.europarl.europa.eu (accessed on 22 May 2016).
- Australian Energy Regulator. National Electricity Market. Chapter 1. 2009. Available online: https://www.aer.gov.au/system/files/Chapter1Nationalelectricitymarket2009.pdf (accessed on 22 May 2016). [Google Scholar]
- Australian Energy Regulator. National Electricity Market. Chapter 2. 2009. Available online: https://www.aer.gov.au/system/files/Chapter2Nationalelectricitymarket2009.pdf (accessed on 22 May 2016).
- Erni, D. Cointegration in Spot Price Energy Markets. Master’s Thesis, University of St. Gallen (HSG), St. Gallen, Switzerland, 2009. [Google Scholar]
- Mihaylova, I. Stochastic Dependencies of Spot Prices in the European Electricity. Master’s Thesis, University of St. Gallen (HSG), St. Gallen, Switzerland, 2009. [Google Scholar]
- Bosco, B.; Parisio, L.; Pelagatti, M.; Baldi, F. Long-run relations in european electricity prices. J. Appl. Econom. 2010, 25, 805–832. [Google Scholar] [CrossRef]
- Bollino, C.A.; Ciferri, D.; Polinori, P. Integration and convergence in European electricity markets. Munich Pers. RePEc Arch. 2013, 1–16. [Google Scholar] [CrossRef]
- Haugh, L.D. Checking the independence of two covariance stationary time series: A univariate residual cross-correlation approach. J. Am. Stat. Assoc. 1976, 71, 378–385. [Google Scholar] [CrossRef]
- Hong, Y. Testing the independence between two covariance stationary time series. Biometrika 1986, 83, 615–625. [Google Scholar] [CrossRef]
- Cánovas, J.S.; Guillamón, A.; Ruiz, M.C. Using permutations to detect dependence between time series. Phys. D Nonlinear Phenom. 2011, 240, 1199–1204. [Google Scholar] [CrossRef]
- Bandt, C.; Pompe, B. Permutation entropy: A natural complexity measure for time series. Phys. Rev. Lett. 2002, 88. [Google Scholar] [CrossRef] [PubMed]
- Bruzzo, A.A.; Gesierich, B.; Santi, M.; Tassinari, C.A.; Birbaumer, N.; Rubboli, G. Permutation entropy to detect vigilance changes and preictal states from scalp EEG in epileptic patients. A preliminary study. Neurol. Sci. 2008, 29, 39–45. [Google Scholar] [CrossRef] [PubMed]
- Cánovas, J.S.; Guillamón, A.; Ruiz, M.C. Using permutations to find structural changes in time series. Fluct. Noise Lett. 2011, 10, 13–30. [Google Scholar] [CrossRef]
- Ruiz, M.C.; Guillamón, A.; Gabaldón, A. A new approach to measure volatility in energy markets. Entropy 2012, 14, 74–91. [Google Scholar] [CrossRef]
- Liao, T.W. Clustering of time series data—A survey. Pattern Recognit. 2005, 38, 1857–1874. [Google Scholar] [CrossRef]
- Aghabozorgi, S.; Shirkhorshidi, A.S.; Wah, T.Y. Time-series clustering—A decade review. Inf. Syst. 2015, 53, 16–38. [Google Scholar] [CrossRef]
- Böckers, V.; Heimeshoff, U. The extent of the European power markets. Energy Econ. 2014, 46, 102–111. [Google Scholar] [CrossRef]
- Izakian, H.; Pedrycz, W.; Jamal, I. Fuzzy clustering of time series data using dynamic time warping distance. Eng. Appl. Artif. Intell. 2015, 39, 235–244. [Google Scholar] [CrossRef]
- Iglesias, F.; Kastner, W. Analysis of Similarity Measures in Times Series Clustering for the Discovery of Building Energy Patterns. Energies 2013, 6, 579–597. [Google Scholar] [CrossRef]
- Möller-Levet, C.S.; Klawonn, F.; Cho, K.H.; Wolkenhauer, O. Fuzzy clustering of short time-series and unevenly distributed sampling points. Adv. Intell. Data Anal. 2003, 330–340. [Google Scholar]
- Foster, E.D. State Space Time Series Clustering Using Discrepancies Based on the Kullback-Leibler Information and the Mahalanobis Distance. Ph.D. Thesis, University of Iowa, Iowa City, IA, USA, 2012. [Google Scholar]
- Lin, J.; Keogh, E.; Wei, L.; Lonardi, S. Experiencing SAX: A novel symbolic representation of time series. Data Min. Knowl. Discov. 2007, 15, 107–144. [Google Scholar] [CrossRef]
- Wallis, S. Measures of Association for Contingency Tables; University College London: London, UK, 2012. [Google Scholar]
- Strehl, A.; Ghosh, J. Cluster Ensembles—A Knowledge Reuse Framework for Combining Multiple Partitions. J. Mach. Learn. Res. 2002, 583–617. [Google Scholar]
- Yao, Y. Information-theoretic measures for knowledge discovery and data mining. In Entropy Measures, Maximum Entropy and Emerging Applications; Springer: Berlin, Germany, 2003; pp. 115–136. [Google Scholar]
- Witten, I.H.; Frank, E. Data Mining: Practical Machine Learning Tools and Techniques; Morgan Kaufmann: Amsterdam, The Netherland, 2005. [Google Scholar]
- Kraskov, A.; Stögbauer, H.; Andrzejak, R.G.; Grassberger, P. Hierarchical Clustering Based on Mutual Information. Biol. Phys. 2003, 1–11. [Google Scholar]
- Nord Pool Spot. Available online: http://www.nordpoolspot.com (accessed on 3 March 2015).
- Independent Electricity System Operator of Ontario Market Web Page. Available online: http://www.theimo.com/imoweb/marketdata/marketData.asp (accessed on 3 March 2015).
- Australian Energy Market Operator Web Page. Available online: http://www.aemo.com.au/data/price_demand.html (accessed on 3 March 2015).
- The Iberian electricity spot Market Operator (OMIE). Available online: http://www.omie.es (accessed on 3 March 2015).
- Energy Exchange Austria (EXAA). Webpage of the Energy Exchange Austria. Available online: http://www.exaa.at (accessed on 3 March 2015).
- European Commission. Commission Decision of 14.4.2010 relating to a proceeding under Article 102 of the Treaty on the Functioning of the European Union and Article 54 of the EEA Agreement (Case 39521-Swedish Interconnectors). 2010. Available online: http://ec.europa.eu/competition/antitrust/cases/dec-docs/39351/39351-1211-8.pdf (accessed on 25 July 2016).
- Australian Energy Market Commission (AEMC). Congestion Management Review (Final Report, June 2008). Available online: http://www.aemc.gov.au/getattachment/ed17404e-3a72-491f-a579-b92aaddace36/Final-Report.aspx (accessed on 22 May 2016).
- ENTSO-E (European Network of Transmission System Operators for Electricity). Available online: https://www.entsoe.eu/Pages/default.aspx (accessed on 22 May 2016).
- Weron, R. Modeling and Forecasting Electricity Loads and Prices: A Statistical Approach; Wiley: Chichester, UK, 2006. [Google Scholar]
- Energy Authority. National Report 2014. Available online: https://www.energiavirasto.fi/documents/10179/0/ National+Report+2014+Finland+1602-601-2014+-+20140710.pdf/61dd1249-c1d7-4b15-8af6-e2ce41f8dcd9?version=1.0 (accessed on 22 May 2016).
- Fingrid (Transmission System Operator in Finland). Available online: http://www.fingrid.fi/en/Pages/default.aspx (accessed on 22 May 2016).
- Energie Control Austria, E-Control (Austrian regulator). Market Report 2010: National Report to the European Commission. Available online: http://www.e-control.at (accessed on 22 May 2016).
- NERA Economic Consulting. The Wholesale Electricity Market in Australia. A Report to the Australian Energy Market Commission (March 2008). Available online: http://www.aemc.gov.au/ (accessed on 22 May 2016).
- Nordic Energy Regulators. NorREG Report on the Price Peaks in the Nordic Wholesale Market During Winter 2009–2010 (Report 1/2011). Available online: http://www.nordicenergyregulators.org/publications (accessed on 22 May 2016).


| -Type | -Type | ⋯ | -Type | ||
|---|---|---|---|---|---|
| -type | ⋯ | ||||
| -type | ⋯ | ||||
| ⋮ | ⋮ | ⋮ | ⋮ | ⋮ | |
| -type | ⋯ | ||||
| ⋯ |
| Region/Year | 2004–2005 | 2005–2006 | 2006–2007 | 2007–2008 | ||||
|---|---|---|---|---|---|---|---|---|
| Import | Export | Import | Export | Import | Export | Import | Export | |
| QLD | - | 9% | - | 13% | - | 14% | - | 10% |
| NSW | 11% | - | 12% | - | 11% | - | 8% | - |
| VIC | - | 6% | - | 3% | - | 4% | - | 2% |
| SA | 18% | - | 20% | - | 7% | - | - | - |
| TA | - | - | - | - | 13% | - | 22% | - |
| ∖ | NSW | QLD | SA | VIC | Aust | DK2 | DK1 | FIN | NPS | Omel | Onta | NO1 | SE | NO2 |
|---|---|---|---|---|---|---|---|---|---|---|---|---|---|---|
| NSW | 0.65 | 0.77 | 0.65 | 0.98 | 0.98 | 0.98 | 0.98 | 0.97 | 0.97 | 0.98 | 0.98 | 0.98 | 0.98 | |
| QLD | 0.75 | 0.86 | 0.8 | 0.98 | 0.98 | 0.98 | 0.98 | 0.98 | 0.98 | 0.98 | 0.98 | 0.98 | 0.98 | |
| SA | 0.87 | 0.94 | 0.66 | 0.98 | 0.98 | 0.98 | 0.98 | 0.98 | 0.98 | 0.98 | 0.98 | 0.98 | 0.98 | |
| VIC | 0.75 | 0.89 | 0.76 | 0.98 | 0.98 | 0.98 | 0.98 | 0.98 | 0.98 | 0.98 | 0.98 | 0.98 | 0.98 | |
| Aust | 1 | 1 | 1 | 1 | 0.96 | 0.95 | 0.97 | 0.97 | 0.97 | 0.98 | 0.97 | 0.97 | 0.97 | |
| DK2 | 1 | 1 | 1 | 1 | 0.99 | 0.89 | 0.75 | 0.85 | 0.98 | 0.98 | 0.92 | 0.68 | 0.86 | |
| DK1 | 1 | 1 | 1 | 1 | 0.99 | 0.96 | 0.92 | 0.91 | 0.98 | 0.98 | 0.95 | 0.91 | 0.94 | |
| FIN | 1 | 1 | 1 | 1 | 1 | 0.87 | 0.98 | 0.79 | 0.98 | 0.98 | 0.9 | 0.35 | 0.74 | |
| NPS | 1 | 1 | 1 | 1 | 1 | 0.93 | 0.97 | 0.87 | 0.98 | 0.98 | 0.76 | 0.75 | 0.79 | |
| Omel | 1 | 1 | 1 | 1 | 1 | 1 | 1 | 1 | 1 | 0.98 | 0.98 | 0.98 | 0.98 | |
| Onta | 1 | 1 | 1 | 1 | 1 | 1 | 1 | 1 | 1 | 1 | 0.98 | 0.98 | 0.98 | |
| NO1 | 1 | 1 | 1 | 1 | 1 | 0.98 | 0.99 | 0.97 | 0.85 | 1 | 1 | 0.86 | 0.87 | |
| SE | 1 | 1 | 1 | 1 | 1 | 0.82 | 0.97 | 0.48 | 0.82 | 1 | 1 | 0.94 | 0.63 | |
| NO2 | 1 | 1 | 1 | 1 | 1 | 0.94 | 0.99 | 0.85 | 0.87 | 1 | 1 | 0.95 | 0.76 |
| ∖ | NSW | QLD | SA | VIC | Aust | DK2 | DK1 | FIN | NPS | Omel | Onta | NO1 | SE | NO2 |
|---|---|---|---|---|---|---|---|---|---|---|---|---|---|---|
| NSW | 0.86 | 0.93 | 0.86 | 1 | 1 | 1 | 1 | 1 | 1 | 1 | 1 | 1 | 1 | |
| QLD | 0.75 | 0.97 | 0.94 | 1 | 1 | 1 | 1 | 1 | 1 | 1 | 1 | 1 | 1 | |
| SA | 0.87 | 0.94 | 0.86 | 1 | 1 | 1 | 1 | 1 | 1 | 1 | 1 | 1 | 1 | |
| VIC | 0.75 | 0.89 | 0.76 | 1 | 1 | 1 | 1 | 1 | 1 | 1 | 1 | 1 | 1 | |
| Aust | 1 | 1 | 1 | 1 | 1 | 1 | 1 | 1 | 1 | 1 | 1 | 1 | 1 | |
| DK2 | 1 | 1 | 1 | 1 | 0.99 | 0.98 | 0.93 | 0.96 | 1 | 1 | 0.99 | 0.9 | 0.97 | |
| DK1 | 1 | 1 | 1 | 1 | 0.99 | 0.96 | 0.99 | 0.98 | 1 | 1 | 1 | 0.99 | 0.99 | |
| FIN | 1 | 1 | 1 | 1 | 1 | 0.87 | 0.98 | 0.93 | 1 | 1 | 0.98 | 0.65 | 0.92 | |
| NPS | 1 | 1 | 1 | 1 | 1 | 0.93 | 0.97 | 0.88 | 1 | 1 | 0.92 | 0.9 | 0.93 | |
| Omel | 1 | 1 | 1 | 1 | 1 | 1 | 1 | 1 | 1 | 1 | 1 | 1 | 1 | |
| Onta | 1 | 1 | 1 | 1 | 1 | 1 | 1 | 1 | 1 | 1 | 1 | 1 | 1 | |
| NO1 | 1 | 1 | 1 | 1 | 1 | 0.98 | 0.99 | 0.97 | 0.85 | 1 | 1 | 0.97 | 0.97 | |
| SE | 1 | 1 | 1 | 1 | 1 | 0.82 | 0.97 | 0.48 | 0.82 | 1 | 1 | 0.94 | 0.86 | |
| NO2 | 1 | 1 | 1 | 1 | 1 | 0.94 | 0.99 | 0.85 | 0.88 | 1 | 1 | 0.95 | 0.76 |
| ∖ | NSW | QLD | SA | VIC | Aust | DK2 | DK1 | FIN | NPS | Omel | Onta | NO1 | SE | NO2 |
|---|---|---|---|---|---|---|---|---|---|---|---|---|---|---|
| NSW | 0.69 | 0.83 | 0.71 | 1 | 1 | 1 | 1 | 1 | 1 | 1 | 1 | 1 | 1 | |
| QLD | 0.69 | 0.74 | 0.66 | 0.98 | 0.97 | 0.98 | 0.98 | 0.98 | 0.97 | 0.98 | 0.98 | 0.98 | 0.97 | |
| SA | 0.83 | 0.92 | 0.44 | 0.98 | 0.98 | 0.97 | 0.98 | 0.98 | 0.98 | 0.98 | 0.97 | 0.97 | 0.98 | |
| VIC | 0.71 | 0.86 | 0.65 | 0.98 | 0.97 | 0.98 | 0.98 | 0.98 | 0.98 | 0.98 | 0.97 | 0.97 | 0.98 | |
| Aust | 1 | 1 | 1 | 1 | 0.94 | 0.93 | 0.96 | 0.95 | 0.97 | 0.97 | 0.97 | 0.96 | 0.97 | |
| DK2 | 1 | 1 | 1 | 1 | 0.99 | 0.77 | 0.72 | 0.8 | 0.97 | 0.98 | 0.91 | 0.69 | 0.79 | |
| DK1 | 1 | 1 | 1 | 1 | 0.99 | 0.93 | 0.9 | 0.85 | 0.97 | 0.98 | 0.96 | 0.88 | 0.93 | |
| FIN | 1 | 1 | 1 | 1 | 1 | 0.91 | 0.99 | 0.68 | 0.97 | 0.98 | 0.83 | 0.19 | 0.52 | |
| NPS | 1 | 1 | 1 | 1 | 1 | 0.95 | 0.97 | 0.87 | 0.97 | 0.97 | 0.7 | 0.65 | 0.69 | |
| Omel | 1 | 1 | 1 | 1 | 1 | 1 | 1 | 1 | 1 | 0.97 | 0.97 | 0.98 | 0.98 | |
| Onta | 1 | 1 | 1 | 1 | 1 | 1 | 1 | 1 | 1 | 1 | 0.98 | 0.98 | 0.98 | |
| NO1 | 1 | 1 | 1 | 1 | 1 | 0.99 | 1 | 0.96 | 0.89 | 1 | 1 | 0.81 | 0.8 | |
| SE | 1 | 1 | 1 | 1 | 1 | 0.89 | 0.98 | 0.36 | 0.84 | 1 | 1 | 0.96 | 0.44 | |
| NO2 | 1 | 1 | 1 | 1 | 1 | 0.95 | 0.99 | 0.75 | 0.87 | 1 | 1 | 0.95 | 0.67 |
| ∖ | NSW | QLD | SA | VIC | Aust | DK2 | DK1 | FIN | NPS | Omel | Onta | NO1 | SE | NO2 |
|---|---|---|---|---|---|---|---|---|---|---|---|---|---|---|
| NSW | 0.82 | 0.91 | 0.83 | 1 | 1 | 1 | 1 | 1 | 1 | 1 | 1 | 1 | 1 | |
| QLD | 0.7 | 0.96 | 0.92 | 1 | 1 | 1 | 1 | 1 | 1 | 1 | 1 | 1 | 1 | |
| SA | 0.83 | 0.92 | 0.79 | 1 | 1 | 1 | 1 | 1 | 1 | 1 | 1 | 1 | 1 | |
| VIC | 0.71 | 0.86 | 0.65 | 1 | 1 | 1 | 1 | 1 | 1 | 1 | 1 | 1 | 1 | |
| Aust | 1 | 1 | 1 | 1 | 1 | 1 | 1 | 1 | 1 | 1 | 1 | 1 | 1 | |
| DK2 | 1 | 1 | 1 | 1 | 0.99 | 0.96 | 0.95 | 0.97 | 1 | 1 | 0.99 | 0.94 | 0.97 | |
| DK1 | 1 | 1 | 1 | 1 | 0.99 | 0.93 | 0.99 | 0.98 | 1 | 1 | 1 | 0.99 | 1 | |
| FIN | 1 | 1 | 1 | 1 | 1 | 0.91 | 0.99 | 0.93 | 1 | 1 | 0.98 | 0.53 | 0.86 | |
| NPS | 1 | 1 | 1 | 1 | 1 | 0.95 | 0.97 | 0.87 | 1 | 1 | 0.94 | 0.91 | 0.93 | |
| Omel | 1 | 1 | 1 | 1 | 1 | 1 | 1 | 1 | 1 | 1 | 1 | 1 | 1 | |
| Onta | 1 | 1 | 1 | 1 | 1 | 1 | 1 | 1 | 1 | 1 | 1 | 1 | 1 | |
| NO1 | 1 | 1 | 1 | 1 | 1 | 0.99 | 1 | 0.96 | 0.89 | 1 | 1 | 0.98 | 0.97 | |
| SE | 1 | 1 | 1 | 1 | 1 | 0.89 | 0.98 | 0.36 | 0.84 | 1 | 1 | 0.96 | 0.8 | |
| NO2 | 1 | 1 | 1 | 1 | 1 | 0.95 | 0.99 | 0.75 | 0.87 | 1 | 1 | 0.95 | 0.67 |
© 2016 by the authors; licensee MDPI, Basel, Switzerland. This article is an open access article distributed under the terms and conditions of the Creative Commons Attribution (CC-BY) license (http://creativecommons.org/licenses/by/4.0/).
Share and Cite
Ruiz-Abellón, M.D.C.; Gabaldón, A.; Guillamón, A. Dependency-Aware Clustering of Time Series and Its Application on Energy Markets. Energies 2016, 9, 809. https://doi.org/10.3390/en9100809
Ruiz-Abellón MDC, Gabaldón A, Guillamón A. Dependency-Aware Clustering of Time Series and Its Application on Energy Markets. Energies. 2016; 9(10):809. https://doi.org/10.3390/en9100809
Chicago/Turabian StyleRuiz-Abellón, María Del Carmen, Antonio Gabaldón, and Antonio Guillamón. 2016. "Dependency-Aware Clustering of Time Series and Its Application on Energy Markets" Energies 9, no. 10: 809. https://doi.org/10.3390/en9100809
APA StyleRuiz-Abellón, M. D. C., Gabaldón, A., & Guillamón, A. (2016). Dependency-Aware Clustering of Time Series and Its Application on Energy Markets. Energies, 9(10), 809. https://doi.org/10.3390/en9100809