1. Introduction
According to the IPCC (Intergovernmental Panel on Climate Change) (2011), energy production from fossil fuels is responsible for over 55% of the world’s greenhouse gas (GHG) emissions [
1]. The IEA (The International Energy Agency) (2008a) estimates that the share of energy consumed in cities accounts for over 70% of these emissions [
2]. Moreover, cities form an even more important arena for climate change mitigation efforts given that city administrations have a unique ability to communicate with the public and respond to public demands quickly and efficiently and thus to bring about meaningful changes at a local level in response to global issues such as climate change [
3].
Urban planning is a key channel for the municipal energy efficiency and climate action [
4]. Compact urban form is predominantly seen as a prerequisite for urban environmental sustainability [
5,
6] further increasing the importance of the development of urban settlements. Consequently, further urbanization and densification of existing urban structures have become key planning strategies because of their connection to reduced energy requirements for housing and transportation (e.g., [
7,
8]). The greater density of urban structures also enables combined heat and power (CHP) production and district heating (DH), which are seen as promising means to reduce the energy systems related GHGs around the globe [
9,
10]. CHP can potentially decrease the fuel requirements by one third compared to separate production with an equal fuel-mix [
11,
12,
13].
The global role of CHP is also expected to increase radically in the near future. In 2007, the G8 countries unanimously urged a radical increase in global CHP production [
9] and the process is being implemented. For example, the CHP share is estimated to increase from the current 2015 levels of below 20% in China and in Germany to 30% in 2030, to 18% from the current 13% in the US, and to 16% from the current 9% in France [
9]. Germany has even set itself an official technology penetration target to increase the share of power production by CHP to 25% in 2020 [
14].
However, the environmental justification for the dominance of densification and CHP-centered policies has also been questioned, and alternative approaches to urban sustainability suggested [
15,
16,
17,
18]. Therefore, comparing the environmental benefits of CHP and other energy system options is becoming a topical issue in urban planning.
Actually, under the typical conditions of local DH networks in CHP environments and wider scale electricity grids, a number of significant uncertainties hinder verifying the environmental rationale of the decisions on energy systems and comparisons between CHP and other options. First, the choice of utilizing average or marginal technology in an assessment for electricity is often not clear, while the impact on the assessment results can be huge (e.g., [
19]) as marginal technologies tend to be the most polluting. Marginal technology refers to the last generator that produces electricity to the network and the marginal electricity mix is defined as the last set of power plants that provides electricity to the network [
20]. It has also been suggested that marginal production should refer to a number of technologies instead of one [
21,
22].
Secondly, a life cycle perspective to the emissions intensities of different energy options adds an important angle to the complexity due to the high variation in the published results (e.g., [
23]). The uncertainties found in life cycle assessments (LCA) of energy production are actually one of the main problems in LCAs [
24]. Furthermore, the two basic LCA approaches, attributional LCA (ALCA) and consequential LCA (CLCA), can lead to very different outcomes, but it can be very unclear which approach to utilize. The selection of approach also relates to the marginal
vs. average production question. ALCA can be defined as a method to describe a system as it is and CLCA as a method to assess how a system will change due a certain decision (e.g., [
25]). It has been said that in ALCA average technologies should be utilized, whereas CLCA refers to the situation of marginal technologies (e.g., [
25,
26]). Plevin
et al. (2013) go as far as to state that ALCA should not be used when policy guidelines are searched for or the LCA results facilitate decision making [
26], but there is no consensus on the question among the scientific community. The boundaries used define both marginal and average technologies and this also causes variation in studies together with the use of different LCA approaches.
Nevertheless, defining when a marginal change in demand actually occurs in the context of urban development is a complex task. As to residential energy use, new residential developments increase the demand from a local perspective, but when the boundary is extended to cover the whole system the local increase appears predominantly only as a change in the geography of demand as households move to the new location. However, any change in the geography of demand, change in temporal demand or change in quantity will have an impact on marginal power production dynamics on a system level. Since the environmental intentions in urban planning are no longer limited to the local environmental quality but include the contribution to global issues such as climate change, local optimization does not necessarily serve far-reaching planning purposes. While one option may seem to be preferable within a restricted area, from a wider perspective the situation can appear as very different. Therefore choosing the right assessment method is not trivial at all.
When extending the assessment boundary to a system level covering potentially multiple nations and sub-energy systems with their supply chain properties, defining the marginal power technologies and impacts becomes virtually impossible. If electricity imports are allowed to balance supply and demand, the definition of marginal production technologies based on the technological qualities loses its basis. For example, extensive construction of wind power capacity may cause excess energy production [
27], and one way to balance the supply and demand is exports. Furthermore, the other Nordic countries in the Nordic grid are net exporters of electricity while Finland is a net importer [
28]. In addition, a temporal perspective to an assessment increases the complexity due to such variables as the capacity to increase renewables. In addition, even if ALCA offered relatively simple analysis options, the uncertainties of basing decision making on CLCA remain substantial. From the perspective of increasing renewable capacity, several authors have pointed out how the periodicity of both wind and solar causes problems [
29,
30,
31], but there are conflicting results as to how much this actually influences the GHG emissions [
30,
31]. In any case, in the future, marginal power production technologies will likely be much closer to average production technologies from the perspective of GHG emissions. This leads to a situation where CLCA cannot be used based on current system dynamics as is, although it can outrank the ALCA approach. An adequate CLCA in this context needs to predict the development of a system within the use lifetime and/or has sensitivity and probability analyses integrated into it.
The third main problem in comparing the GHGs from CHP and other options in urban planning decision making arises from the fact that there is no unequivocal method to assign the emissions for electricity and heat in CHP production (e.g., [
32]). Each one can be claimed as the primary product which should carry the main emissions load. Consequentially, a number of allocation methods have been suggested with highly varying emissions distributions. Thus, a certain CHP utility operating with purely fossil fuels can still claim to be selling very low-carbon energy. If the utility chooses to allocate the emissions mostly to electricity, which is sold to the grid with virtually no impact on the grid average, it can claim to be selling low-carbon energy due to the heat production having a low carbon content, and the electricity sold to the end-user being purchased from the grid with low average emissions. An increasing share of CHP has also been shown to relate to high variability in energy GHG assessments [
33].
Under the typical CHP conditions of local CHP production and a national or even international electricity grid the one conducting an assessment or introducing a policy guideline often has the power to present the emissions in the best light for the occasion, or, as happens quite often, needs to rely on second-hand information without proper transparency. However, in the studies with an urban planning perspective, the uncertainties related to the emissions from energy production are rarely given much consideration. Therefore, the results and the policy guidelines that arise can actually rely heavily on methodological choices, but these choices may not be transparent or not even recognized at all.
The purpose of this paper is to compare, from an urban planning perspective, the choice between CHP and a ground-source heat pump (HP) as the energy systems of a new residential area in the light of the uncertainty of the GHG assessment outcomes imposed by the above-mentioned factors. In the paper we present an analysis of the GHG impact of an actual new residential development in Finland to demonstrate the complexity of such an assessment and the problems in giving robust policy guidelines for planners. With the results we show that, with different but justifiable assessment choices, a very wide array of results can be obtained leading to different planning guidelines. We also discuss the comparability of CHP and HP with different assessment assumptions. The boundary issue together with ALCA vs. CLCA is covered by comparing both average and marginal electricity with three different choices of marginal fuel.
Finland provides an interesting case for analyzing the GHG impacts of CHP penetration and comparing CHP with other energy systems. CHP already dominates the heat supply in cities [
28], and high climate mitigation aspirations have been placed on urban densification policies and further CHP utilization. It has been proposed that CHP results in environmental benefits in comparison to HPs in Finnish conditions (e.g., [
34]), but opinions favoring HPs have been presented as well, and there is a current debate on which of the two is in fact superior. The issue is very complex due to the fact that currently heat production in Finland relies heavily on fossil fuels [
28], which leads to significant GHG emissions in absolute terms despite the benefits of CHP. At the same time, electricity in Finland is not very GHG intensive due to the high proportion of nuclear power and renewables [
28]. Finland also belongs to the Nordic grid, which enjoys even lower average emissions due to the hydropower supply from Sweden and Norway. On the other hand, the current marginal production technologies are relatively GHG intensive.
The study design is introduced in
Section 2. The results of the study are presented and discussed in
Section 3 and
Section 4 gives the main conclusions.
2. Study Design
2.1. Case Setting
This paper revisits and reanalyzes the case study of Ristimäki
et al. (2013) [
35] from the perspective of the GHGs from residential energy consumption. In their study Ristimäki
et al. suggested that HPs would be preferable over the current CHP system from the perspectives of both the GHG and cost. However, they only used certain fixed emissions intensities and one allocation method to calculate CHP. In this paper, we reanalyzed the same case to evaluate the potential constraints and uncertainties in their study, and to see if certain assumptions would lead to the reverse selection criteria between HPs and CHP as suggested recently by Rinne and Syri (2013) [
34] in a more general setting in the Finnish context.
The case area is the first phase of the new residential area of Härmälänranta in Tampere, Finland. The site is situated 5 km southwest from the Tampere city center and consists of 7 similar multi-story modern low-energy residential buildings. Every building has 6 floors, 28 apartments and 3100 m2, totaling overall approximately 22,000 gross m2 for around 550 residents.
The buildings of Härmälänranta fall into energy class A in Finland. The energy requirements estimated by Ristimäki
et al. came to 80 kWh/m
2/a for heating and hot water and 14 kWh/m
2/a for communal building electricity [
35]. For our study, we added 25 kWh/m
2/a for household electricity based on the statistics of new district heated apartment buildings in Finland [
36], for a total of approximately 2600 MWh/a for the whole case area.
The local energy company in Tampere is Tampereen Sähkölaitos Oy, which produces both heat and electricity. In the base year of the study, 2012, almost 80% of heat and 93% of electricity were produced in three CHP plants. Almost 70% of the delivered district heat was produced by natural gas in 2012. Other fuels used were peat (13%), wood (17%) and oil (2.5%). In the study we assumed the nearest CHP plant, Naistenlahti 1, to supply the heat in CHP options. In Naistenlahti 1 only natural gas was used as a fuel in the reference year. In the future the plan of the city of Tampere is to increase the use of renewables in energy production, first to 38% in 2020 and further to 80% by 2040. In CHP plants biogas can potentially be used instead of natural gas and solid biomass can be introduced into the DH network as well. Development scenarios from the perspective of DH and electricity from the grid were excluded from the study, but a discussion of the impacts of the 38% biomass future scenario is included as it represents the most likely near future change in the local production environment.
In 2012, the Finnish electricity production fuel-mix consisted of 41% renewables, 20% fossil fuels (50% coal and 50% natural gas), 33% nuclear power and 6% peat [
37]. 25% of the electricity came from CHP [
37]. The shares fluctuate annually due to variations in the global fuel prices and in renewables production, especially due to variable weather conditions. The key case data are presented in
Table 1.
Table 1.
Case Härmälänranta key numbers.
Table 1.
Case Härmälänranta key numbers.
| Categories | Values |
|---|
| Härmälänranta residential area | |
| - Distance from Tampere city center (km) | 5 |
| - DH network in close proximity | yes |
| - Space (gross m2) | 22,000 |
| - Apartments | 196 |
| - Estimated number of residents | 550 |
| Energy consumption estimations | |
| - Heat and hot water (MWh/a) | 1730 |
| - Electricity (MWh/a) | 850 |
| Naistenlahti 1 power plant | |
| - Natural gas | 100% |
| Finnish electricity grid mix | |
| - Renewables | 41% |
| - Nuclear power | 33% |
| - Fossil fuels | 20% |
| - Peat | 6% |
Finland also belongs to the Nord Pool Spot electricity market along with the other Nordic countries, Estonia and Lithuania. The Nord Pool grid is further connected to the Russian, Polish and German grids. The production profile in the Nordic countries connected to the Nord Pool Spot market is based on significantly more renewables than is Finnish electricity production. In 2012, hydropower accounted for 59%, wind for 7%, geothermal power for 1%, nuclear for 13% and thermal power for 20% [
14].
2.2. Compared Energy Options
We compared the two actual planning phase energy system options of Härmälänranta:
- (1)
CHP and
- (2)
HP.
We tested how the assumption on average or marginal production affects the results when different CHP allocation methods and LCA assumptions are utilized. The heating options were adopted from Ristimäki
et al. [
35], but also represented a current lively discussion topic in Finland. We utilized three different fuels for marginal production, coal, oil and gas (following Kara
et al. 2008) [
38] to give scope to the variation of the marginal mix as it should not be considered as relying on only one fuel. The marginal technology was assumed as condensing power with an efficiency range from 33% to 59% according to Cherubini
et al. [
23]. There is also potential temporal variation, especially over a longer time-span, in which fuel fills the final marginal demand change, although coal is dominant at the moment in Finland. Thus, an analysis with these three options provides a good overview of the impact of changes in marginal fuel use and of taking marginal production as a mix of fuels (and technologies) rather than simply as the most GHG intensive coal condensation, which is the prevailing tradition in Finland.
Table 2 presents the compared options.
Table 2.
Compared energy options.
Table 2.
Compared energy options.
| Option | CHP with CHP Electricity | HP with Marginal Electricity | Grid Average Electricity |
|---|
| Allocation/fuel | Benefit Method | Energy Method | Coal | Oil | Gas | Benefit Method | Energy Method | HP |
| Description | CHP heat is used and the resulting electricity production is allocated to the settlement up to their electricity demand. | Coal as a marginal fuel providing all the electricity needed. | Oil as a marginal fuel providing all the electricity needed. | Gas as a marginal fuel providing all the electricity needed. | CHP heat is used but electricity is assumed to come from the Finnish grid. | HP provides heat operating with grid average electricity. Housing electricity is also grid average. |
CHP is assumed to have a production efficiency range of 80% to 95% (HHV; higher heating value) following Cherubini
et al. [
23], of which 30%–45% is electricity and 50% heat. Transmission losses are excluded and are expected to be equal between electricity and heat. We also assumed 60% of the peak power demand to be produced by the CHP plant and the rest in a peak heating plant, resulting in approximately 20% of the DH demand to come from heating plants. For the heating plants we utilized an efficiency range of 77% to 91% from Cherubini
et al. [
23]. In the assessment the CHP fuel-mix is 100% natural gas, and the peak heating plant is assumed to operate with natural gas as well.
The “CHP with CHP electricity”-option is not very often included in any assessments, but we see it as a very relevant option due to the fact that the increase in the heat demand also drives increased electricity production. Commonly heat production from a CHP plant enables and drives the electricity production of such a plant, but not the other way around. As the heat demand of a site has a subsequent impact on the electricity production of the CHP plant involved, the electricity should as well be allocated to the site responsible for the increased production, at least up to the demand level. Furthermore, later in the paper we discuss the very general phenomenon that with certain CHP allocation methods a utility can claim to sell both very low carbon heat and very low carbon electricity even though it actually operates with fossil fuels with relatively high carbon contents.
Assessing the electricity demand of the CHP areas with CHP electricity enables depicting better the full subsequent impact of the new development. In our case, the subsequent change in the local CHP plant’s electricity output is relatively close to the site’s annual demand. Although the match is weaker if the daily and seasonal fluctuations were taken into account, this option depicts an important perspective. If there were surplus electricity from the residential area and CHP, it would decrease the marginal electricity production of the system and thus would have a reduction impact on the emissions from the current system. If the development of electricity and marginal technology production were to lead to marginal electricity production with lower emissions than the surplus electricity from the CHP, emissions would naturally increase. Ultimately the case is about subsequent displacement of resources and a precise assessment of the GHG impact of the new settlement would be very complex. Notwithstanding, the suggested “CHP with CHP electricity” option allows for assessing the GHGs when the grid impact is unknown. It is also worth noting that the “CHP with CHP electricity” option can be justified as today the plants are driven by the level of demand for heat. If there were true excess heat available from, for instance, a power plant driven by the demand for electricity, the allocation option would not be relevant.
Regarding the HP options, the efficiency measure of HPs, COP (Coefficient of Performance),
i.e., the ratio of produced heat to required electricity to run the pump, is typically 2.6–3.6 [
39], and here we used 3.0, following Ristimäki
et al. [
35]. COP can actually reach a level of over 4.0 (e.g., [
34,
40]), and we discuss the impact of the COP assumption on the results as well. HPs are typically not fitted to provide 100% of the needed heat due to decreasing overall efficiency, and at least during peak hours electric heating resistors are used as complementary heaters [
41], but the COP figure takes this into account.
2.3. Life Cycle GHG Intensities for Different Fuels
The published GHG intensities for different fuels and production modes vary significantly depending on the source, for example because of the assessment boundary definition and several necessary assumptions (e.g., [
23,
25]). Cherubini
et al. (2009) [
23] present ranges based on published LCAs for different fuels and production modes for electricity and cogeneration, which we employed in our study. The ranges do not necessarily present the highest or the lowest values suggested by earlier studies, but a wide enough spread to have a significant impact on the results and thus demonstrate the importance of the intensity assumptions. The intensities are for the output, thus including also the conversion efficiency as an important factor.
Table 3 presents the figures from Cherubini
et al. [
23] employed in this study.
Table 3.
GHG intensities for certain electricity and cogeneration technologies and fuels from Cherubini
et al. (2009) [
23].
Table 3.
GHG intensities for certain electricity and cogeneration technologies and fuels from Cherubini et al. (2009) [23].
| Fuel/Production Mode | g CO2e/kWh |
|---|
| Biomass | 54…108 |
| Biogas | 54…234 |
| Wind | 3.6…36 |
| Geothermal | 7.2…36 |
| Hydro | 1.8…36 |
| Solar | 54…144 |
| Coal | 1080…1800 |
| Oil | 720…1080 |
| Nuclear | 18…108 |
| Natural gas | 360…720 |
Using the production distribution of the Finnish grid (see
Section 2.1.) and the lower and upper values of
Table 3 for calculating, the Finnish electricity production intensity has a lower boundary of 213 g CO
2e/kWh and an upper boundary of 391 g CO
2e/kWh.
For the CHP gas power plant the intensity boundaries are the range for natural gas, and for marginal production we used the ranges for coal, oil and natural gas in
Table 3. For the separate heat production in peak heating plants we used the range of 252…306 g CO
2e/kWh for natural gas retrieved from the same study of Cherubini
et al. (2009) [
23] for separate heat production. Other fuels could be used as well to fulfill the peak heat demand, but the impact of separate production in our case is low.
2.4. Emissions Allocation Methods in Co-Production
There are a number of different calculation methods for allocating CHP plant emissions. These include the benefit method, energy method, the energy method, all-for-heat/electricity method, product price method, EN 15316-4-5: 2007 standard’s method, ratio method, and work method. Different methods can lead to very different outcomes with important impacts on the assessment results.
In this study, the two most relevant methods were used in the calculations to allow comparisons between them:
- (1)
benefit method as the dominant method used in Finland and
- (2)
energy method as the globally most widely used method.
In addition, the all-for-electricity method was used to demonstrate an extreme case possible with the different allocation methods.
In the benefit method the emissions of a CHP plant are divided according to the ratio of fuel consumption of separate production forms. For electricity the alternative production form is a condensing power plant (efficiency 33%–59%) and for a thermal water boiler (efficiency 77%–91%). Efficiency ranges, according Cherubini
et al. (2009) [
23] representing true alternative conversion efficiencies, were utilized in the minimum and maximum calculations. Consequently, in this method, the weighting is based on the efficiencies of the separate energy productions of heat and electricity, and it makes a good comparison of the combined production’s benefits if heat and electricity are produced separately. The benefit is allocated to both end fractions. In the calculation, first the fuel consumption of alternative acquisition forms is calculated by dividing the produced energy form in cogeneration by the efficiency of the separate production of energy form.
where
F’e = fuel consumption of alternative acquisition form for electricity
F’h = fuel consumption of alternative acquisition form for heat
Ee = produced electricity in cogeneration
Eh = produced heat in cogeneration
ηe = efficiency of separate production of electricity (33%–59%)
ηh = efficiency of separate production of heat (77%–91%)
The actual fuel consumption allocated to an end energy fraction is calculated with the ratio of the primary energy used to produce it with the separate energy production and the primary energy needed to produce both the energy fraction with the separate production forms.
where,
Fe = calculated fuel consumption of electricity production in cogeneration
Fh = calculated fuel consumption of heat production in cogeneration
F = consumption of fuel in cogeneration
In the energy method, the emissions are divided according to the ratio of produced final energy fractions. This method addresses extra emissions of heat in comparison with separate production, because the efficiency of separate heat production is higher than the efficiency in cogeneration. The division of emissions is calculated by dividing the fuel consumption of energy by the total fuel consumption and multiplying by the fuel consumption of cogeneration.
In the all-for-electricity method fuels are primarily subjected to electricity. Primary energy demand for electricity is calculated given the assumption that the electricity is generated via separate condensing power production. The fuel consumption of alternative electricity production is calculated by dividing the produced electricity in cogeneration by the efficiency of the separate production of electricity.
The primary energy allocated to heat is calculated by the difference between the total primary energy used for CHP and the primary energy allocated to electricity.
4. Conclusions
This study was set to analyze how energy systems should be viewed in environmentally aware urban planning and related decision making. The choice of energy system is often the most important factor in the GHG emissions of a residential area and should thus have a very central role in the environmental considerations of urban planning. CHP has a strong push globally due to its potential to reduce the GHGs compared to separate heat and electricity production (e.g., [
9,
10]). However, the uncertainties in assessing the emissions from CHP and alternative options related to any specific planning situation make it very difficult to give any robust guidelines for planning. Consequently, the assessments are inevitably based on strong general assumptions instead of including the local conditions, leading potentially to biased results and unwanted GHG development in the long run. In addition to the difficulties in rating the order of preference to different energy production modes, even the order of magnitude for the emissions caused by a certain settlement is difficult to assess robustly due to the uncertainties related to the GHG intensities of different production modes, fuels and grid averages (discussed in detail e.g., in [
23,
25,
47]).
In the study we analyzed the new residential development of Härmälänranta in Tampere, Finland, which had earlier been studied by Ristimäki
et al. (2013) [
35], who concluded that HPs should be preferred over CHP as the energy system from the perspective of GHGs. On the other hand, Rinne and Syri (2013) [
34] have recently suggested just the opposite order of preference in Finnish conditions. Our results show clearly how strongly assumption-dependent any preference order actually is. We presented several very problematic issues which hinder robust decisions in any such assessment with regard to the GHG outcome. According to our results, either option can be the preferable one in a certain operating environment, and it is actually often a very complex task to determine the preference order.
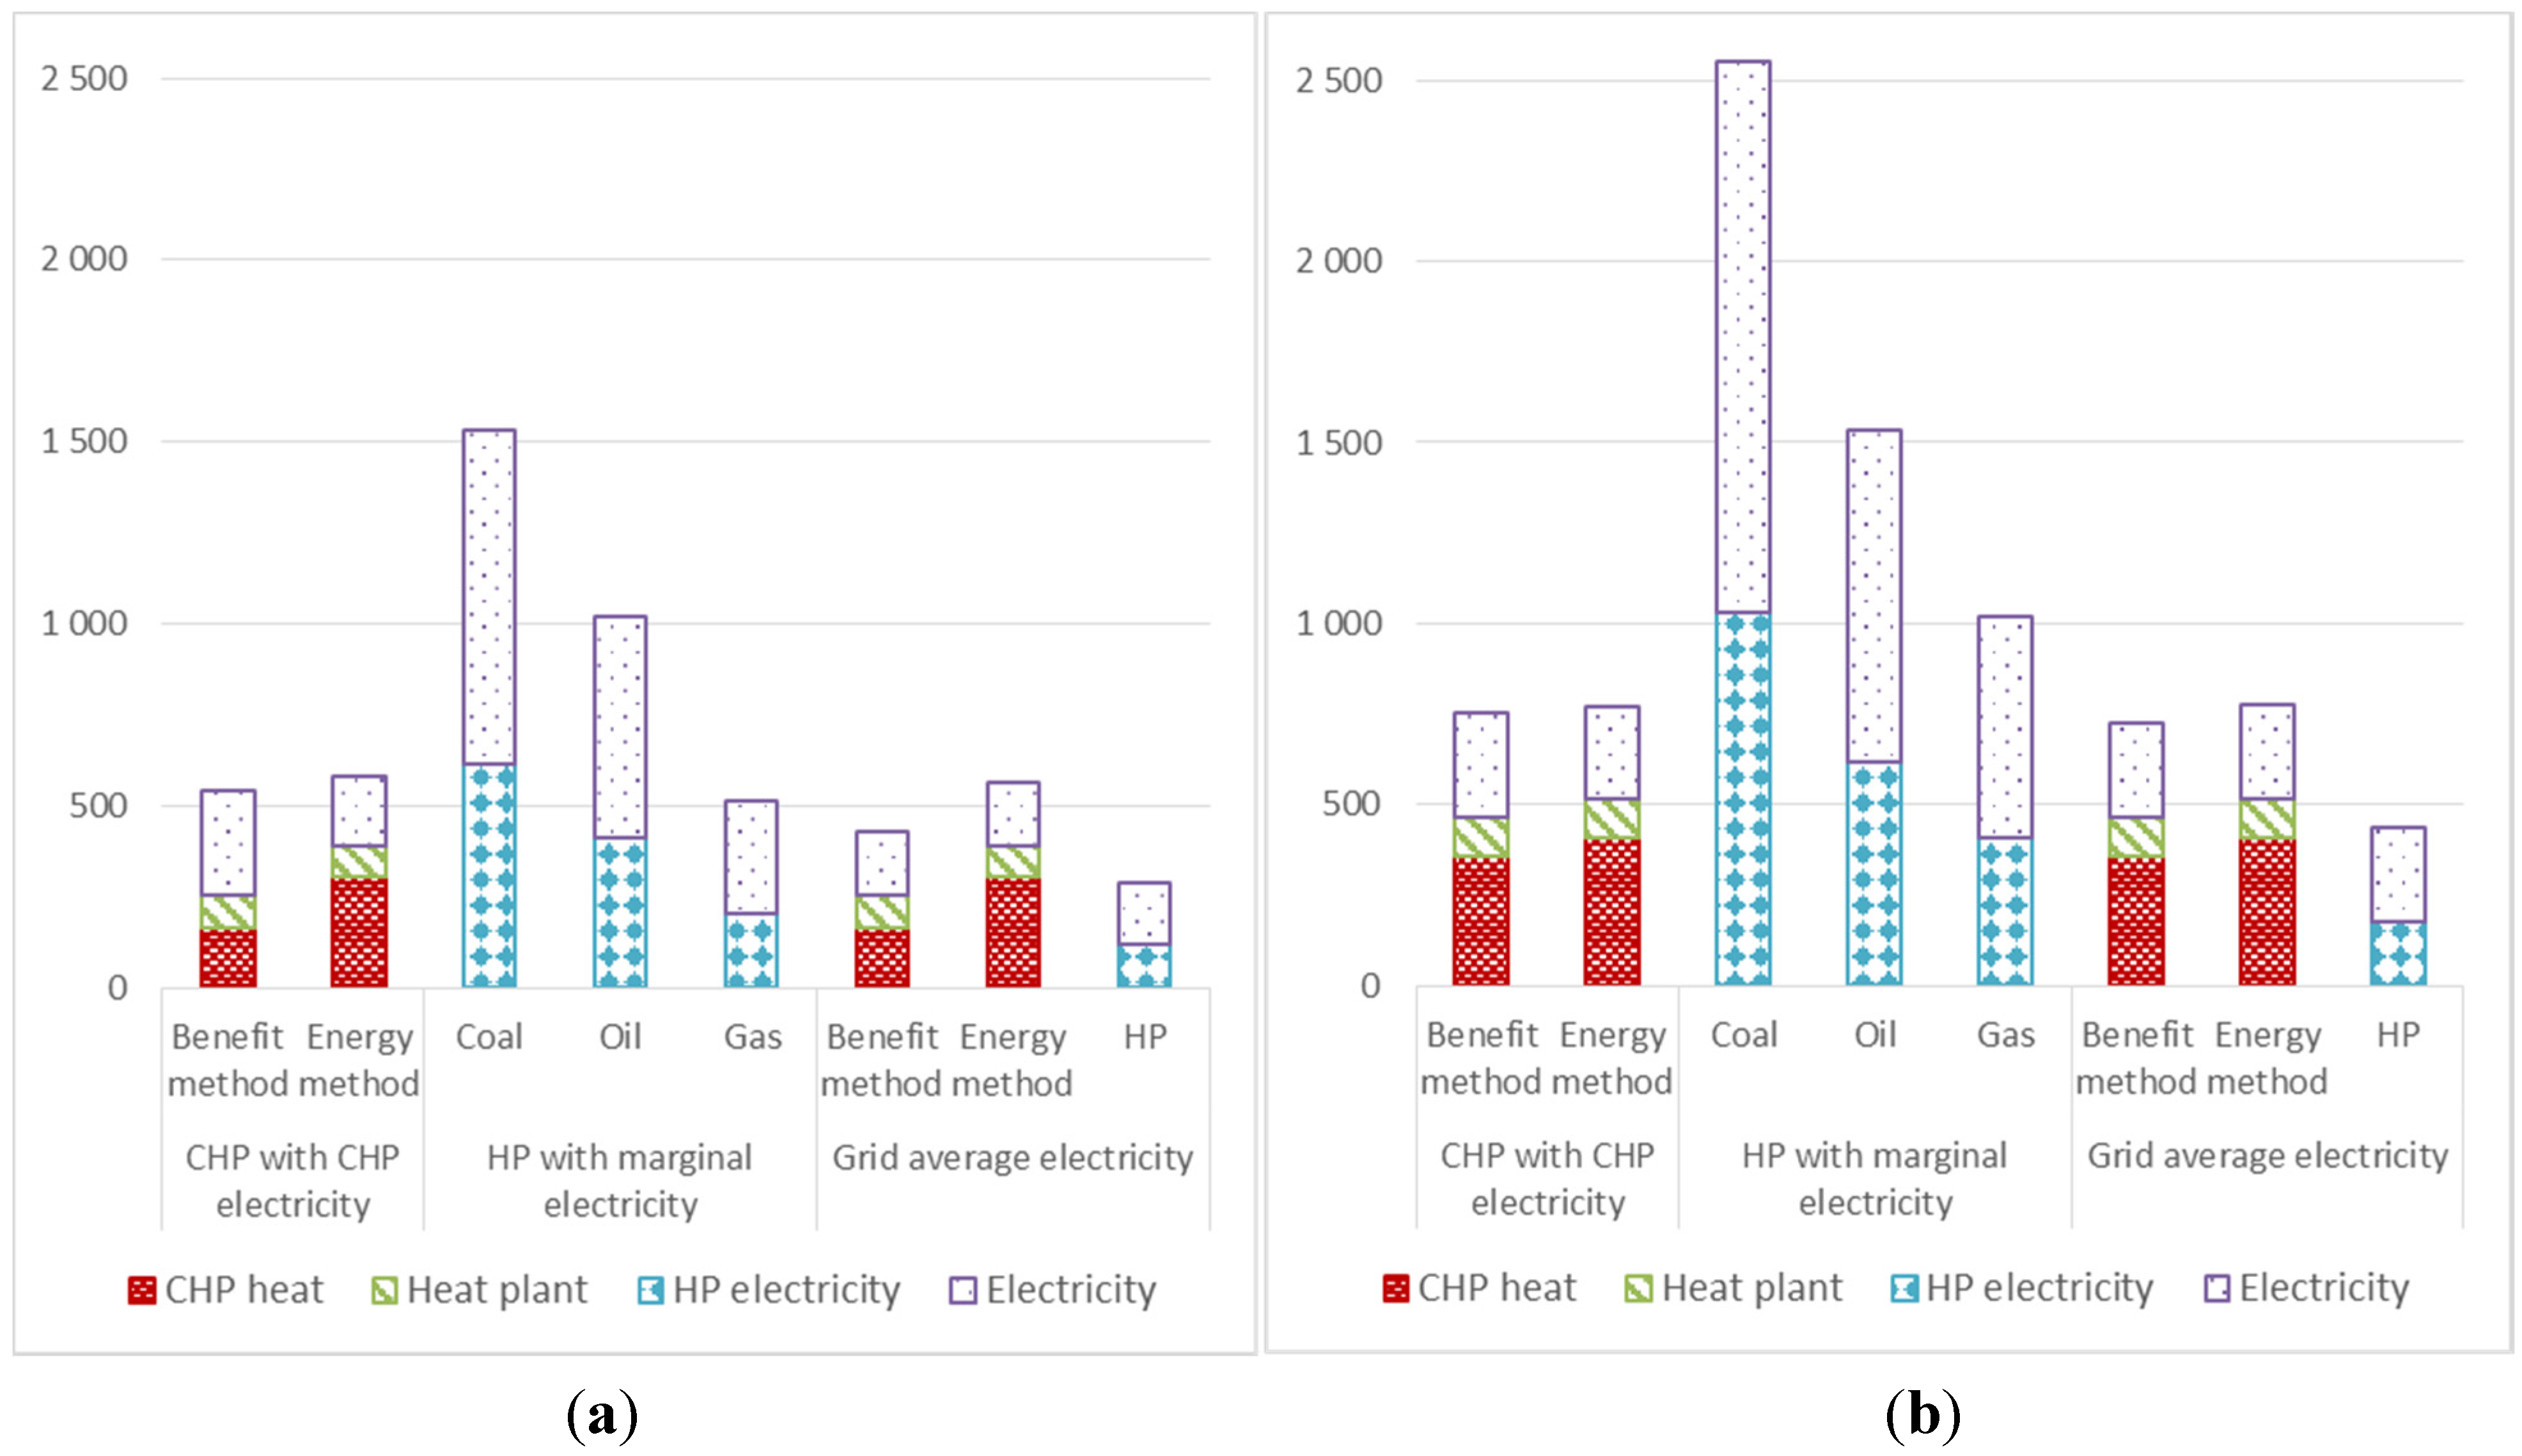
In general we suggest in this paper an assessment method in which the CHP electricity is first allocated to those demanding the heat and only the possibly remaining share is fed to the grid. This has not been the dominant method, but the justifications are clear in the context of our study: CHP electricity output follows heat production, the same sources of demand thus holding certain responsibility for electricity production as well, according to the consumer responsibility principle (e.g., [
48]). Furthermore, this allocation allows a more balanced comparison between CHP and HP, since the different allocation methods have less impact on the overall emissions, as depicted in
Figure 1. CHP heat clients cannot be assumed to drive marginal electricity production with their demand unless it exceeds the CHP electricity output (at a certain point of time). However, it is not fully justified to assess the electricity demand of CHP clients with a grid average, especially if HPs are assumed to drive marginal production.
The context of the study was Finland, specifically an area of Tampere, but the issue observed and the results achieved have wider relevance. Wherever heat is produced locally and electricity is provided by at least a regional grid, similar complexities are likely to occur in GHG assessments. For example, in other Nordic countries the issue is highly topical (e.g., [
33,
49]). Furthermore, given that CHP production is seen as a potential means to significantly help in stabilizing the global GHGs, the related complexity in GHG assessments should be better understood. For a full picture, the study should also be extended to cover the exergy perspective as well as different fuel-mixes for the CHP plant.


 ,
, 
