1. Introduction
Power supply in isolated regions far from land, including islands, is typically provided by small capacity diesel power plants. To overcome the high cost of diesel fuel in these small-capacity electrical power systems, and to prevent environmental pollution, a hybrid power system has begun to be applied, including in Alaska (USA). A hybrid power system is a diesel power plant system interconnected with a wind-turbine generator (WT) and photovoltaic (PV) array [
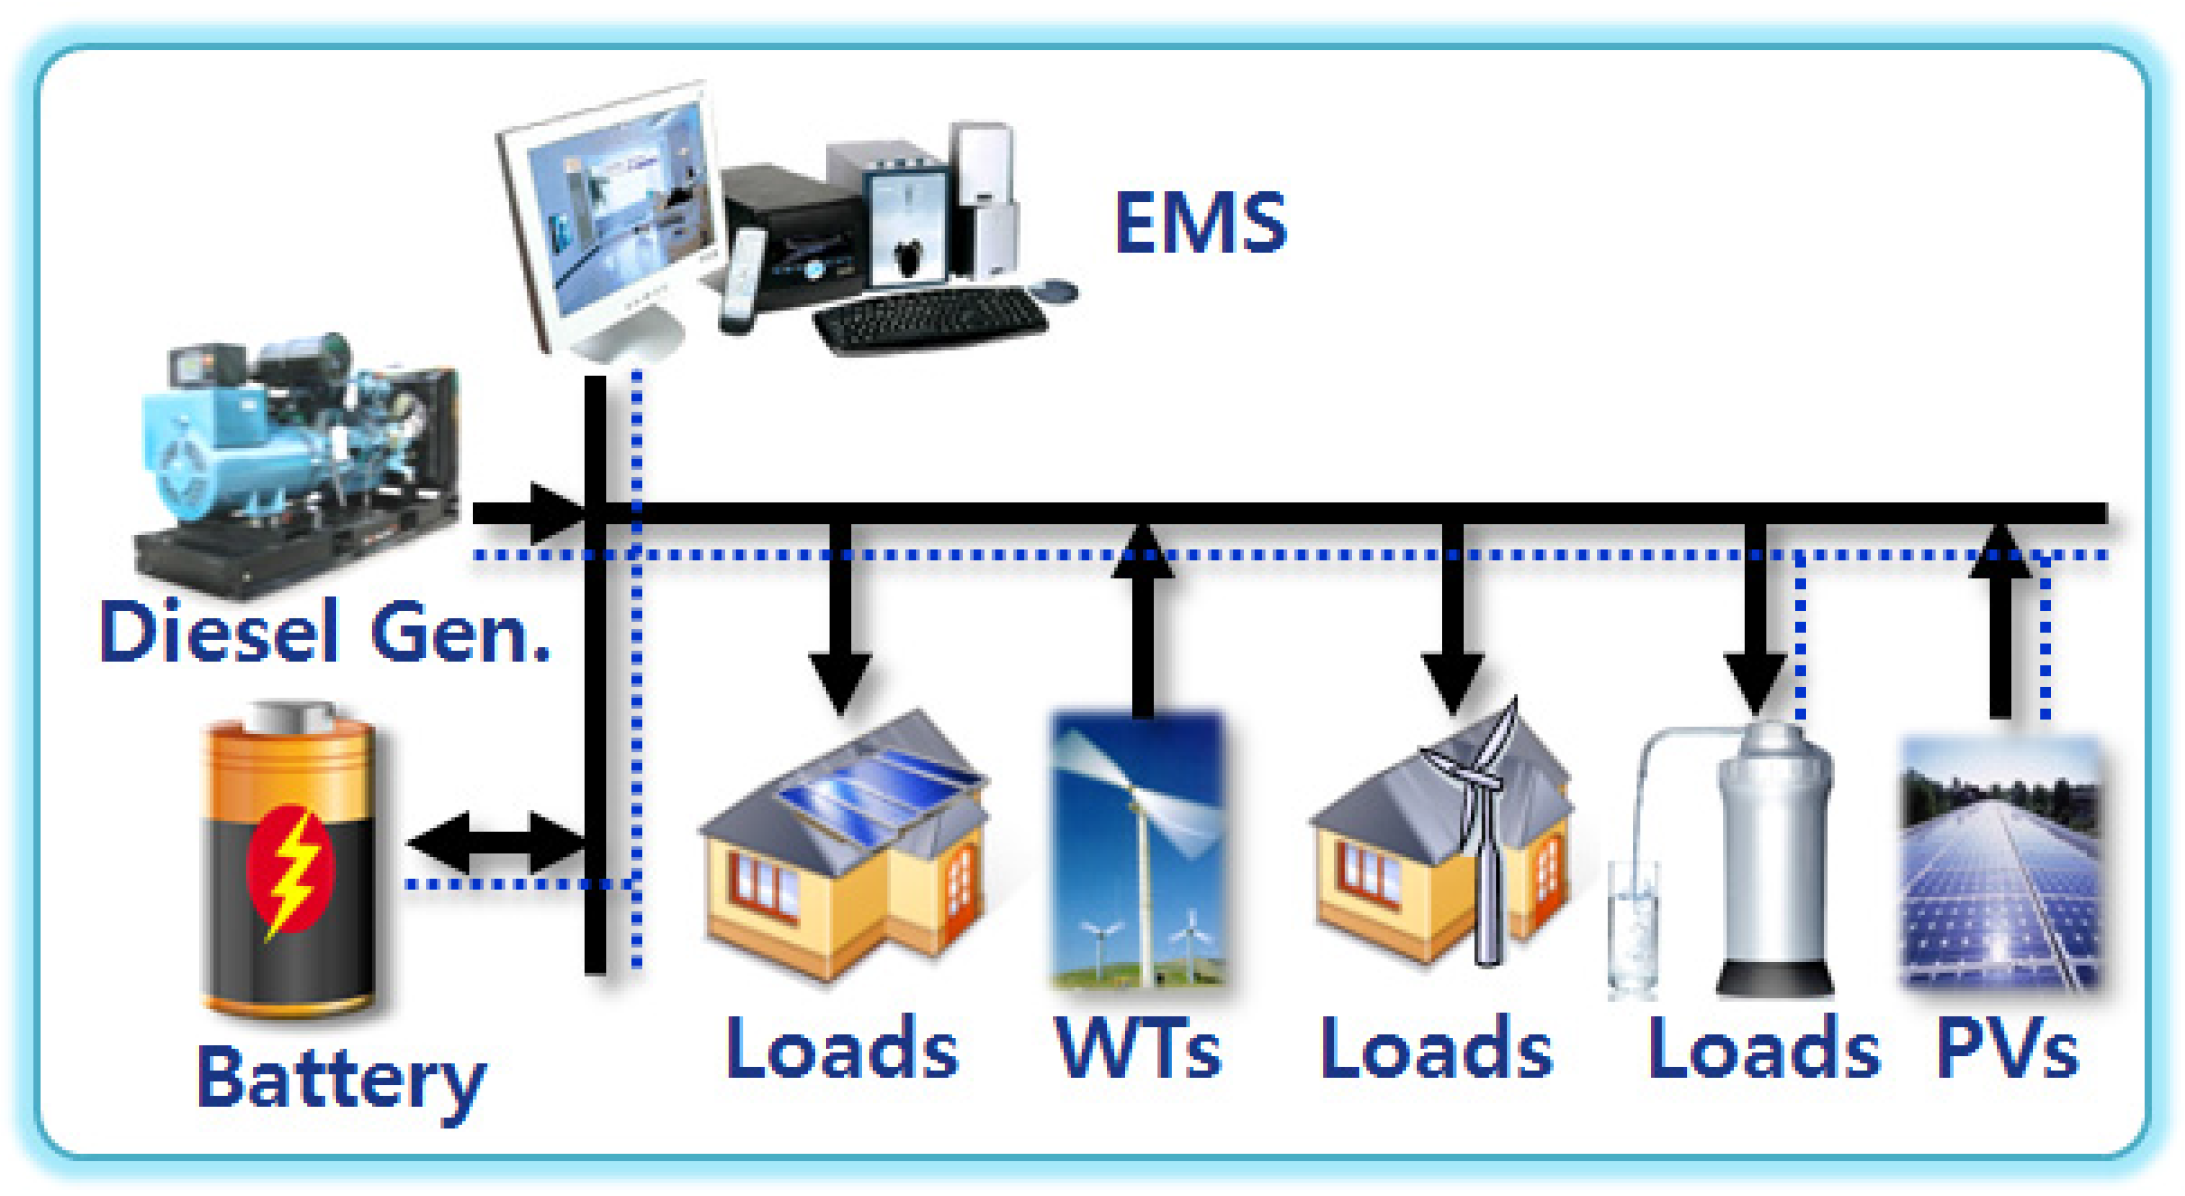
1]. However, a restriction on renewable energy capacity that can be interconnected with a diesel power plant is still applied on account of the output variances of WTs and PVs. An attempt has been made to add a large capacity battery to the hybrid power system to solve the above problem owing to the sharp decline in battery prices in recent years. Such a system is called a remote microgrid (
Figure 1) or hybrid microgrid [
2,
3,
4,
5]. However, renewable energy or batteries remain expensive, therefore, it is necessary to have an appropriate combination to construct an economically feasible system.
Figure 1.
Example of a remote microgrid.
Figure 1.
Example of a remote microgrid.
To effectively utilize the renewable energy cost, many researchers have studied algorithms to calculate the capacity of applicable generator units that can constitute a low cost reliable power system [
6]. Li
et al. [
6] compared some proposed algorithms and presented a simple algorithm to determine the required number of generating units of a WT generator and PV array, as well as the associated storage capacity for a standalone hybrid microgrid. The algorithm is based on the observation that the battery charge state should be periodically invariant. Liang
et al. [
7] investigated the stochastic modeling and optimization tools for microgrids. Wang
et al. [
8] proposed an optimal capacity allocation method for standalone microgrids using a particle swarm optimization algorithm. Bansal
et al. [
9] analyzed the economic feasibility of a hybrid power system using the biogeography-based optimization (BBO) algorithm. Wies
et al. [
10] modeled load sharing between a diesel generator and PV using Simulink and presented how to analyze the economic feasibility. Xu
et al. [
11] proposed an optimal sizing method to achieve higher power supply reliability. However, Stiel
et al. [
12] and Yoo
et al. [
13] used a commercial feasibility study tool called HOMER instead of complex algorithms and thereby presented economic feasibility assessments results on a wind-diesel hybrid power system.
Purser
et al. [
14] presented the results of a technical and economic feasibility study of implementing a microgrid at Georgia Southern University using HOMER. Mizani
et al. [
15] presented the demonstration results for optimal design and operation of a grid-connected microgrid.
Fan
et al. [
16] presented design considerations to develop a standalone smart grid on Ubin Island (Pulau) as well as simulation results. Kojima
et al. [
17] proposed a structure and control method of an existing diesel power plant interconnected with a small capacity of WT, PV, and batteries. Prull
et al. [
18] proposed a design procedure, including a load study and meteorological information study, as well as design results to construct a remote microgrid on Necker Island (UK), but they didn’t include any field test results. Fay
et al. [
1] presented the performance and economic analysis results for isolated wind-diesel systems in Alaska. Kaldellis
et al. [
19] presented cost-benefit analysis results of remote hybrid wind-diesel power stations. Ulleberg
et al. [
20] presented a remote renewable energy system for the Faroe Islands, but these wind-diesel systems usually didn’t include the battery and/or photovoltaic generator. However, some studies presented algorithms that use only partial information to quickly calculate renewable energy and battery capacity. In particular, such algorithms do not consider the charge and discharge efficiency of the battery system and the depth of discharge (DoD) according to battery type. Some algorithms were only theoretically validated. Although some of the above studies proposed a design procedure for a remote microgrid, they provided no operational results from real sites. Some studies presented the comparison results between simulation and real implementation but they usually didn’t include the design targets such like raising the system efficiency, stable operation, power quality,
etc. To construct a remote microgrid, it is necessary to have an optimal system design that considers the power reserve ratio to both ensure the system economic feasibility and maintain the stable operation and rated voltage and frequency of the system. In addition to the above considerations, an appropriate system structure should be considered. The system should be constructed according to the design results; moreover, the design procedure should be validated and fed back through comparisons with long-term operation results. However, no studies have provided such a series of procedures.
The present paper presents economic feasibility study results and a system structure to develop a grid-forming inverter-based remote microgrid for distant islands located on the west coast of South Korea. It presents design parameters for economical and reliable remote microgrid designs through comparisons between simulation results and real operation results. Moreover, this study aims to share the optimal design direction through real long-term operation results of the remote microgrid.
3. Feasibility Study for Test Island
The remote microgrid referenced in this paper was designed to minimize power supply costs through an optimal combination of distributed power and the energy storage devices, and to consider reliable operations. In this section, the economic feasibility study results of the proposed remote microgrid are presented using HOMER. The economic feasibility study used real meteorological and load data from the actual site.
3.1. Feasibility Study Tool
To economically construct a remote microgrid, renewable energy type, battery type, and capacity should be accurately calculated. In addition, precise analysis of target area meteorological data is likewise needed. Such a series of processes is called a feasibility study, which can be performed by the most widely used commercial tool called HOMER.
HOMER is a computer simulation program designed by the National Renewable Energy Laboratory (NREL) in the United States. Coined as the Optimization Model for Distributed Power, HOMER allows the modelling of both grid and non-grid connected power systems consisting of conventional and renewable technologies. The program considers the economic and technical feasibility of desired power systems and delivers comprehensive reports covering a range of subjects from the net present capital cost of the system to the renewable penetration. It allows the input of renewable resources such as wind speeds, battery data, demand load data, capital and operation and maintenance (O&M) costs among others, as well as sensitivity analyses modelling the impact on the system to variations in any input [
25].
HOMER uses the following equation to calculate the total net present cost:
where
Cann,tot is the total annualized cost,
i the annual real interest rate (the discount rate),
Rproj the project lifetime, and CRF (discount raterecovery factor), given by Equation (4):
where
i is the annual real interest rate and
N is the number of years.
HOMER uses the following equation to calculate the levelized cost of energy:
where
Cann,tot is the total annualized cost,
Eprim and
Edef are the total amounts of primary and deferrable load, respectively, that the system serves per year, and
Egrid,sales is the amount of energy sold to the grid per year [
25].
3.2. Test Island in Korea
A distant target island was selected to validate the remote microgrid technology.
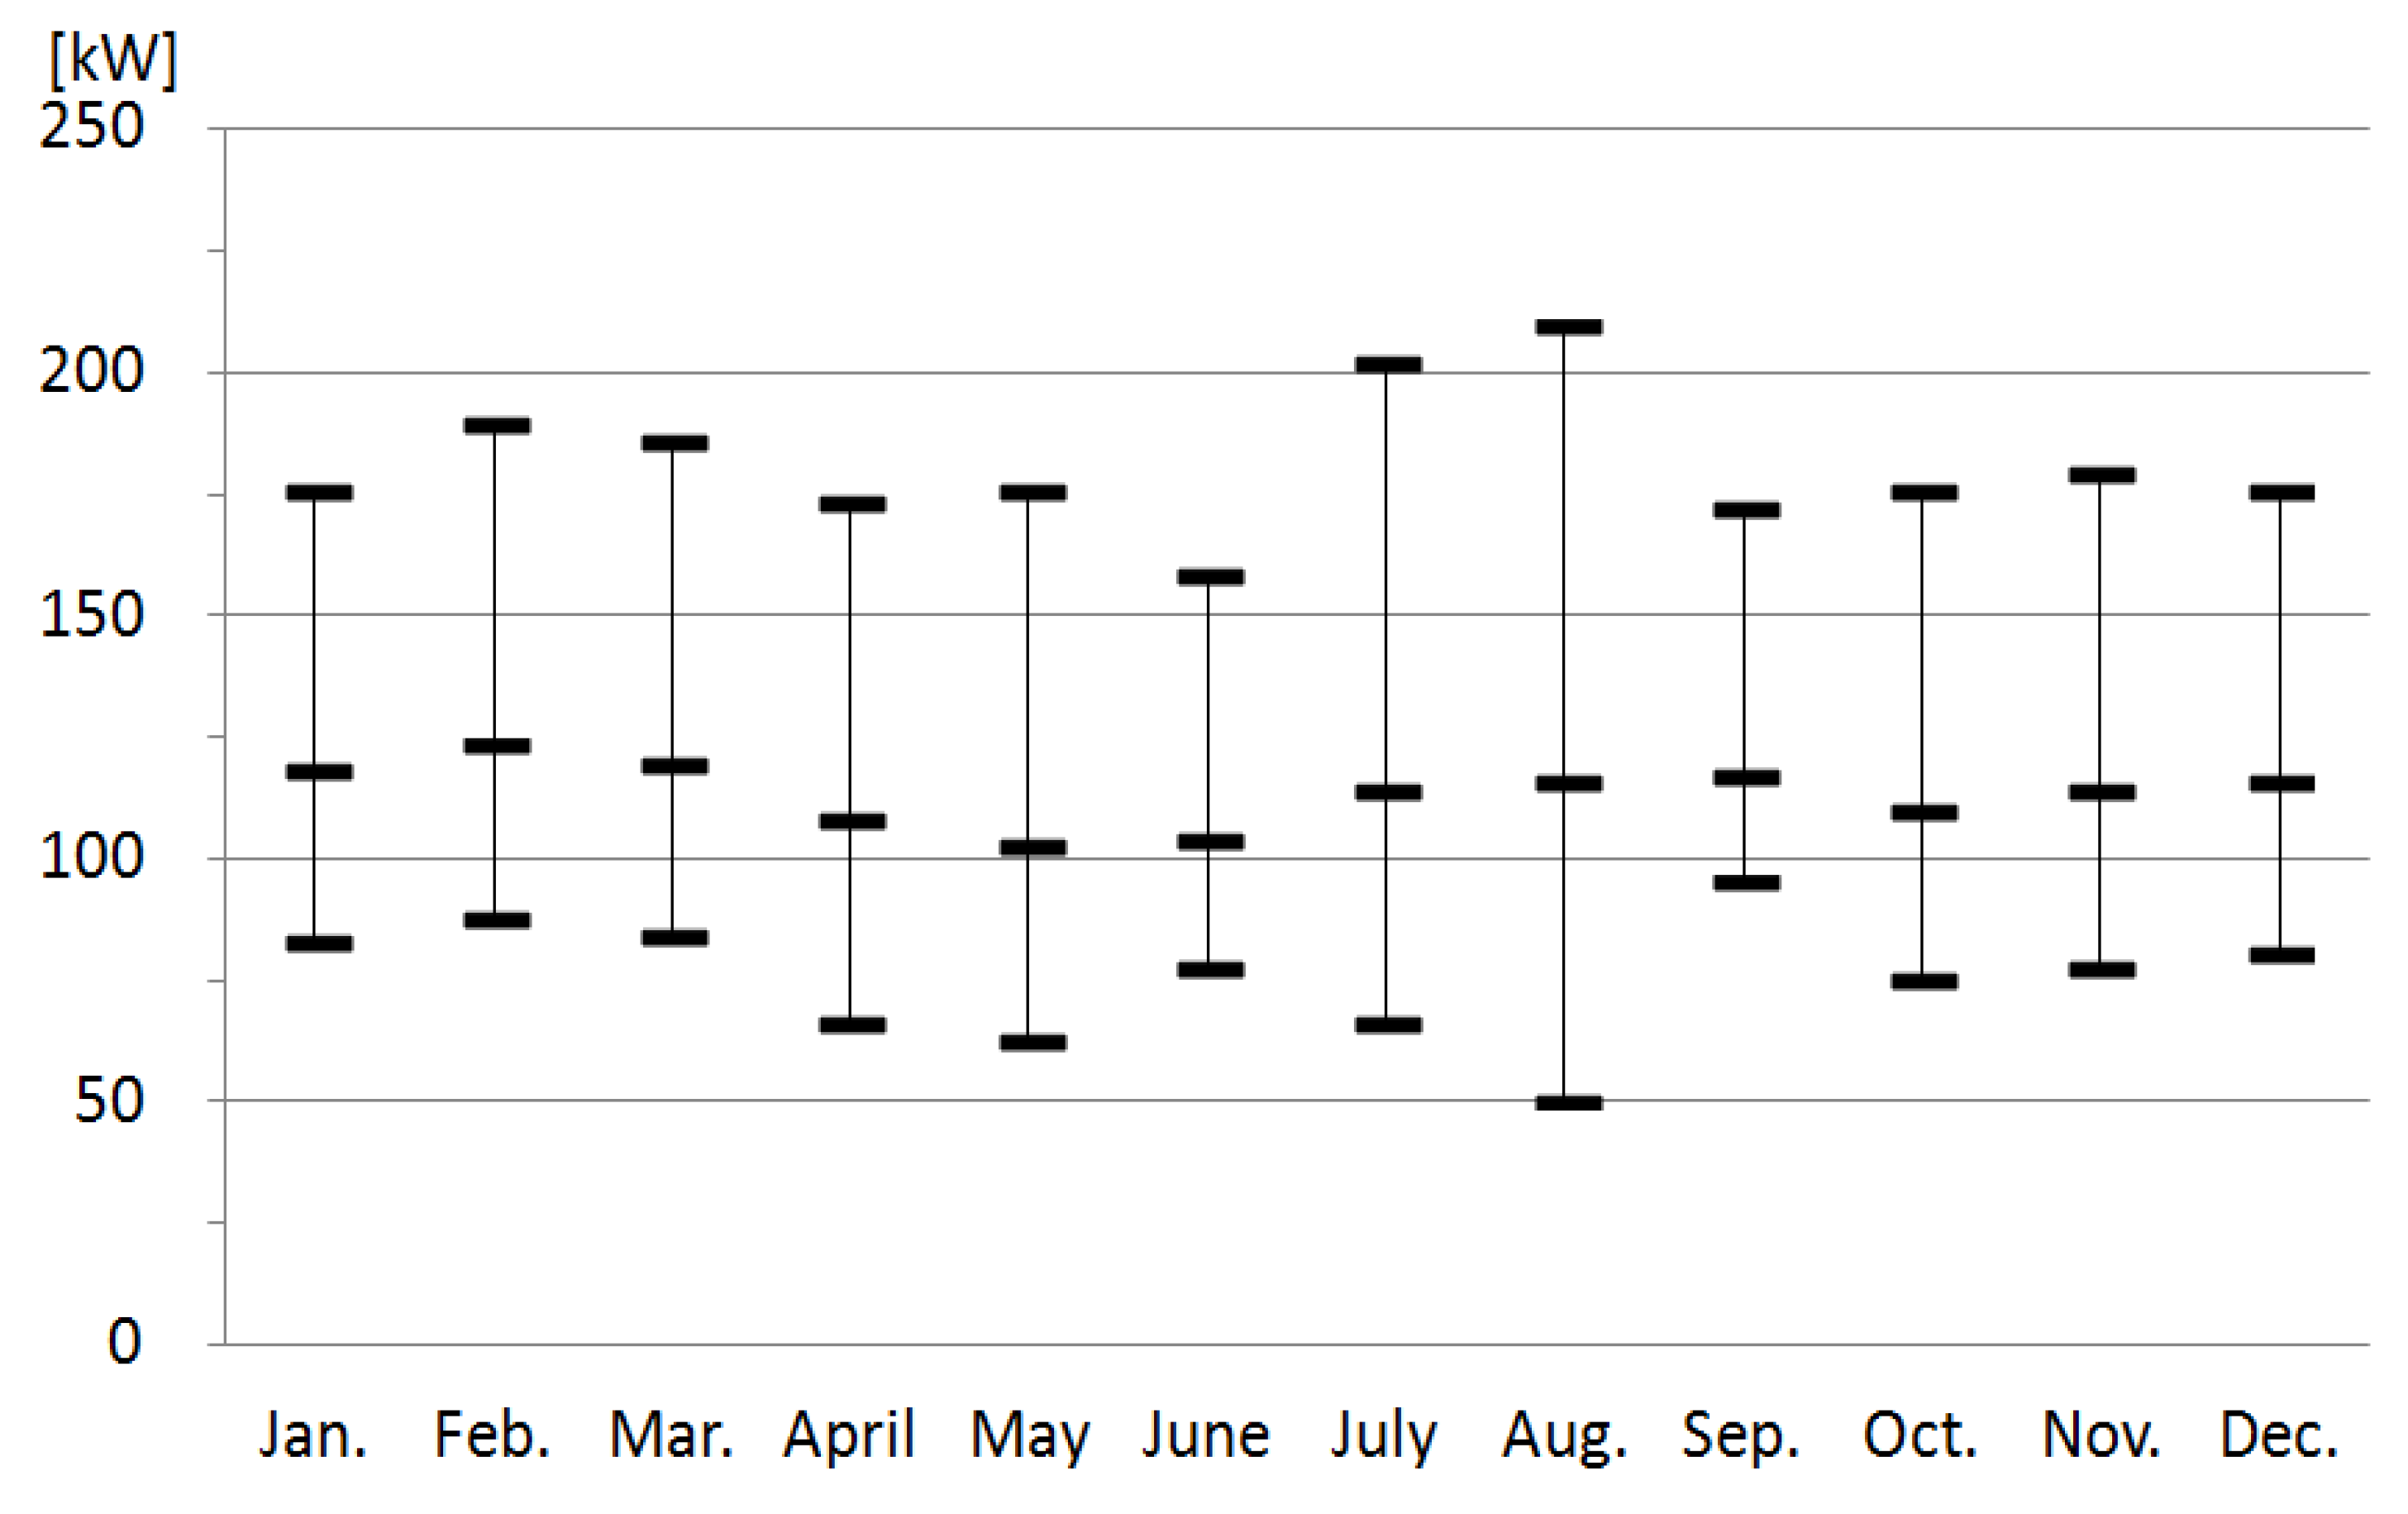
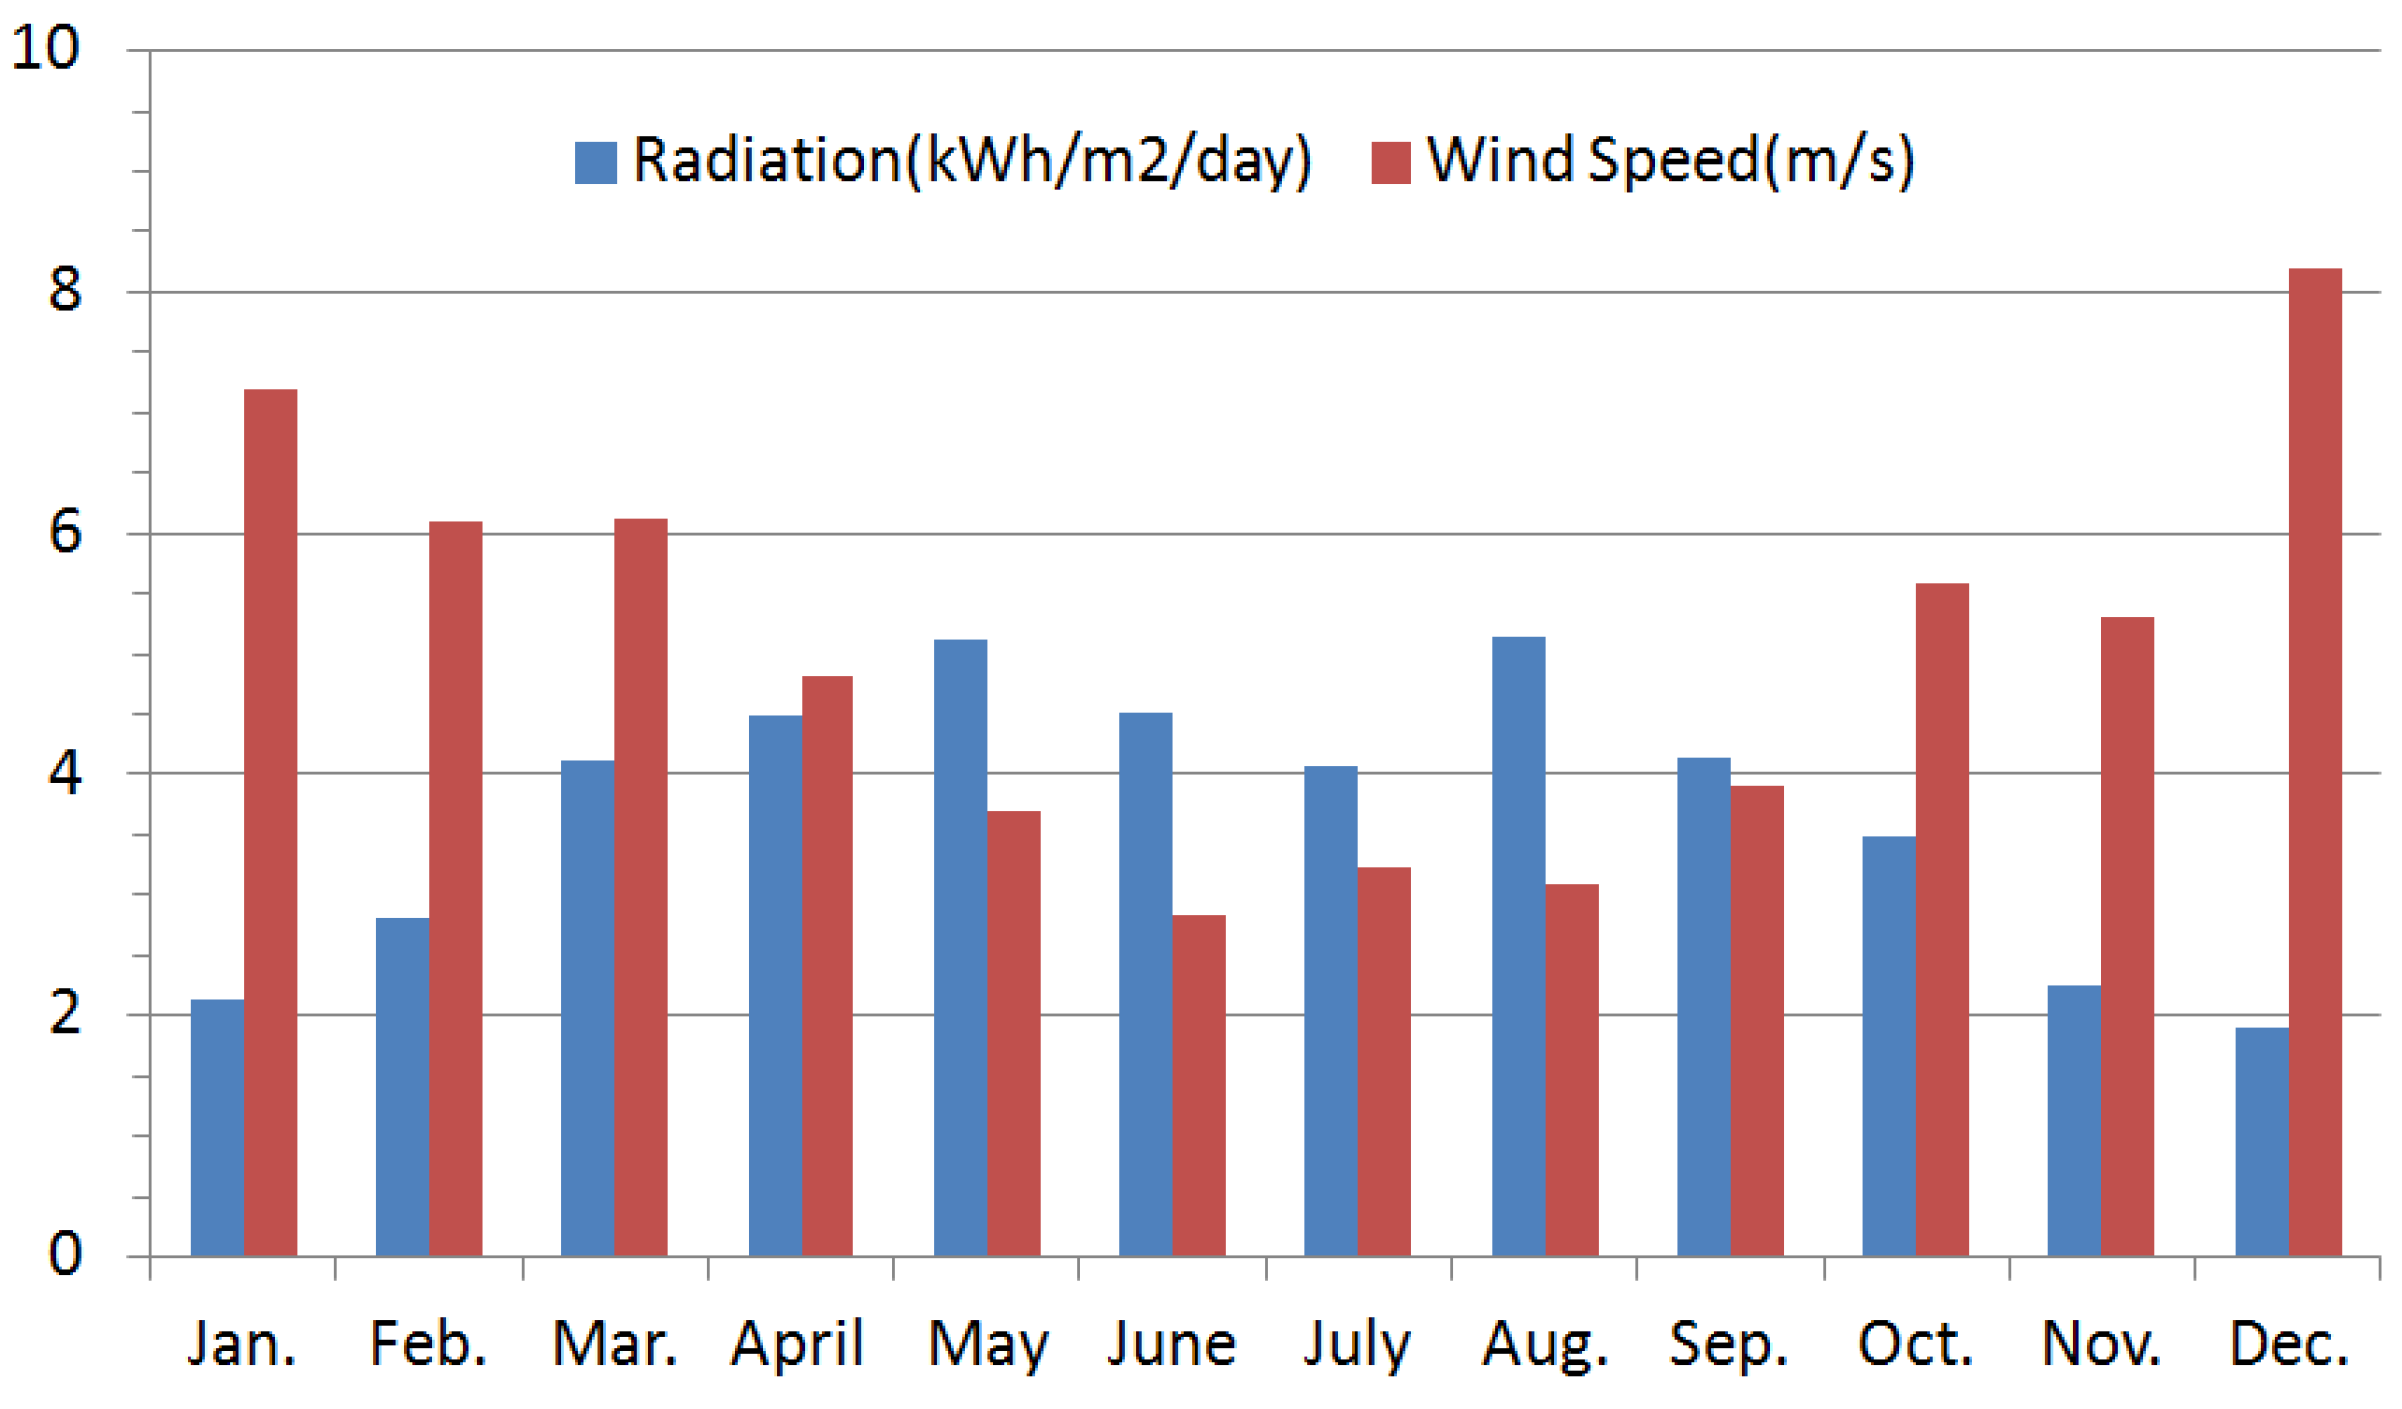
Table 2 shows the information about the target island. The target island is located approximately 6 km from the mainland and currently has approximately 280 residents. There are three 100 kW diesel generators on the island; two generators operate in parallel during normal hours and one is for reserve. The distributed voltage is 6.6 kV, and there are two distribution lines. The heavy load supplied to the diesel power plant during normal operation hours is produced by an induction motor whose rated capacity is 11 kW. The mean wind velocity and solar radiation in 2013 were 5.1 m/s and 3.68 kWh/m
2·day, respectively, which represent typical data in offshore islands in South Korea [
26].
Table 2.
Overview of the Test Island [
27].
Table 2.
Overview of the Test Island [27].
| Name | Gasado (Gasa Island) |
| Location | Southern part of South Korea |
| Area | 6.4 km2 |
| Population | 286 person (168 house) |
| Electrical System | Gen-set: 100kW × 3 (1992 year); Distribution Line (6.6 kV): 8 km; Main Transformer (380 V/6.9 kV): 300 kVA × 2 |
| Fuel Consumption | 285,000 L/year (2013 year) |
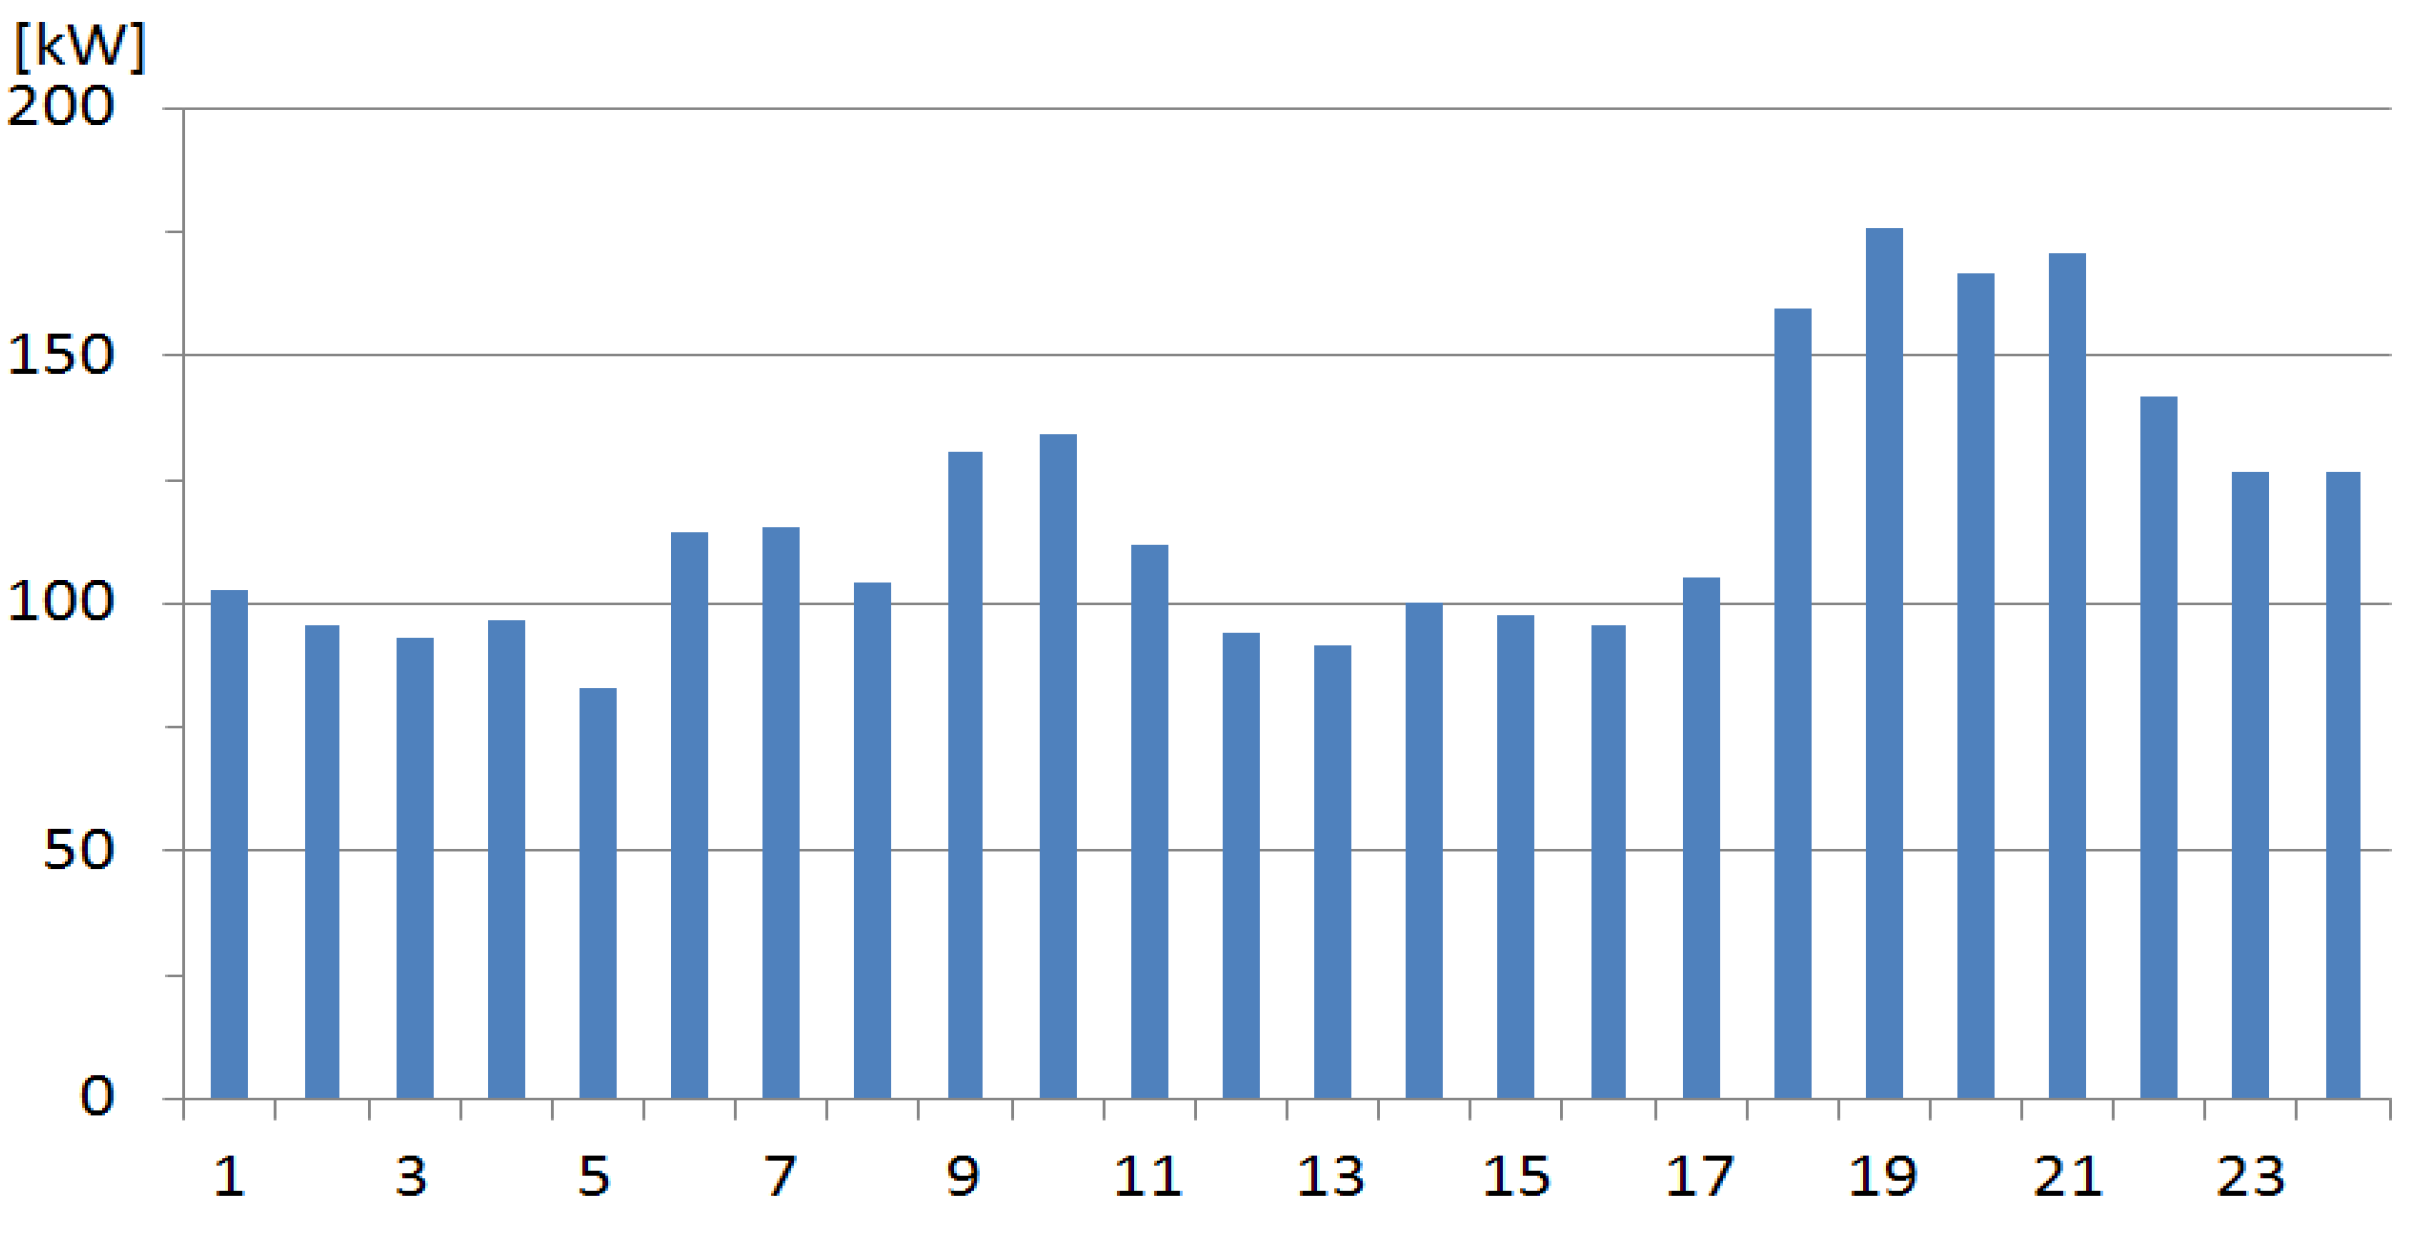
| Load (2013year) | Average: 113 kW; Peak: 210 kW; Minimum: 50 kW; Heavy load: 11 kW; Induction Motor × 2 |
| Weather (Annual average) | Daily Radiation: 3.68 kWh/m2·day; Wind Speed: 5.0 m/s @ 30 mL; Temperature: 13.4 °C |
3.3. Results of Economic Feasibility Study
The data presented in
Section 3.2 and the
Appendix were entered into HOMER to run the economic feasibility study simulation The simulation input data were set with consideration of the current diesel power plant operation results and current prices of renewable energy and batteries to be as realistic as possible.
The simulation results of the target island are summarized in
Table 3, which shows a typical combination according to the renewable energy fraction. As shown in the table, the Cost of Energy (COE) of the diesel power plant in the target island was $0.992 and the annual operating cost was $869,000. The operation cost consisted of the diesel generator fuel cost, maintenance cost for the power generator and lines, personnel cost for operators, and other expenses. Power bills paid by customers were omitted.
Table 3.
Simulation result for economic feasibility study.
Table 3.
Simulation result for economic feasibility study.
| Ren. Fraction (%) | COE ($) | NPC (1000$) | Operat. Cost (1000$) | Initial Capital (1000$) | Fuel (kL) | Photovoltaic (kW) | Wind Turbine (100 kW) | Battery (100 kWh) | Inverter (kVA) |
|---|
| 0 | 0.913 | 11,258 | 903 | 0 | 311 | 0 | 0 | 0 | 0 |
| 10.9 | 0.833 | 10,277 | 735 | 1120 | 244 | 150 | 0 | 5 | 500 |
| 20.9 | 0.822 | 10,134 | 698 | 1435 | 217 | 250 | 0 | 5 | 500 |
| 30.8 | 0.834 | 10,285 | 671 | 1920 | 190 | 50 | 2 | 5 | 500 |
| 40.9 | 0.875 | 10,794 | 693 | 2160 | 177 | 300 | 1 | 5 | 500 |
| 50.5 | 0.879 | 10,849 | 653 | 2710 | 149 | 300 | 2 | 5 | 500 |
| 59.7 | 0.885 | 10,916 | 622 | 3165 | 121 | 350 | 2 | 10 | 500 |
| 69.8 | 0.901 | 11,111 | 587 | 3800 | 91 | 450 | 2 | 15 | 500 |
| 80.9 | 0.919 | 11,342 | 546 | 4540 | 57 | 600 | 2 | 20 | 500 |
| 89.9 | 1.051 | 12,963 | 553 | 6067 | 34 | 600 | 3 | 35 | 500 |
| 94.4 | 1.284 | 15,835 | 575 | 8668 | 18 | 600 | 6 | 50 | 500 |
The most economical system configuration can be formed with approximately 20% of renewable energy. However, the COE was lower or similar compared to that of the existing diesel power plant until a proportion of renewable energy in the remote microgrid reached approximately 70%. Furthermore, under the same COE, various combinations of capacities of renewable energy and batteries can be possible.
4. Remote Microgrid System Design
In this section, the design objectives for achieving the implementation and demonstration of an energy independent island using remote microgrid technology, as well as the results, are presented.
4.1. Design Target
Table 4 shows the design target and results for the test island. The energy independence of the test island was set to 99%, which means that 100% energy independence would not be pursued in consideration of the economic feasibility. That is, if required, diesel generators would be partially used. The daily average load in the test island was 113 kW. However, an average load was set to 120 kW to account for the supply-ready loads and future load increase rate. The required renewable energy capacity could be calculated as shown in Equation 6. The result is consistent with that in
Table 3.
Table 4.
Design target and design results for the test island [
26].
Table 4.
Design target and design results for the test island [26].
| Category | Design Target | Results |
|---|
| Renewable Energy Fraction | 99% of power supplied by renewable energy | wind turbine (WT): 400 kW;
photovoltaic (PV): 314 kW |
| Battery Capacity | Power supply by batteries only for one or more days | 3 MWh |
| Inverter Capacity | -Total recharge of renewable energy output;
-Inverter operation efficiency improvement | 500 kVA × 2 ea, 250 kVA × 1ea;
If CVCF inverter capacity is not sufficient, parallel inverter is running |
| System optimization | -Parallel operation of inverters and diesel generators;
-Improvement of heat efficiency by fixed-speed operation of the diesel generator | -Inverter: CVCF (Constant Voltage Constant Frequency) operation;
-Diesel generator : Droop operation |
| Electrical System | -Microgrid technology validation;
-Commercial operation and cost minimization | -Construction of new distribution line;
-Parallel interconnection with the main transformer |
| EMS (Energy Management System) | -Overall monitoring and control of the system;
-System automatic operation | -SCADA + application;
-Prediction of loads and renewable energy;
-Direct load control |
According to the renewable energy capacity, 400 kW of WT and 314 kW of PV were installed with comprehensive consideration of the geographical characteristics, installation site, and building permit issues. A design goal was to set the power supply for only one day with batteries when no renewable energy output was supplied to achieve an energy independent island. This was calculated with Equation (7). Additional Depth of Discharge (DoD) was not considered because we selected lithium batteries:
Finally, we set the size of battery as 3 MWh considering the 5% margin.
The inverter capacity was calculated via Equation (8) in consideration of the maximum renewable energy output:
To account for a possible commercial inverter purchase and inverter operation efficiency, two 500-kVA inverters and one 250-kVA inverter were set up. One 500-kVA inverter was used for backup. A 250-kVA inverter was set in the “off” state during normal hours and was automatically turned on if renewable energy output exceeded the threshold value. Through this, we can raise the operation efficiency of the system. The inverters could be charged and discharged bi-directionally for system optimization and could be run with the diesel generators in parallel. To employ the existing facilities in their current states, the diesel generator was operated using the droop method.
To validate the microgrid technology prior to the commercial operation, a test distribution line (D/L) was installed. Using the test D/L and main transformer for backup, the additional test system could be operated without power interruption. GFIs and the diesel generators are interconnected into the low voltage side of the main transformers to minimize the construction cost.
The overall system was monitored and controlled via an energy management system (EMS). To improve system efficiency, battery life management and diesel generator output were controlled using the prediction of loads and renewable energy power generation. For example, if the EMS predicts that the renewable energy supply will be enough within 24 h, the EMS calculates the output power and the stop time of the diesel generators.
4.2. Simulation Result for Test Island
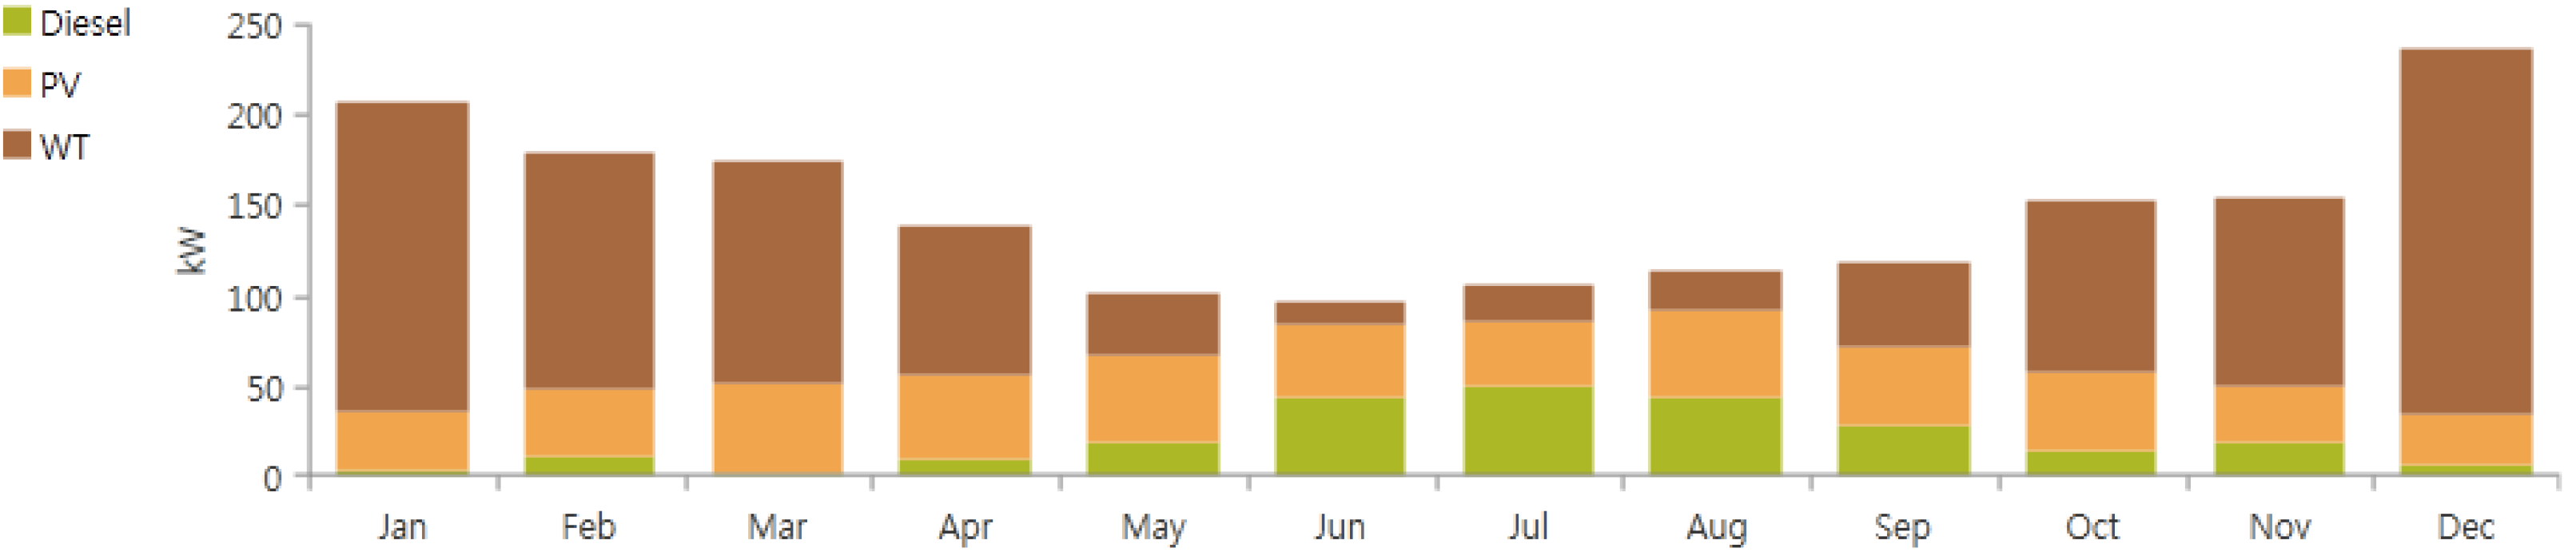
Renewable energy and battery capacities determined by the design target were entered into HOMER to run the simulation of annual power production and loss. The results are shown in
Figure 2 and
Table 5. It was estimated that the PV produced 354,156 kWh per year, the WT produced 759,718 kWh per year, and the diesel power generator produced 180,137 kWh per year. A capacity factor of the PV was estimated less than that of other PV stations in South Korea, which was because the target area was an island. Although an energy independent island was designed as a goal, the renewal energy produced only 79.4% of the power required under the current construction conditions. Thus, the remainder of the power (20.6%) should be supplied by the diesel generator. Excess power supplied by the renewable energy was estimated as 379,987 kWh/year, which amounted to 29.4% of the total power production. This result was obtained because wind in South Korea is concentrated in the winter season on account of its geographical characteristic.
Figure 2.
Expected monthly energy production by generator of the test island.
Figure 2.
Expected monthly energy production by generator of the test island.
5. Results and Discussion
In this section, the result of a real remote microgrid construction in the test island and its operation results are presented. The results are compared with the simulation results in
Section 3.2.
5.1. Implementation Results of the Field Test Site
Remote microgrid system was constructed on the test island in accordance with the design targets (
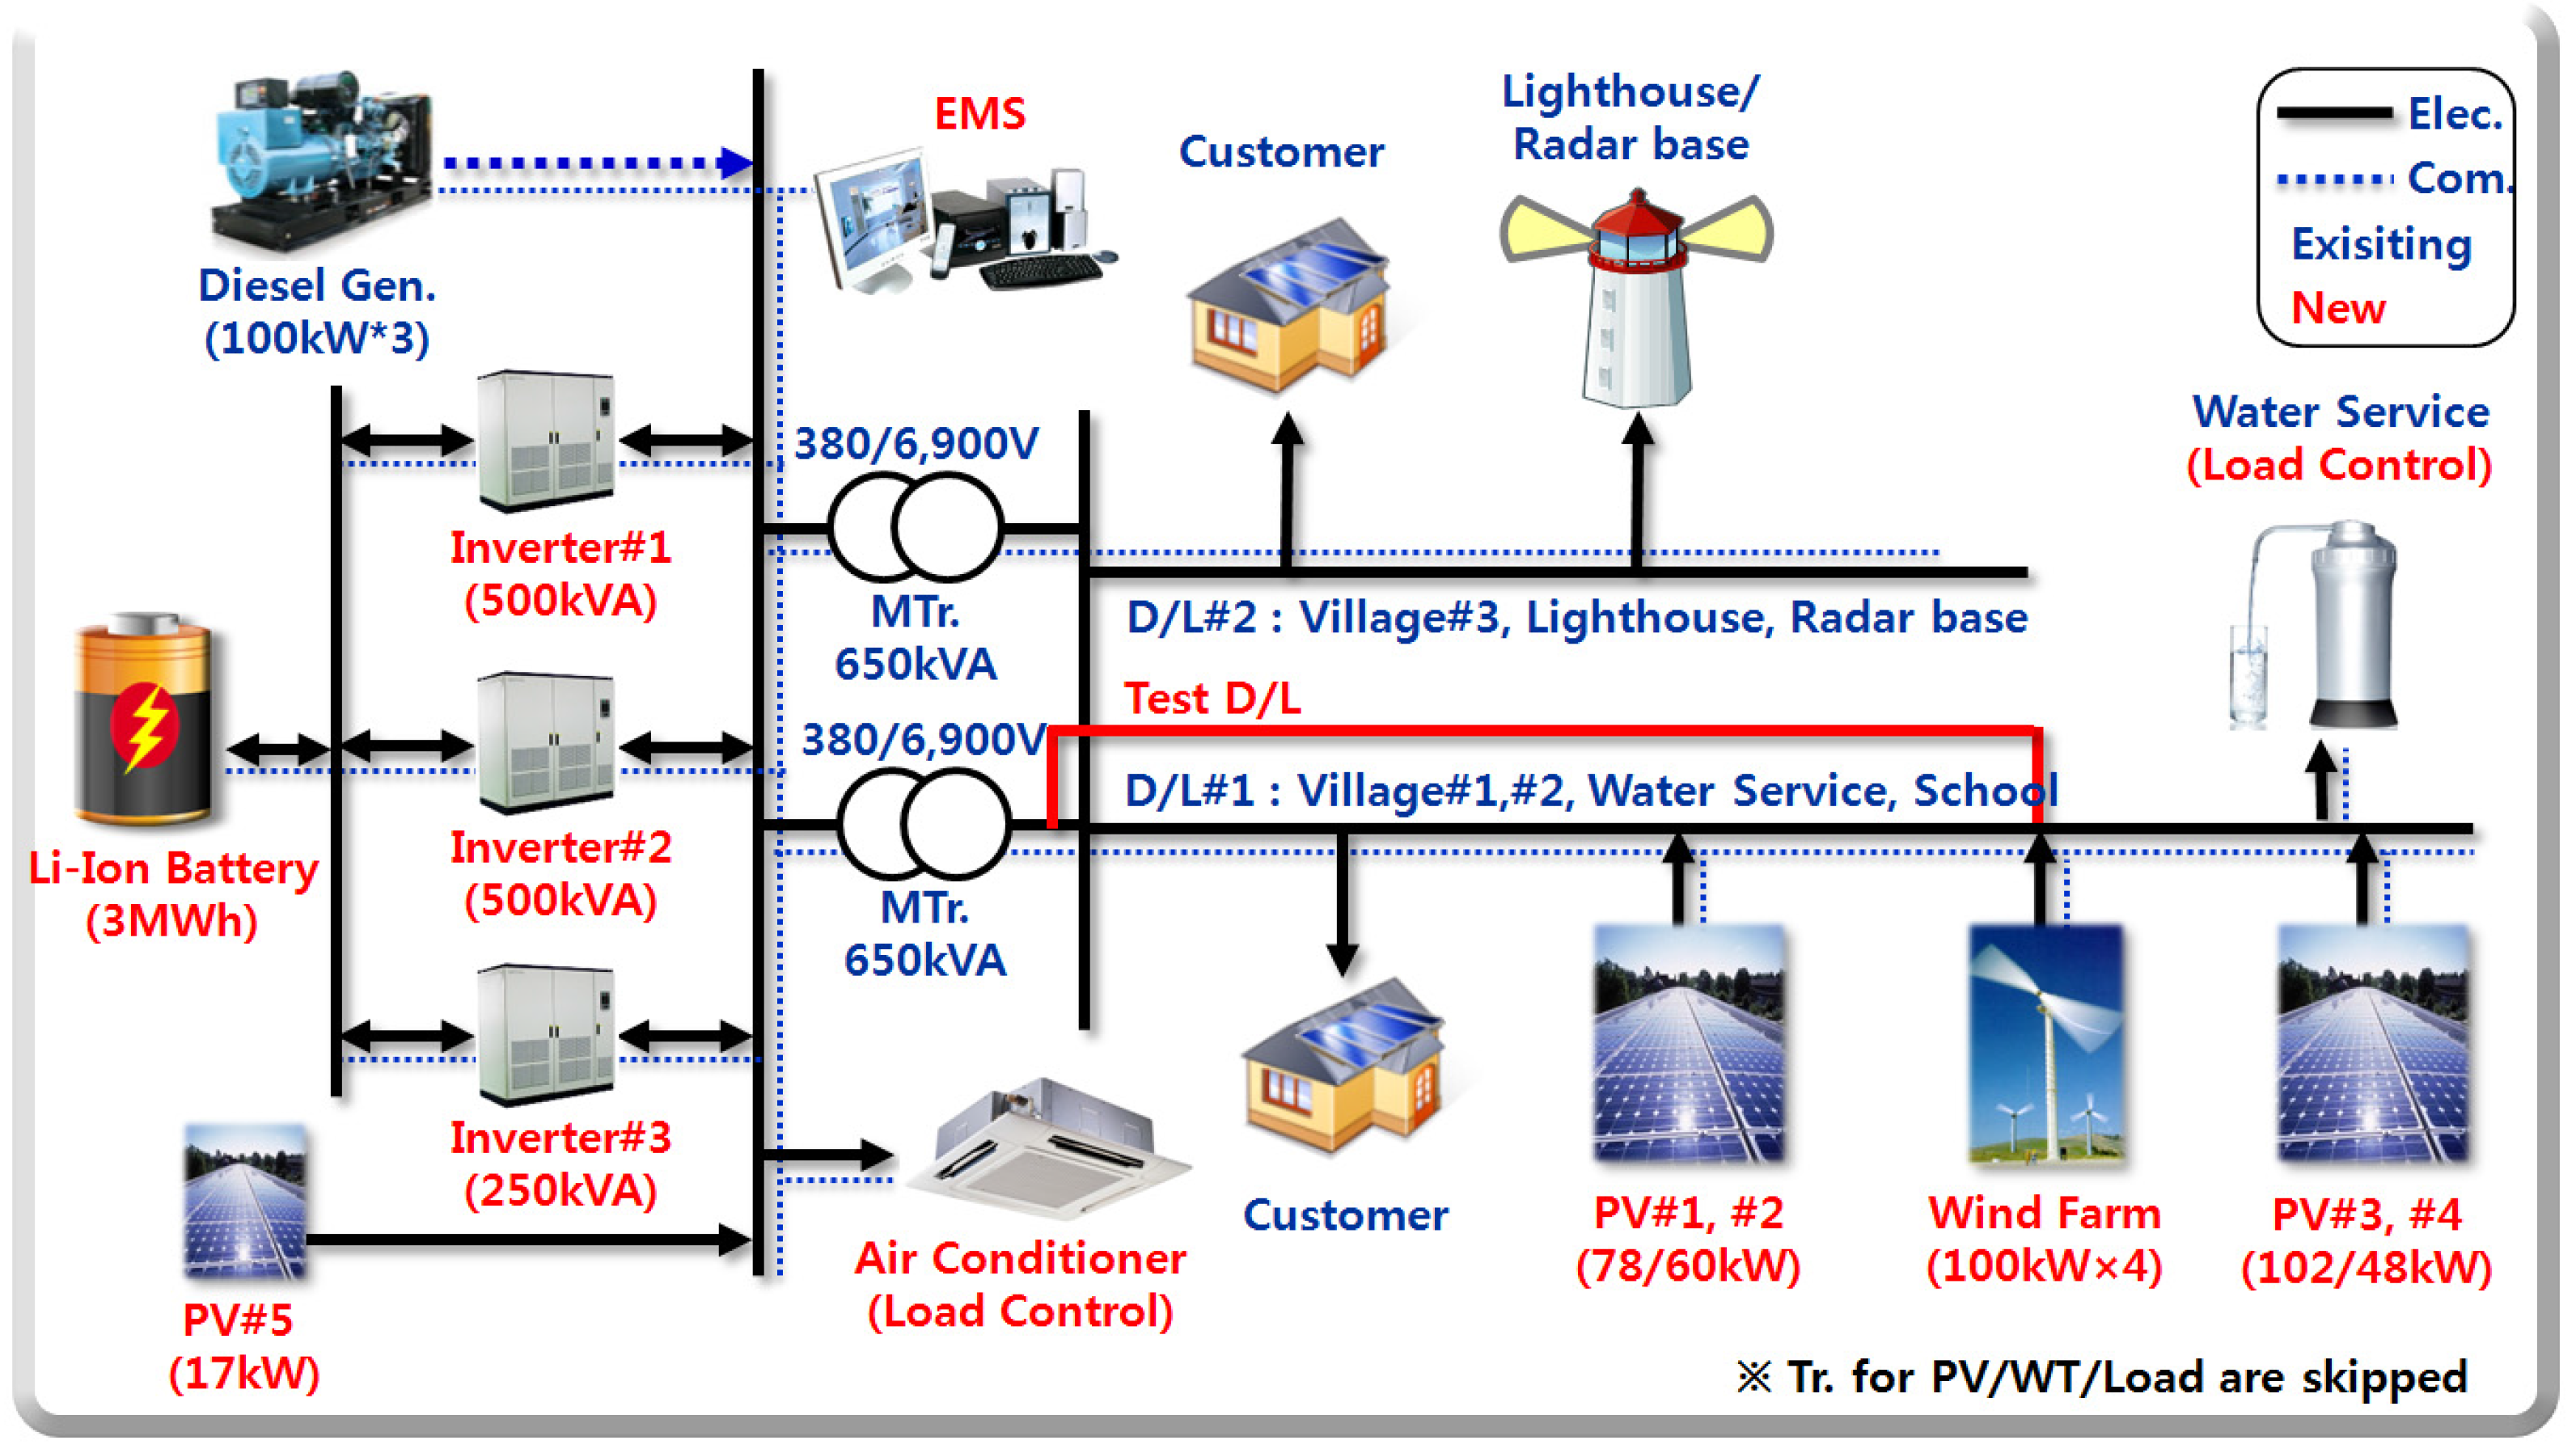
Section 3.1). The system architecture is shown in
Figure 3 and
Table 6 shows functions and features of installed equipment. The remote microgrid on the test island is an inverter-based small power system. Usually, just one Grid Forming Inverter (GFI) controls the system voltage (V) and frequency (f) of Remote microgrid. The #2 inverter is for backup (if there is a fault at #1) or
vice versa. It means that two GFIs don’t operate in parallel because each GFI will control voltage & frequency and there be voltage oscillation called “hunting” [
26].
Table 5.
Simulation Results for Design Target.
Table 5.
Simulation Results for Design Target.
| Contents | Quantity | Value |
|---|
| PV | Rated Capacity | 314 kW |
| Total Production | 355,124 kWh/year |
| Mean Output | 40.5 kW |
| Capacity Factor | 12.90% |
| Penetration Rate | 26.30% |
| WT | Rated Capacity | 100 kW × 4 ea |
| Total Production | 733,790 kWh/year |
| Mean Output | 83.7 kW |
| Capacity Factor | 20.90% |
| Penetration Rate | 54.40% |
| Diesel Generator | Rated Capacity | 100 kW × 3ea |
| Total Production | 260,207 kWh/year |
| Mean Output | 137.8 kW |
| Fuel Consumption | 78,927 L/year |
| Hours of Operation | 1888 h/year |
| Penetration Rate | 19.30% |
| Battery | Energy In | 346,597 kWh/year |
| Energy Out | 328,682 kWh/year |
| Losses | 17,915 kWh/year |
| Energy Flows | Load | 989,878 kWh/year |
| Production | 1,349,120 kWh/year |
| Excess Electricity | 318,316 kWh/year |
| Renewable Fraction | 73.70% |
If the output power from WTs/PVs is bigger than the amount of load, GFI will charge the battery to maintain V&F. On the contrary, the GFI will discharge the electrical power from the battery to the load. If the surplus power is bigger than the GFI’s rated power (500 kVA), the #3 inverter (250 kVA) will be operated automatically.
Sometimes, the diesel generators are interconnected to the GFI to charge the battery or to supply the power to the loads. We used the previously installed diesel generators to operate in parallel with the GFI without any functional modification. Because each diesel generators can operate in parallel with each other with its droop function. Voltage droop is the intentional loss in output voltage from a device as it drives a load [
28]. Frequency droop allows synchronous generators to run in parallel, so that loads are shared among generators in proportion to their power rating [
28]. In our test island, GFI will control system voltage & frequency and diesel generators will be operated in droop mode, so there is no concern for the voltage oscillation problem. WTs & PVs don’t run without GFI, because the diesel generators cannot control the frequency properly if there is too much power from WTs & PVs. In this system, we impose the spinning reserve at the GFI because this system is the inverter-based remote microgrid. Through this, we can reduce the fuel consumption for the spinning reserve of the diesel generators.
Figure 3.
System architecture of the test island.
Figure 3.
System architecture of the test island.
Test D/L is for the initial system test using GFI, WTs, PVs and load simulator, so normally Test D/L is not charged.
Table 6.
Functions and Features of Installed Equipment.
Table 6.
Functions and Features of Installed Equipment.
| Contents | Specification | Functions and Features |
|---|
| Energy Manage System | SCADA + Application | Battery SOC management, Forecasting of load and renewable energy, Direct load control, Automation |
| Grid Forming Inverter | 500 kVA × 2, 250 kVA × 1 | Frequency &voltage control, P/Q control 500 kVA #2: Backup, 250 kVA: for shortage of rating |
| Battery | 3 MWh, Li-ion | Electrical energy storage, 1 C-rate, NMC type Three GFIs are connected to 3 MWh in parallel |
| WT | 100 kW × 4 | Permanent Magnet Synchronous Generator (PMSG) + Full converter, Power limitation, Power factor & Voltage control, LVRT, FRT |
| PV | 314 kW (8 ea) | Power limitation, Monitoring of each module, Water floating PV system for limited site |
| Diesel Generator | 100 kW × 3 | Droop control, Remote on/off |
| Load | Water pump, Air conditioner | Water tank is used to energy storage.
Battery room temperature control using surplus energy |
In the test island, a water supply tank was installed on a mountainside and water was supplied to households via natural water pressure. Thus, the water level in the water supply tank should be 70% or higher at all times; the water level was maintained by a water supply motor. If excess power in the renewable energy was used for charging the battery, the excess power was used to run the motor via the EMS for water pumping in advance instead of battery charging. In this way, the battery charging could be minimized to extend the battery life.
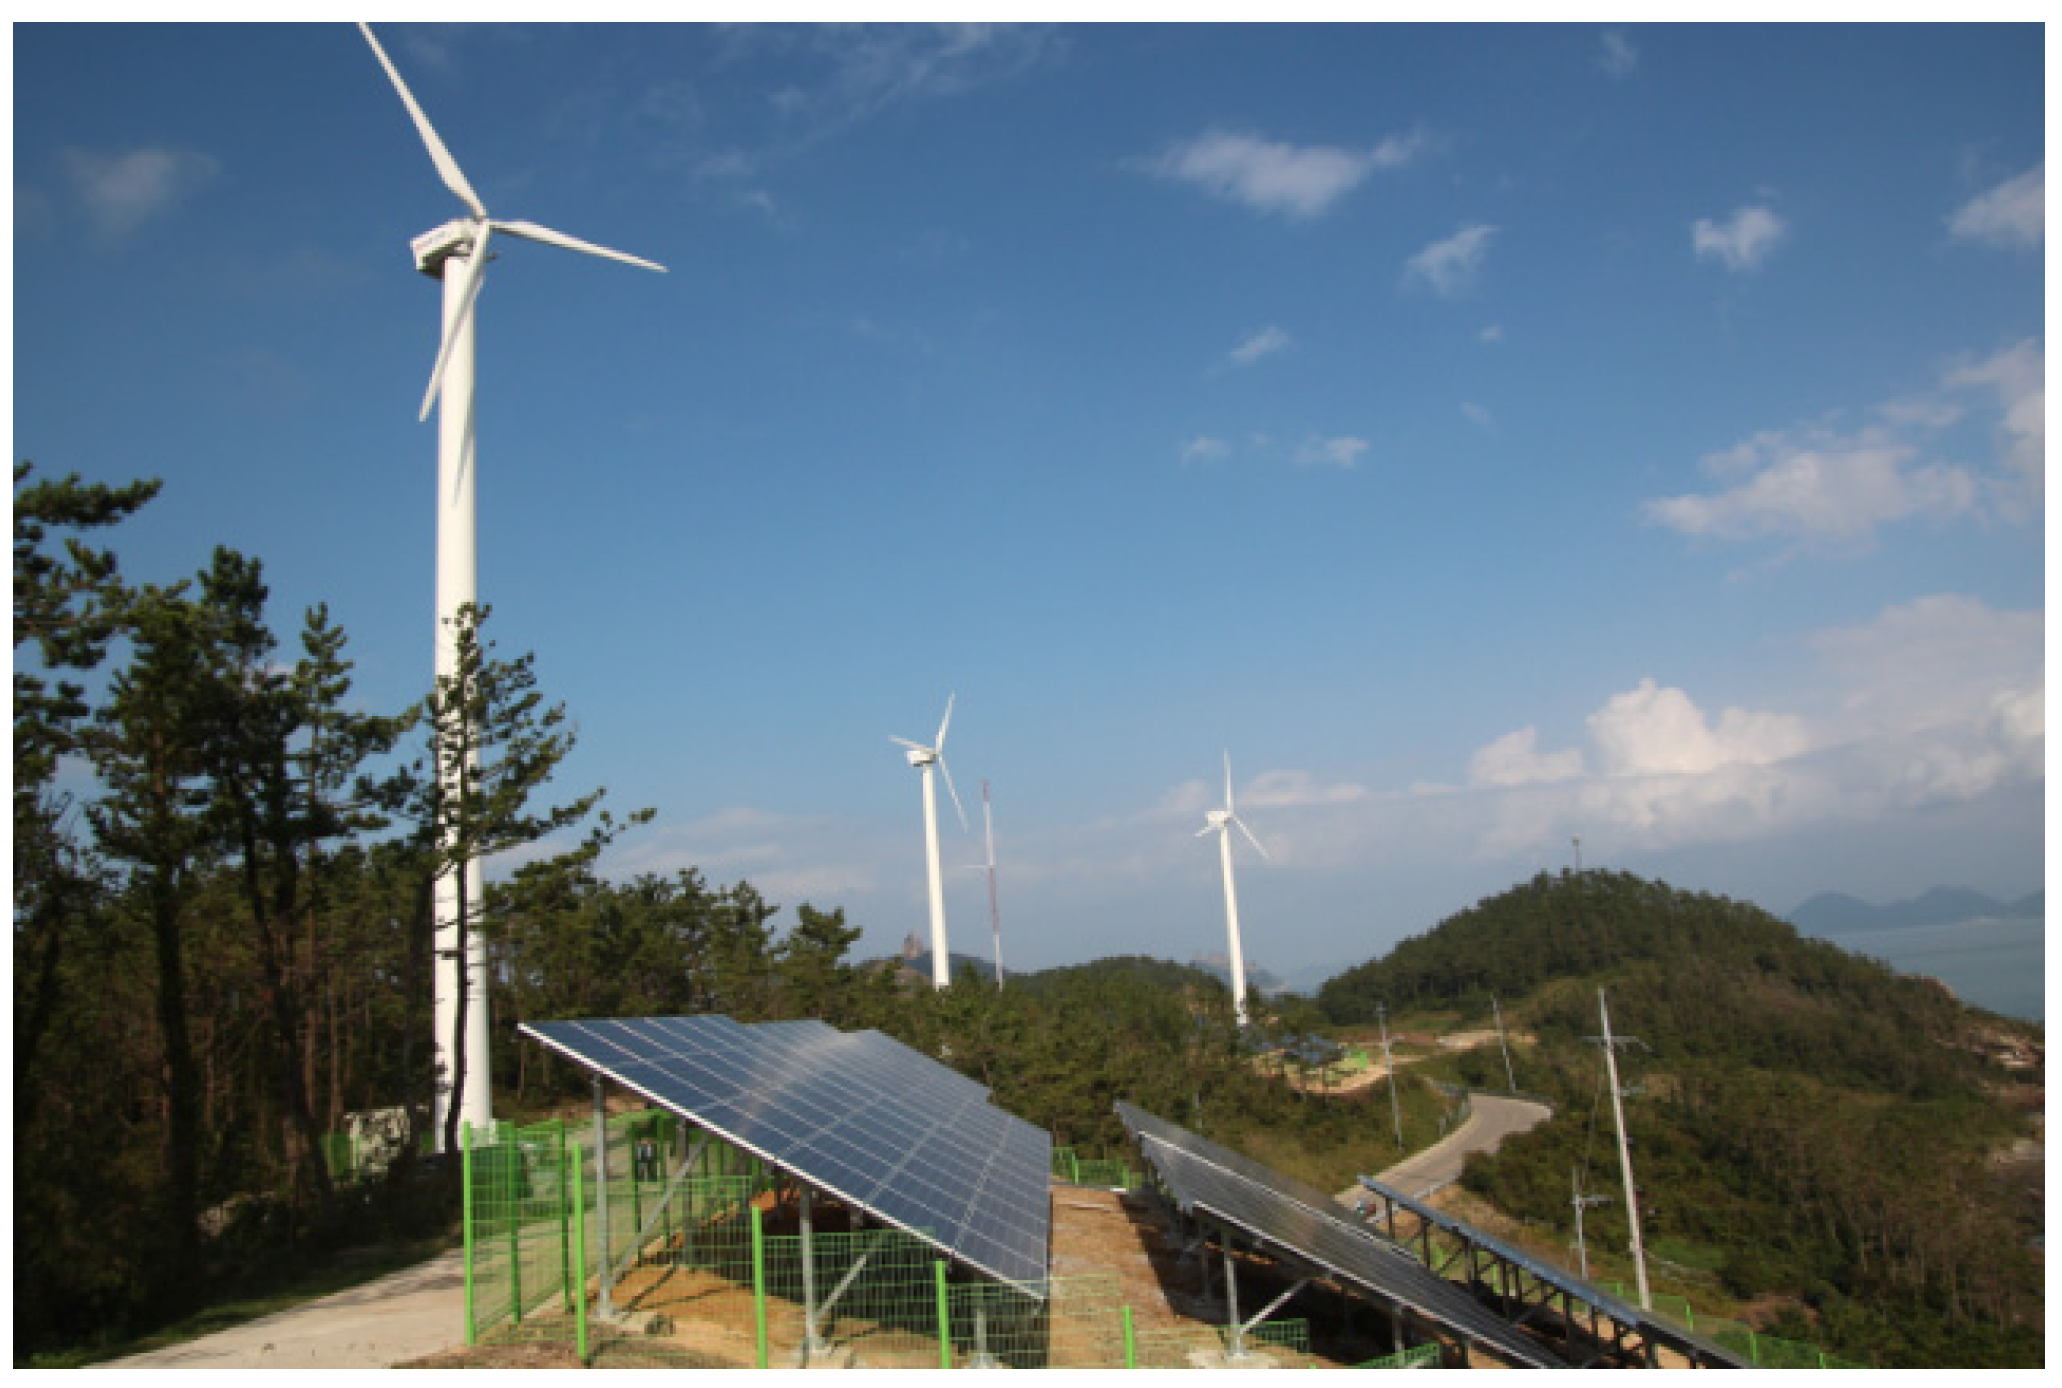
Figure 4,
Figure 5,
Figure 6 and
Figure 7 are the installed equipment in the test island.
Figure 4.
Wind and solar farm.
Figure 4.
Wind and solar farm.
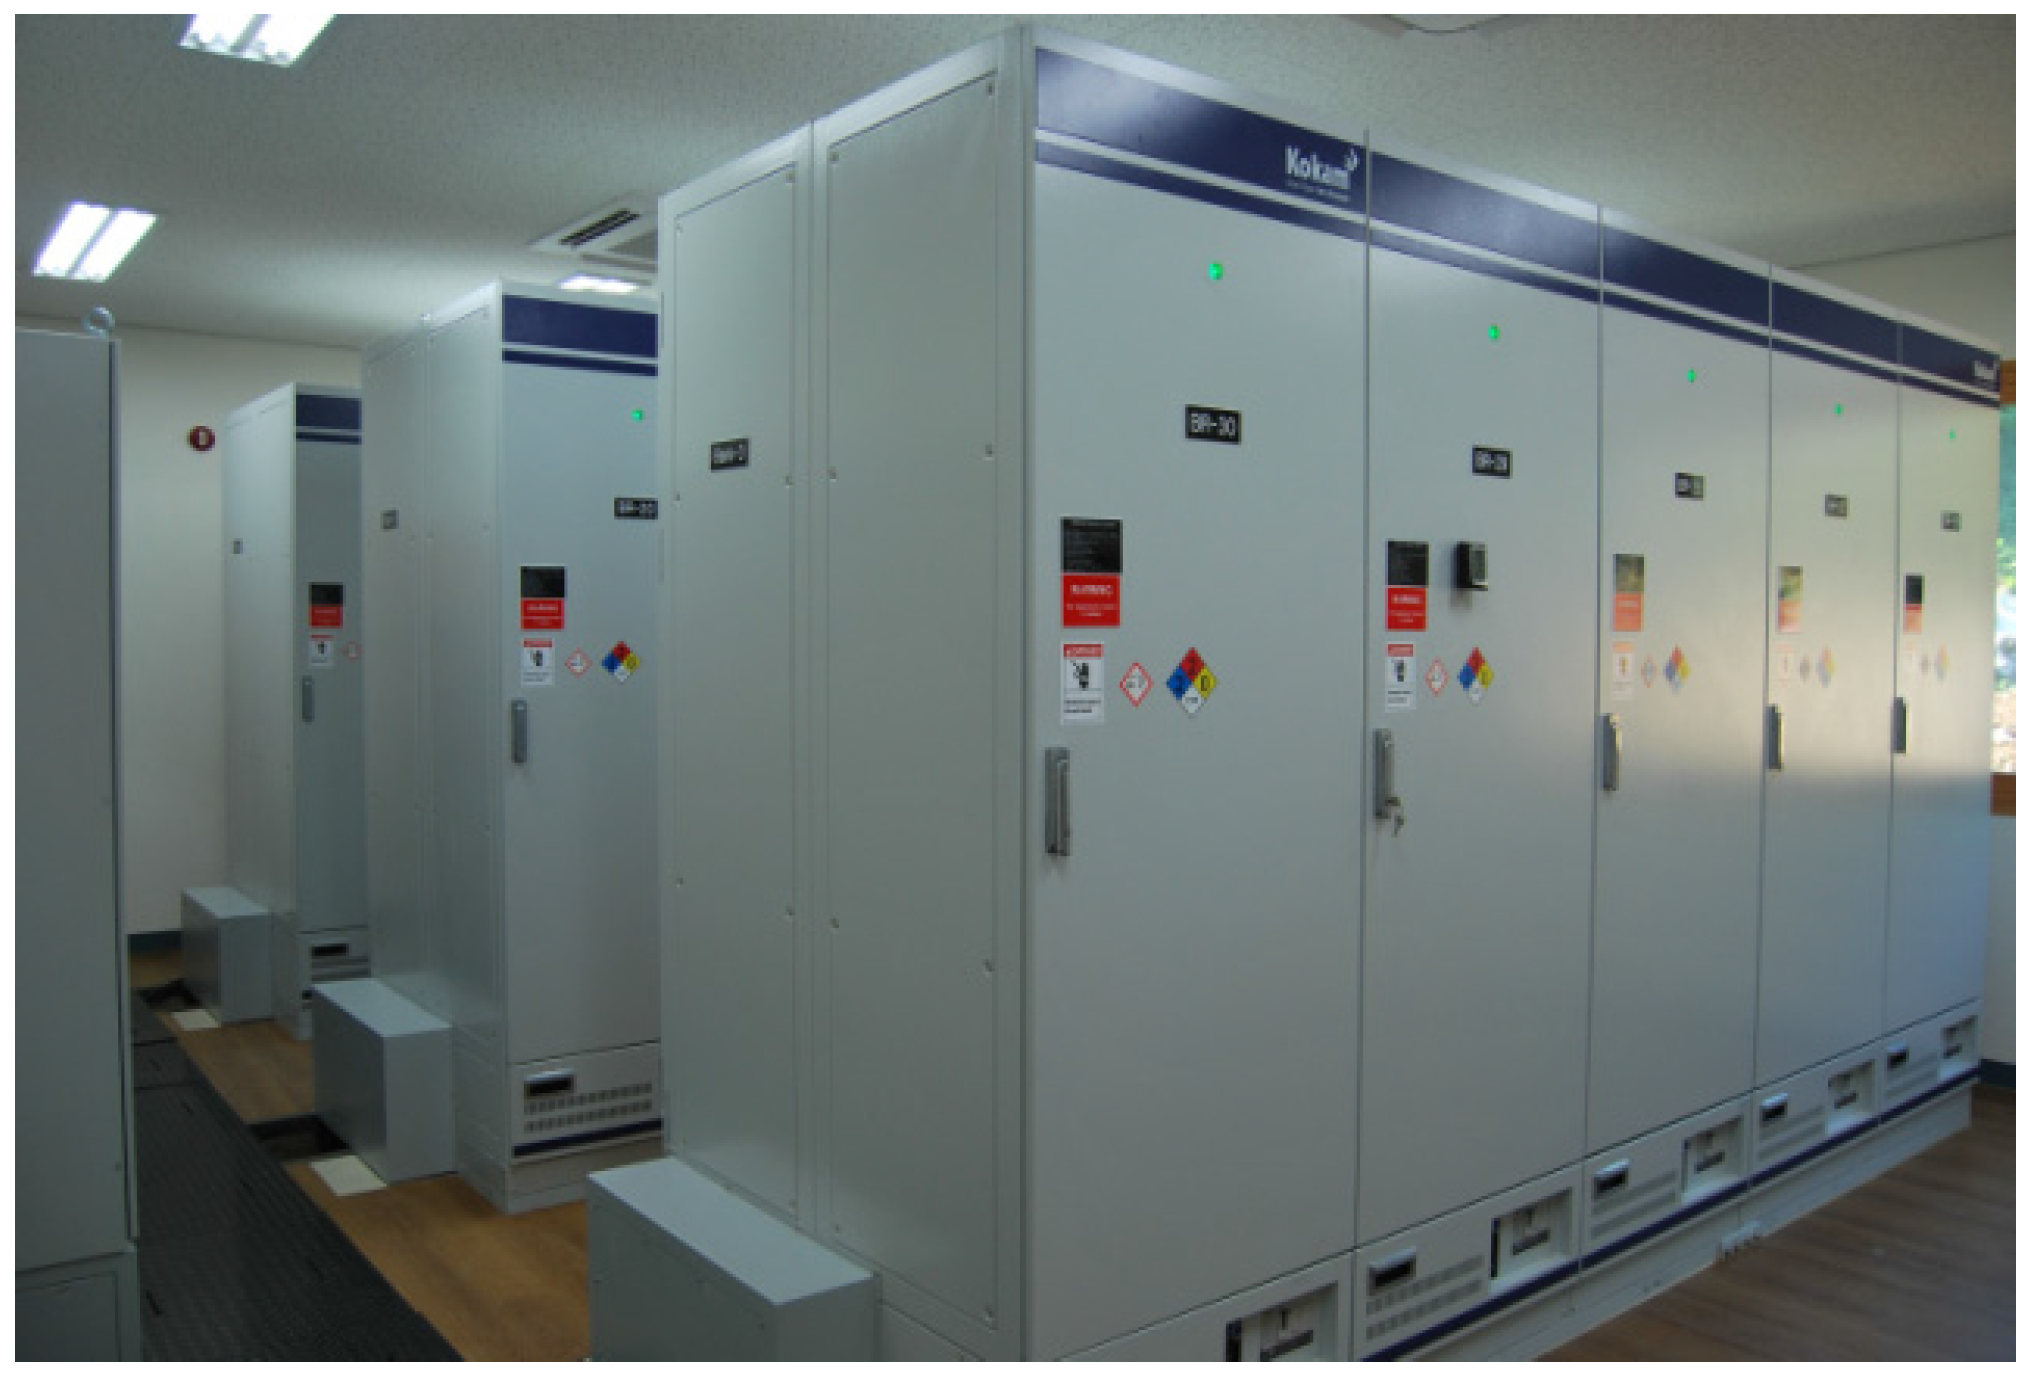
Figure 5.
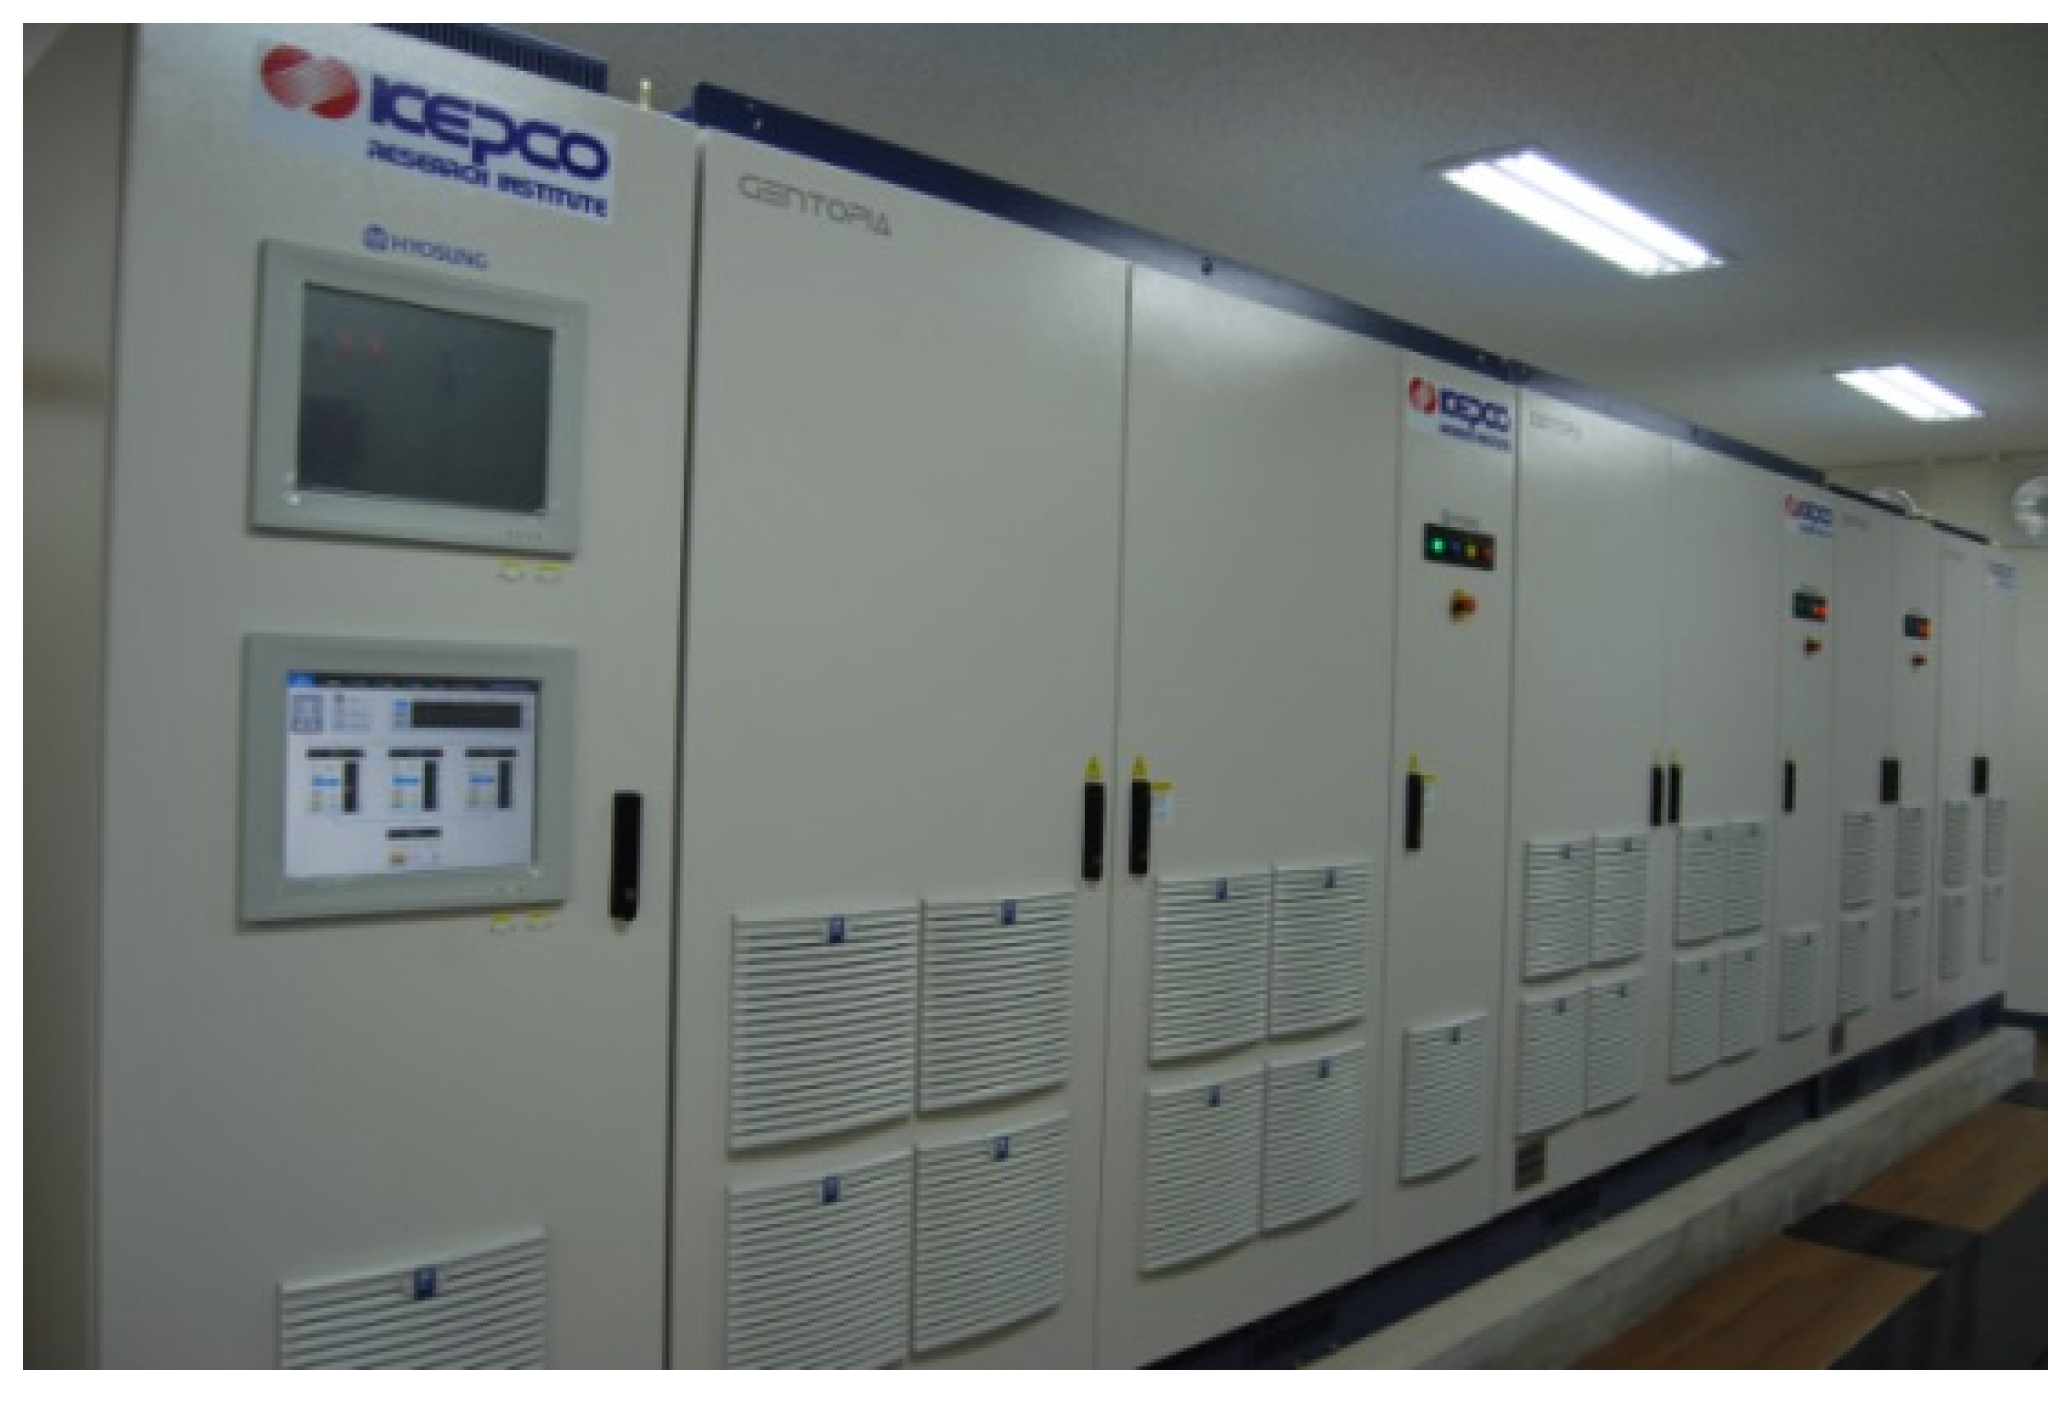
Grid forming inverters.
Figure 5.
Grid forming inverters.
Figure 6.
Li-ion battery.
Figure 6.
Li-ion battery.
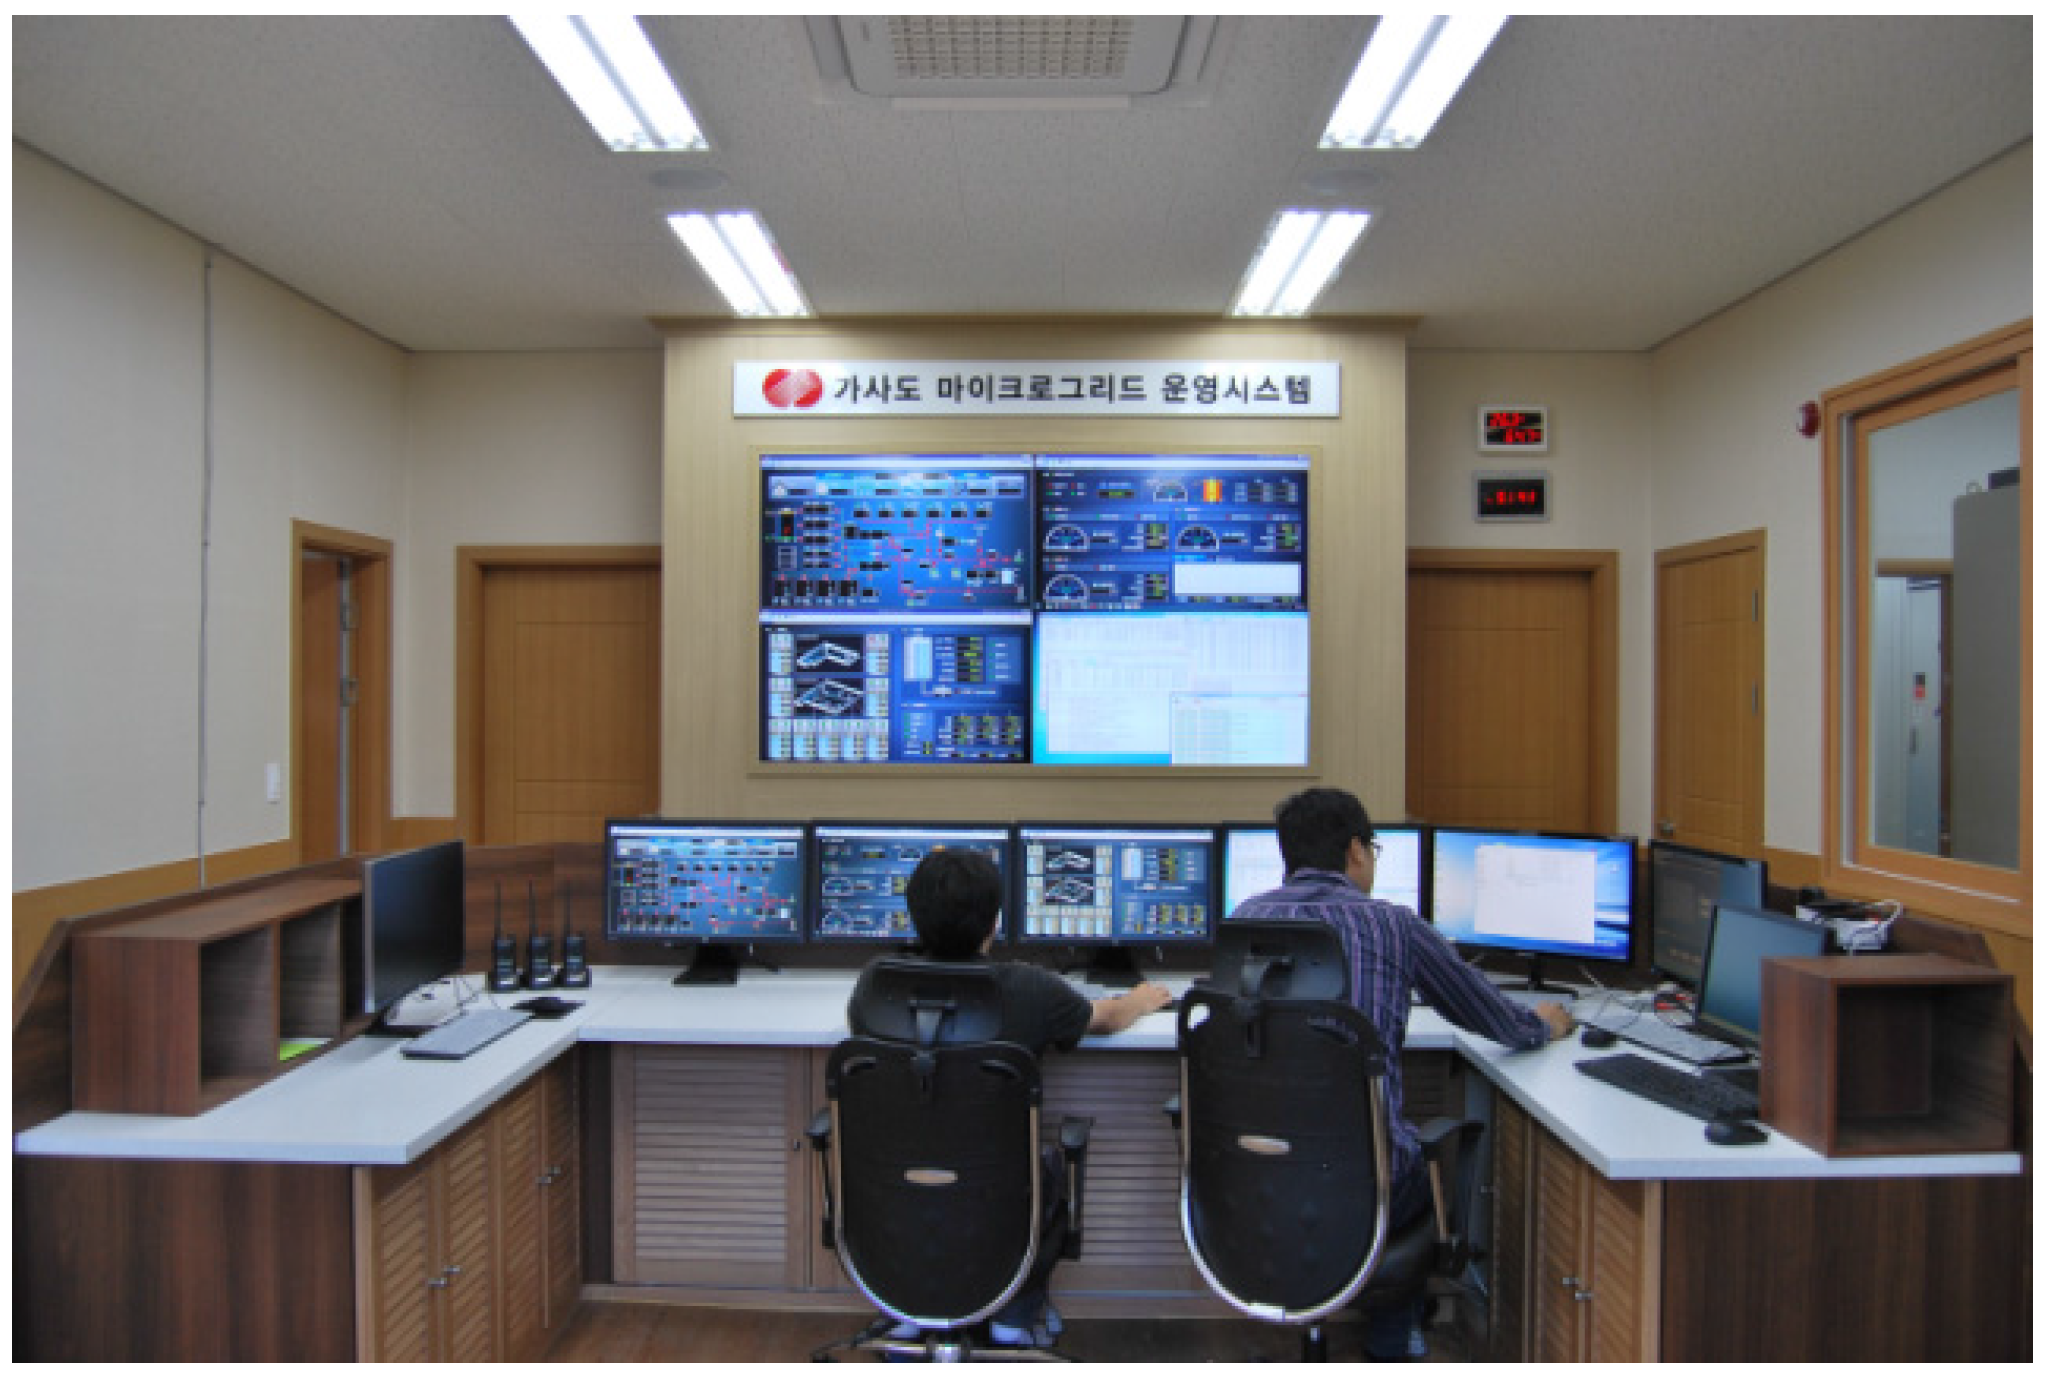
Figure 7.
Energy management system.
Figure 7.
Energy management system.
5.2. Analysis of Operation Results
Table 7 shows the operation results from October 2014 to March 2015 after the construction of the remote microgrid. On the test island, wind velocity was high and solar radiation was low in the winter season, whereas wind velocity was low and solar radiation was high in the summer season. The commercial operation of the remote microgrid began in October 2014. Because the WT capacity was greater than the PV capacity, power generation via WT was more than that of PV. During a six-month period, the average renewable energy fraction was approximately 82% and diesel generator fuel consumption was reduced by 80%.
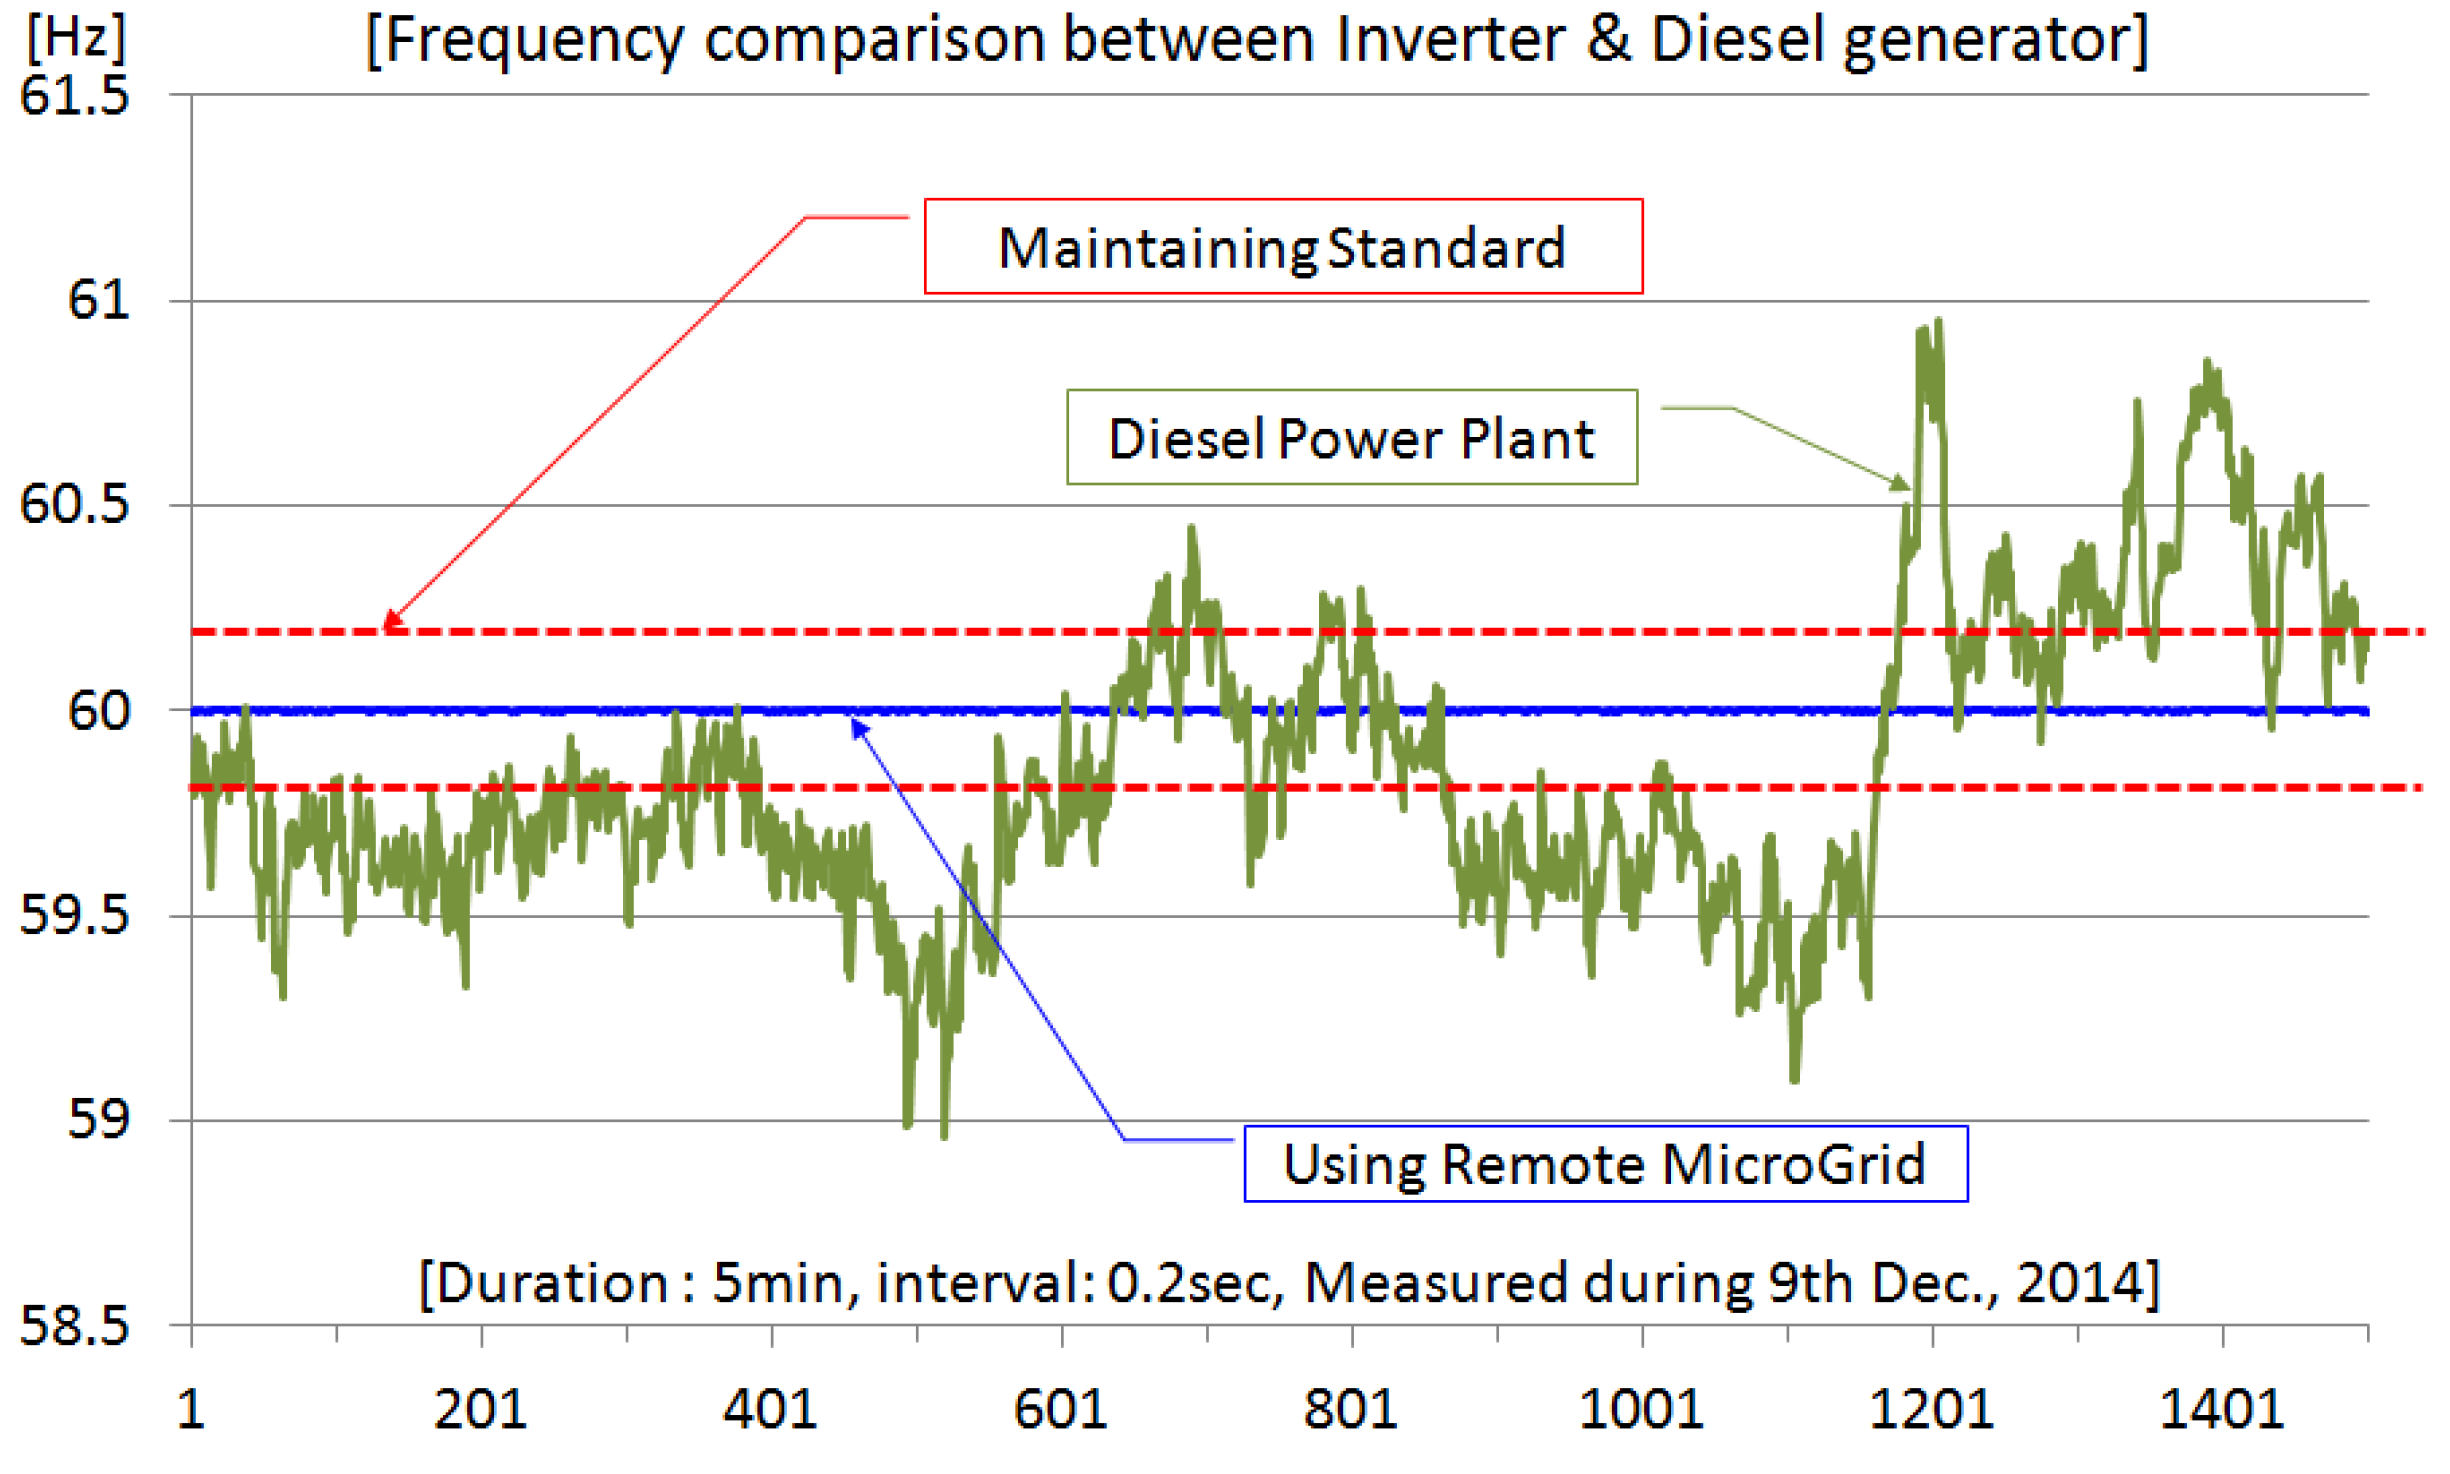
Figure 8 shows a graph of the frequency comparison between the remote microgrid and the diesel power plant. The frequency-maintaining standard in South Korea is 59.8 to 60.2 Hz as an average value of a 30 min interval, which is displayed in the figure as a red dotted line. When supplying power with the diesel generator (green color solid line), the maintenance rate was 57% as the average value of a 0.2 s interval. However, when supplying power with the remote microgrid (blue solid line), the maintenance rate was 100% as the average value of a 0.2 s interval. That is, the power quality of the remote microgrid was better than that of the diesel power plant, despite the high renewable energy rate.
Table 7.
Energy production and load of the test island after commission.
Table 7.
Energy production and load of the test island after commission.
| Generator | Unit | October | November | December | January | February | March | Average |
|---|
| Wind Turbine | kWh | 33,301 | 42,107 | 56,577 | 55,700 | 50,200 | 31,400 | 44,881 |
| Photovoltaic | kWh | 27,659 | 23,537 | 15,005 | 21,064 | 23,705 | 35,940 | 24,485 |
| Diesel Generator | kWh | 20,300 | 16,839 | 21,061 | 12,672 | 6222 | 13,539 | 15,106 |
| Total Production (=Load and Loss) | kWh | 81,260 | 82,483 | 92,643 | 89,436 | 80,127 | 80,879 | 84,471 |
| Renewable Fraction | % | 75.0 | 79.6 | 77.3 | 85.8 | 92.2 | 83.3 | 82.0 |
| Fuel Consumption (after commission) | Liter | 6379 | 5272 | 6049 | 3703 | 1699 | 3600 | 4450 |
| Fuel Consumption (before commission) | Liter | 21,828 | 21,829 | 21,830 | 24,836 | 19,998 | 23,611 | 22,322 |
Figure 8.
Frequency comparison between the remote microgrid and diesel power plant.
Figure 8.
Frequency comparison between the remote microgrid and diesel power plant.
5.3. Operation Results Comparison with Economic Feasibility Study
Table 8 shows the expected energy production and load on the test island according to HOMER. The average load was 84,650 kWh, which was similar to that of 84,471 kWh in
Table 5. That is, the loads were relatively well simulated. The power generation results via PV were 26,750 and 24,485 kWh, respectively, which showed an approximately 8.5% error, which was not significantly different compared to the expected power generation. However, the average WT power generation results were 96,987 and 44,881 kWh, respectively, which showed a difference by more than two-fold. This result was due to the significant WT power generation in the winter caused by high wind velocity; moreover, the battery was fully charged, thereby often stopping WT or enforcing output restriction. Another key reason for the error was the lower average wind velocity than in past years and several line fault accidents.
Table 8.
Expected energy production and load of the test island by HOMER.
Table 8.
Expected energy production and load of the test island by HOMER.
| Generator | Unit | October | November | December | January | February | March | Average |
|---|
| Wind Turbine | kWh | 67,760 | 71,989 | 146,867 | 123,287 | 83,624 | 88,398 | 96,987 |
| Photovoltaic | kWh | 32,788 | 21,948 | 20,403 | 23,634 | 25,319 | 36,411 | 26,750 |
| Diesel Generator | kWh | 16,988 | 20,411 | 8143 | 5894 | 12,964 | 4965 | 11,561 |
| Total Production | kWh | 117,536 | 114,347 | 175,413 | 152,815 | 121,907 | 129,773 | 135,299 |
| Total Load Served | kWh | 81,563 | 81,901 | 85,719 | 87,700 | 82,580 | 88,437 | 84,650 |
| Renewable Fraction | % | 85.5 | 82.2 | 95.4 | 96.1 | 89.4 | 96.2 | 91.0 |
| Fuel Consumption | Liter | 5124 | 6115 | 2462 | 1782 | 3911 | 1485 | 3480 |
| Excess Energy and Loss | kWh | 35,973 | 32,446 | 89,694 | 65,115 | 39,327 | 41,336 | 50,649 |
Accordingly, the average renewable fraction was also low at approximately 82%, which was unlike the initial expectation. Moreover, the average fuel consumption was also increased from 3480 to 4450 L. The average fuel consumption was reduced by 81% compared to that of the previous year.
5.4. Efficient Operation of Diesel Generators in the Remote Microgrid
If power is supplied to loads using only a diesel generator, the diesel generator would be entirely responsible for frequency control due to invariant loads. Under this circumstance, a fuel input amount can suddenly vary according to invariant loads so that fuel efficiency can be degraded. If a diesel generator is run in parallel with a grid forming inverter (GFI), the GFI handles frequency control due to invariant loads. Accordingly, the diesel generator can be run with constant output as well as improved fuel efficiency. Because parallel operation of two generators is not needed for reserve power, the diesel generator can be run in the highest efficiency region.
Table 9 shows a comparison of power generation efficiency between a power supply using only a diesel generator and a power supply using a diesel generator running in parallel with the GFI. This is the result of fuel consumption and power generation when real loads were supplied for 24 h each. According to data in
Table 9, efficiency was improved by 14.2%. Operation efficiency of the inverter is normally 88% to 95%, and round-trip efficiency of the battery is 90% to 95%. Thus, when a diesel generator is run in the remote microgrid, it should be run in the highest efficiency section. The maximum output of the diesel generator should also not exceed the load to prevent a power loss due to charging and discharging of the battery. This would result in improvements in the overall system efficiency.
Table 9.
Fuel consumption comparison of a diesel generator.
Table 9.
Fuel consumption comparison of a diesel generator.
| Operation Type | At Diesel Power Plant | At Remote Microgrid |
|---|
| 2 gen-set in parallel | one gen-set with grid forming inverter (GFI) |
|---|
| Fuel Consumption | 766.2 L/24 h | 562.7 L/24 h |
| Total Production | 2319.3 kWh | 1946.2 kWh |
| Average Power | 96.6 kW | 81 kW |
| Energy per Fuel | 3.02 kWh/L | 3.45 kWh/L |
| Fuel per Energy | 0.3304 L/kWh | 0.2892 L/kWh |


