Abstract
In this study we design and test a novel solar tracking generation system. Moreover, we show that this system could be successfully used as an advanced solar power source to generate power in greenhouses. The system was developed after taking into consideration the geography, climate, and other environmental factors of northeast China. The experimental design of this study included the following steps: (i) the novel solar tracking generation system was measured, and its performance was analyzed; (ii) the system configuration and operation principles were evaluated; (iii) the performance of this power generation system and the solar irradiance were measured according to local time and conditions; (iv) the main factors affecting system performance were analyzed; and (v) the amount of power generated by the solar tracking system was compared with the power generated by fixed solar panels. The experimental results indicated that compared to the power generated by fixed solar panels, the solar tracking system generated about 20% to 25% more power. In addition, the performance of this novel power generating system was found to be closely associated with solar irradiance. Therefore, the solar tracking system provides a new approach to power generation in greenhouses.
1. Introduction
In recent times, there have been several advancements in greenhouse automation systems [1]. These advancements include the creation of artificial light that meets specific light parameters in an internal environment. Based on the plant light requirements, natural lights can be supplemented by artificial lights to improve crop production. Therefore, it is very important to adequately provide efficient artificial light for greenhouses [2,3]. However, the use of artificial light has raised many concerns, including the use of excessive fossil fuel for generating electrical power [4]. Researchers are now developing alternative energy sources, such as solar photovoltaic panels, which would provide energy for the operation of artificial light in the near future. These alternative energy sources are renewable, clean energy sources that are also environmentally friendly.
Energy plays an integral role in economic growth. Moreover, it is considered as a significant national security concern. In recent decades, there has been a great demand for energy due to a spurt in economic activities [5]. Future economic growth heavily depends on the long-term availability of energy that is affordable, accessible, and environmentally sustainable. Therefore, scientists are focusing their efforts on develop alternative energy sources that are clean and renewable [6,7,8]. Among these alternative sources of energy, solar energy is one of the most viable candidates. However, solar energy has some drawbacks, such as low density, intermittent availability, and broad and varied spatial distribution [9]. Scientists have to address these limitations of solar energy before it can be used as an effective utility.
Among the various renewable sources of energy, solar energy is the most abundant form of renewable energy; however, the instrumentation and installation of solar photovoltaic panels involves high expenditure of money, making solar power currently a restricted utility [10]. China receives abundant sunlight throughout the year [11,12,13]. In particular, the southern territory of China, which lies at a latitude of 45.62, receives more than 2300 h of sunlight annually. Therefore, a significant amount of this solar energy can be harnessed for social and economic development of these areas.
Solar panels are generally used to harness solar energy [14]. Silicon solar panels get heated to a temperature of more than 70 °C when they are subjected to intense sunlight for a prolonged duration of time. At this high temperature, these panels show low efficiency while converting sunlight into energy. As a result, the system performance is diminished and the power generation system encounters a one-third loss approximately [15]. Therefore, a solar energy system is exposed to different amounts of sunlight, which controls the amount of power generated by the solar energy conversion system. In other words, the system generates more power when it is exposed to greater amount of sunlight [16]. Researchers have recently used this energy theory in a large number of practical applications, and they have proposed solutions to many limitations of solar energy [17,18,19,20,21]. Al-Soud et al. [22] have designed a parabolic solar cooker that has an automatic sun tracking system consisting of two axes. Mousazadeh et al. [23] have reviewed sun-tracking principles and methods. Xiaodi et al. [24] have designed a novel solar boiling water system containing a holistic solar funnel concentrator. These studies have elucidated how automatic solar tracking systems can be effectively used to address energy problems.
In this study, we faced energy problems when we provided artificial lighting to greenhouse plants in northeast China during the winter season. Northeast China is a relatively backward region, so very few devices in this region operate on alternative energy sources. In particular, the application of solar energy is very scarce. As sunshine is available for a relatively shorter duration of time during winter, greenhouses must be provided with artificial lighting for a longer duration of time. As a result, the power consumption of greenhouses is greater during winter. In this study, we elucidated how an auto tracking system can be effectively used to increase solar energy utilization. Compared with a traditional fixed solar energy system, an automatic tracking system increases the power-generating capacity of the solar energy system by more than 20%. Therefore, we have implemented an improved solar tracking system, which provides a new approach to power generation in greenhouses.
2. Results and Discussion
Solar Tracking System Tests
A simple auto solar tracking system was tested; the tracking route followed the motion trail of COSMOS Motion simulation analysis. The results indicated that direction of sunlight was always kept fixed with respect to the solar panel. Thus, we obtained the maximum solar flux. If the system deviated from the direction of sunlight, there was a decrease in the rate at which the system received solar radiation. With an increase in the angle of deviation, there was a decrease in the rate at which the sunlight passed through the system.
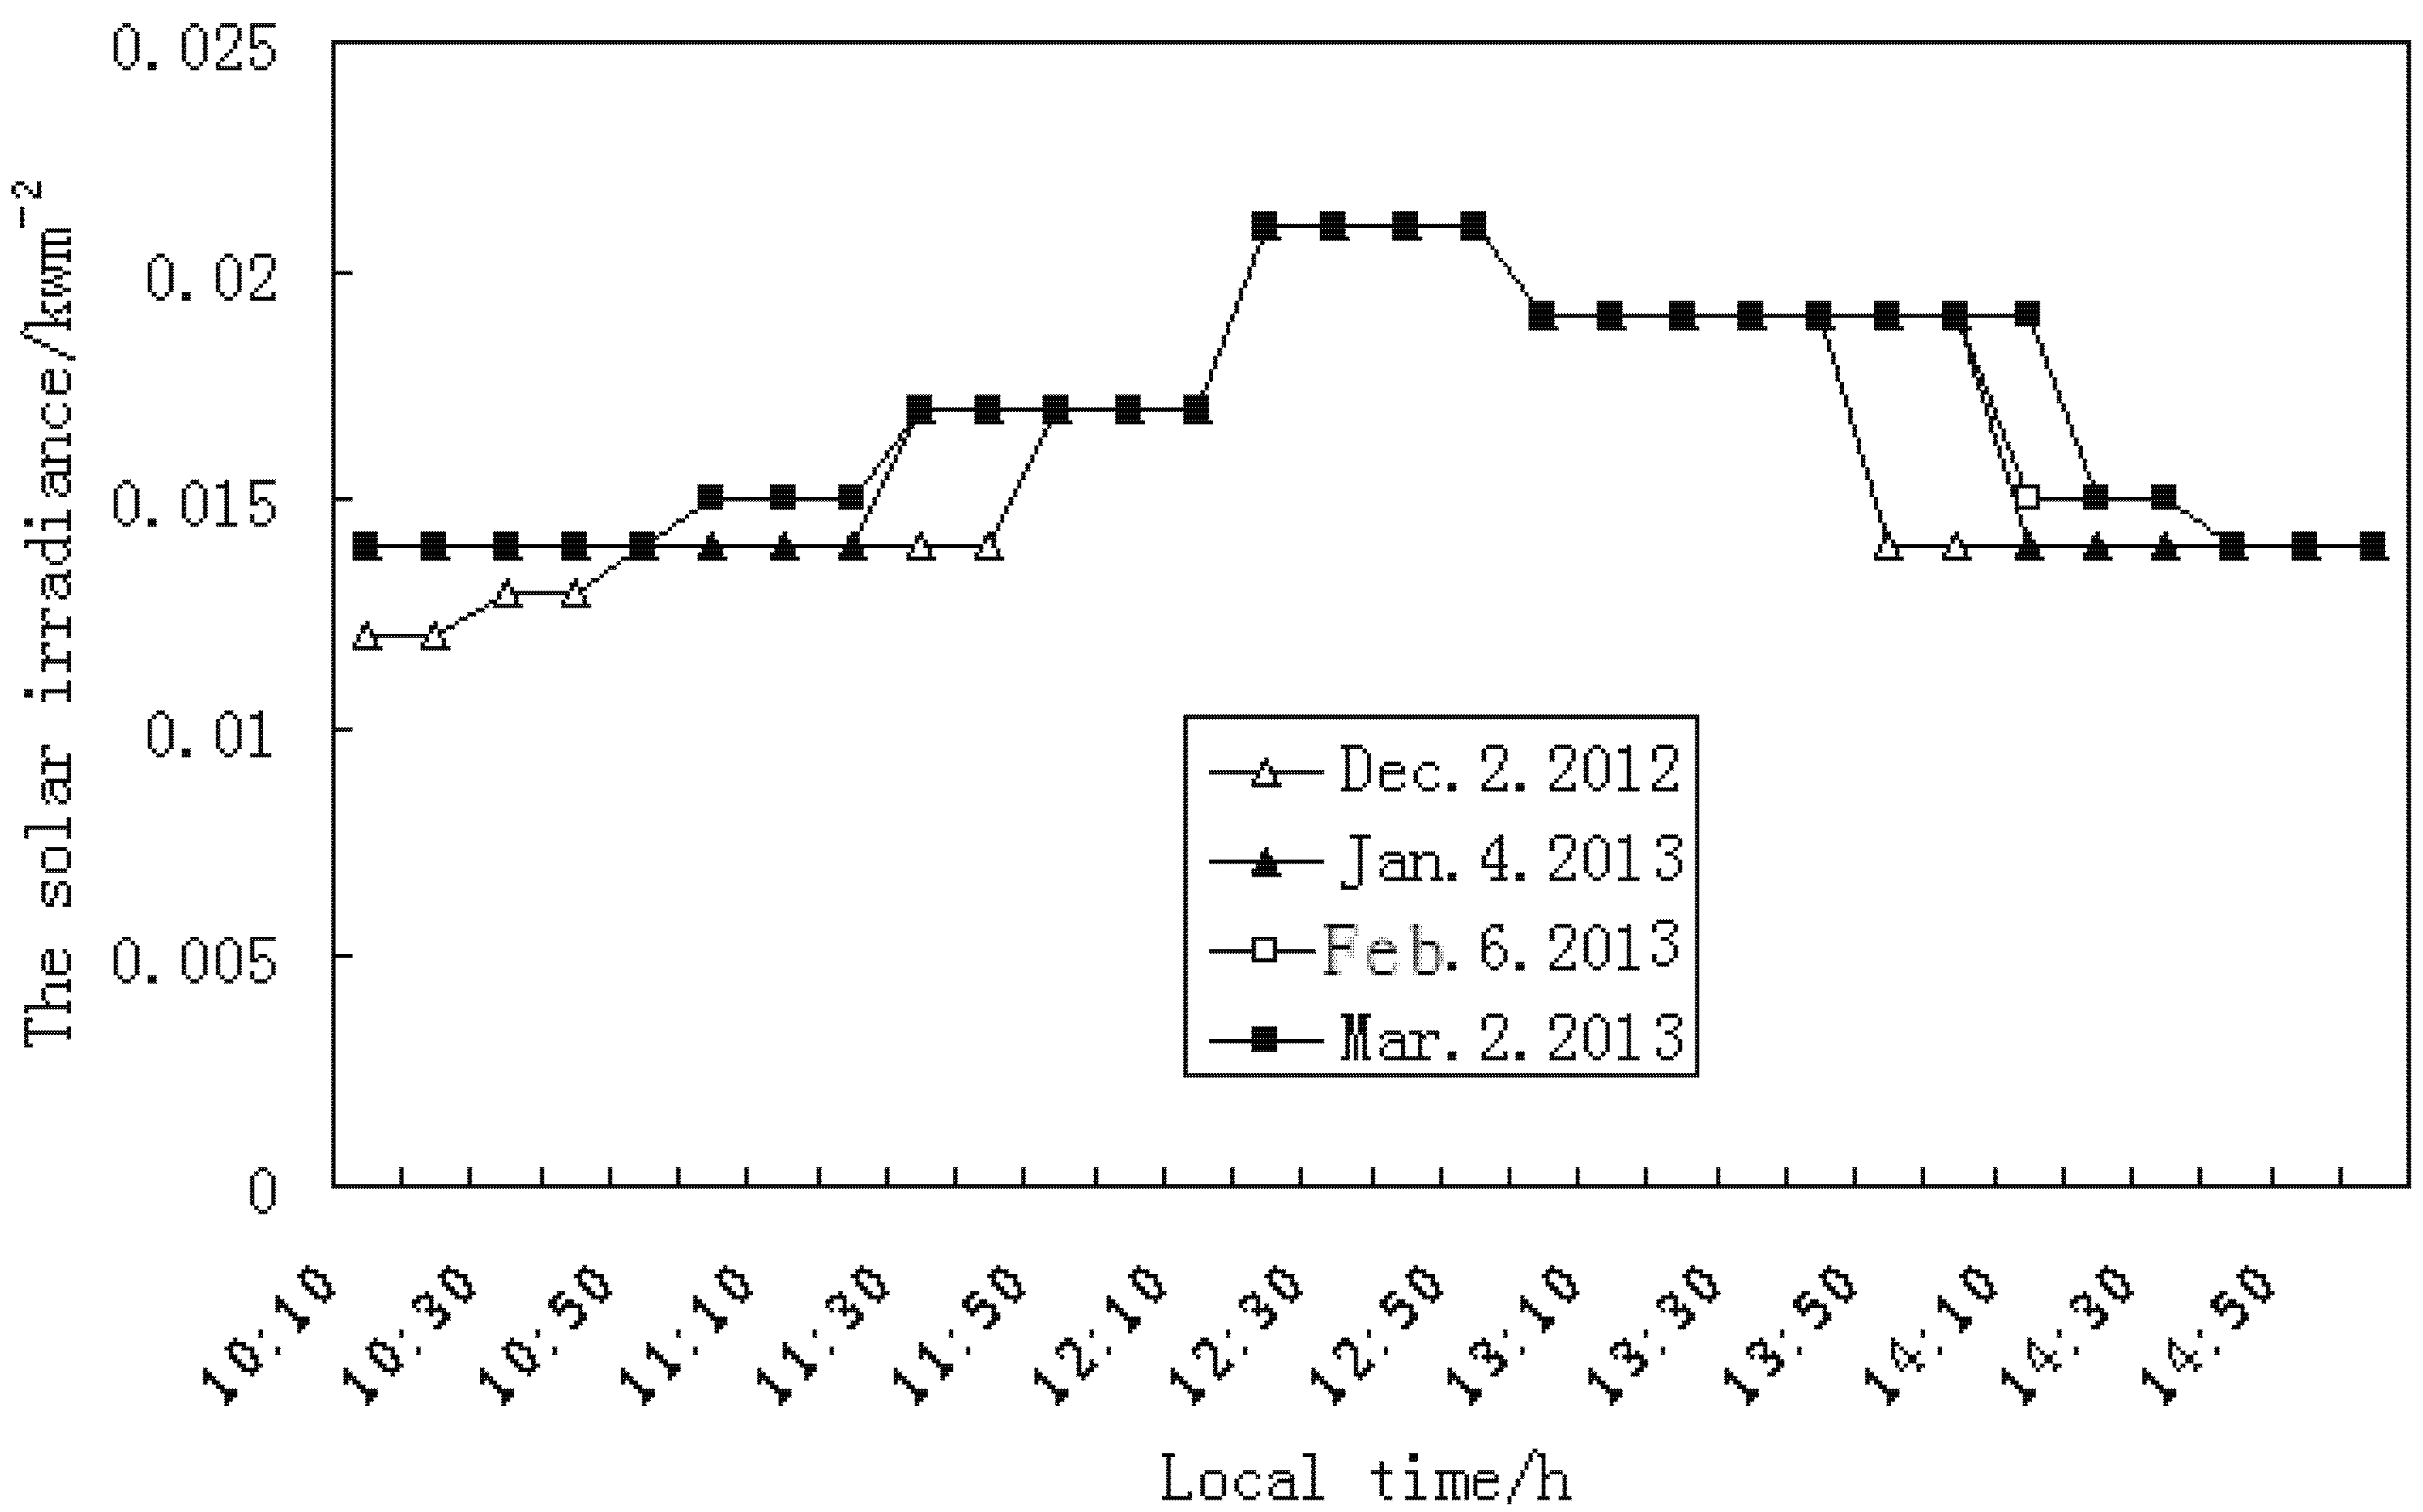
On 21 December 2012, the power produced by the solar tracking system was 10.94 Wh, while that produced by the fixed panel was only 9.11 Wh. Thus, the solar tracking system produced 20% more power than that produced by the fixed panel (Figure 1 and Figure 2). On 21 January 2013, the power generated by the solar tracking system was 17.08 Wh, while that produced by the fixed panel was only 14.13 Wh. Thus, the solar tracking system generated 21% more power than that produced by the fixed panel. On 20 February 2013, the power produced by the solar tracking system was 20.93 Wh, while the power generated by the fixed panel was only 17.03 Wh. Compared to the power generated by the fixed panel, the solar tracking system generated about 23% more power. On 21 March 2013, the solar tracking system produced 21.87 Wh, while the fixed panel produced only 17.65 Wh. Thus, compared to the power generated by the fixed panel, the solar tracking system generated about 24% more power. Overall, the results indicate that the solar tracking system generated approximately 20% to 25% more power than the fixed panel. In the solar tracking system, power production was rapid. Moreover, the solar radiant intensity of the solar tracking system was higher than that of the fixed panel.
Fixed and solar tracking systems produced the same amount of power on cloudy days (Figure 3 and Figure 4). When the solar irradiance declined to 0.014 kW/m2, the power generated by the two methods reached zero simultaneously, indicating that the performance of both the systems was poor on cloudy days. Thus, although the solar tracking system efficiently collects incident solar radiation on sunny days, its system is ineffective on cloudy days. Therefore, the tracking mode did not produce measurable increases in power output on cloudy days. Therefore, on cloudy days, the tracking mode should be suspended to save the energy required to drive the system.
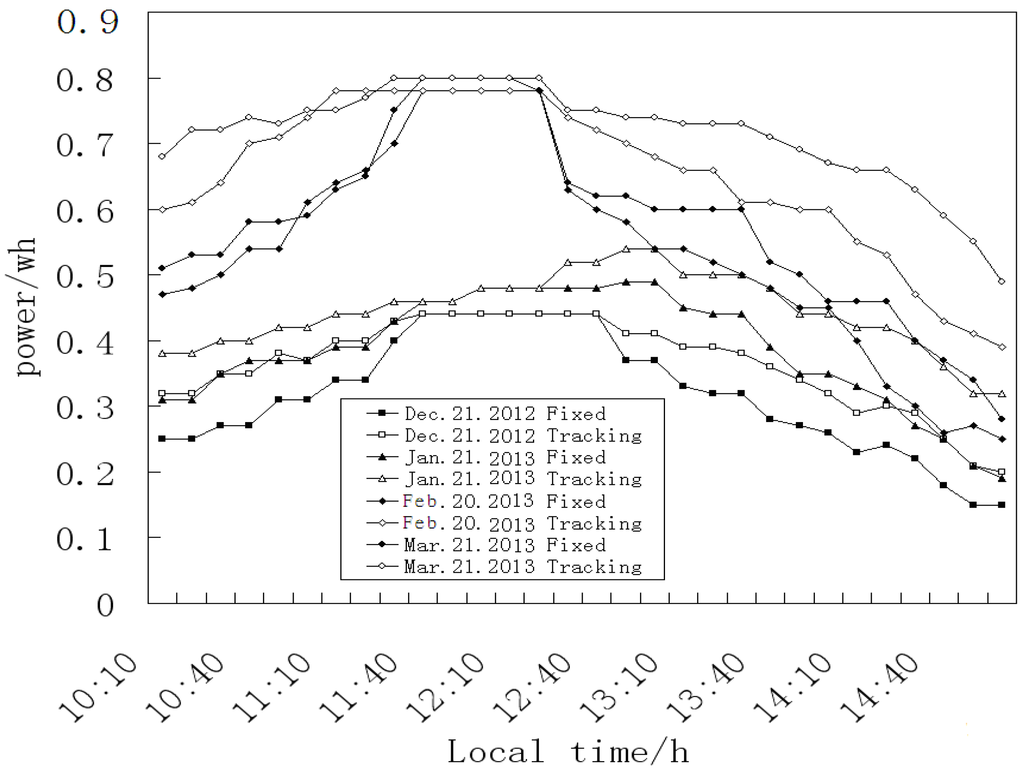
Figure 1.
Power generated (Wh) over time (plotted in 10-min increments) on sunny days.
Figure 1.
Power generated (Wh) over time (plotted in 10-min increments) on sunny days.
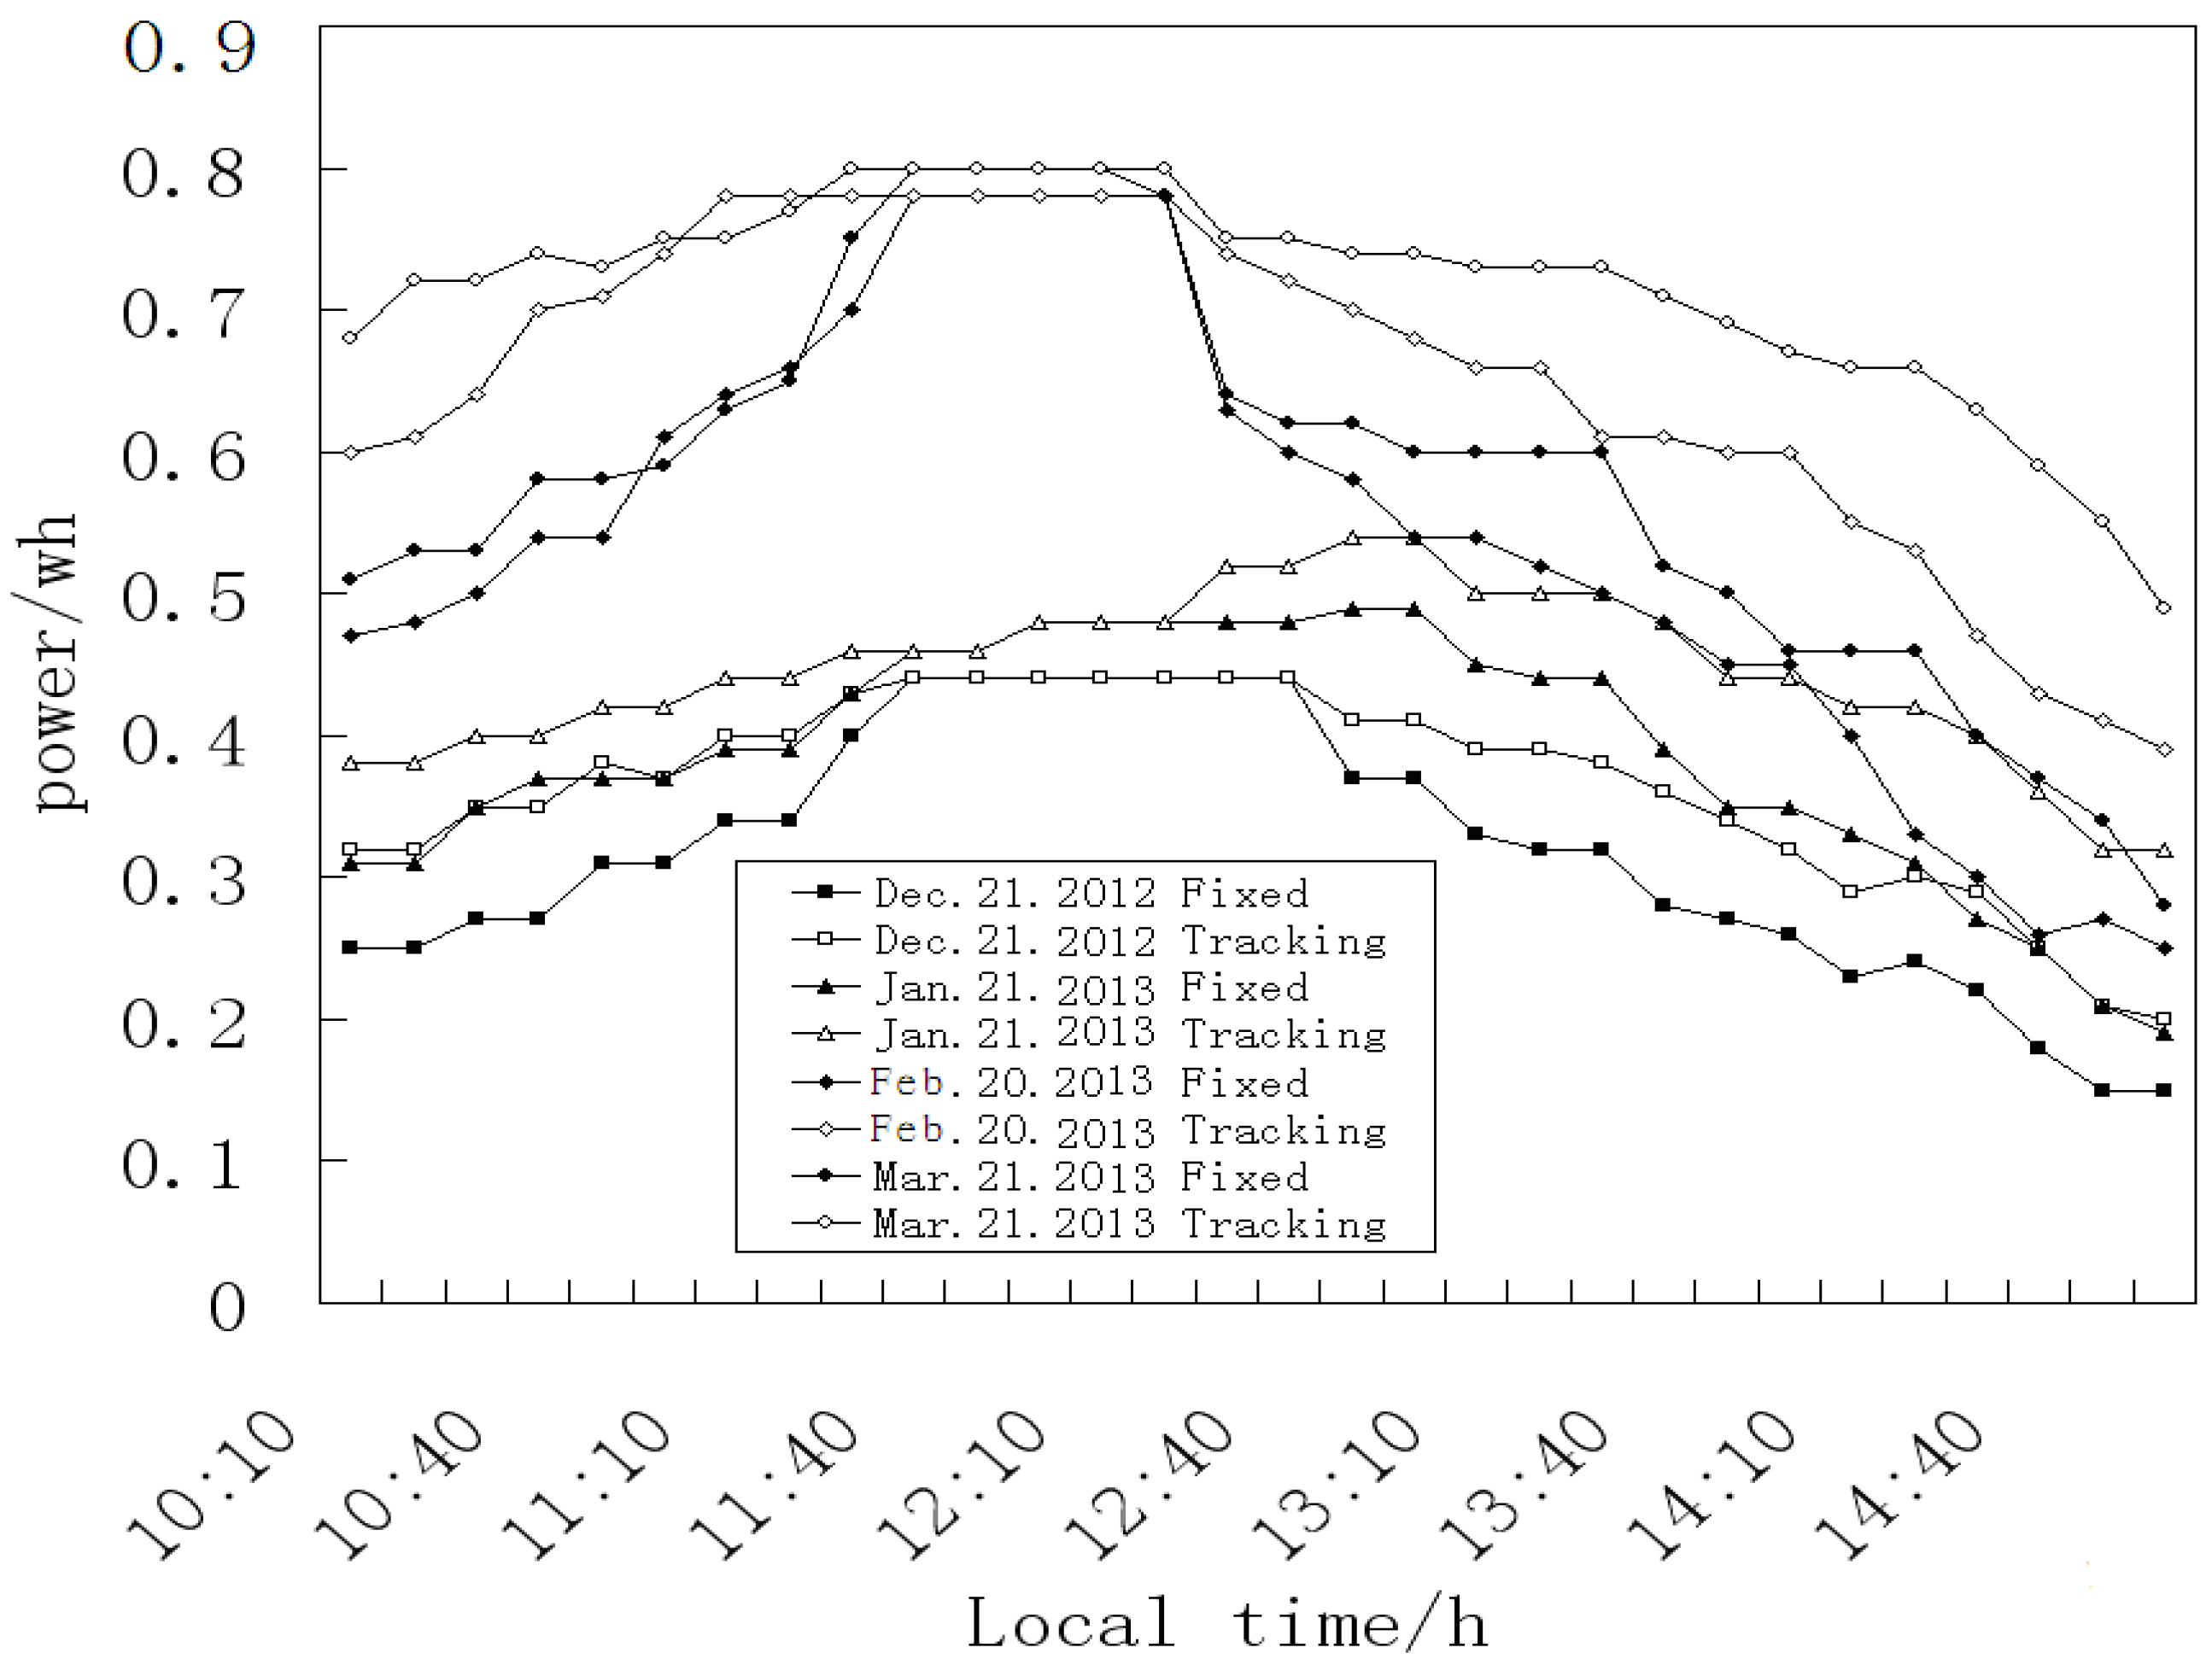
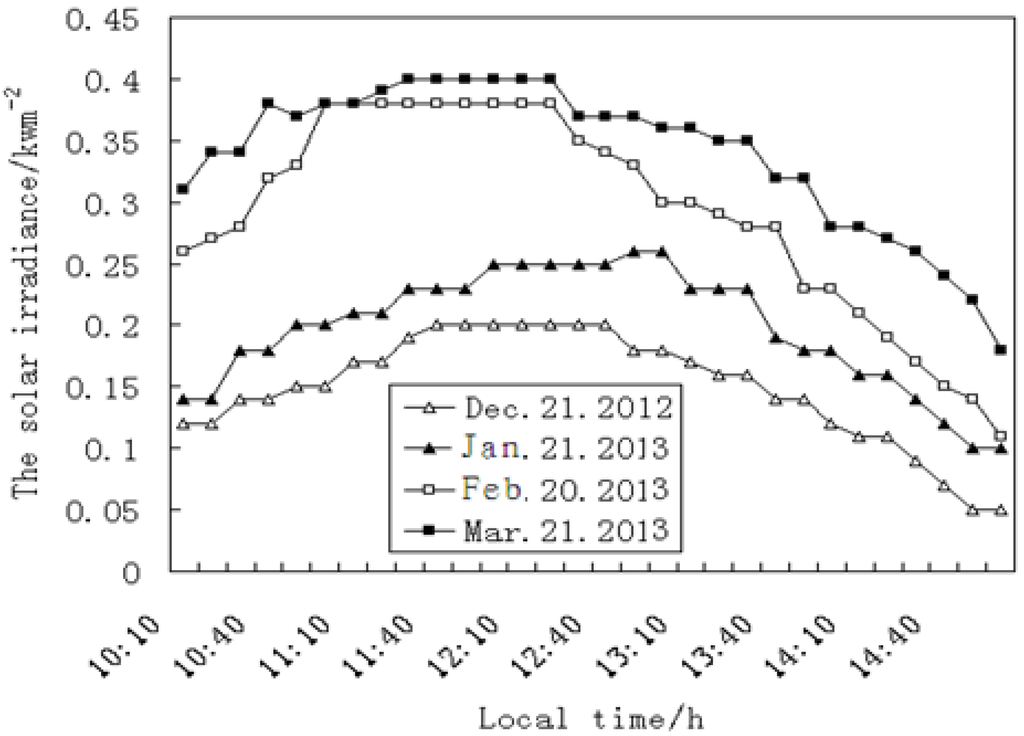
Figure 2.
Amount of solar irradiance (kW/m2) over time (plotted in 10-min increments) on sunny days.
Figure 2.
Amount of solar irradiance (kW/m2) over time (plotted in 10-min increments) on sunny days.

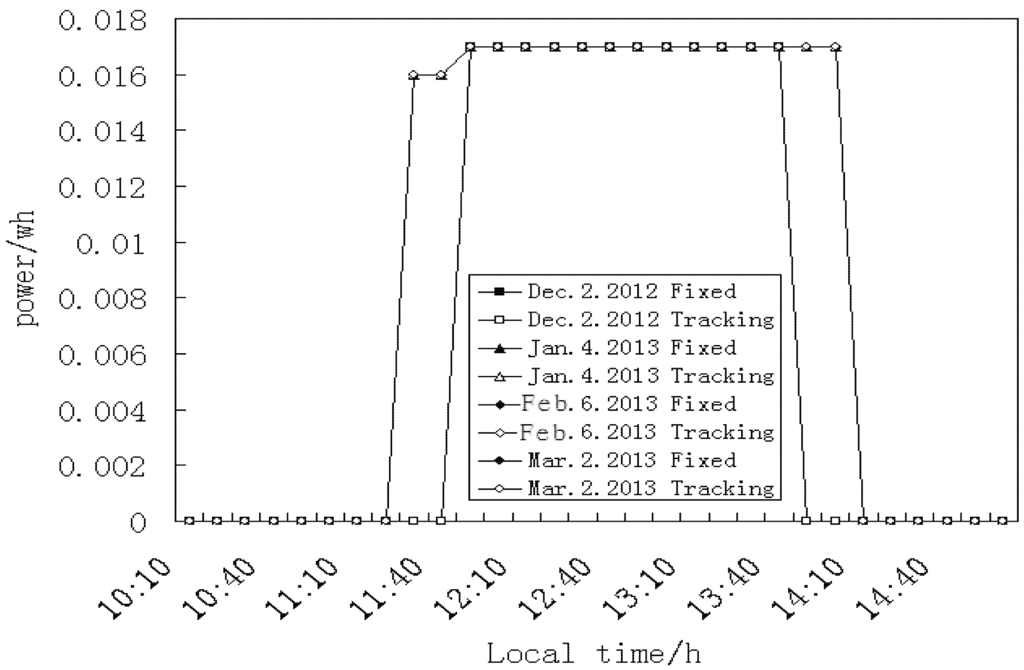
Figure 3.
Power generated (Wh) over time (plotted in 10-min increments) on cloudy days.
Figure 3.
Power generated (Wh) over time (plotted in 10-min increments) on cloudy days.


Figure 4.
Amount of solar irradiance (kW/m2) over time (plotted in 10-min increments) on cloudy days.
Figure 4.
Amount of solar irradiance (kW/m2) over time (plotted in 10-min increments) on cloudy days.
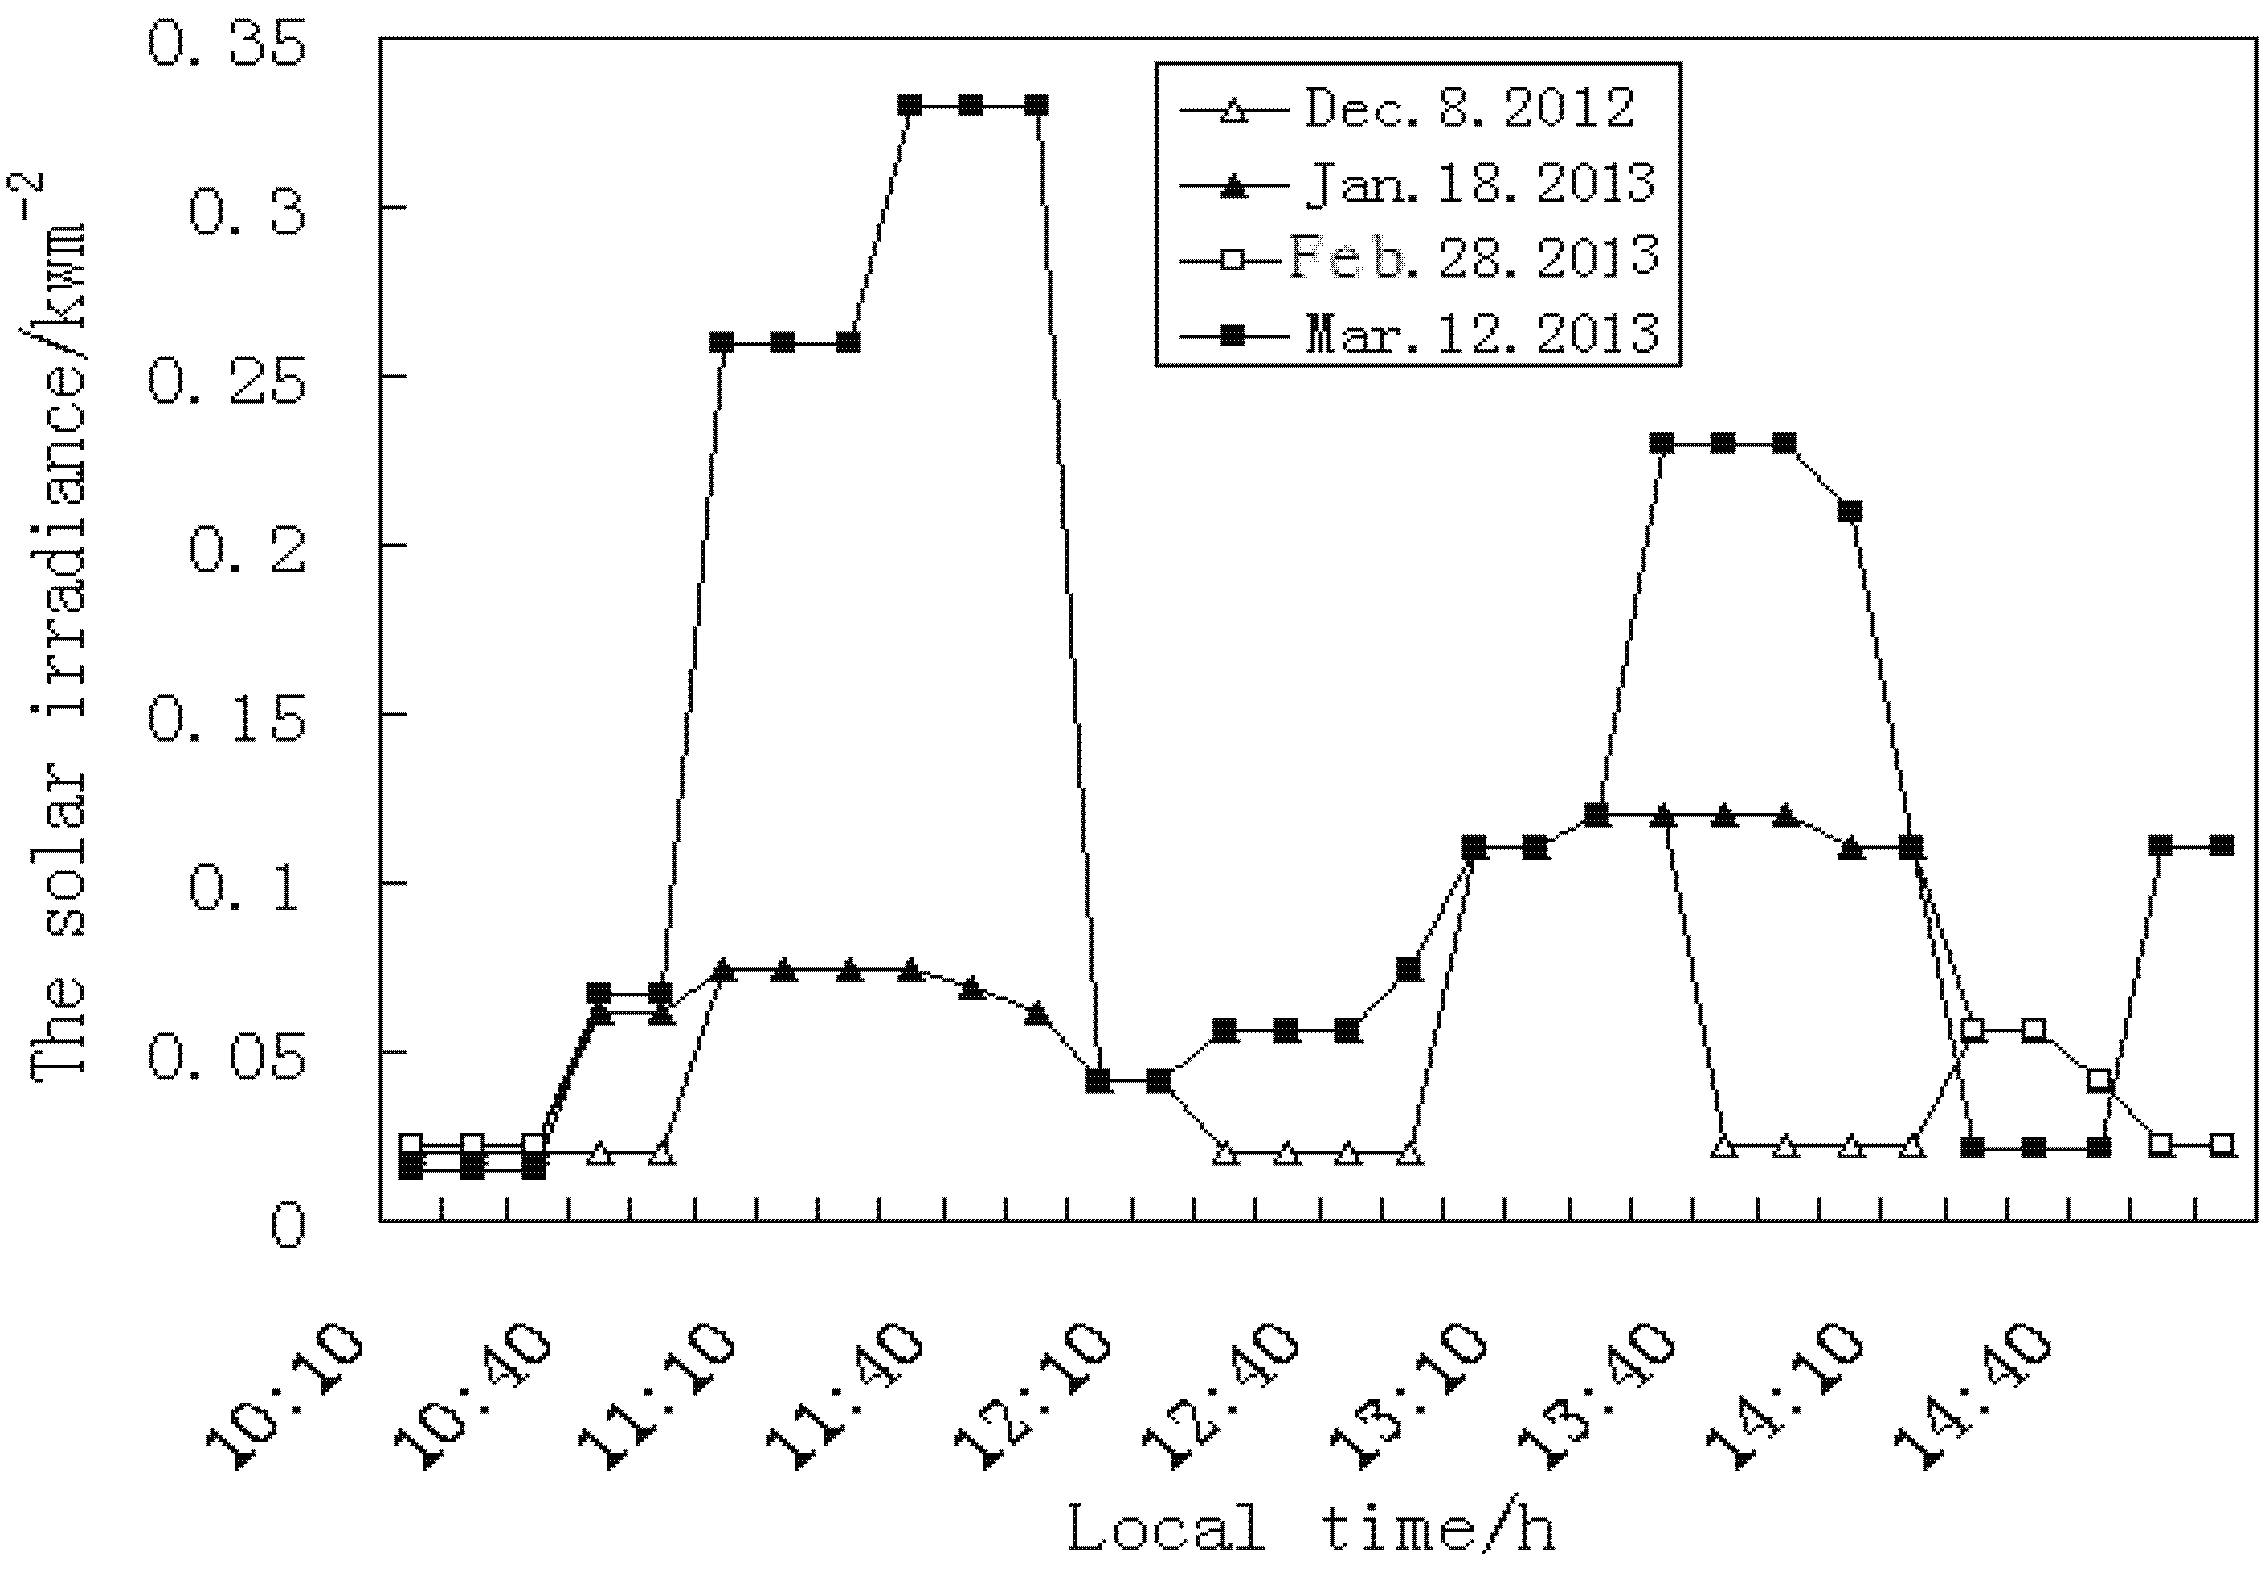
In Figure 5 and Figure 6, we present the measurements of power generated from different horizontal solar irradiances on days that were intermittently cloudy and sunny. The amount of power generated by the two methods was consistent with the solar irradiance. During cloudy portions of the day, the solar irradiance declined to 0.02 kW/m2. At this stage, the power generated by the two methods also decreased along with the decreasing solar irradiance. However, during sunny periods of the day, the solar irradiance rose to 0.34 kW/m2. At this stage, the power generated by the two methods also increased with the increasing solar irradiance. The power generated under these conditions was highly variable. Furthermore, during sunny periods of the day, the amount of power generated by the solar tracking system exceeded the amount of power generated by the fixed solar pane by up to 25%.
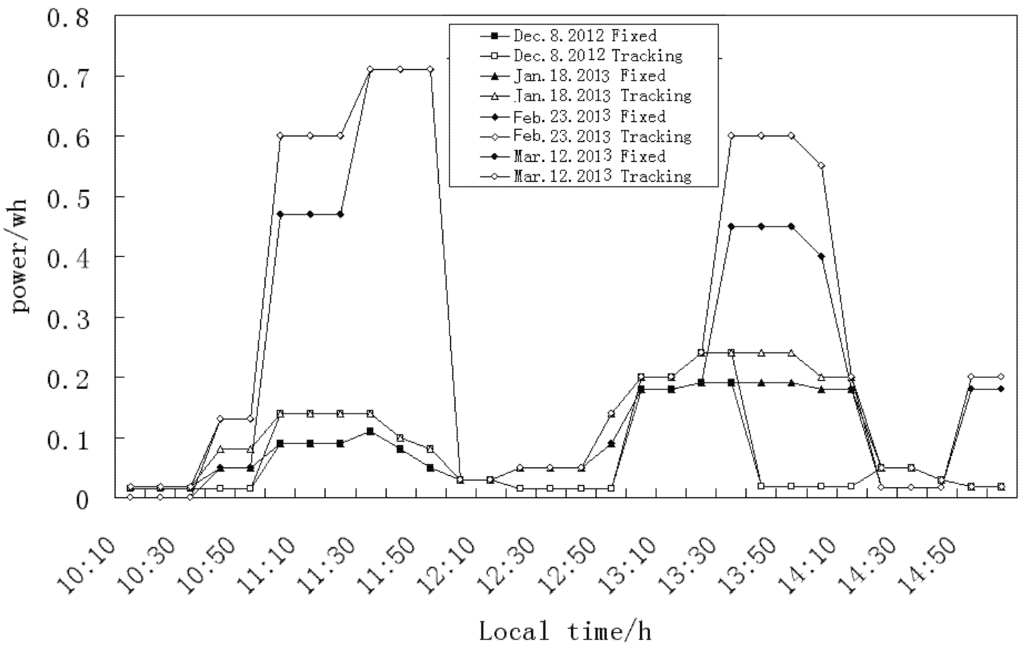
Figure 5.
Power generated (Wh) over time (plotted in 10-min increments) on days that were intermittently sunny and cloudy.
Figure 5.
Power generated (Wh) over time (plotted in 10-min increments) on days that were intermittently sunny and cloudy.

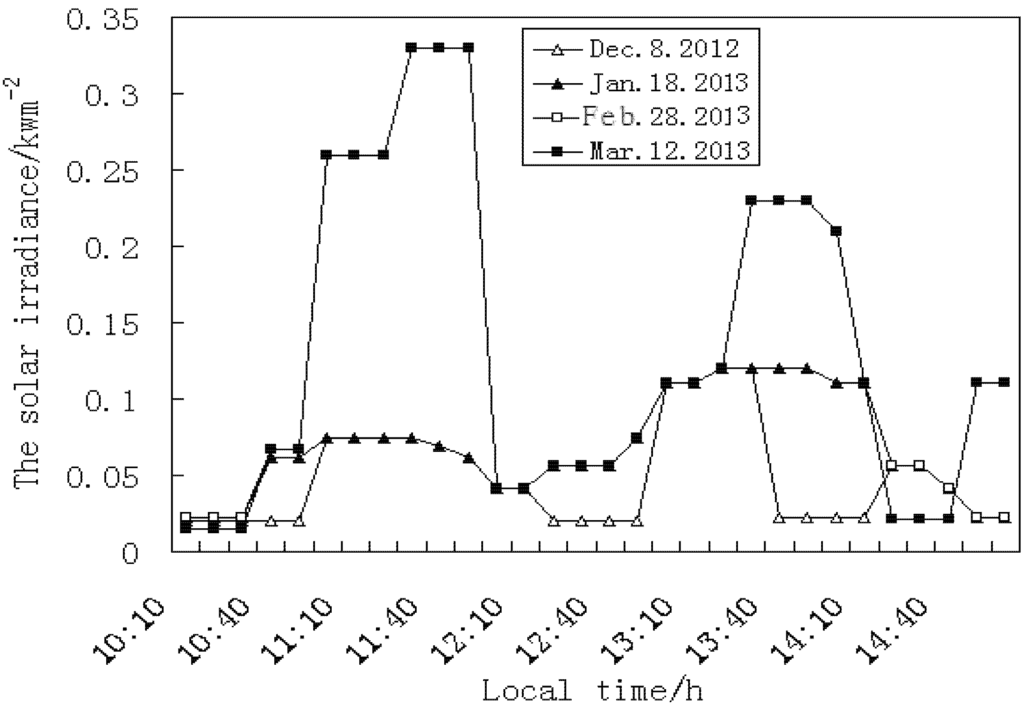
Figure 6.
Amount of solar irradiance (kW/m2) over time (plotted in 10-min increments) on days which were intermittently sunny and cloudy.
Figure 6.
Amount of solar irradiance (kW/m2) over time (plotted in 10-min increments) on days which were intermittently sunny and cloudy.
From December to March, the power produced by the solar tracking system and the fixed solar panel either increased or decreased depending on the solar irradiance (Figure 7 and Figure 8). The power generated from the solar tracking system was approximately 20% to 25% higher than that produced by the fixed solar panel (Figure 9). With an increase in solar irradiance, the linear regression ratio of the two methods also increased (Figure 10 and Figure 11). The average solar irradiance (R2) value was 0.7112. These results indicated a significantly positive linear relationship.
Under the same sunlight, the average solar irradiance (R2) value was 0.9805 under fixed power output (Figure 10). Under tracking power output, the average solar irradiance (R2) value was 0.9878 (Figure 11). These values indicated that the relationship between the tracking power output and average solar irradiance was greater than the association between fixed power output and average solar irradiance. In summary, the power generated by the two methods had a strong association with solar irradiance.
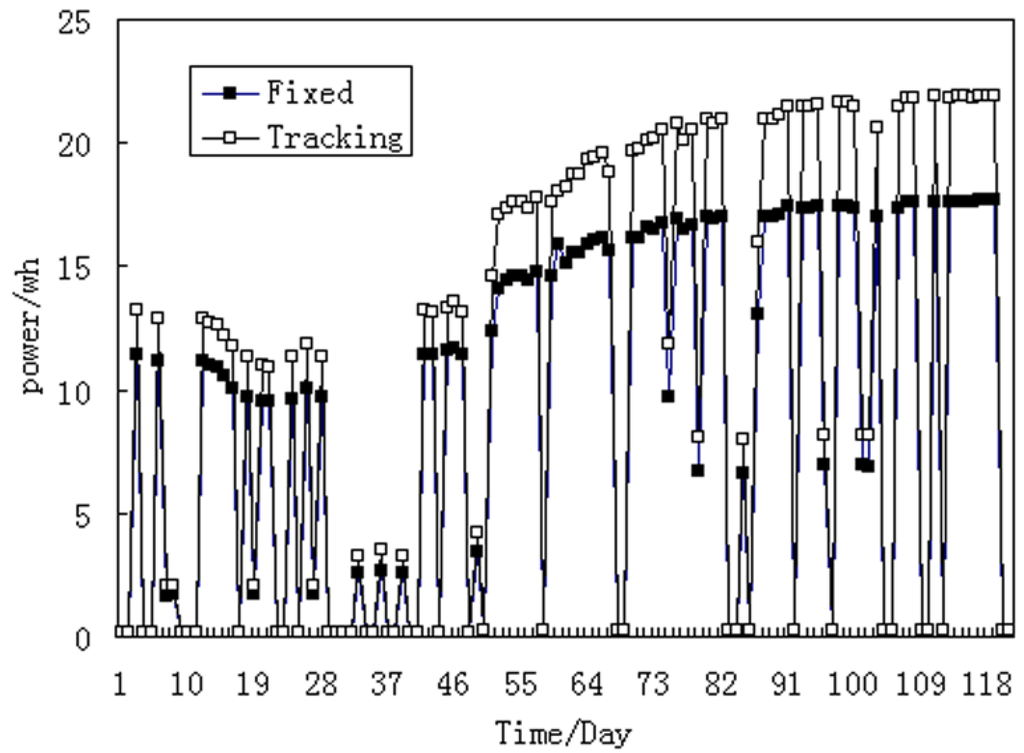
Figure 7.
Power generated (Wh) over a four month period (December–March) by the Fixed and Tracking Solar Systems.
Figure 7.
Power generated (Wh) over a four month period (December–March) by the Fixed and Tracking Solar Systems.
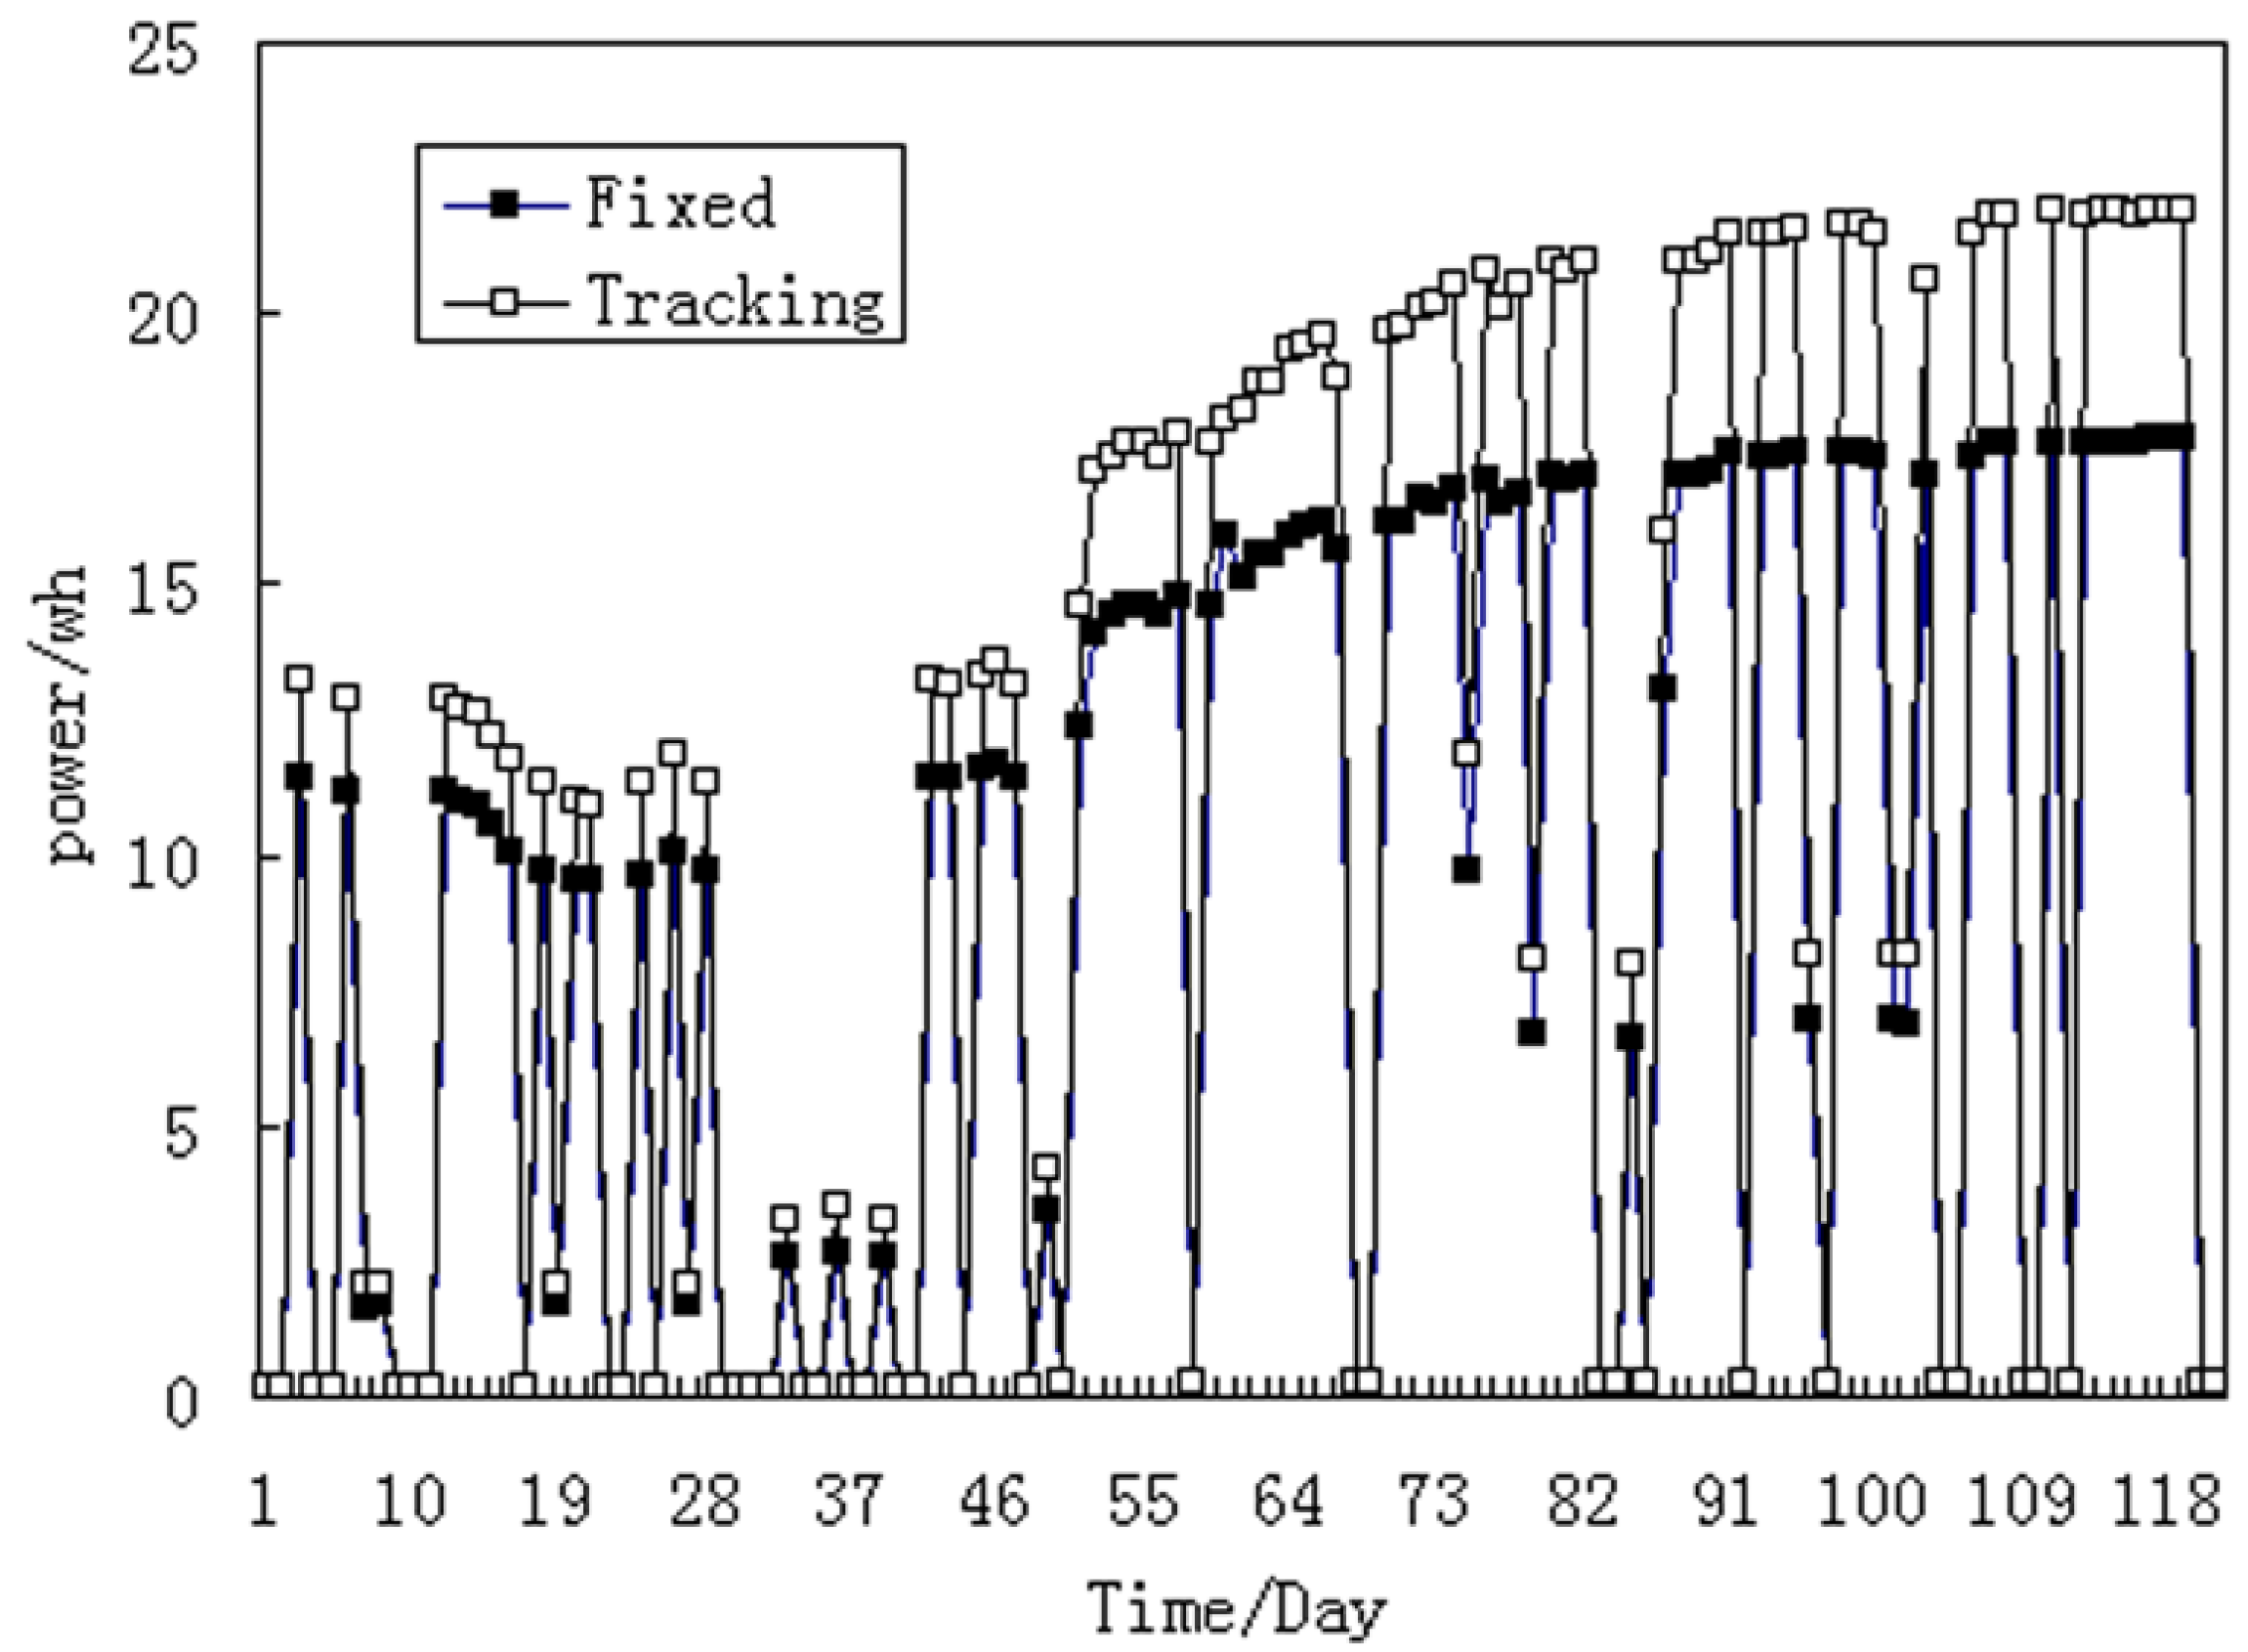

Figure 8.
Amount of solar irradiance (kW/m2) over the four month period (December–March).
Figure 8.
Amount of solar irradiance (kW/m2) over the four month period (December–March).
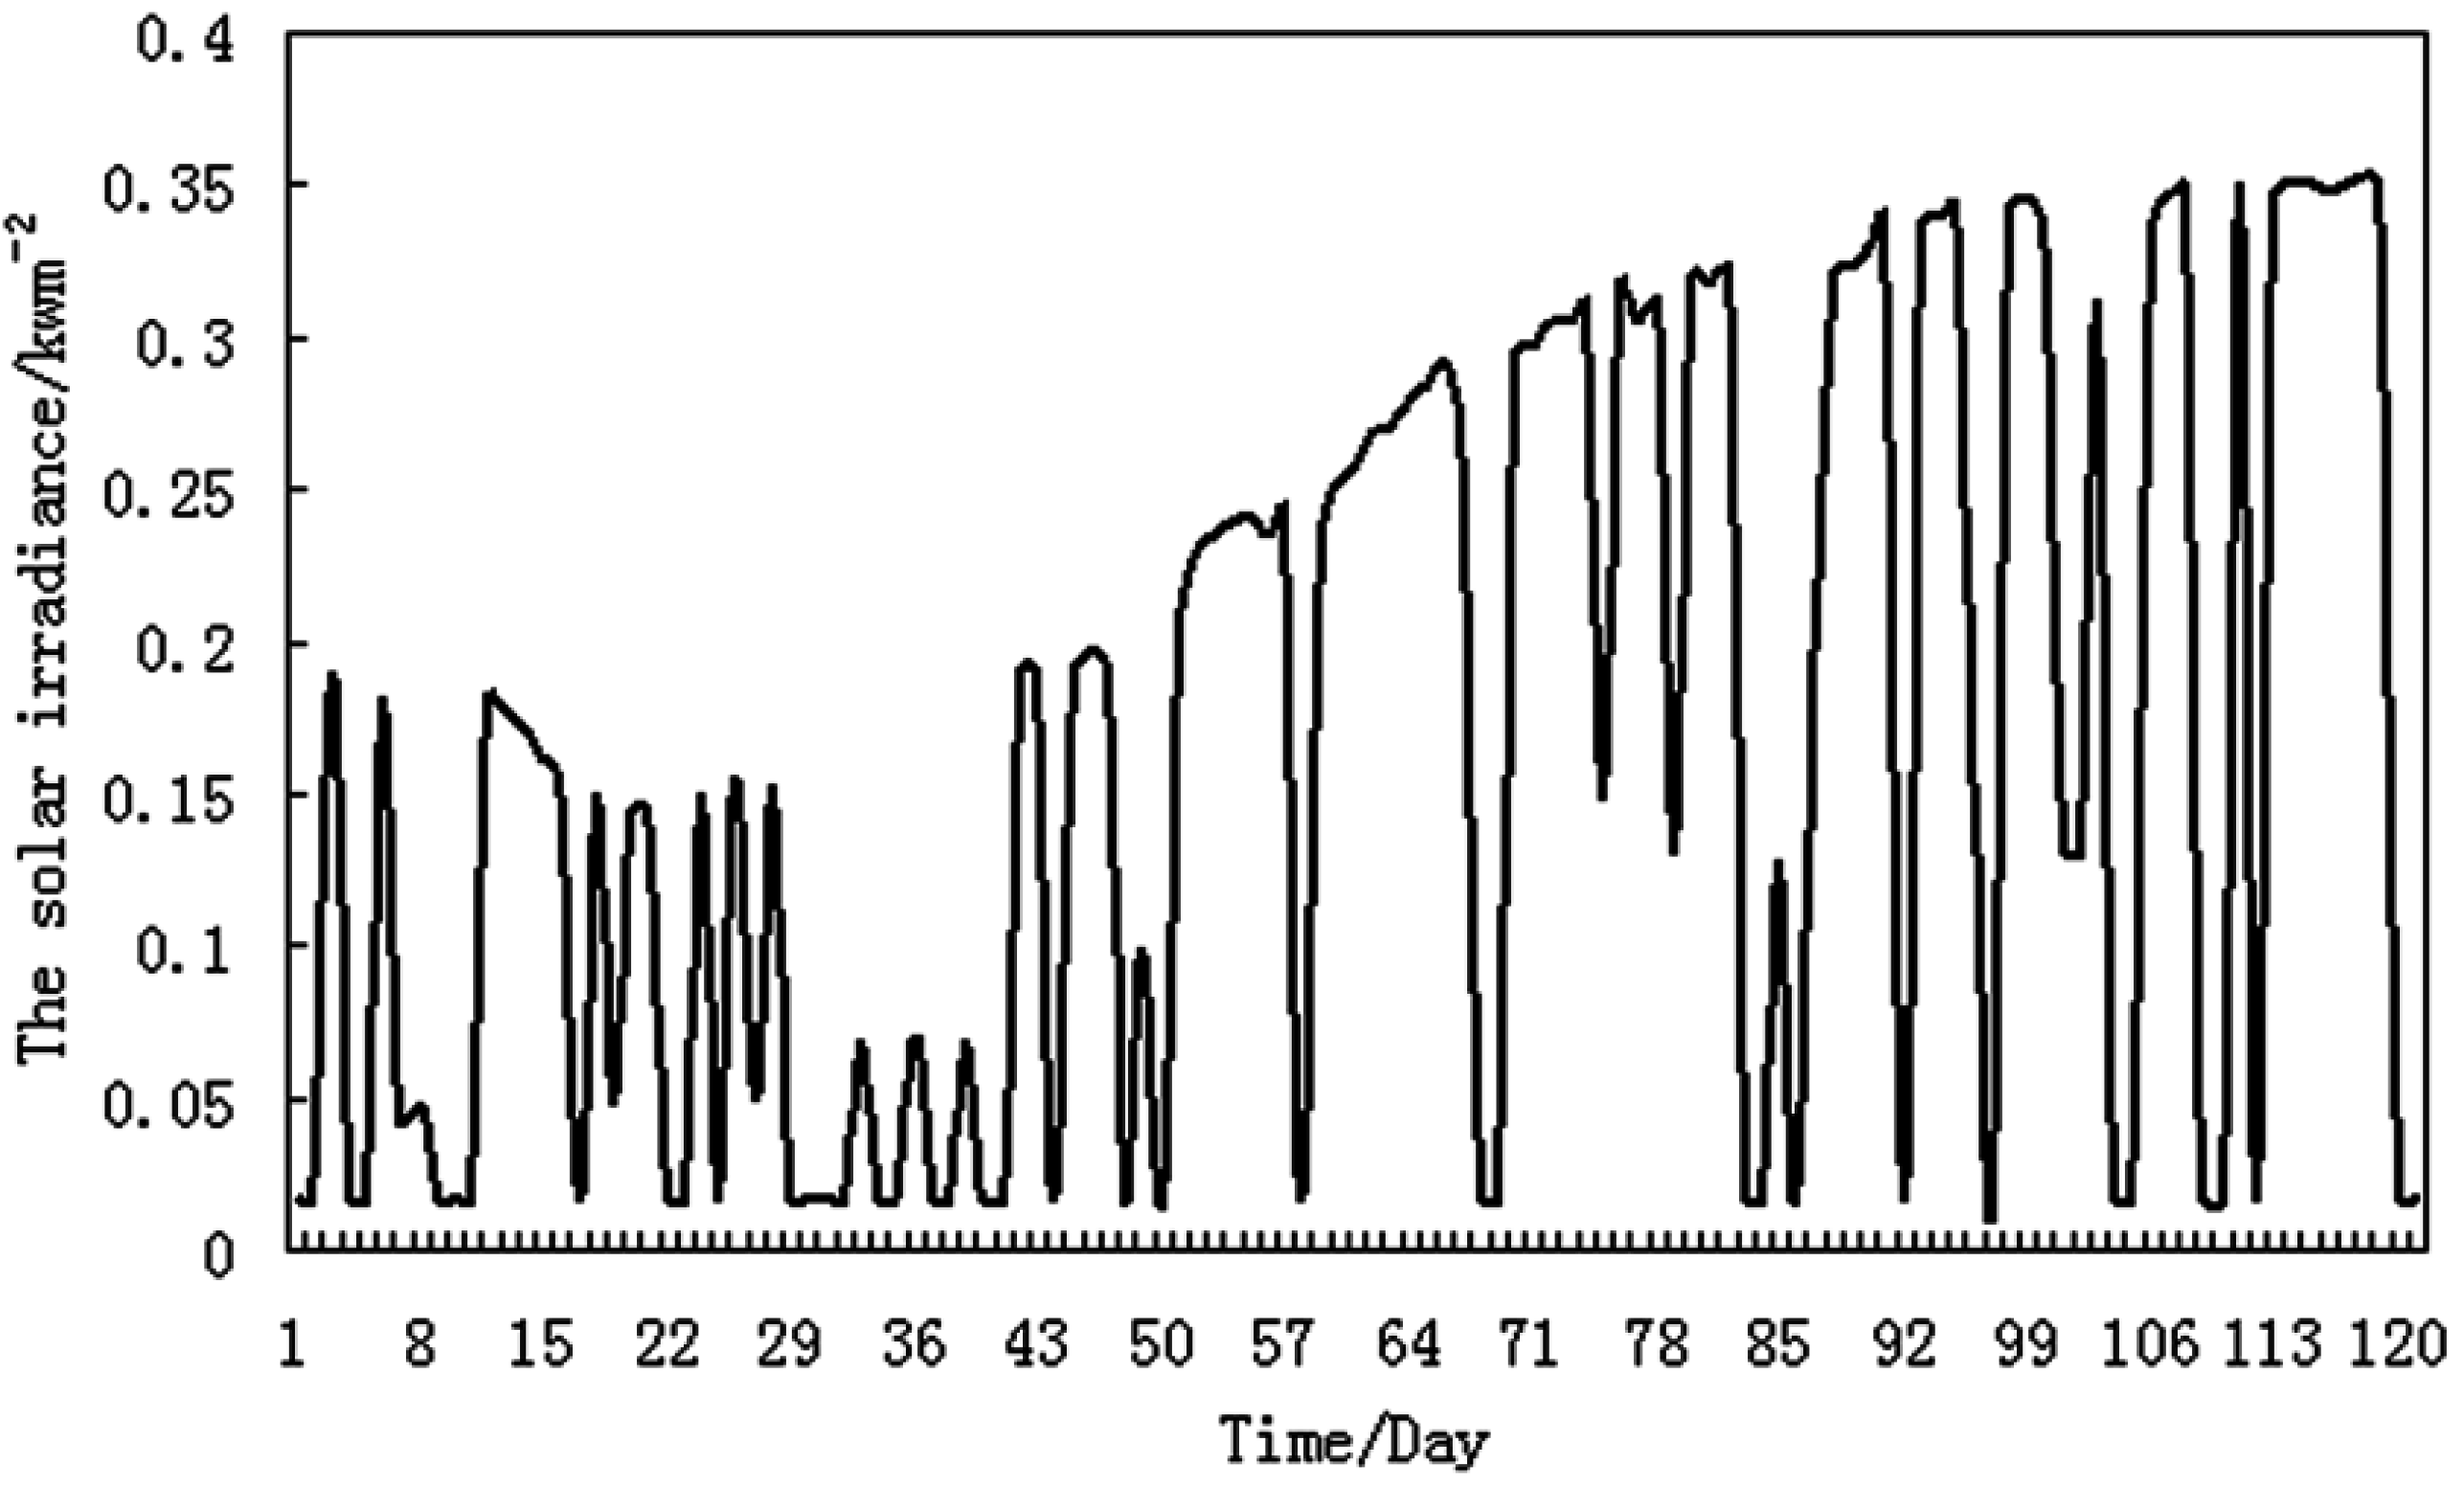

Figure 9.
Linear regression between average solar irradiance (kW/m2) and increase ratio%.
Figure 9.
Linear regression between average solar irradiance (kW/m2) and increase ratio%.
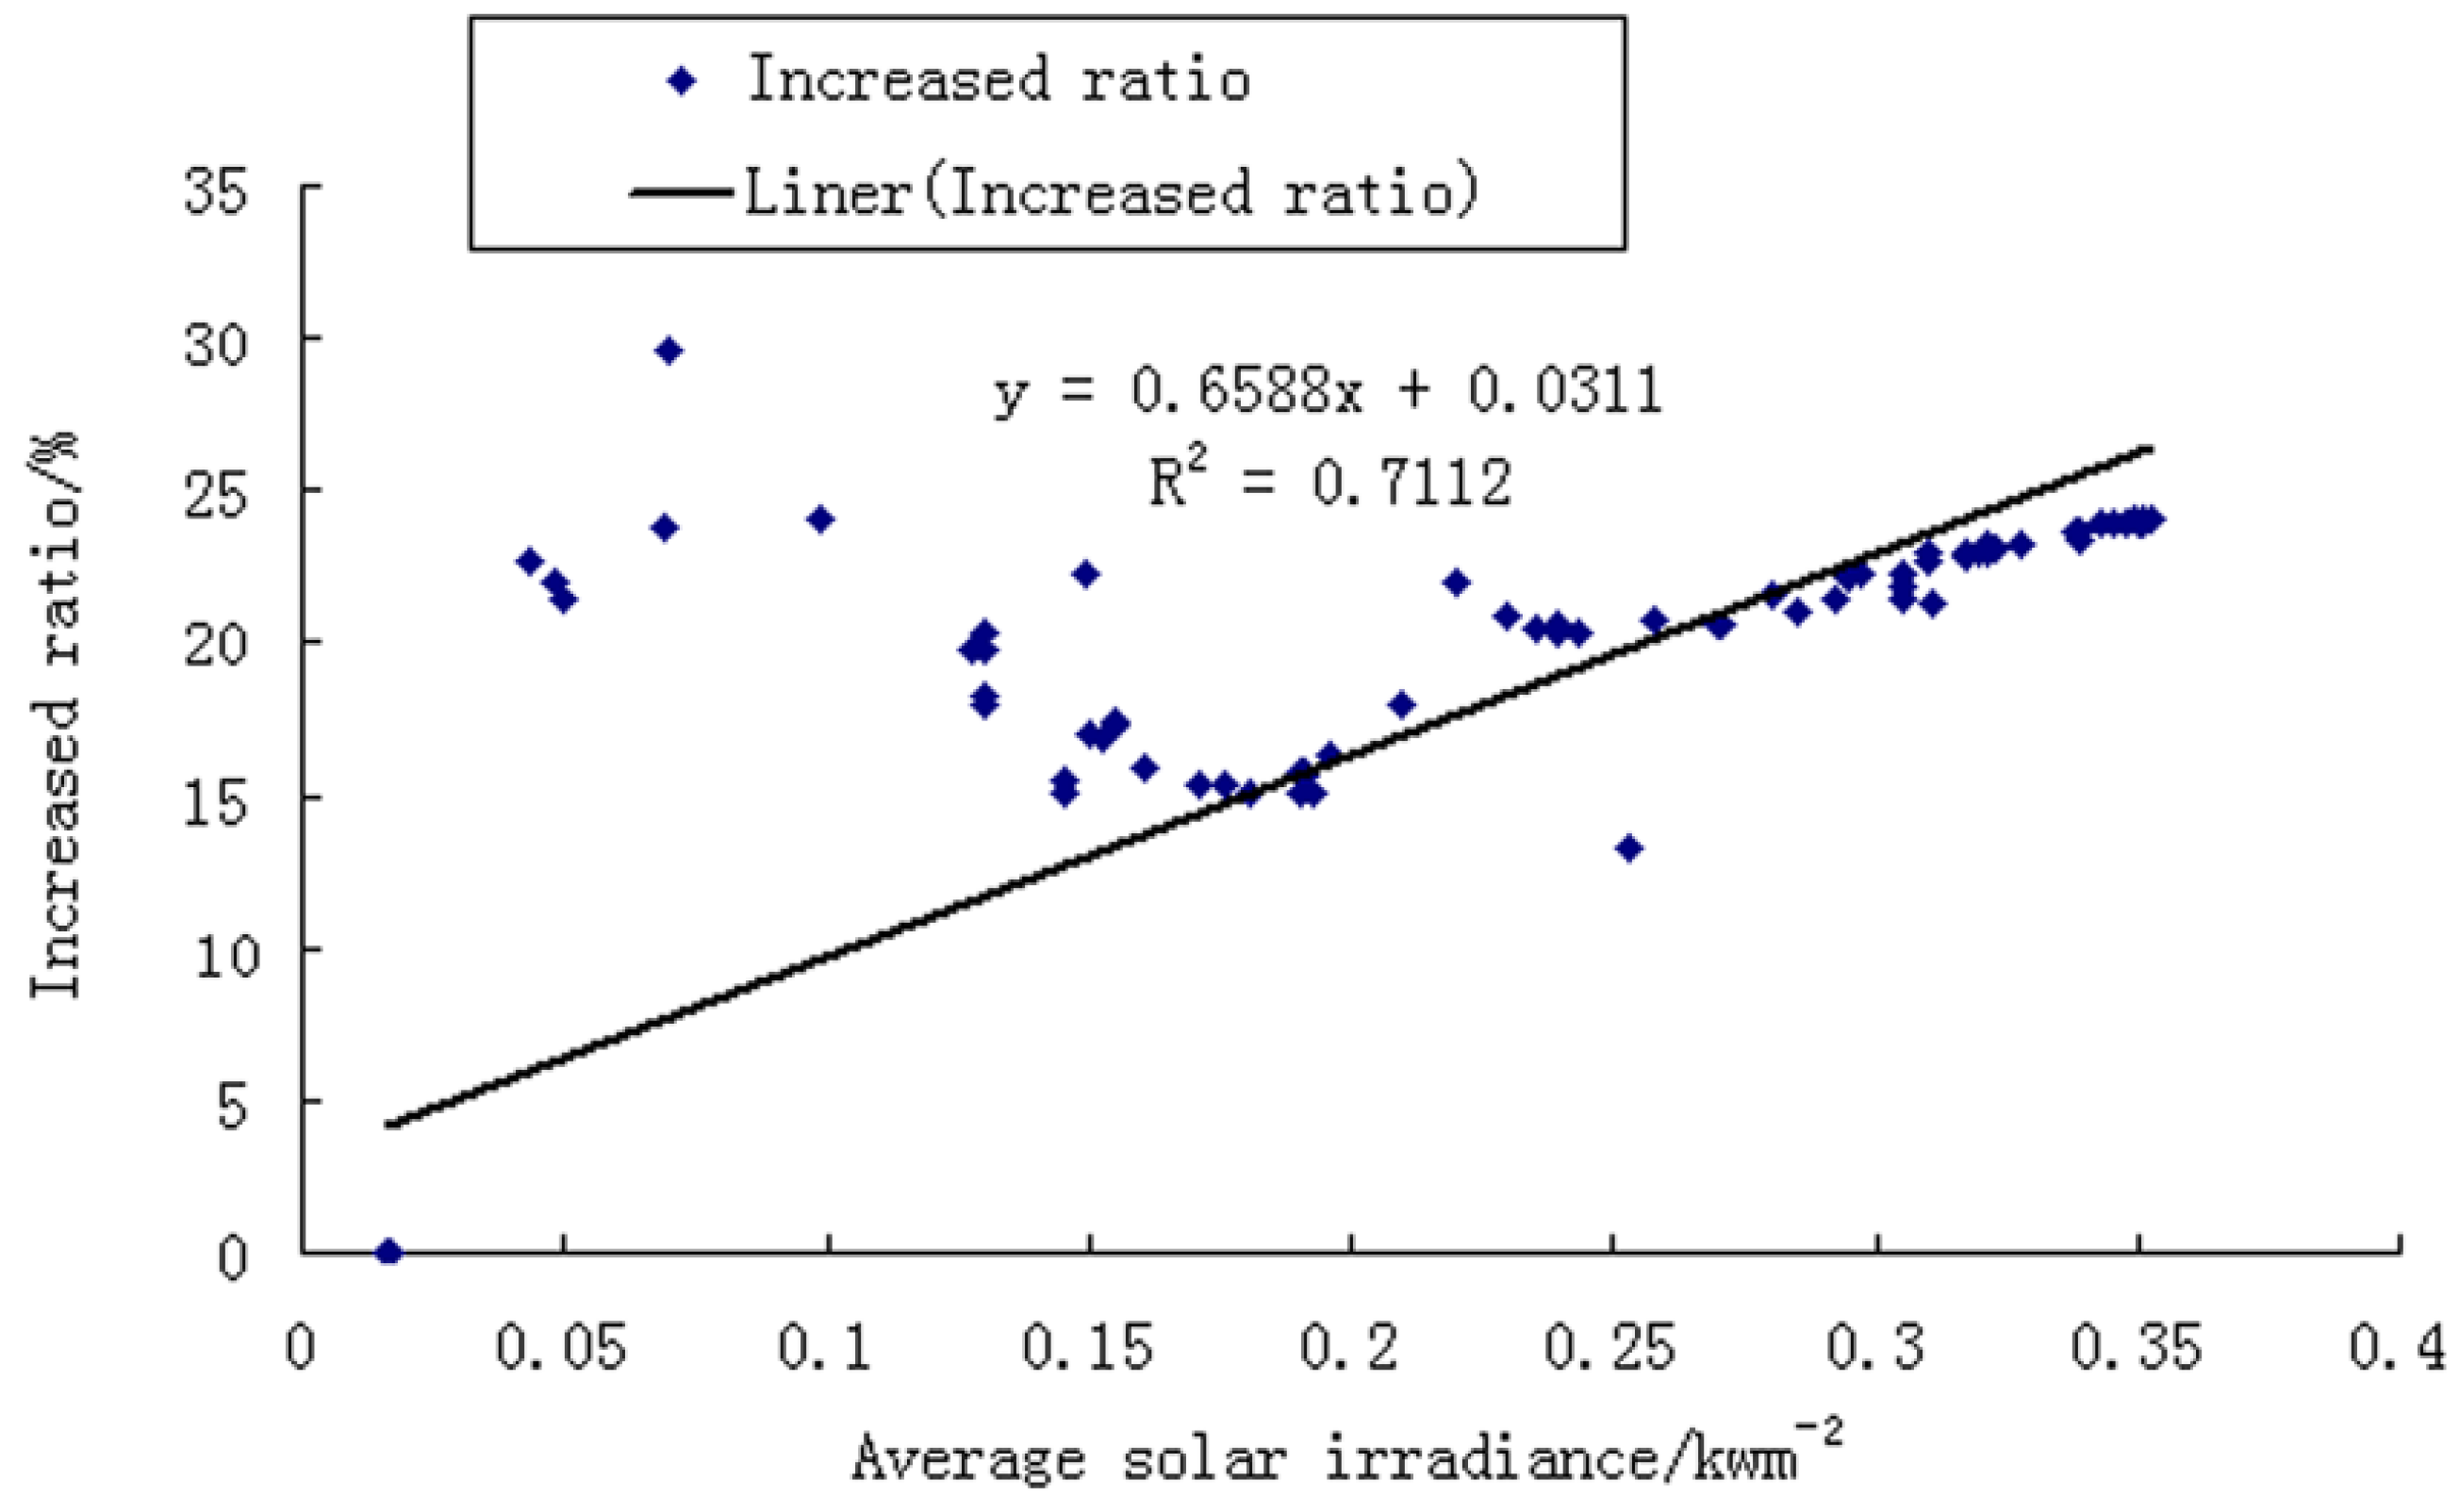
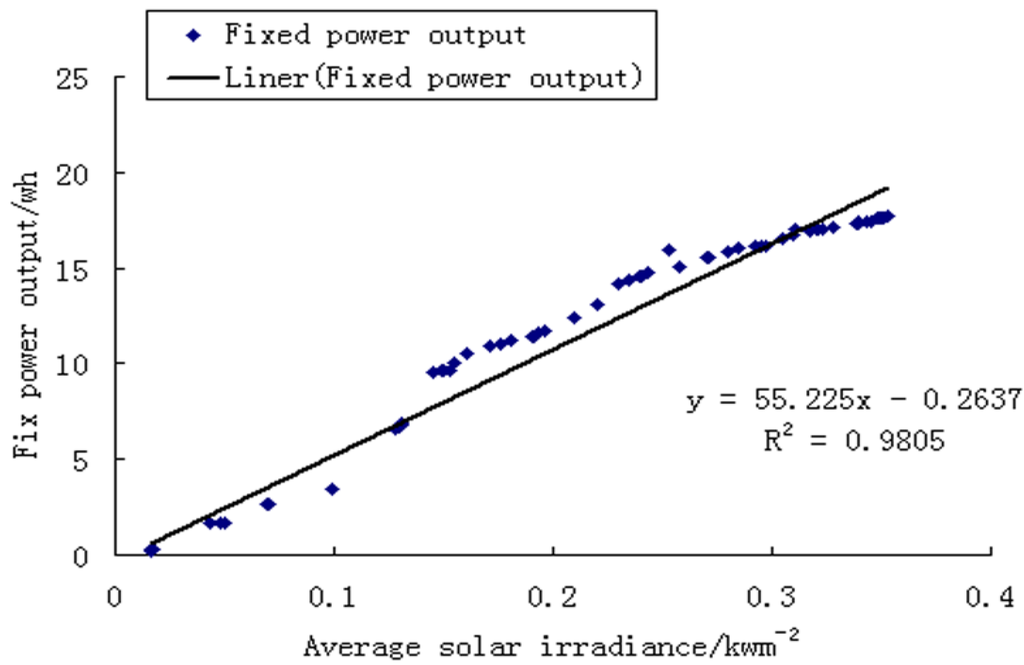
Figure 10.
Linear regression between average solar irradiance (kW/m2) and fixed solar output (Wh).
Figure 10.
Linear regression between average solar irradiance (kW/m2) and fixed solar output (Wh).
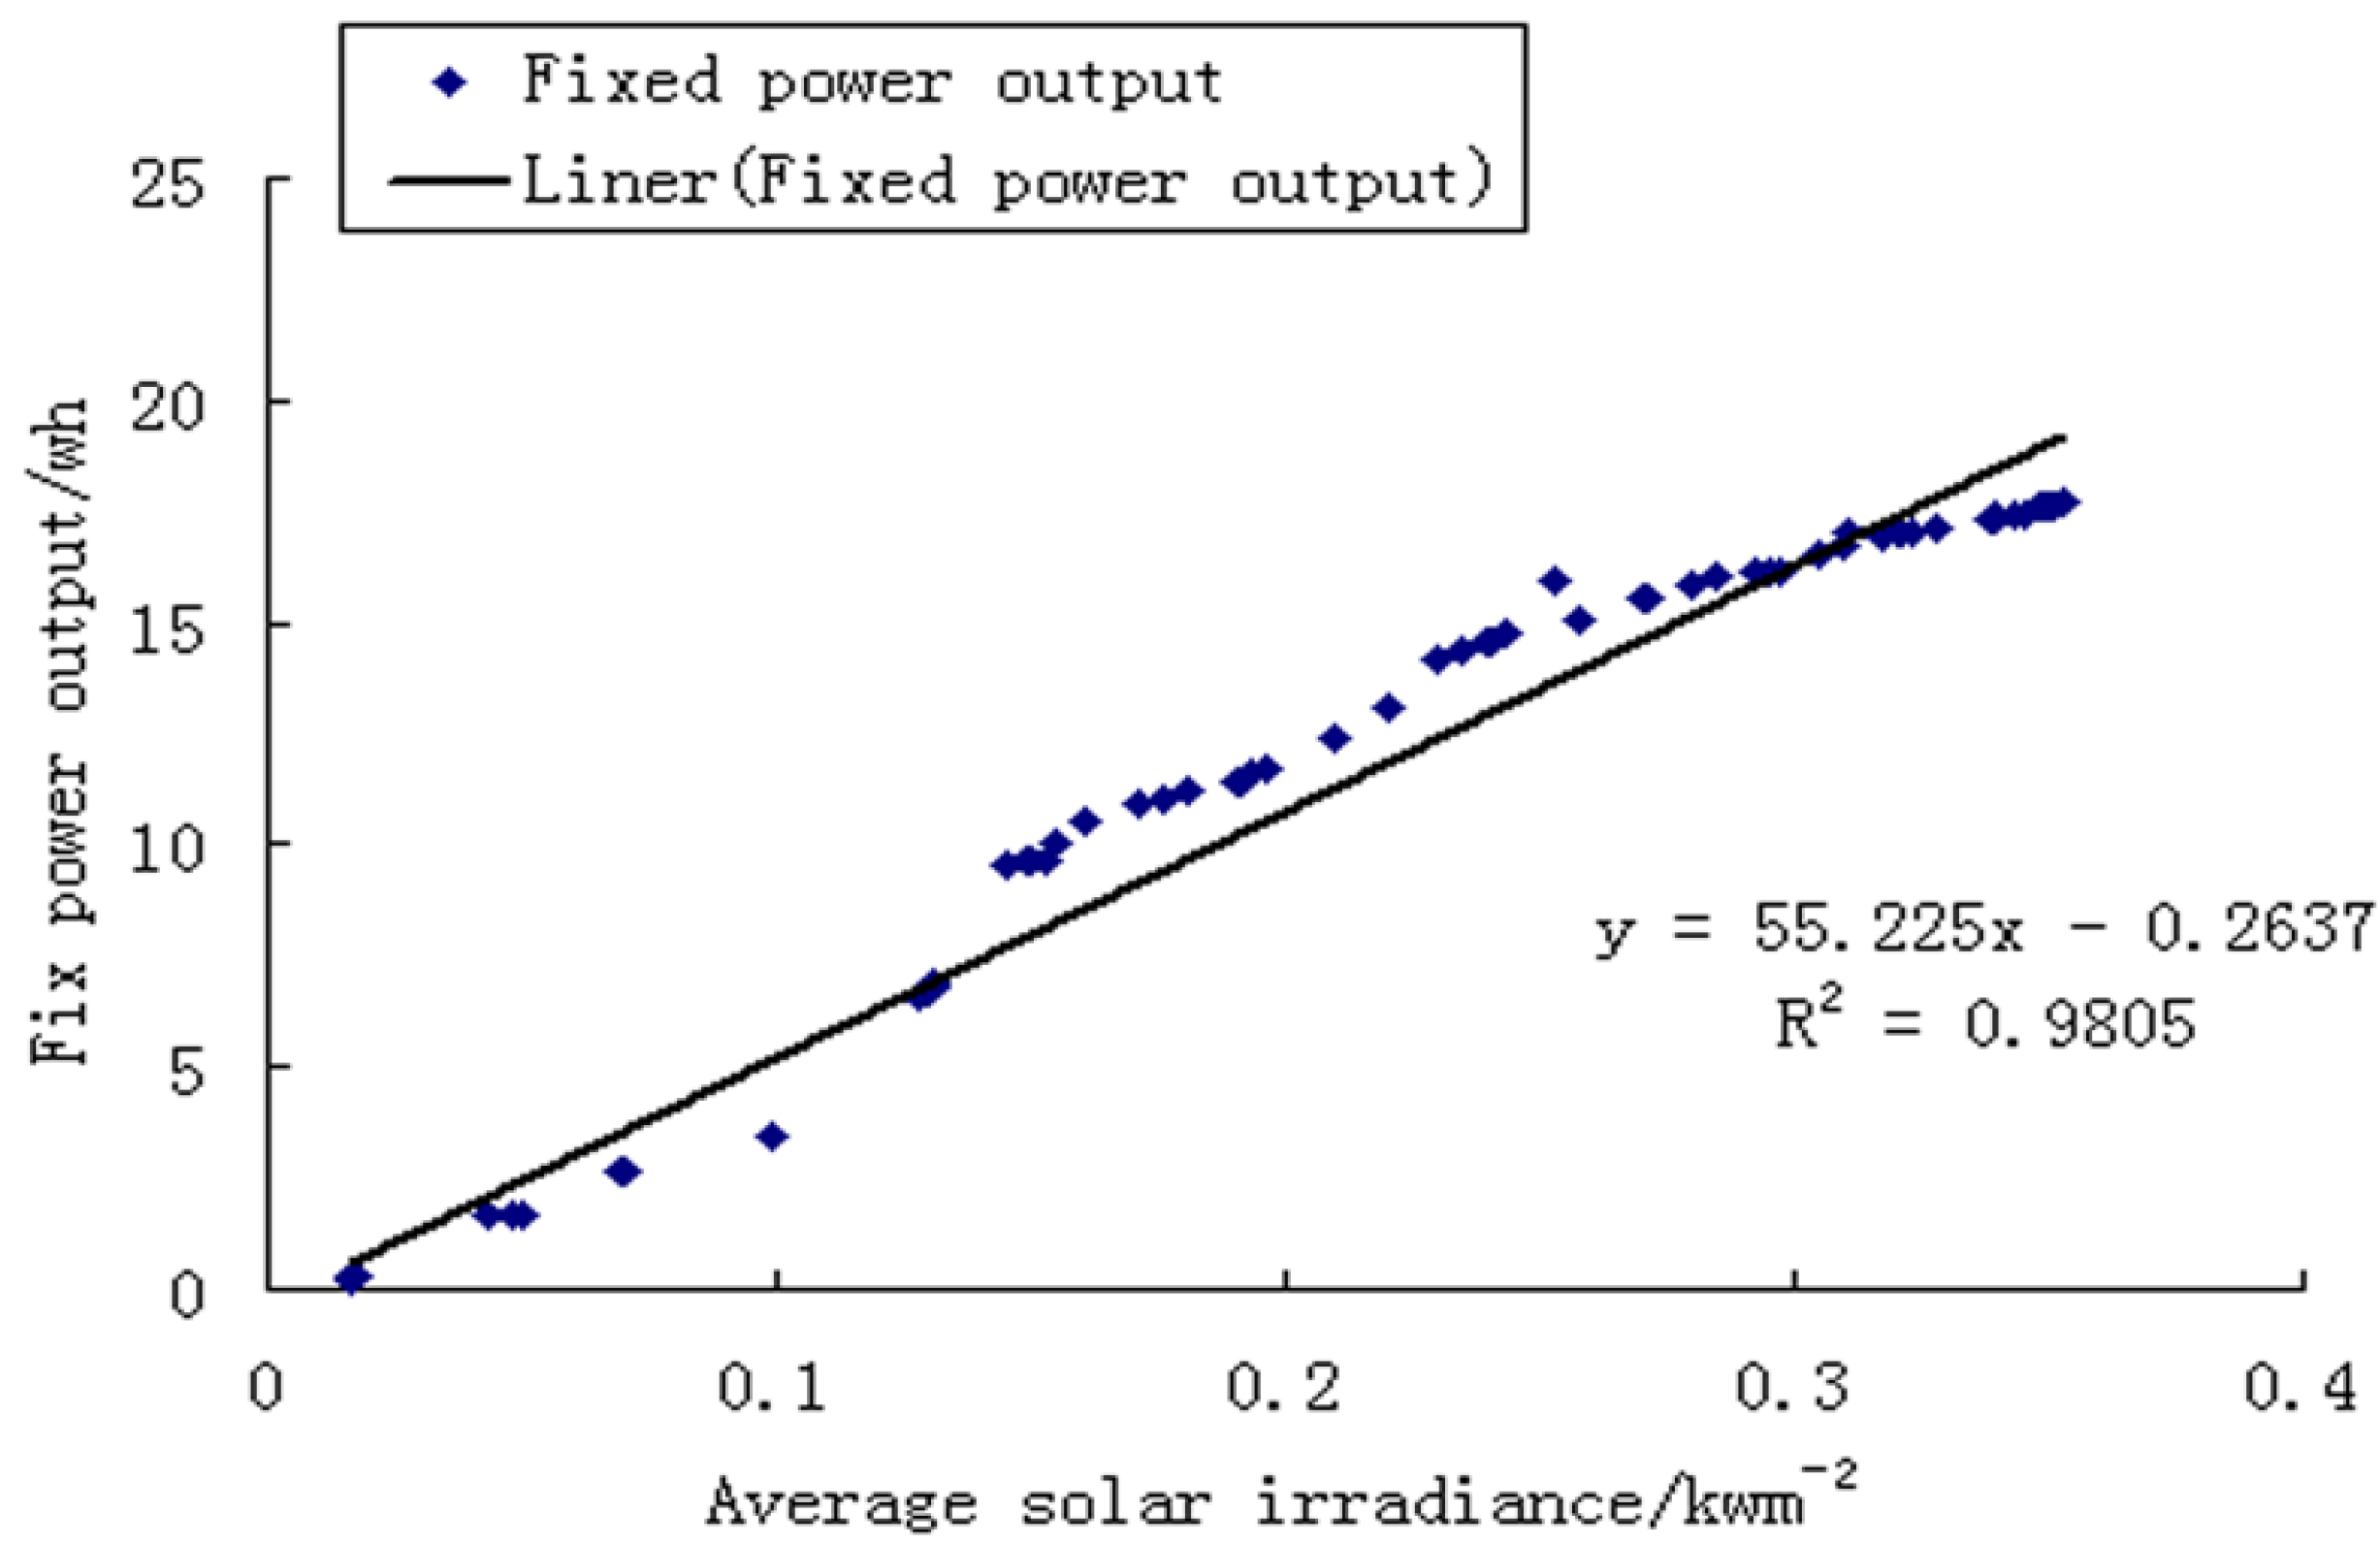
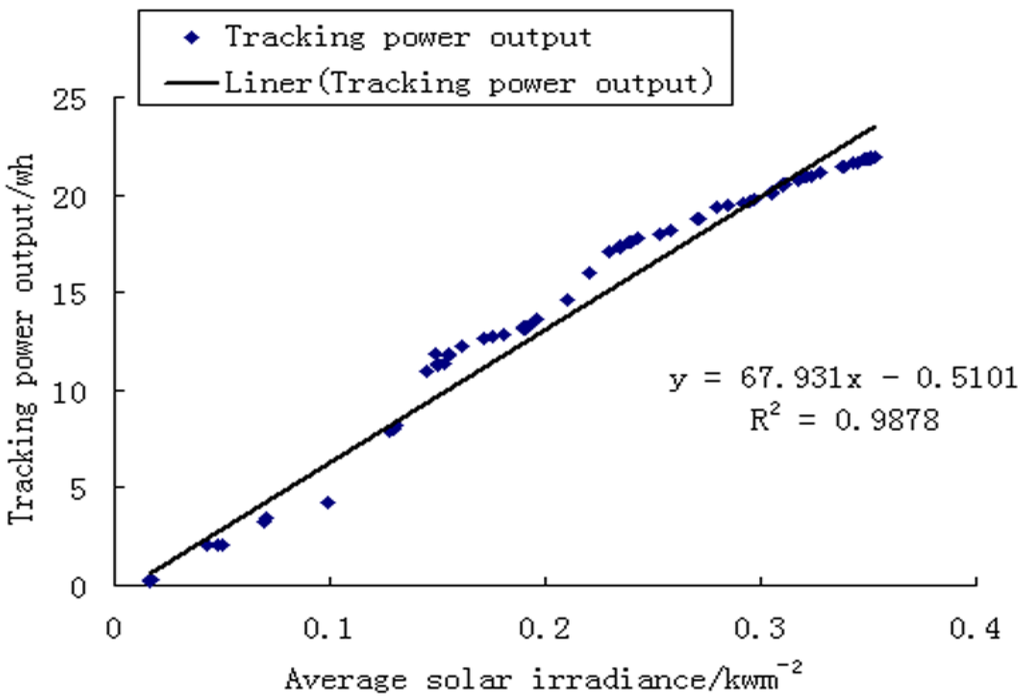
Figure 11.
Linear regression between average solar irradiance (kW/m2) and tracking solar output (Wh).
Figure 11.
Linear regression between average solar irradiance (kW/m2) and tracking solar output (Wh).

3. Material and Methods
3.1. Solar Tracking System Design
The structural components and working principle of the solar tracking system are described in Figure 1 and the following sections (1) and (2).
- (1)
- Structure of the automatic solar tracking system
In the mechanical transmission parts, the main technical indicators were as follows: component strength, component stiffness, component stability, angle range, and tracking accuracy.
- (a)
- Component strength: Component should have sufficient strength; the so-called strength is defined as the ability to resist damage under load.
- (b)
- Component stiffness: Component should have sufficient rigidity. Certain structural deformations cannot exceed the permissible limits of normal operation.
- (c)
- Component stability: Member should have sufficient stability; the requirements of the original straight shape remain unchanged.
- (d)
- Angle range: In the mechanical transmission part of the solar tracking system, the orientation axis angle should be at least 270°, and the corner of the pitch axis should be 90°.
- (e)
- Tracking accuracy: At a 12° angle, the system followed the sun once in every forty-eight minutes.
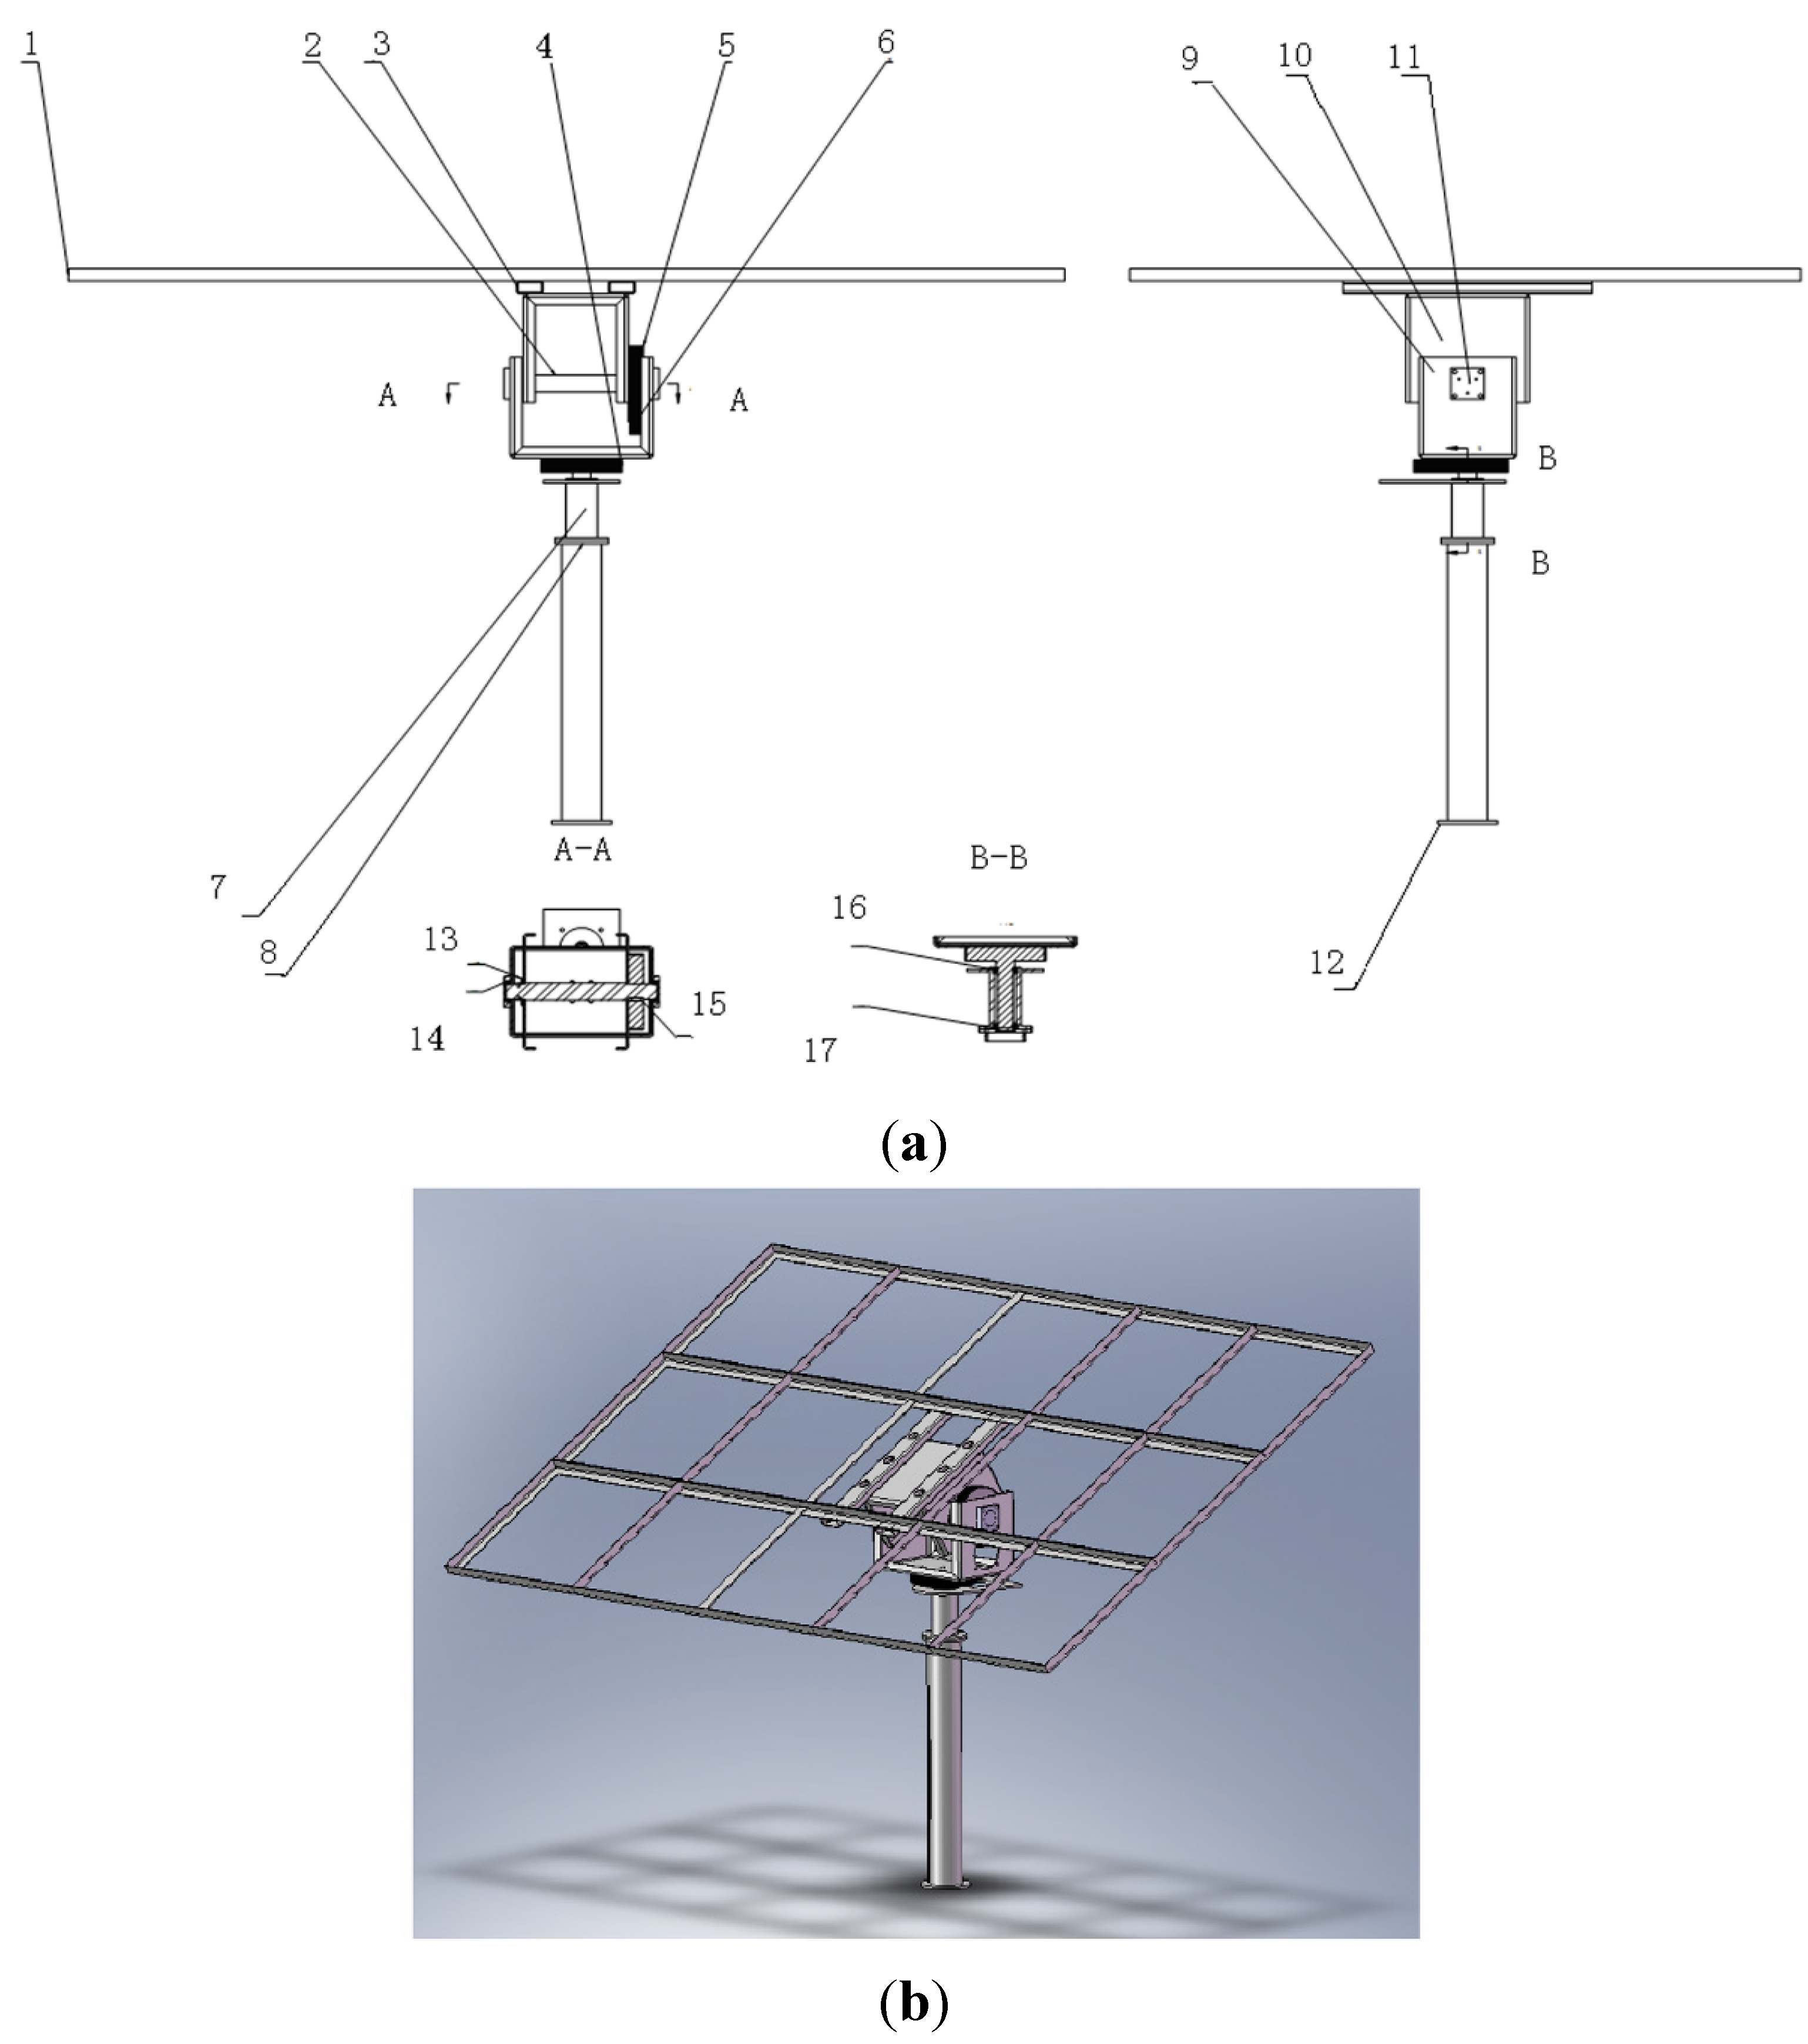
These factors govern the mechanical transmission part of the design. A two-axis automatic solar tracking system was designed for greenhouse applications [25]. The solar automatic tracking system is shown in Figure 12.

Figure 12.
(a) Assembly diagram. 1 solar panels: angle steel bracket; 2 pitch-axis; 3 rectangular steel piece; 4 azimuth-axis gear; 5 pitch-axis great gear; 6 pinion; 7 two-axles-bearing pedestal; 8 pillar; 9 lower base element; 10 upper base element; 11 axle-bearing pedestal; 12 flange; 13 button shaft flange; 14 bearing; 15 flat key; 16 bearing; 17 bearing block shoulder; (b) Overall diagram. The system follows solar irradiance automatically.
- (2)
- Motion Simulation using COSMOS Motion Analysis
The solar panel’s axial movement was ascribed in a 1/4 circle (The largest pitch angle can be rotated at 90°). The solar panels’ pitch-axis trajectory was depicted by applying the COSMOS Motion analysis tool on the surface of solar panels, precluding the interference during their free movement (Figure 13). The solar panel movement was established in a 3/4 circle with the same orientation. COSMOS Motion analysis determined the azimuth-axis trajectory of solar panels, preventing the interference during their freed movement [26] (Figure 14).

Figure 13.
Pitch-axis trajectory (0°–90°).
Figure 13.
Pitch-axis trajectory (0°–90°).
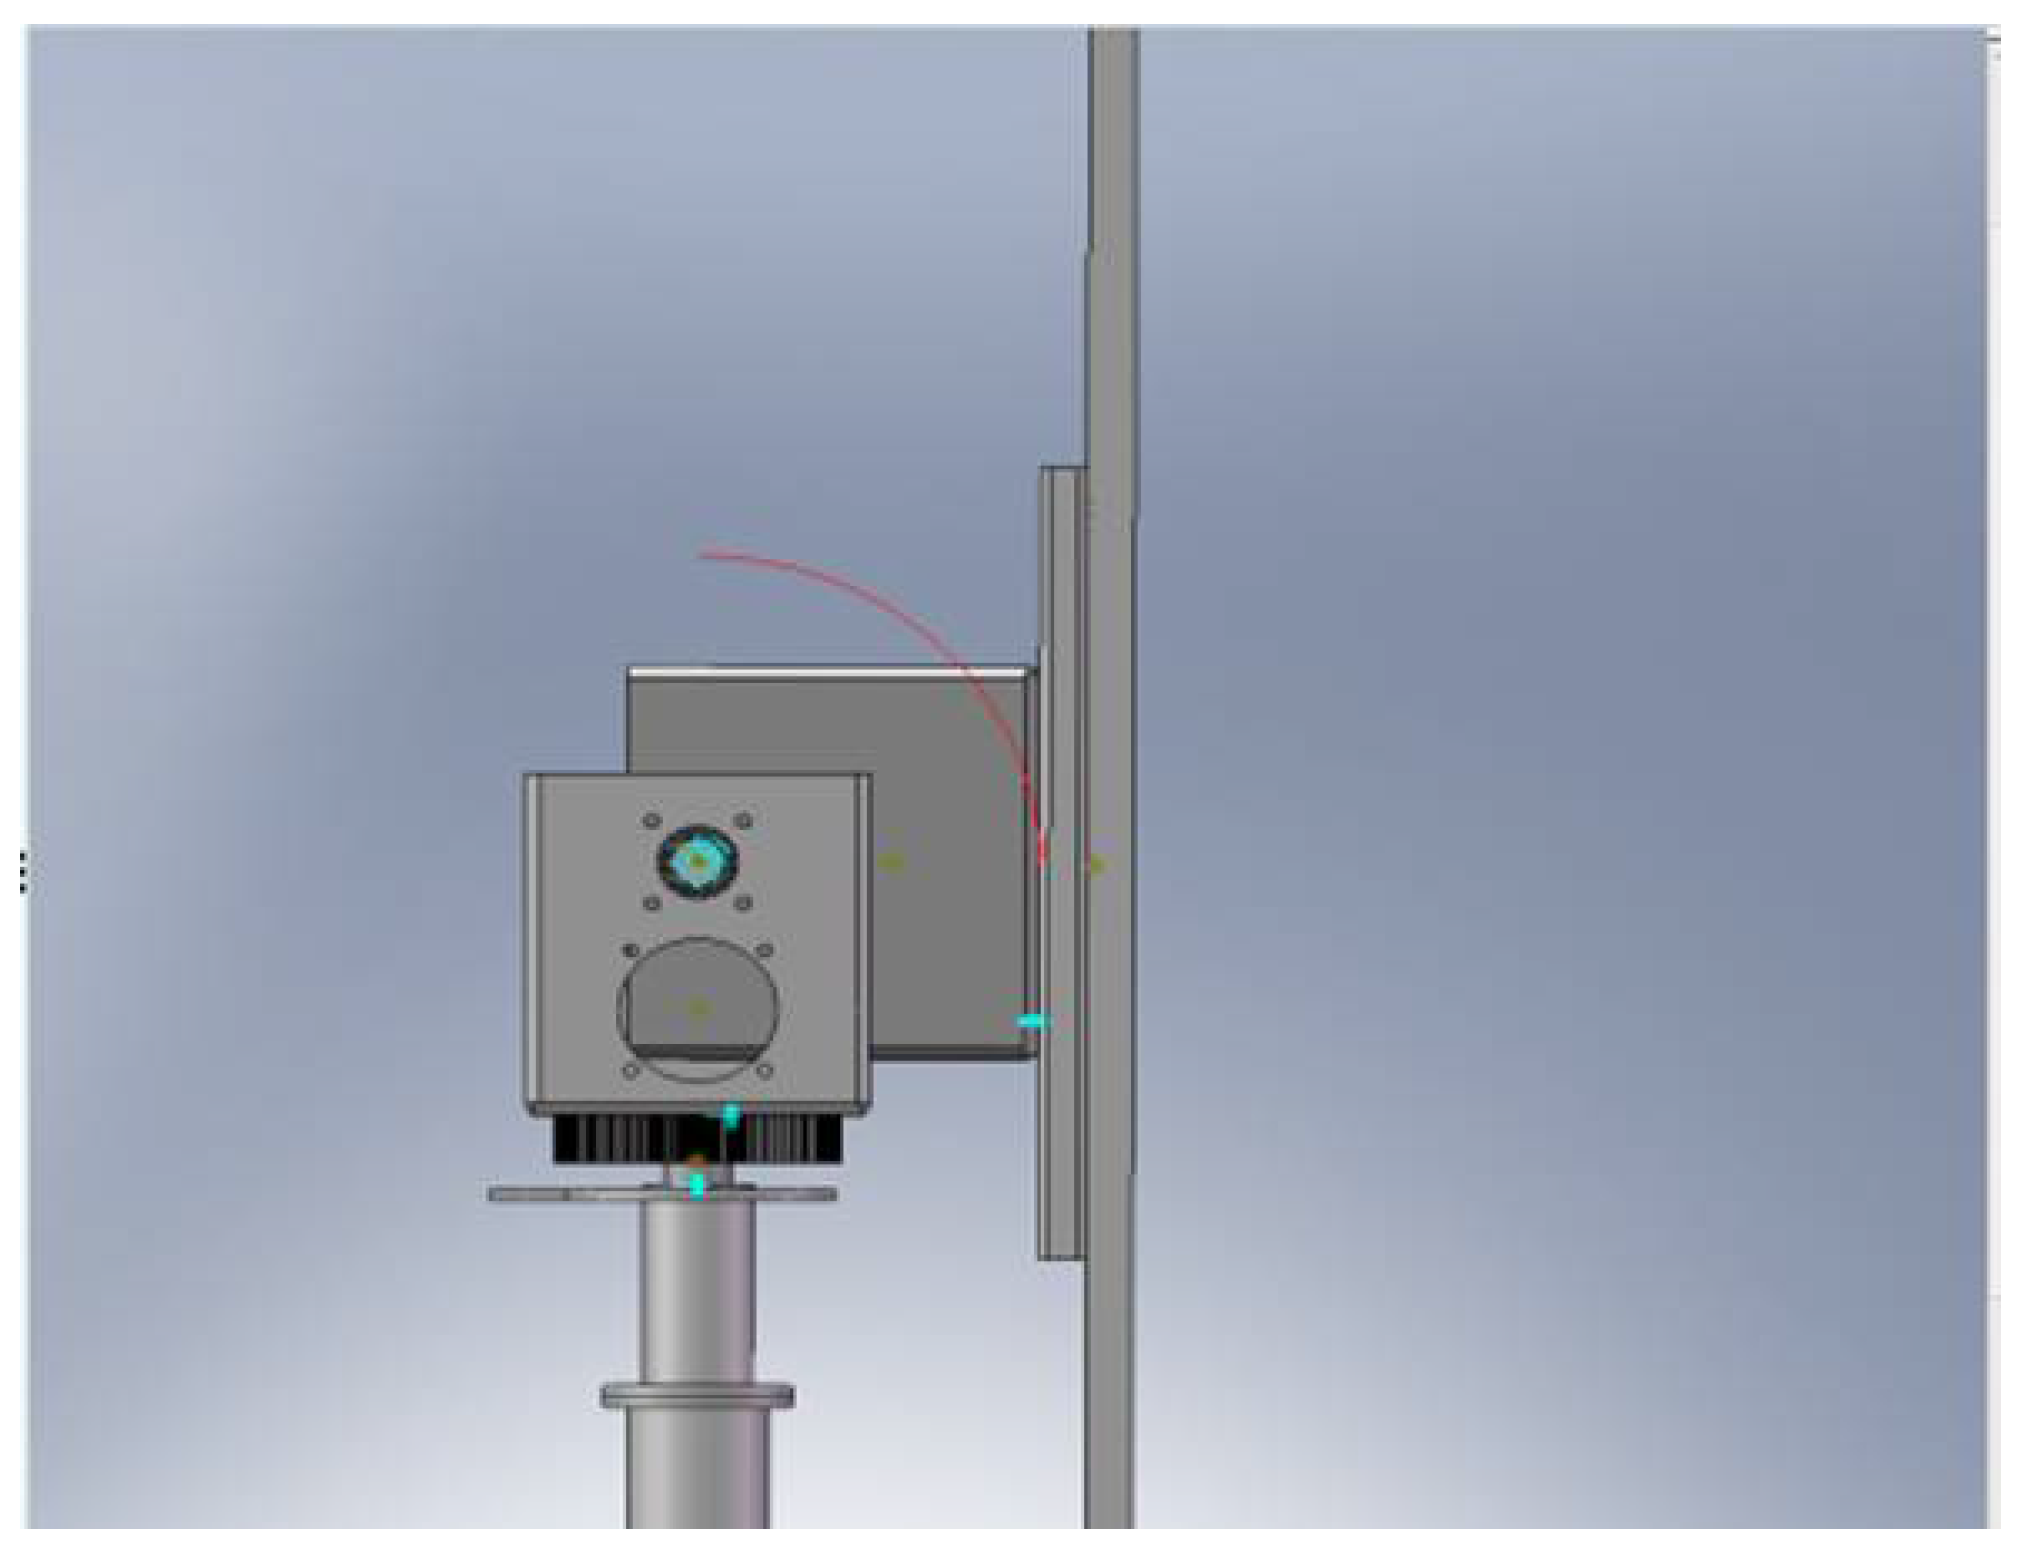
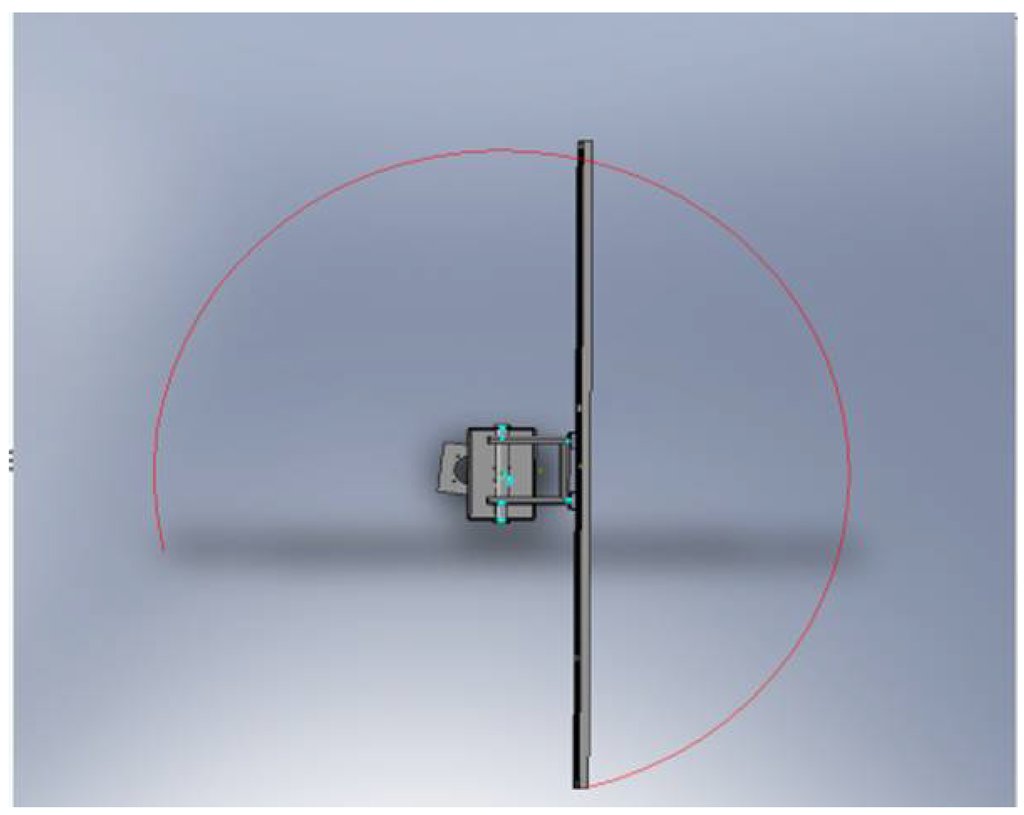
Figure 14.
Azimuth-axis trajectory (0°–270°).
Figure 14.
Azimuth-axis trajectory (0°–270°).

3.2. Solar Tracking System: Experimental Methods
Due to the large size of the automatic solar tracking system, the processing time was long. Moreover, the automatic solar tracking system was highly expensive and occupied a large area. Taking these factors into consideration, we designed and constructed a smaller solar automatic tracking system (Figure 15). Table 1 enlists the variables of this solar panel. The total (global) solar irradiance (kW/m2) that impinged on the horizontal surface of the Earth is typically measured by pyranometers, which are mounted horizontally to measure the irradiance over 2-p steradians (a hemisphere) [27,28,29]. As shown in Figure 16, the measurements of solar irradiance were taken using a DFY-2 radiometer; the specifications of these measurements were provided in Table 2 and Table 3. In northeast China, greenhouses have to be provided with additional light in winter. However, as the solar irradiance in winter is very little, so a solar energy system would find it difficult to generate sufficient power for long durations of time in winter. Therefore, we had to perform experimental comparisons.
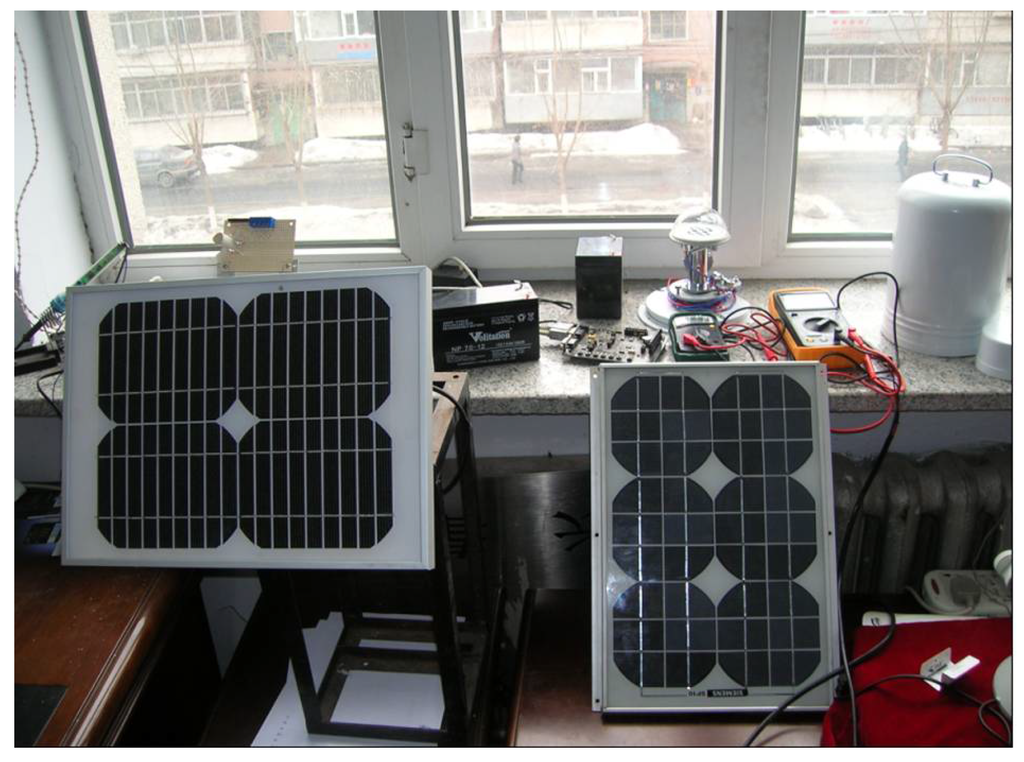
Figure 15.
Comparison of experimental tools.
Figure 15.
Comparison of experimental tools.
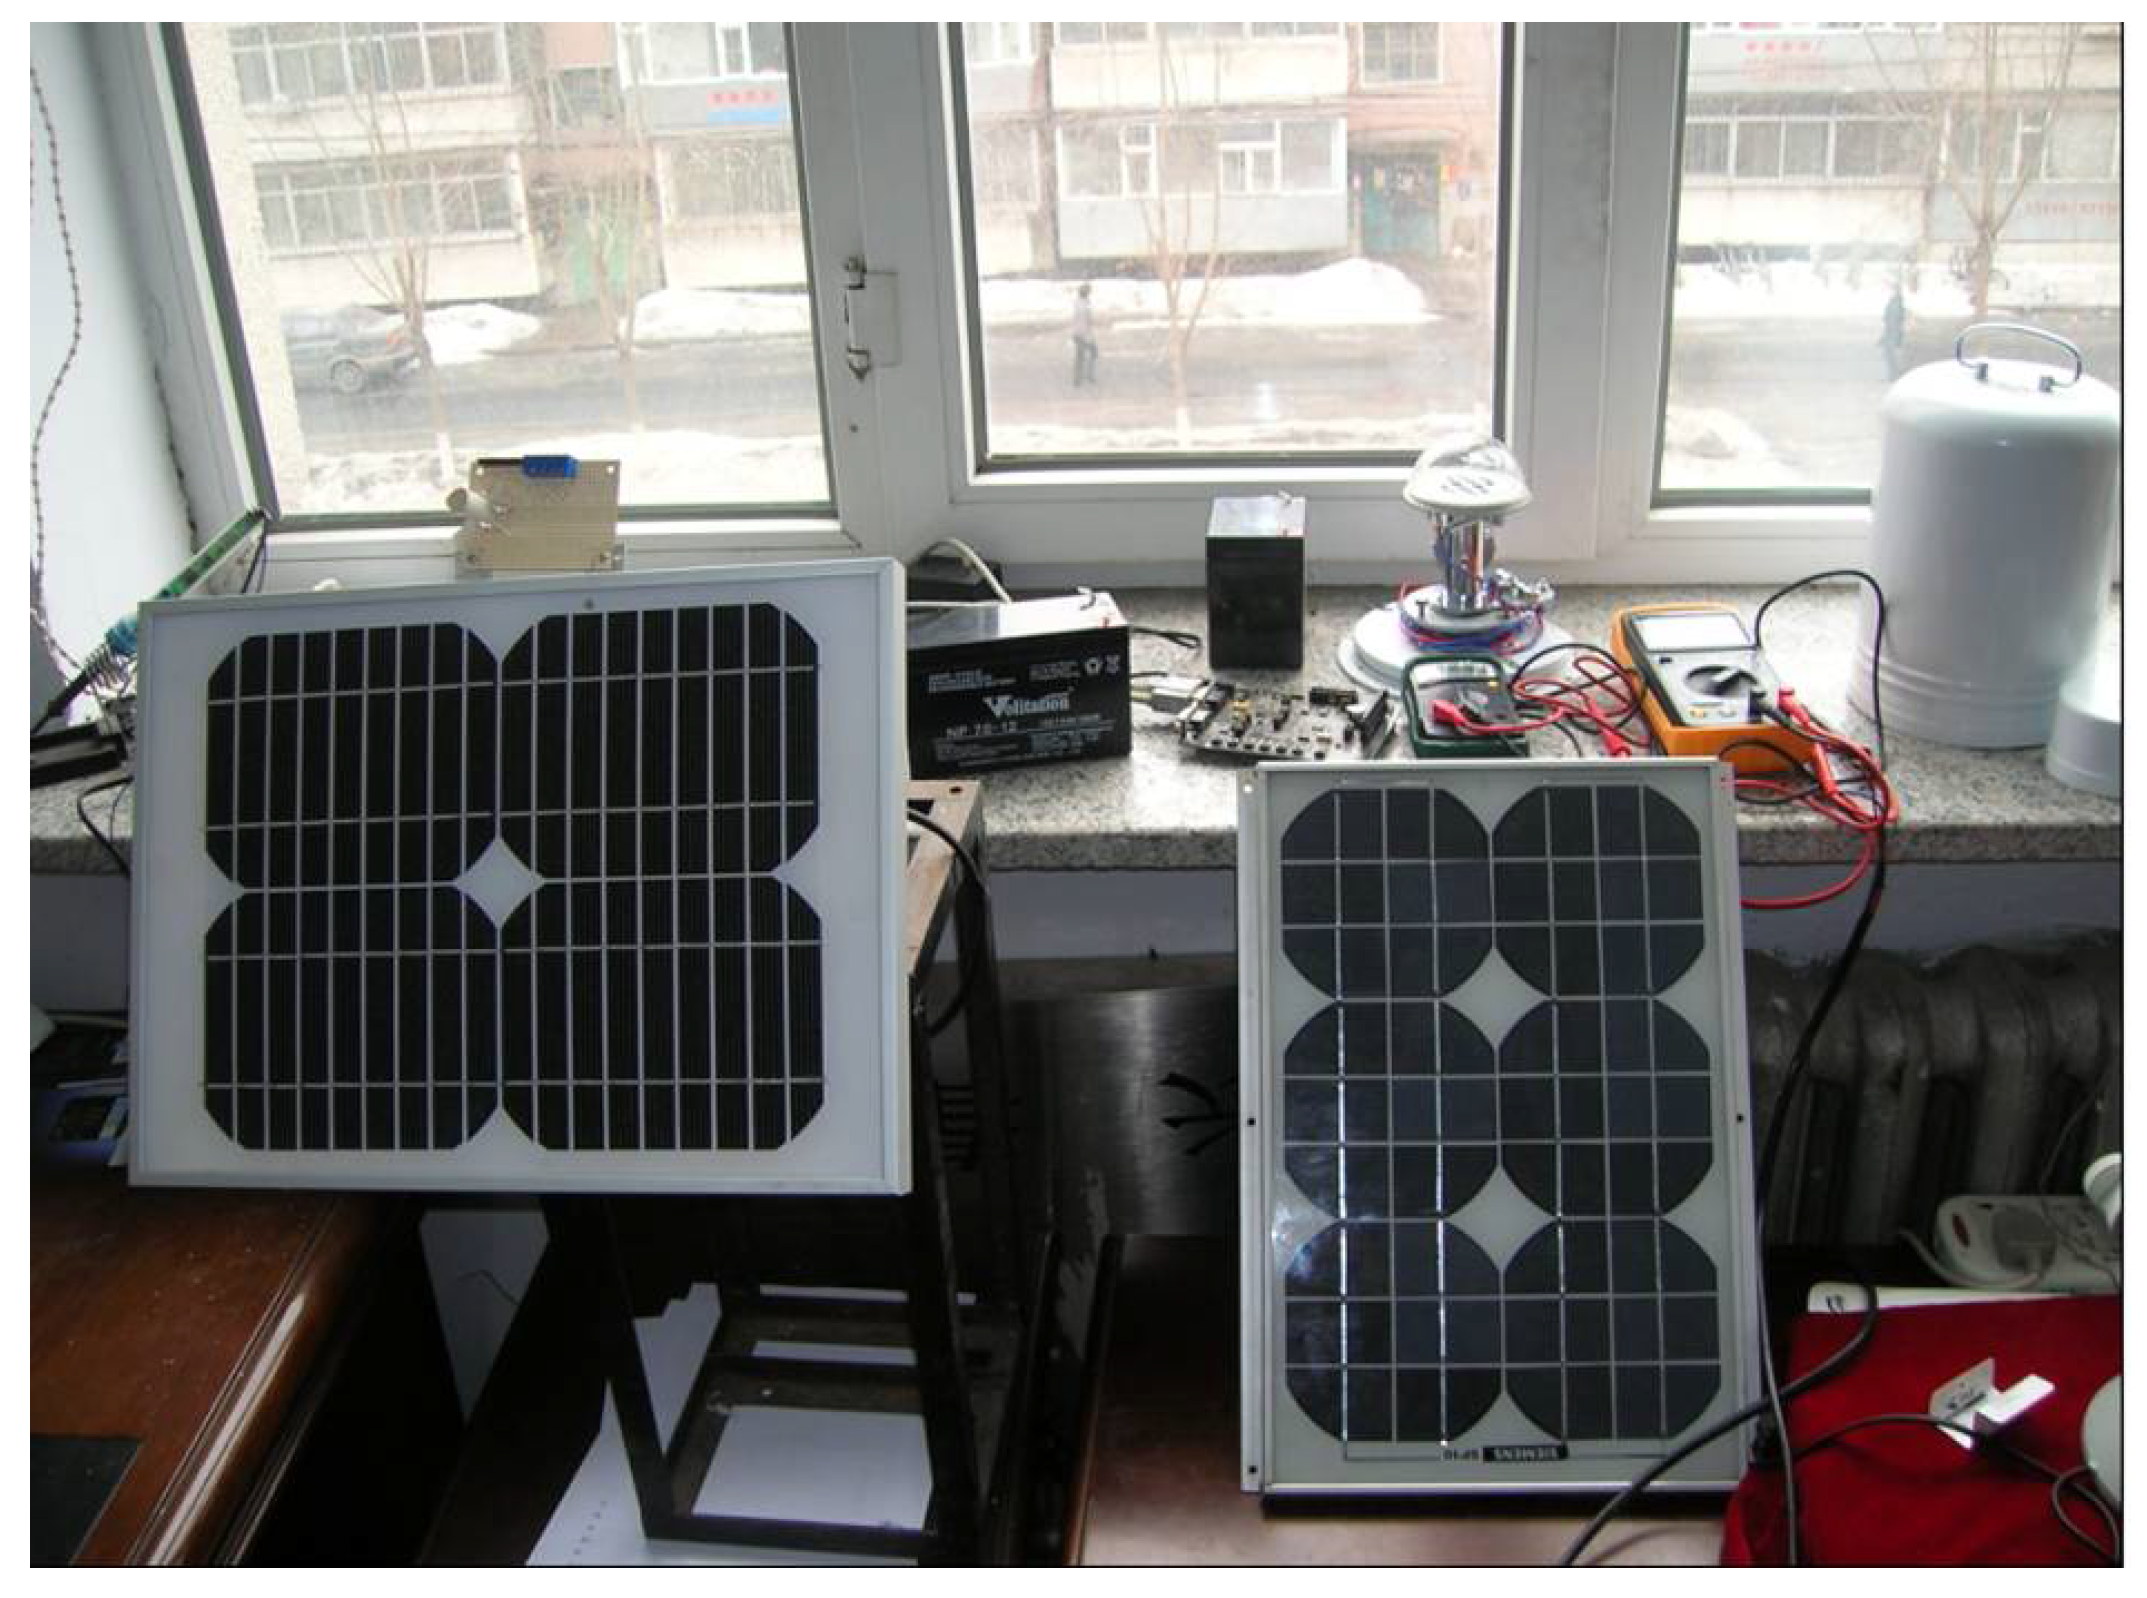
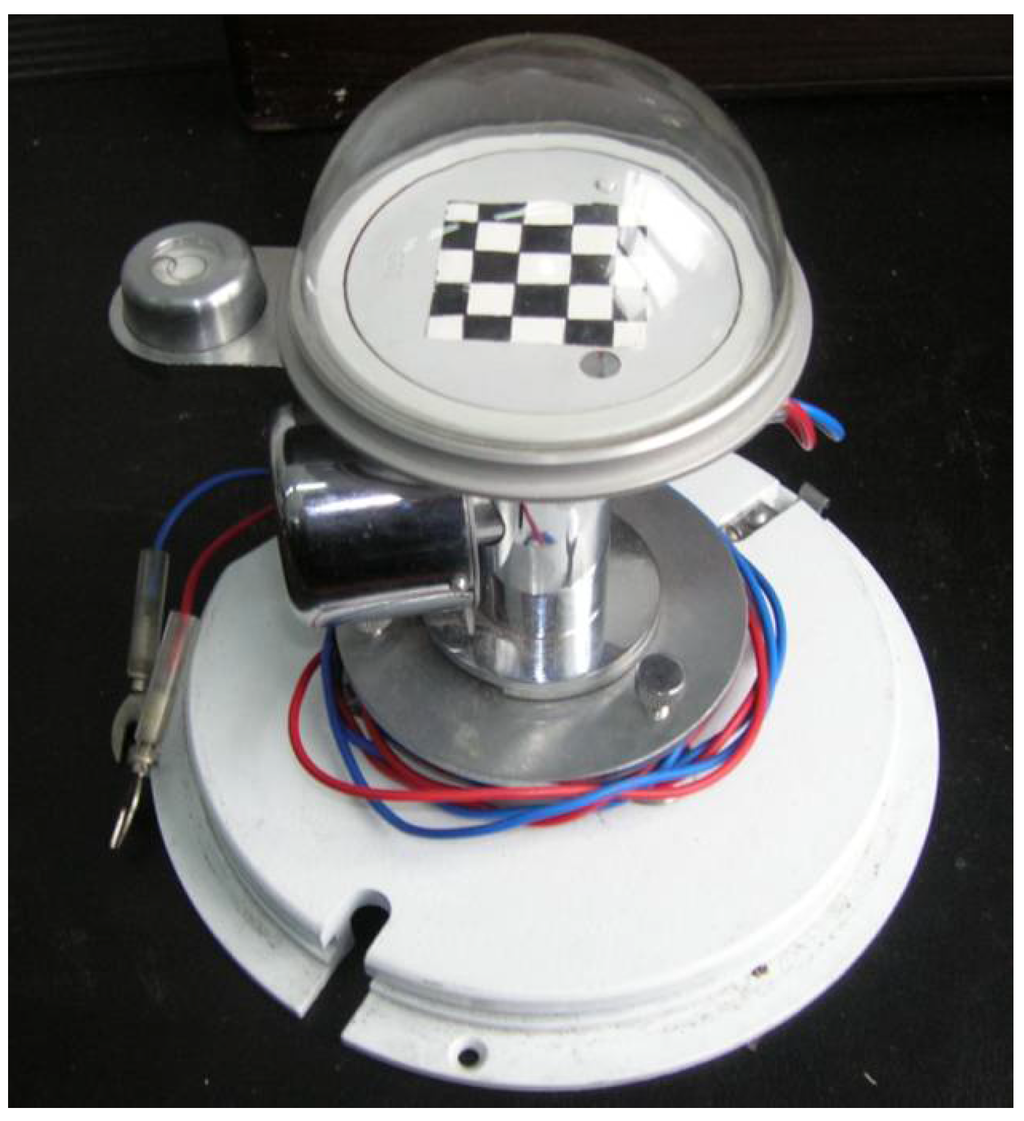
Figure 16.
DFY-2 Radiometer.
Figure 16.
DFY-2 Radiometer.


Table 1.
Solar panel variables.
| Maximum Power | Operating Voltage | Operating Current | Open Circuit Voltage | Open Circuit Current | Dimensions | Weight |
|---|---|---|---|---|---|---|
| 10 W | 17.2 V | 0.59 A | 21.3 V | 0.63 A | 385 × 290 × 25 mm | 1.4 kg |
Table 2.
DFY-2 Radiometer technical variables.
| Sensitivity | Resistance | Inertia |
|---|---|---|
| 7.2–14.3 μv/wm−2 | 35 ± 5 | 40 s |
Table 3.
DFY-2 Radiometer Suitable Environment and Dimensions.
| Temperature | Relative Humidity | Dimensions | Weight |
|---|---|---|---|
| −45–+45 °C | ≤95% rh | 180 × 270 mm | 3.2 kg |
In winter, the device was placed such that it faced a window in a laboratory, and the experiment was continued. However, the building that was located in front of the window blocked sunlight, preventing it from entering the laboratory before 10:00. This building also effectively blocked the sunlight from entering the laboratory room after 15:00. Therefore, the experimental data were collected between 10:00 and 15:00. The fixed solar panel and tracking system generated power simultaneously from 10:00 to 15:00. Every 10 min, we measured the power output and the amount of solar irradiance in the laboratory. We subsequently compared the power generated by the tracking system and the fixed solar panel. Furthermore, in the same environment, we also measured the amount of solar irradiance using the DFY-2 Radiometer. Under the same levels of solar radiations, we measured the solar irradiance and the generated capacity of the fixed and automatic tracking systems. We performed these measurements during the entire winter season, which extended from December 2012 to March 2013.
The system was tested under conditions of natural weather. We plotted the variation in solar intensity (y-axis) and the power generated by the system over time (x-axis) (Figure 1 and Figure 2). We plotted the results for a sunny day, a totally cloudy day, and a day that was intermittently cloudy and sunny; we selected these days in each of the four months of winter season (December–March).
From 10:00 to 15:00, the ratio of power output increase was calculated for the tracking system using samples representing four sunny days, four cloudy days, and four days that were intermittently cloudy and sunny in each of the four months of winter season (December–March).
4. Conclusions
- (1)
- A new solar tracking system was designed using COSMOS Motion, which performed a simulation analysis and demonstrated the expected motion trail in the absence of an interference phenomenon.
- (2)
- In this study, we successfully implemented a tracking solar power system. In northeast China, during the winter season, the days are relatively short. As a result, northeast China receives sunlight for a shorter duration of time. Therefore, very little power is generated by fixed solar panels during winter. However, with the newly designed solar auto tracking system, the power generation increased by 20% to 25% in winter. This novel system produced power rapidly and effectively.
- (3)
- A regression analysis was conducted to assess the power produced by the solar auto tracking system and fixed solar panels. The experimental results showed a positive relationship between the power generated by both the methods and the amount of solar irradiance. The higher ratio of power generated by both the solar methods was also positively associated with the average solar irradiance. The results of this study would serve to enhance solar power research throughout China.
Acknowledgments
This study received financial support from the Key Project of Science and Technology Foundations of Jilin Province, China (Grant: 20080246). The authors sincerely thank the Department of Mechanical Science (Grant: 450060441065) and Engineering and the Department of Biology and Agriculture.
Author Contributions
Hai-Ye Yu conceptualized this study. Qi-Xun Zhang contributed significantly to the experimental analysis and prepared the manuscript. Qiu-Yuan Zhang and Zhong-Yuan Zhang performed data analyses and wrote the manuscript; Cheng-Hui Shao and Di Yang helped in performing the experimental analysis and provided constructive feedback.
Conflicts of Interest
The authors declare no conflict of interest.
References
- Kolokotsa, D.; Saridakis, G.; Dalamagkidis, K.; Dolianitis, S.; Kaliakatsos, I. Development of an intelligent indoor environment and energy management system for greenhouses. Energy Convers. Manag. 2010, 51, 155–168. [Google Scholar] [CrossRef]
- Goto, E.; Takakura, T. The Effect of Artificial light on the Growth of Lettuce. Acta Hortic. 1988, 20, 313–318. [Google Scholar]
- Hu, Y.G.; Li, P.P.; Deng, Q.A.; Mao, H.P. Study on the Effect of Artificial Lighting in Greenhouse and Disposition Design of Light Source. J. Jiangsu Univ. Sci. Technol. 2001, 22, 37–40. [Google Scholar]
- Barghini, A.; de Medeiros, B.A. Artificial lighting as a vector attractant and cause of disease diffusion. Environ. Health Perspect. 2010, 118, 1503–1506. [Google Scholar] [CrossRef] [PubMed]
- Pode, R. Addressing India’s energy security and options for decreasing energy dependency. Renew. Sustain. Energy Rev. 2010, 14, 3014–3022. [Google Scholar] [CrossRef]
- Chao, R.M.; Ko, S.H.; Pai, F.S.; Lin, I.H.; Chang, C.C. Evaluation of a photovoltaic energy mechatronics system with a built-in quadratic maximum power point tracking algorithm. Sol. Energy 2009, 83, 2177–2185. [Google Scholar] [CrossRef]
- Riyad, A.M.; Salah, A.; Iyad, M.M. Design, construction and operation of spherical solar cooker with automatic sun tracking system. Energy Convers. Manag. 2011, 5, 615–620. [Google Scholar]
- Crockett, R.G.; Newborough, M.; Highgate, D.J. Electrolyser-based energy management: A means for optimising the exploitation of variable renewable-energy resources in stand-alone applications. Sol. Energy 1997, 6, 293–302. [Google Scholar] [CrossRef]
- Kelly, N.A.; Gibson, T.L. Improved photovoltaic energy output for cloudy conditions with a solar tracking system. Sol. Energy 2009, 83, 2092–2102. [Google Scholar] [CrossRef]
- McConnell, I.; Li, G.; Brudvig, G.W. Energy conversion in natural and artificial photosynthesis. Chem. Biol. 2010, 17, 434–447. [Google Scholar] [CrossRef] [PubMed]
- Li, Z.S.; Zhang, G.Q.; Li, D.M.; Zhou, J.; Li, L.J.; Li, L.X. Application and development of solar energy in building industry and its prospects in China. Energy Policy 2007, 4, 1–7. [Google Scholar] [CrossRef]
- Zhai, X.Q.; Wang, R.Z. Experiences on solar heating and cooling in China. Renew. Sustain. Energy Rev. 2008, 12, 1110–1128. [Google Scholar] [CrossRef]
- Kalogirou, S.A.; Tripanagnostopoulos, Y. Industrial application of PV/T solar energy systems. Appl. Therm. Eng. 2007, 27, 8–9. [Google Scholar] [CrossRef]
- Arbab, H.; Jazi, B.; Rezagholizadeh, M. A computer tracking system of solar dish with two-axis degree freedoms based on picture processing of bar shadow. Renew. Energy 2009, 34, 1114–1118. [Google Scholar] [CrossRef]
- Zahr, M.; Friedrich, D.; Kloth, T.Y. Bionic Photovoltaic Panels Bio-Inspired by Green Leaves. J. Bionic Eng. 2010, 7, 284–293. [Google Scholar] [CrossRef]
- Ghosh, H.R.; Bhowmik, N.C.; Hussain, M. Determining seasonal optimum tilt angles, solar radiations on variously oriented, single and double axis tracking surfaces at Dhaka. Renew. Energy 2010, 35, 1292–1297. [Google Scholar] [CrossRef]
- Zhang, Q.X.; Yu, H.Y. Simulation analysis of the security of transmission mechanism of automatic. J. Jilin Univ. 2010, 40, 480–484. [Google Scholar]
- Mohammad, N.; Karim, T. Design and Implementation of Hybrid Automatic Solar-Tracking System. J. Sol. Energy 2013, 135, 1–6. [Google Scholar] [CrossRef]
- Lee, Y.P.; Chen, H.S.; Gau, Y.Q. Analysis and Design of a Single-Axis Automatic Solar Tracking and Power Filtering System for Solar Power Generation. Sens. Lett. 2012, 10, 1075–1080. [Google Scholar] [CrossRef]
- Shiau, J.-K.; Lee, M.-Y.; Wei, Y.-C. Circuit Simulation for Solar Power Maximum Power Point Tracking with Different Buck-Boost Converter Topologies. Energies 2014, 7, 5027–5046. [Google Scholar] [CrossRef]
- Frydrychowicz-Jastrzebska, G.; Bugala, A. Modeling the Distribution of Solar Radiation on a Two-Axis Tracking Plane for Photovoltaic Conversion. Energies 2015, 8, 1025–1041. [Google Scholar] [CrossRef]
- Al-Soud, M.S.; Essam, A.; Ali, A.; Salah, A.; Hraysha, E.S. A parabolic solar cooker with automatic two axes sun tracking system. Appl. Energy 2010, 87, 463–470. [Google Scholar] [CrossRef]
- Mousazadeh, H.; Keyhani, A.; Javadi, A.; Mobli, H.; Abrinia, K.; Sharifi, A. A review of principle and sun-tracking methods for maximizing solar systems output. Renew. Sustain. Energy Rev. 2009, 13, 1800–1818. [Google Scholar] [CrossRef]
- Xue, X.D.; Zheng, H.F.; He, K.Y.; Chen, Z.L.; Tao, T.; Xie, G. Experimental study on a new solar boiling water system with holistic track solar funnel concentrator. Energy 2010, 35, 692–697. [Google Scholar]
- Zhang, Q.X.; Yu, H.Y. Analysis of statics of solar auto-tracking system and simulation of fluctuating wind. Trans. CSAE 2010, 26, 137–141. [Google Scholar]
- Zhang, Q.X.; Yu, H.Y.; Yang, D. Analysis of Solar Auto-tracking System Kinematics and Static Force. In Proceedings of the Second International Conference on Modeling, Simulation and Visualization Methods, Sanya, China, 15–16 May 2010; pp. 226–228.
- Iqbal, M. An Introduction to Solar Radiation; Academic Press: Orlando, FL, USA, 1983. [Google Scholar]
- Myers, D.R.; Stoffel, T.L.; Reda, R.; Wilcox, S.M.; Andreas, A.M. Recent progress in reducing the uncertainty in and improving pyranometer calibrations. Trans. ASME 2002, 124, 44–50. [Google Scholar] [CrossRef]
- Myers, D.R. Solar radiation and measurements for renewable energy applications; data and model uncertainty. Energy 2005, 30, 1517–1531. [Google Scholar] [CrossRef]
© 2015 by the authors; licensee MDPI, Basel, Switzerland. This article is an open access article distributed under the terms and conditions of the Creative Commons Attribution license (http://creativecommons.org/licenses/by/4.0/).