1. Introduction
Energy is one of the main concerns for water utilities; it is necessary from water extraction to its disposal. Energy consumption depends on the water system’s location and characteristics and, in particular, on availability and quality of resources, the network topology, the area’s topography and the waste water treatments used [
1,
2].
There are two main contributions to the operational cost of a water supply system: the cost of pumping energy and the cost of preparing the water for use. The former is recognized as having a significant influence and even a small overall increase in efficiency may result in significant cost savings [
3,
4,
5]. The latter is strictly linked to water quality; costs can increase when freshwater resources are not available and desalination is considered as an alternative [
6]. Nevertheless, as reported by Nogueira Vilanova and Perrella Balestieri [
7], the energy intensity, expressed as the energy used for one cubic meter of water, can vary from 0.25 to 4.5 kWh/m
3 depending on the source type (
i.e., surface or groundwater), not including the desalination process, for which the energy intensity can be up to 15 kWh/m
3.
The relationship between energy cost and water loss has also been investigated in the literature. Water loss, in terms of leakage on both the utility and the consumer side, can affect the amount of energy required to supply water to the users, e.g., water losses lead to oversized pumps, producing a proportional waste of energy [
8]. As is widely known, most inefficiencies occur before water reaches the end user [
9]. In addition, in supply systems experiencing the intermittent distribution, energy consumption increases further [
10,
11]. In particular, such operational conditions are quite common during a water shortage in which the water managers may be forced to supply water for only a few hours per day or a few days per week. To cope with intermittency, users collect water in rooftop tanks, which are often filled by means of pumps, to overcome inadequate pressure levels and gather as much water as possible. The users’ local tanks are often larger than necessary. Therefore, this configuration, coupled with intermittent distribution, contributes to inequalities among users in term of both water volume [
12] and energy cost [
13]. In addition, the periodic emptying and filling periods stress the pipe network by causing the number of leaks and, consequently, the amount of energy consumed by the water utility company to increase [
11].
Colombo and Karney [
14] developed a simple analytical relationship between the energy efficiency of a water supply system and leak size and location by investigating the roles of system demand and orifice hydraulics. In addition, a description of how the energy cost response depended on the system’s complexity (simulated by a growing number of loops) was presented. Later, Colombo and Karney [
15] described the impact of leaks on electricity consumption in systems characterized by a pump connected to storage. The results have shown the effect of a number of factors, such as the system components’ relative locations and the pumping strategy, on the energy cost when there are leaks. In addition, the authors underlined the role of friction on the system’s energy response to leakages and showed that the inclusion of storage capacity does not necessarily guarantee lower energy consumption. Then, the water utility companies’ energy consumption depends on the energy loss associated with water leakages and friction losses [
16] and represents a significant source of greenhouse gasses (GHG) emissions [
17,
18]. “The total amount of GHG emissions directly and indirectly caused by an activity or is accumulated over the life stage of product” is defined as the carbon footprint [
19]. The drinking water system’s effect on GHG emissions has been analysed by several researchers [
17,
20,
21]. A review of current methods of estimation is presented in Pandey
et al. [
22]. The allocation of GHG emissions, related to the supply chain, among producers and users has been also analysed [
23]. In addition to reducing energy consumption, GHG emissions can be abated by reducing leaks [
17].
Energy efficiency measures have been proposed in terms of system design, operation, and maintenance improvements that include leakage management. Moreover, the selection of a suitable energy tariff and the inclusion of renewable energy sources can further reduce the cost of energy [
24,
25]. In such an achievement, the role of a hydraulic model and optimization methods are recognized by several authors [
26]. Prior to applying any measures, an assessment of the energy use or energy flows of the water system should be made and the amount of water lost should be determined.
The present paper aims to suggest a method for a multi-criteria analysis of water supply maintenance measures relating to leakage reduction and energy efficiency. Such measures cannot be analysed by only examining their primary objectives because of the interactions between potential energy production, recovery, water loss and GHG emission. This paper describes a complex case study, the water supply system of Palermo (Italy), which shows the potential of the multi-criteria approach in the selection of the most reliable solution for system maintenance. The paper demonstrates that, in urban water systems, measures aimed at energy saving cannot be reliably analysed without considering their impact on water loss and, at the same time, leakage reduction impacts energy consumption. This is due to the links between energy and pressure and between pressure and leaks that can only be analysed in an integrated way. The results show that mitigation plans aimed at a single objective do not optimally reduce the operational costs.
2. Methods of Analysis
When dealing with a water supply, leakage reduction measures may interact with energy balance because controlling water loss generally reduces the volume of water flowing through pumping stations and treatment plants. Accordingly, some energy production measures, such as the introduction of turbines, pumps as turbines (PATs) [
10,
27], influence pressure levels and reduce leakages. The mitigation measures cannot be analysed globally without considering both aspects [
24]; obviously, the water supply’s carbon footprint is also influenced.
Some performance indicators were considered in the present study that are relevant to leakage estimation, energy consumption and GHG production. In literature several formulations have been proposed considering also water scarcity conditions [
28,
29,
30]. To estimate the GHG emission, boundaries must be selected with regard to the activities included in the analysis and the time period. In particular, the present analysis was performed on potable water production and supply with the water sources (the environment) and the urban water tanks (the users) as boundaries. Because the aim of the paper was to compare different mitigation solutions, the analysis was not performed on the complete urban water cycle, which includes sewer systems and waste water treatment, to reduce the complexity of the analysis. The water supply system analysed includes more than 80 units that comprise the potable water supply chain from the environment to the users. The national energy mix defined by the Italian Energy Authority (GSE) was used for estimating the amount of carbon emitted due to energy transport and production. The use of the database, including the consideration of water losses, allowed the GHG emission of the entire system and for each of the subsystems described below to be estimated. The following indicators [
31,
32] were selected for leakage estimation (Water Losses: WL):
where CARL is the volume of current annual real losses,
Vs is the system input volume,
Lpipes is the length of the pipes (excluding service connections), and UARL is the calculated volume of the unavoidable annual real losses. All of the volumes are expressed in thousands of m
3/year and all of the lengths are in km. UARL can be computed using the following empirical equation [
31]:
where
Lm is the length of the system’s pipes in km (excluding service connections),
Nc is the number of service connections,
Lc is the average service connection length in m, and
P is the average system pressure in atm.
The following indicators were selected for the energy consumption analysis [
31] (Energy: EN):
where
Ec is the energy consumption,
Ep is the annual energy recovery, and INHAB is the resident population. All energies are reported in kWh per year.
As for to the indicators relating to energy, the following indicators were adopted in the present paper to analyse the GHG production (Carbon Oxides: CO):
where
COeq is the annual GHG production expressed in
tCOeq per year.
Indicator WL3 is the well-known infrastructure leakage index (ILI) that is used to evaluate the potential for water loss recovery using technically feasible measures; it is the ratio between the CARL, i.e., the current annual losses, and the UARL, i.e., the minimum technically feasible leakage volume. A value of WL3 near unity means that the system is optimized in terms of leakage control. In general, low values of the indicators mean the system is performing well.
3. Palermo’s Water Supply System
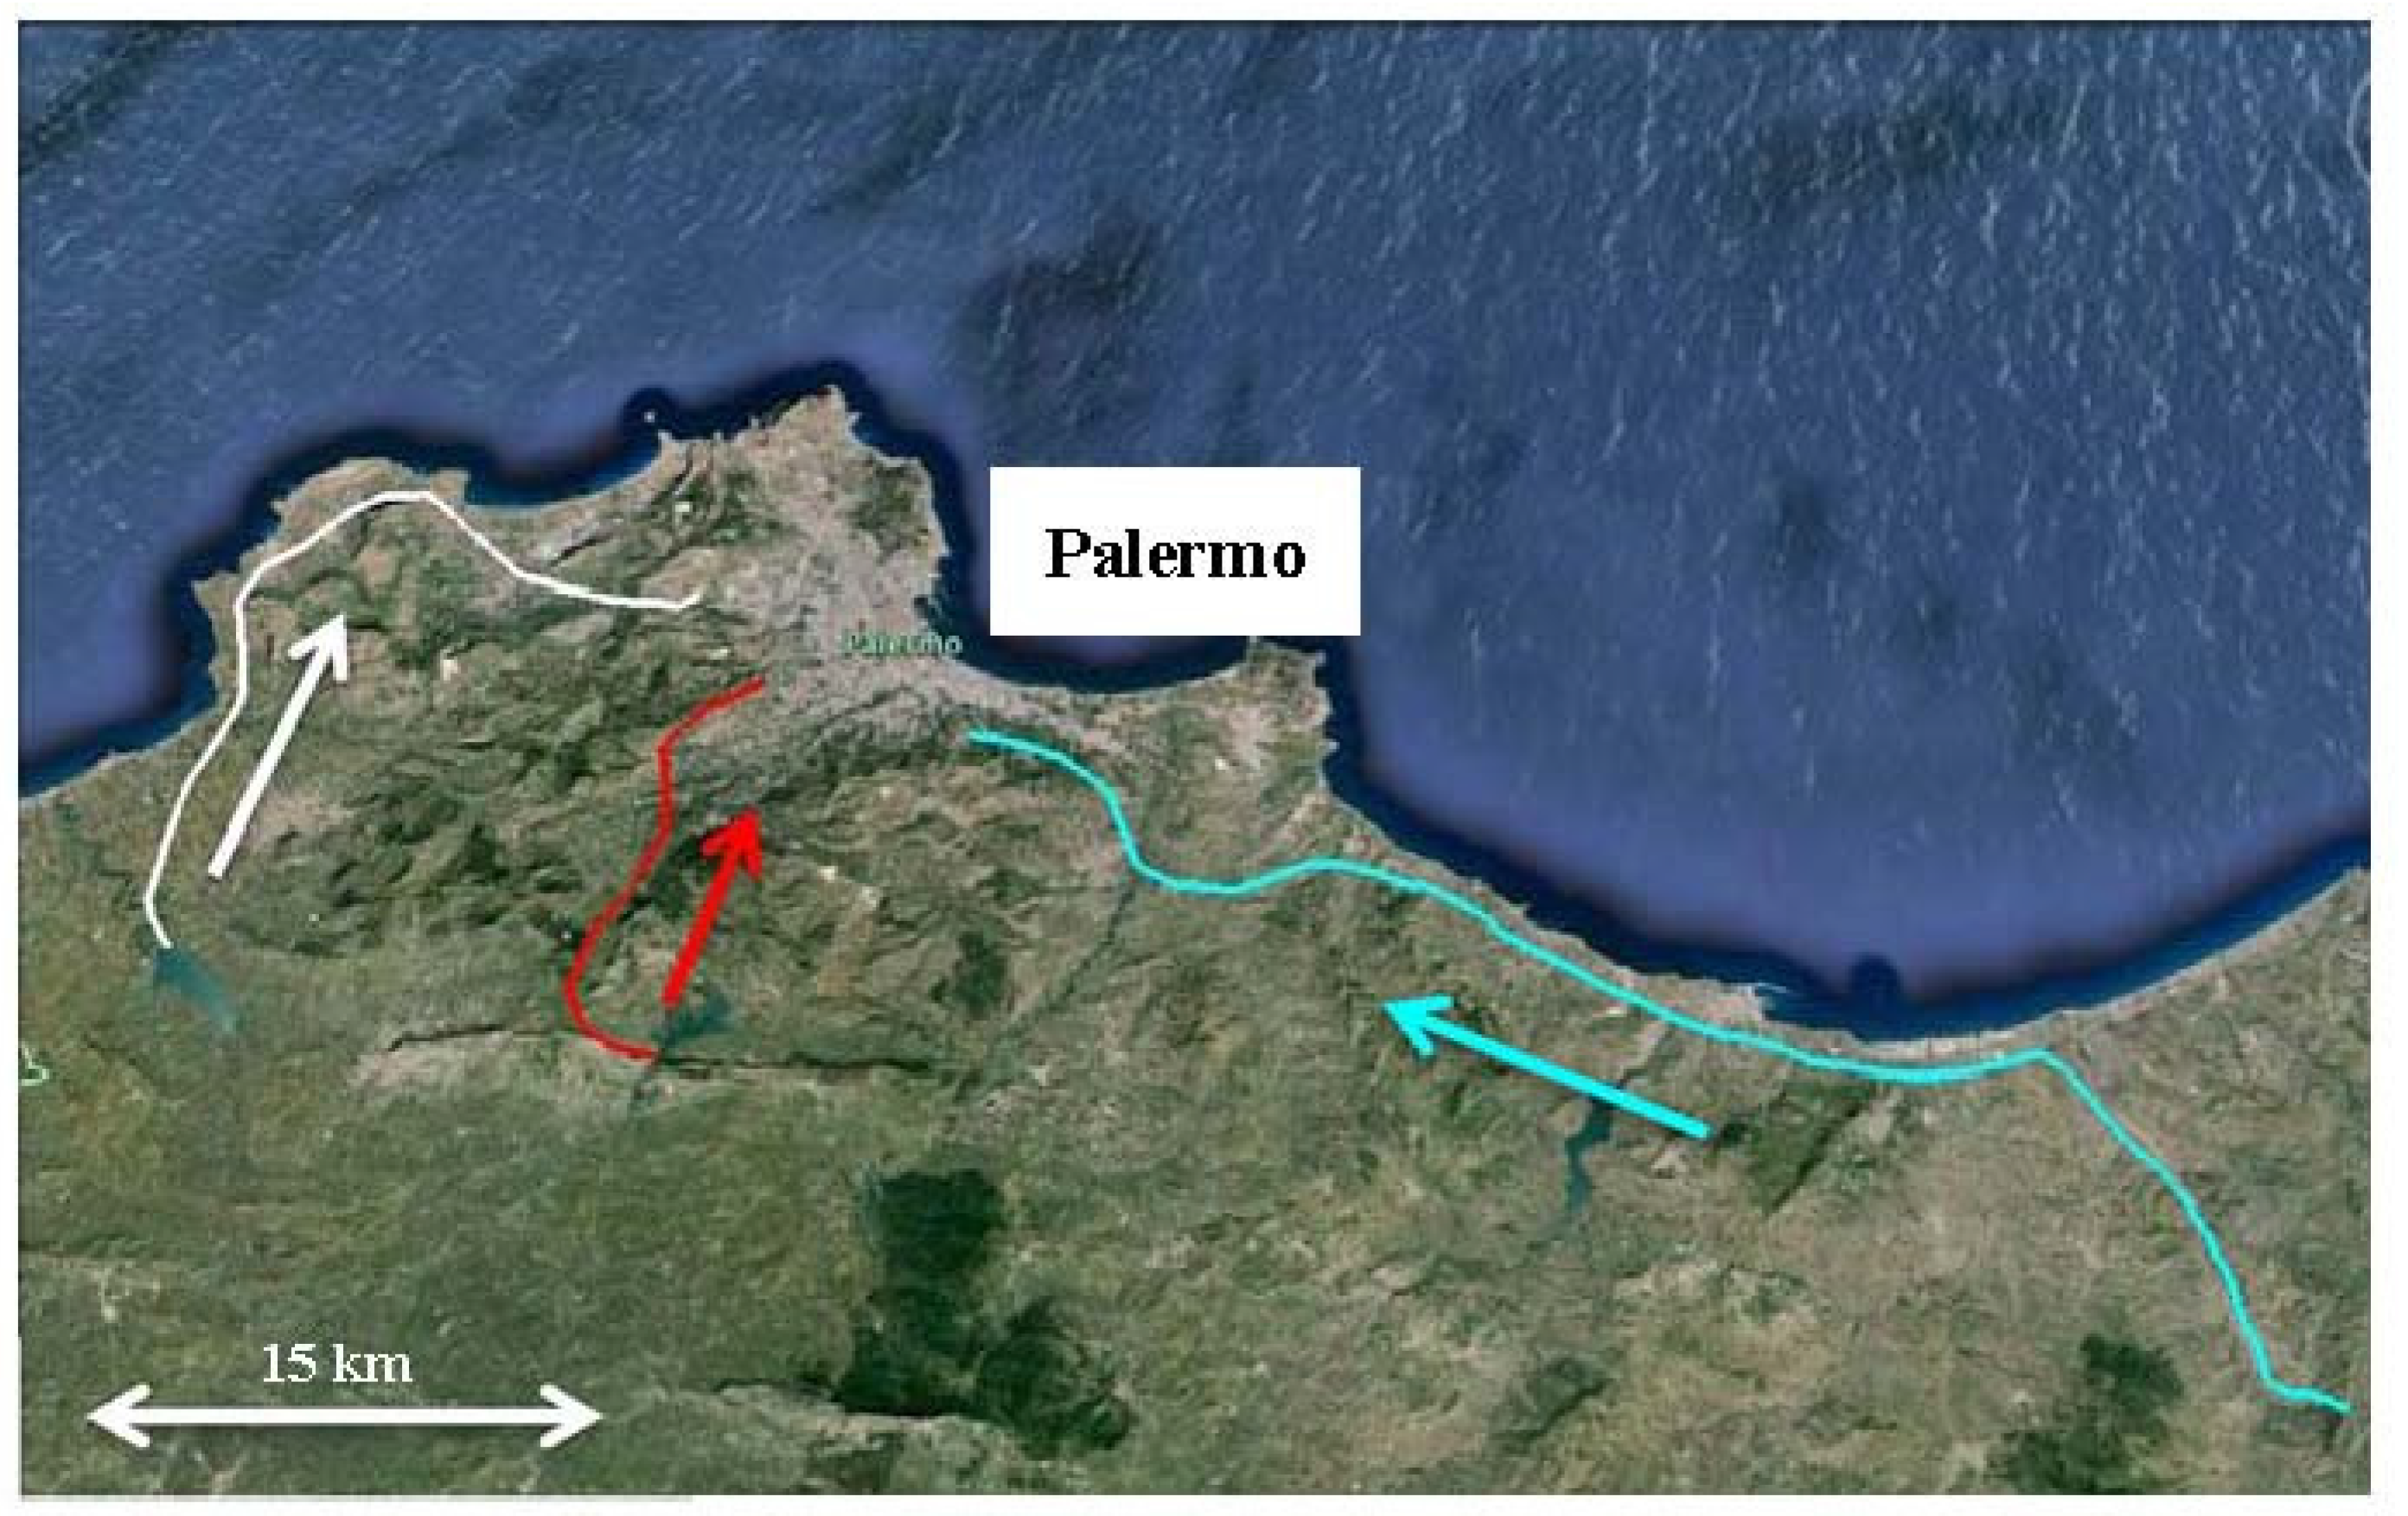
The city of Palermo is the sixth most populous in Italy with approximately 800,000 residents, 50,000 commuters and 100,000 seasonal tourists. The city is located on the northern coast of Sicily and it is surrounded by the sea (in the north) and mountains (in the other directions). Water is supplied by several ground (wells and springs) and surface (artificial reservoirs and rivers) sources. Water is collected by three water systems (
Figure 1): the Scillato system collects water from sources on the eastern side of the region; the Gabriele system collects water from sources located in the southern mountains; and the Jato system collects water from sources located on the western side of the region. The average abstracted volume is 151.8 Mm
3/year and around 3.3 Mm
3/year are exported to other systems directly at the source. Water volumes supplied to the three systems is then equal to 148.5 Mm
3/year and the average volume supplied to users is 111 Mm
3/year. The average water loss is near 27%: the Scillato water supply system is characterized by high losses (37.8%); the Gabriele and Jato systems are newer and characterized by lower leakage volumes (17.8% and 14%, respectively).
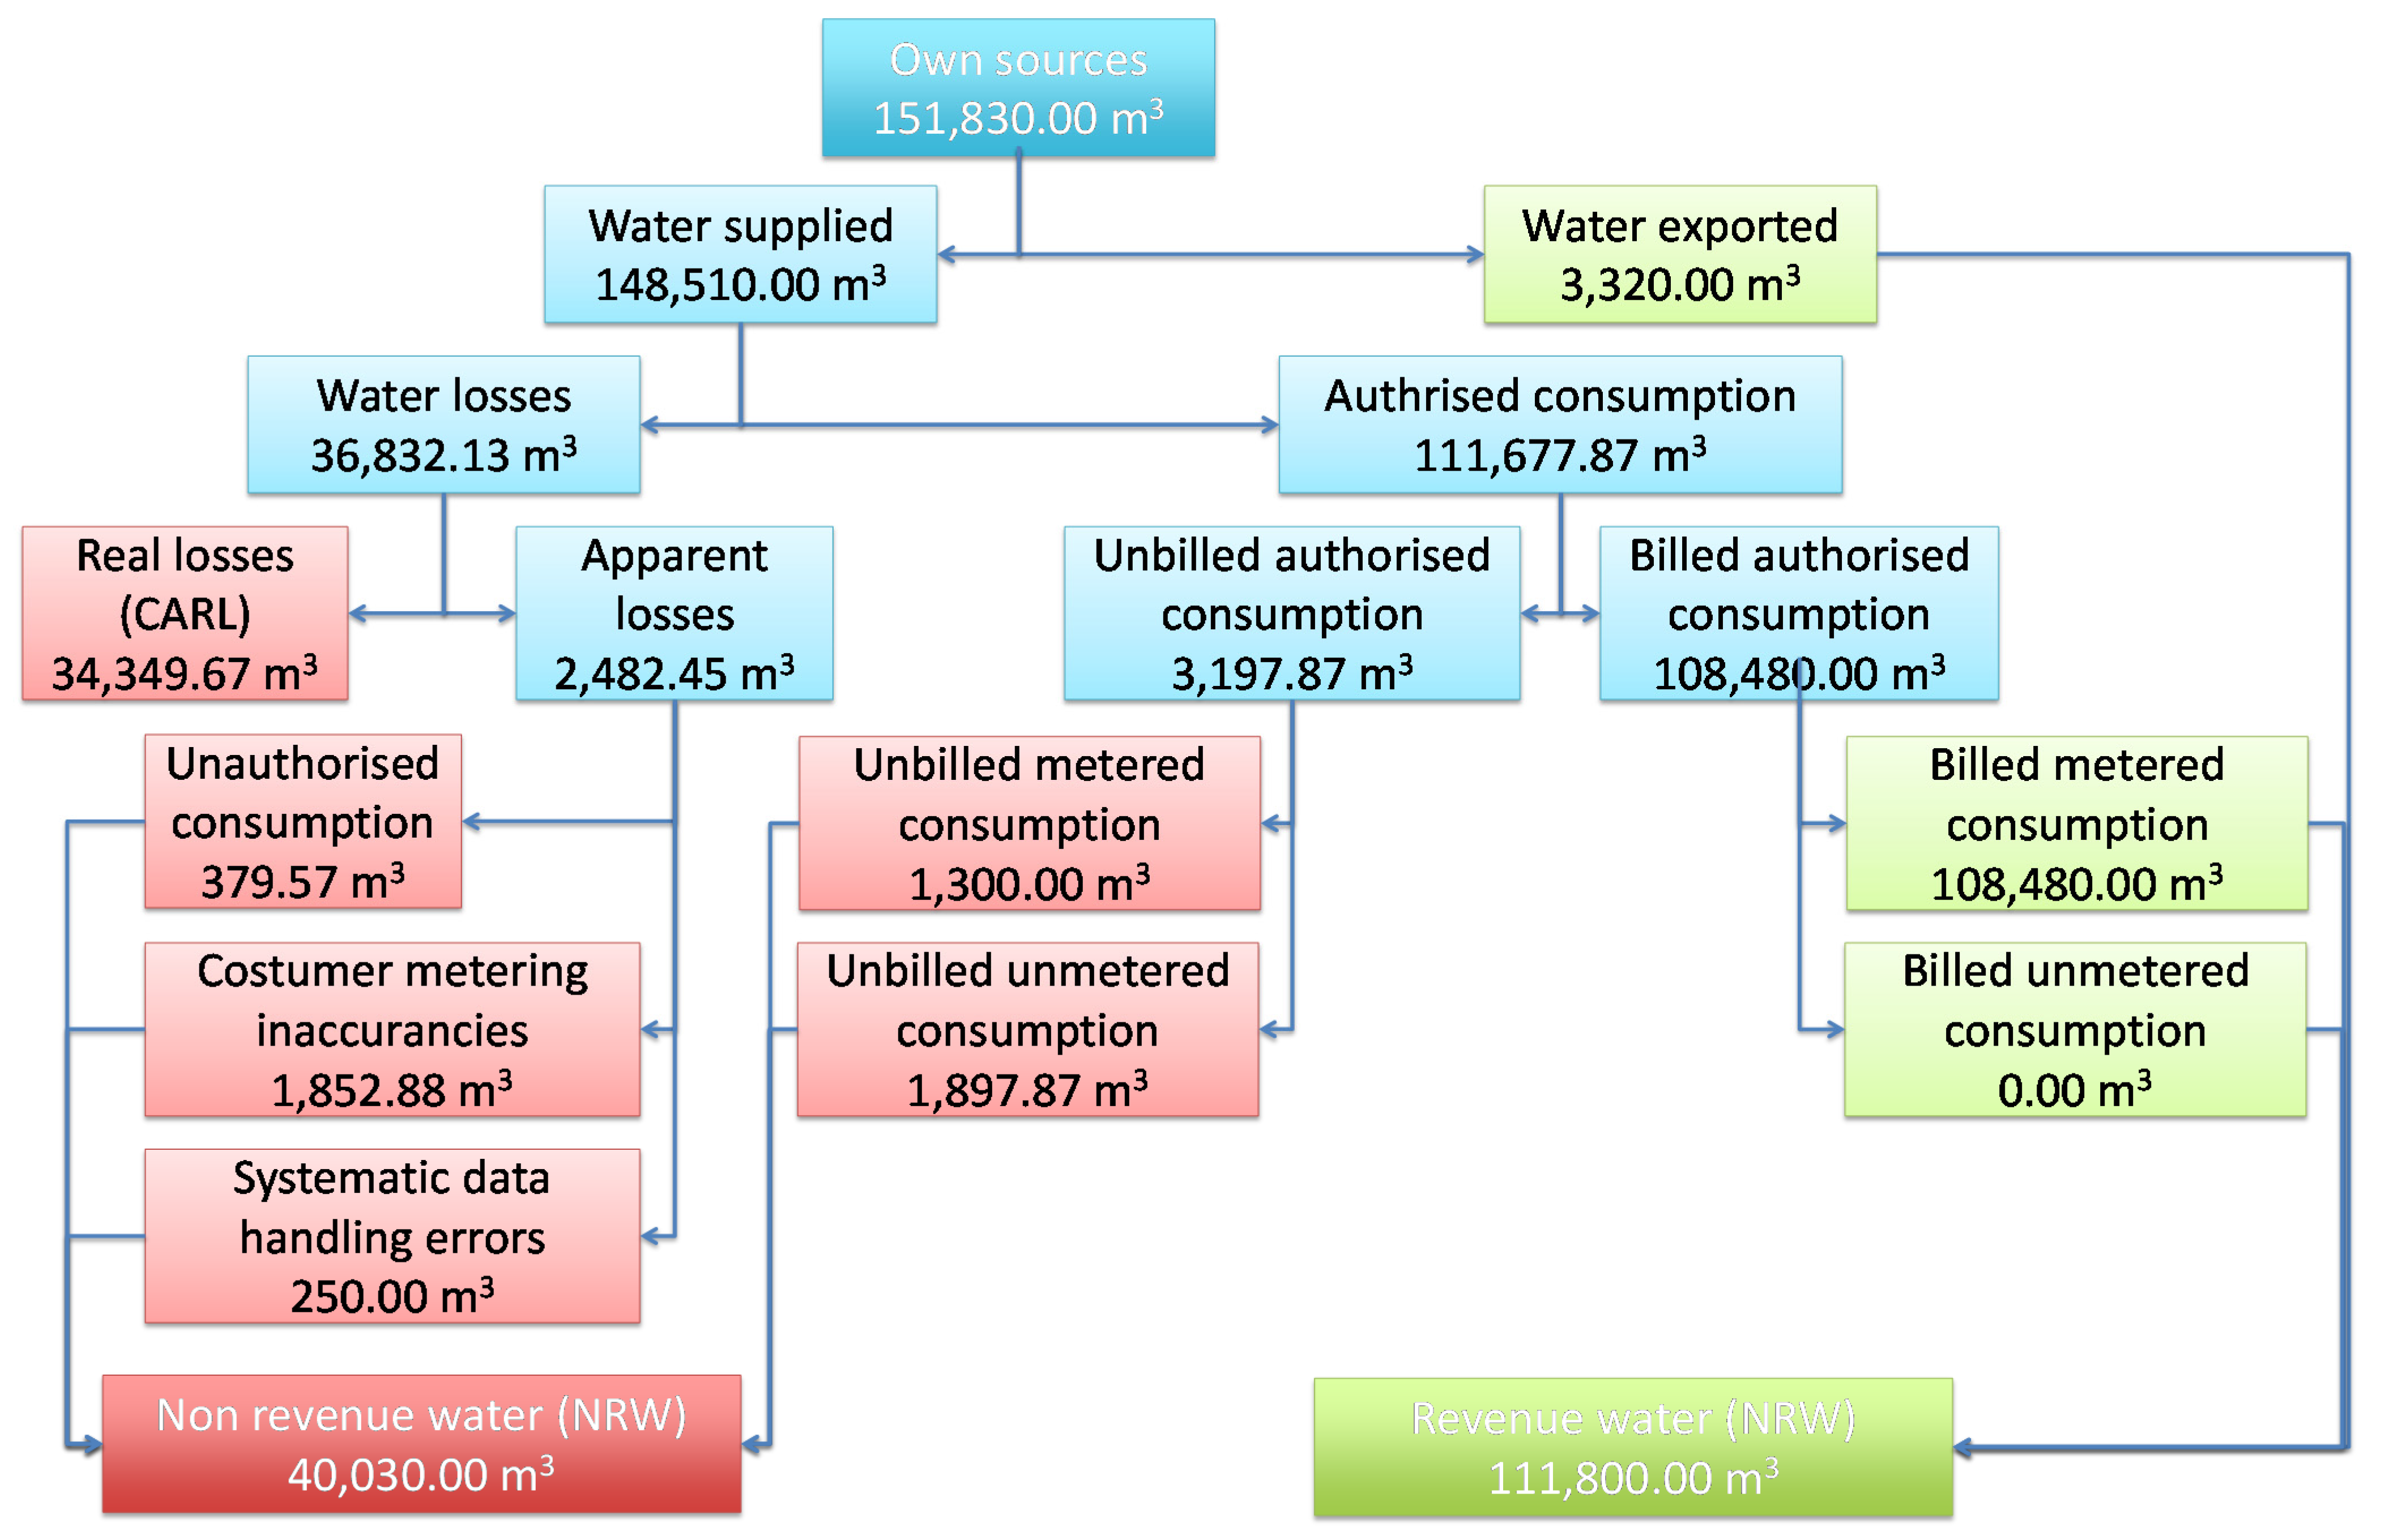
Figure 2 reports all of the water balance data for the year 2013 using the International Water Association (IWA) Standard International Water Balance for the system [
33]. These numbers were obtained from the official water balance provided by the Water Manager. The water balances are certified by the National Water Authority that uses such data for assessing the reliability of service provided by the water managers. The small amount of unauthorized consumption is because users are not supplied along the pipes, allowing water thefts to be discovered easily. Unbilled authorized consumption is due to the minimum amount of water that must be supplied without billing according to the tariff plan. Details of the system and the Palermo water supply can be found in Fontanazza
et al. [
34].
As the length of the whole supply system
Lm (excluding service connections) is 6770 km, the system is characterized by 63,412 service connections with an average length
Lc of 8.7 m and the average system pressure is 3.8 atm, the system’s UARL level assessed through Equation (4) is 2.61 Mm
3. The performance indicators relating to the CARL level take the following values:
An analysis of the indicators shows that almost a quarter of the supplied volume is lost along the way. The high value of indicator WL3 shows that the system is not optimized and that work can be performed technically to reduce leakages.
Figure 1.
The water supply scheme in Palermo: the Jato system (in white); the Gabriele System (in red) and the Scillato System (in cyan).
Figure 1.
The water supply scheme in Palermo: the Jato system (in white); the Gabriele System (in red) and the Scillato System (in cyan).
Figure 2.
The water balance for the year 2013, determined using the IWA method.
Figure 2.
The water balance for the year 2013, determined using the IWA method.
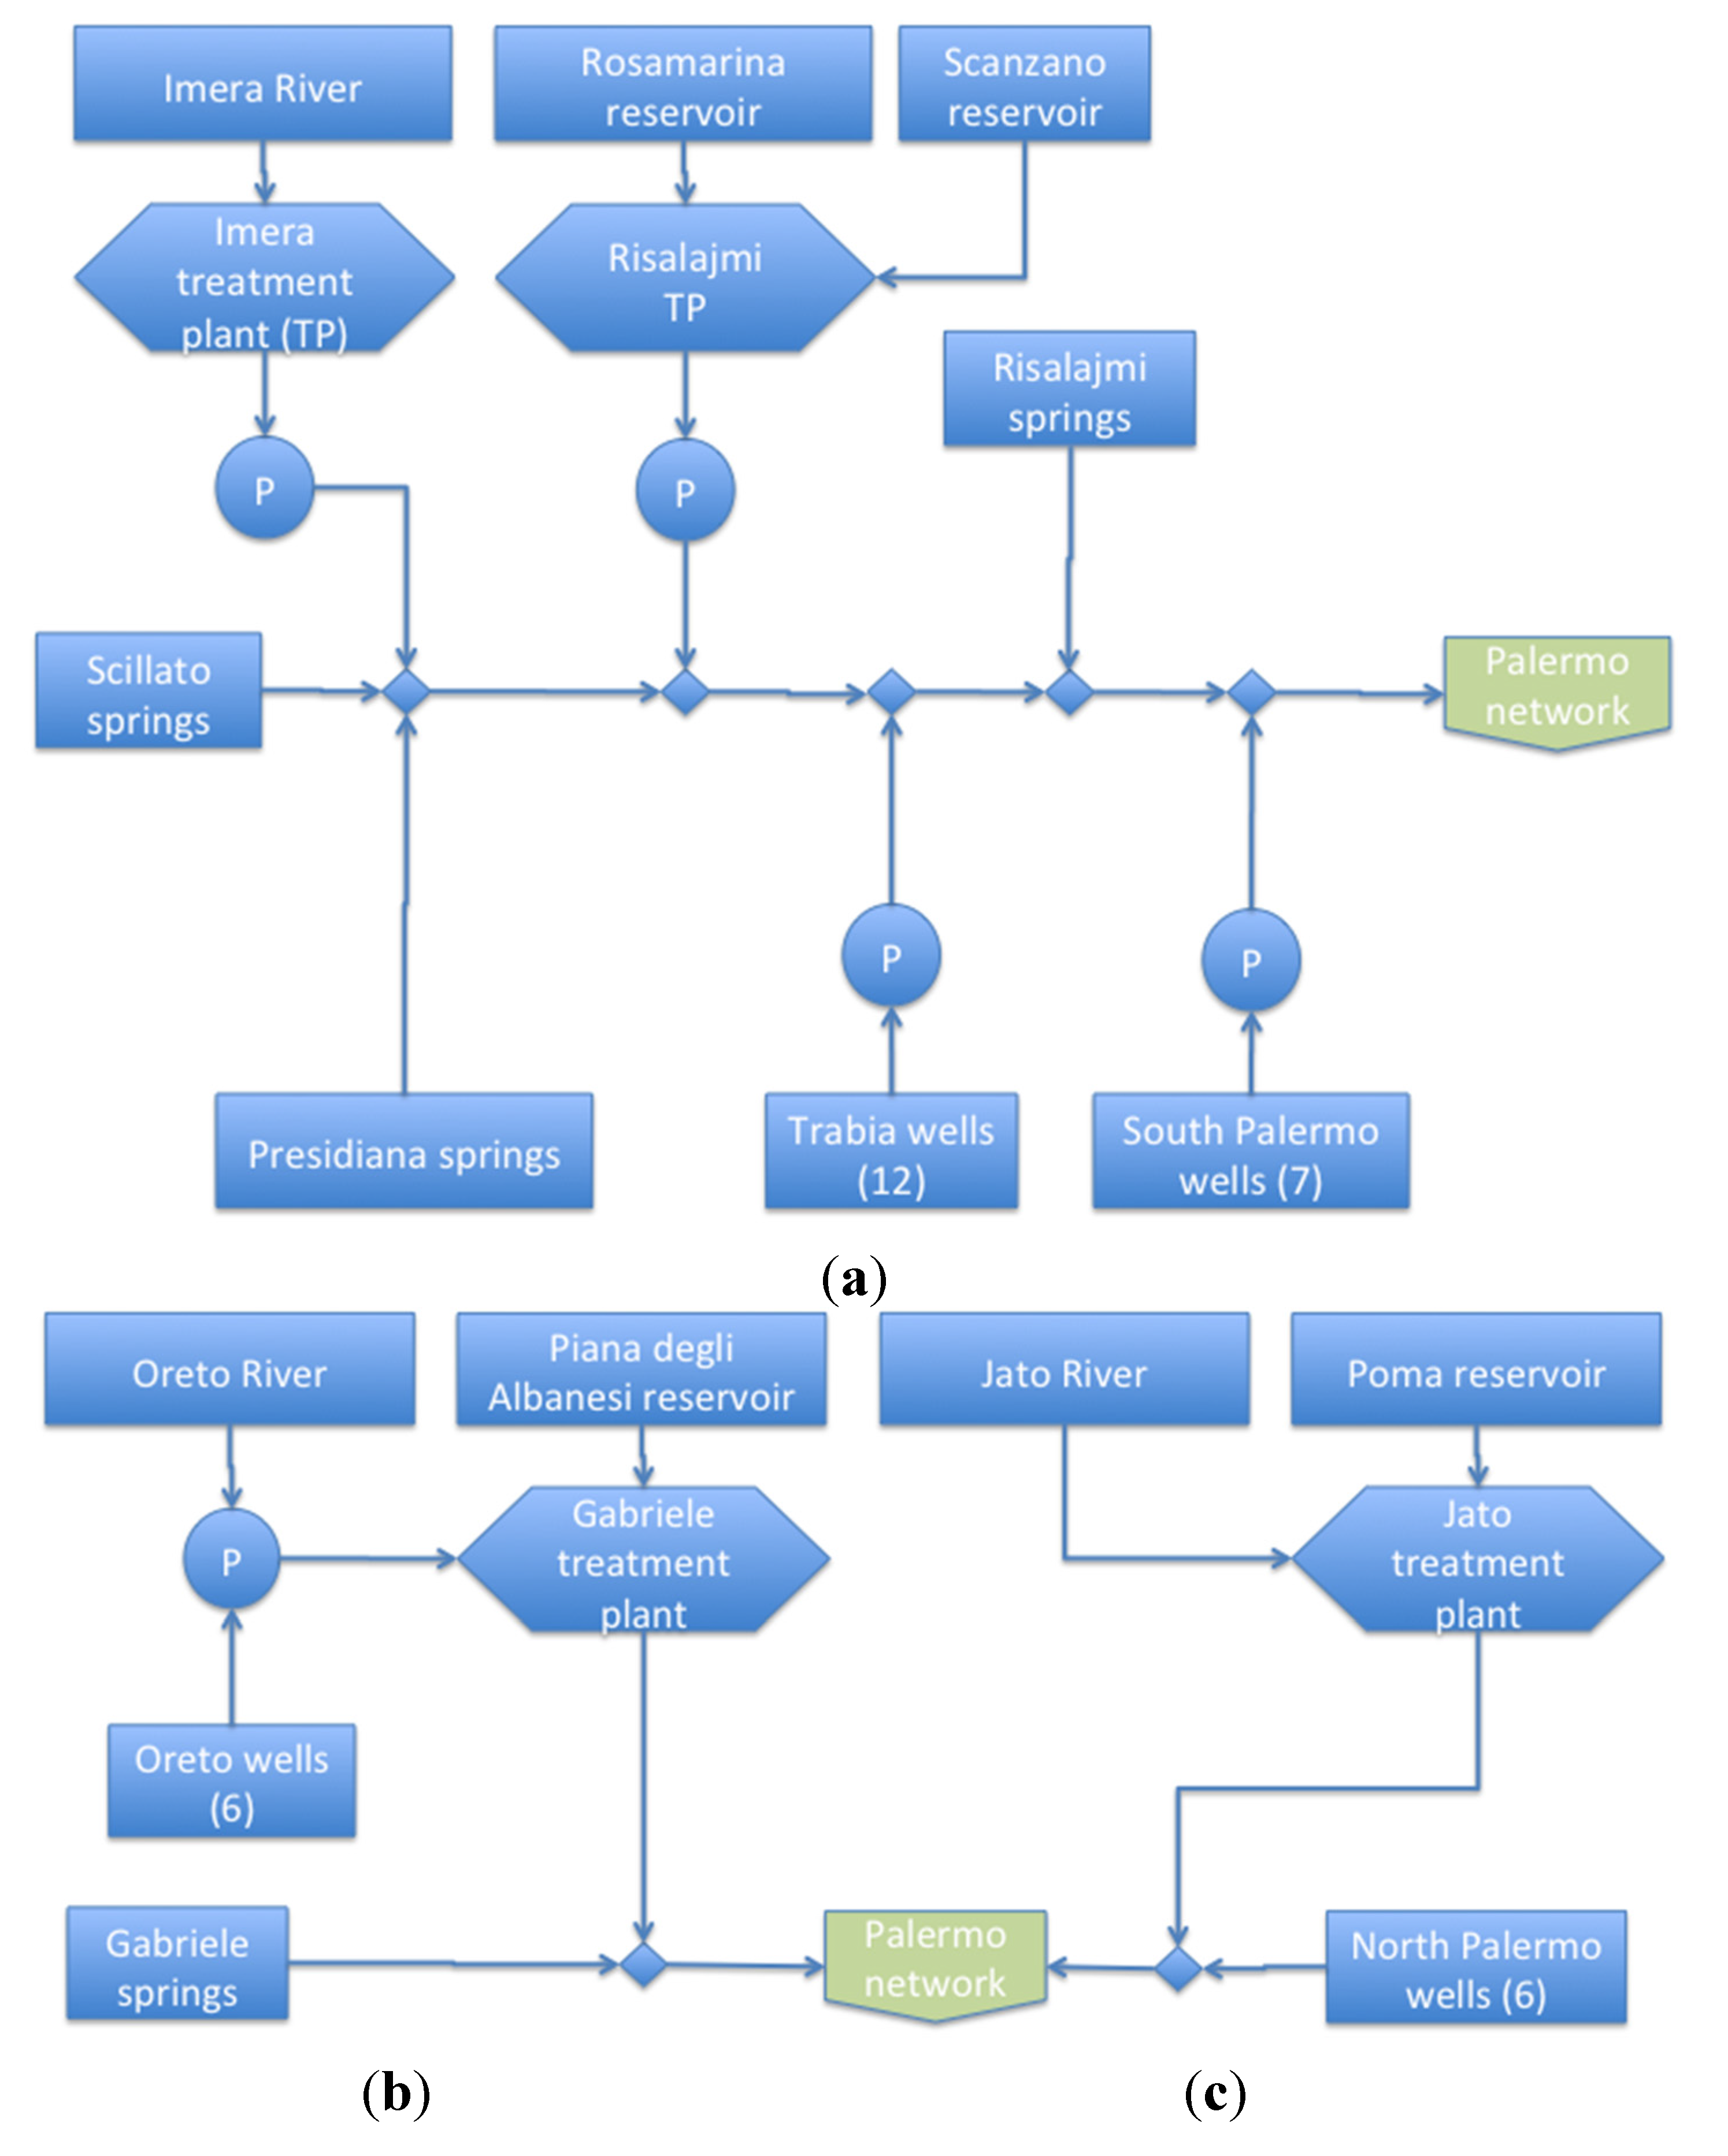
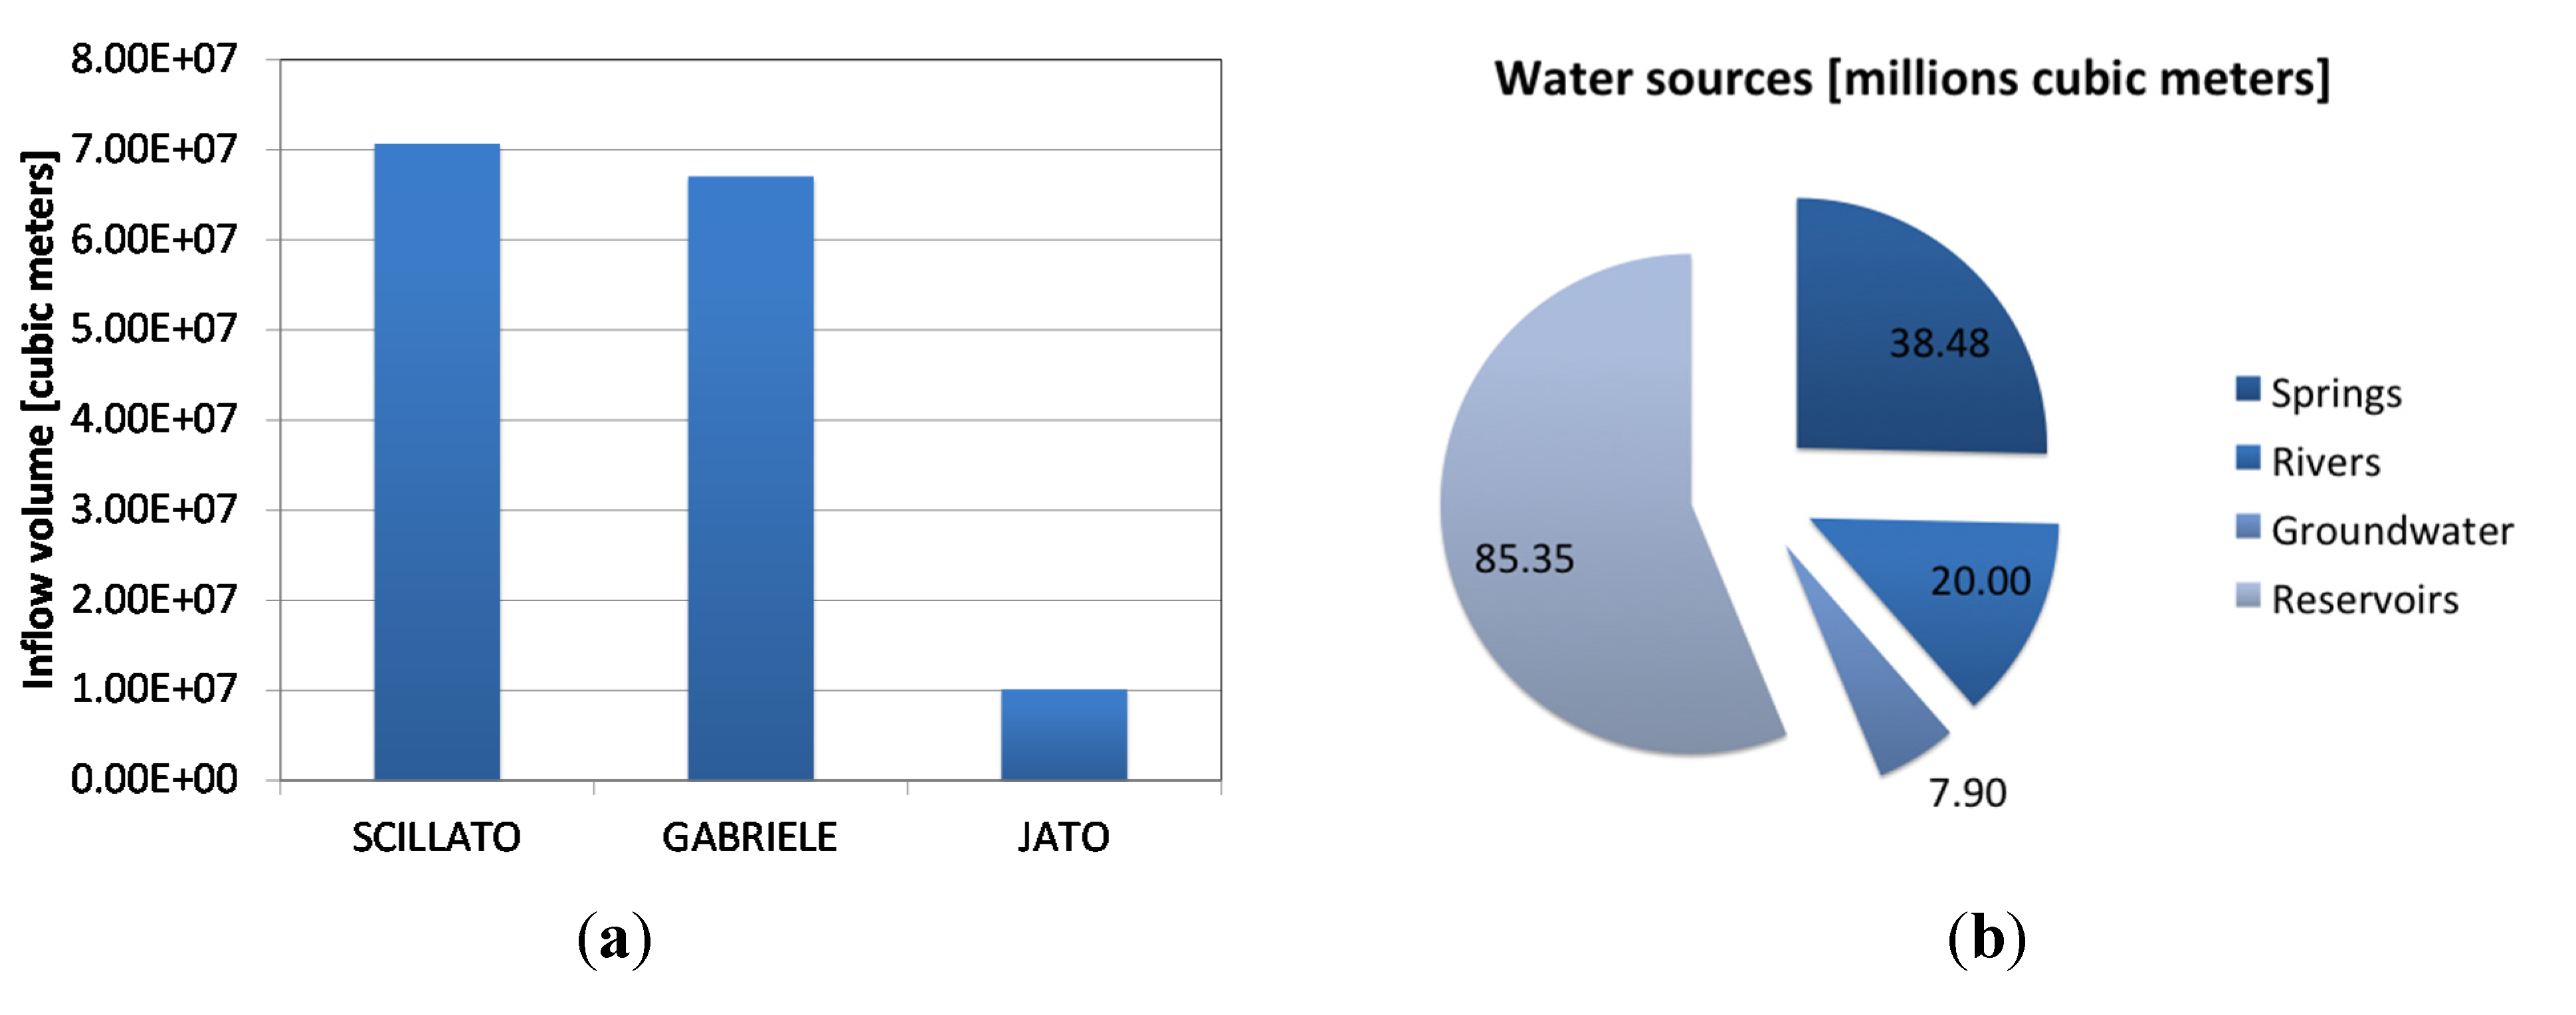
The Scillato system is the most complex with 3 springs, 19 wells, 2 treatment plants (connected to 3 reservoirs) and 4 in-line pumping stations. The Gabriele system is supplied by 1 spring, 6 wells, 1 treatment plant and 1 inline pumping station. The Jato system is supplied by 3 wells and 1 treatment plant with no in-line pumps.
Figure 3 shows a schematic representation of the three systems. The energy consumption in the Scillato system is mainly due to pumping (more than 70% of the total consumption is due to in-line pumps and wells); energy consumption in the other two systems is mainly due to treatment (especially in the Jato system, which is characterized by gravity pipes in which pressure energy is not recovered).
Figure 3.
Schematic representation of Scillato system (a); Gabriele system (b) and Jato system (c).
Figure 3.
Schematic representation of Scillato system (a); Gabriele system (b) and Jato system (c).
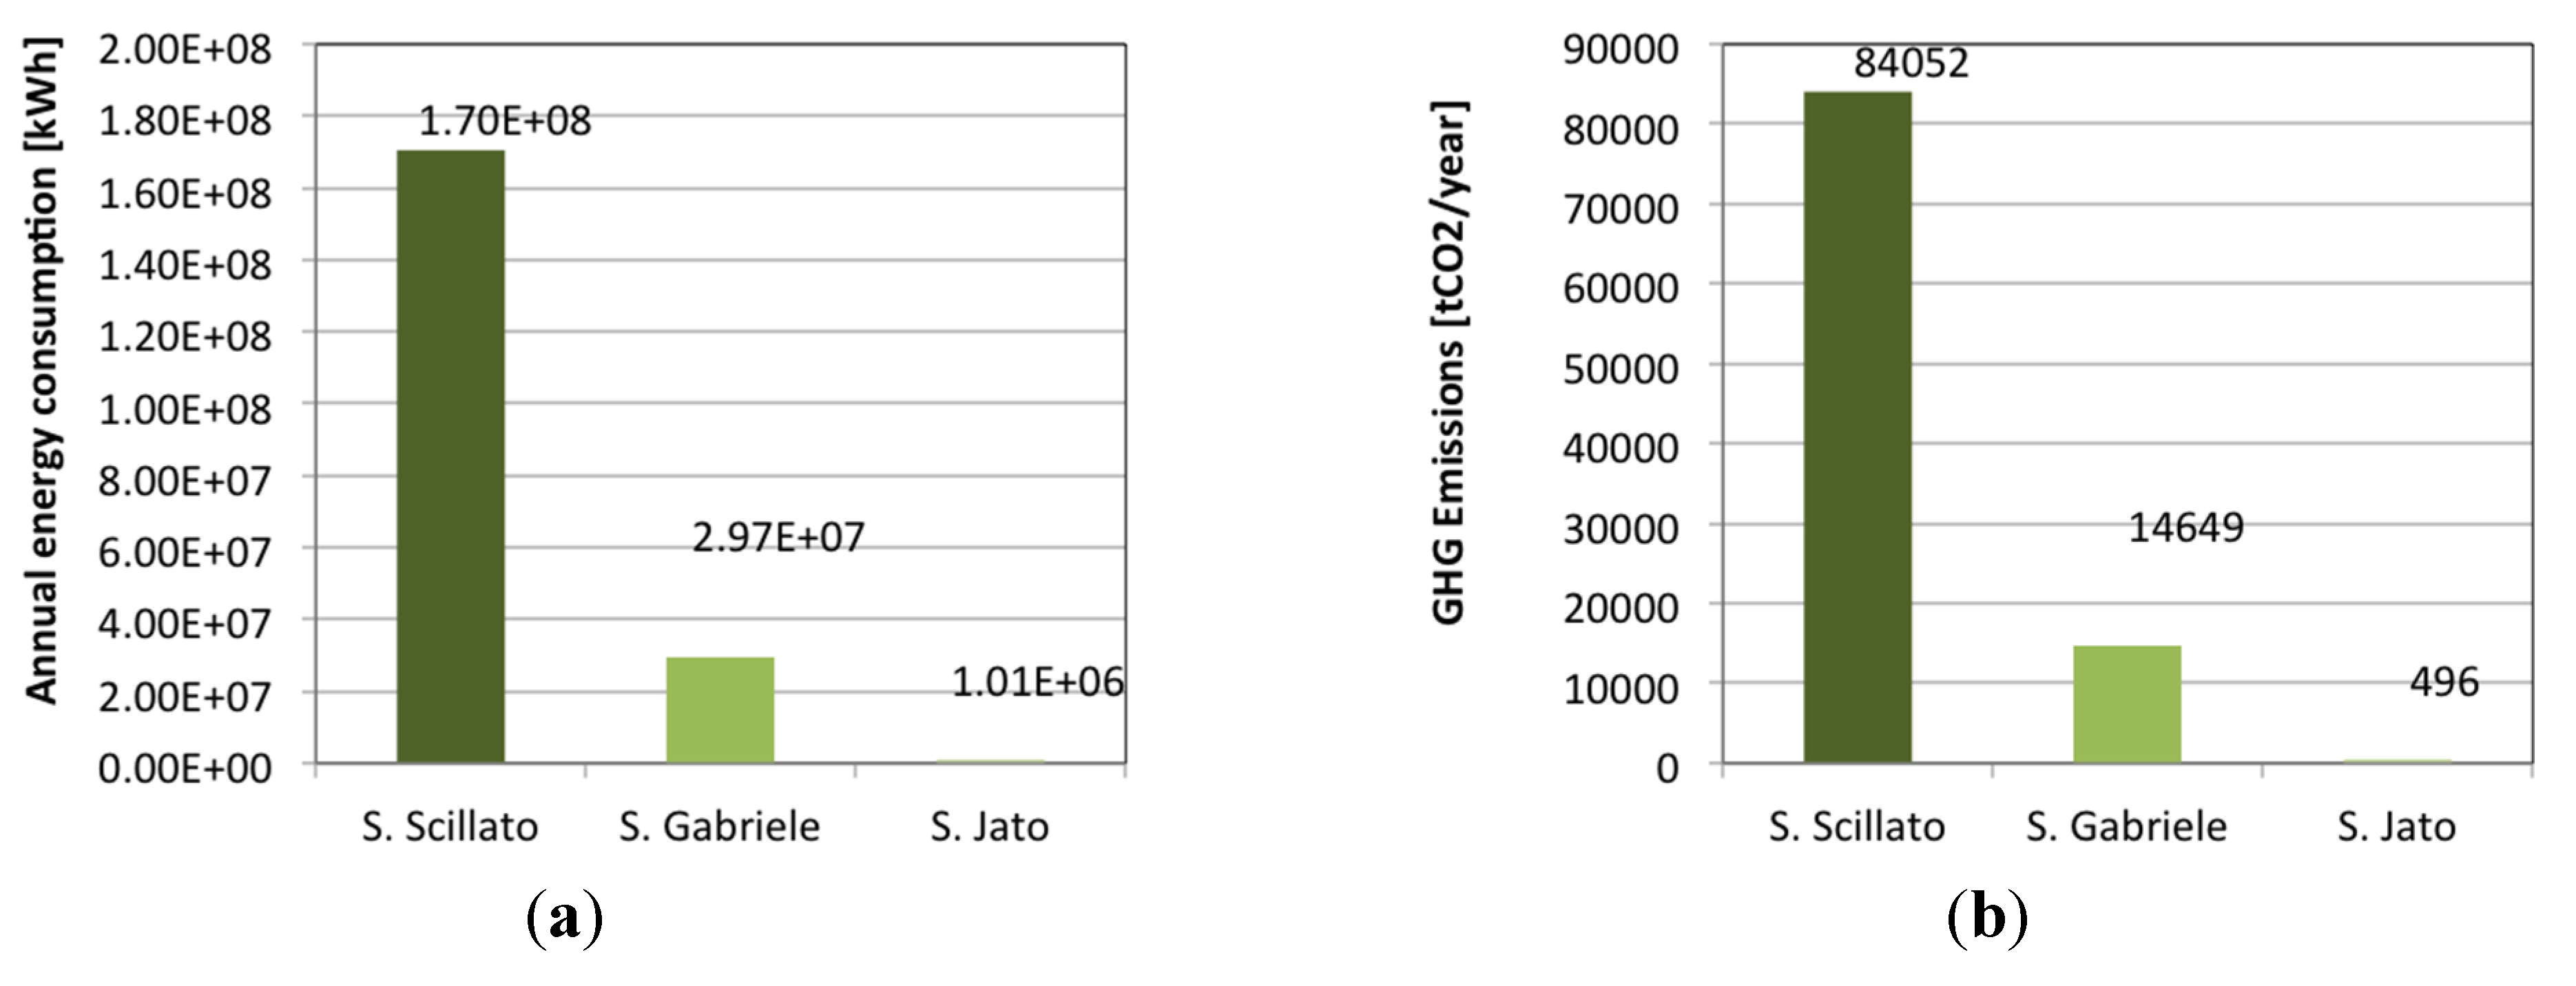
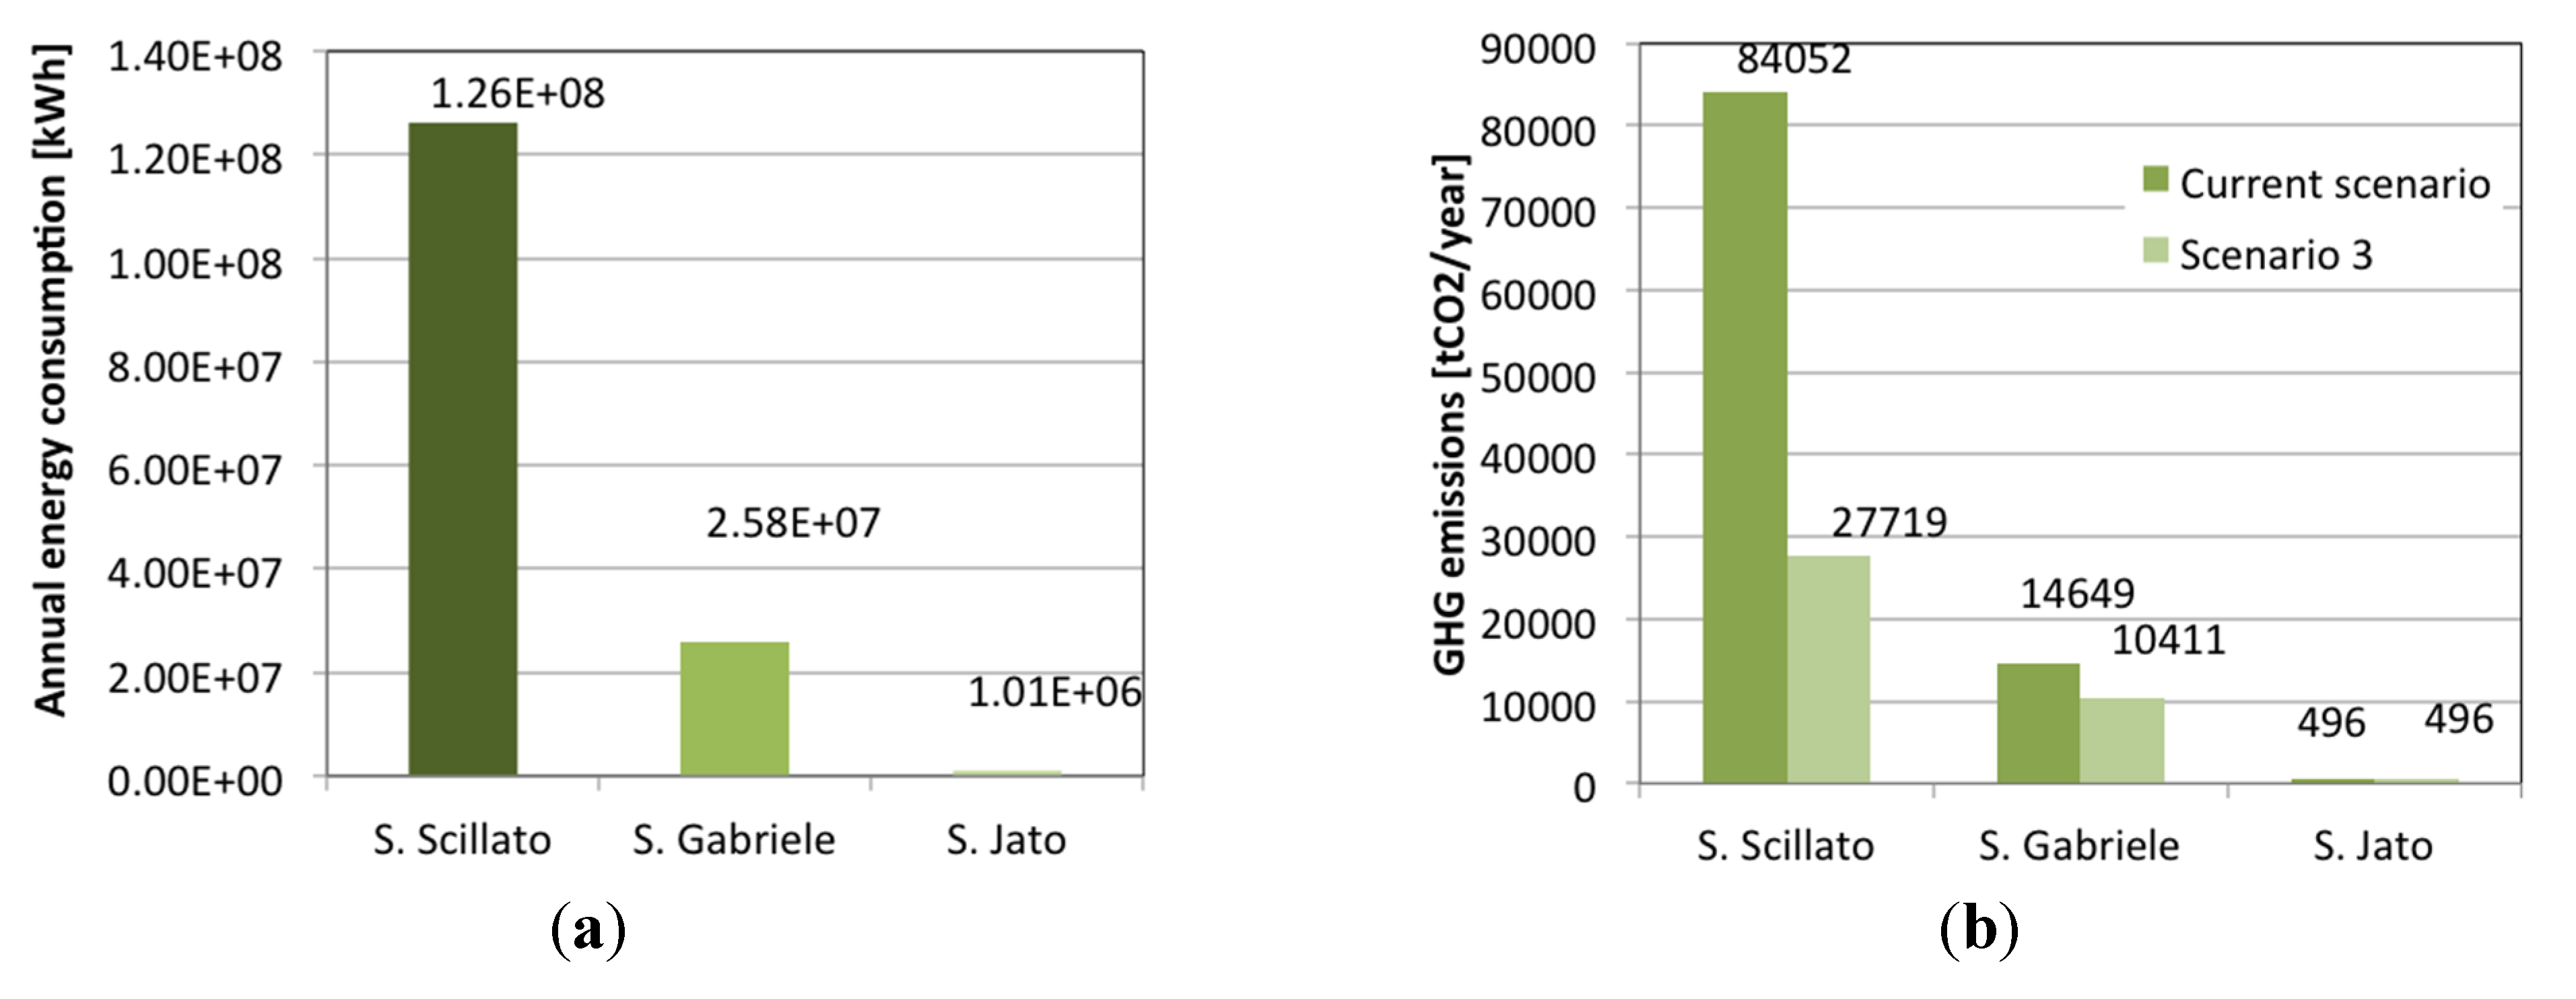
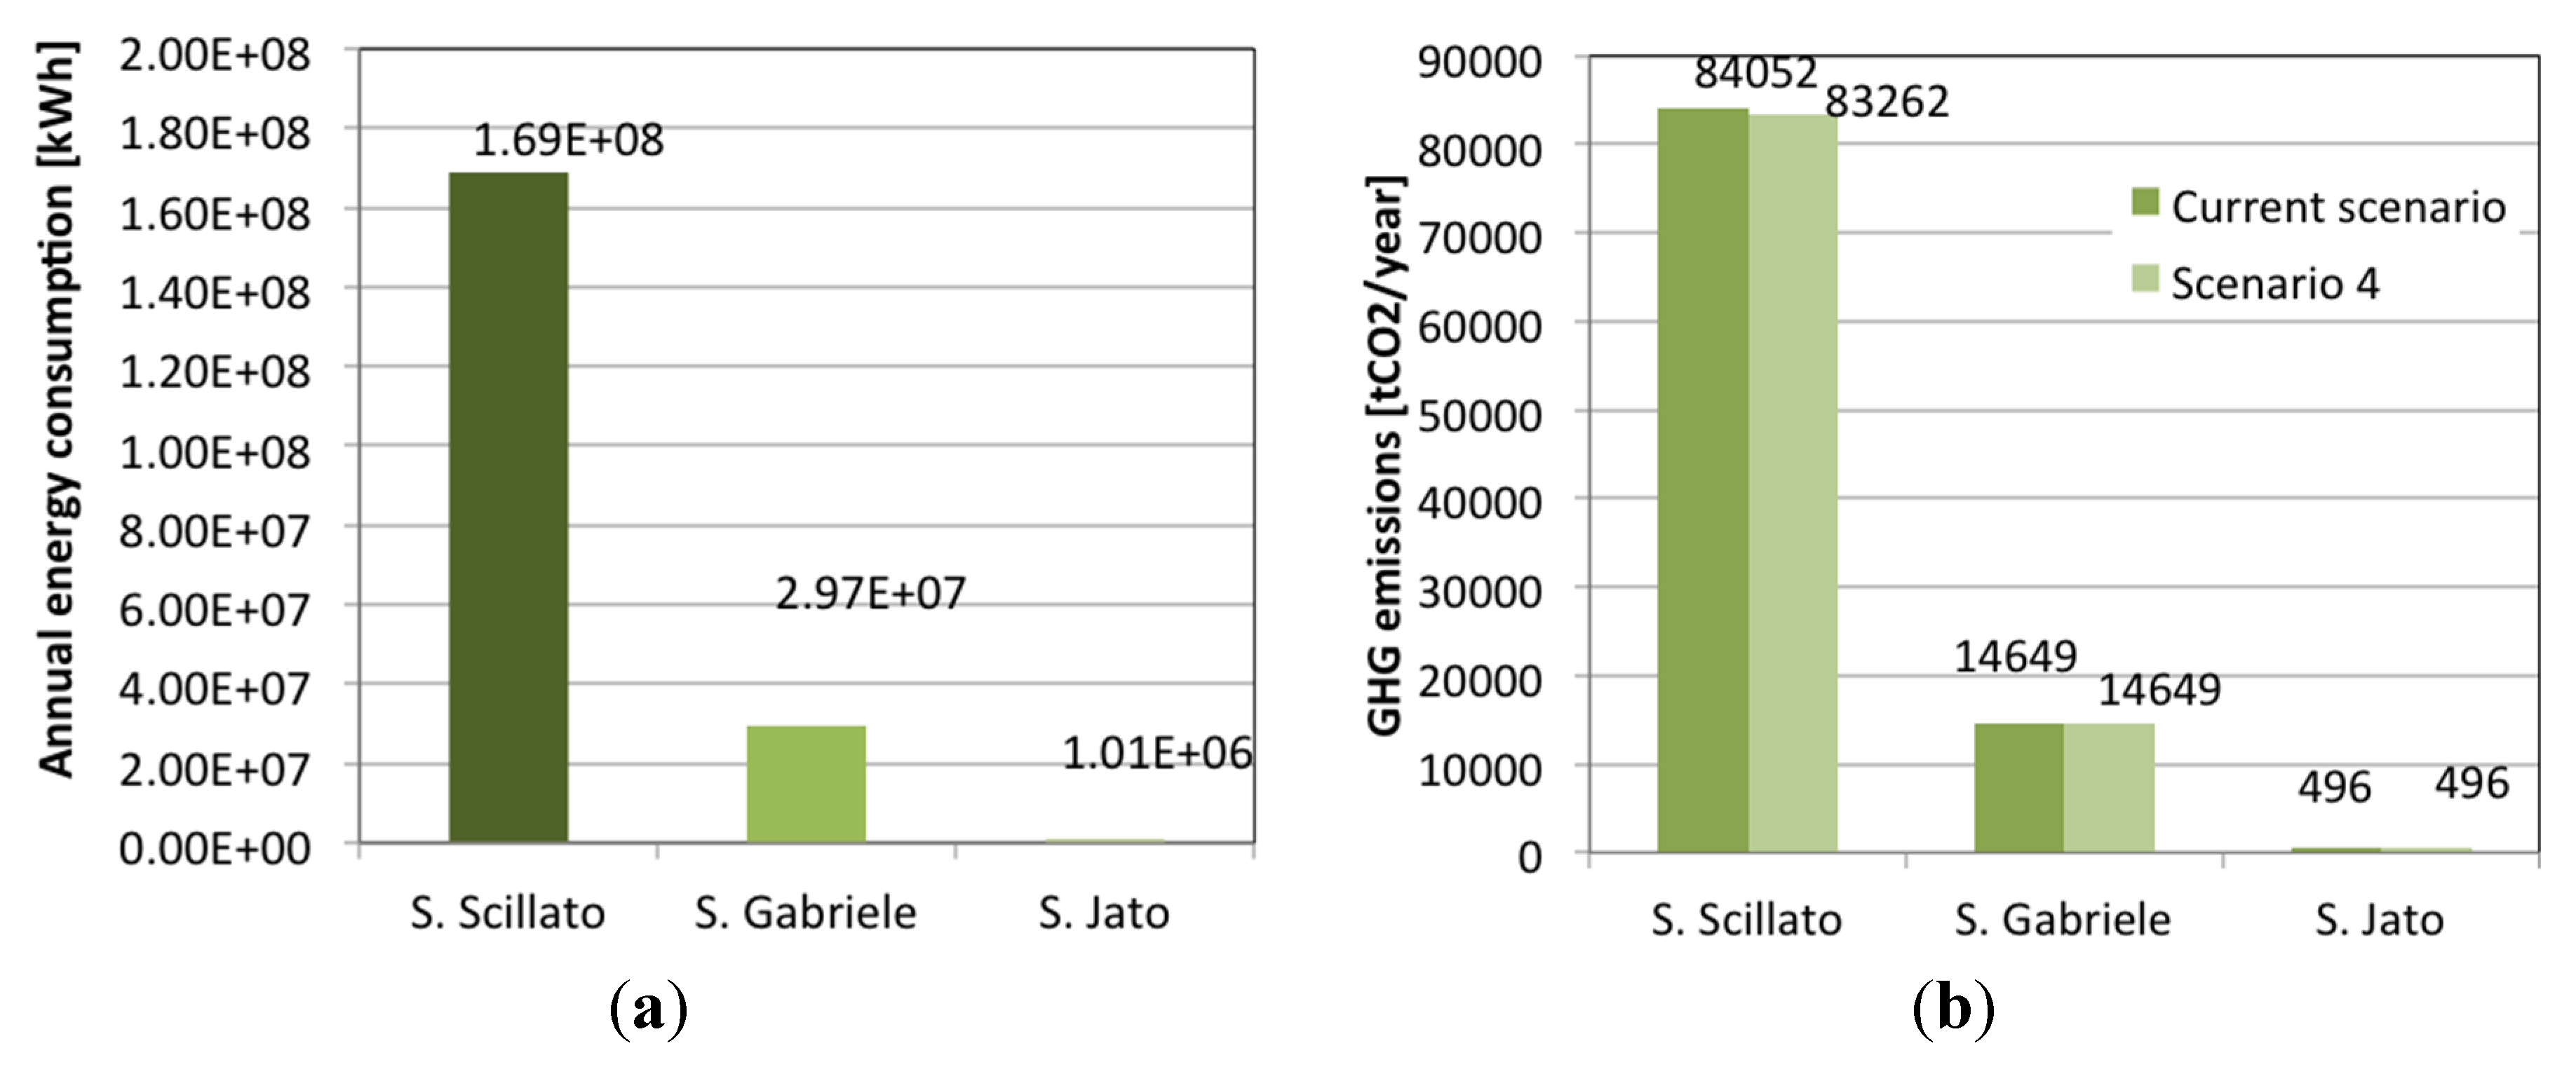
The total average energy consumption of the system is 1.99 × 10
8 kWh per year: 1.70 × 10
8 kWh are consumed by the Scillato system; 0.29 × 10
8 kWh by the Gabriele system and 1.01 × 10
6 kWh by the Jato system (
Figure 4). The value of indicator EN1 is 1.36 kWh/m
3 and the value of indicator EN2 is 251.25 kWh/(inhabitant·year). The value of indicator EN3 is 0.31 kWh/m
3, which represents the energy consumption due to leakage).
The current baseline shows that GHG production is mainly due to energy consumption (for pumping and treatment); the direct production of GHGs during treatment can be neglected in the present study.
Figure 4.
The breakdown of Vs volumes among the three different supply systems (a) and among the source types (b).
Figure 4.
The breakdown of Vs volumes among the three different supply systems (a) and among the source types (b).
The Water Manager does not pay for the water abstracted from resources being utilized; therefore, the main operational costs are for energy and maintenance. According to the National Energy Authority, the Italian energy mix has an average cost of 0.08 Euros/kWh and produces 0.49 kg eq. CO
2 per kWh, which results in the production of the following amounts of GHGs (
Figure 5):
Scillato System: 84,052 ton eq. CO2 per year and an economic cost of 13.6 MEuros
Gabriele System: 14,650 ton eq. CO2 per year and an economic cost of 2.32 MEuros
Jato System: 496 ton eq. CO2 per year and an economic cost of 0.08 MEuros
Figure 5.
The current energy consumption and carbon footprint of the three supply sub-systems.
Figure 5.
The current energy consumption and carbon footprint of the three supply sub-systems.
One unit of GHG production (indicator CO1) is equal to 0.41 kg CO2eq/m3 of system input water volume. The value of performance indicator CO2 is 124 kg CO2eq/(inhabitant·year) and the value of indicator CO3 is 0.095 kg CO2eq/m3; these values show how leakage contributes to GHG production.
The system is characterized by a large amount of leakage and unused hydraulic potential because the springs and reservoirs are elevated with respect to the urban tanks. In fact, reservoirs around the city have an average water level between 135 and 260 m above the average sea level and the springs are located at elevations of between 380 and 110 m. Urban tanks are located around the city at elevations of between 90 and 50 m, making it possible to exploit hydraulic head to produce energy to be used in the supply process. In addition, leakage reduction programmes can be overseen as possible solutions for reducing the potable water demand and, therefore, reducing costs.
4. Results and Discussion
The situation of the Palermo water supply system can be optimized by recovering pressure energy or reducing water leakages that produce energy and economic losses. The present amount of water lost (approximately 34.4 Mm
3 per year) produces an annual economic loss of greater than 8 MEuros (only considering the expense of energy for treatment and transport); over 20,000 ton eq. CO
2 per year can be avoided by halving the amount of leakage in the system. In the present situation, four possible scenarios were identified:
Scenario 1—installation of turbines to recover hydraulic head energy: Turbines are installed downstream of each excess hydraulic head higher than 2 atm (at urban tank inlets and at the treatment plant inlet).
Scenario 2—replacement of a part of the Scillato pipeline: Replacing the old steel pipe is proposed to reduce leakage in that system; in this scenario, the same number of turbines is introduced as in Scenario 1.
Scenario 3—replacement of old pumps with high efficiency ones: The pumping stations are 30 years old on average, and their efficiency is between 60% and 70%; new pumps and motors can reach efficiencies of 80%–85%, thus reducing energy consumption.
Scenario 4—installation of solar panels in the available areas of the existing treatment plants: Such a solution does not require any work on the hydraulic system and is a common practice for reducing the operational costs of water managers in Italy.
The scenarios were compared in terms of investment costs and performance indicators aimed at leakage analysis, estimation of energy consumption and GHG emission quantification.
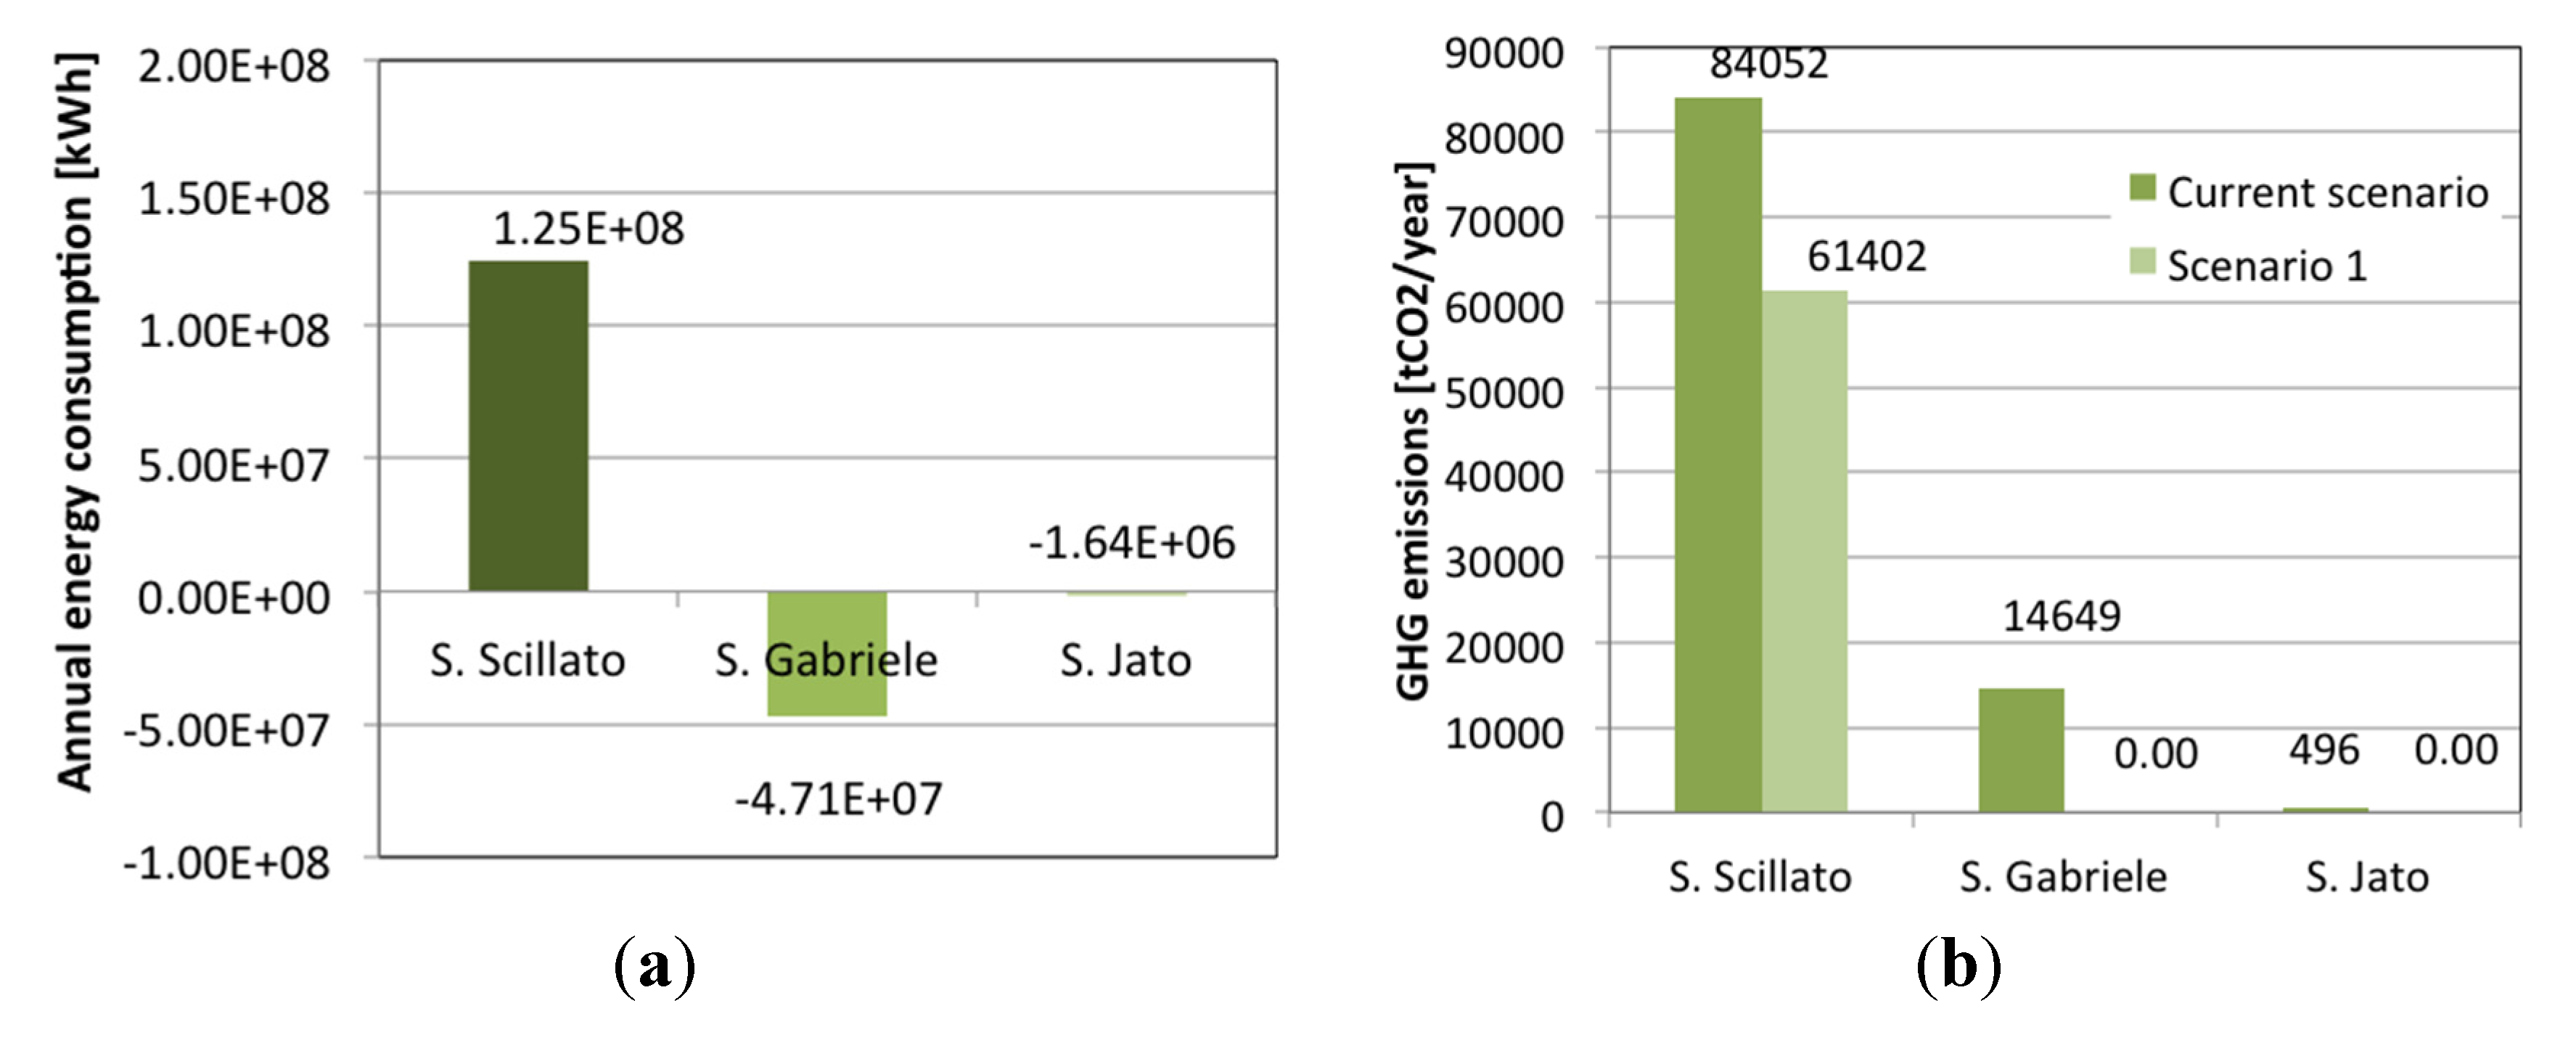
In Scenario 1, 9 turbines were introduced: 2 in the Scillato System (with a total installed power capacity of 2.2 MW), 4 in the Gabriele System (with a total installed power capacity of 4.1 MW) and 3 in the Jato System (with a total installed power capacity of 440 kW). The total cost of this investment is 18.7 MEuros.
The introduction of turbines reduces the energy consumption by 55%: the Scillato system’s energy requirement was reduced by 30% and the Gabriele and Jato systems started producing more energy than they consume. The latter systems are primarily gravity-based; a small amount of energy is used for pumping and large residual hydraulic head that can be used for turbines. The elevation of Jato springs is 260 m above sea level and the city reservoirs are approximately 70 m above sea level; the Gabriele wells are 350 m above sea level and the connected reservoirs are approximately 110 m above sea level. These hydraulic potentials allow enough additional energy to be recovered to cover all of the consumption of the two sub-systems providing additional energy for the Scillato system.
The amount of GHGs produced by the Jato and Gabriele systems is reduced to zero and the amount produced by the Scillato system is reduced to 61,402 ton eq. CO2 per year. The average unit production of GHGs is reduced to 0.26 kg CO2eq/m3 (indicator CO1). Water losses are amplified by the increase in the average system pressure due to the introduction of turbines. In Scenario 1, the average system pressure is 4.5 atm and the UARL is 3.09 Mm3.
The CARL is increased to 39,620 Mm
3 per year; therefore, an increase in the supplied water volume
Vs of 153,780 Mm
3 is necessary. This scenario is also characterized by a sharp decrease in energy consumption and GHG production alongside increased leakage (
Figure 6 and
Table 1).
WL3 is the only indicator that shows an increase in performance because unavoidable leakage (UARL) increases more than loss (CARL) due to the increase in the average system pressure. The unit energy consumption (EN1) is significantly reduced, as is the amount of energy lost due to leakages (EN3). GHG production is decreased in accordance with energy consumption.
Figure 6.
Performance indicators: energy consumption (a) and GHG emission reduction (b) in Scenario 1.
Figure 6.
Performance indicators: energy consumption (a) and GHG emission reduction (b) in Scenario 1.
Table 1.
Performance indicators in all of the mitigation scenarios and in the initial condition (Scenario 0).
Table 1.
Performance indicators in all of the mitigation scenarios and in the initial condition (Scenario 0).
| Indicator | Scen. 0 | Scen. 1 | Scen. 2 | Scen. 3 | Scen. 4 |
|---|
| WL1 (-) | 0.231 | 0.258 | 0.190 | 0.2313 | 0.231 |
| WL2 (m3/(km·year)) | 5.15 | 5.74 | 4.26 | 5.15 | 5.15 |
| WL3 (-) | 13.16 | 12.82 | 11.67 | 13.16 | 13.16 |
| EN1 (kWh/m3) | 1.360 | 0.496 | 0.423 | 0.532 | 1.358 |
| EN2 (kWh/(inhabitants·year)) | 251.3 | 91.63 | 78.29 | 98.28 | 249.6 |
| EN3 (kWh/m3) | 0.310 | 0.128 | 0.081 | 0.161 | 0.308 |
| CO1 (kg CO2eq/m3) | 0.41 | 0.26 | 0.22 | 0.33 | 0.40 |
| CO2 (kg CO2eq/(inhabitants·year)) | 124.0 | 48.03 | 41.02 | 61.00 | 123.1 |
| CO3 (kg CO2eq/m3) | 0.095 | 0.07 | 0.04 | 0.09 | 0.094 |
In Scenario 2, the replacement of 52.4 km of old steel pipe is proposed in addition to the introduction of 9 turbines. Thanks to the replacement, flows in the main pipe are reduced by 35% and leakage is reduced to 17.2% in that system. The flow reduction is compensated by an increase of 27% in the hydraulic potential at urban tank inlets, reducing the overall energy recovery at the Scillato turbines by 17.5%. The pipe replacement has a high capital cost (61.5 MEuros) that is not compensated by the annual reduction in energy costs (1.2 MEuros per year). The small impact on energy costs is because the reduction of the flow in the system reduces the amount of energy consumed and produced. This scenario performs well in all areas, even though its high implementation costs are not covered by the increase in energy savings.
Because it is not viable on an economic level, Scenario 2 cannot be considered an option even if the reduction in GHG production is much greater than that of Scenario 1 and, on average, the unit production of GHGs is reduced to 0.22 kg CO2eq/m3.
Scenario 3 requires the replacement of all of the pumps and propellers in the system with high-efficiency ones. The current weighted pumping efficiency is 62% and, according to market standards, new pumps have efficiencies between 80% and 85% (with a weighted average of 82%). Considering solely the substitution of pumps and propellers, the investment cost is 22.1 MEuros, which results in a reduction in energy costs of 4.7 MEuros per year. In Scenario 3, on average, the unit production of GHGs is reduced to 0.21 kg CO
2eq/m
3. The impact of this scenario on the Jato system is null because there are no pumping stations to be modified. This scenario’s impact on the Gabriele system is also low. Scenario 3 is ineffective in terms of leakage performance (
Figure 7 and
Table 1). The introduction of variable speed drives (VSD) in the pumps could reduce the amount of energy consumed without replacing the pumps. This possibility was investigated providing results similar to the presented Scenario 3.
Figure 7.
Indicators, energy consumption (a) and GHG emission (b) reduction in Scenario 3.
Figure 7.
Indicators, energy consumption (a) and GHG emission (b) reduction in Scenario 3.
Finally, in Scenario 4, solar panels are introduced in the areas where treatment plants are located. This measure was applied to 2800 m
2 with a production of approximately 600 kWh/m
2 per year. Solar panels are not able to influence the system’s energy balance by providing 1.68 × 10
6 kWh per year. As shown in
Figure 7, this scenario does not have a relevant impact on energy consumption or GHG emission. This result is primarily because the amount of energy produced by the solar panels is insufficient for the system’s energy demands. The indicators do not report a significant change from the present situation (
Figure 8 and
Table 1).
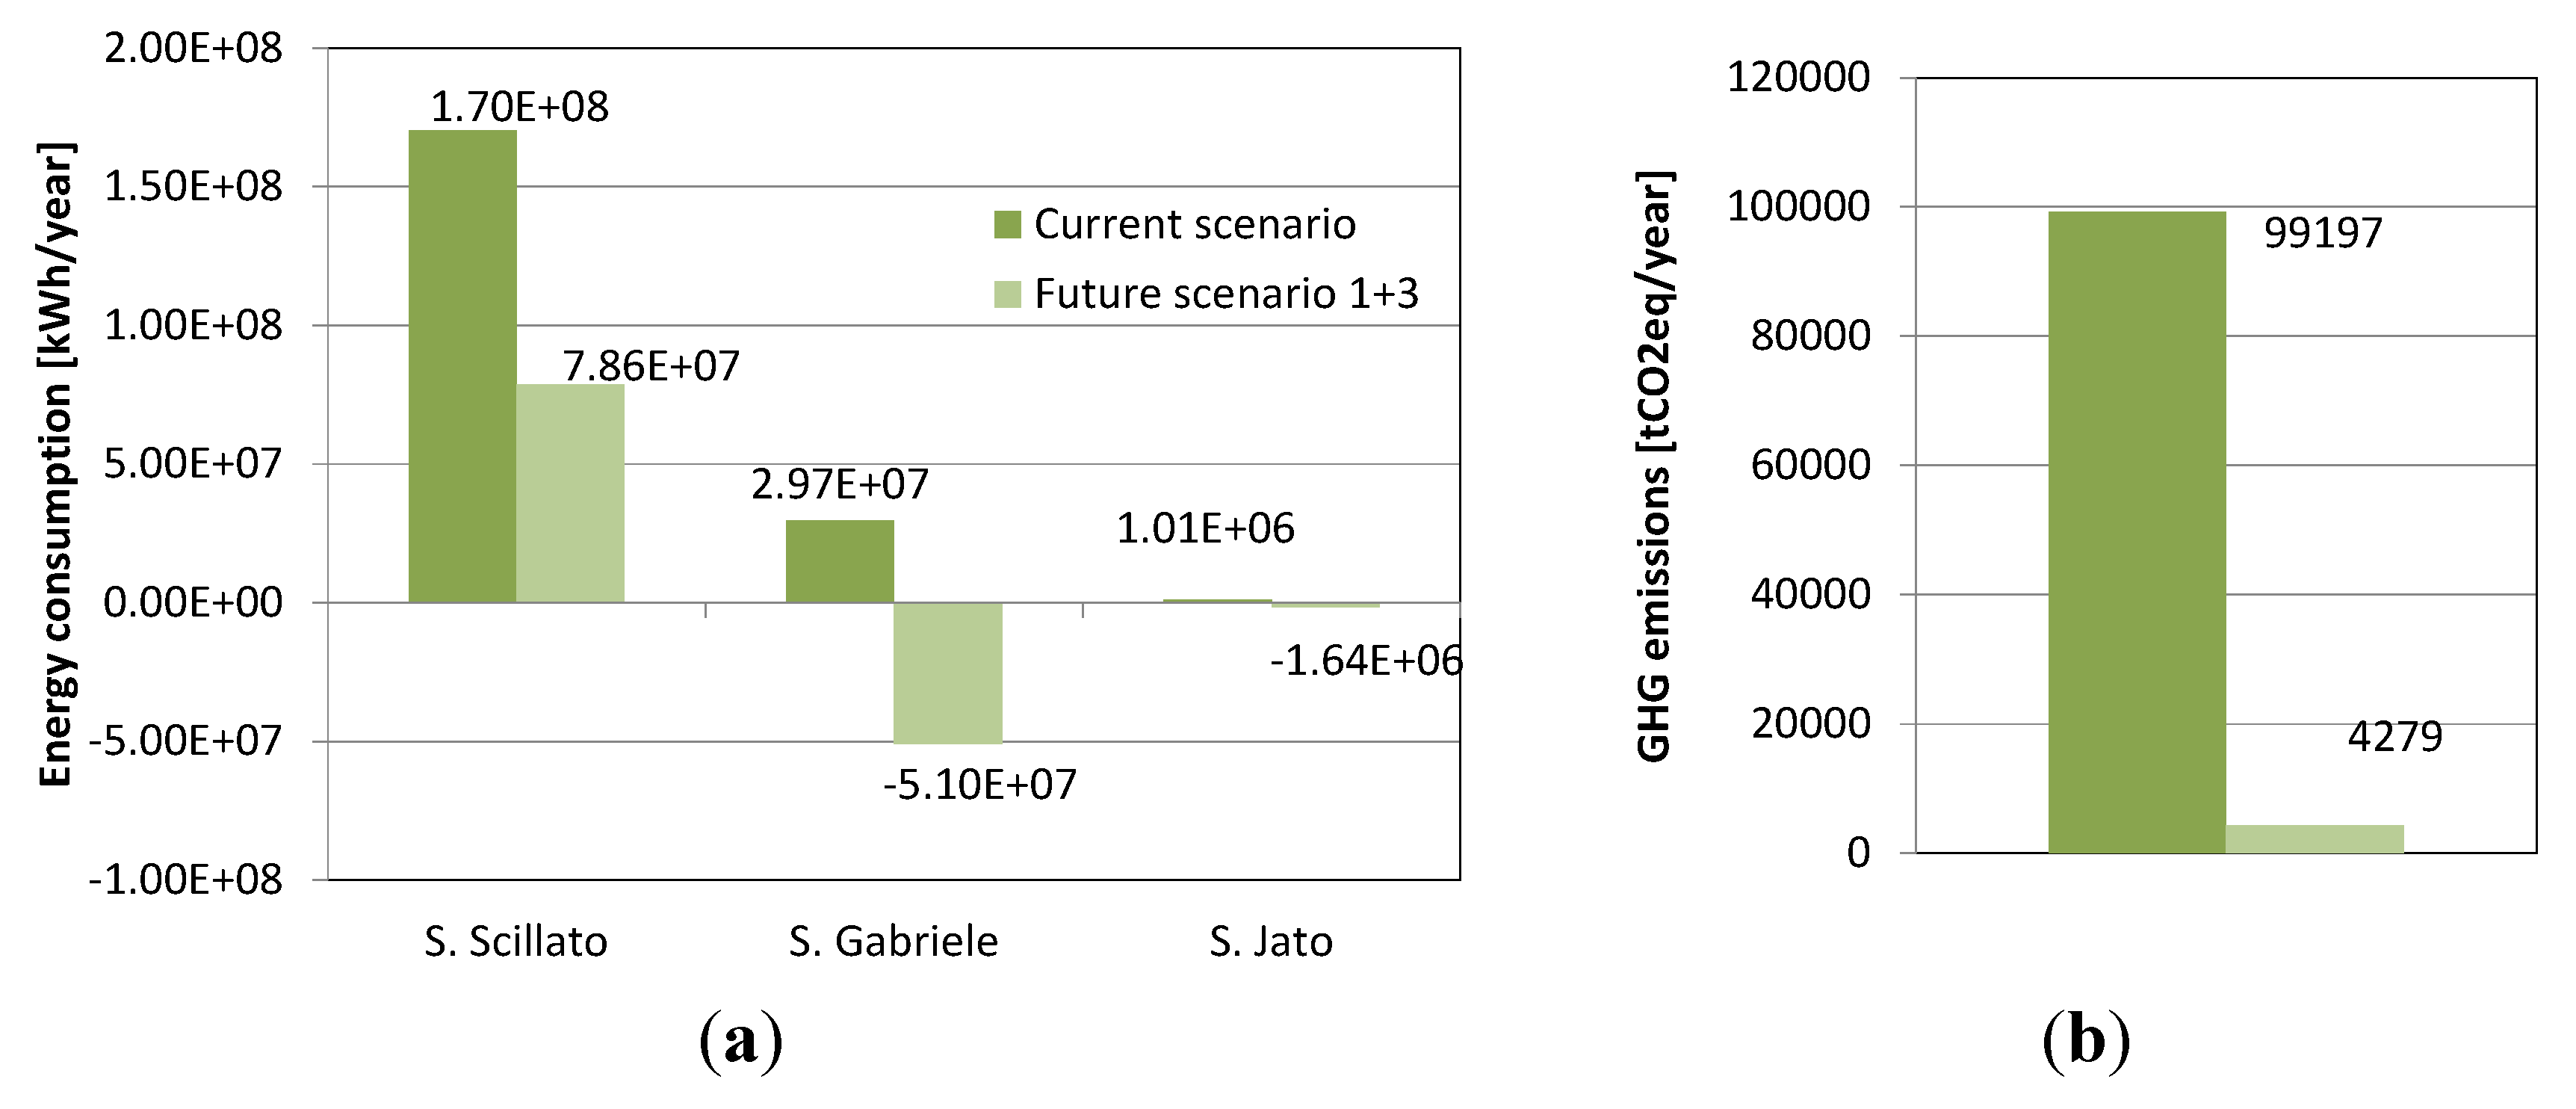
In conclusion, a combination of Scenario 1 and Scenario 3 was considered because those are the most promising scenarios in terms of offering a good combination of energy saving and energy recovery measures.
Figure 9 shows the reductions in energy consumption and GHG emission. On average, the unit production of GHG is reduced to 0.07 kg CO
2eq/m
3, leading to a reduction of 83% in the overall energy consumption of the water supply service.
Figure 8.
Energy consumption (a) and GHG emission reduction (b) in Scenario 4.
Figure 8.
Energy consumption (a) and GHG emission reduction (b) in Scenario 4.
Figure 9.
A comparison between energy consumption (a) and GHG (b) in the present situation and when a Scenarios 1 and 3 is adopted.
Figure 9.
A comparison between energy consumption (a) and GHG (b) in the present situation and when a Scenarios 1 and 3 is adopted.
5. Conclusions
In the present paper, a comprehensive technical and economic analysis was presented to analyse possible mitigation scenarios for an urban water supply system. The Performance Indicators were applied to the complex system supplying the city of Palermo, which has slightly less than one million inhabitants.
Scenarios were considered that involve energy recovery, energy-saving solutions and water loss reduction. The scenarios were compared with regard to capital and energy costs and GHG emissions.
The present situation is characterized by a highly inefficient system in which leakage is much greater than the optimal level, potential energy is lost in gravity pipes and energy is used to run pumping stations in a system that leaks 23% of the supplied volume.
A combination of energy recovery and energy-saving solutions was proposed to reduce energy costs by 83% and to change CO2eq production per cubic metre of supplied water from 0.41 to 0.07 kg CO2eq/m3.
In general, the method used was shown to be a powerful tool for comparing mitigation solutions from a multi-objective perspective involving economic and environmental aspects. The multi-objective approach is useful for understanding the different interactions between energy balance and water balance optimization and for obtaining global insight into the impact of mitigation scenarios on the process. The use of simple single objectives aimed to water recovery or energy recovery cannot give a complete picture of the complex interconnection between energy consumption and water leakages so reducing the reliability of the evaluation of mitigation efficiency.


