
Performance Analysis of an Evaporator for a Diesel Engine–Organic Rankine Cycle (ORC) Combined System and Influence of Pressure Drop on the Diesel Engine Operating Characteristics

Abstract
:1. Introduction
2. Numerical Simulation and Performance Analysis of Evaporator
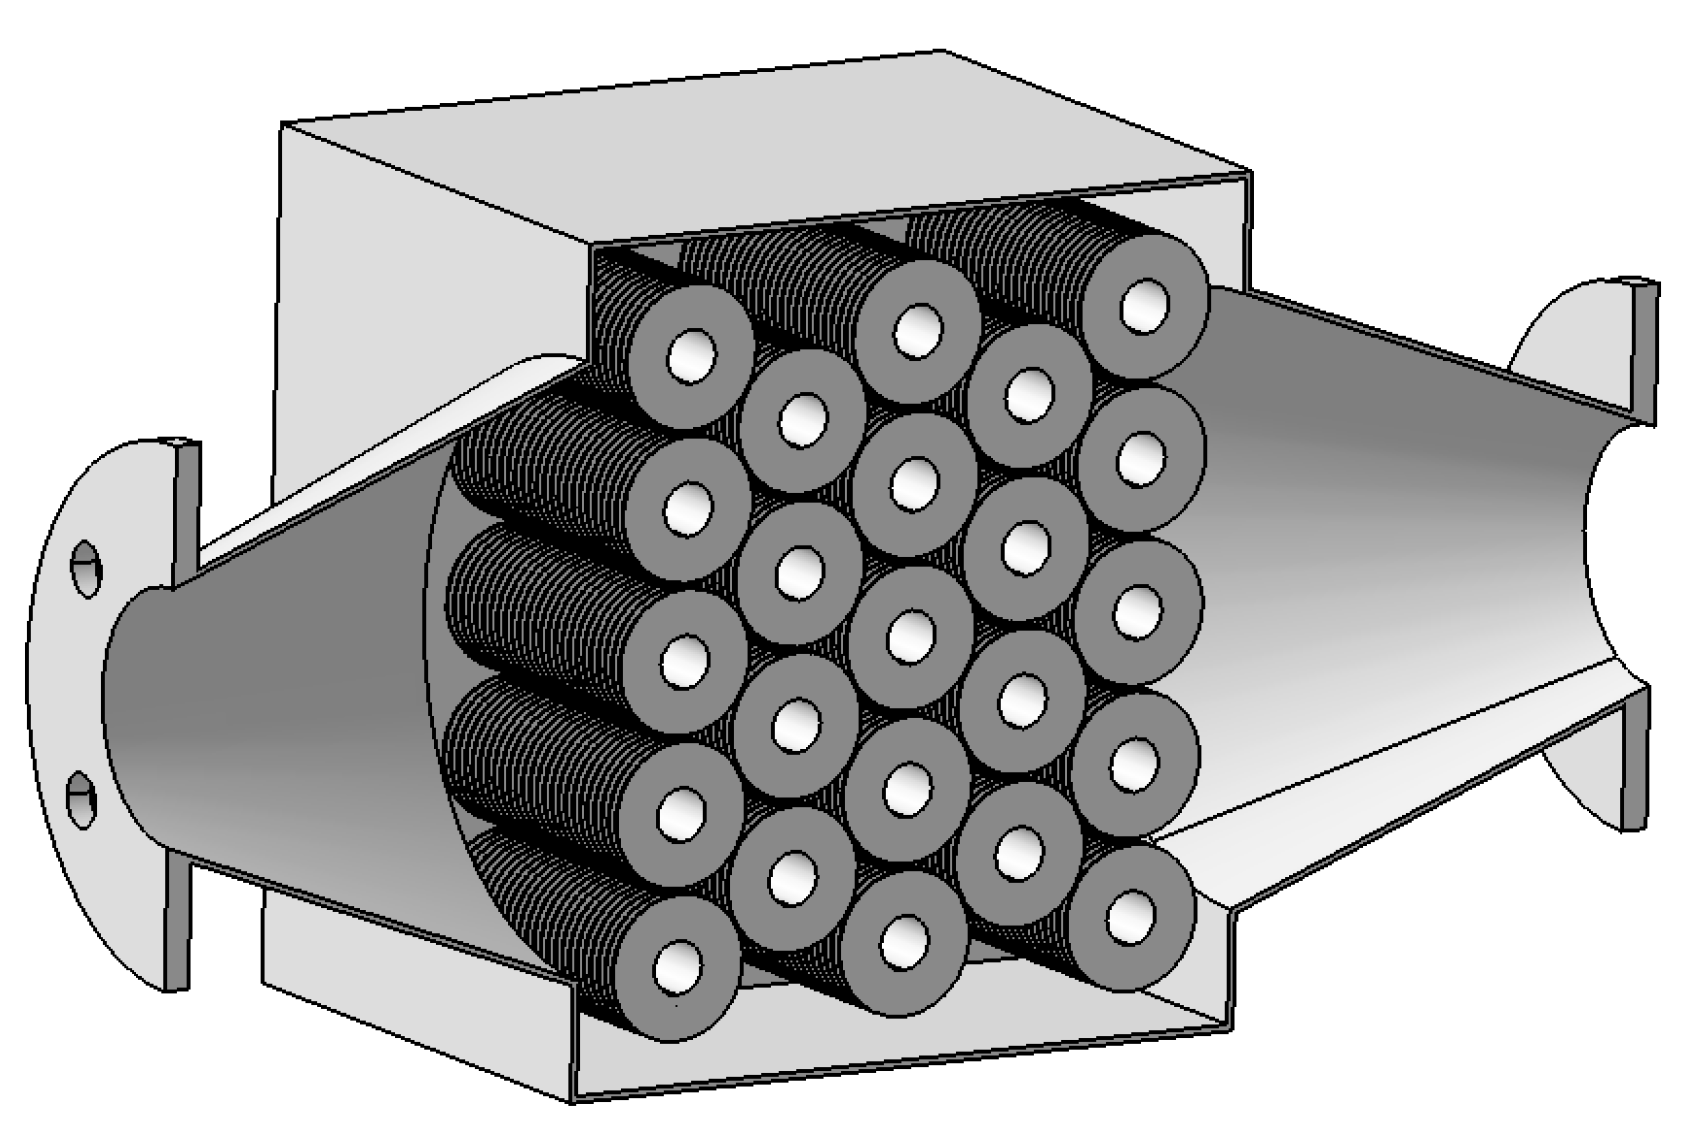
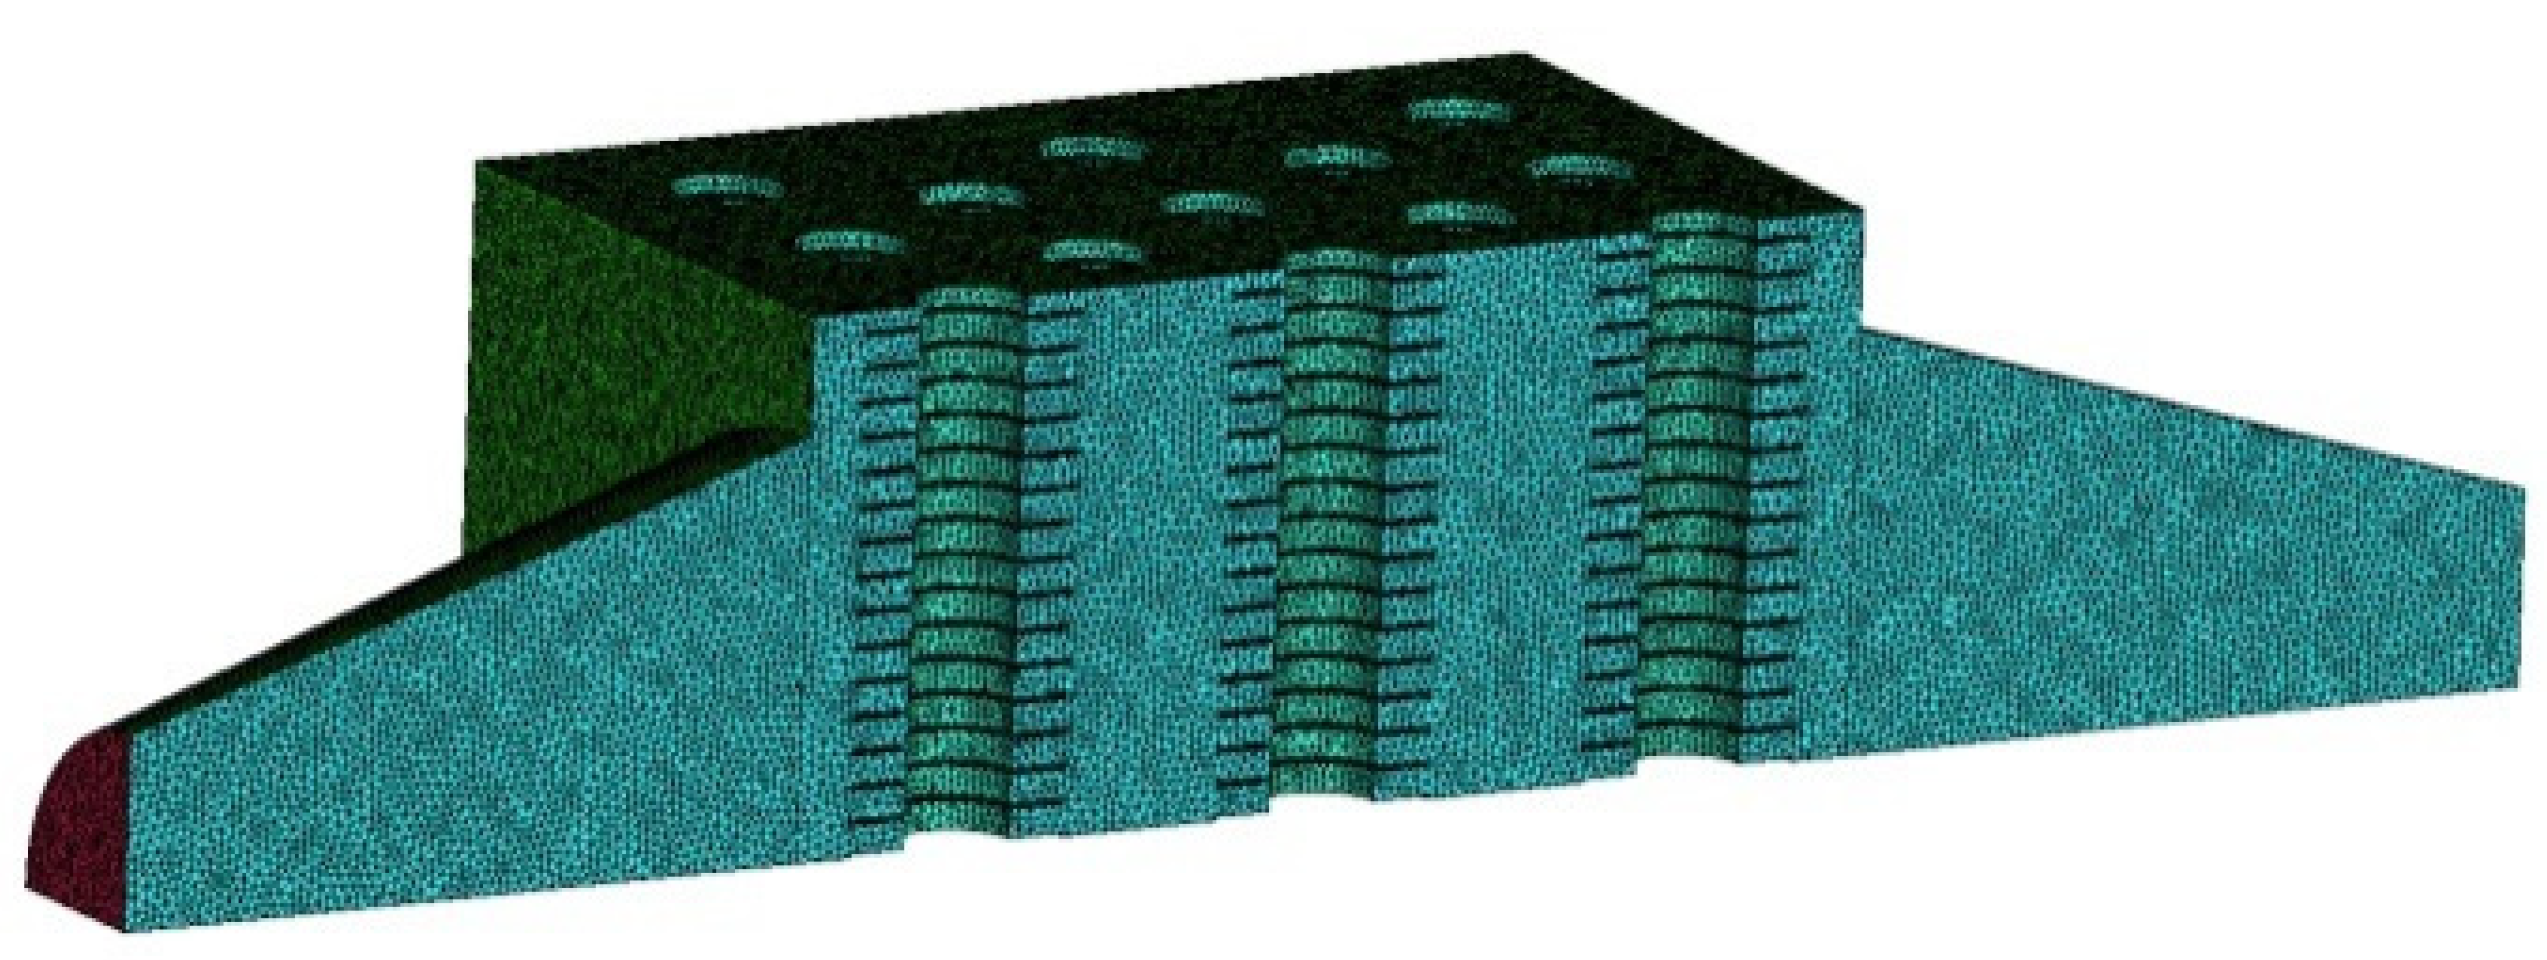
2.1. Physical Model of Evaporator


| Item | Parameter | Unit |
|---|---|---|
| Number of tube rows | 5 | - |
| Number of tubes in a row | 4 or 5 | - |
| Total number of tubes | 23 | - |
| Fin thickness | 1.5 | mm |
| Fin height | 27 | mm |
| Tube outside diameter | 27 | mm |
| Tube inner diameter | 20 | mm |
| Tube pitch | 47 × 56 | mm |
| Tube row alignment | Staggered | - |
2.2. Boundary Conditions and Governing Equations of the Model
| Item | Parameter | Unit |
|---|---|---|
| Exhaust gas density ρm | 0.6553 | kg·m−3 |
| Exhaust specific heat at constant pressure cp,m | 1096.4 | J·(kg·K)−1 |
| Exhaust thermal conductivity λm | 0.04245 | W·(m·K)−1 |
| Exhaust dynamic viscosity μm | 2.8177 × 10⁻⁵ | kg·(m·s)−1 |
| Item | Parameter | Unit |
|---|---|---|
| Mass flow rate of exhaust gas | 0.06788 | kg·s−1 |
| Temperature at evaporator inlet | 628 | K |
| Pressure at evaporator outlet | 1.01 × 10⁵ | Pa |
2.3. Grid Generation and Numerical Method
2.4. Experimental Validation of Evaporator Numerical Simulation
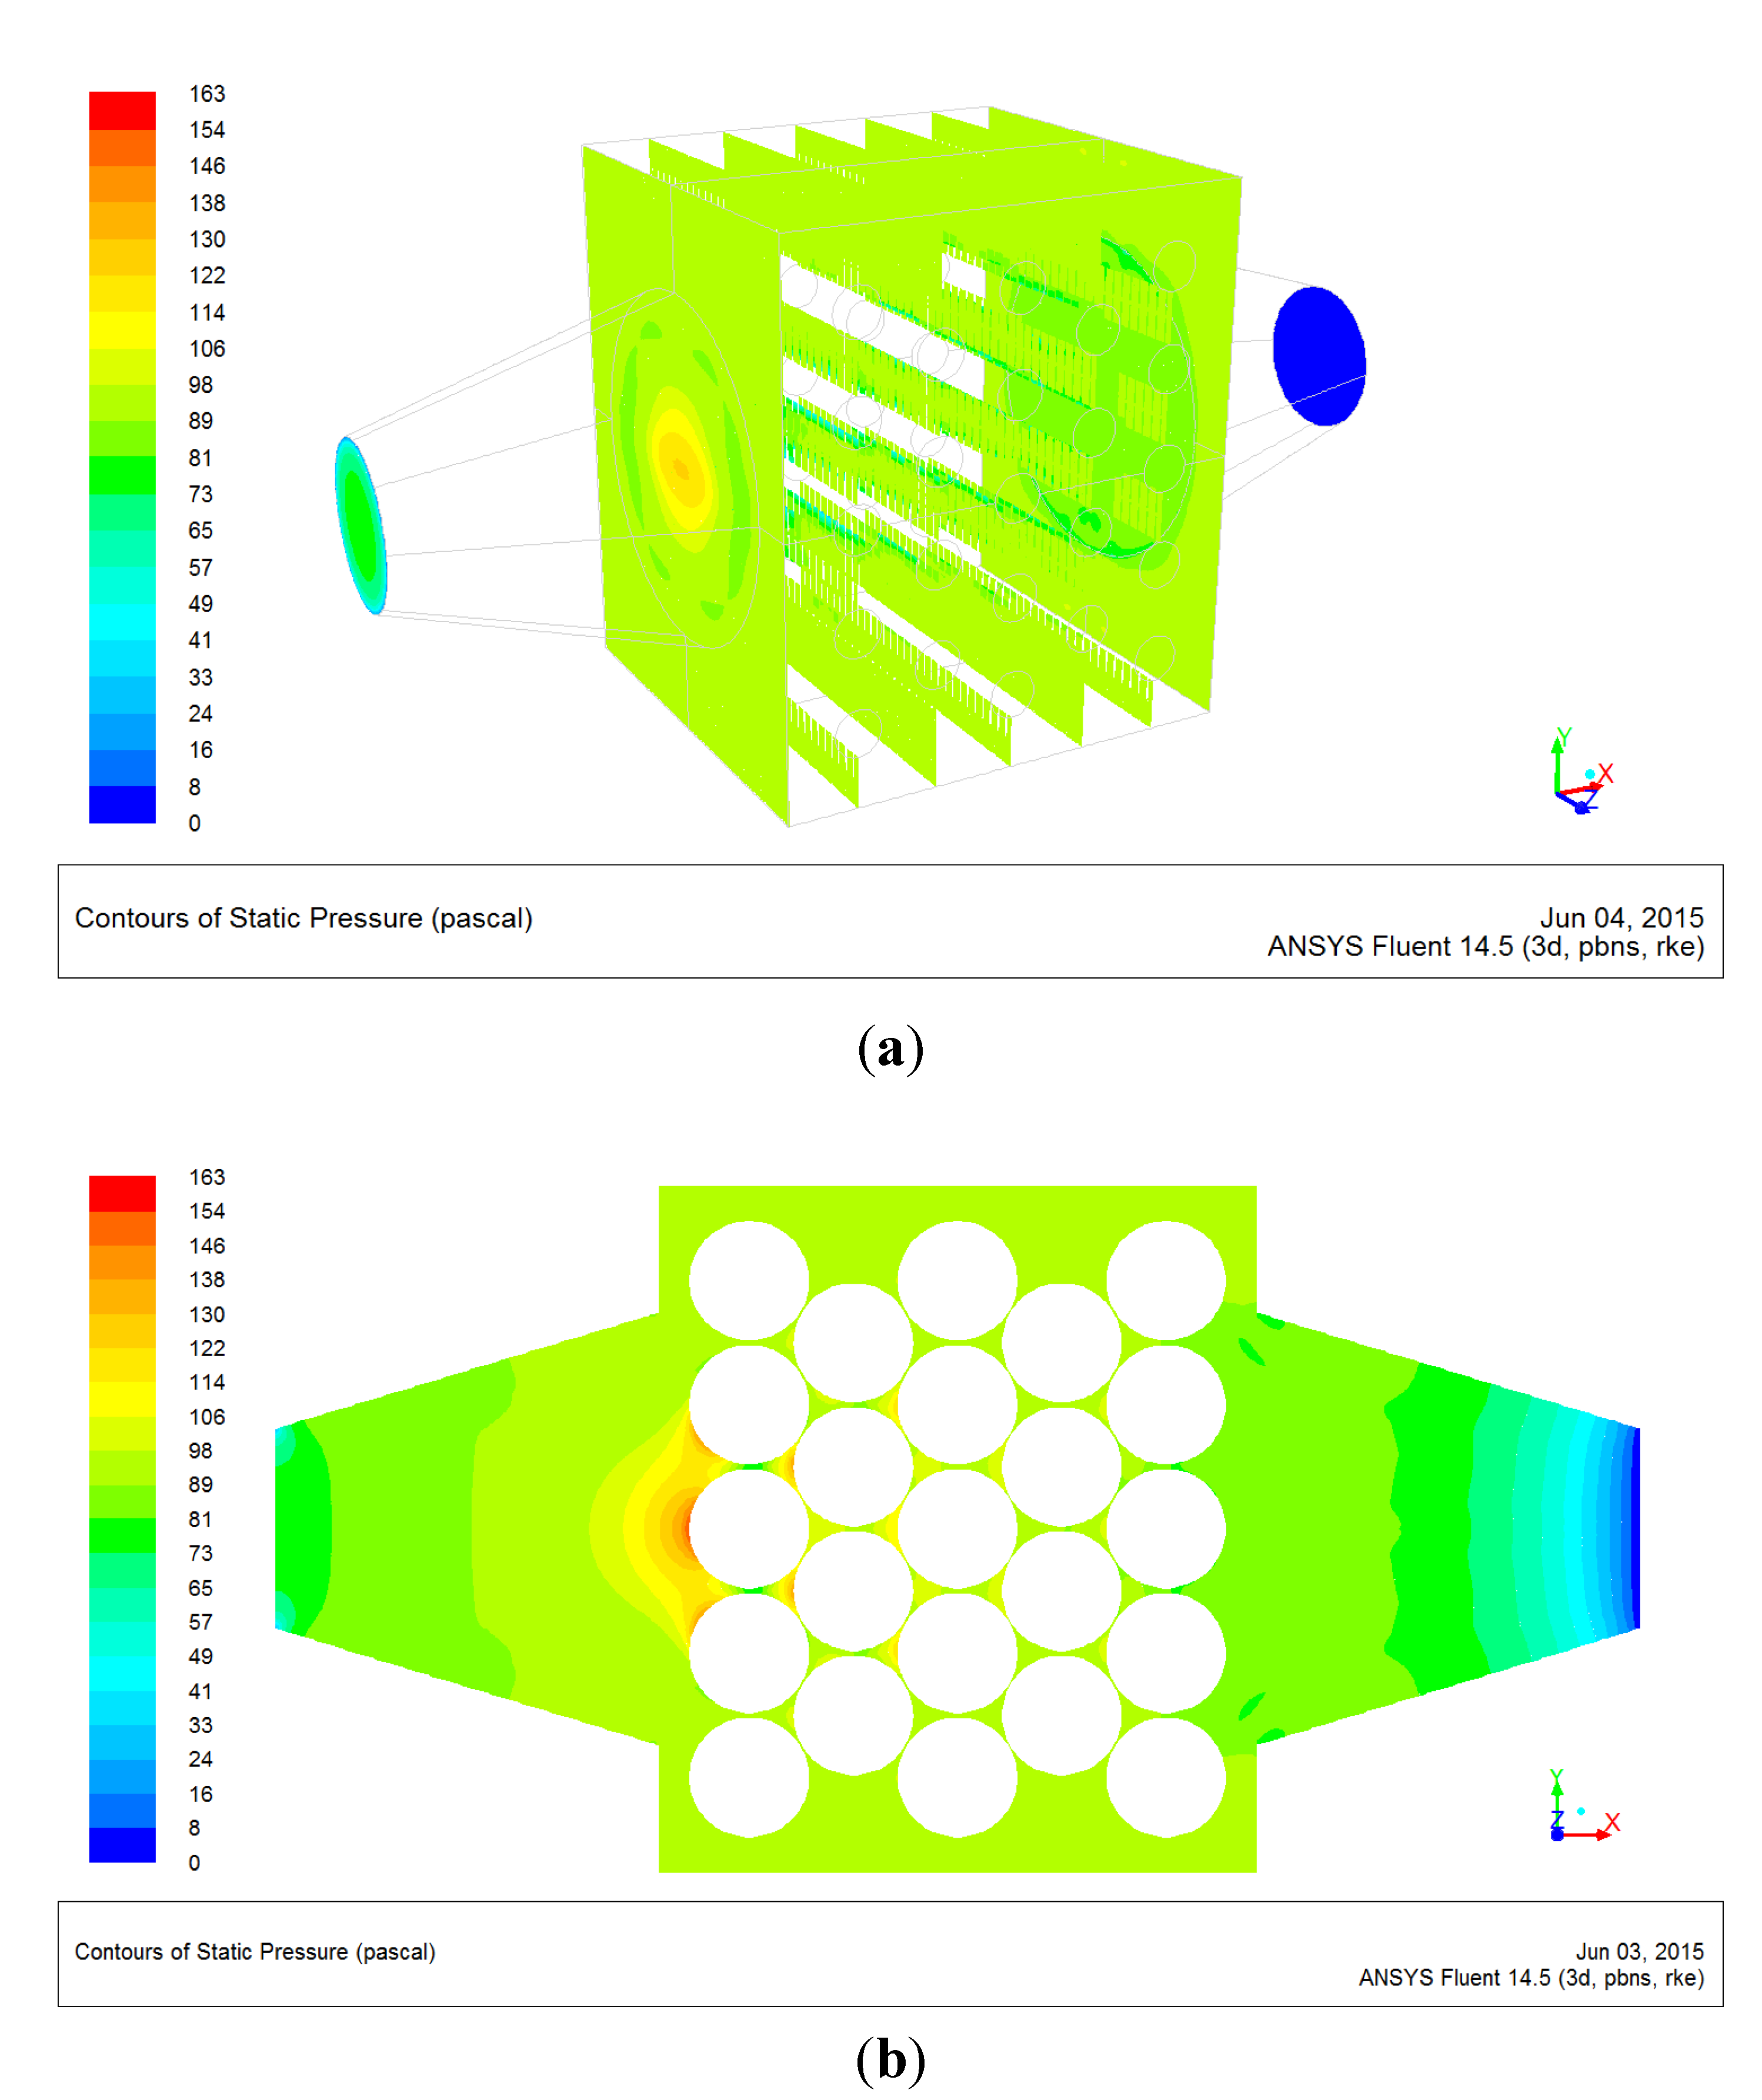
2.5. Results and Discussion of the Evaporator Numerical Simulation


3. Numerical Simulation for Diesel Engine
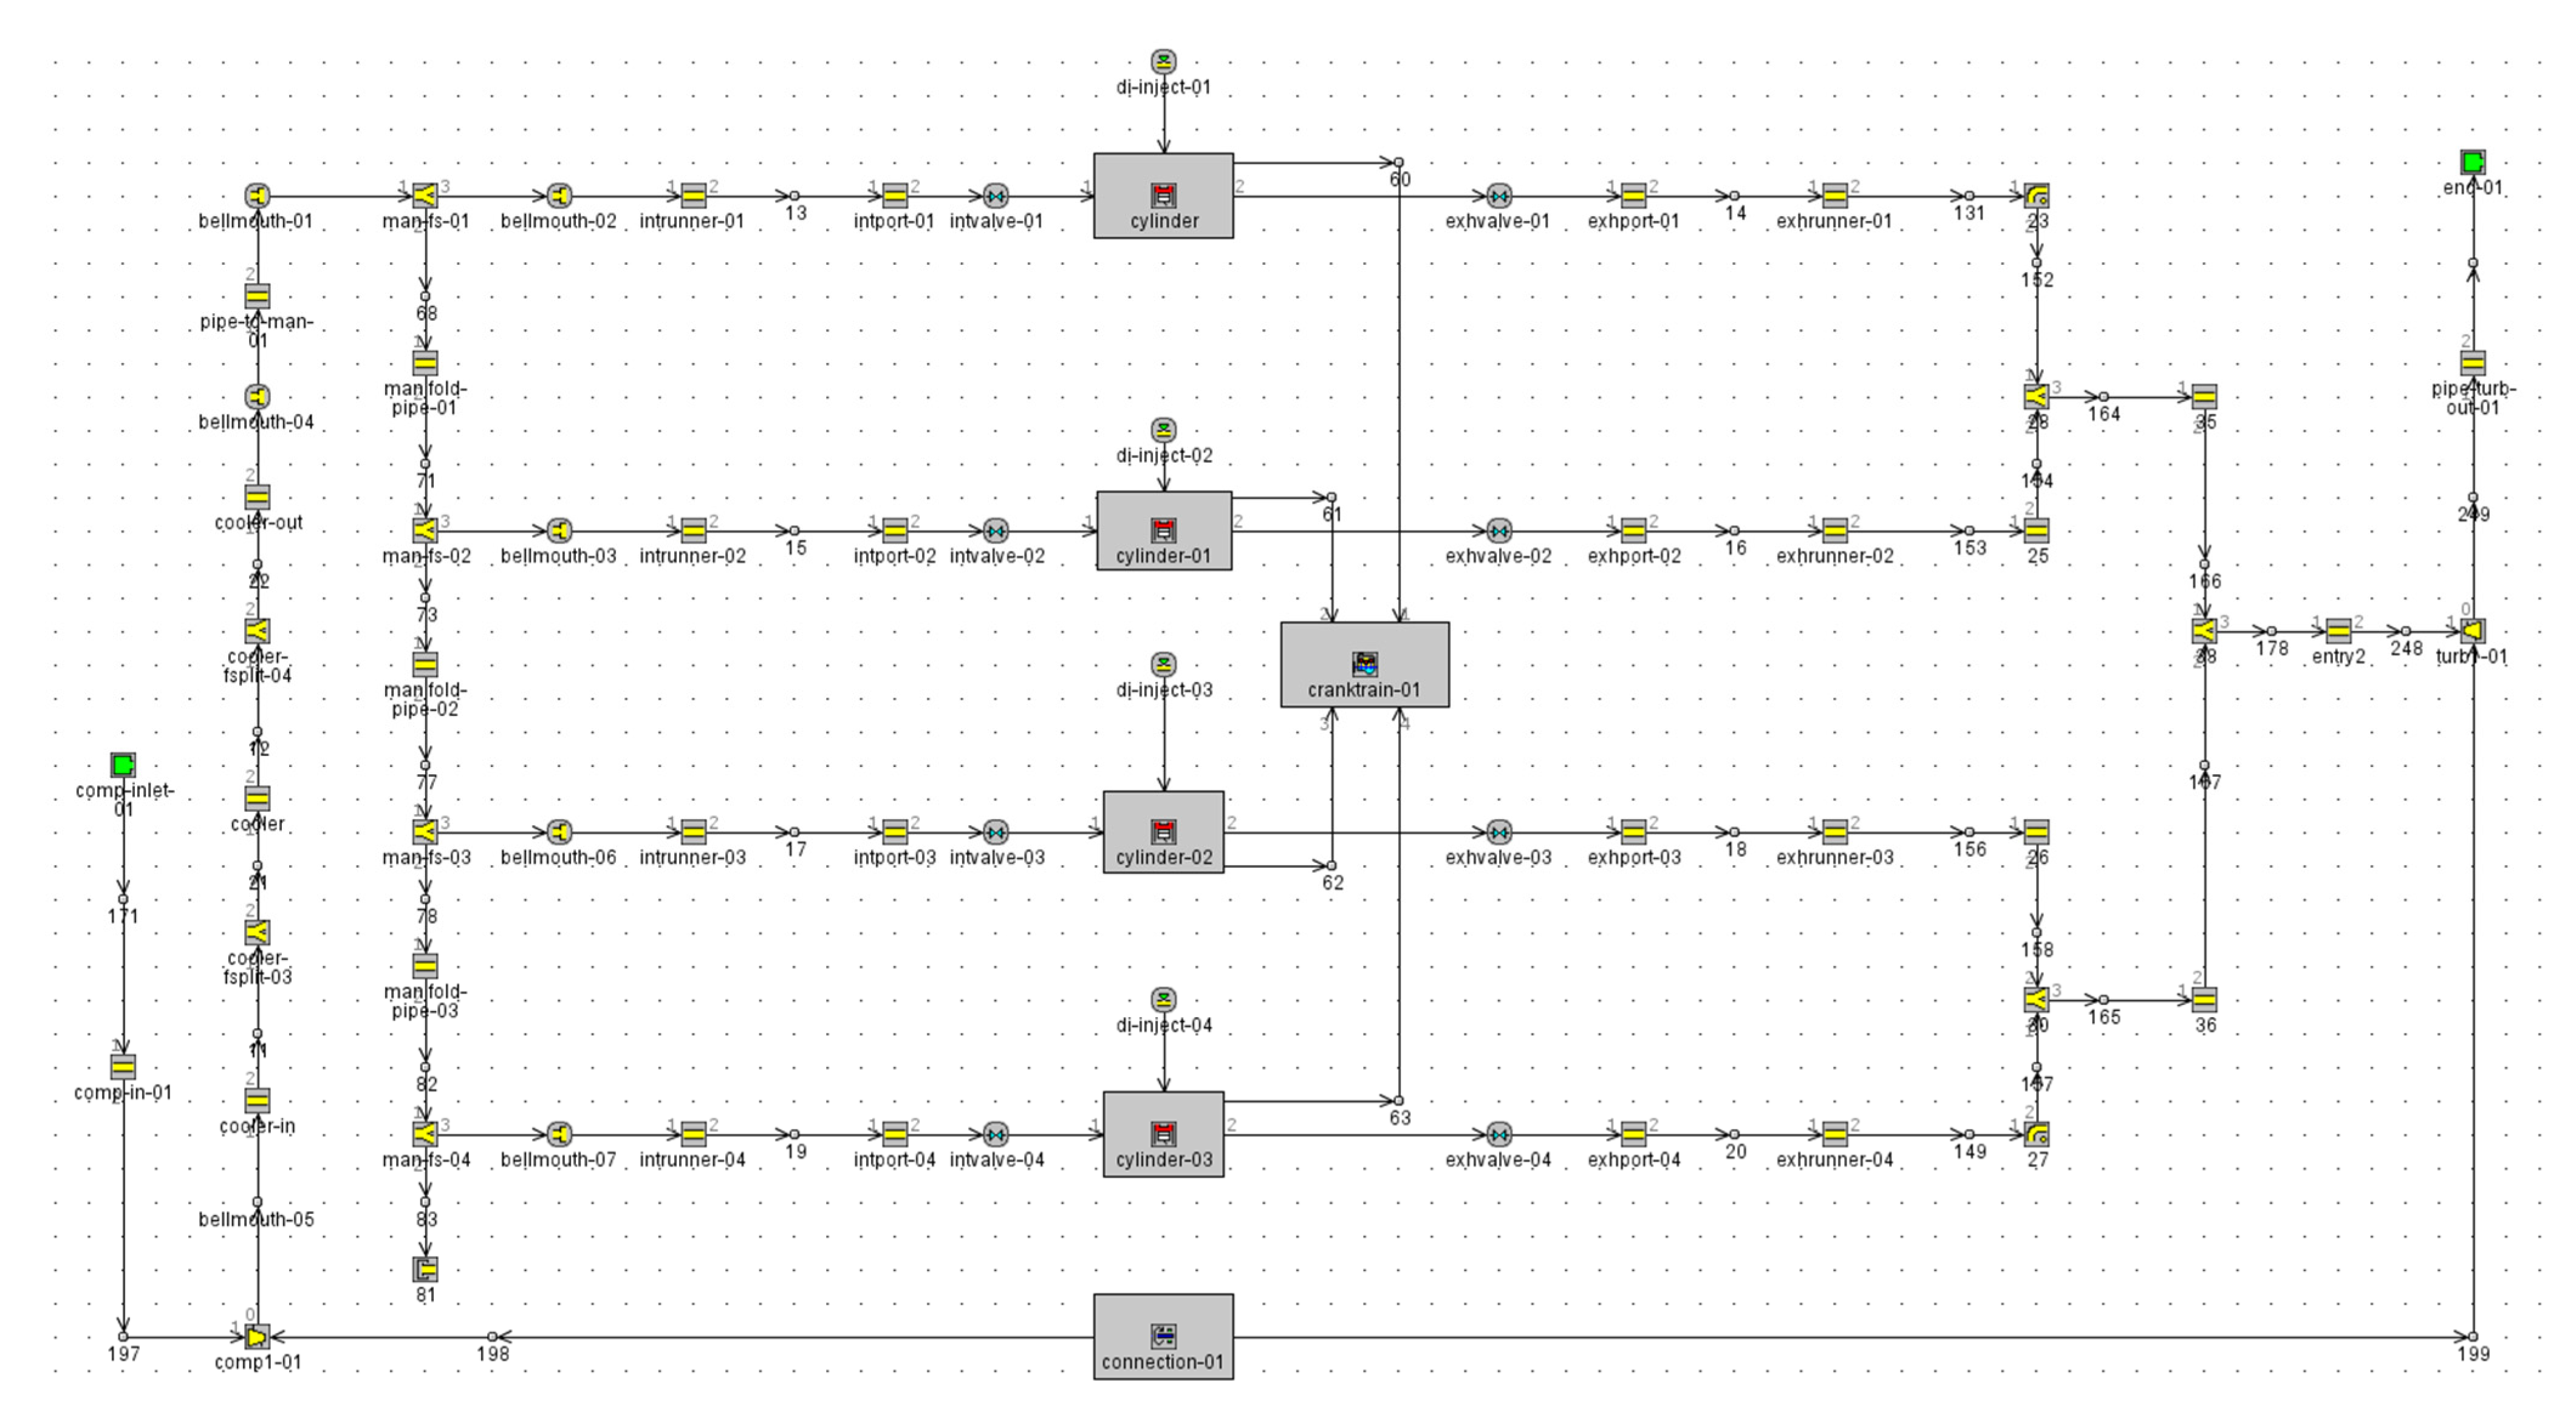
3.1. Simulation Model of Diesel Engine
| Item | Parameter | Unit |
|---|---|---|
| Type | turbocharged common-rail diesel engine | - |
| Cylinder diameter | 93 | mm |
| Stroke | 102 | mm |
| Compression ratio | 17.4 | - |
| Displacement | 2.771 | L |
| Rated power | 85 | kW |
| Rated speed | 3600 | r·min−1 |
| Maximum torque | 280 | N·m |
| Speed at max. torque | 2300 | r·min−1 |
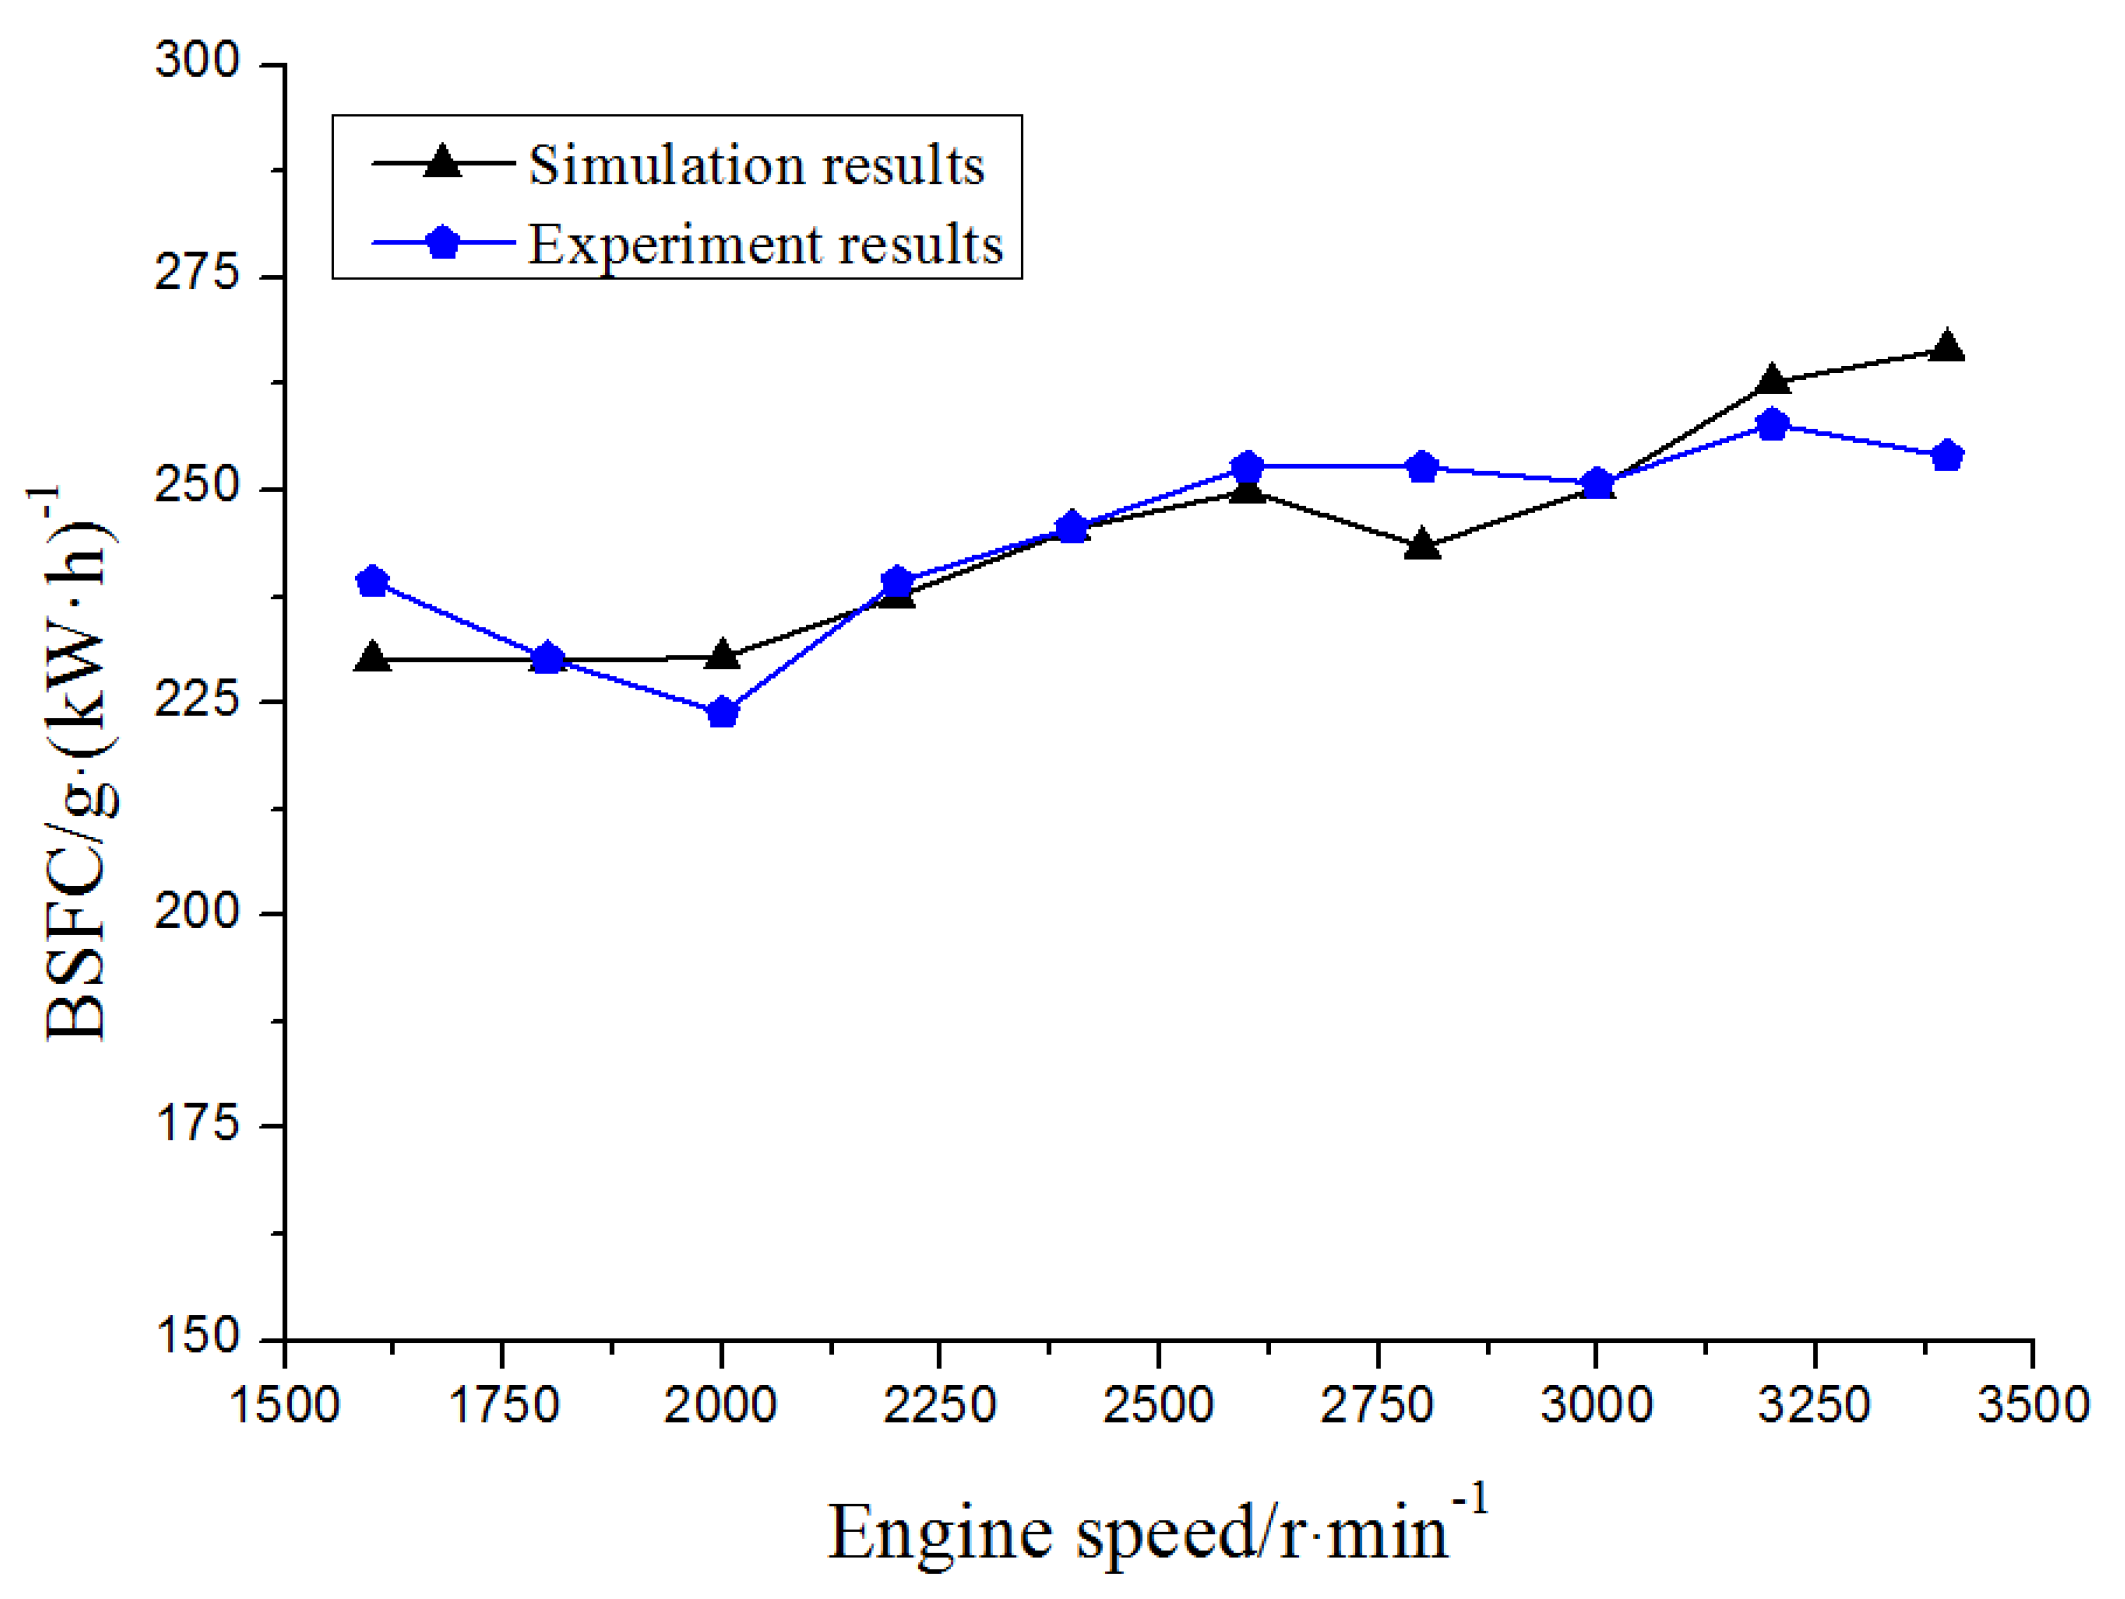
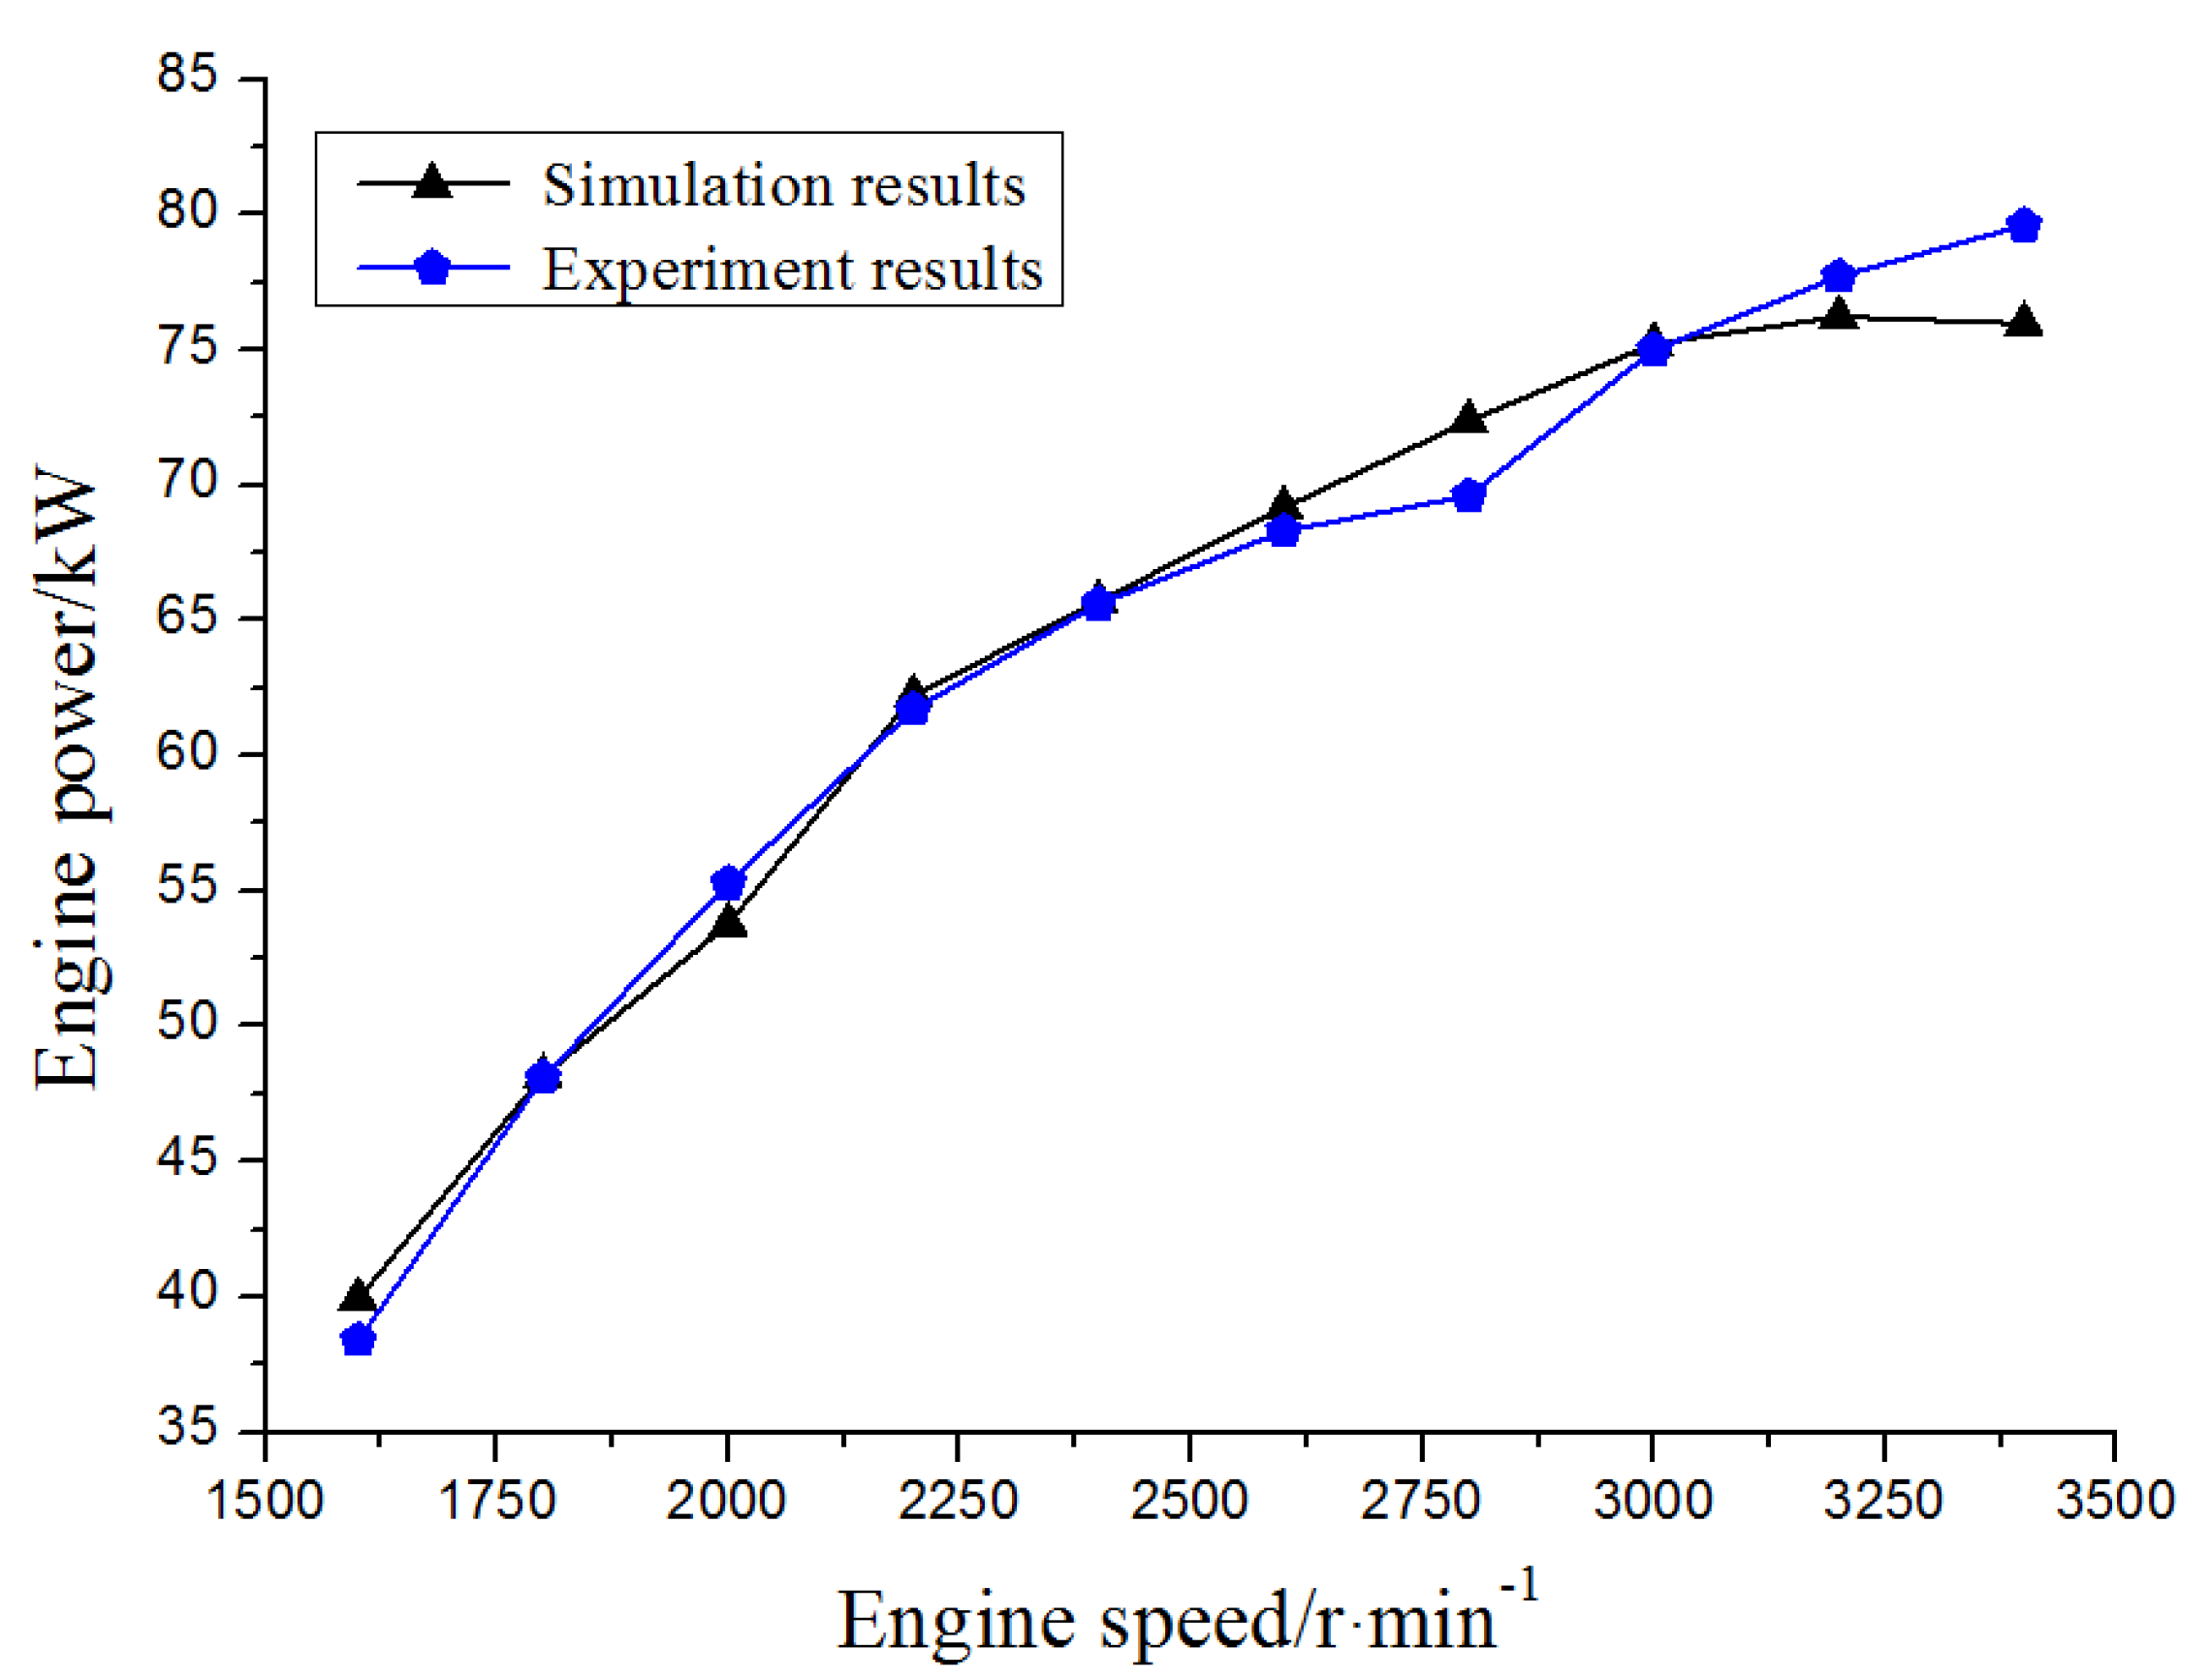
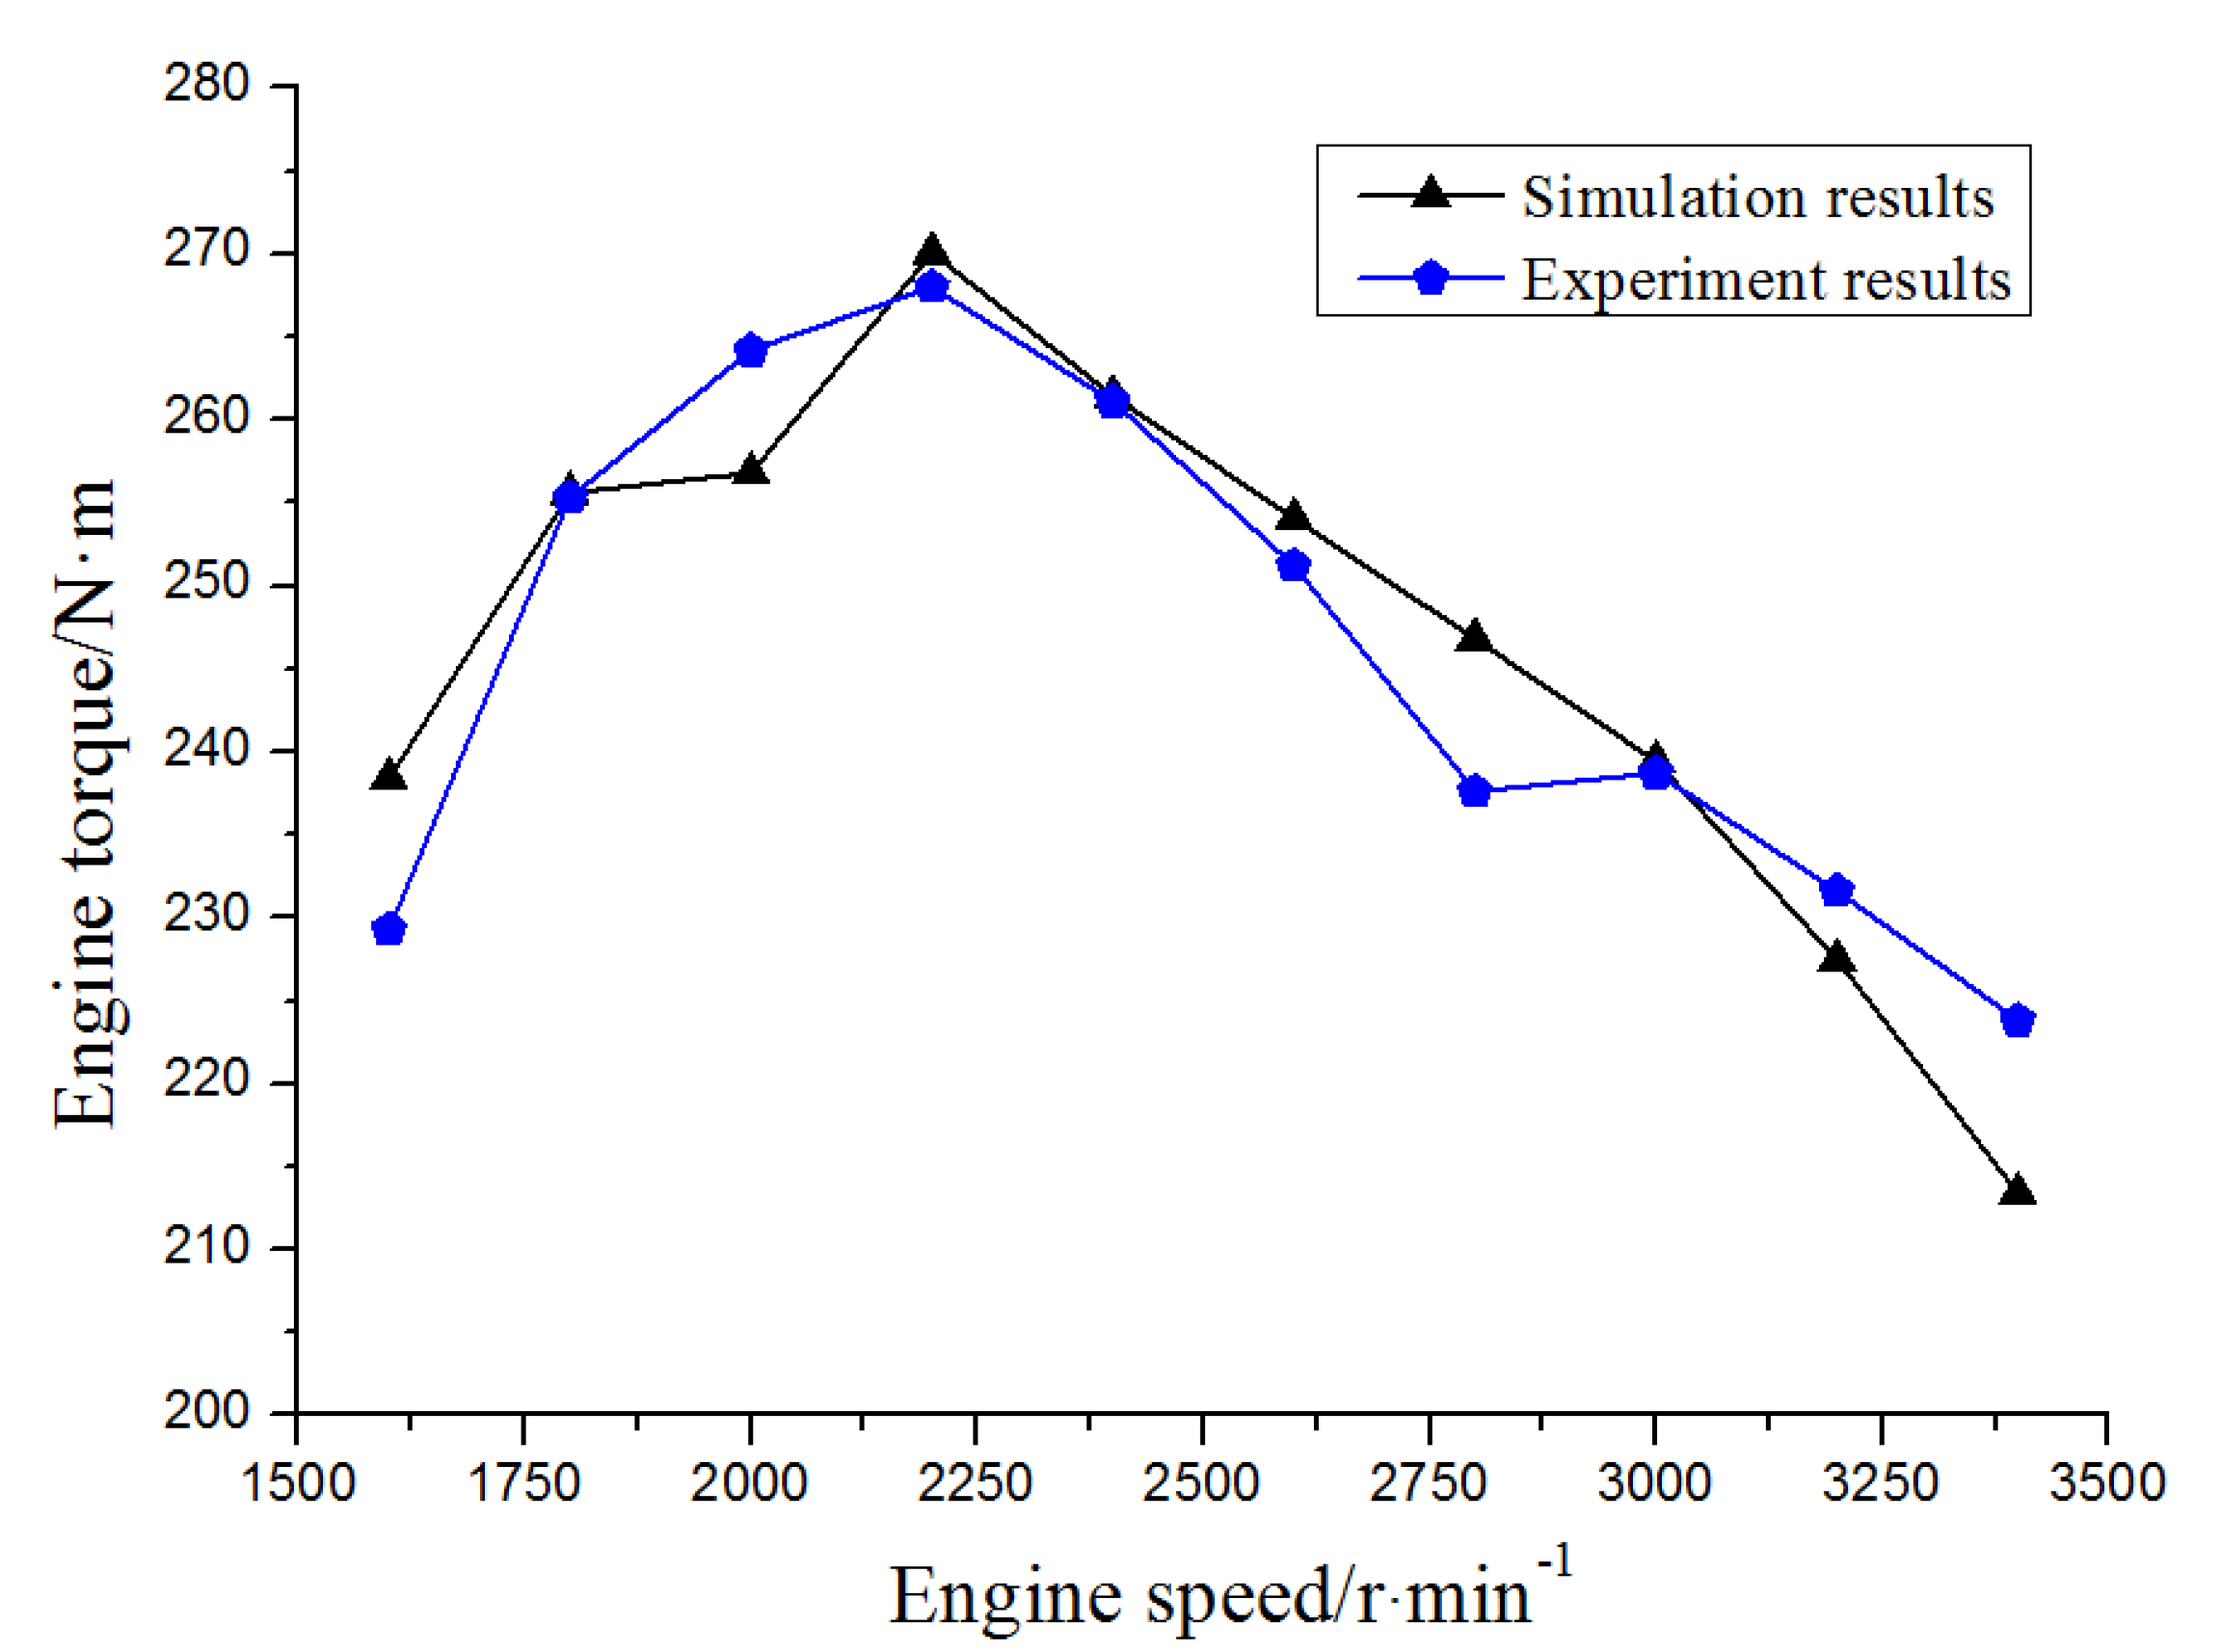
3.2. Validation of Diesel Engine Simulation Model

4. Analysis of the Operating Performance for Diesel Engine–ORC Combined System
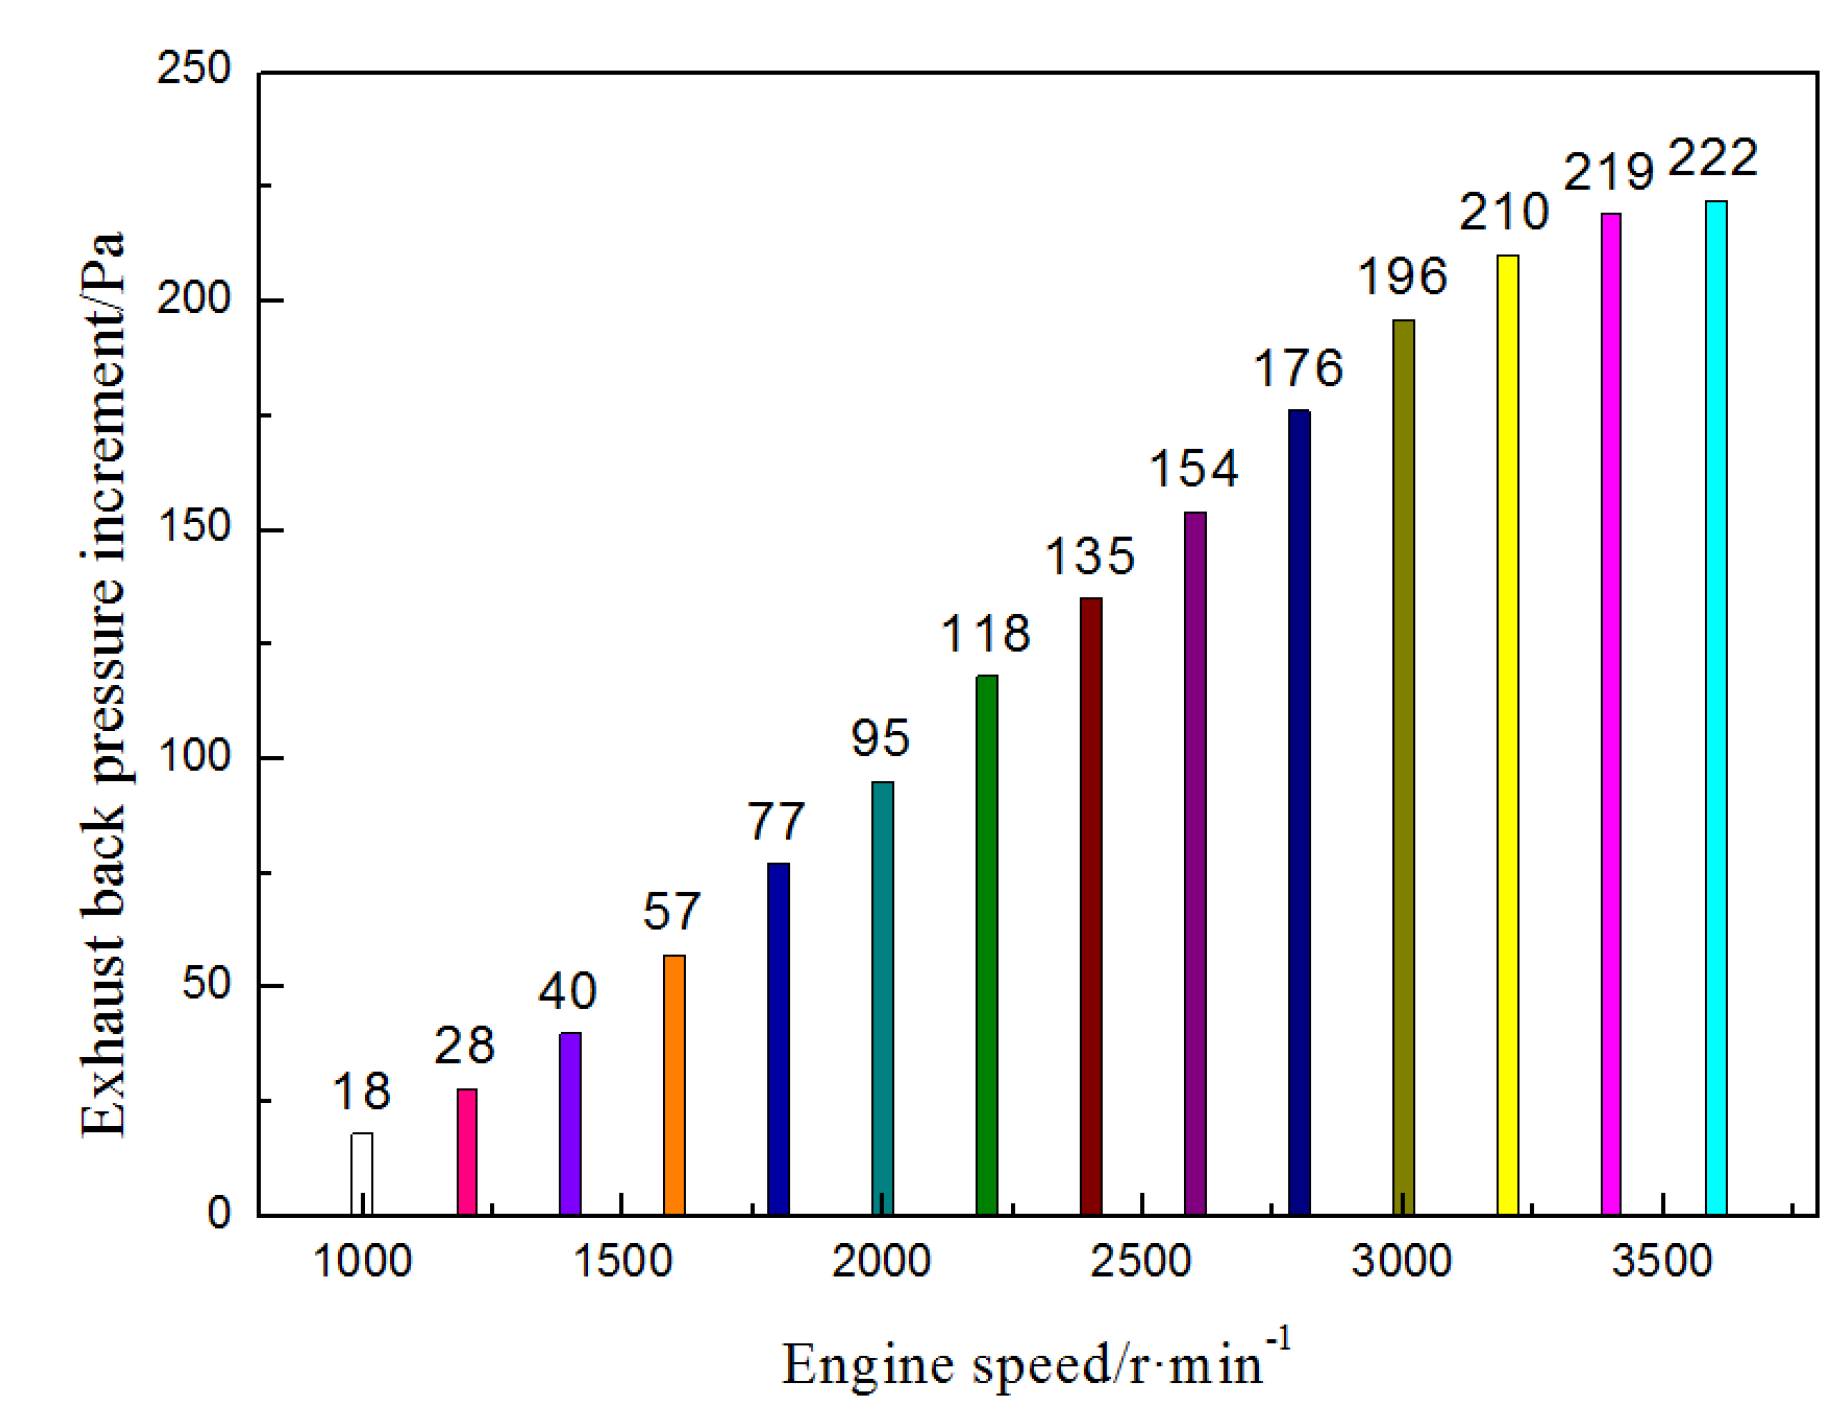
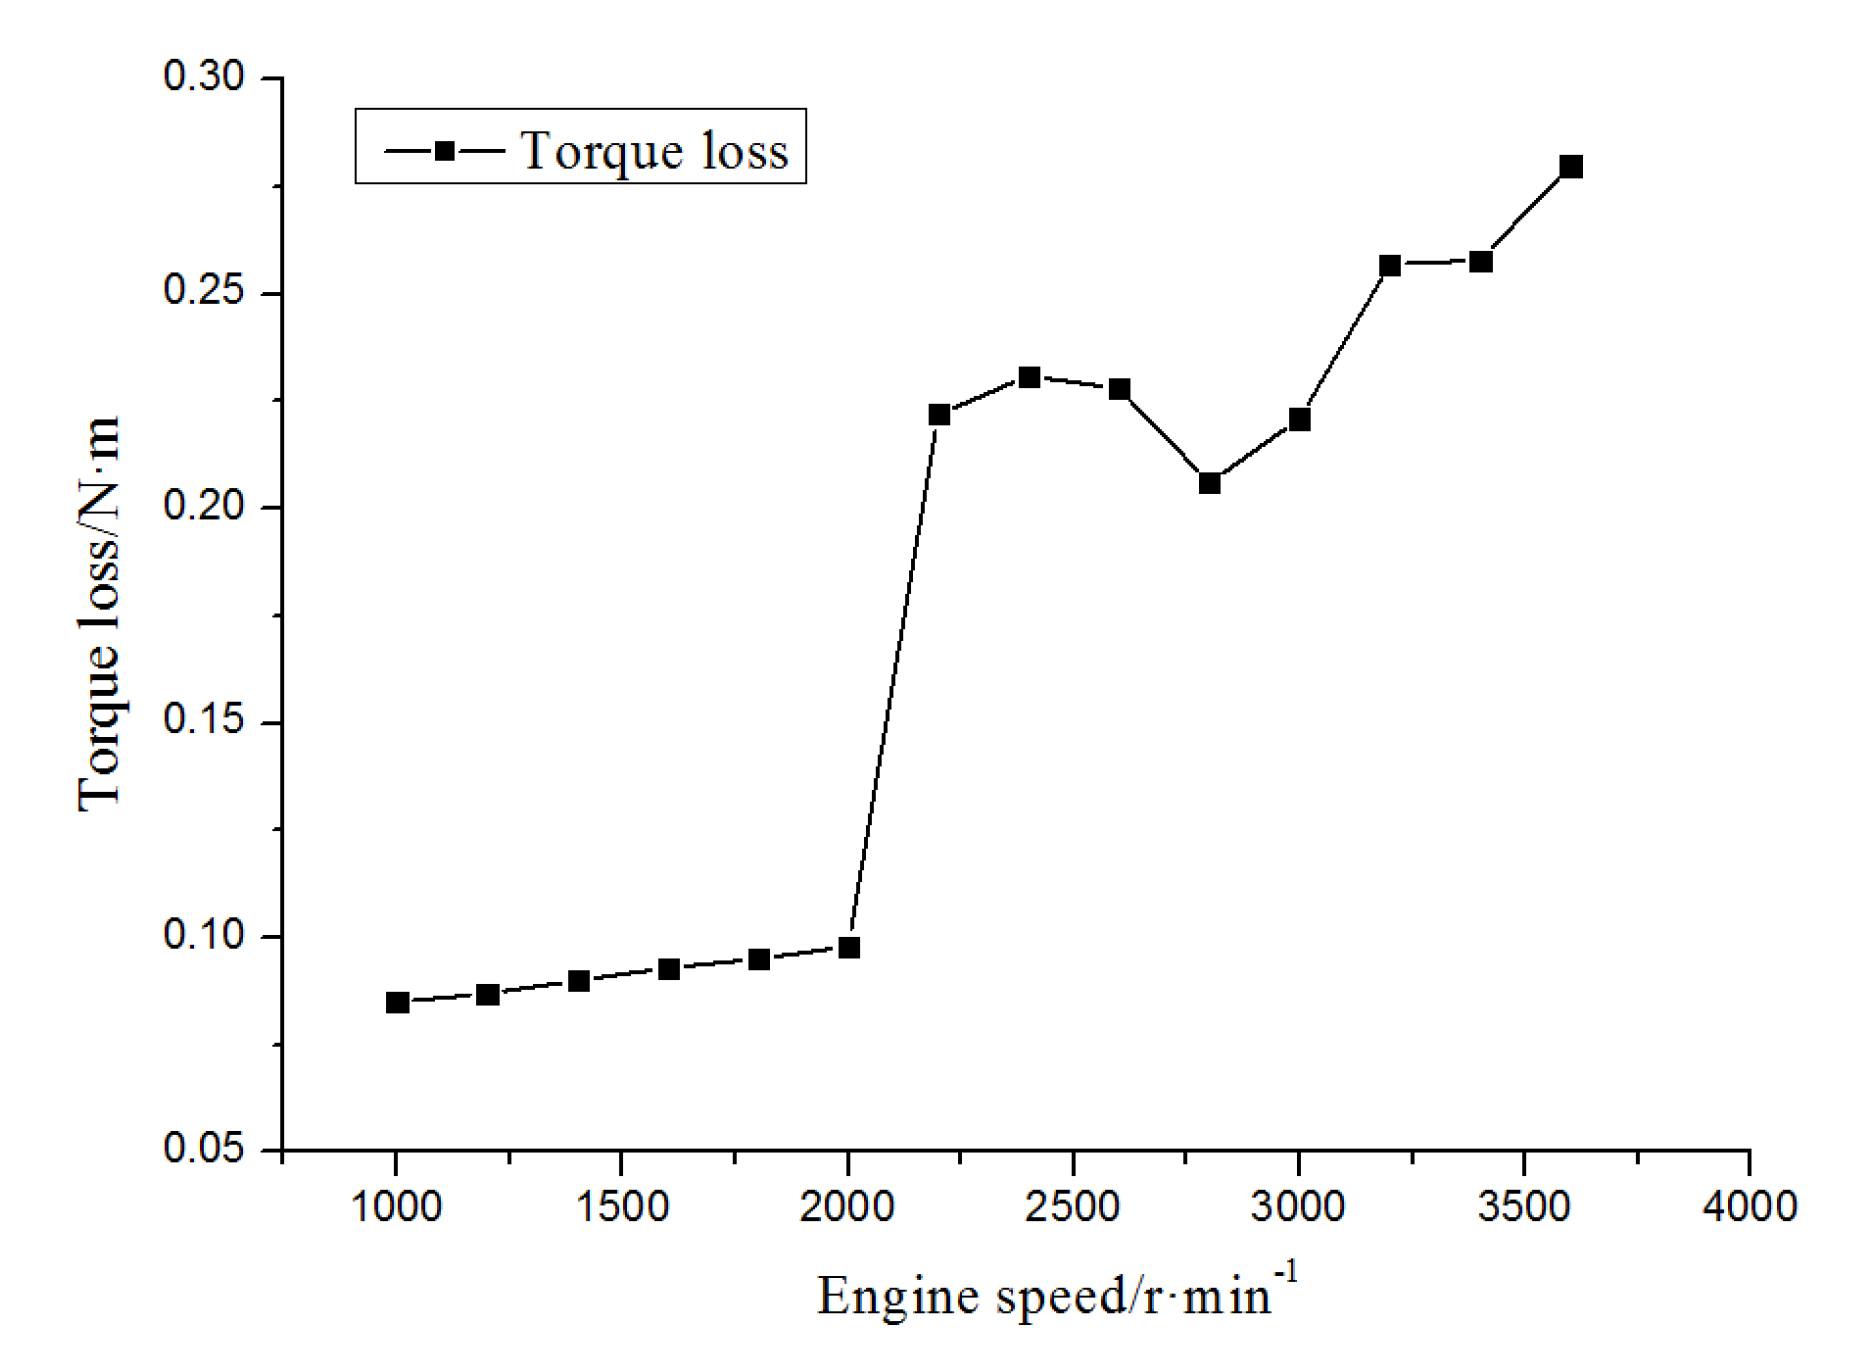
4.1. Influence of Pressure Drop of Evaporator on the Engine Operating Characteristics


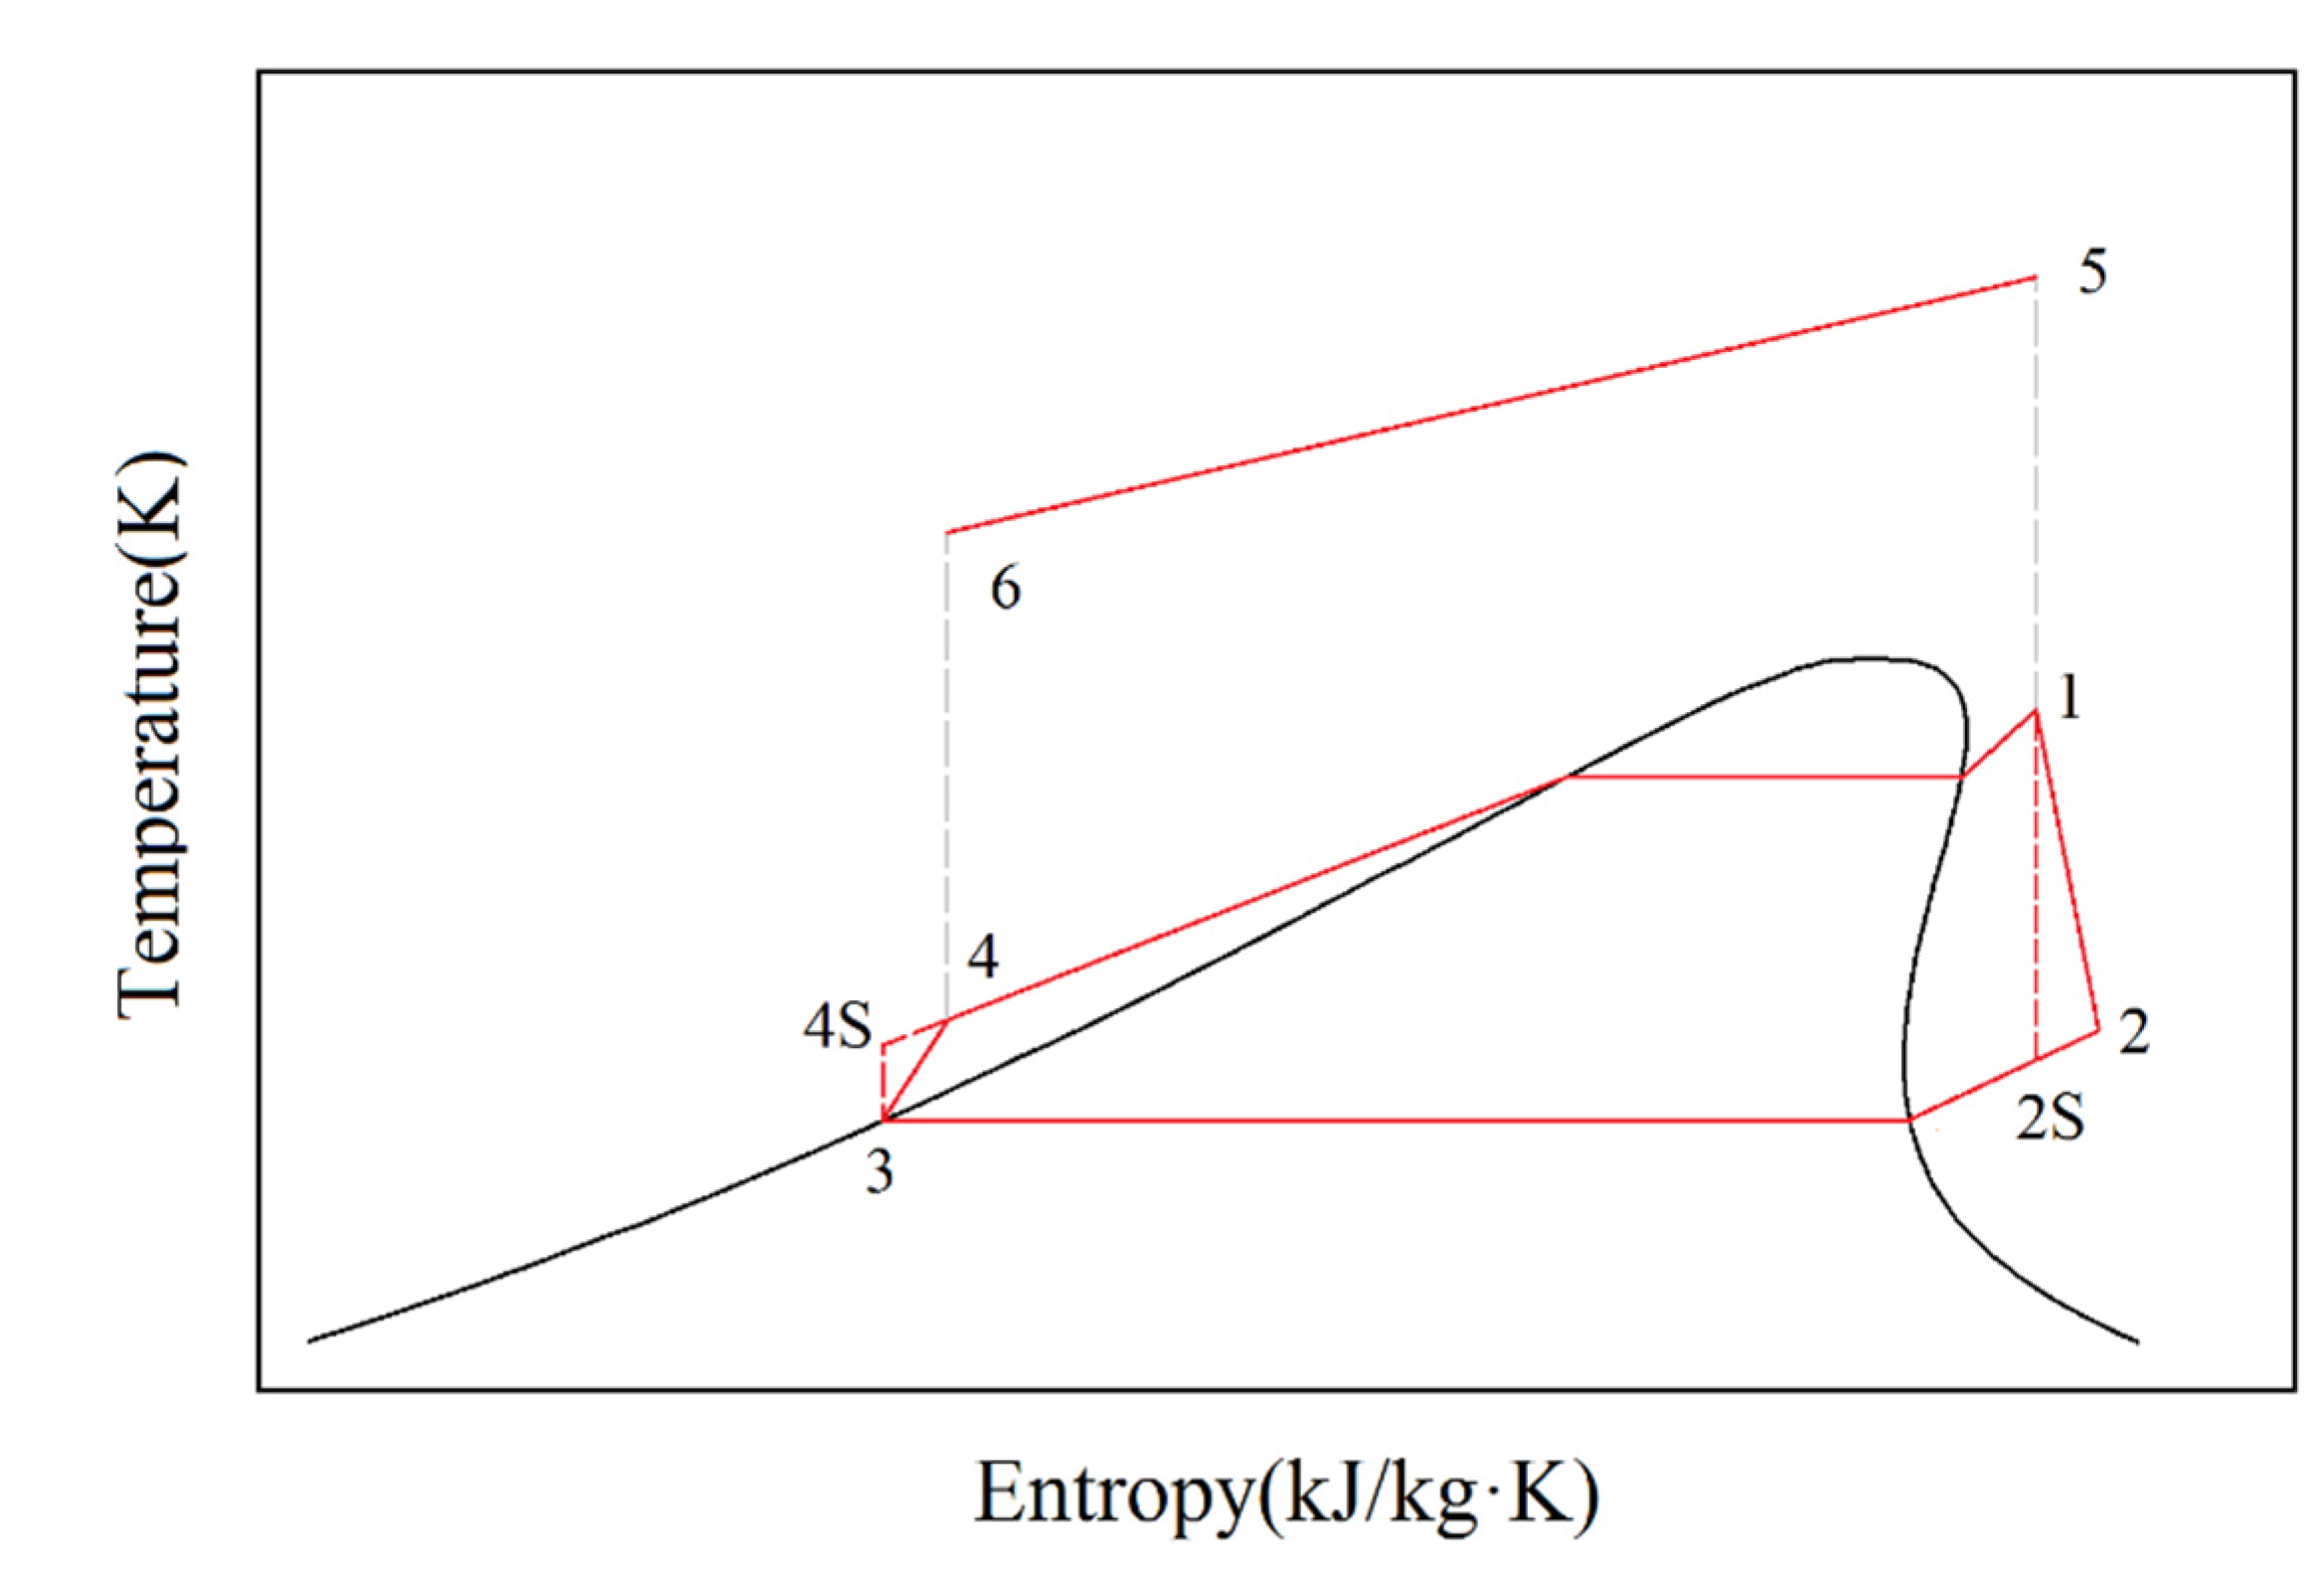
4.2. Thermodynamic Model of the ORC System
4.3. Operating Performance of Diesel Engine–ORC Combined System


5. Conclusions
- (1)
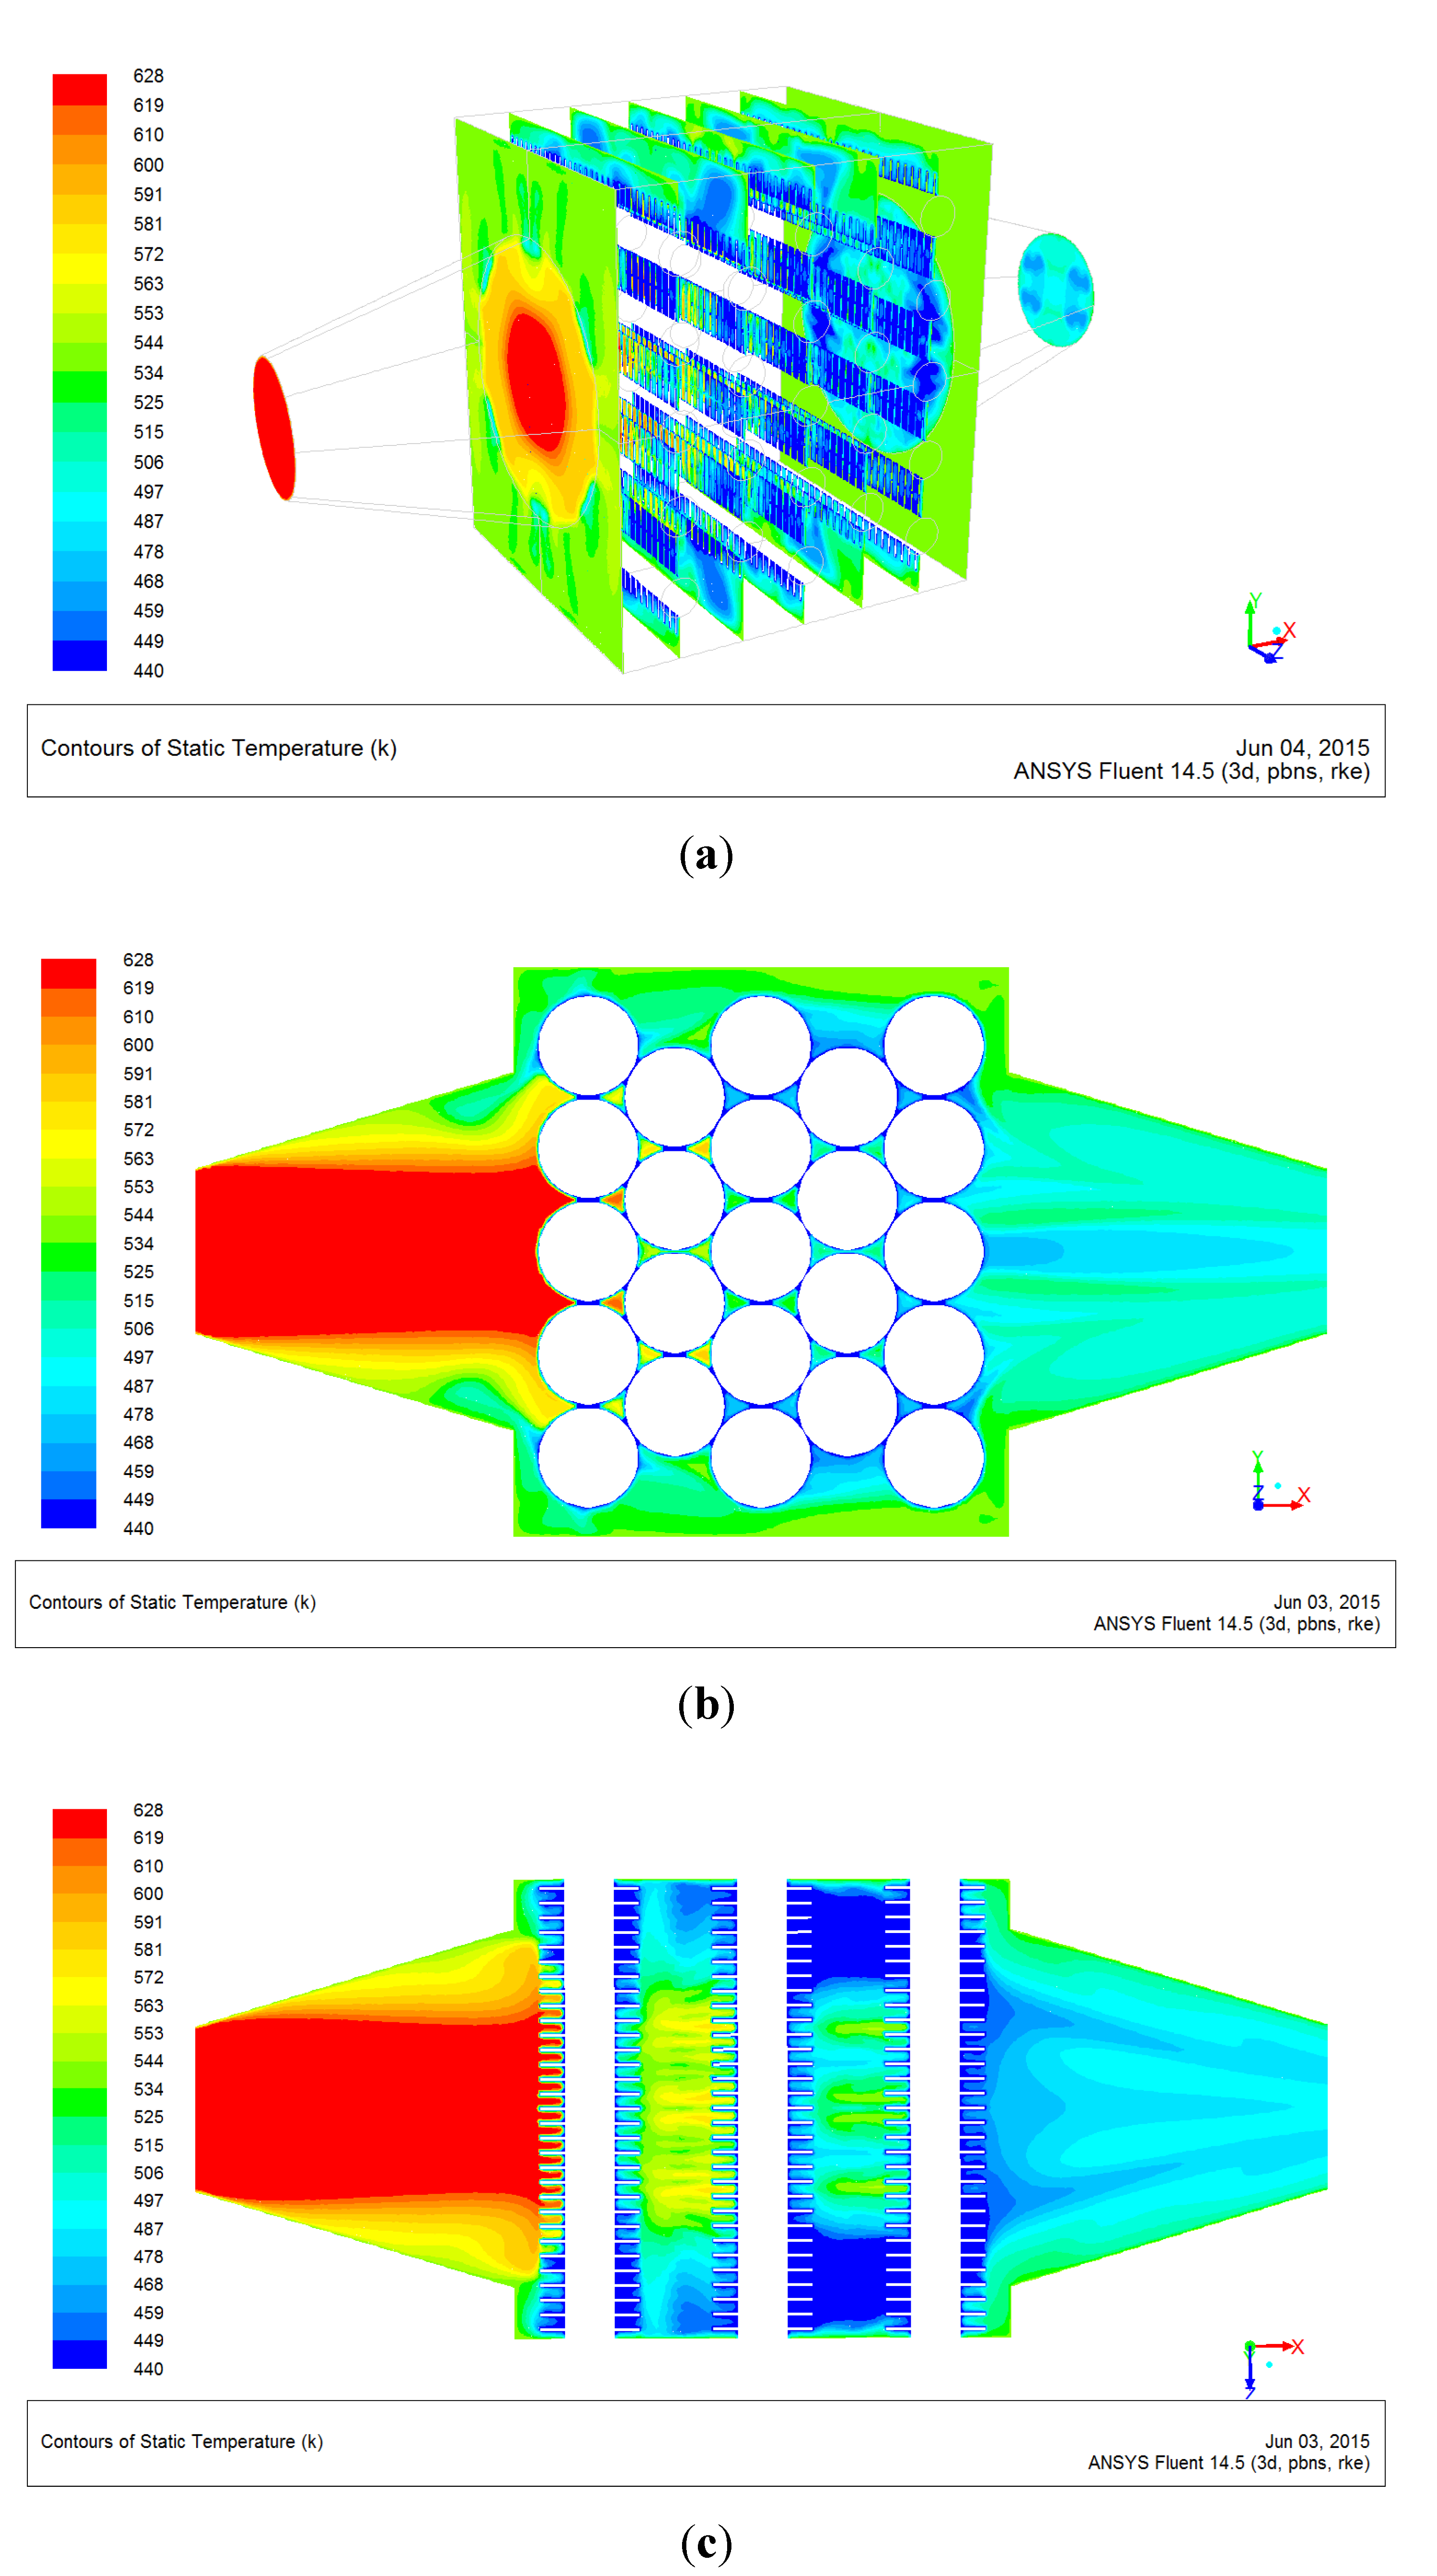
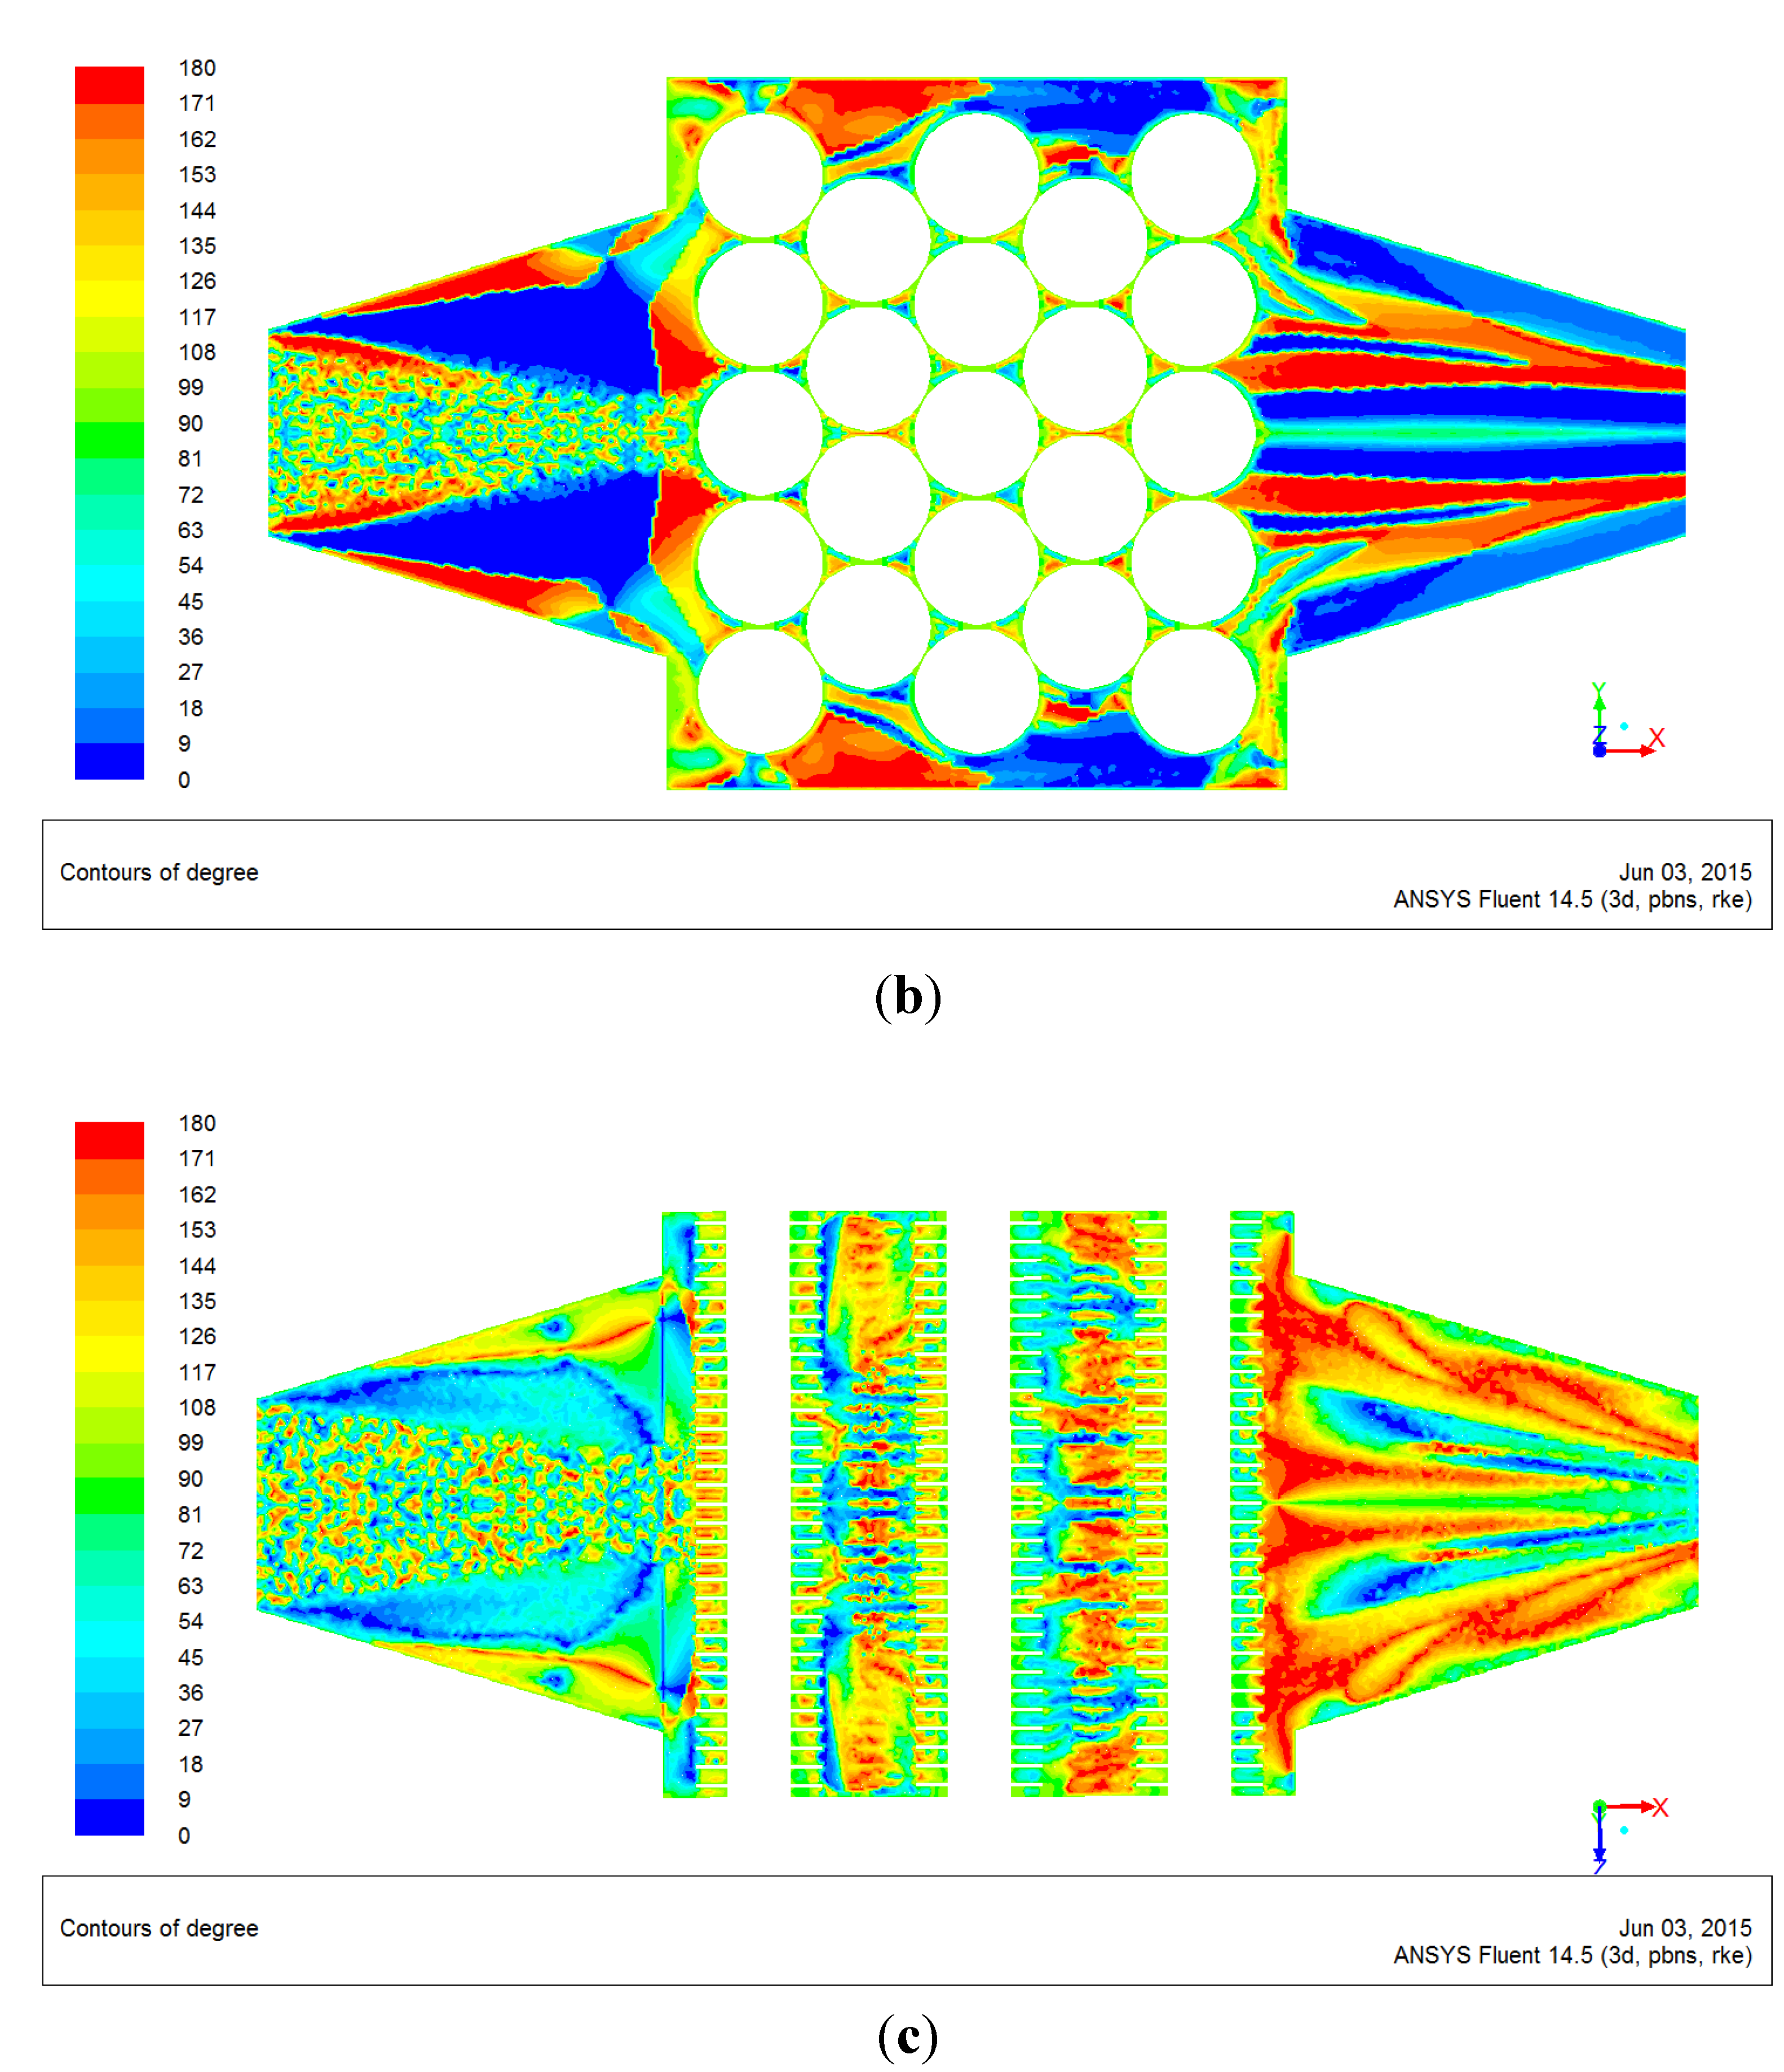
- The exhaust gas temperatures decrease gradually along the flow direction at the evaporator shell side. The high-temperature exhaust gas in the flow space between the first and second rows diffuses quickly. To ensure that the exhaust flow is evenly distributed in the spaces between the neighboring fin layers, a reasonable design of the shapes that connect the main body with the front end and back end portions is necessary.
- (2)
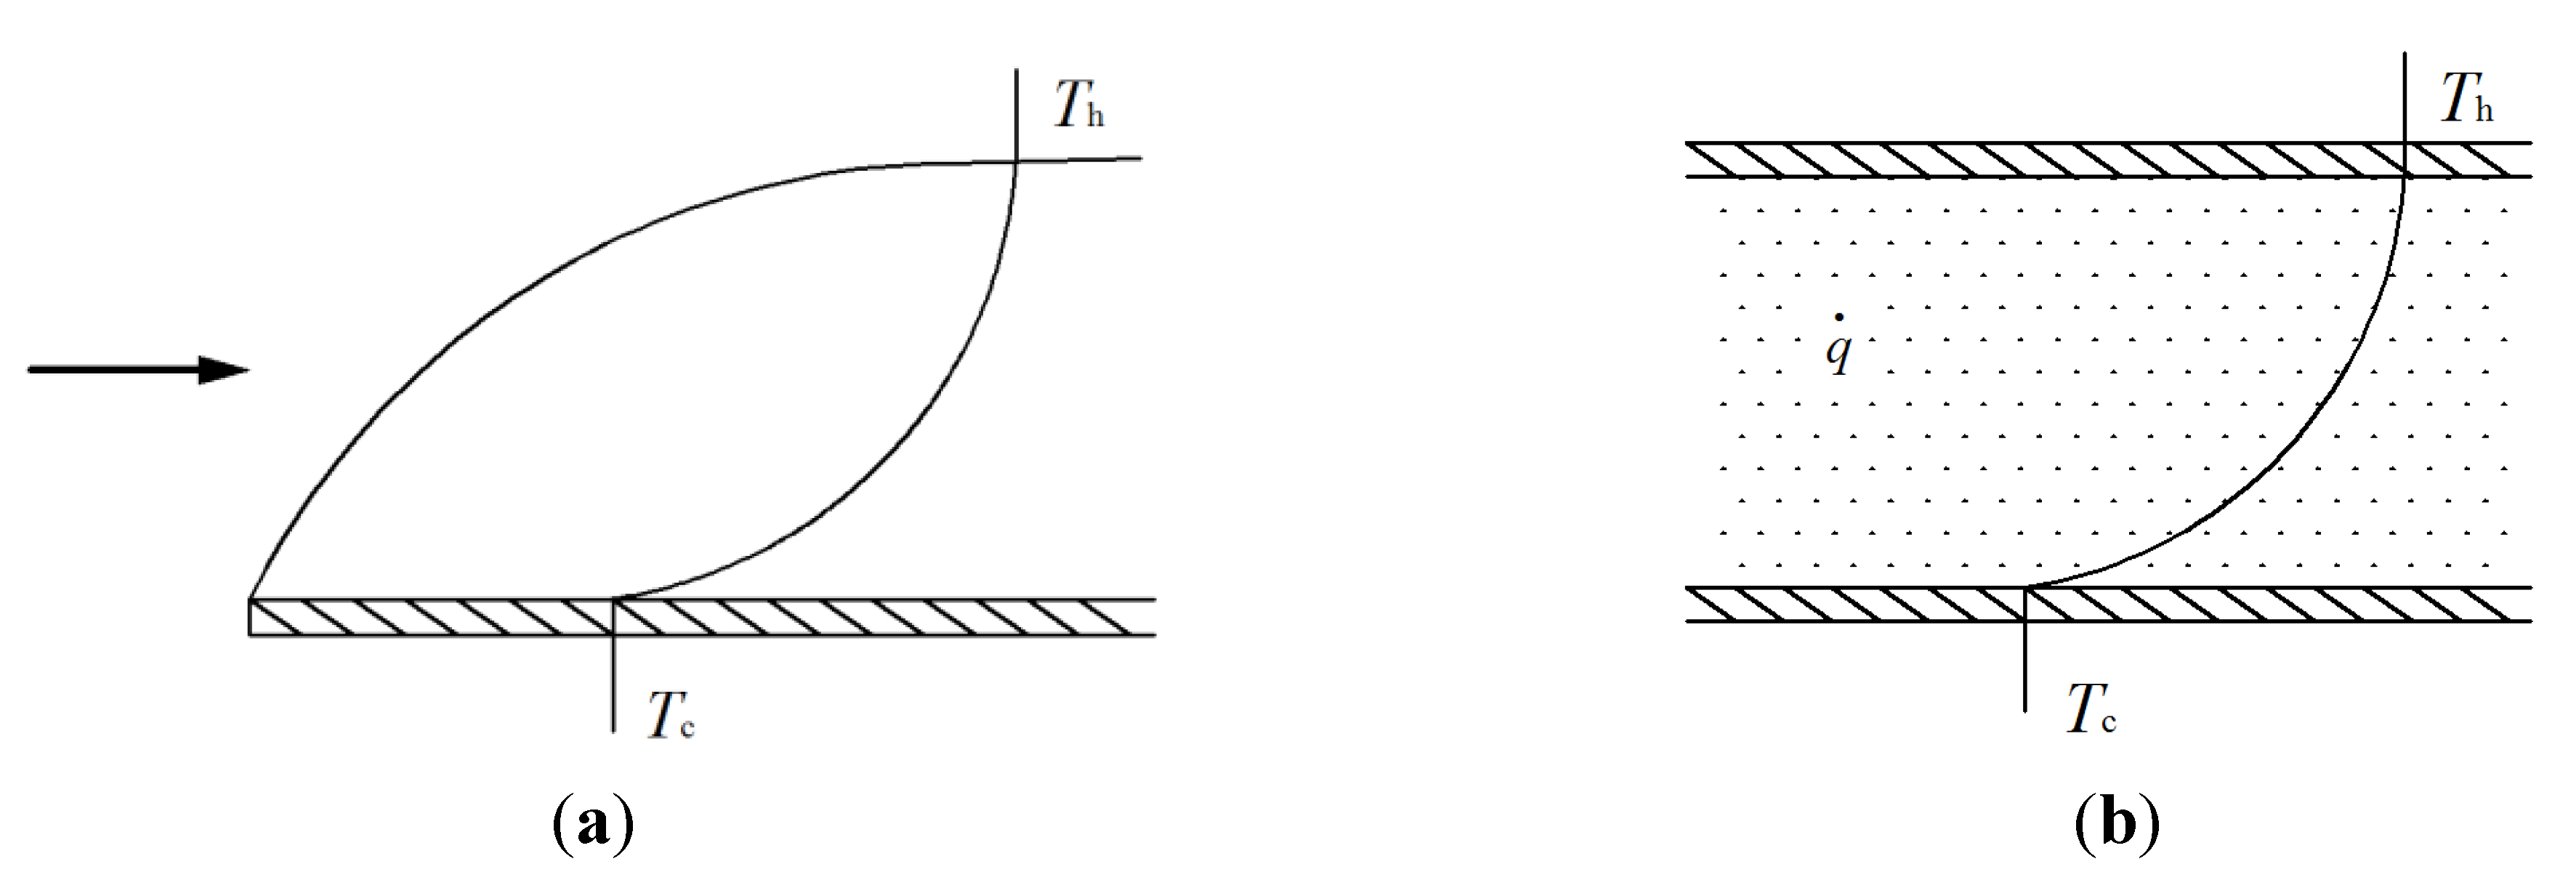
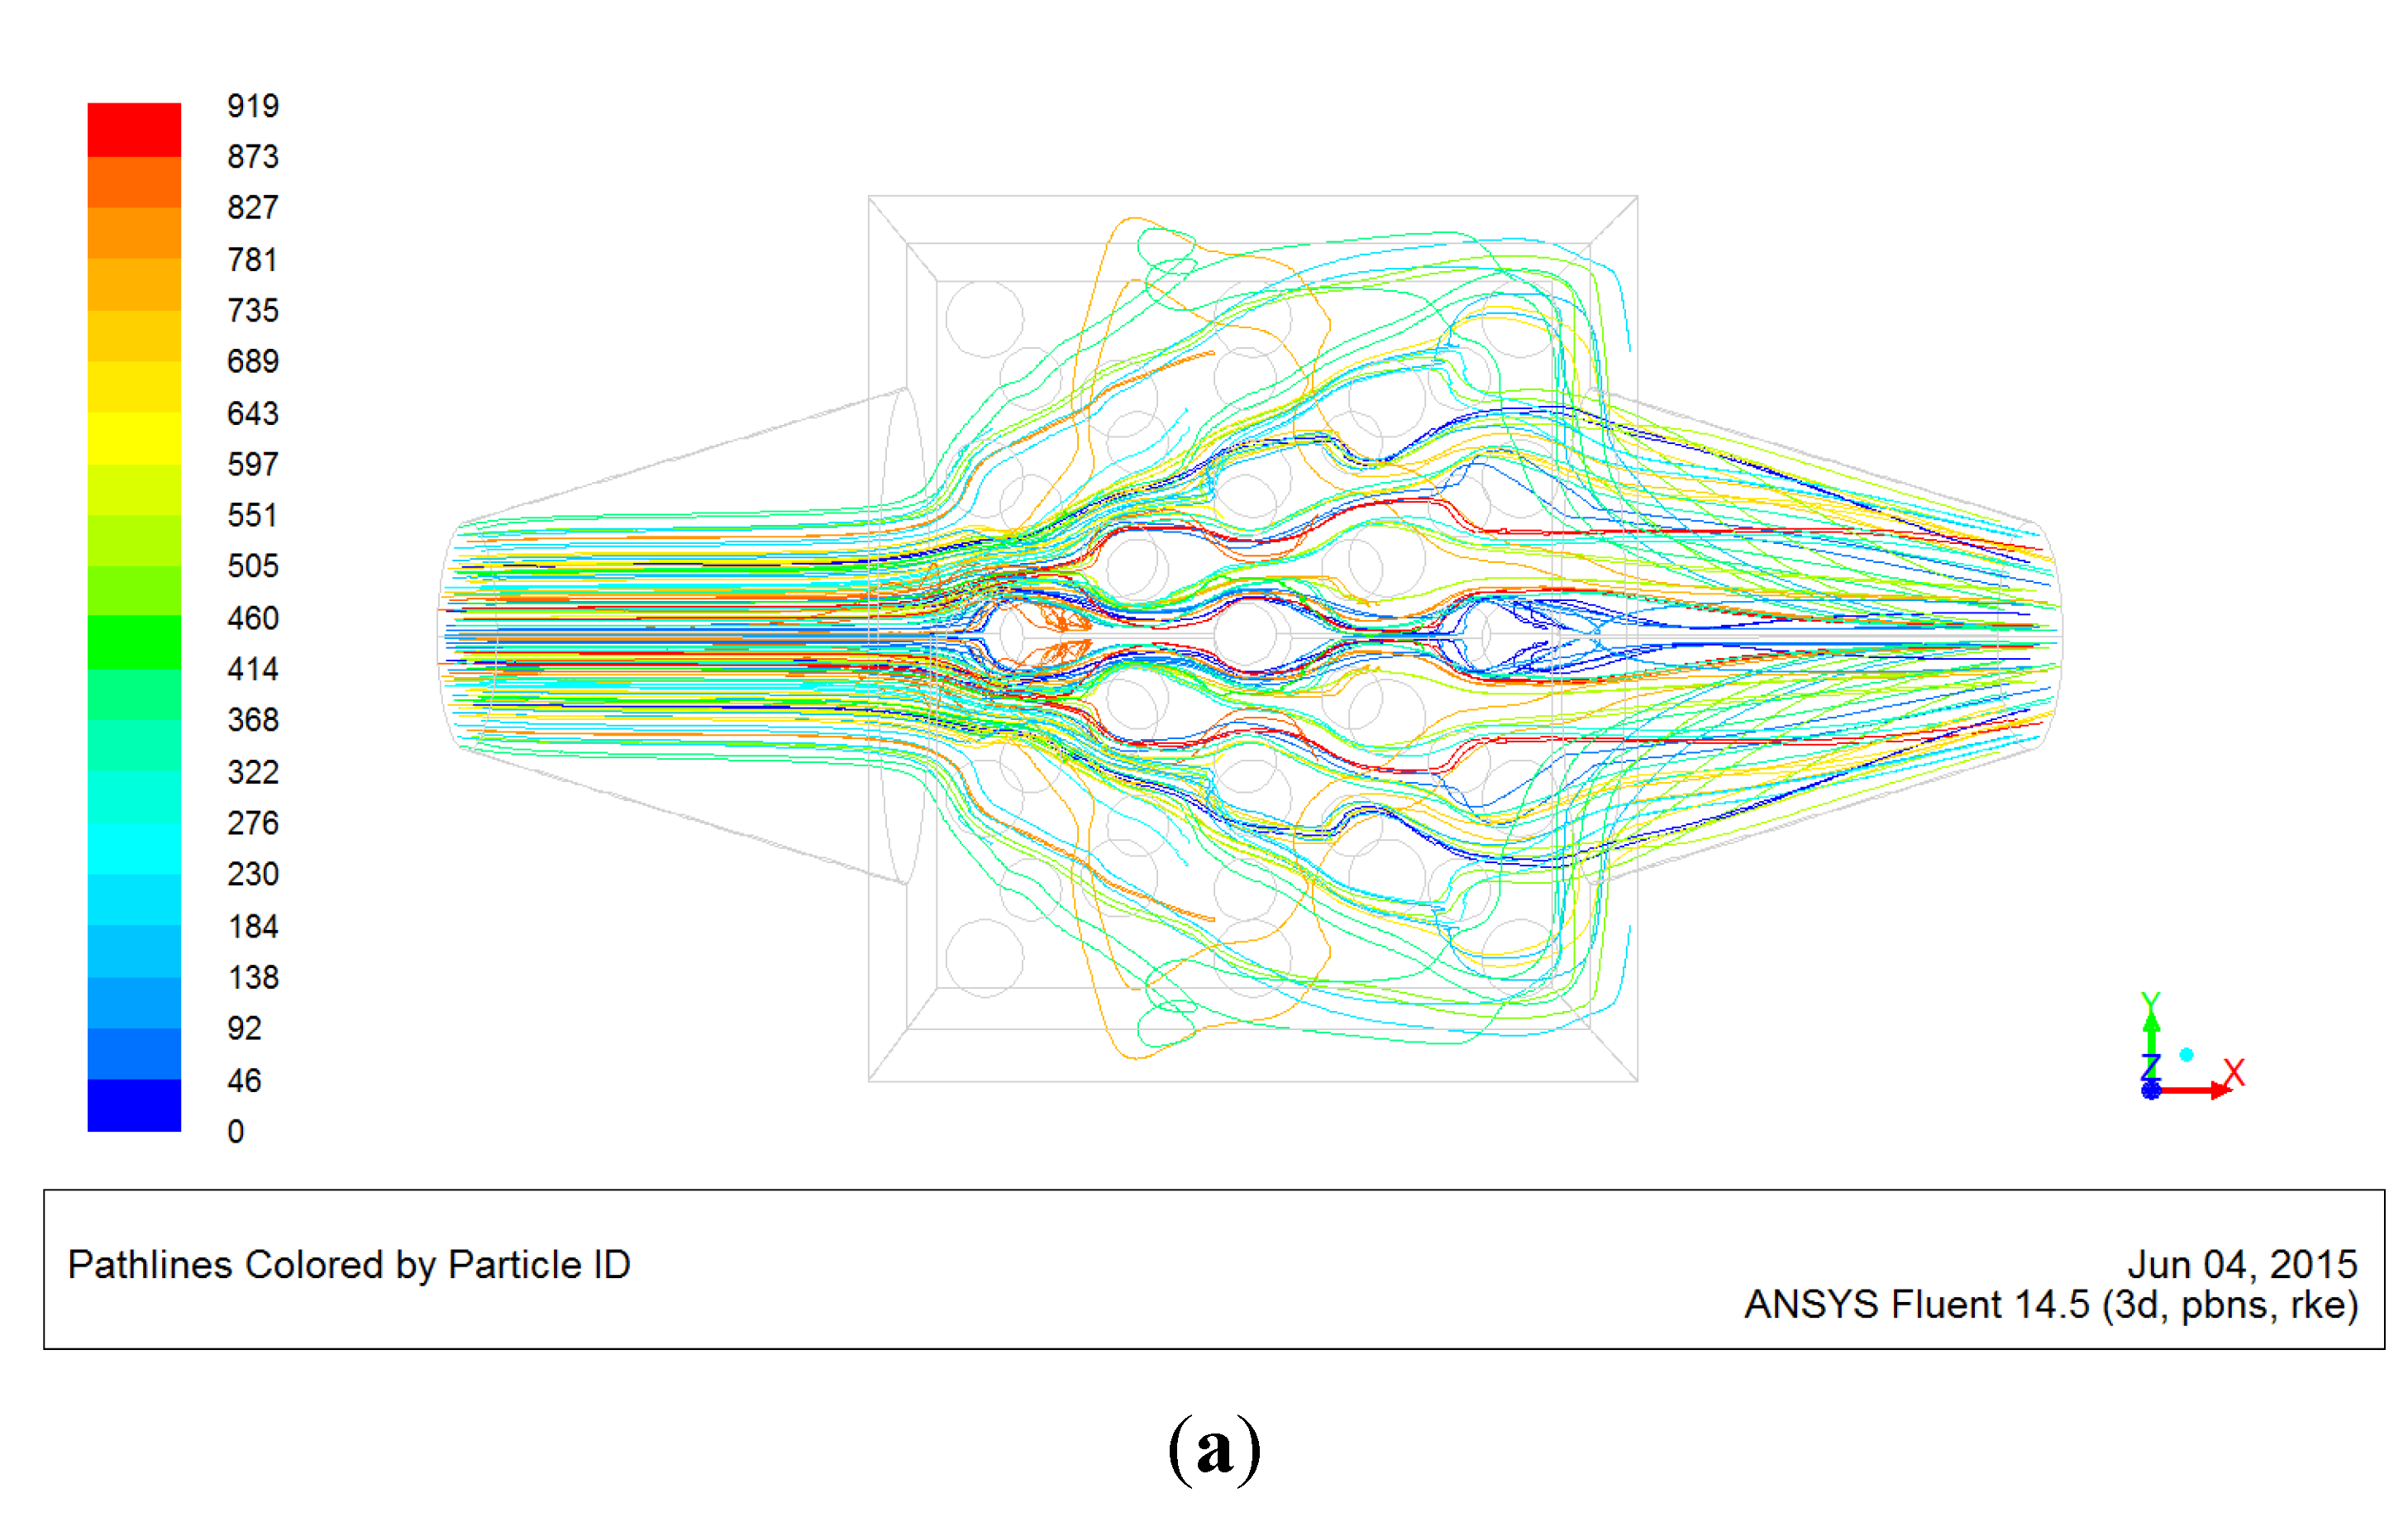
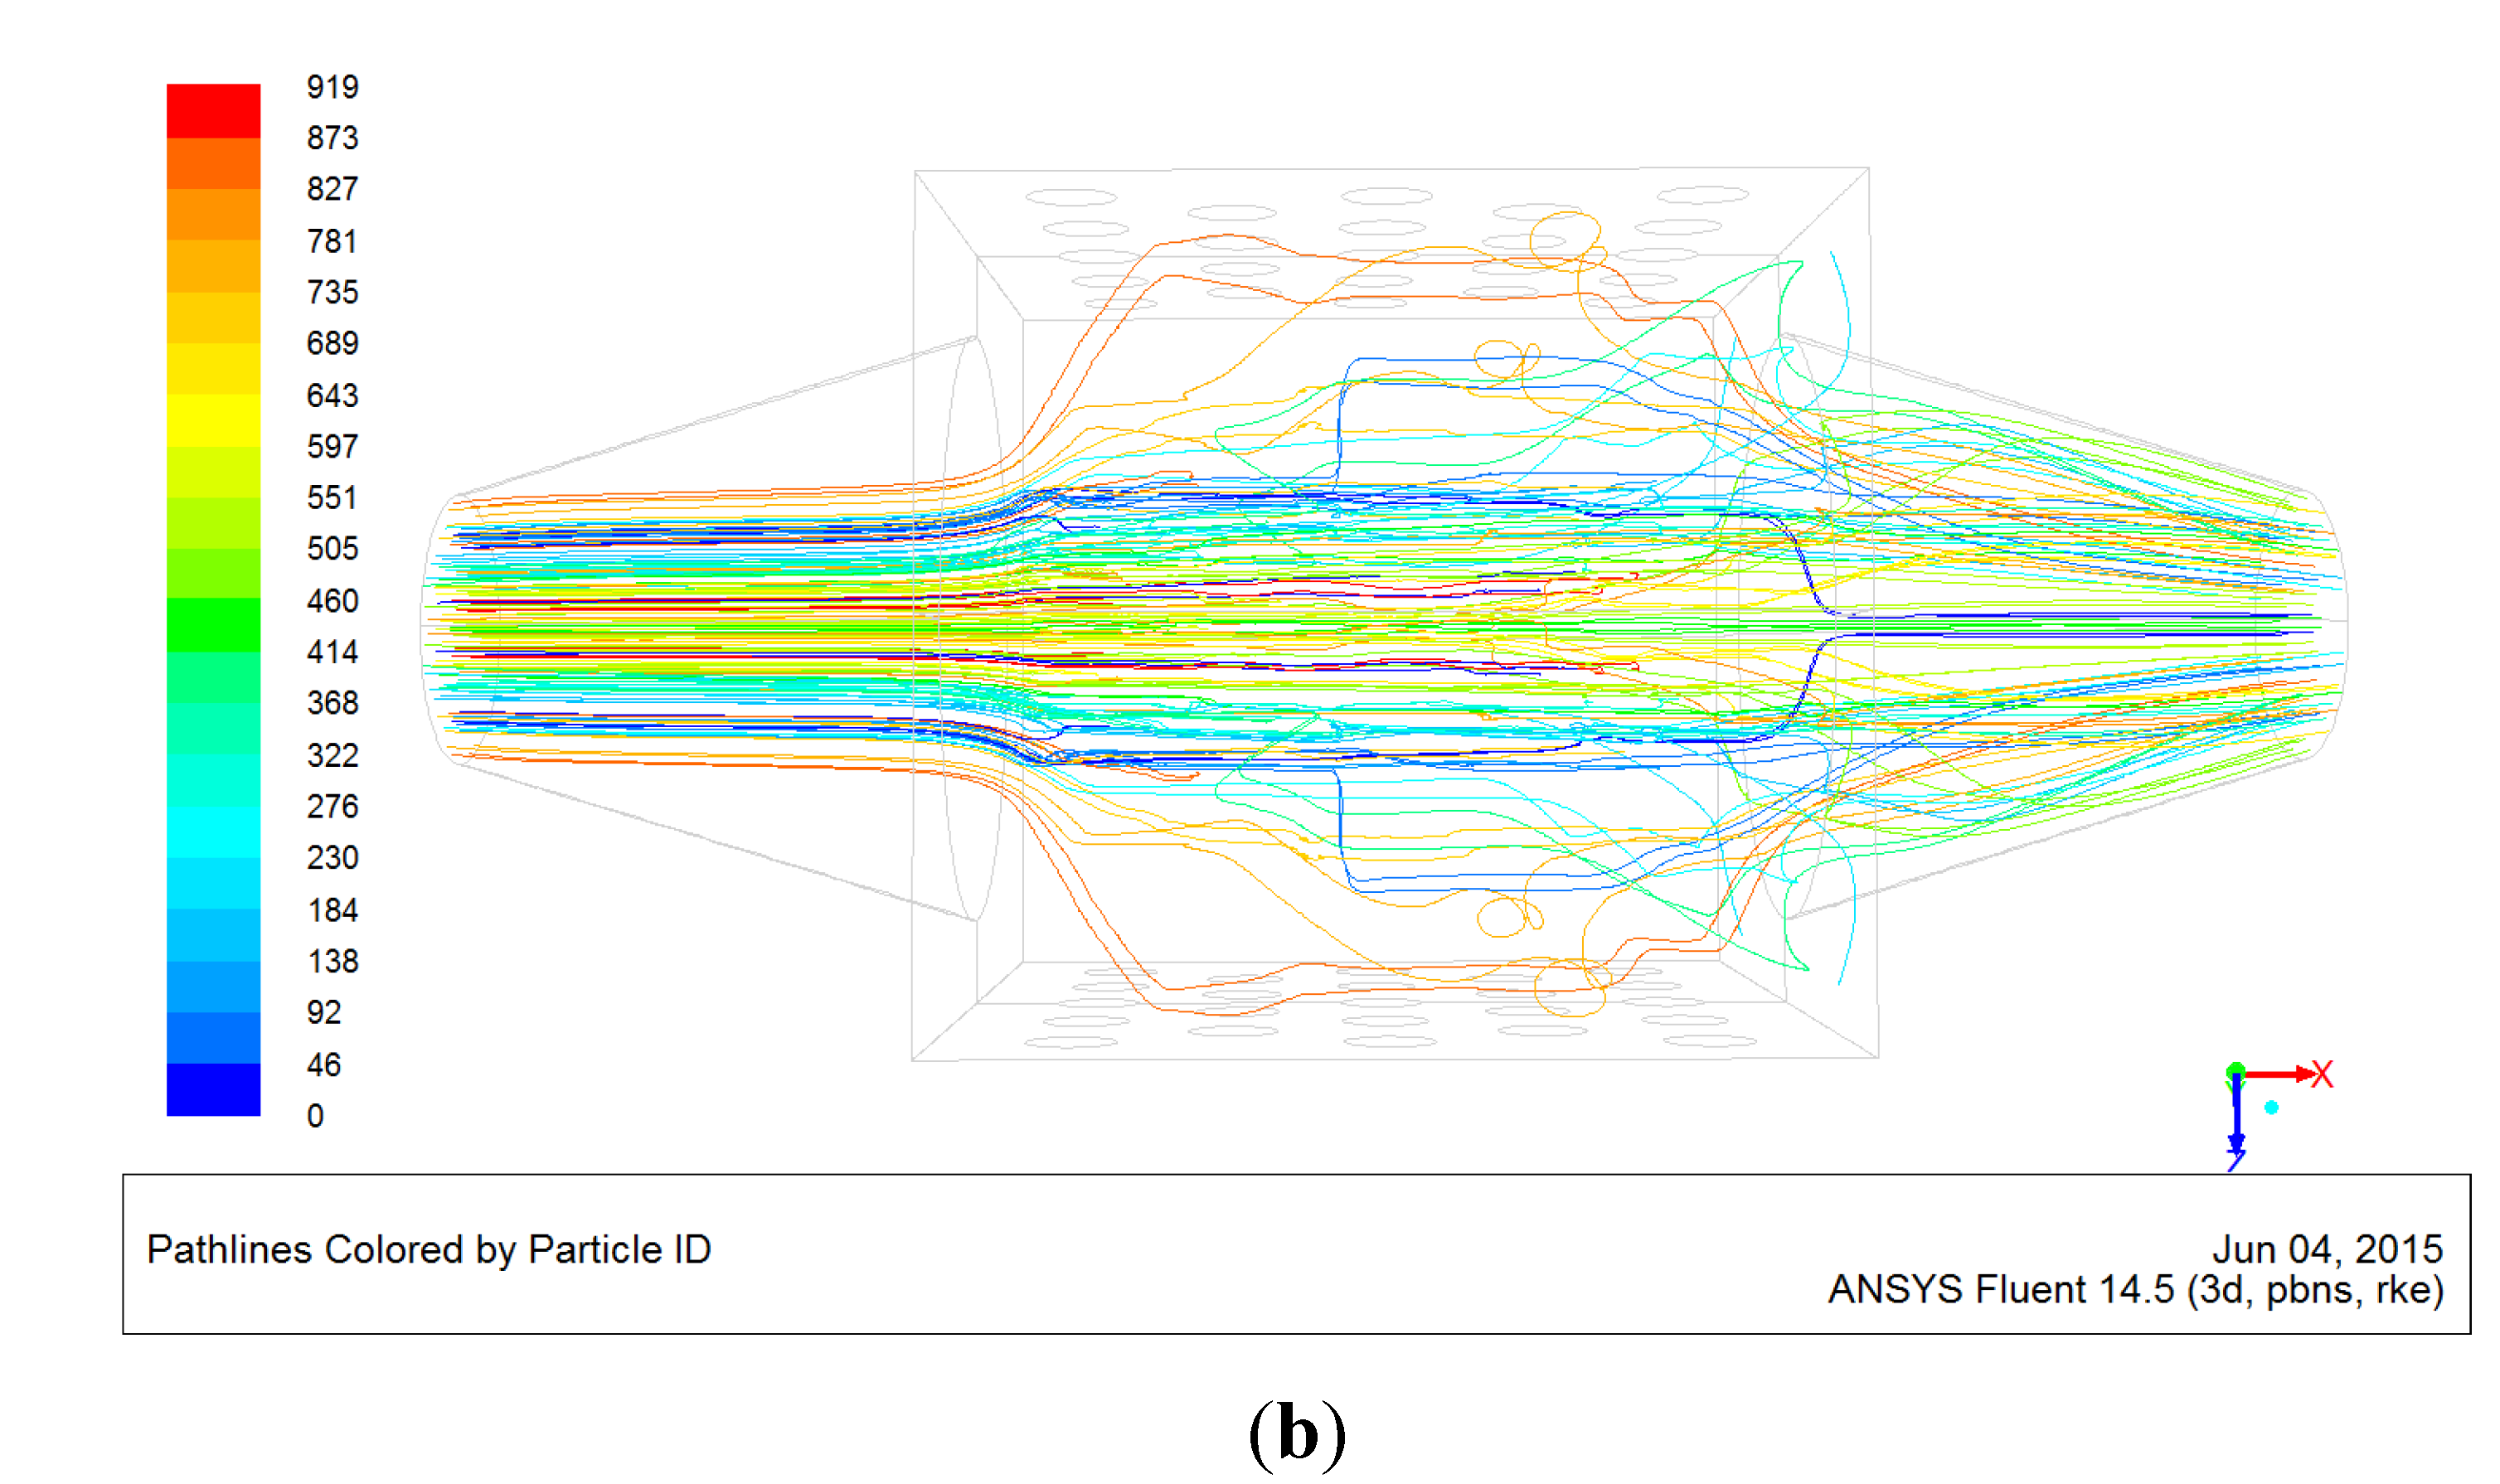
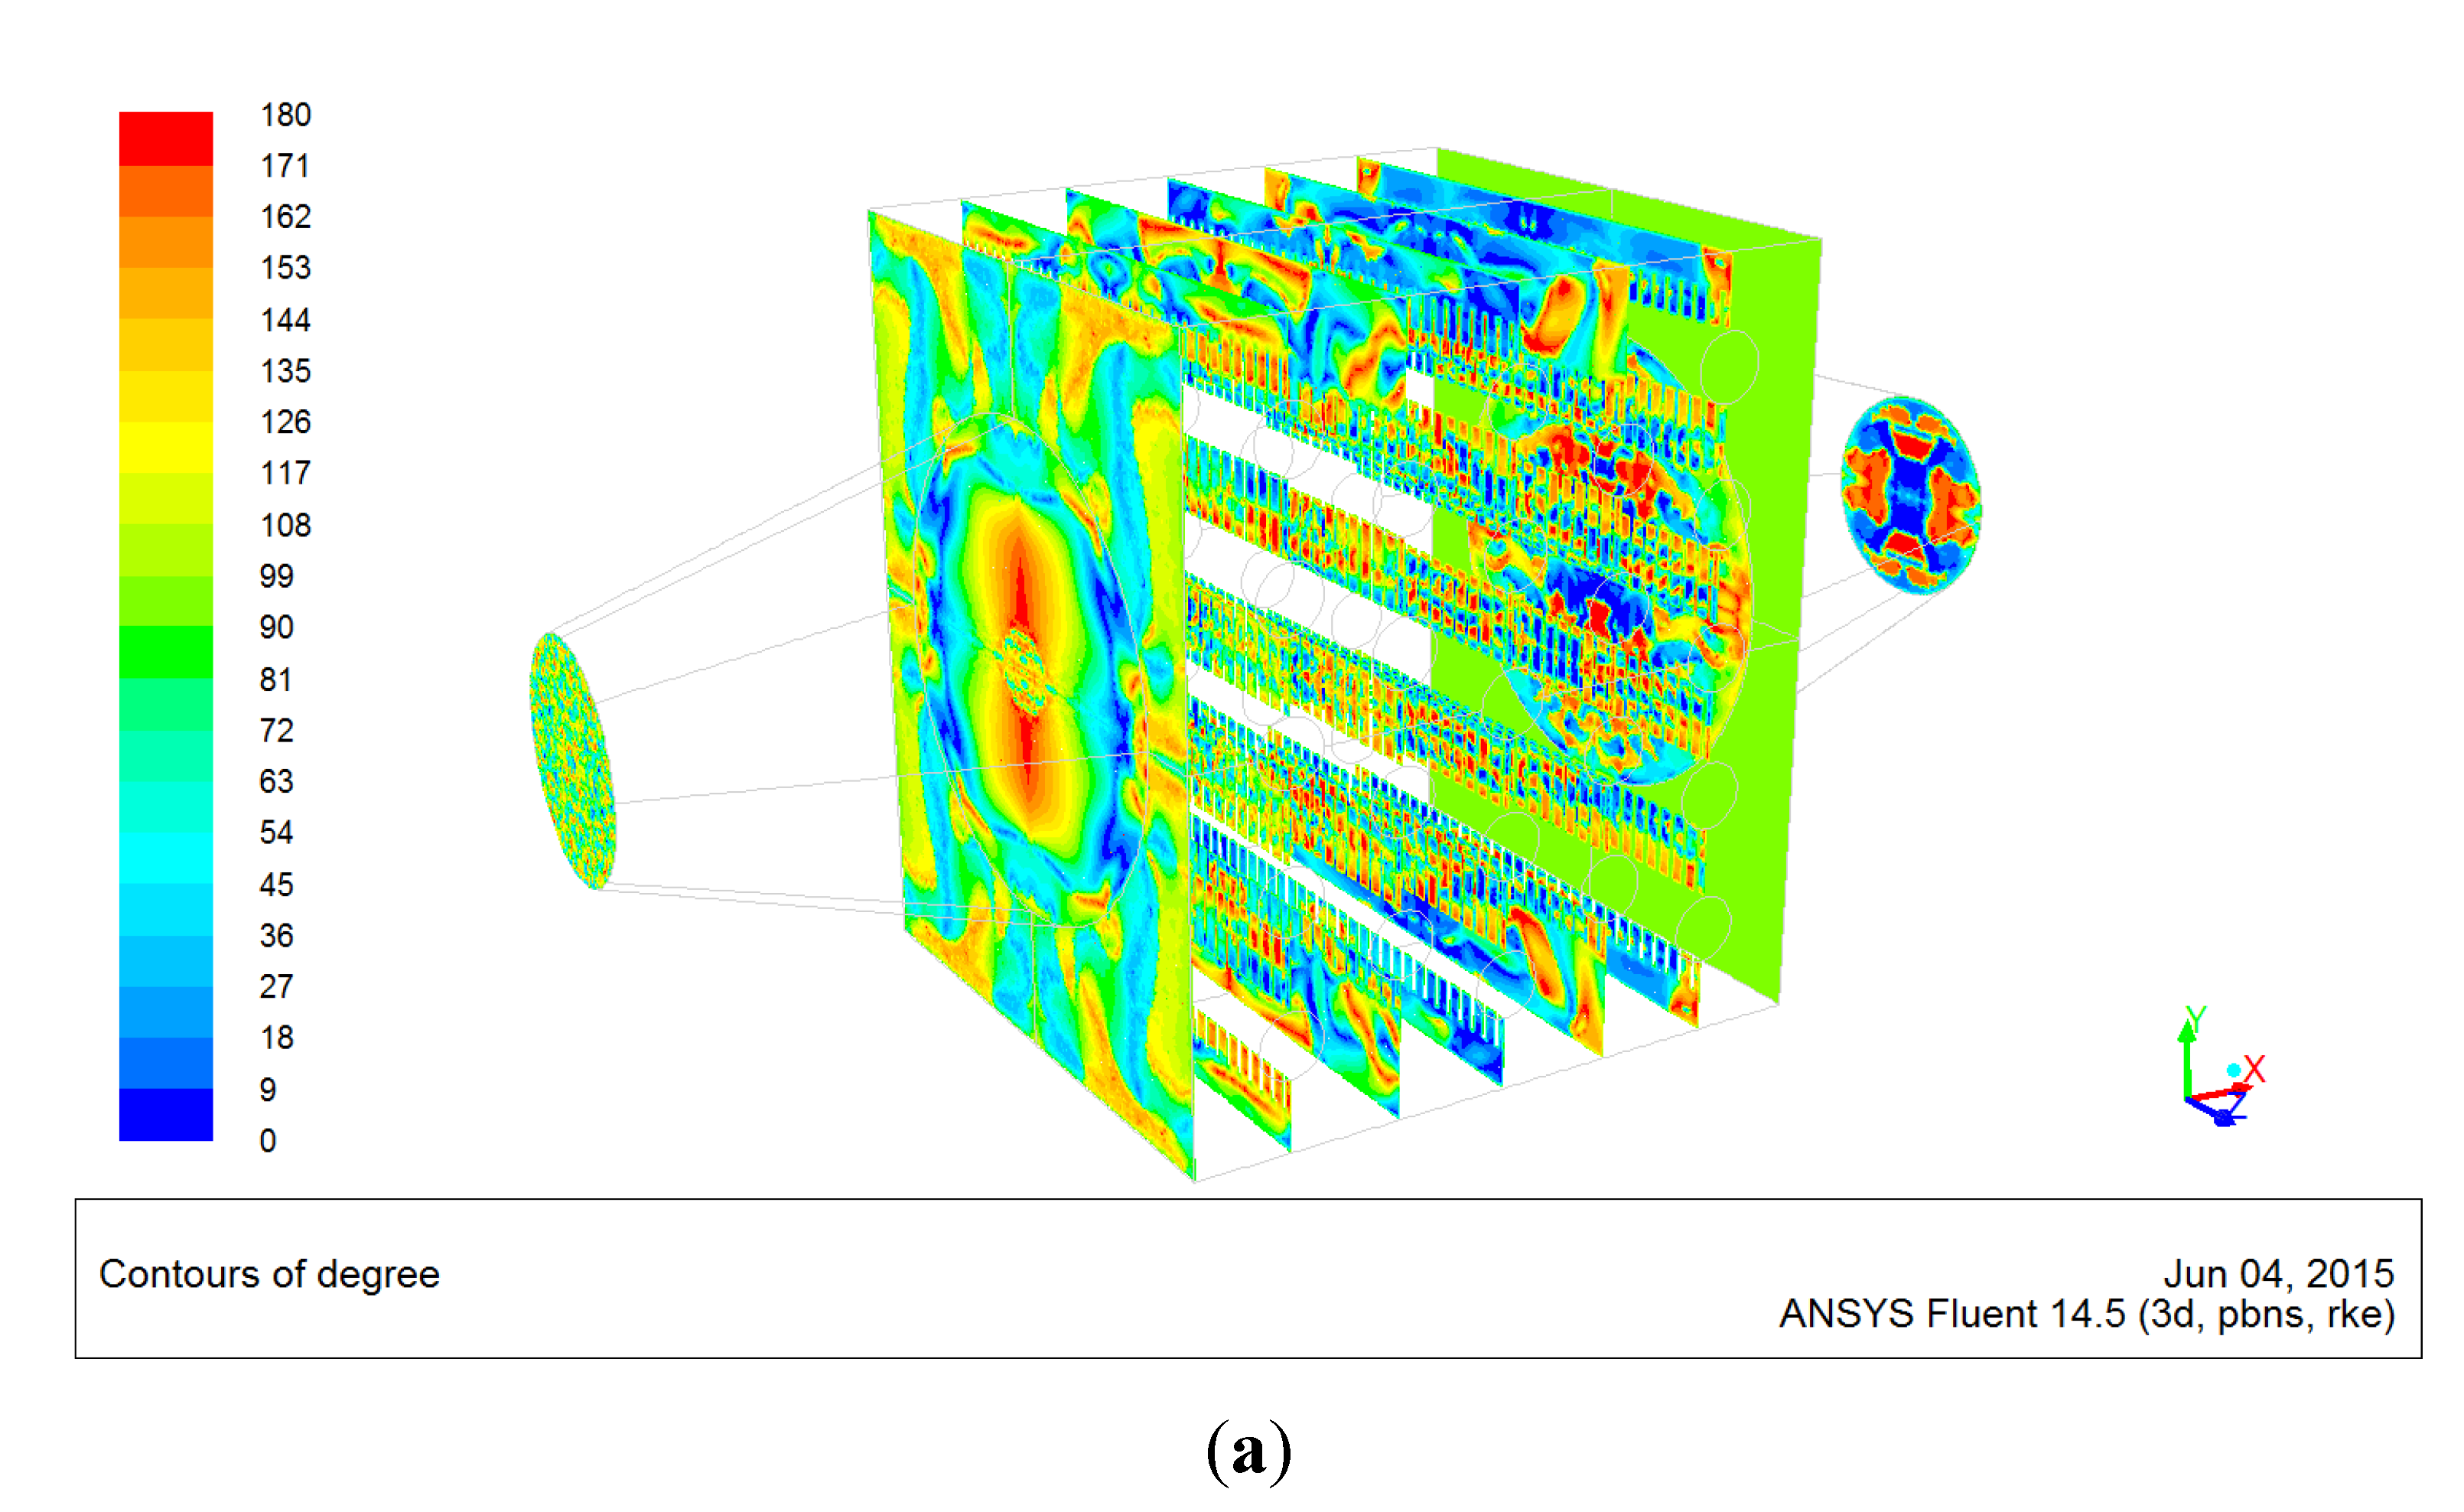
- The field synergy effect for the areas among the tube bundles of the evaporator main body and the field synergy effect for the areas among the fins on the windward side are satisfactory. However, the field synergy effect for the areas among the fins on the leeward side is weak. To further improve the heat transfer performance, the layout of the fins can be modified, and the shapes and angles of the fins can be adjusted to make the synergy angle between the velocity and the temperature gradient close to 0° or 180°, which can provide a theoretical guide for the design and performance optimization of the fin-and-tube evaporator.
- (3)
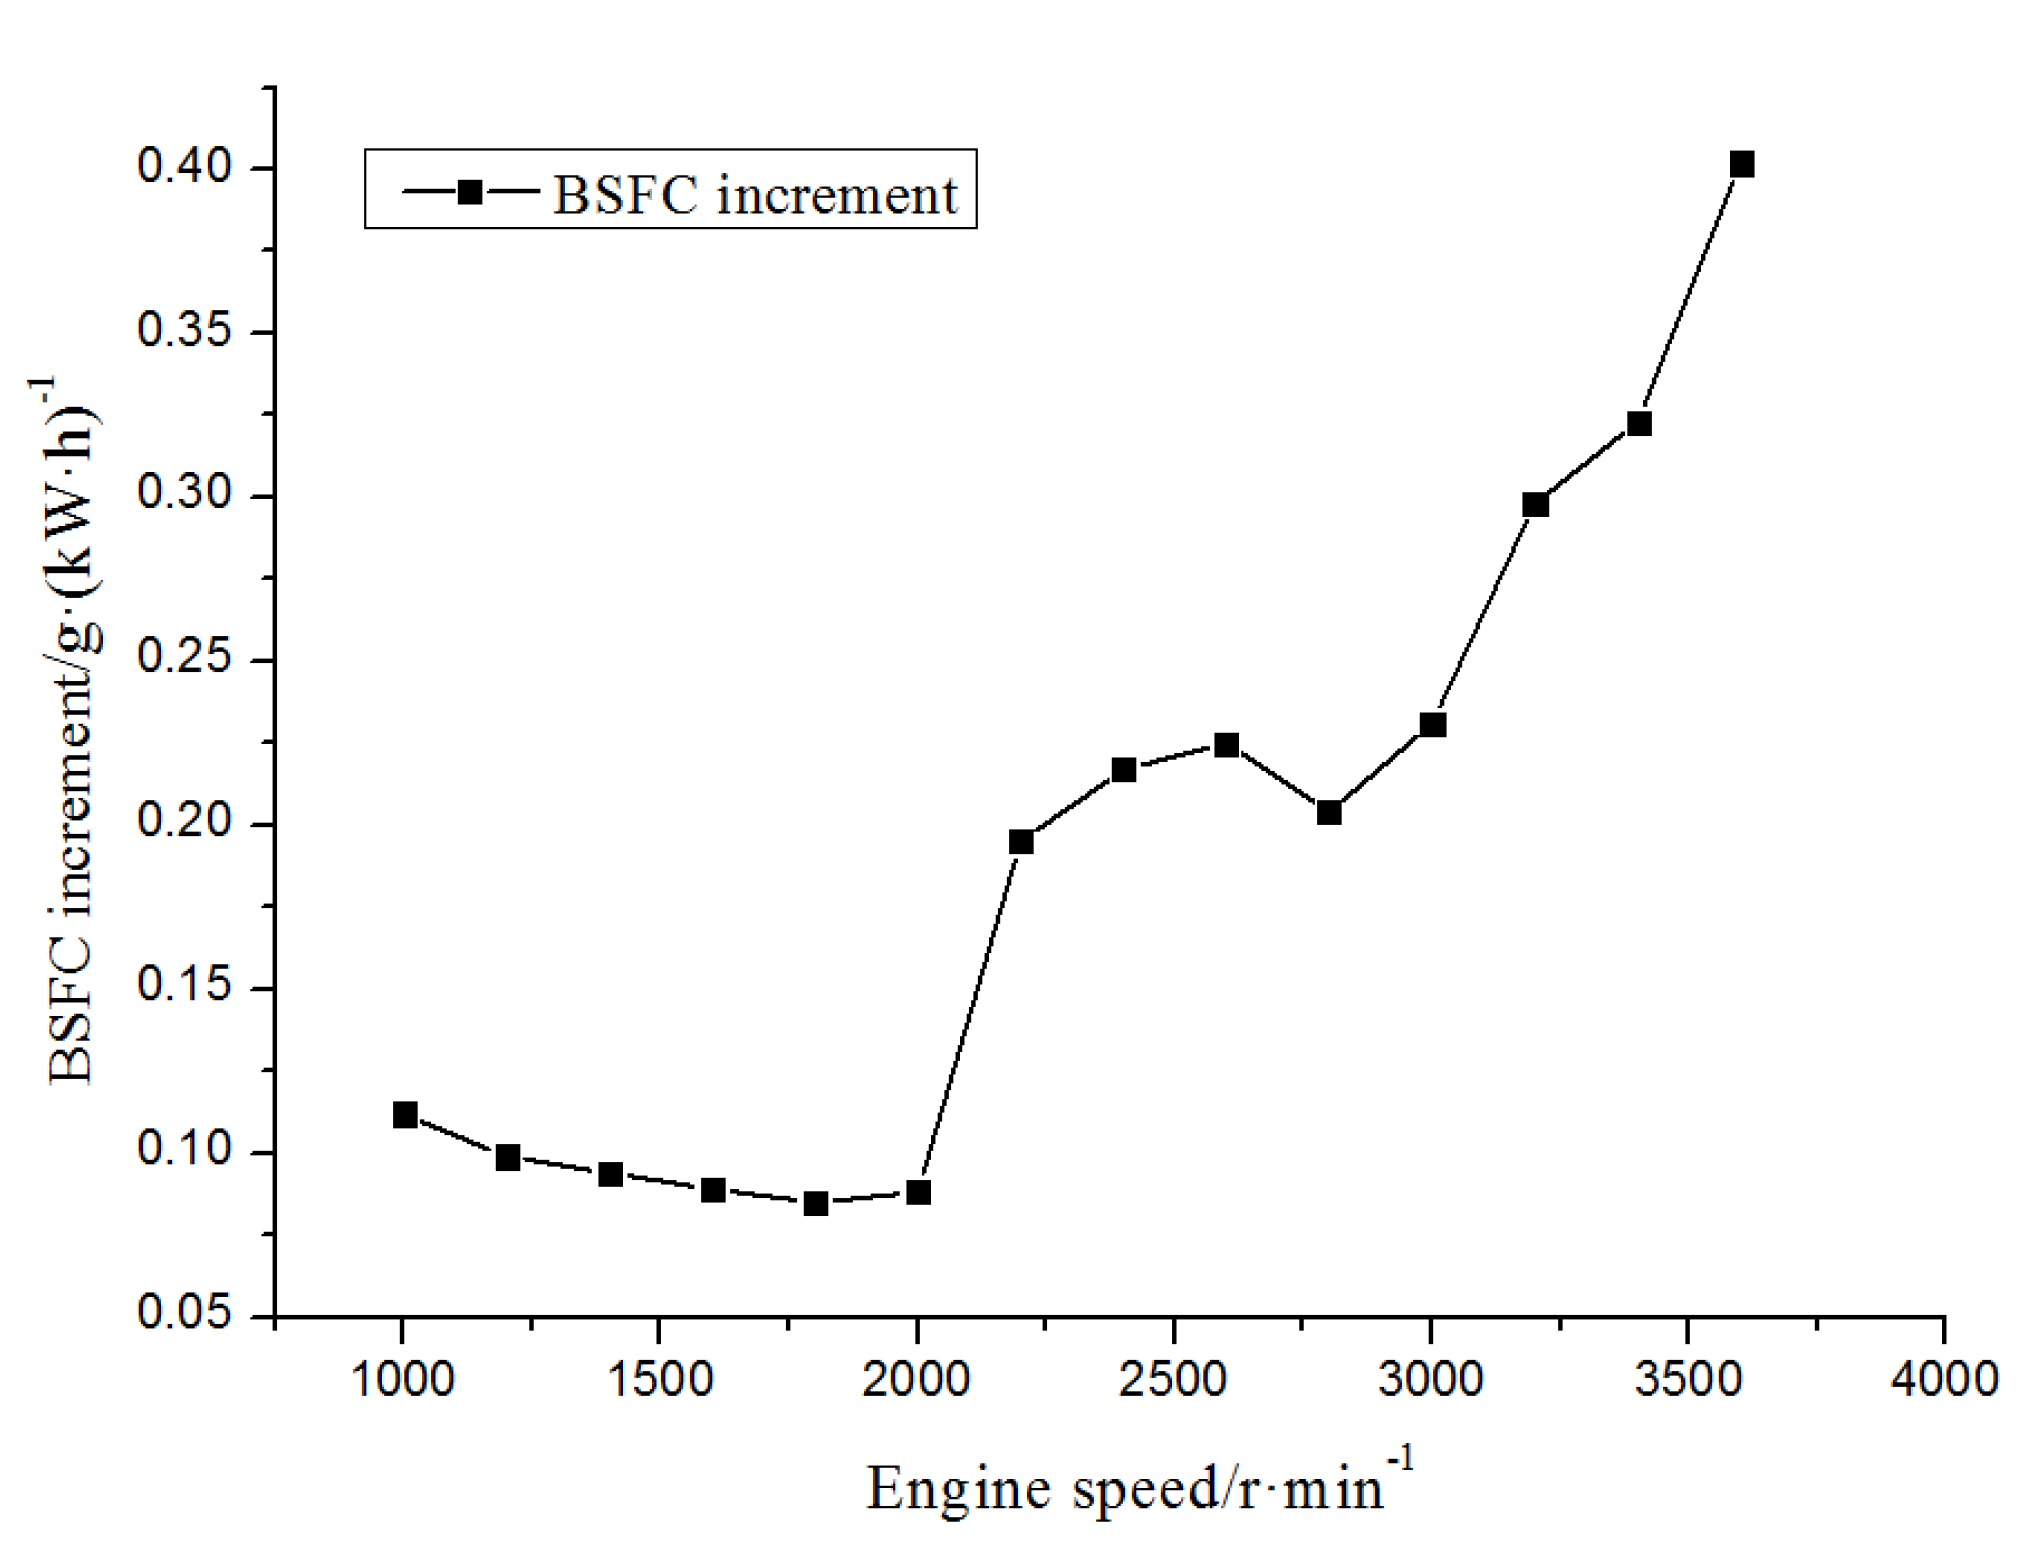
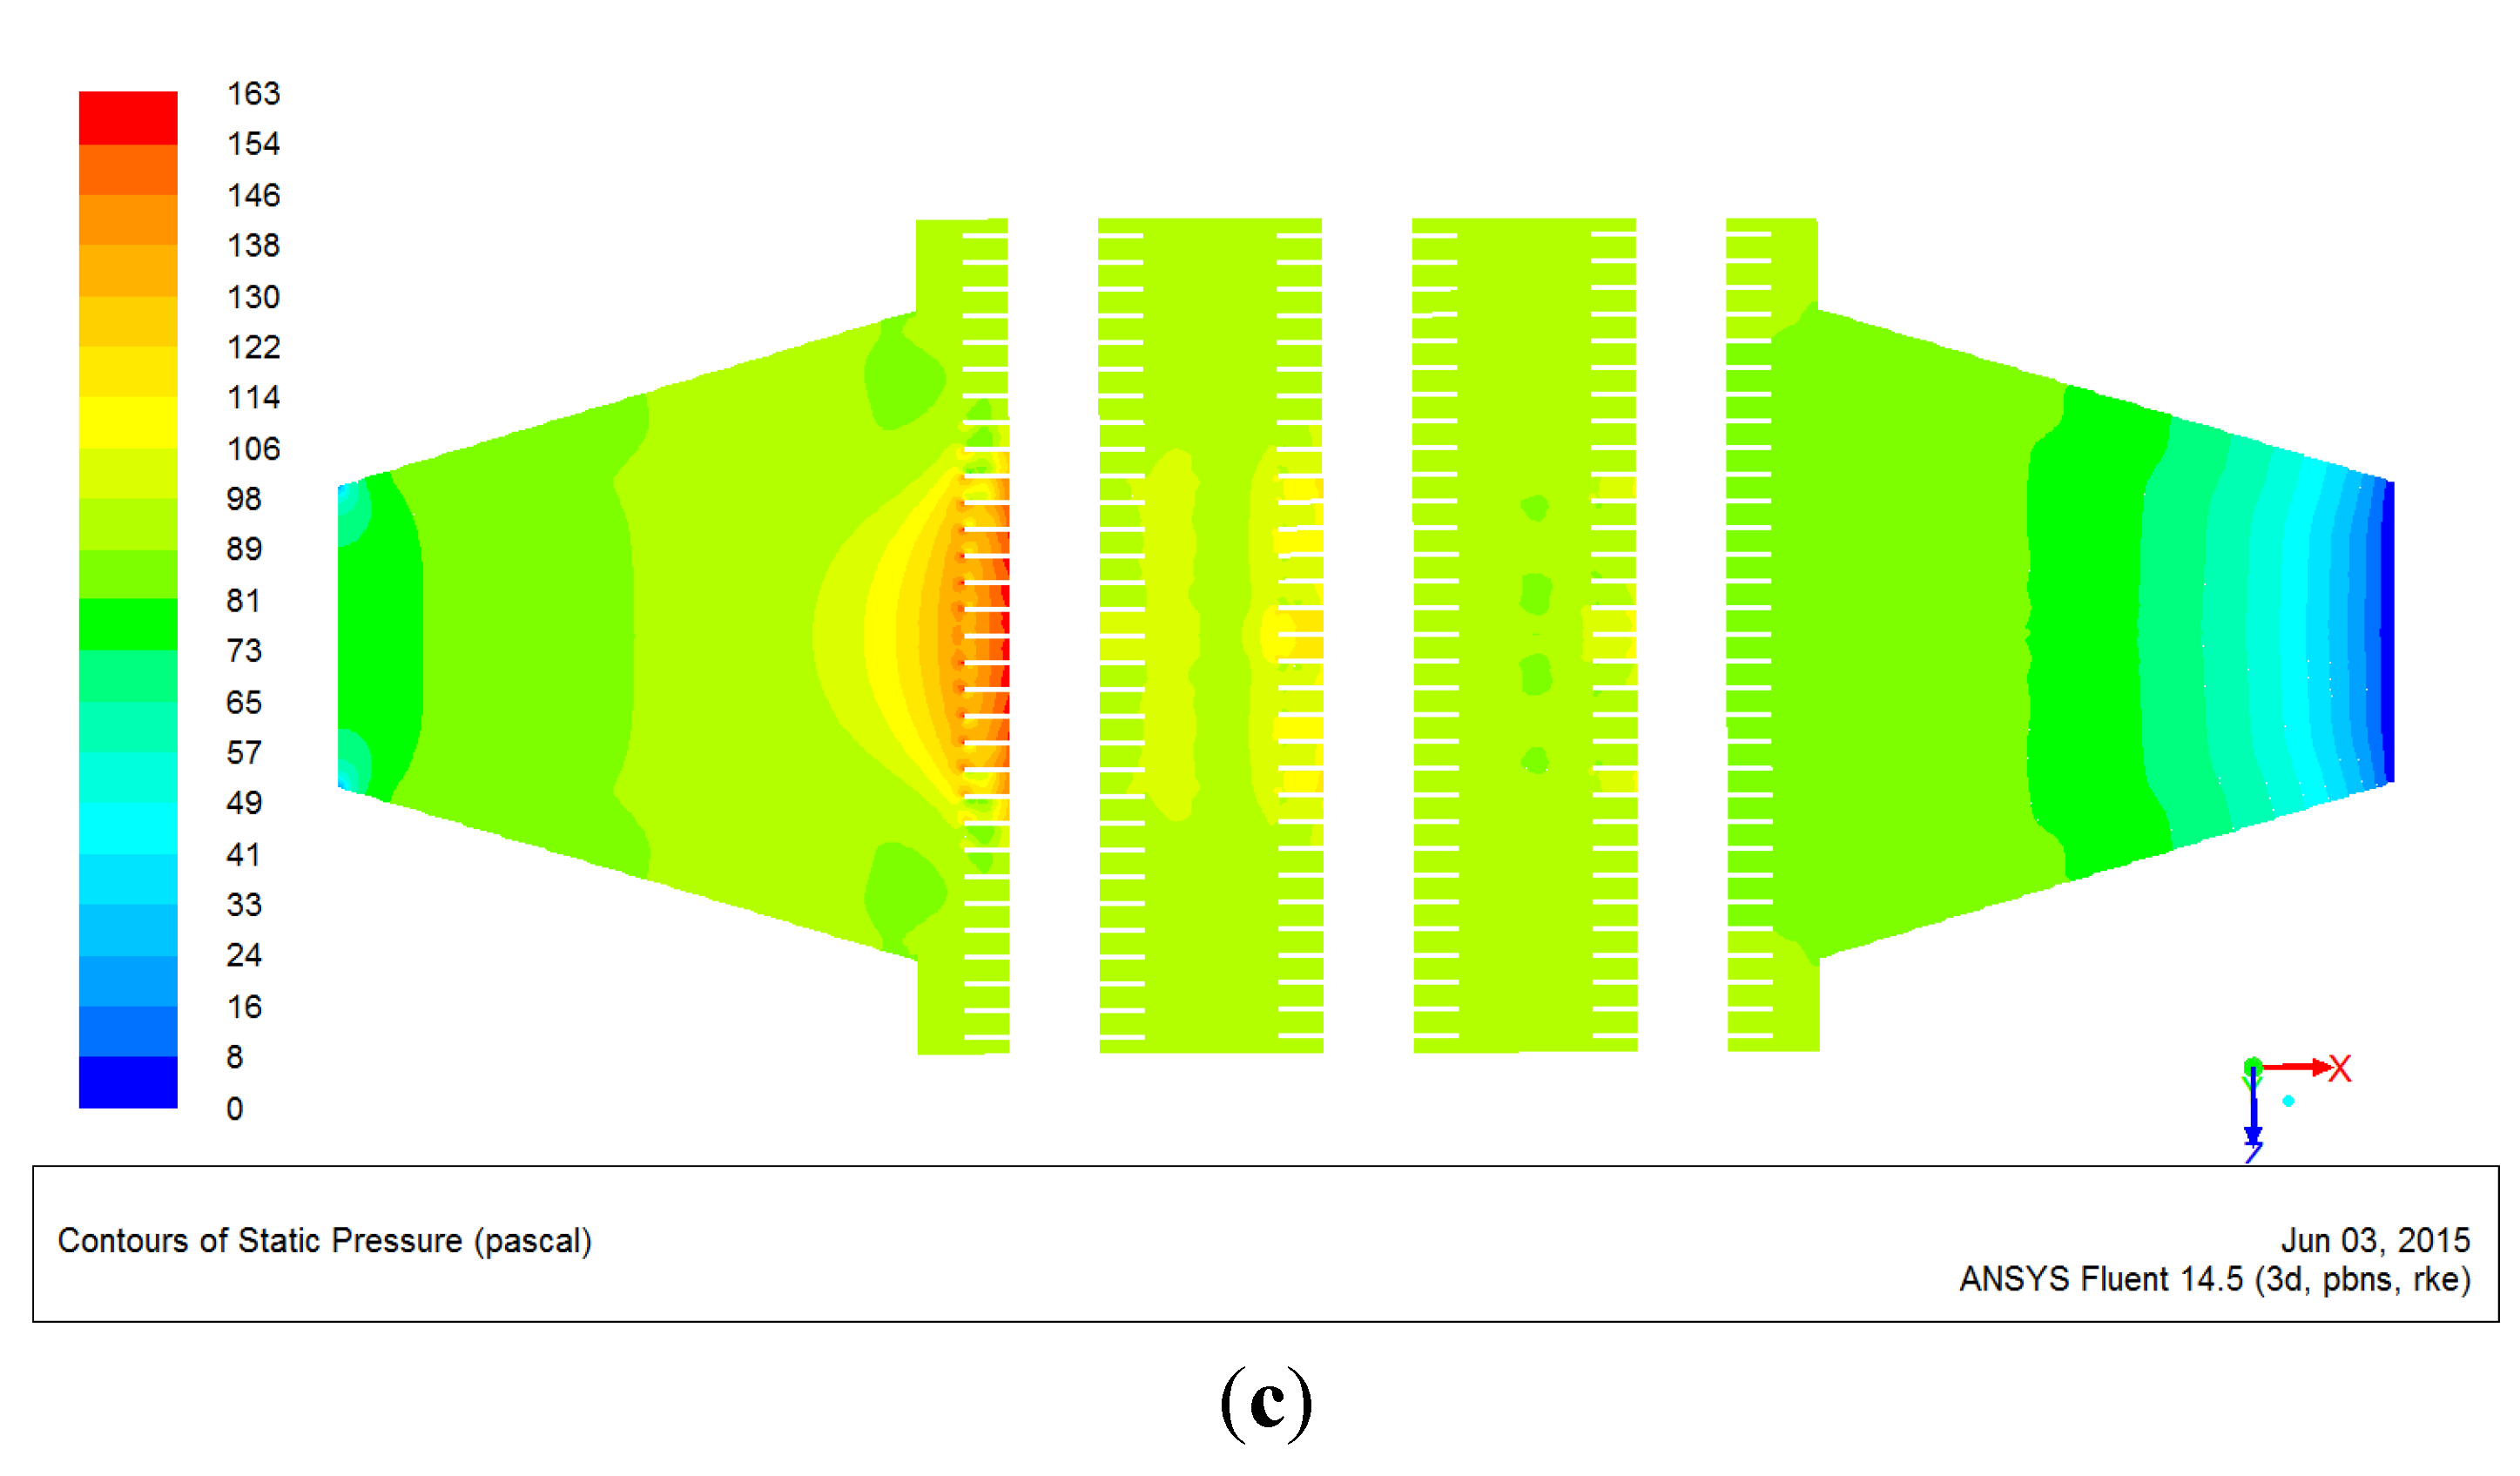
- As a result of the pressure drop caused by the evaporator of the ORC system, the diesel engine power and torque decrease slightly, whereas the BSFC increases slightly with the increase of the exhaust back pressure. With the increase of engine speed, the power loss, the torque loss, and the BSFC increment increase gradually, with the most significant change being less than 1%.
- (4)
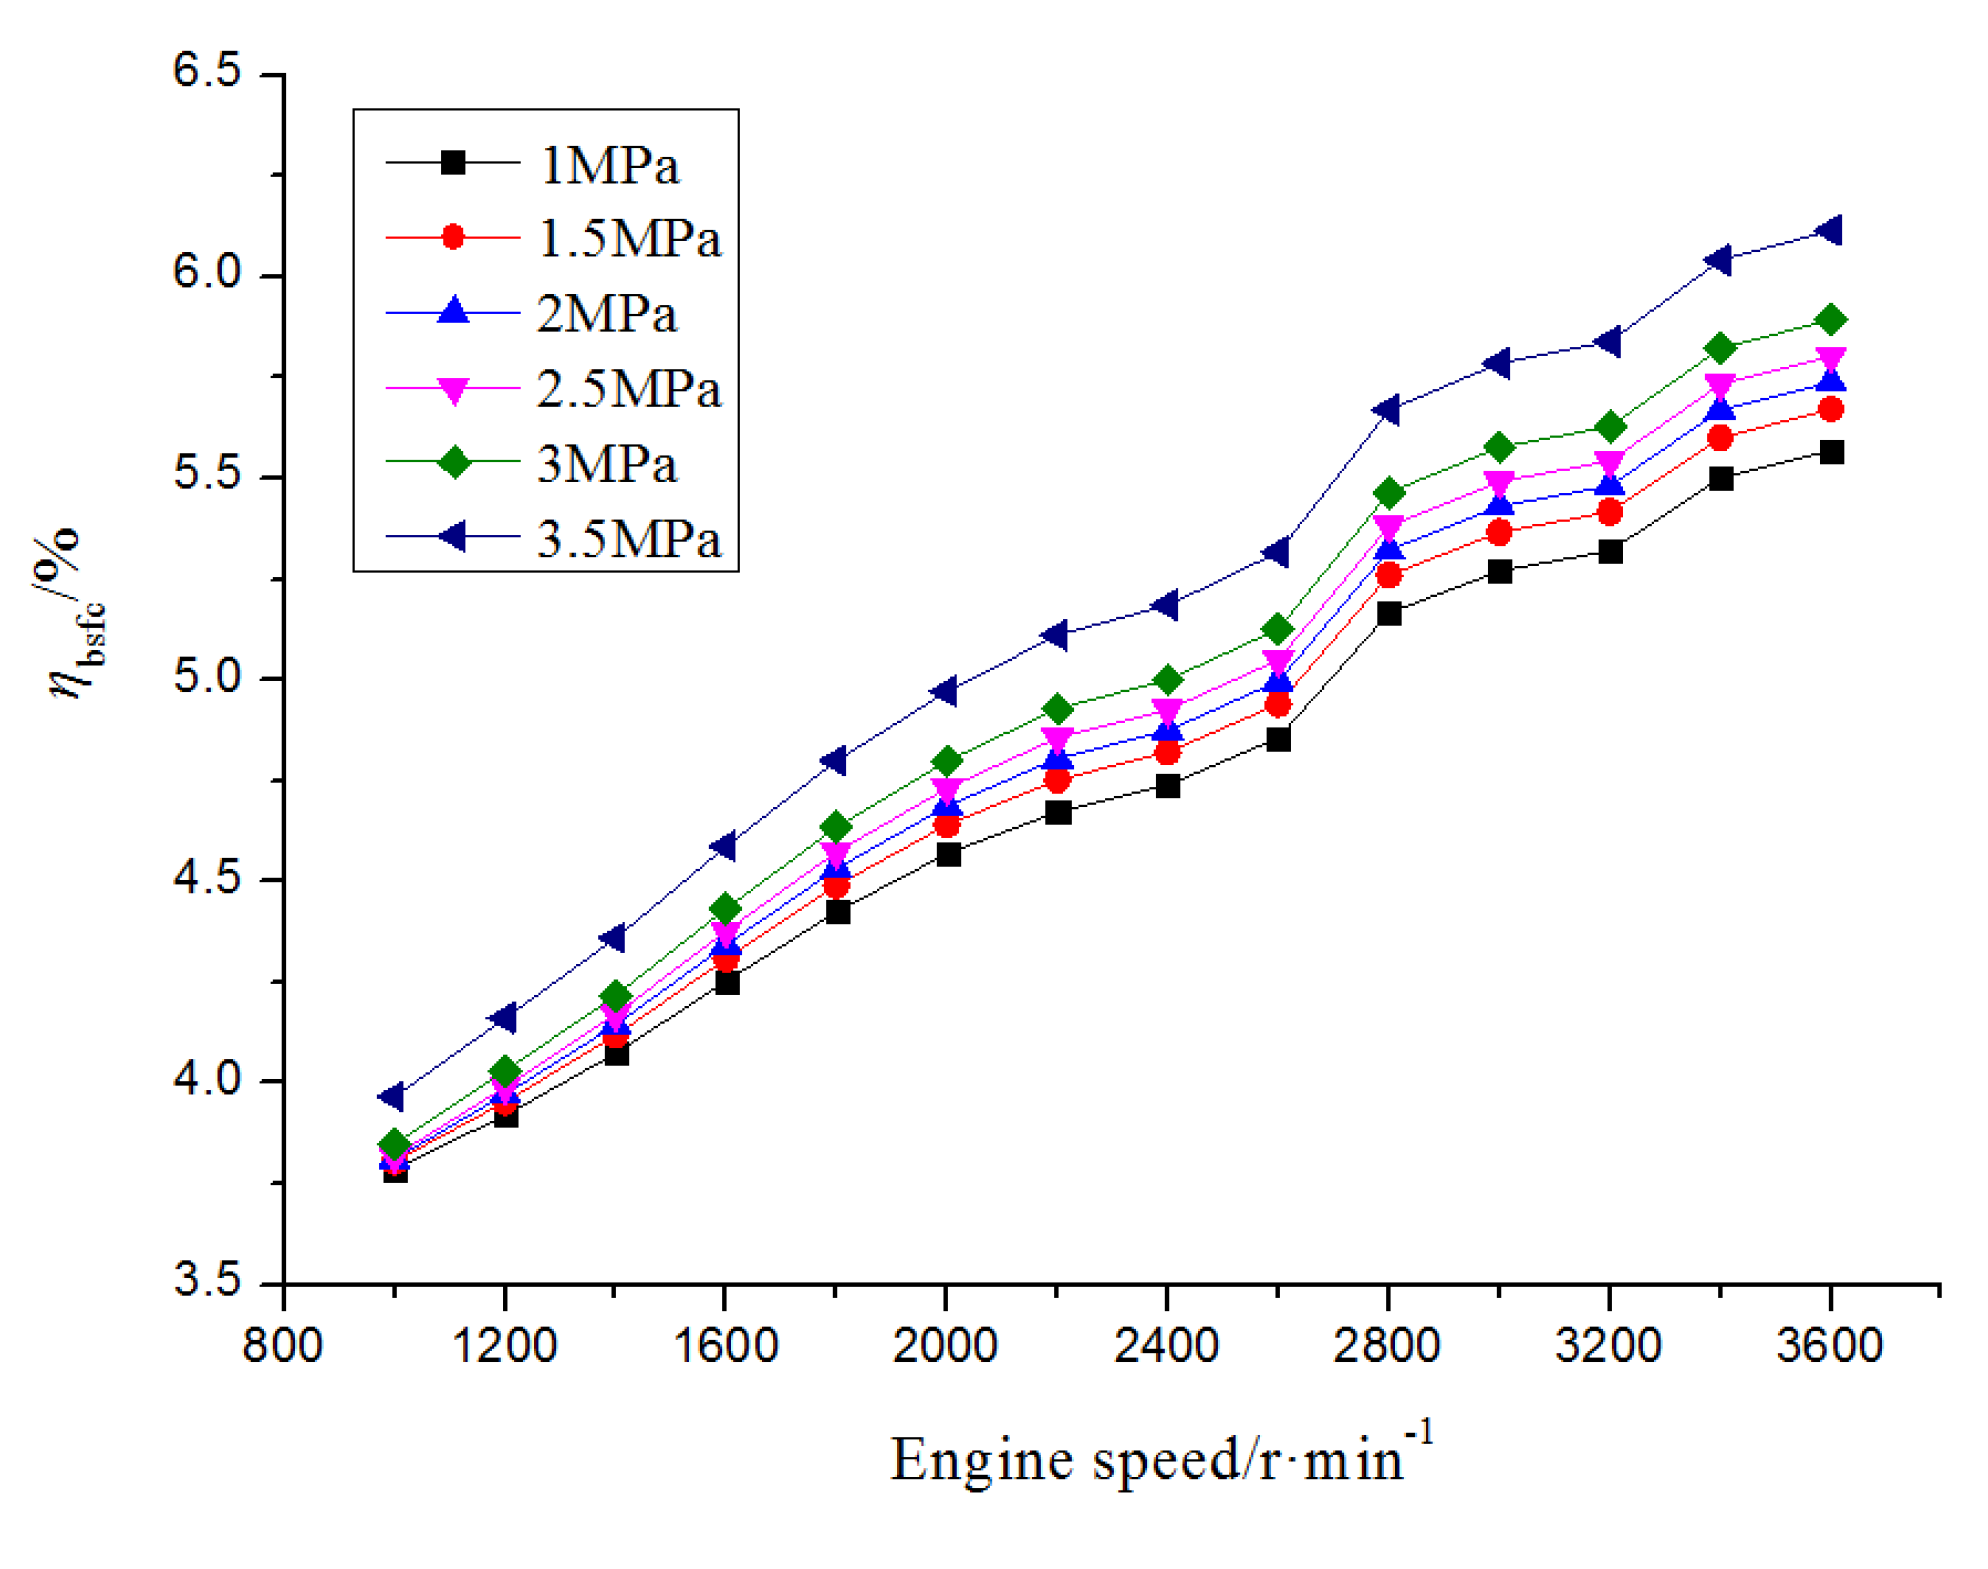
- Compared with the diesel engine itself, the maximum increase of power output is 6.5% for the diesel engine–ORC combined system, and the maximum decrease of BSFC is 6.1%.
Acknowledgments
Author Contributions
Conflicts of Interest
Acronyms
| ORC | organic Rankine cycle |
| BSFC | brake specific fuel consumption |
Greek Letters
| ρ | density (kg·m−3) |
| λ | thermal conductivity (W·(m·K)−1) |
| μ | dynamic viscosity (kg·(m·s)−1) |
| Φa | excess air coefficient |
| Φij | interaction factor |
| ηw | power increase rate of the diesel engine-ORC combined system (%) |
| ηbsfc | BSFC decrease rate of the diesel engine-ORC combined system (%) |
| δt | thermal boundary layer thickness (m) |
| β | intersection angle between velocity and temperature gradient (degree) |
| ηp | isentropic efficiency of pump (%) |
| ηs | isentropic efficiency of expander (%) |
Subscripts
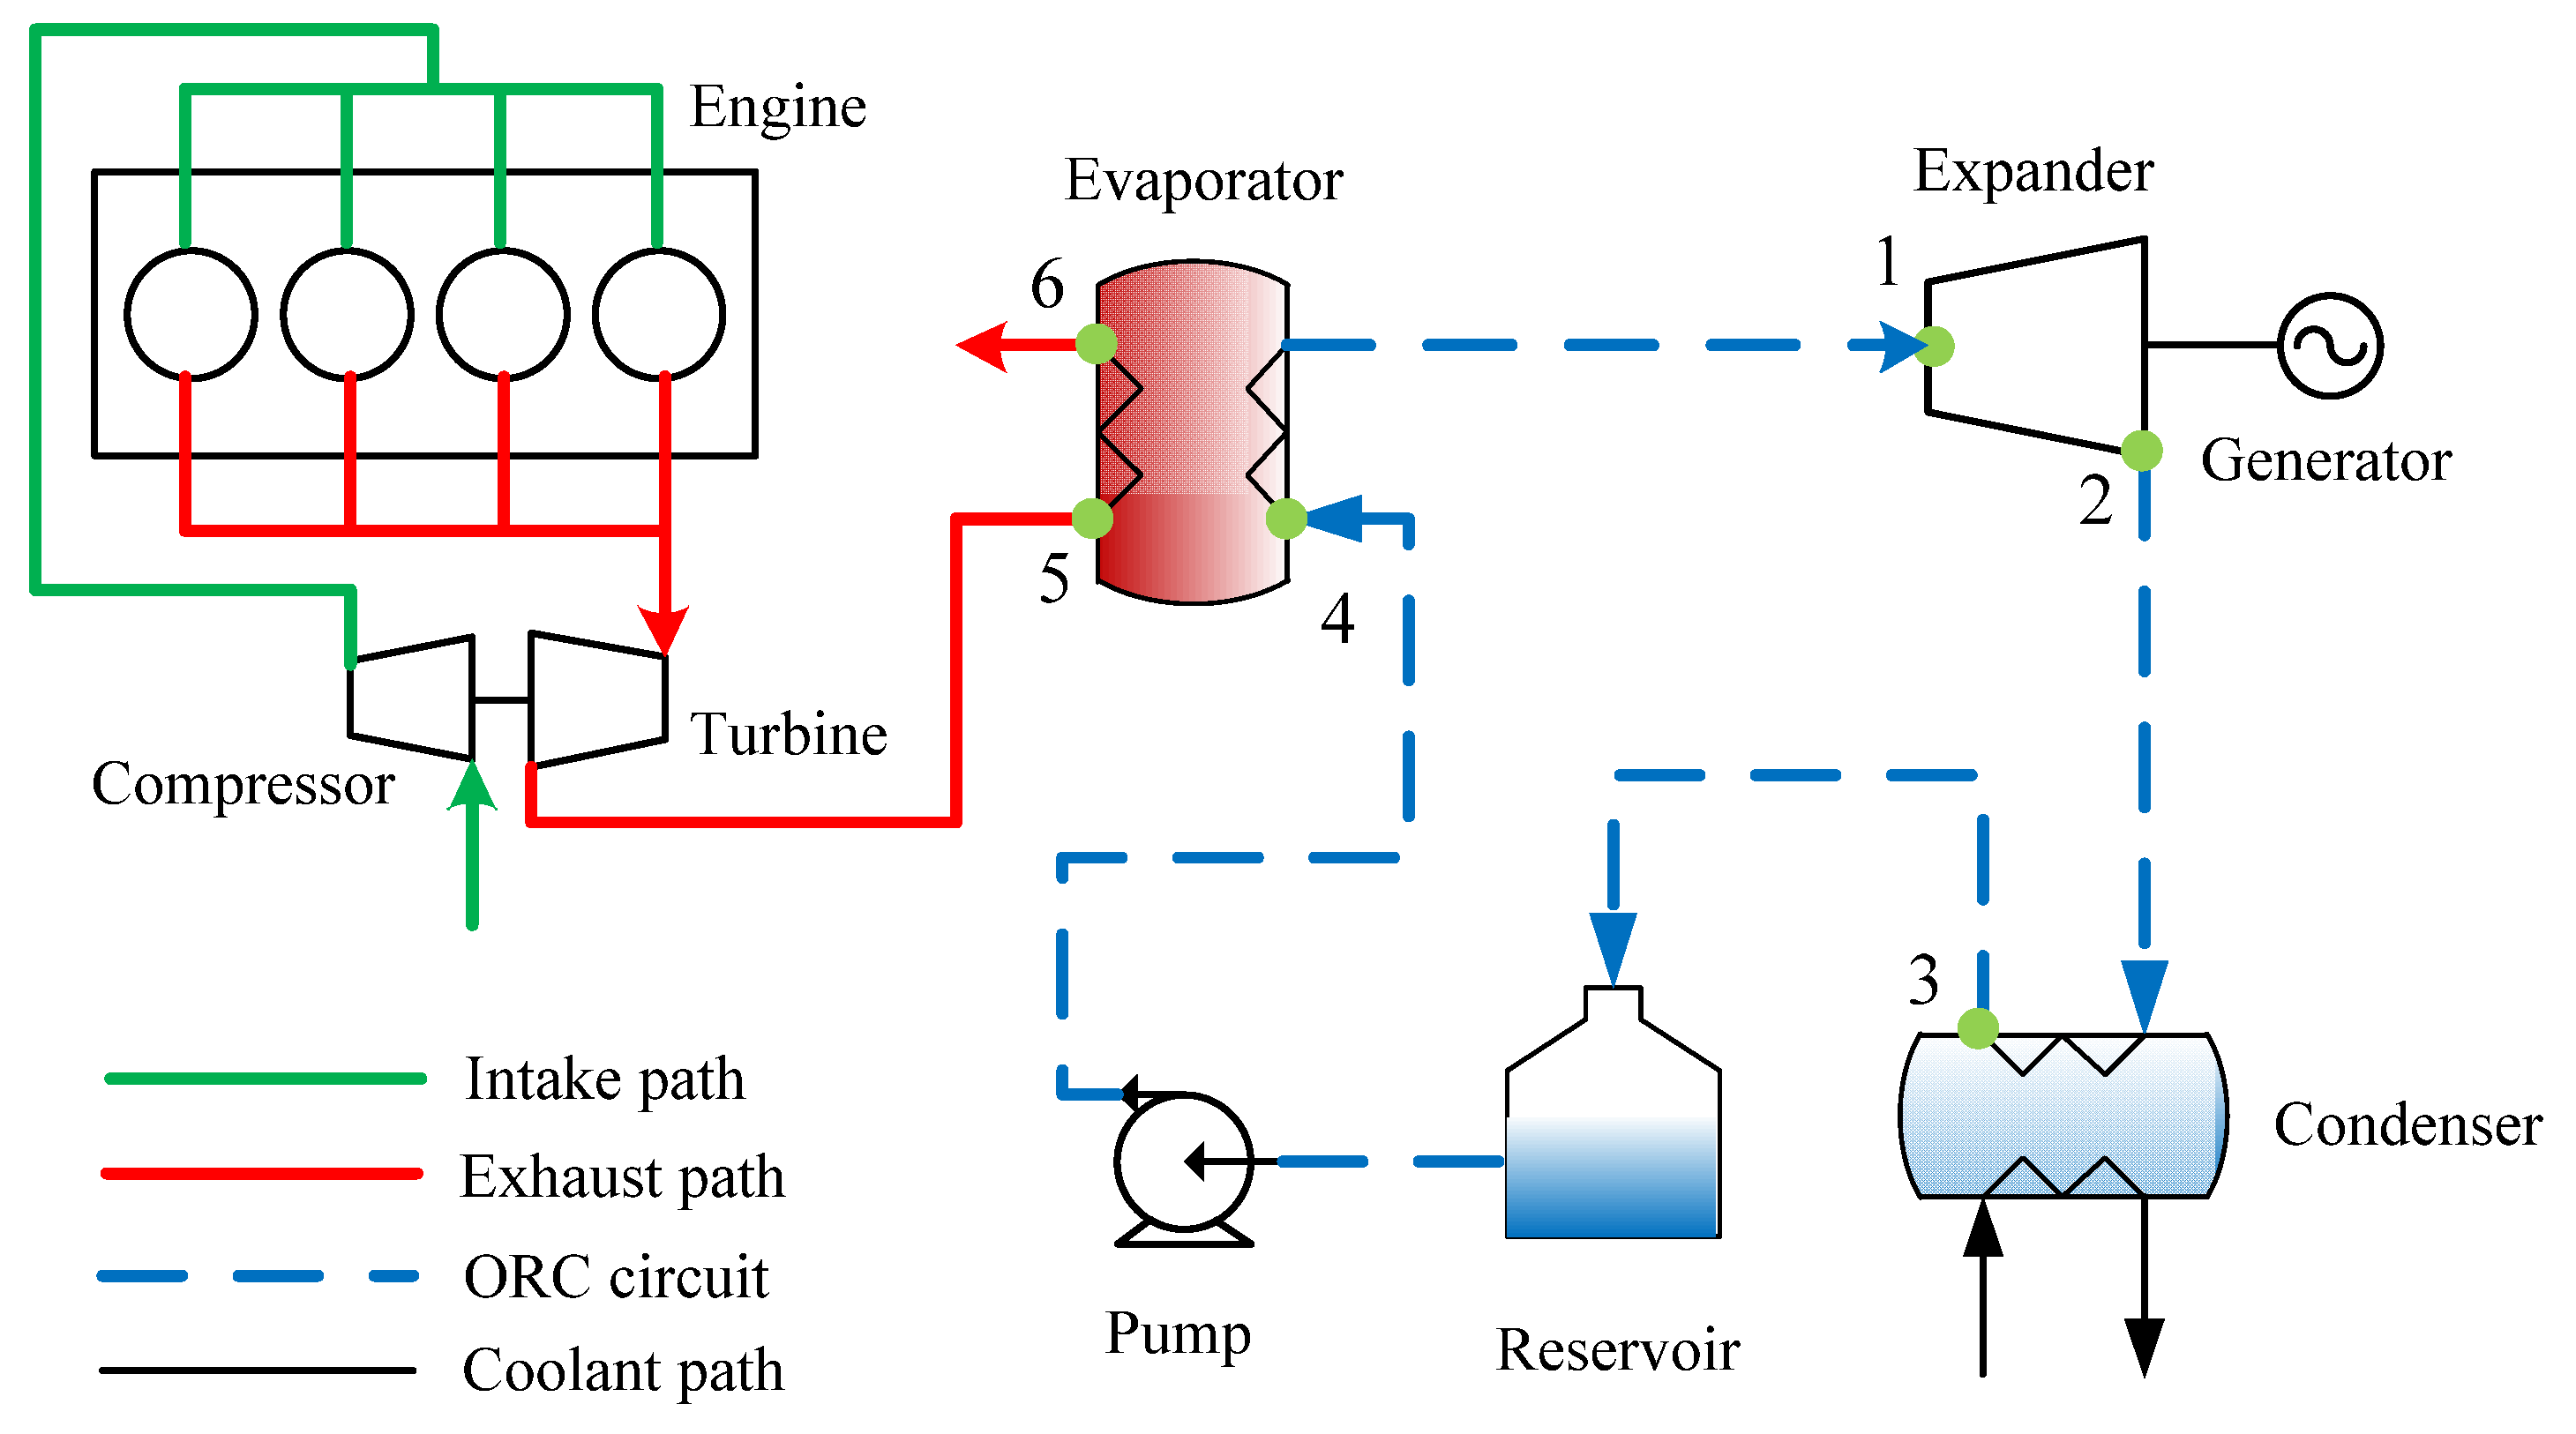
| 1, 2, 2s, 3, 4, 4s, 5, 6 | state points in cycle (see Figure 17) |
| comb | diesel engine-ORC combined system |
| s | expander |
| p | pump |
| e | evaporator |
| c | condenser |
| n | net |
| m | average |
| w | value on the wall surface |
| x | based on length x |
Nomenclature
| cp | specific heat at constant pressure (J·(kg·K)−1) |
| M | molecular weight (kg·kmol−1) |
| mf | mass fraction |
| vf | mole fraction |
| x, y | Cartesian coordinates (m) |
| u | velocity component in x-direction (m·s−1) |
| v | velocity component in y-direction (m·s−1) |
| T | temperature (K) |
strength of heat source (kJ) | |
| R | radius of the channel (m) |
| Re | Reynolds number |
| Pr | Prandtl number |
| Nu | Nusselt number |
| St | Stanton number |
| I | integral |
velocity (m·s−1) | |
dimensionless velocity vector | |
| U∞ | free-stream fluid velocity (m·s−1) |
| T∞ | free-stream fluid temperature (K) |
| Tw | wall temperature (K) |
temperature gradient (K·m−1) | |
dimensionless temperature gradient | |
dimensionless Cartesian coordinates | |
net power output of ORC system (kW) | |
power output of the diesel engine (kW) | |
power output of the diesel engine in the diesel engine-ORC combined system (kW) | |
mass flow rate (kg·s−1) | |
power (kW) | |
heat transfer rate (kW) | |
| bsfc | BSFC of the diesel engine (g·(kW·h)−1) |
| bsfccom | BSFC of the diesel engine-ORC combined system (g·(kW·h)−1) |
| h | enthalpy (kJ·kg−1) |
References
- Dolz, V.; Novella, R.; García, A.; Sánchez, J. HD Diesel Engine Equipped with a bottoming Rankine Cycle as a Waste Heat Recovery System Part I: Study and Analysis of the Waste Heat Energy. Appl. Therm. Eng. 2012, 36, 269–278. [Google Scholar] [CrossRef]
- Heywood, J.B. Internal Combustion Engine Fundamentals; McGraw-Hill, Inc.: New York, NY, USA, 1988. [Google Scholar]
- Kaska, O. Energy and exergy analysis of an organic Rankine for power generation from waste heat recovery in steel industry. Energy Convers. Manag. 2014, 77, 108–117. [Google Scholar] [CrossRef]
- Karellas, S.; Leontaritis, A.D.; Panousis, G.; Bellos, E.; Kakaras, E. Energetic and exergetic analysis of waste heat recovery systems in the cement industry. Energy 2013, 58, 147–156. [Google Scholar] [CrossRef]
- Wang, J.F.; Yan, Z.Q.; Zhao, P.; Dai, Y.P. Off-design performance analysis of a solar-powered organic Rankine cycle. Energy Convers. Manag. 2014, 80, 150–157. [Google Scholar] [CrossRef]
- Uris, M.; Linares, J.I.; Arenas, E. Techno-economic feasibility assessment of a biomass cogeneration plant based on an Organic Rankine Cycle. Renew. Energy 2014, 66, 707–713. [Google Scholar] [CrossRef]
- Uusitalo, A.; Honkatukia, J.; Turunen-Saaresti, T.; Larjola, J. A thermodynamic analysis of waste heat recovery from reciprocating engine power plants by means of organic Rankine cycles. Appl. Therm. Eng. 2014, 70, 33–41. [Google Scholar] [CrossRef]
- Leslie, N.P.; Zimron, O.; Sweetser, R.S.; Stovall, T.K. Recovered energy generation using an organic Rankine cycle system. ASHRAE Trans. 2009, 115, 220–230. [Google Scholar]
- Imran, M.; Usman, M.; Park, B.S.; Kim, H.J.; Lee, D.H. Multi-objective optimization of evaporator of organic Rankine cycle (ORC) for low temperature geothermal heat source. Appl. Therm. Eng. 2015, 80, 1–9. [Google Scholar] [CrossRef]
- Zhang, H.G.; Wang, E.H.; Fan, B.Y. Heat transfer analysis of a finned-tube evaporator for engine exhaust heat recovery. Energy Convers. Manag. 2013, 65, 438–447. [Google Scholar] [CrossRef]
- Kundu, B.; Das, P.K. Performance and optimum dimensions of flat fins for tube-and-fin heat exchangers: A generalized analysis. Int. J. Heat Fluid Flow 2009, 30, 658–668. [Google Scholar] [CrossRef]
- Zhang, Z.G.; Ma, D.B.; Fang, X.M. Experimental and numerical heat transfer in a helically baffled heat exchanger combined with one three-dimensional finned tube. Chem. Eng. Process. 2008, 47, 1738–1743. [Google Scholar] [CrossRef]
- Ozden, E.; Tari, I. Shell side CFD analysis of a small shell-and-tube heat exchanger. Energy Convers. Manag. 2010, 51, 1004–1014. [Google Scholar] [CrossRef]
- Zhang, J.F.; Li, B.; Huang, W.J.; Lei, Y.G.; He, Y.L.; Tao, W.Q. Experimental performance comparison of shell-side heat transfer for shell-and-tube heat exchangers with middle-overlapped helical baffles and segmental baffles. Chem. Eng. Sci. 2009, 64, 1643–1653. [Google Scholar] [CrossRef]
- An, C.S.; Choi, D.H. Analysis of heat-transfer performance of cross-flow fin-tube heat exchangers under dry and wet conditions. Int. J. Heat Mass Transf. 2012, 55, 1496–1504. [Google Scholar] [CrossRef]
- Bhuiyan, A.A.; Amin, M.R.; Sadrul Islam, A.K.M. Three-dimensional performance analysis of plain fin tube heat exchangers in transitional regime. Appl. Therm. Eng. 2013, 50, 445–454. [Google Scholar] [CrossRef]
- Tang, L.H.; Zeng, M.; Wang, Q.W. Experimental and numerical investigation on air-side performance of fin-and-tube heat exchangers with various fin patterns. Exp. Therm. Fluid Sci. 2009, 33, 818–827. [Google Scholar] [CrossRef]
- Aytunc, E.; Bails, O.; Levent, B. Effect of geometrical parameters on heat transfer and pressure drop characteristics of plate fin and tube heat exchangers. Appl. Therm. Eng. 2005, 25, 2421–2431. [Google Scholar]
- Şahin, H.M.; Dal, A.R.; Baysal, E. 3-D Numerical study on the correlation between variable inclined fin angles and thermal behavior in plate fin-tube heat exchanger. Appl. Therm. Eng. 2007, 27, 1806–1816. [Google Scholar] [CrossRef]
- Han, H.; He, Y.L.; Li, Y.S.; Wang, Y.; Wu, M. A numerical study on compact enhanced fin-and-tube heat exchangers with oval and circular tube configurations. Int. J. Heat Mass Transf. 2013, 65, 686–695. [Google Scholar] [CrossRef]
- Tao, Y.B.; He, Y.L.; Huang, J.; Wu, Z.G.; Tao, W.Q. Numerical study of local heat transfer coefficient and fin efficiency of wavy fin-and-tube heat exchangers. Int. J. Therm. Sci. 2007, 46, 768–778. [Google Scholar] [CrossRef]
- Hatami, M.; Ganji, D.D.; Gorji-Bandpy, M. Numerical study of finned type heat exchangers for ICEs exhaust waste heat recovery. Case Stud. Therm. Eng. 2014, 4, 53–64. [Google Scholar] [CrossRef]
- Bai, S.Q.; Lu, H.L.; Wu, T.; Yin, X.L.; Shi, X.; Chen, L.D. Numerical and experimental analysis for exhaust heat exchangers in automobile thermoelectric generators. Case Stud. Therm. Eng. 2014, 4, 99–112. [Google Scholar] [CrossRef]
- Diesel fuel. Available online: http://en.wikipedia.org/wiki/Diesel_fuel (accessed on 14 March 2015).
- Lemmon, E.W.; Huber, M.L.; McLinden, M.O. REFPROP Version 8.0, NIST Standard Reference Database 23; US Department of Commerce: Washington, DC, USA, 2007.
- Cengel, Y.A.; Boles, M.A. Thermodynamics—An Engineering Approach, 6th ed.; McGraw-Hill: New York, NY, USA, 2008; pp. 423–469. [Google Scholar]
- Poling, B.E.; Prausnitz, J.M.; O’Connell, J.P. The Properties of Gases and Liquids, 5th ed.; McGraw-Hill: New York, NY, USA, 2001. [Google Scholar]
- Roache, P.J.; Ghia, K.N.; White, F.M. Editorial policy statement on the control of numerical accuracy. J. Fluids Eng. 1986, 108. [Google Scholar] [CrossRef]
- Guo, Z.Y.; Li, D.Y.; Wang, B.X. A novel concept for convective heat transfer enhancement. Int. J. Heat Mass Transf. 1998, 41, 2221–2225. [Google Scholar] [CrossRef]
- Tao, W.Q.; Guo, Z.Y.; Wang, B.X. Field synergy principle for enhancing convective heat transfer—its extension and numerical verification. Int. J. Heat Mass Transf. 2002, 45, 3849–3856. [Google Scholar] [CrossRef]
- Guo, Z.Y.; Tao, W.Q.; Shah, R.K. The field synergy (coordination) principle and its applications in enhancing single phase convective heat transfer. Int. J. Heat Mass Transf. 2005, 48, 1797–1807. [Google Scholar] [CrossRef]
- Wang, E.H.; Zhang, H.G.; Fan, B.Y.; Ouyang, M.G.; Yang, K.; Yang, F.Y.; Li, X.J.; Wang, Z. 3D numerical analysis of exhaust flow inside a fin-and-tube evaporator used in engine waste heat recovery. Energy 2015, 82, 800–812. [Google Scholar] [CrossRef]
© 2015 by the authors; licensee MDPI, Basel, Switzerland. This article is an open access article distributed under the terms and conditions of the Creative Commons Attribution license (http://creativecommons.org/licenses/by/4.0/).
Share and Cite
Bei, C.; Zhang, H.; Yang, F.; Song, S.; Wang, E.; Liu, H.; Chang, Y.; Wang, H.; Yang, K. Performance Analysis of an Evaporator for a Diesel Engine–Organic Rankine Cycle (ORC) Combined System and Influence of Pressure Drop on the Diesel Engine Operating Characteristics. Energies 2015, 8, 5488-5515. https://doi.org/10.3390/en8065488
Bei C, Zhang H, Yang F, Song S, Wang E, Liu H, Chang Y, Wang H, Yang K. Performance Analysis of an Evaporator for a Diesel Engine–Organic Rankine Cycle (ORC) Combined System and Influence of Pressure Drop on the Diesel Engine Operating Characteristics. Energies. 2015; 8(6):5488-5515. https://doi.org/10.3390/en8065488
Chicago/Turabian StyleBei, Chen, Hongguang Zhang, Fubin Yang, Songsong Song, Enhua Wang, Hao Liu, Ying Chang, Hongjin Wang, and Kai Yang. 2015. "Performance Analysis of an Evaporator for a Diesel Engine–Organic Rankine Cycle (ORC) Combined System and Influence of Pressure Drop on the Diesel Engine Operating Characteristics" Energies 8, no. 6: 5488-5515. https://doi.org/10.3390/en8065488
APA StyleBei, C., Zhang, H., Yang, F., Song, S., Wang, E., Liu, H., Chang, Y., Wang, H., & Yang, K. (2015). Performance Analysis of an Evaporator for a Diesel Engine–Organic Rankine Cycle (ORC) Combined System and Influence of Pressure Drop on the Diesel Engine Operating Characteristics. Energies, 8(6), 5488-5515. https://doi.org/10.3390/en8065488