Abstract
Lignocellulosic biomass-based ethanol is categorized as 2nd generation bioethanol in the advanced biofuel portfolio. To make sound incentive policy proposals for the Chinese government and to develop guidance for research and development and industrialization of the technology, the paper reports careful techno-economic and sensitivity analyses performed to estimate the current competitiveness of the bioethanol and identify key components which have the greatest impact on its plant-gate price (PGP). Two models were developed for the research, including the Bioethanol PGP Assessment Model (BPAM) and the Feedstock Cost Estimation Model (FCEM). Results show that the PGP of the bioethanol ranges $4.68–$6.05/gal (9,550–12,356 yuan/t). The key components that contribute most to bioethanol PGP include the conversion rate of cellulose to glucose, the ratio of five-carbon sugars converted to ethanol, feedstock cost, and enzyme loading, etc. Lignocellulosic ethanol is currently unable to compete with fossil gasoline, therefore incentive policies are necessary to promote its development. It is suggested that the consumption tax be exempted, the value added tax (VAT) be refunded upon collection, and feed-in tariff for excess electricity (byproduct) be implemented to facilitate the industrialization of the technology. A minimum direct subsidy of $1.20/gal EtOH (2,500 yuan/t EtOH) is also proposed for consideration.
Keywords:
economics; plant-gate price; enzyme; cost breakdown; incentives; policy; tax preference; subsidy 1. Introduction
1.1. Biofuel is an Important Alternative to Fossil Fuels in China and Globally
The rising concern over oil dependency and greenhouse gas (GHG) emissions has driven China to seek alternatives to fossil gasoline in the transportation sector. China’s overseas oil dependence ratio increased to 58.1% in 2013, with a national oil consumption of over 498 million tons and a net import volume of over 254 million tons []. It is projected that domestic oil demand will increase to 600–700 million tons by 2030, and 700–800 million tons by 2050 []. Meanwhile, domestic crude oil production will probably remain at approximately 200 million tons by 2020 [] and even by 2050 []. The wide gap between supply and demand provides development opportunities for alternative fuels, especially biofuels []. According to the research results of the International Energy Agency (IEA), biofuels could provide 27% of total transport fuel by 2050, and contribute in particular to the replacement of diesel, kerosene and jet fuel. The projected use of biofuels could avoid around 2.1 gigatonnes (Gt) of CO2 emissions per year if produced sustainably [].
1.2. Goal of Bioethanol Development Was not Met in China
China is now the third largest country in terms of bioethanol production and consumption. The annual use of bioethanol will reach four million tons by 2015, and 10 million tons by 2020, according to the 12th Five-Year Plan for Bioenergy Development, and the Medium and Long-Term Development Plan for Renewable Energy in China. However, by 2012 the annual production of ethanol was only 2.02 million tons []; far from targeted volumes.
1.3. Purpose of the Research
During the 11th Five-Year period, China decided not to expand ethanol production capacity using grains as feedstock. Instead it promotes ethanol production from non-grain feedstock, including lignocellulosic biomass. The main factor restraining the development of bioethanol lies in the high production cost of non-grain bioethanol production, especially ethanol production from lignocellulosic biomass. China currently has few operational commercial-scale plants for lignocellulosic ethanol, and there is uncertainty around the production cost. It is critical to identify the key factors driving the cost of lignocellulosic ethanol production, and to compare its competitiveness with gasoline so that sound incentive policies can be made to promote research and development (R&D) and industrialization of lignocellulosic ethanol. To this end, the paper conducts techno-economic and sensitivity analyses on a typical lignocellulosic ethanol pathway.
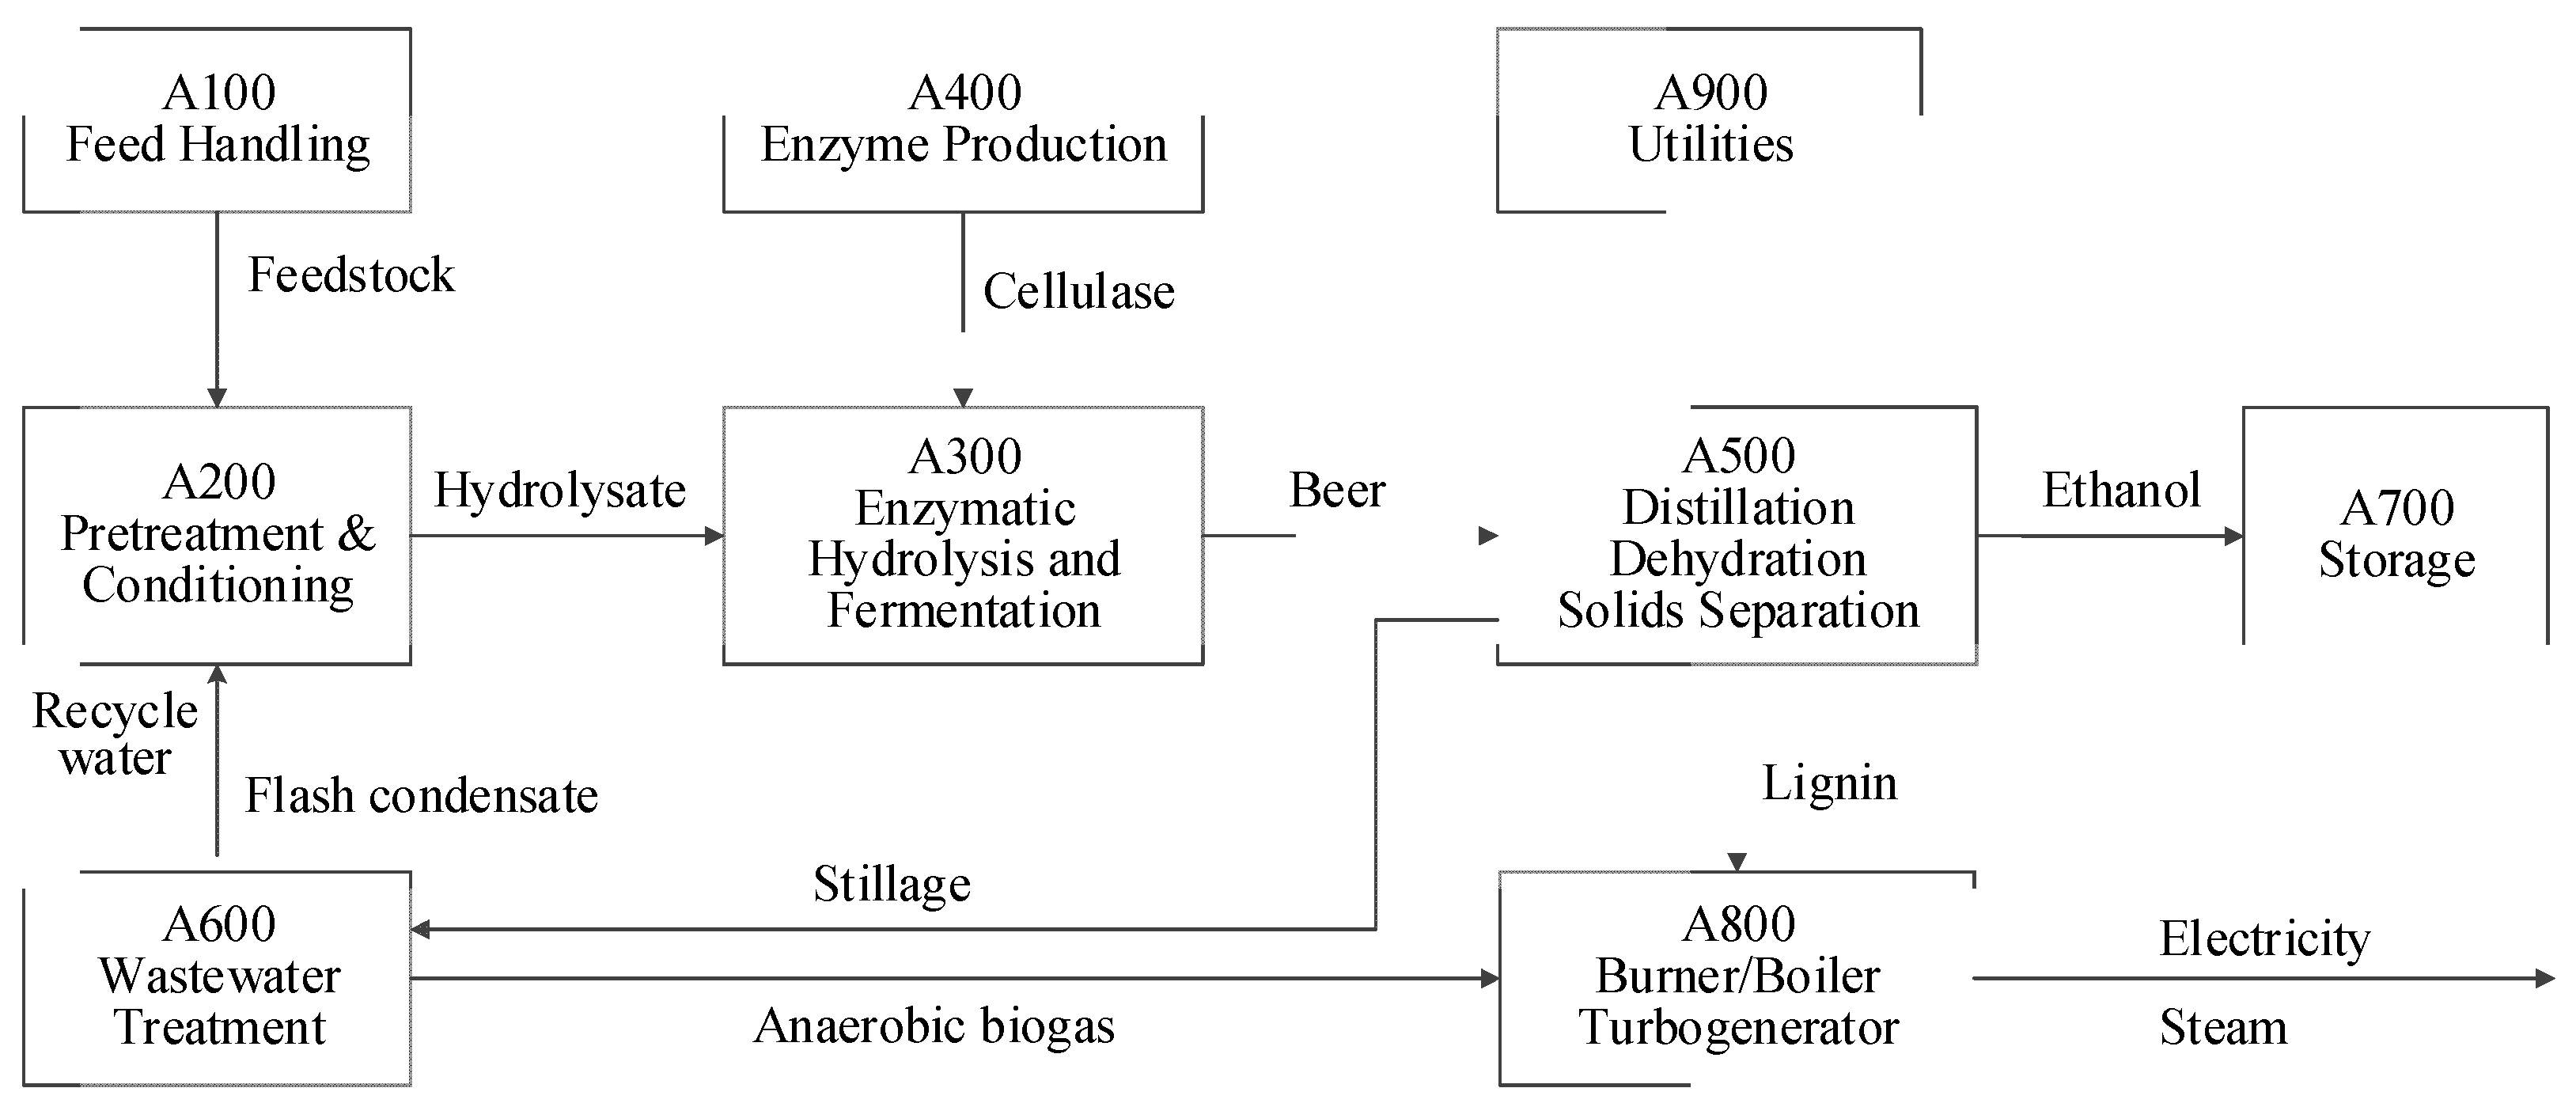
2. Process Pathway Description
The paper uses a biochemical conversion pathway that was developed by the United States National Renewable Energy Laboratory (NREL) []. It was selected for analysis for the following two reasons: (1) it represents a typical example of lingocellulosic ethanol technology globally, and is particularly similar to Chinese pathways. (2) Technical and economic data surrounding the process is easily accessible given that R&D has been developed by the NREL since 1980s, and a series of publications containing details of the process design are available.
The process uses co-current dilute-acid pretreatment of corn stover, and enzymatic hydrolysis of the remaining cellulose, followed by fermentation of the resulting glucose and xylose to produce ethanol. The process design also includes feedstock handling and storage, product purification, wastewater treatment, lignin combustion, product storage, and required utilities. Altogether, nine areas are designed, as shown in Figure 1.
Figure 1.
Simplified flow diagram of the overall process.
3. Scenario Design
Two categories of eight scenarios were developed based on the combination of technology, economics and policies, as shown in Table 1.
In the first category, CN scenarios, a thorough investigation of the status of Chinese technology was made, and based on this, the key technical parameters were determined. In the second category, NREL-CN scenarios, the conversion targets of NREL report [] were used. In both categories of scenarios, a cash flow analysis model was built to assess the economics of the technology in Chinese situations. Large amounts of Chinese economic data were collected by survey and calculation as an input to the model.
Emphasis was put on the analyses of CN scenarios, since the purpose of the research is to develop suggestions for the Chinese government. Six policy scenarios were designed to assess the effects of different policies on the economics of lignocellulosic ethanol production, and to estimate the potential of lignocellulosic technology in China. In Scenario CN_1, no incentive policy was introduced, implying the most pessimistic result. The scenario was regarded as a baseline case and all other scenarios were developed from it. Most of the following data and calculation results in the paper are specific to Scenario CN_1. In Scenario CN_2, excess electricity (byproduct) produced by the plant would be purchased compulsorily by the grid under a feed-in tariff program at the same price as that of biomass power. In Scenario CN_3, the value added tax (VAT) is refunded upon collection. In Scenario CN_4, the consumption tax was exempted. In Scenario CN_5, VAT was refunded upon collection and the consumption tax was exempted. In Scenario CN_6, all the policy incentives in preceding scenarios were included, making it the most optimistic scenario.
Table 1.
Scenarios for techno-economic analysis.
| Category | Scenarios | Policies | Technology | Economic data (prices, tax rates, etc.) |
|---|---|---|---|---|
| CN | CN_1 | No incentive policy | Status quo of China | Chinese |
| CN_2 | Feed-in tariff for excess electricity | |||
| CN_3 | VAT refunded upon collection | |||
| CN_4 | Consumption tax exempted | |||
| CN_5 | Sum of CN_3 and CN_4 | |||
| CN_6 | Sum of CN_2 and CN_5 | |||
| NREL-CN | NREL-CN_1 | No incentive policy | NREL, 2012 [] | Chinese |
| NREL-CN_2 | Excess electricity sold to grid |
The six policy scenarios above were developed in accordance with the following facts and experiences:
- 1)
- Taxes applicable to fuel ethanol in China include income tax, VAT, consumption tax, Urban Maintenance and Construction Tax (UMCT, 7% of the sum of VAT and consumption tax), and Education Surcharge (ES, 3% of the sum of VAT and consumption tax). To encourage the expansion of the biofuel industry in China, incentive policies have been set for four grain-based fuel ethanol producers approved by the Chinese government since 2002. The policies were as follows: consumption tax on fuel ethanol was waved, VAT was imposed first and then refunded to fuel ethanol producers, and a direct subsidy was provided to fuel ethanol producers to ensure they can make an appropriate level of profit [,]. The incentives may be considered for the promotion of lignocellulosic biomass-based ethanol production in the future.
- 2)
- In light of the Renewable Energy Law of the People’s Republic of China [], which took effect in 2010, “the relevant electricity grid enterprise shall […] purchase the full amount of the synchronized electricity, as covered by its grid, of the project of synchronized electricity generation by using renewable energy, and provide synchronization service for electricity generation by using renewable energy.” The excess electricity produced by the lignocellulosic ethanol plant is in accordance with the law and should be protected by it.
- 3)
- Many countries offer tax preferences and direct subsidies to promote the development of fuel ethanol production. The United States is the world’s leading producer and consumer of ethanol, accounting for 50% of supply and 57% of demand in 2008 []. Producers of cellulosic biofuels are eligible for a production tax credit of $1.01 per gallon. Brazil was the global pioneer in promoting ethanol at large scale as a vehicle fuel through the Proalcool program, which was started in the 1970s. It is the second largest world producer in this market (38.2% of global production and 30.4% of demand in 2008 []). In Brazil, anhydrous ethanol, which is used to blend with gasoline, is untaxed [].
4. Methodology
Two models were developed in the paper to make a strict techno-economic analysis: namely, the Feedstock Cost Estimation Model (FCEM) and the Bioethanol Plant-Gate Price Assessment Model (BPAM). The former was developed to calculate feedstock cost, which was an input into the latter model.
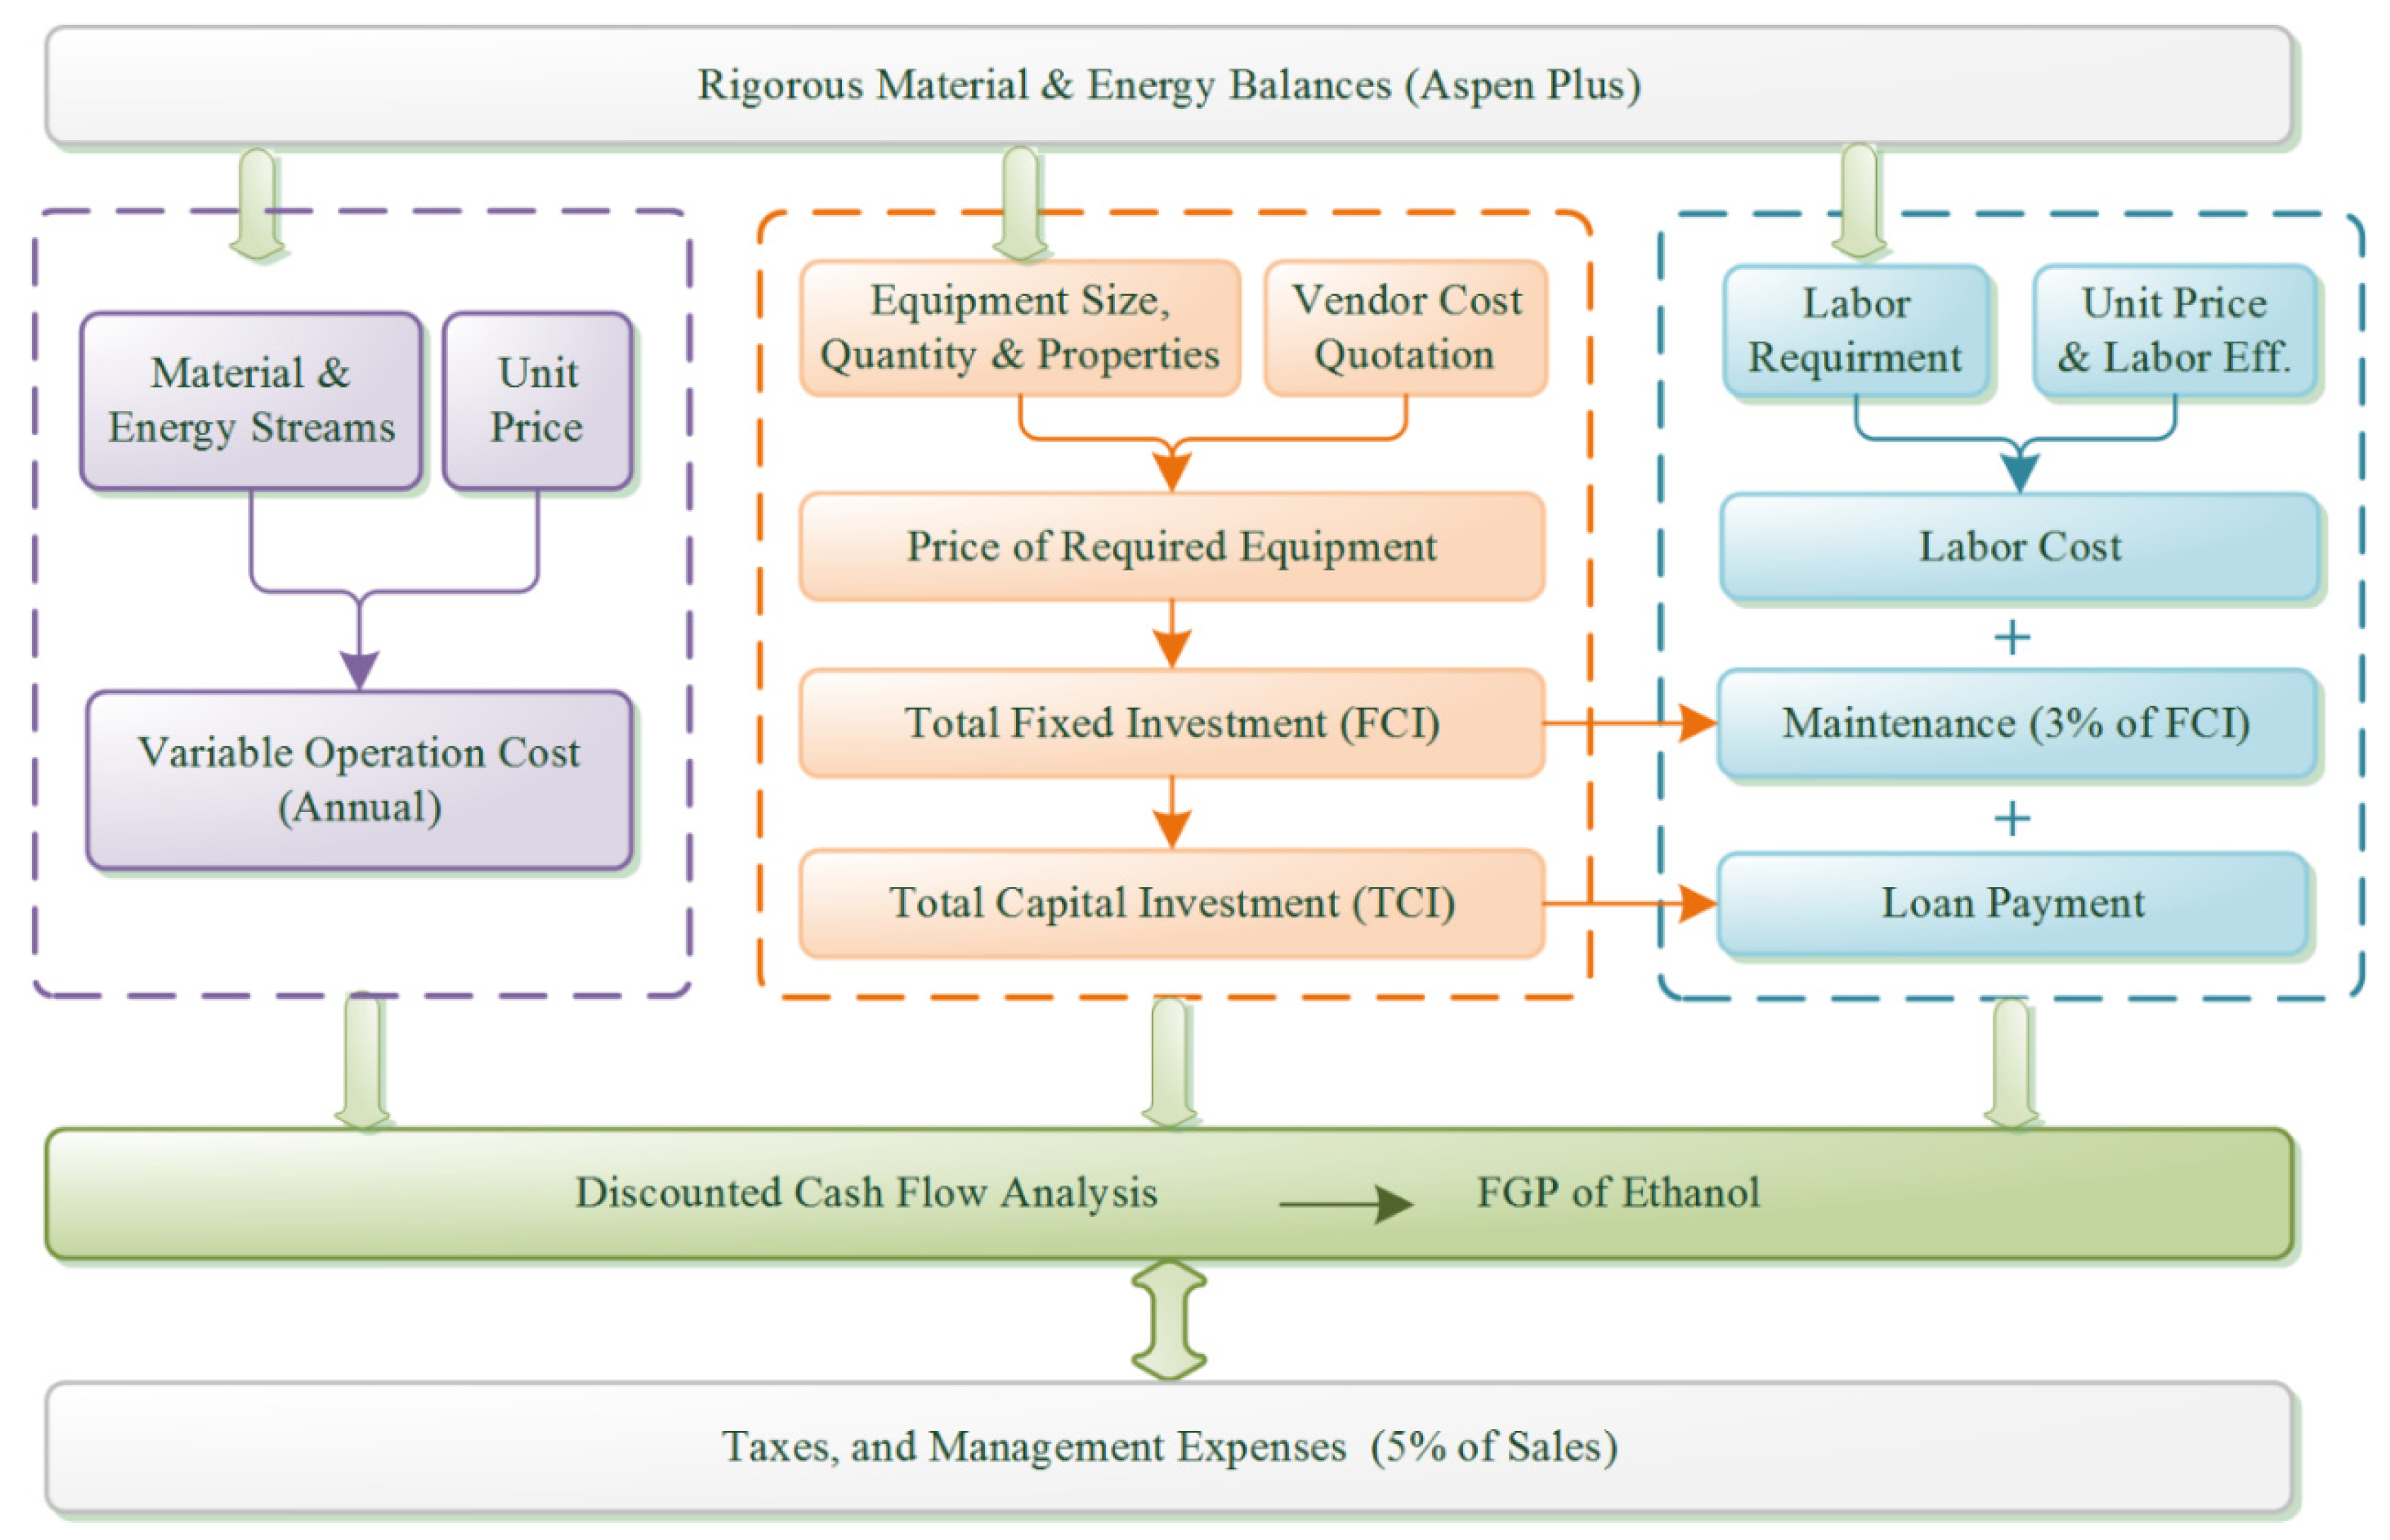
4.1. Bioethanol Plant-Gate Price Assessment Model (BPAM)
The BPAM was developed under China’s national conditions using an NREL biorefinery analysis process model as its basis []. The composition and data flow of the model is shown in Figure 2.
Figure 2.
Techno-economic analysis approach.
In the model, the technology pathway described in Section 2 was simulated using ASPEN Plus® Software to obtain material and energy balance data, labor requirements as well as equipment sizes and numbers, which assist in determining the operating costs of ethanol production and prices of the required equipment. The total capital investment (TCI) was computed based on the total equipment cost using the Langer coefficient method []. The variable operating costs (VOC) were determined based on material and energy data produced by simulation and quoted unit prices of the material and energy. Fixed operating costs (FOC), including labor costs, maintenance and management expenses, were determined based on factors such as the scale of the plant, fixed capital investment (FCI), TCI, and annual sales. Taxes were determined in line with Chinese tax regulations and rules. With these costs, the paper used a discounted cash flow analysis to determine the PGP of ethanol required to obtain a zero net present value (NPV) with a finite internal rate of return as shown in Formula (1):
where:
- TCI is the initial total capital investment;
- t is the year of plant operation, and construction lasts for 3 years, i.e., t E (−2,−1,0);
- PGPt is plant-gate price of ethanol product in year t;
- Qt is ethanol production in year t;
- Pbt is the price of the byproduct (excess electricity) in year t;
- Qbt is the production of the byproduct in year t;
- Ft is feedstock cost in year t;
- Mct is the operating cost of ethanol in year t;
- Loant is the loan payment (including interest) in year t;
- Tt is the taxes paid by the plant in year t; and
- IRR is the internal rate of return.
4.2. Feedstock Cost Estimation Model (FCEM)
4.2.1. Model Framework
In the FCEM model, it is assumed that an agent purchases feedstock from farmers’ fields at a certain price. He then hires laborers for collection, transportation, and primary processing. The feedstock is first transported to a center for primary processing and storage, and then to the ethanol production plant for fuel conversion. During this process, four costs are incurred, as shown in Table 2.
Table 2.
Composition of feedstock cost.
| No. | Costs for | Spatial transfer phases |
|---|---|---|
| 1 | At-field feedstock purchasing (C1n) | At field |
| 2 | Feedstock collection and transportation (C2n) | Field-to-center |
| 3 | Primary processing and storage (C3n) | At center |
| 4 | Transportation (C4n) | Center-to-plant |
The first cost was determined by survey, and others were determined by calculation. Finally, profit of the agent was added to the total cost of the feedstock, which was estimated based on Equation (2):
where, C is the plant-gate cost of feedstock; N is the number of all collection centers; n is the symbol of specific collection center; j is the symbol of each phase, namely at field, field-to-center, at center, and center-to-plant; and P is the profit of the agent.
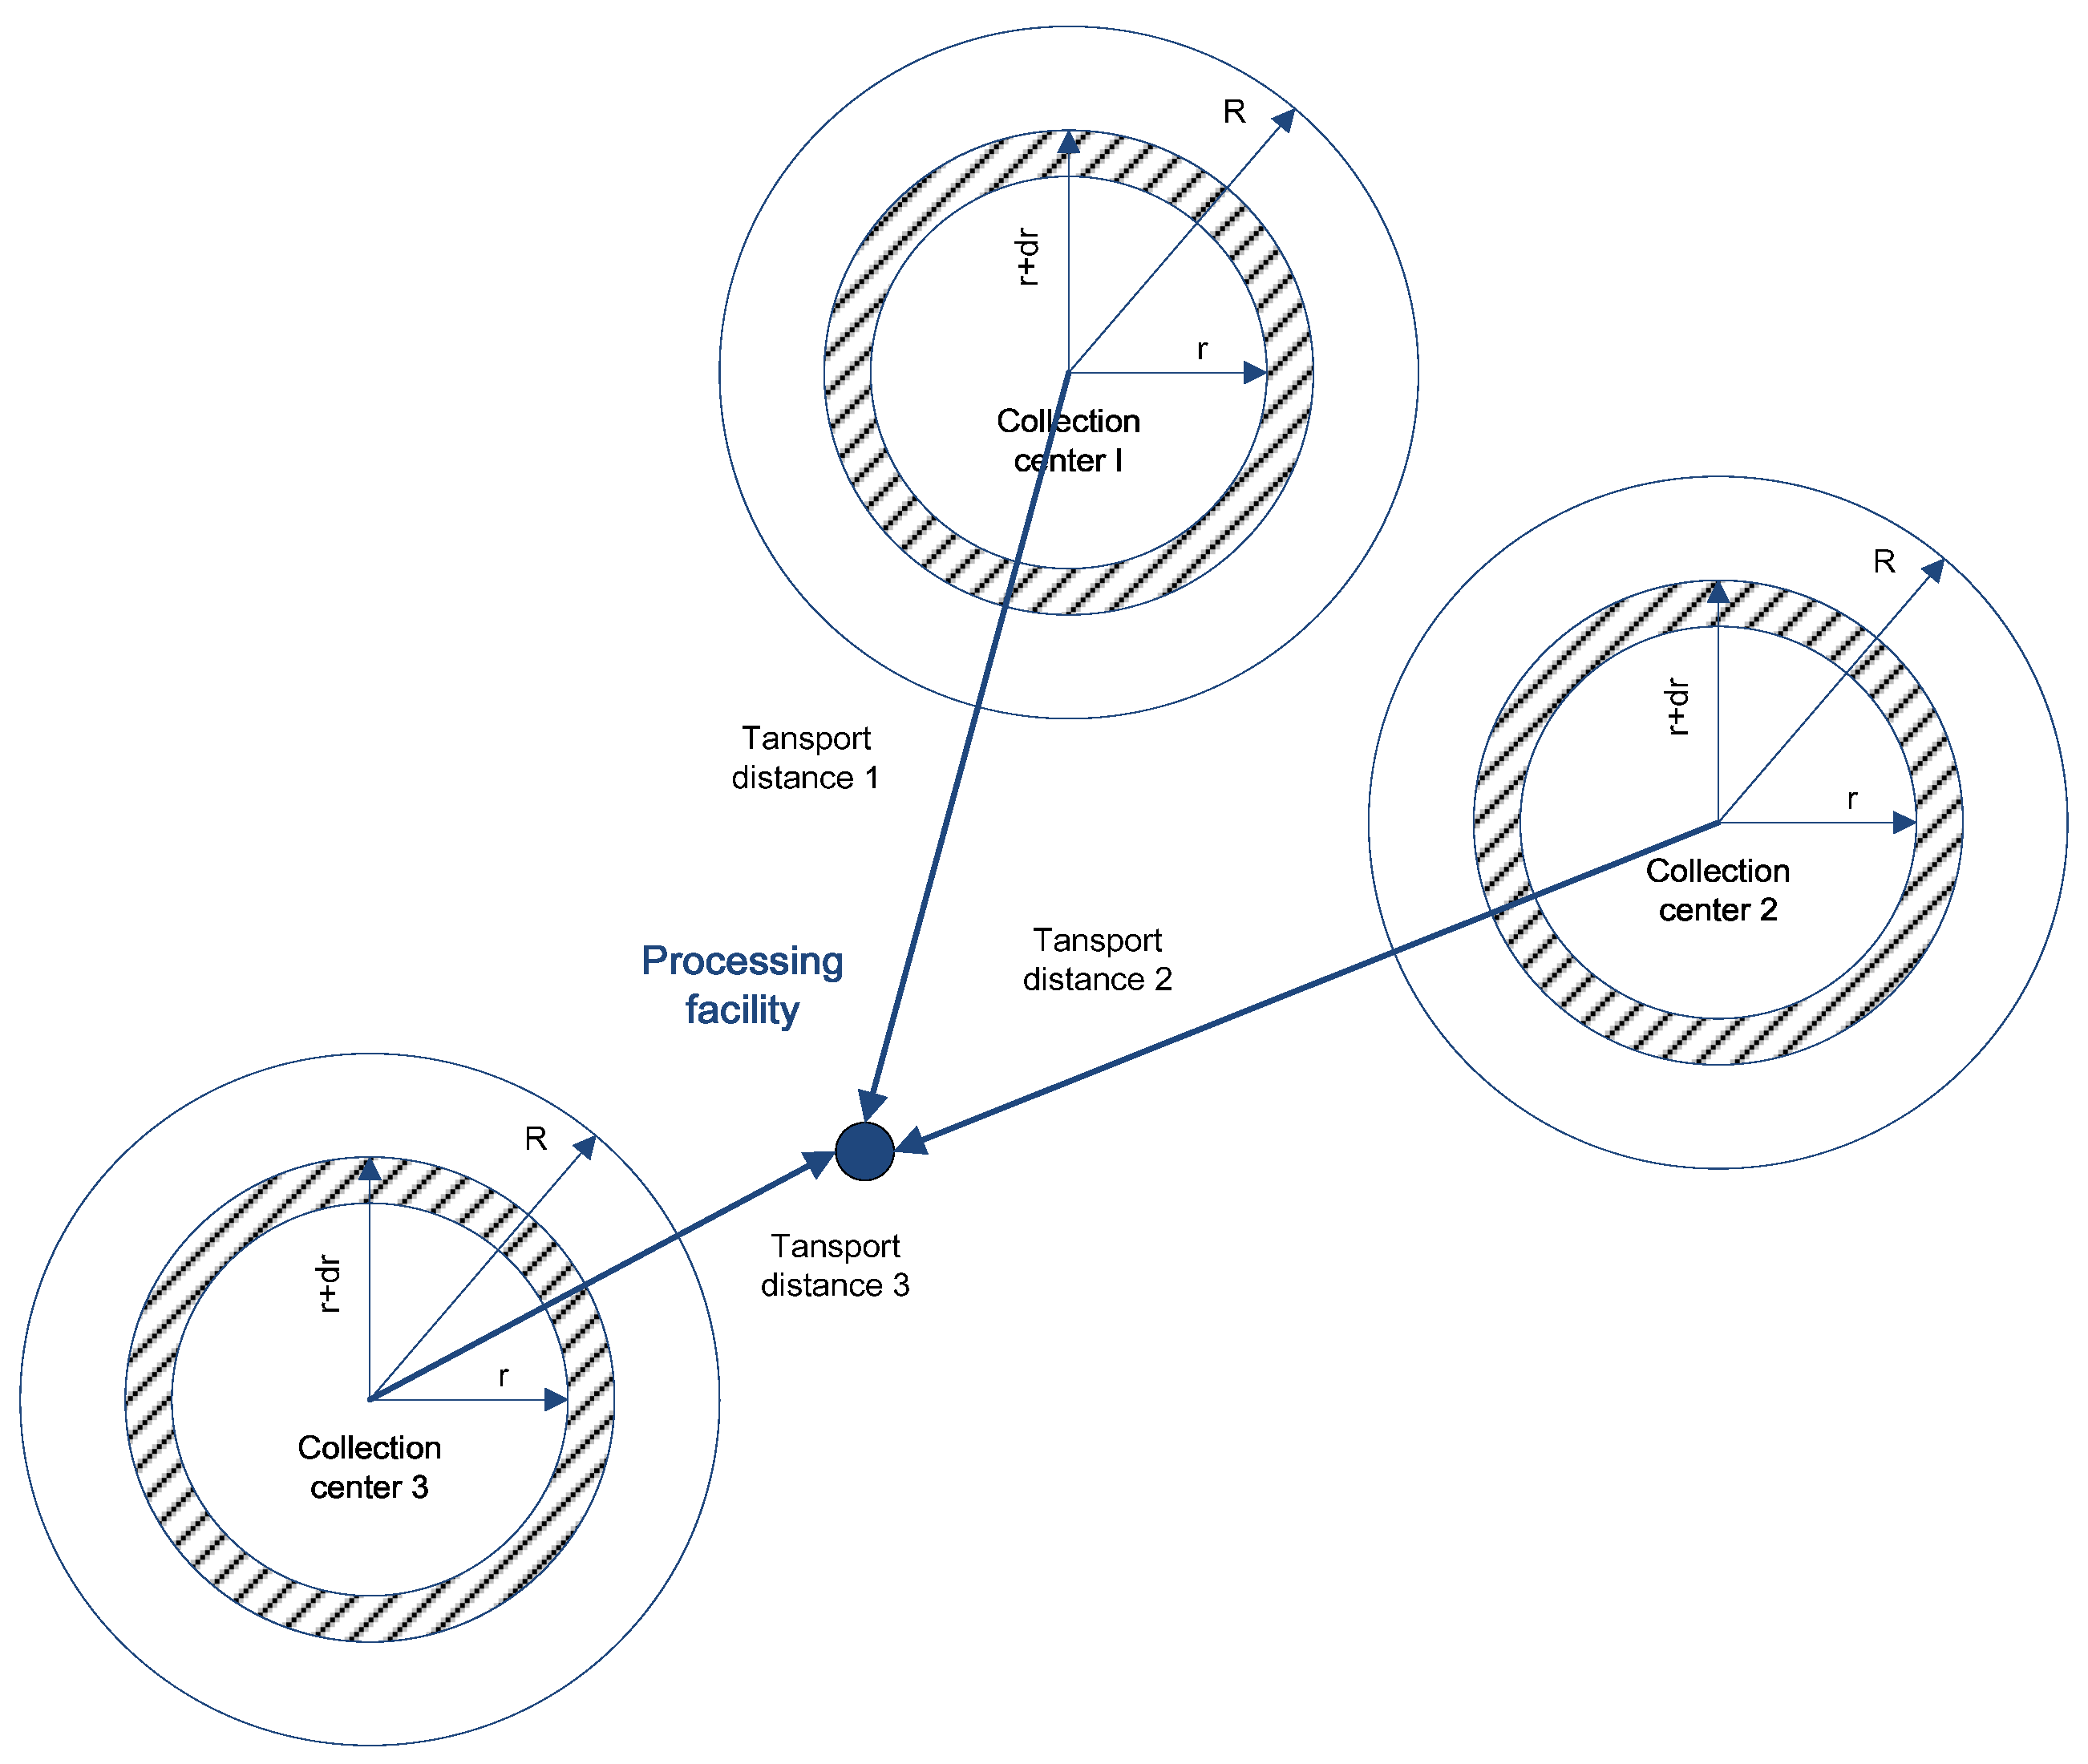
4.2.2. Transportation Mode
The location of collection centers are theoretically assumed to be at the center of a uniformly distributed area, following the original approach of Overend [] which is widely applied in this research area (Figure 3).
Figure 3.
Feedstock transport mode.
4.2.3. Calculation Method of C2n, C3n, C4n, and P
(1) Field-to-center cost (C2n)
The field-to-center collection and transport cost (C2n) is calculated based on Equation (3):
where Clfc, Cdfc, Cdefc, Cmfc Cffc are the cost of labor for feedstock collection in the field, labor cost for vehicle driving, equipment depreciation, the cost of equipment maintenance and other expenses, and fuel cost, respectively. The calculation of Cffc was based on Nguyen and Prince [], as shown in Equation (4):
where Yn is feedstock yield per unit area; αn is the fraction of useful land (an index of useful land density); βfc is the ratio of actual road length to direct distance, taken as constant, which is denoted as the tortuosity factor in Overend []; tfc is fuel cost per unit distance and unit mass. Rn is the maximum collection radius for the specific collection center, which was estimated based on Equation (5):
where Qn is the feedstock volume required for collection center n.
(2) Cost at the center (C3n)
The feedstock primary processing cost is calculated as:
where, Cec is energy cost; Clc is labor cost; Cdmc is depreciation cost of buildings and equipment; and Clandc is land rent cost.
(3) Center-to-plant cost (C4n)
The transport cost from collection centers to the processing facility is calculated as:
where Clcp, Cdecp, Cmcp and Cfcp are the costs of labor for transportation, equipment depreciation, and the cost of equipment maintenance and other expenses, and fuel cost respectively. Cfcp is calculated as:
where Qncp is transport quantity from collection center n to processing facility; Scp is transport distance from collection center n to the processing facility; βcp is the ratio of actual road length to direct distance, and tcp is fuel cost per unit distance and unit mass from collection center to processing facility. Transport distance Scp is calculated as:
(4) Profit of the agent (P)
We assume that the agent gets a net profit of 5% for his service, and the calculation base is the sum of C2n, C3n and C4n:
5. Assumptions, Data and Calculation
5.1. Assumption
The economics of ethanol production are assessed with the following assumption: all pieces of equipment are made domestically, rather than being imported.
5.2. Feedstock Composition
Investigation into the composition of corn stover in China revealed that it varies significantly across different regions where the corn stover grows [,,]. The composition described in the NREL report [] was found to be fit for Chinese situations and is therefore applied here without modification. The details of the composition are shown in Table 3.
Table 3.
Feedstock composition. Unit: dry wt %.
| Component | Content | Component | Content | Component | Content |
|---|---|---|---|---|---|
| Cellulose | 35.05 | Mannan | 0.60 | Acetate | 1.81 |
| Xylan | 19.53 | Sucrose | 0.77 | Protein | 3.10 |
| Galactan | 1.43 | Lignin | 15.76 | Extractives | 14.65 |
| Arabinan | 2.38 | Ash | 4.93 |
Source: NREL report [], p. 14.
5.3. Key Technical Parameters
Based on expert consultancy results in China and on the NREL report [], the paper determined key technical parameters used in Aspen Plus simulation for different scenarios as shown in Table 4. The parameters and their values are explained in Section 5.3.1, Section 5.3.2 and Section 5.3.3.
Table 4.
Key technical parameters.
| Technical Parameters | Scenarios CN ④ | Scenarios NREL-CN ⑤ |
|---|---|---|
| PT ① xylan to xylose | 90% | 90% |
| PT glucan to glucose | 9.9% | 9.9% |
| EH ② enzyme loading | 50 mg/g | 20 mg/g |
| EH cellulose to glucose | 80% | 90% |
| FERM ③ contamination losses | 6% | 3% |
| FERM xylose to ethanol | 0% | 85% |
| FERM arabinose to ethanol | 0% | 85% |
Notes: ① PT: pretreatment; ② EH: enzymatic hydrolysis; ③ FERM: fermentation; ④ The values of the column are determined through surveys and expert consultancy. ⑤ The values of the column are taken from the NREL report [].
5.3.1. Key Parameters in Pretreatment
Pretreatment is a prerequisite operation to improve the following bioconversion process, in which most of the xylan is degraded to xylose and furfural, and the crystalline structure of most cellulose is broken down, increasing accessibility for enzymatic hydrolysis. At present, the technical parameters of this process are very similar in China and in the US.
5.3.2. Key Parameters in Enzyme Hydrolysis
The high cost of enzyme has been one of the key barriers constraining the development of lignocelluosic ethanol. The enzyme loading in the paper was determined based on the Chinese technical status. Compared with the enzyme developed by some leading enzyme providers in the world, like Novozymes, the activity of enzyme produced by local suppliers is much lower and so more loading is required.
5.3.3. Key Parameters in Fermentation
In terms of fermentation, the bottleneck in China relates to the conversion of five-carbon sugar into ethanol. Although it is reported that progress has been made in the research of strains using pentoses and hexoses in ethanol production [], almost none of them can be converted in industrial-scale plants given the current level of technology in China.
5.4. Parameters Used in the Model of Discounted Cash Flow Analysis
Many parameters are required for the discounted cash flow analysis, including plant life, discount rate, and loan terms, to name a few. These are summarized in Table 5.
Table 5.
Economic parameters for discounted cash flow analysis.
| Item | Scenarios CN, NREL-CN | NREL case ② |
|---|---|---|
| Plant life | 30 years | 30 years |
| Discount rate | 13% [] | 10% |
| General plant depreciation | SL ① Depreciation [] | 200% declining balance (DB) |
| General plant recovery period | 20 years | 7 years |
| Steam plant depreciation | SL ① Depreciation [] | 150% DB |
| Steam plant recovery period | 20 years | 20 years |
| Financing | 40% equity | 40% equity |
| Loan terms | 10-year loan at 6.9% | 10-year loan at 8% APR |
| Construction period | 3 years | 3 years |
| First 12 months’ expenditures | 8% | 8% |
| Next 12 months’ expenditures | 60% | 60% |
| Last 12 months’ expenditures | 32% | 32% |
| Working capital | 5% of FCI | 5% of FCI |
| Start-up time | 3 months | 3 months |
| Revenues during start-up | 50% | 50% |
| Variable costs during start-up | 75% | 75% |
| Fixed costs during start-up | 100% | 100% |
| Income Tax Rate | 25% [] | 35% |
| VAT rate 1 | 17% [] | - |
| VAT rate 2 | 13% [] | - |
| Consumption rate | 5% [] | - |
| UMCT&ES | 10% [] | - |
| Feed-in tariff | $0.123/kwh ③ |
Notes: ① SL-straight line; ② data source: Page 68 of the NREL report []; ③ Current price of biopower.
5.5. Feedstock Cost Calculation
In Scenarios CN and NREL-CN, the feedstock cost (plant-gate) is $74/t (450 yuan/t) based on the result of the FCEM. Some of the key data and calculation results are listed in Table 6, Table 7 and Table 8. For details of the calculation, please refer to the supplementary file.
Table 6.
Prices used in feedstock cost estimation.
| Items | Unit | Price |
|---|---|---|
| Diesel price | $/L | 1.23 ① |
| Electricity price | $/kWh | 0.12 [] |
| Laborers’ salary for feedstock collection and pretreatment | $/laborday | 12.0 [] |
| Laborers’ salary at the fuel ethanol station | $/laborday | 11.5 [] |
| Salary of tractor drivers | $/laborday | 12.0 [] |
| Salary of truck drivers | $/laborday | 32.8 [] |
| Salary of liquid tank truck drivers | $/laborday | 32.8 [] |
| Feedstock on-field purchasing price | $/t | 27.6 [] |
Sources: ① Survey.
Table 7.
General data in feedstock cost estimation.
| Items | Unit | results |
|---|---|---|
| Ethanol production of the plant | t/year | 106,557 ① |
| Feedstock requirement of the plant | t/year | 876,042 [] |
| Feedstock processing efficiency | 0.90 [] | |
| Feedstock collected from the field | t/year | 973,380 ② |
| Maximum capacity of the center | T | 50,000 [] |
| Number of collection center | 20 |
Notes: ① Calculated by Aspen Plus simulation; ② =Feedstock requirement of the plant/feedstock processing efficiency.
Table 8.
Key parameters for feedstock cost estimation.
| Symbol | Unit | Results | Sources |
|---|---|---|---|
| Yn | t/ha. | 650 | [] |
| αn | 0.50 | Assumption | |
| βfc | 1.40 | [] | |
| tfc | yuan/tkm | 1.20 | Survey |
| βcp | 1.40 | Assumption | |
| tcp | yuan/tkm | 0.24 | Survey |
5.6. Total Capital Investment
Parameters of equipment were obtained by Aspen Plus simulation. Base prices of similar equipment pieces were obtained from the Machinery & Electronic Products Quotation Manual (2011) [], and then the purchase prices of equipment required in the process were determined using polynomial fitting method. The prices of equipment for 2013 were then determined based on the Price Index of Fixed Assets Investment during 2002–2012, published by the National Bureau of Statistics of China []. Thereafter, the total capital investment was determined by Langer Coefficient Method. It is assumed that the ethanol mill is built on land of Class 12 [], which has a unit price of $20/m2 (120 yuan/m2), and that the total area of the mill is 533,600 m2 (800 mu) []. The calculation results in Scenario CN_1 are shown in Table 9.
Table 9.
Summary of the total capital investment (Scenario CN_1).
| Item | Description | Amount | |
|---|---|---|---|
| Total equipment purchased cost, TEPC | $72,666,884 | ||
| Equipment installation | 39% | of TEPC | $28,340,085 |
| Instrumentation and control system | 13% | of TEPC | $9,446,695 |
| Process piping | 31% | of TEPC | $22,526,734 |
| Electrical equipment | 10% | of TEPC | $7,266,688 |
| Buildings | 10% | of TEPC | $7,266,688 |
| Site development | 10% | of TEPC | $7,266,688 |
| Total plant direct cost, TPDC | $154,780,464 | ||
| Engineering design and supervision | 32% | of TEPC | $23,253,403 |
| Construction | 34% | of TEPC | $24,706,741 |
| Total plant indirect cost, TPIC | $47,960,144 | ||
| Total plant cost, TPC | $202,740,607 | ||
| Contractor’s fee | 5% | of TPC | $10,137,030 |
| Contingency | 10% | of TPC | $20,274,061 |
| Fixed capital investment, FCI | $233,151,698 | ||
| Working capital | 5% | of FCI | $11,657,585 |
| Land | $10,497,049 | ||
| Total capital investment, TCI | $255,306,332 | ||
In the scenario, the plant consumes 2,000 dry tons of feedstock per day, with an expected 8,410 operation hours. The annual ethanol production is 35,150,000 gallons, and the total capital investment (TCI) per gallon of bioethanol is $7.26 (2,432 yuan).
5.7. Operating Costs
5.7.1. Variable Operating Cost
Variable operating cost, which includes raw materials except feedstock (corn stover) in the context and waste handling charges, is incurred only when the process is in operation. Quantities of raw materials used and wastes produced were determined by Aspen Plus simulation. The unit prices of various materials were determined based on quotations. The operating time of the plant is expected to be 8,410 hours per year (96% uptime). The VOC for Scenario CN_1 are shown in Table 10. The same calculation method was used for other scenarios.
5.7.2. Fixed Operating Cost
Fixed operating cost is generally incurred in full whether or not the plant is producing at full capacity. It includes labor costs, maintenance expenses and management costs. Table 11 summarizes the fixed operating cost in Scenario CN_1. The salary data were obtained from the annual report of COFCO Biochemical (Anhui) Co., Ltd., as well as from job hunting sites. The determination of maintenance expenses was based on the experiences of chemical industry [,]. The same calculation method was used for the other scenarios.
Table 10.
Variable operating cost (Scenario CN_1).
| Process area | Stream Description | Usage ① (kg/hr) | Cost ② ($/ton) | MM$/year (2013) | Cent/Gal Ethanol |
|---|---|---|---|---|---|
| Raw Materials | |||||
| A200 | Sulfuric acid, 93% | 1,981 | 90 | 1.50 | 4.27 |
| Ammonia | 1,047 | 575 | 5.07 | 14.42 | |
| A300 | Corn steep liquor | 1,143 | 105 | 1.01 | 2.88 |
| Diammonium phosphate | 141 | 1,439 | 1.71 | 4.87 | |
| Sorbitol | 44 | 3,069 | 1.15 | 3.26 | |
| A400 | Purchased enzyme | 0 | 0 | 0.00 | 0.00 |
| Glucose | 6,252 | 787 | 41.37 | 117.71 | |
| Corn steep liquor | 425 | 90 | 0.32 | 0.92 | |
| Ammonia | 297 | 492 | 1.23 | 3.50 | |
| Host nutrients | 174 | 630 | 0.92 | 2.63 | |
| Sulfur dioxide | 42 | 328 | 0.12 | 0.33 | |
| A600 | Caustic (as pure) | 2187 | 297 | 5.47 | 15.56 |
| A800 | Boiler chemicals | 0 | 4,949 | 0.01 | 0.03 |
| FGD Lime | 1097 | 96 | 0.88 | 2.52 | |
| Feedstock | 0 | 0 | 0.00 | 0.00 | |
| A900 | Cooling tower chemicals | 4 | 2455 | 0.08 | 0.21 |
| Makeup water | 226,045 | 0 | 0.44 | 1.24 | |
| Subtotal | 125.90 | 174.35 | |||
| Waste disposal | |||||
| A800 | Disposal of Ash | 6,062 | 35 | 1.78 | 5.08 |
| Subtotal | 1.78 | 5.08 | |||
| Total variable operating costs | 127.69 | 179.43 | |||
Notes: Source: ① Aspen simulation results; ② the prices were obtained by quotation.
Table 11.
Annual fixed operating cost (Scenario CN_1).
| Labor Cost | |||
|---|---|---|---|
| Position | Salary | # required a | Cents/Gal EtOH |
| Plant manager | 70,492 [] | 1 | 0.20 |
| Vice plant managers | 49,180 [] | 3 | 0.42 |
| Plant engineer | 39,344 [] | 1 | 0.11 |
| Maintenance supervisors | 9,836 [] | 3 | 0.08 |
| Maintenance technician | 6,557 [] | 21 | 0.39 |
| Lab manager | 14,754 [] | 1 | 0.04 |
| Lab technician | 9,836 [] | 4 | 0.11 |
| Lab technician-enzyme | 9,836 [] | 4 | 0.11 |
| Shift supervisors | 8,197 [] | 21 | 0.49 |
| Shift operators | 5,738 [] | 222 | 3.62 |
| Sales manager | 13,115 [] | 1 | 0.04 |
| Salesmen | 8,197 [] | 6 | 0.14 |
| Clerks & secretaries | 4,918 [] | 12 | 0.17 |
| Total salaries | 5.93 | ||
| Labor burden (40%) | 2.37 | ||
| Subtotal | 8.31 | ||
| Maintenance | 5% of FCI b | 33.17 | |
| Management | 5% of Sales b | 30.25 | |
| Total | 71.72 |
Sources: a the numbers required were determined on [,,,]; b [].
6. Results and Discussion
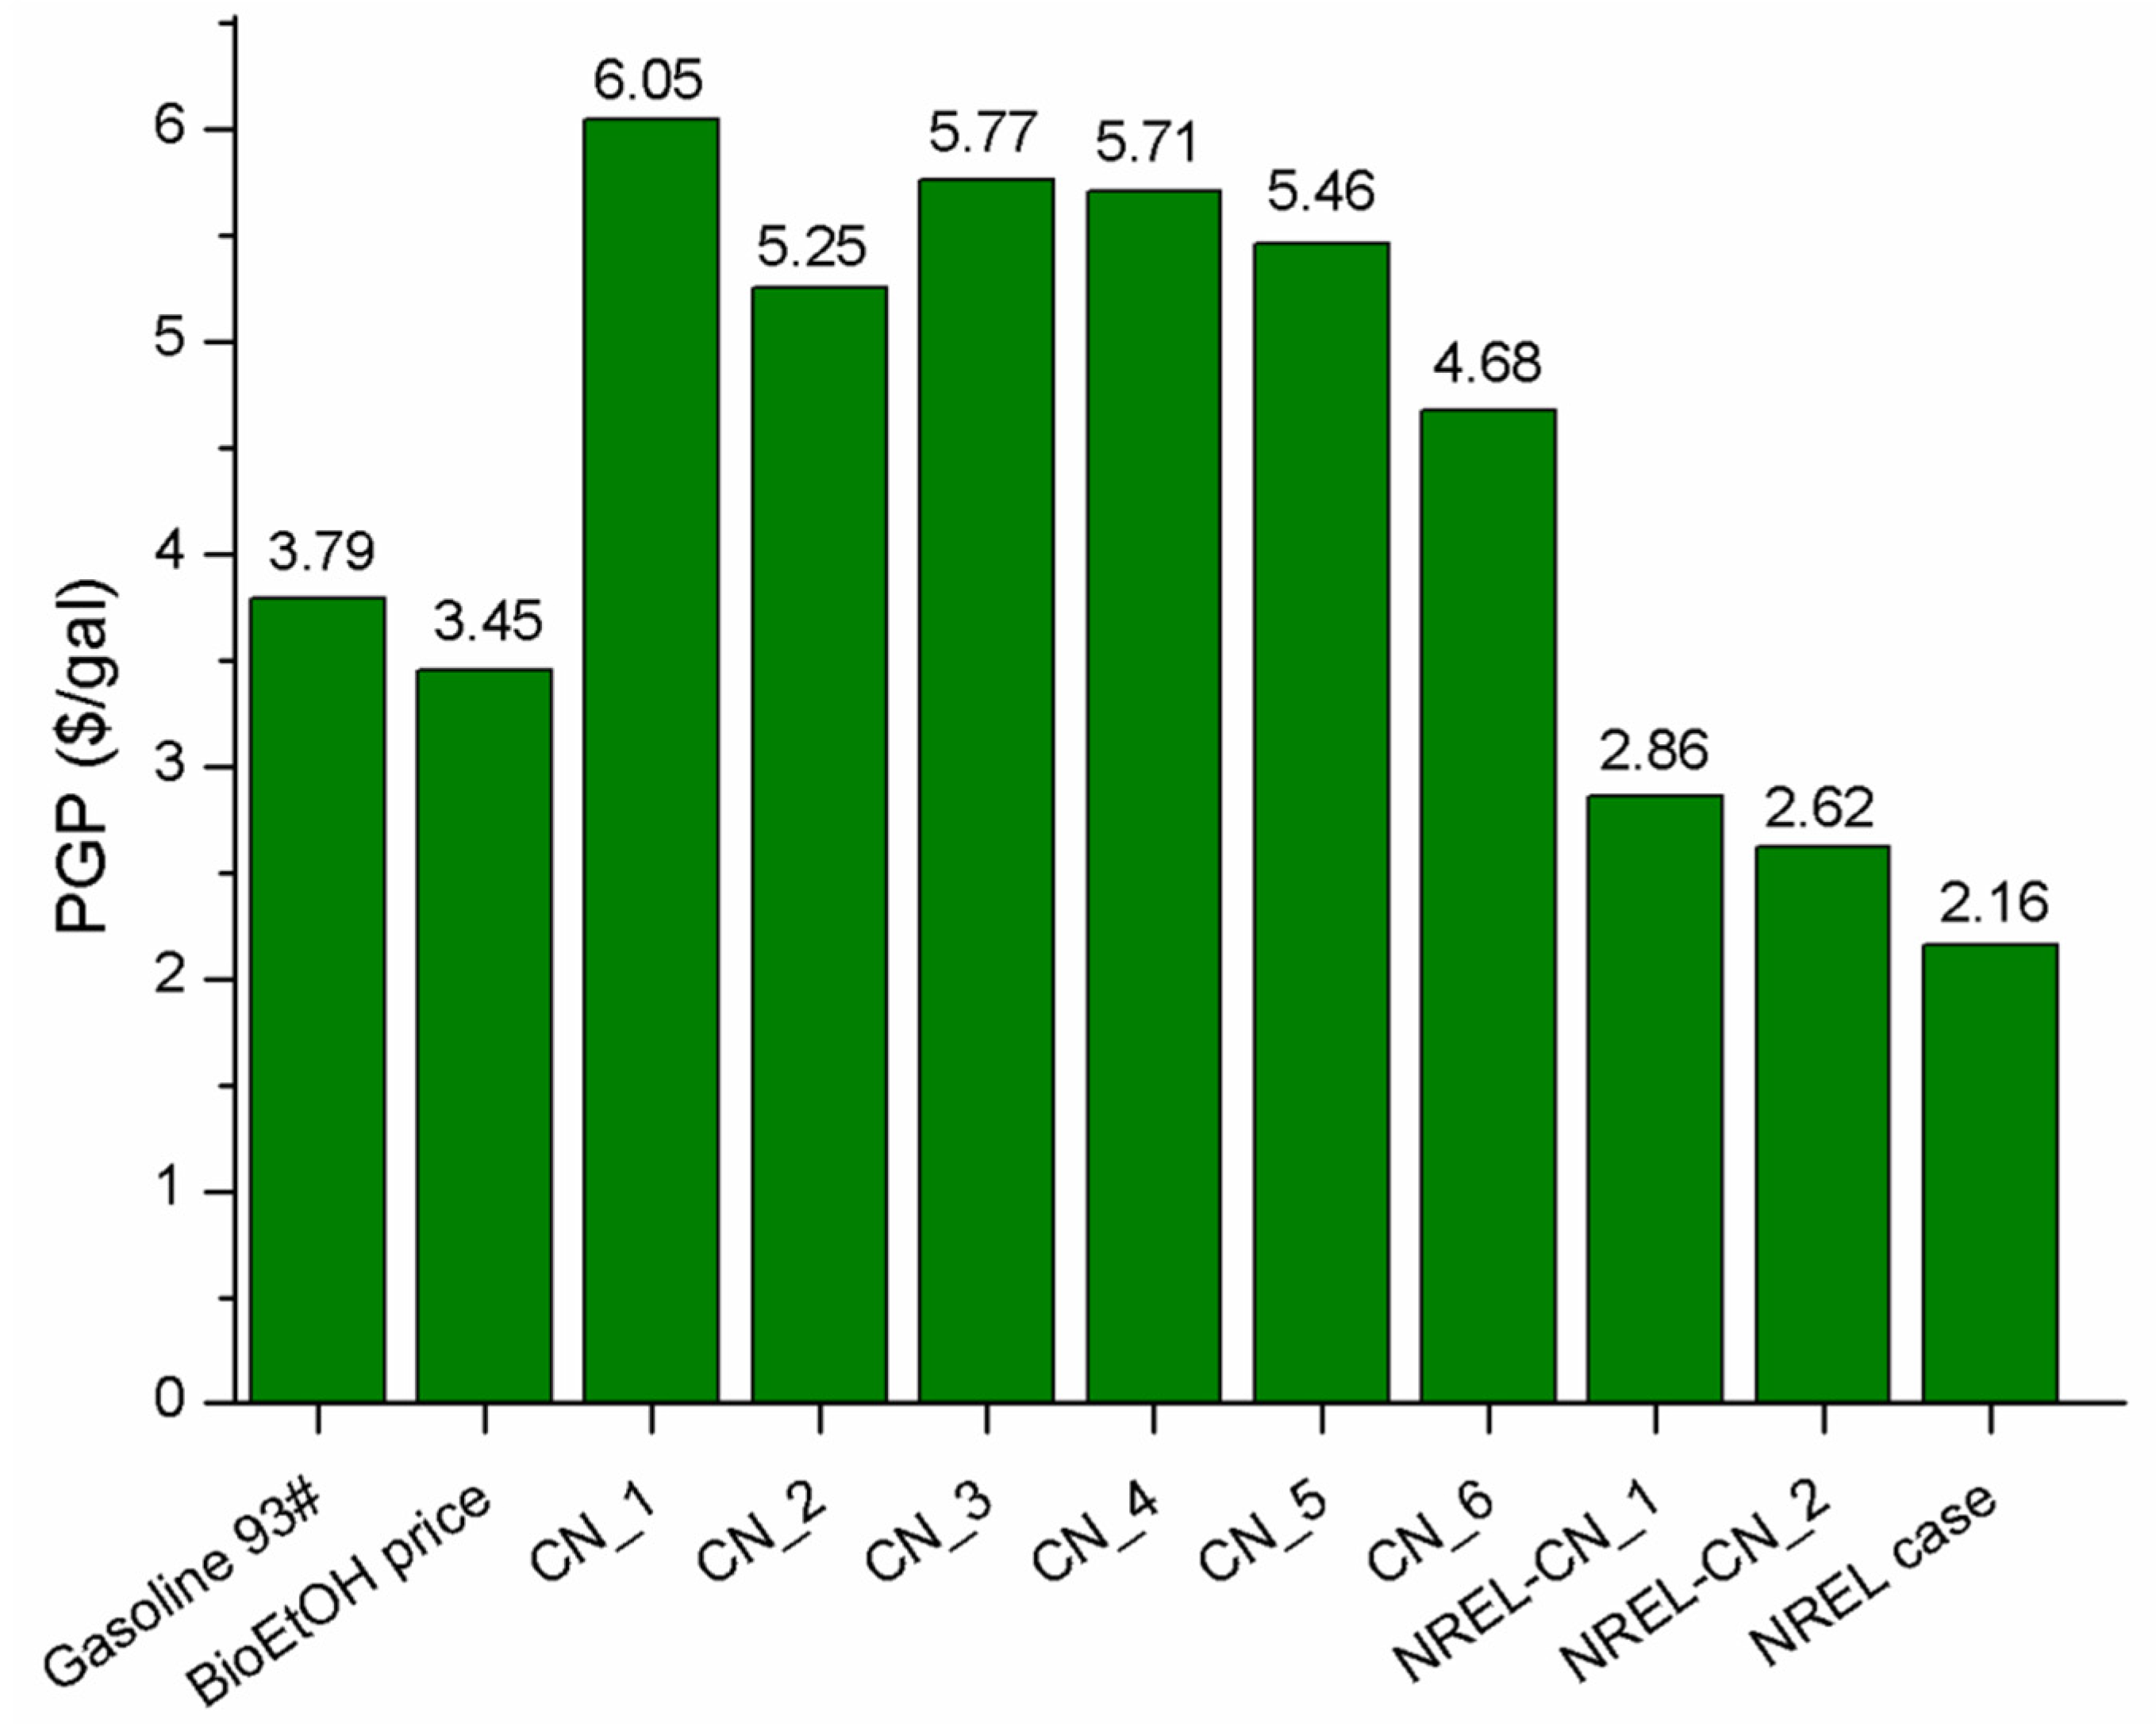
6.1. PGP of Bioethanol in Different Scenarios
As shown in Figure 4, the results show that the PGP of bioethanol in Scenario CN_1-6 are 6.05/gal (12,356 yuan/t), 5.25/gal (10,723 yuan/t), 5.77/gal (11,785 yuan/t), 5.71/gal (11,663 yuan/t), 5.46/gal (11,158 yuan/t), and 4.68/gal (9,550 yuan/t), respectively. In contrast, the fossil gasoline PGP in 2013 was around $3.79/gal (8,475 yuan/t). The selling price of fuel ethanol, therefore, was around $3.45/gal (7,722 yuan/t) in that year, determined on the PGP of Gasoline 93# multiplied by 0.9111 in accordance with China’s existing policy. This implies that, under the current situation in China, lignocellulosic ethanol is unable to compete with fossil gasoline on economic grounds. A direct subsidy will help the plant to break even. The size of the subsidy varies in the different scenarios, and is lowest in Scenario CN_6 at $1.23/gal EtOH (around 2500 yuan/t EtOH).
In Scenarios NREL-CN_1-2, the bioethanol PGPs are lower than the current selling price of bioethanol in China. This is due to higher levels of technology efficiency, such as co-fermentation of 5-carbon and 6-carbon sugars, lower enzyme loading and other factors, as listed in Table 3. In these scenarios, none of the incentive policies are needed. The PGP (minimum ethanol selling price, MESP) of bioethanol in the NREL case presented in the 2011 report [] are introduced for comparison.
Figure 4.
Current bioethanol selling price in China, PGPs of gasoline 93# and lingo-cellulosic ethanol in different scenarios, and bioethanol PGP in NREL case. Note: the BioEtOH price indicated by the second bar is the bioethanol price settled by the government, which equals the plant gate price of Gasoline 93# multiplied by 0.9111, based on the current bioethanol pricing mechanism in China.
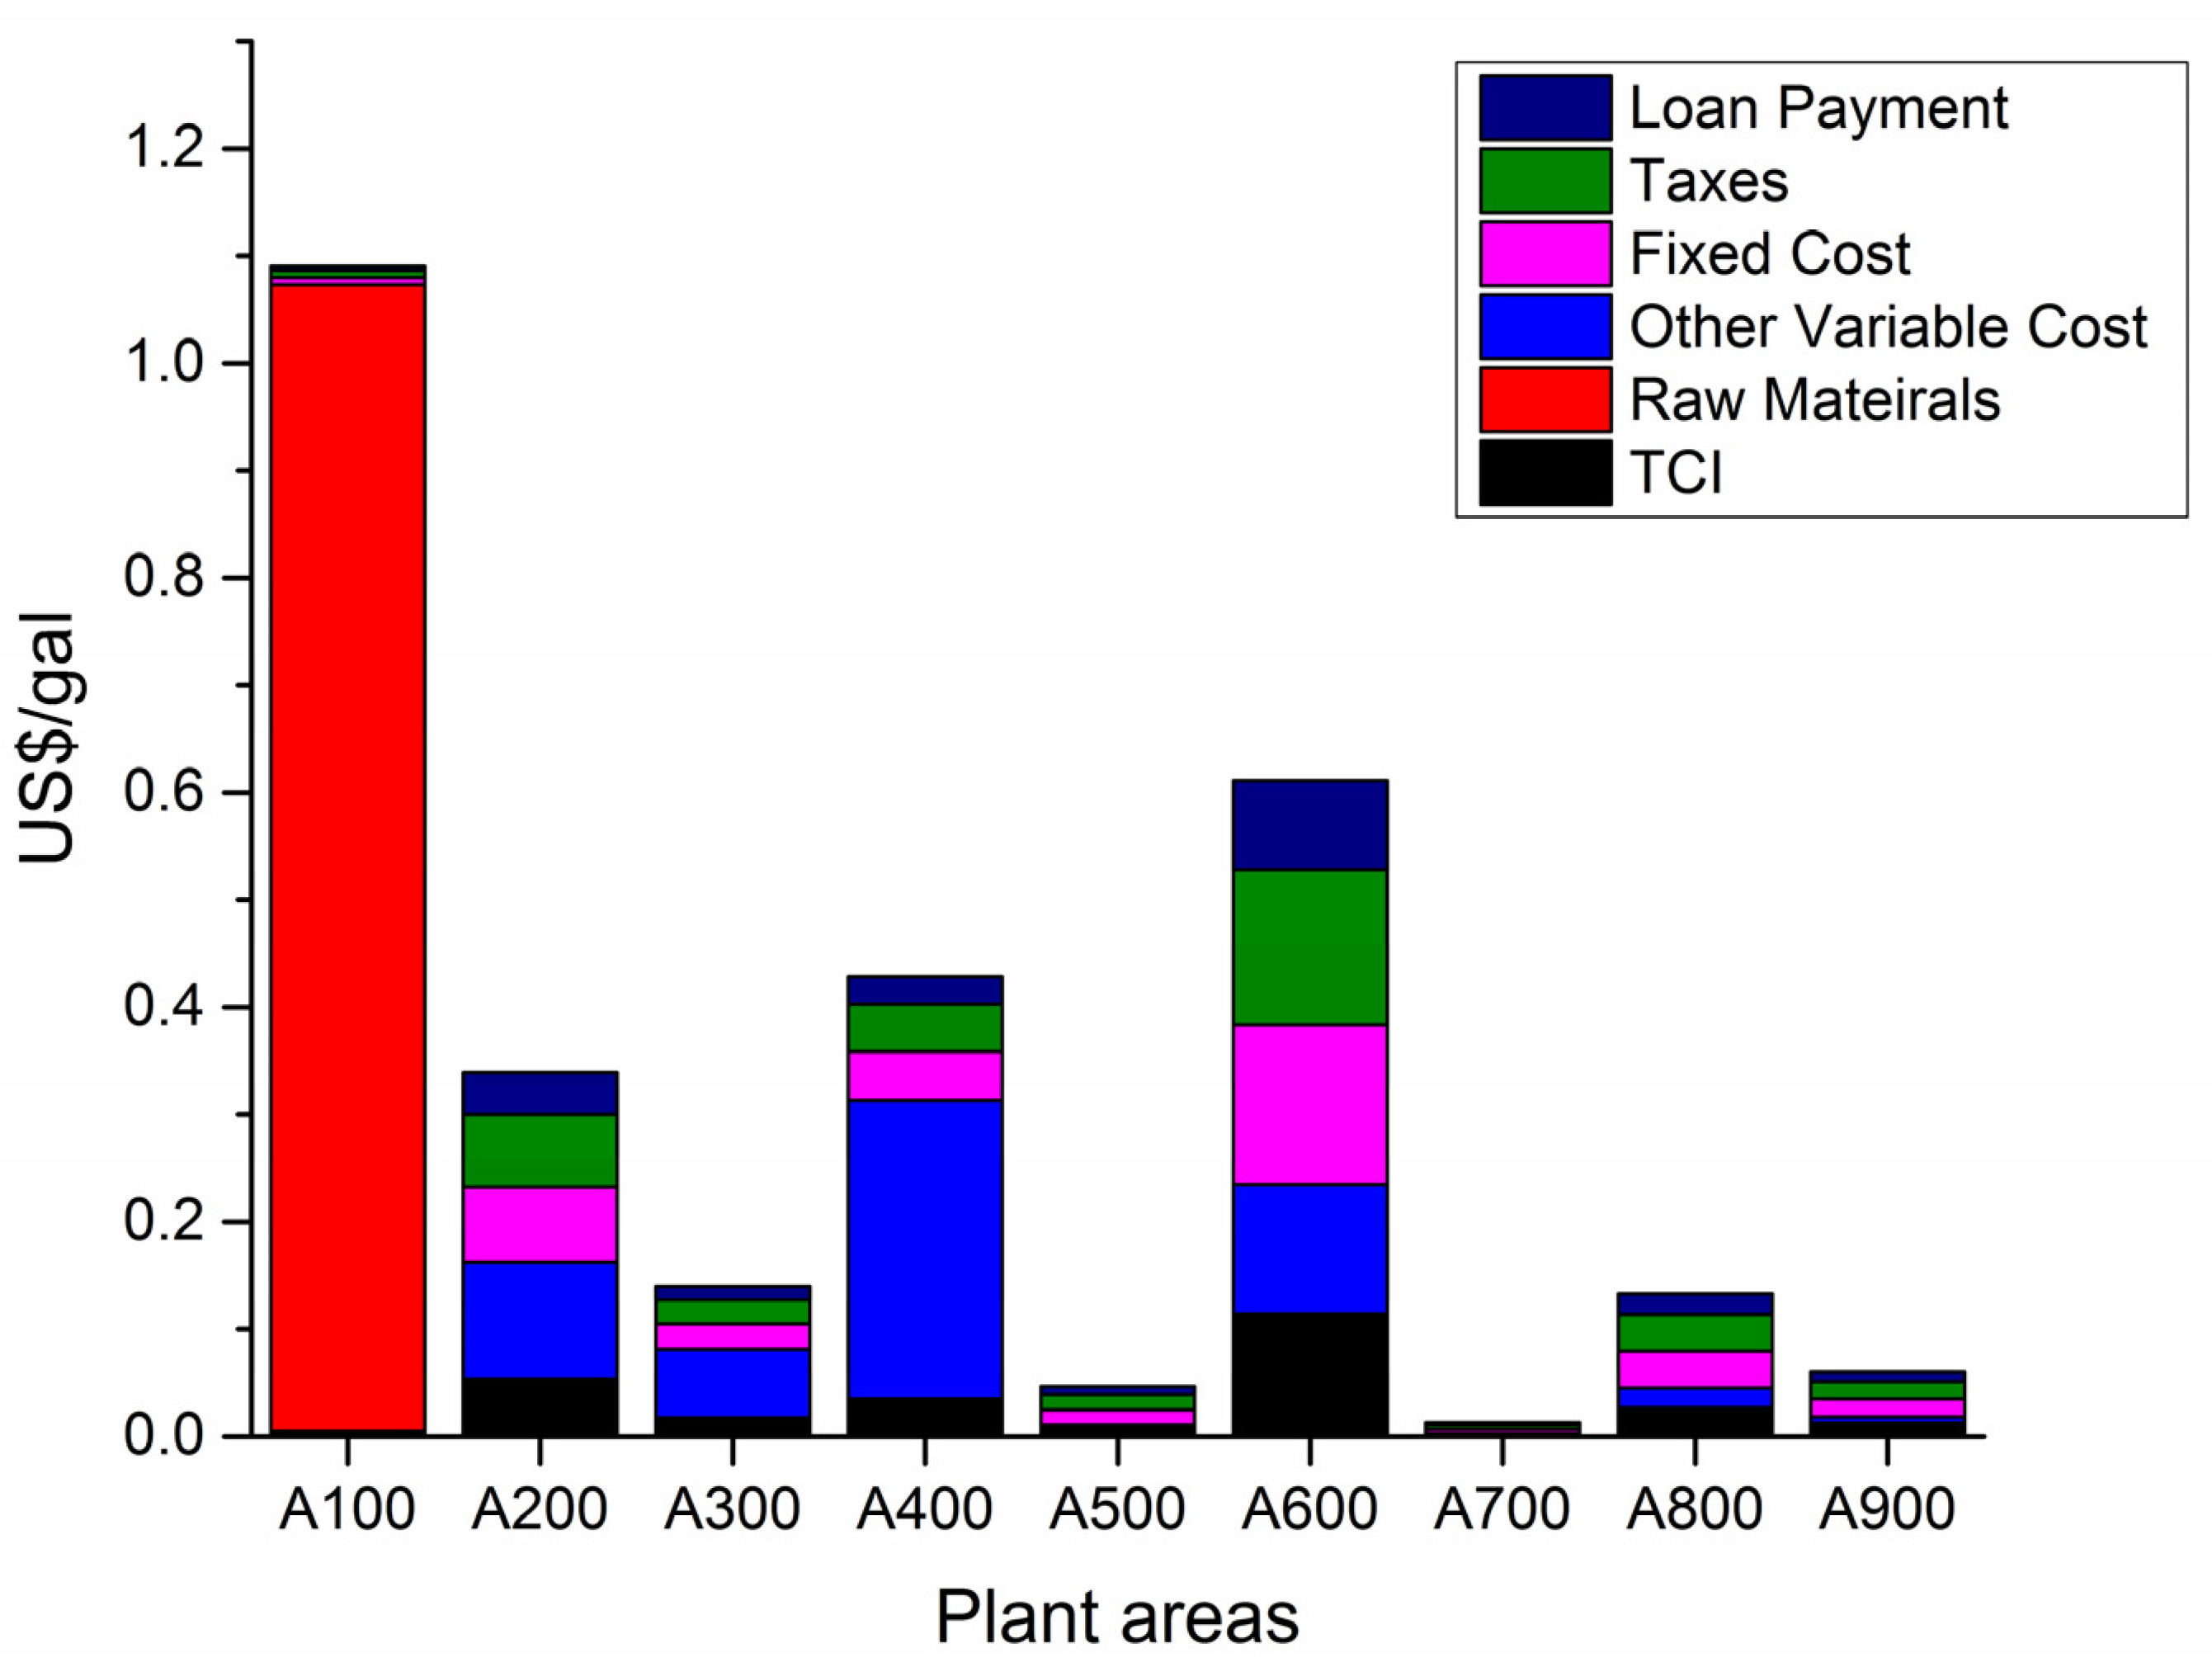
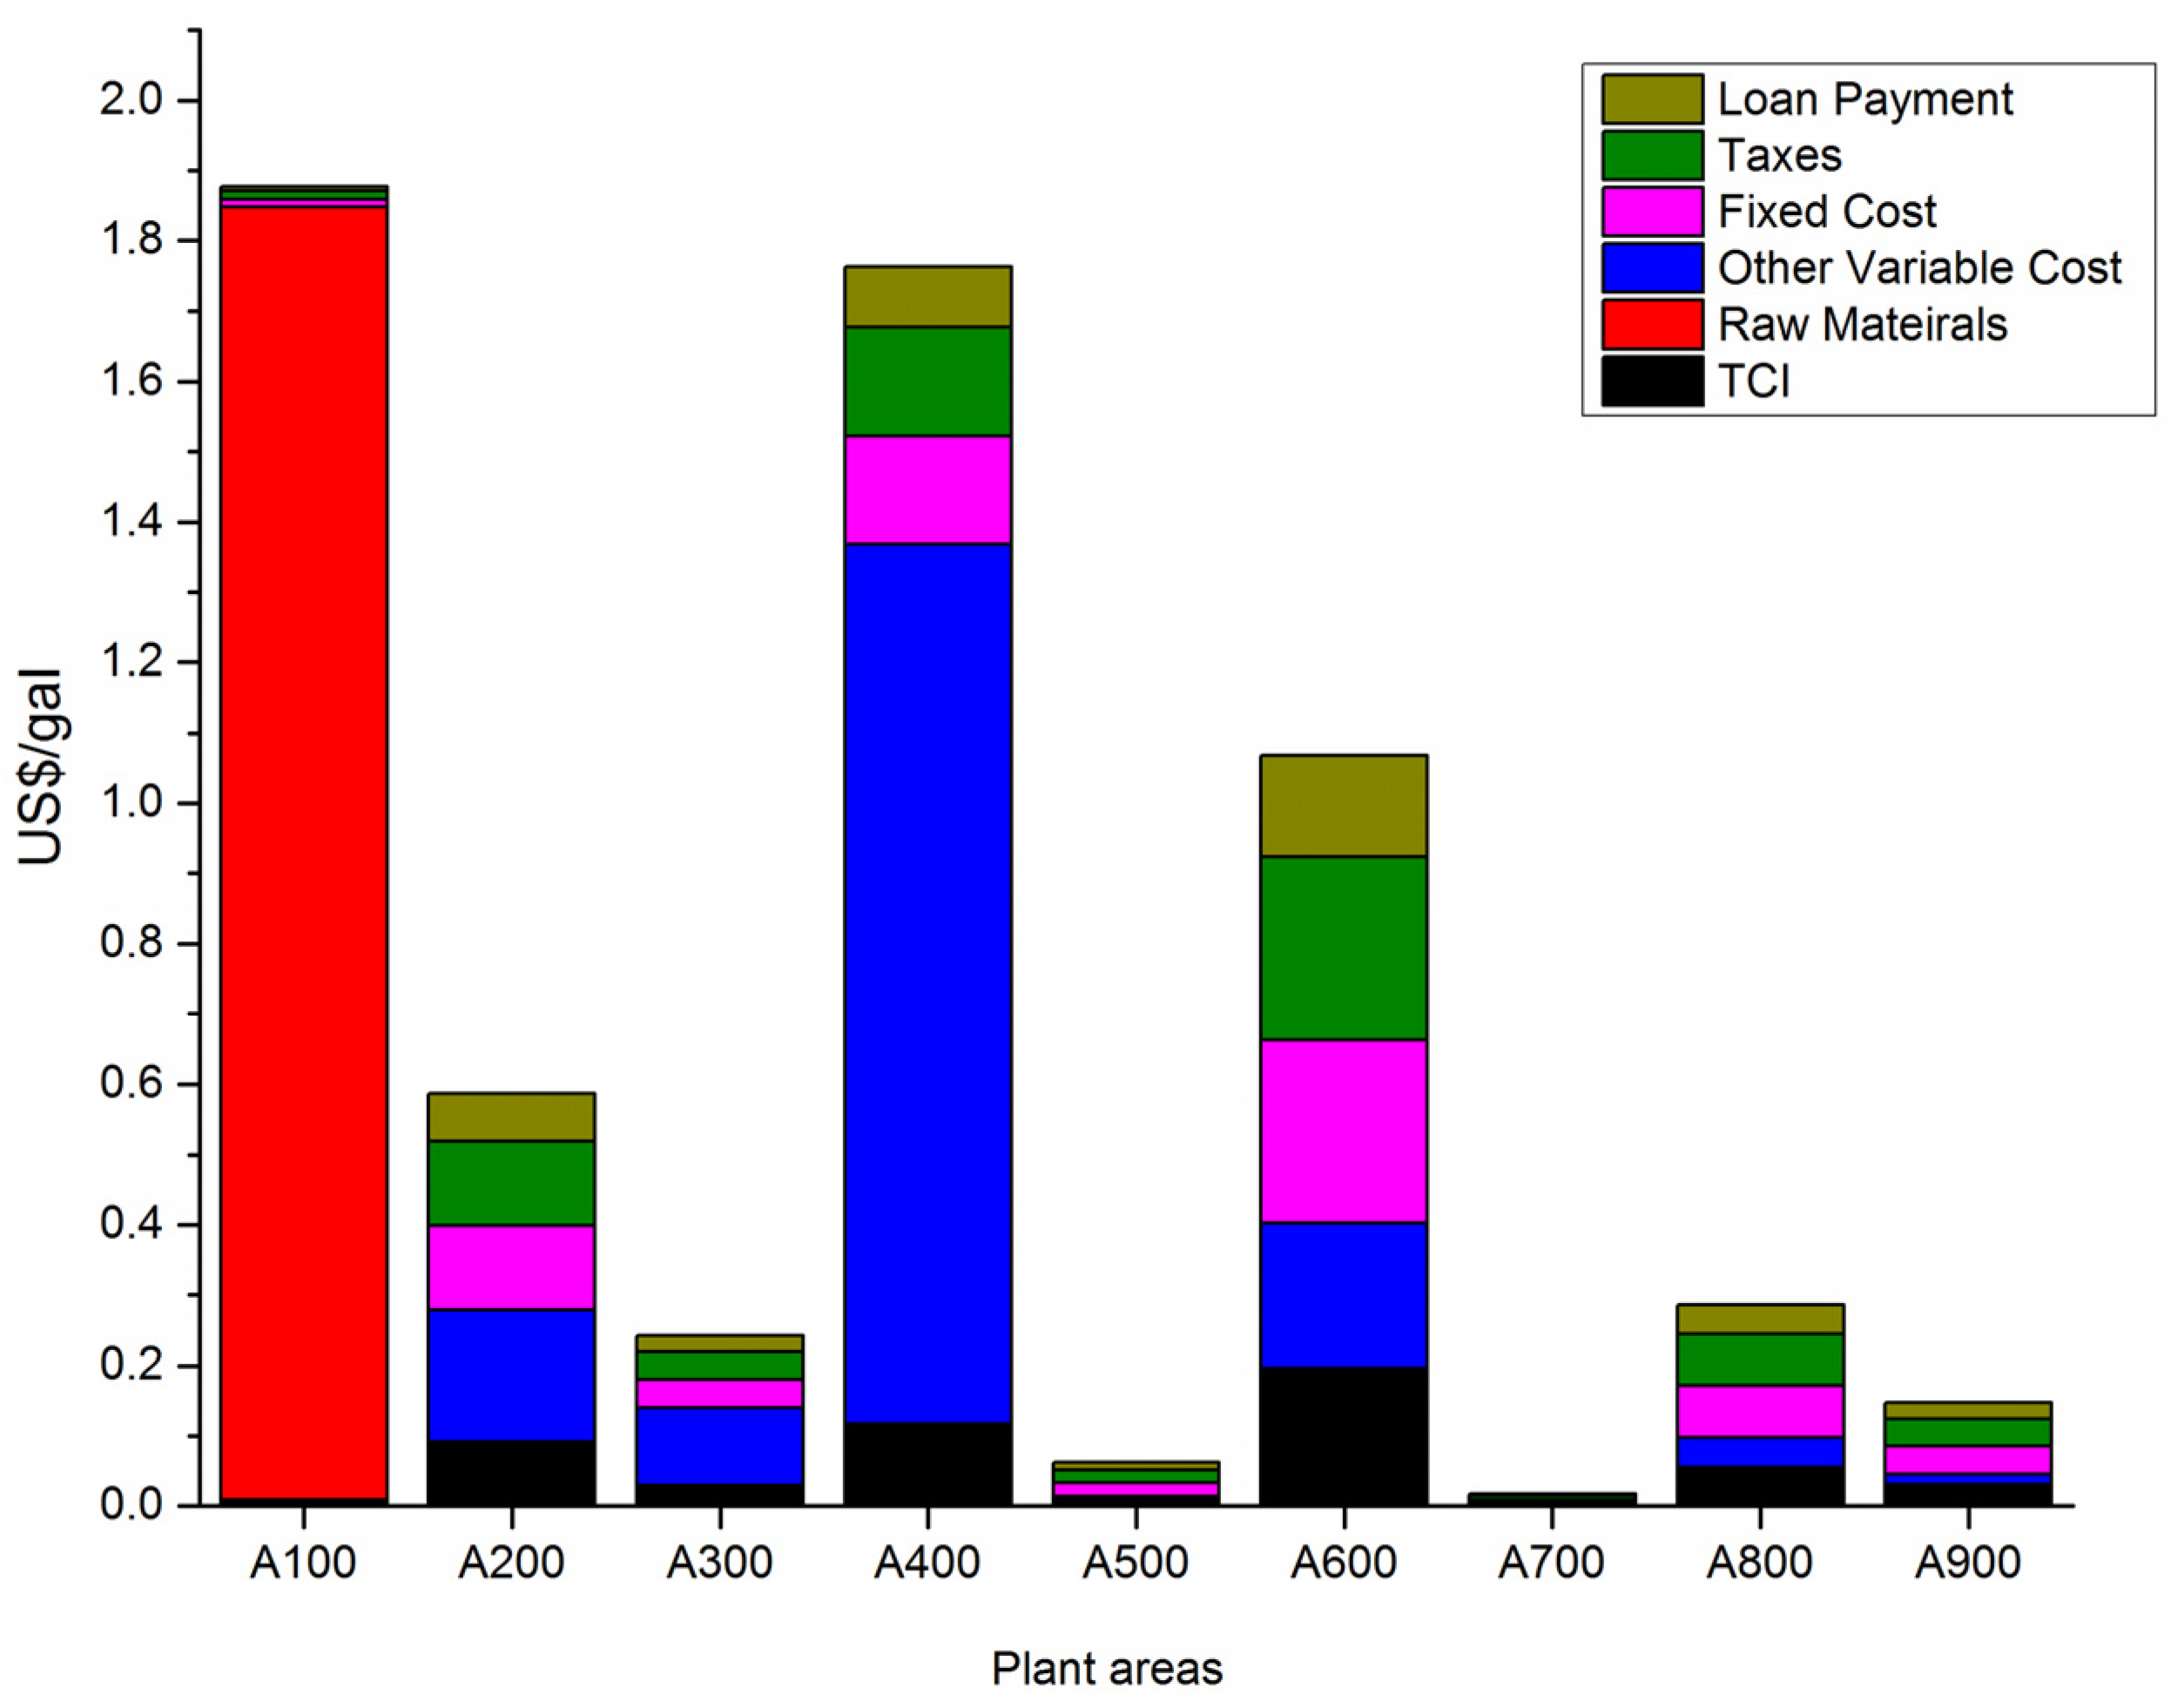
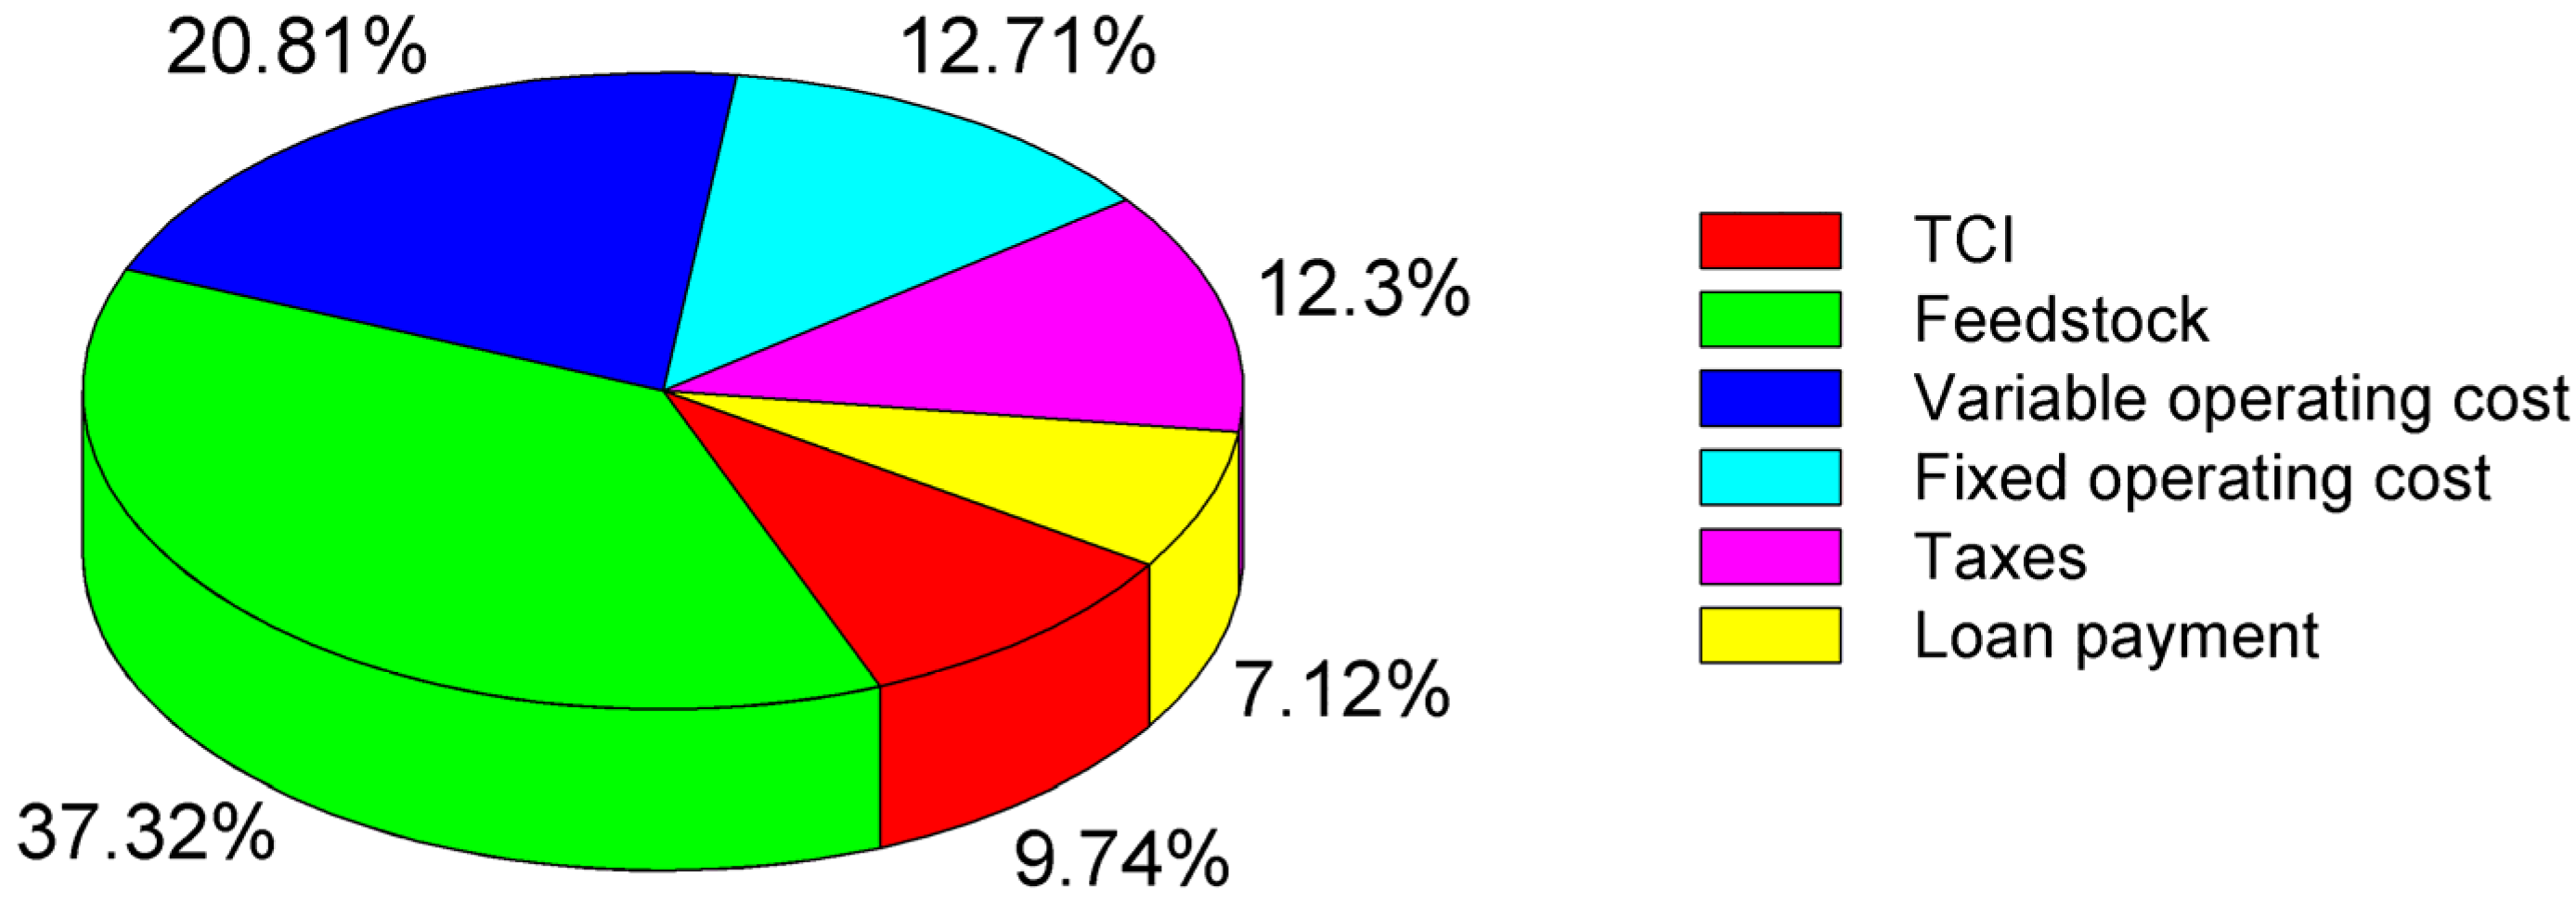
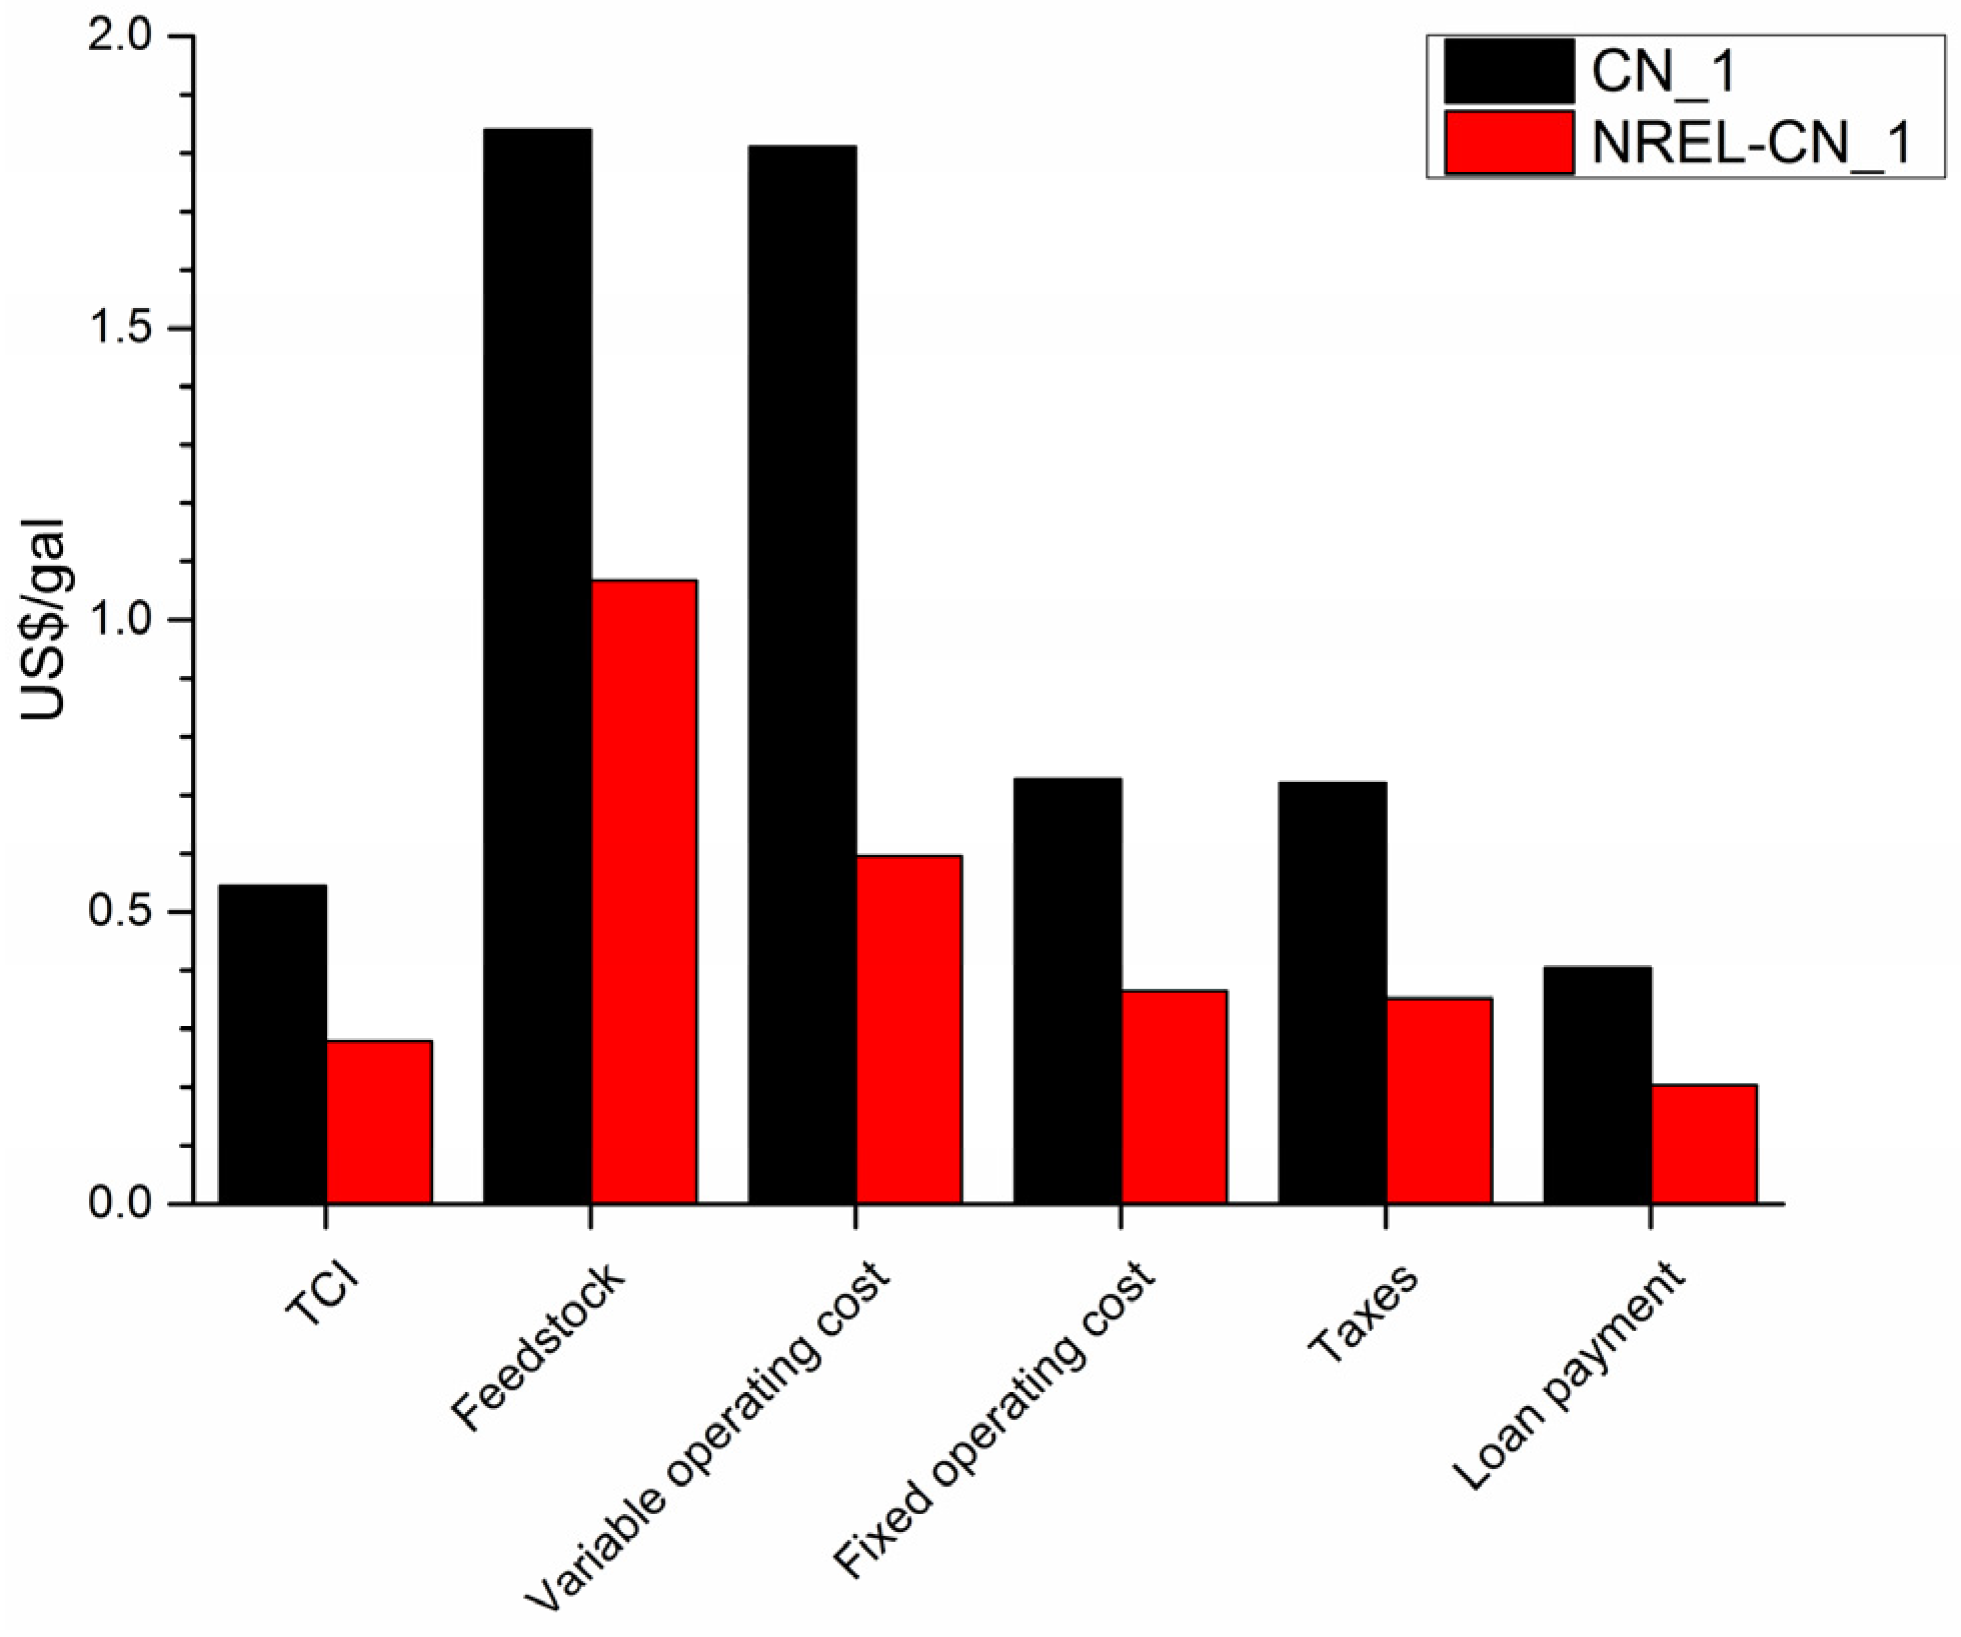
6.2. Cost Breakdown of Areas in Scenarios CN_1 and NREL-CN_1
A breakdown of costs incurred during ethanol production is shown in Figure 5 and Figure 6. In both scenarios, the largest cost during ethanol production is feedstock cost in Area 100. The second most expensive areas in Scenarios CN_1 and NREL-CN_1 are cellulose enzyme in Area 400 and wastewater treatment in Area 600, respectively. The difference is due to the dramatic decrease of enzyme cost in Scenario NREL-CN_1. The cost structure is found to be quite similar across most of the areas.
Figure 5.
Cost breakdown of plant areas in scenario CN_1.
Figure 6.
Cost breakdown of plant areas in scenario NREL-CN_1.
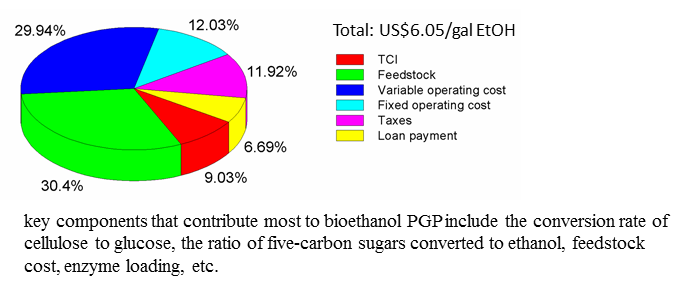
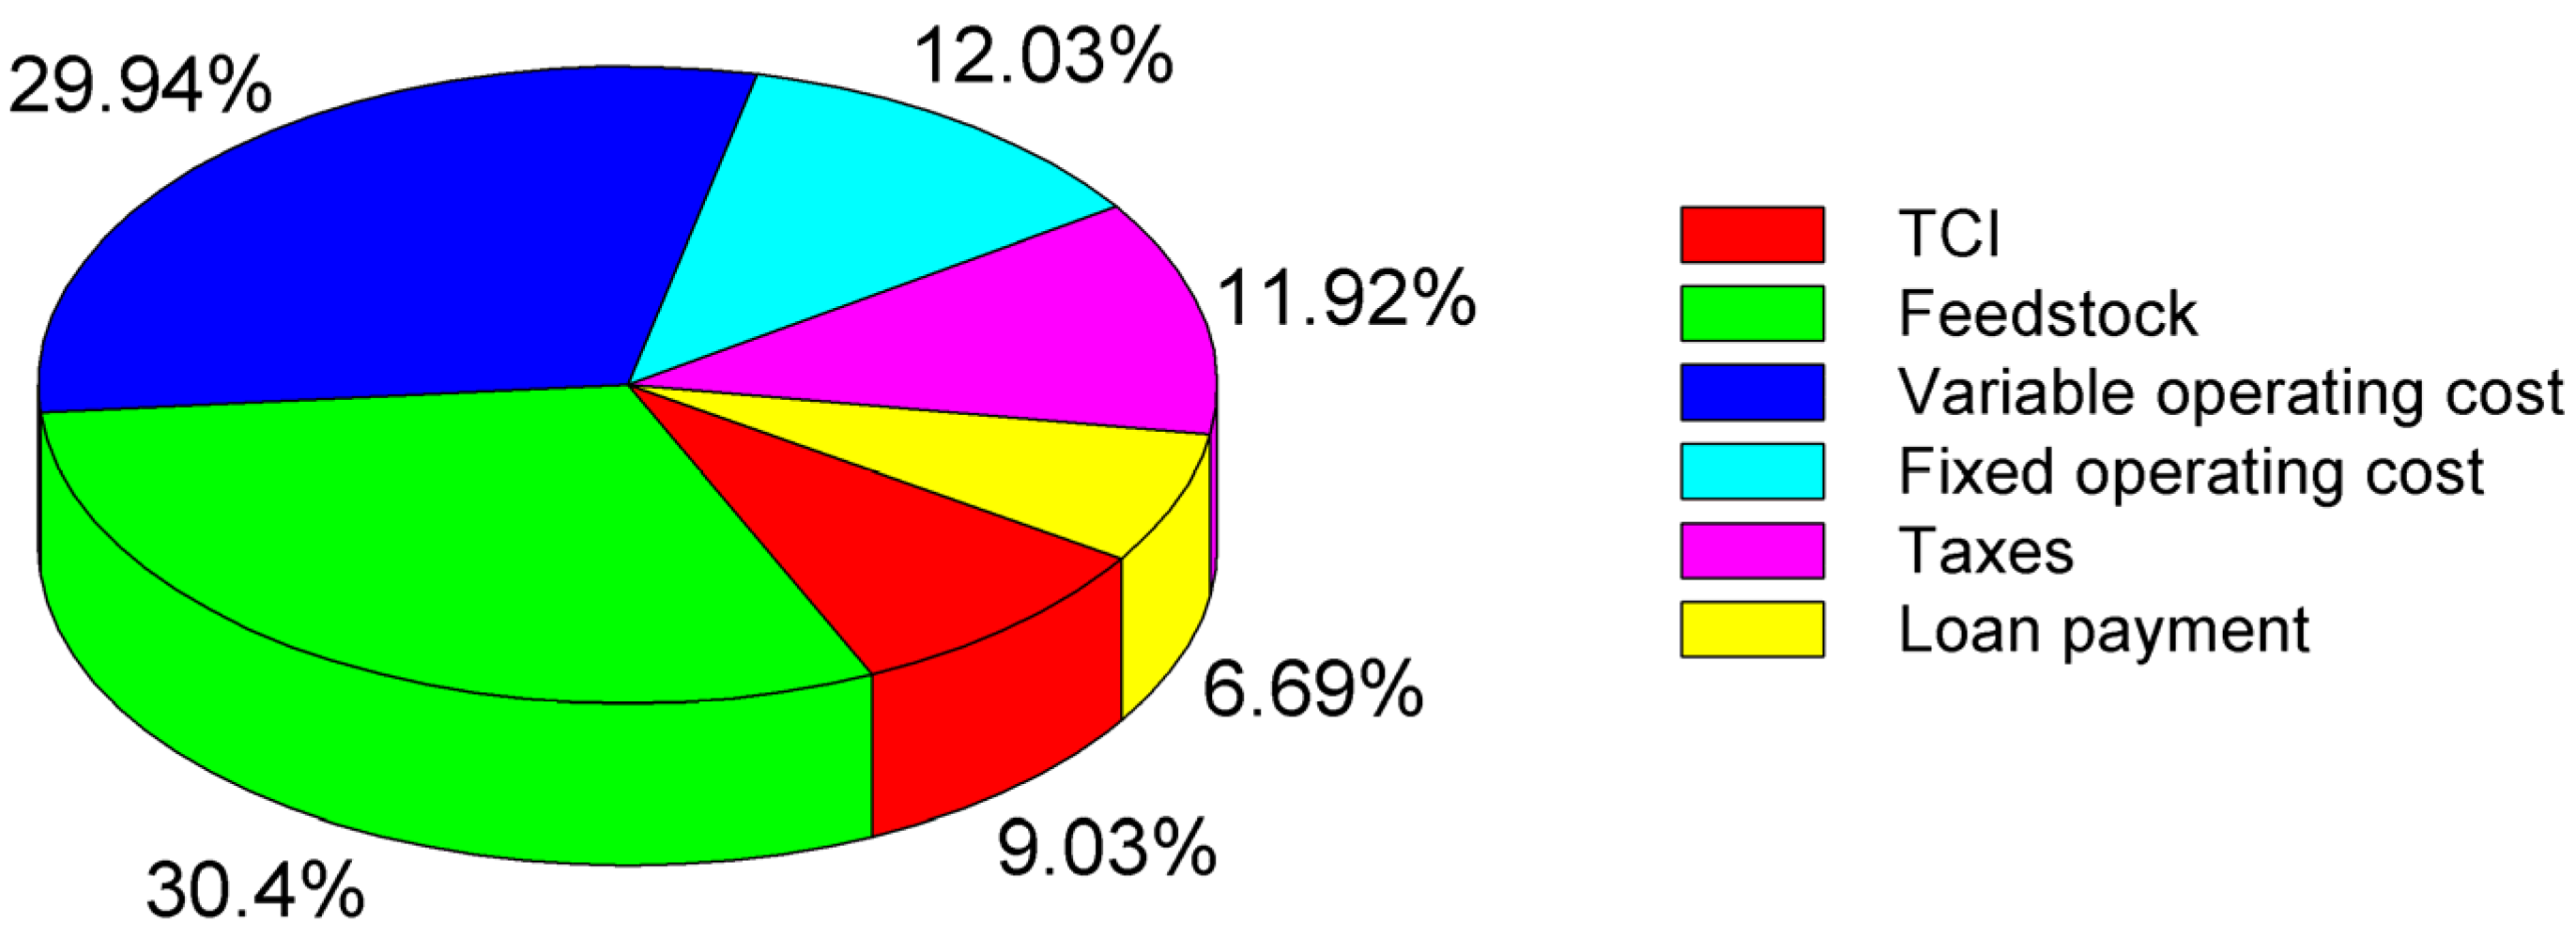
6.3. Cost Breakdown by Composition in Scenarios CN_1 and NREL-CN_1
Figure 7 and Figure 8 show the cost breakdown by composition. The sum of feedstock cost and variable operating cost is the most significant cost in both scenarios, taking up around 60% of the total PGP. It should be noted that taxes account for 12% of ethanol PGP. The share of TCI is around 10%.
Figure 7.
Cost breakdown by composition in scenario CN_1.
Figure 8.
Cost breakdown by composition in scenario NREL-CN_1.
Figure 9 shows the costs of different components in bioethanol production. The cost of each component in Scenario CN_1 is around twice that in Scenario NREL-CN_1. The reason is that the ethanol yield of the former scenario (35.15 MM gal/year) is almost half that of the latter (60.48 MM gal/year). The technology level in China falls far behind NREL’s technology target described in its report [].
Figure 9.
Costs of different components.
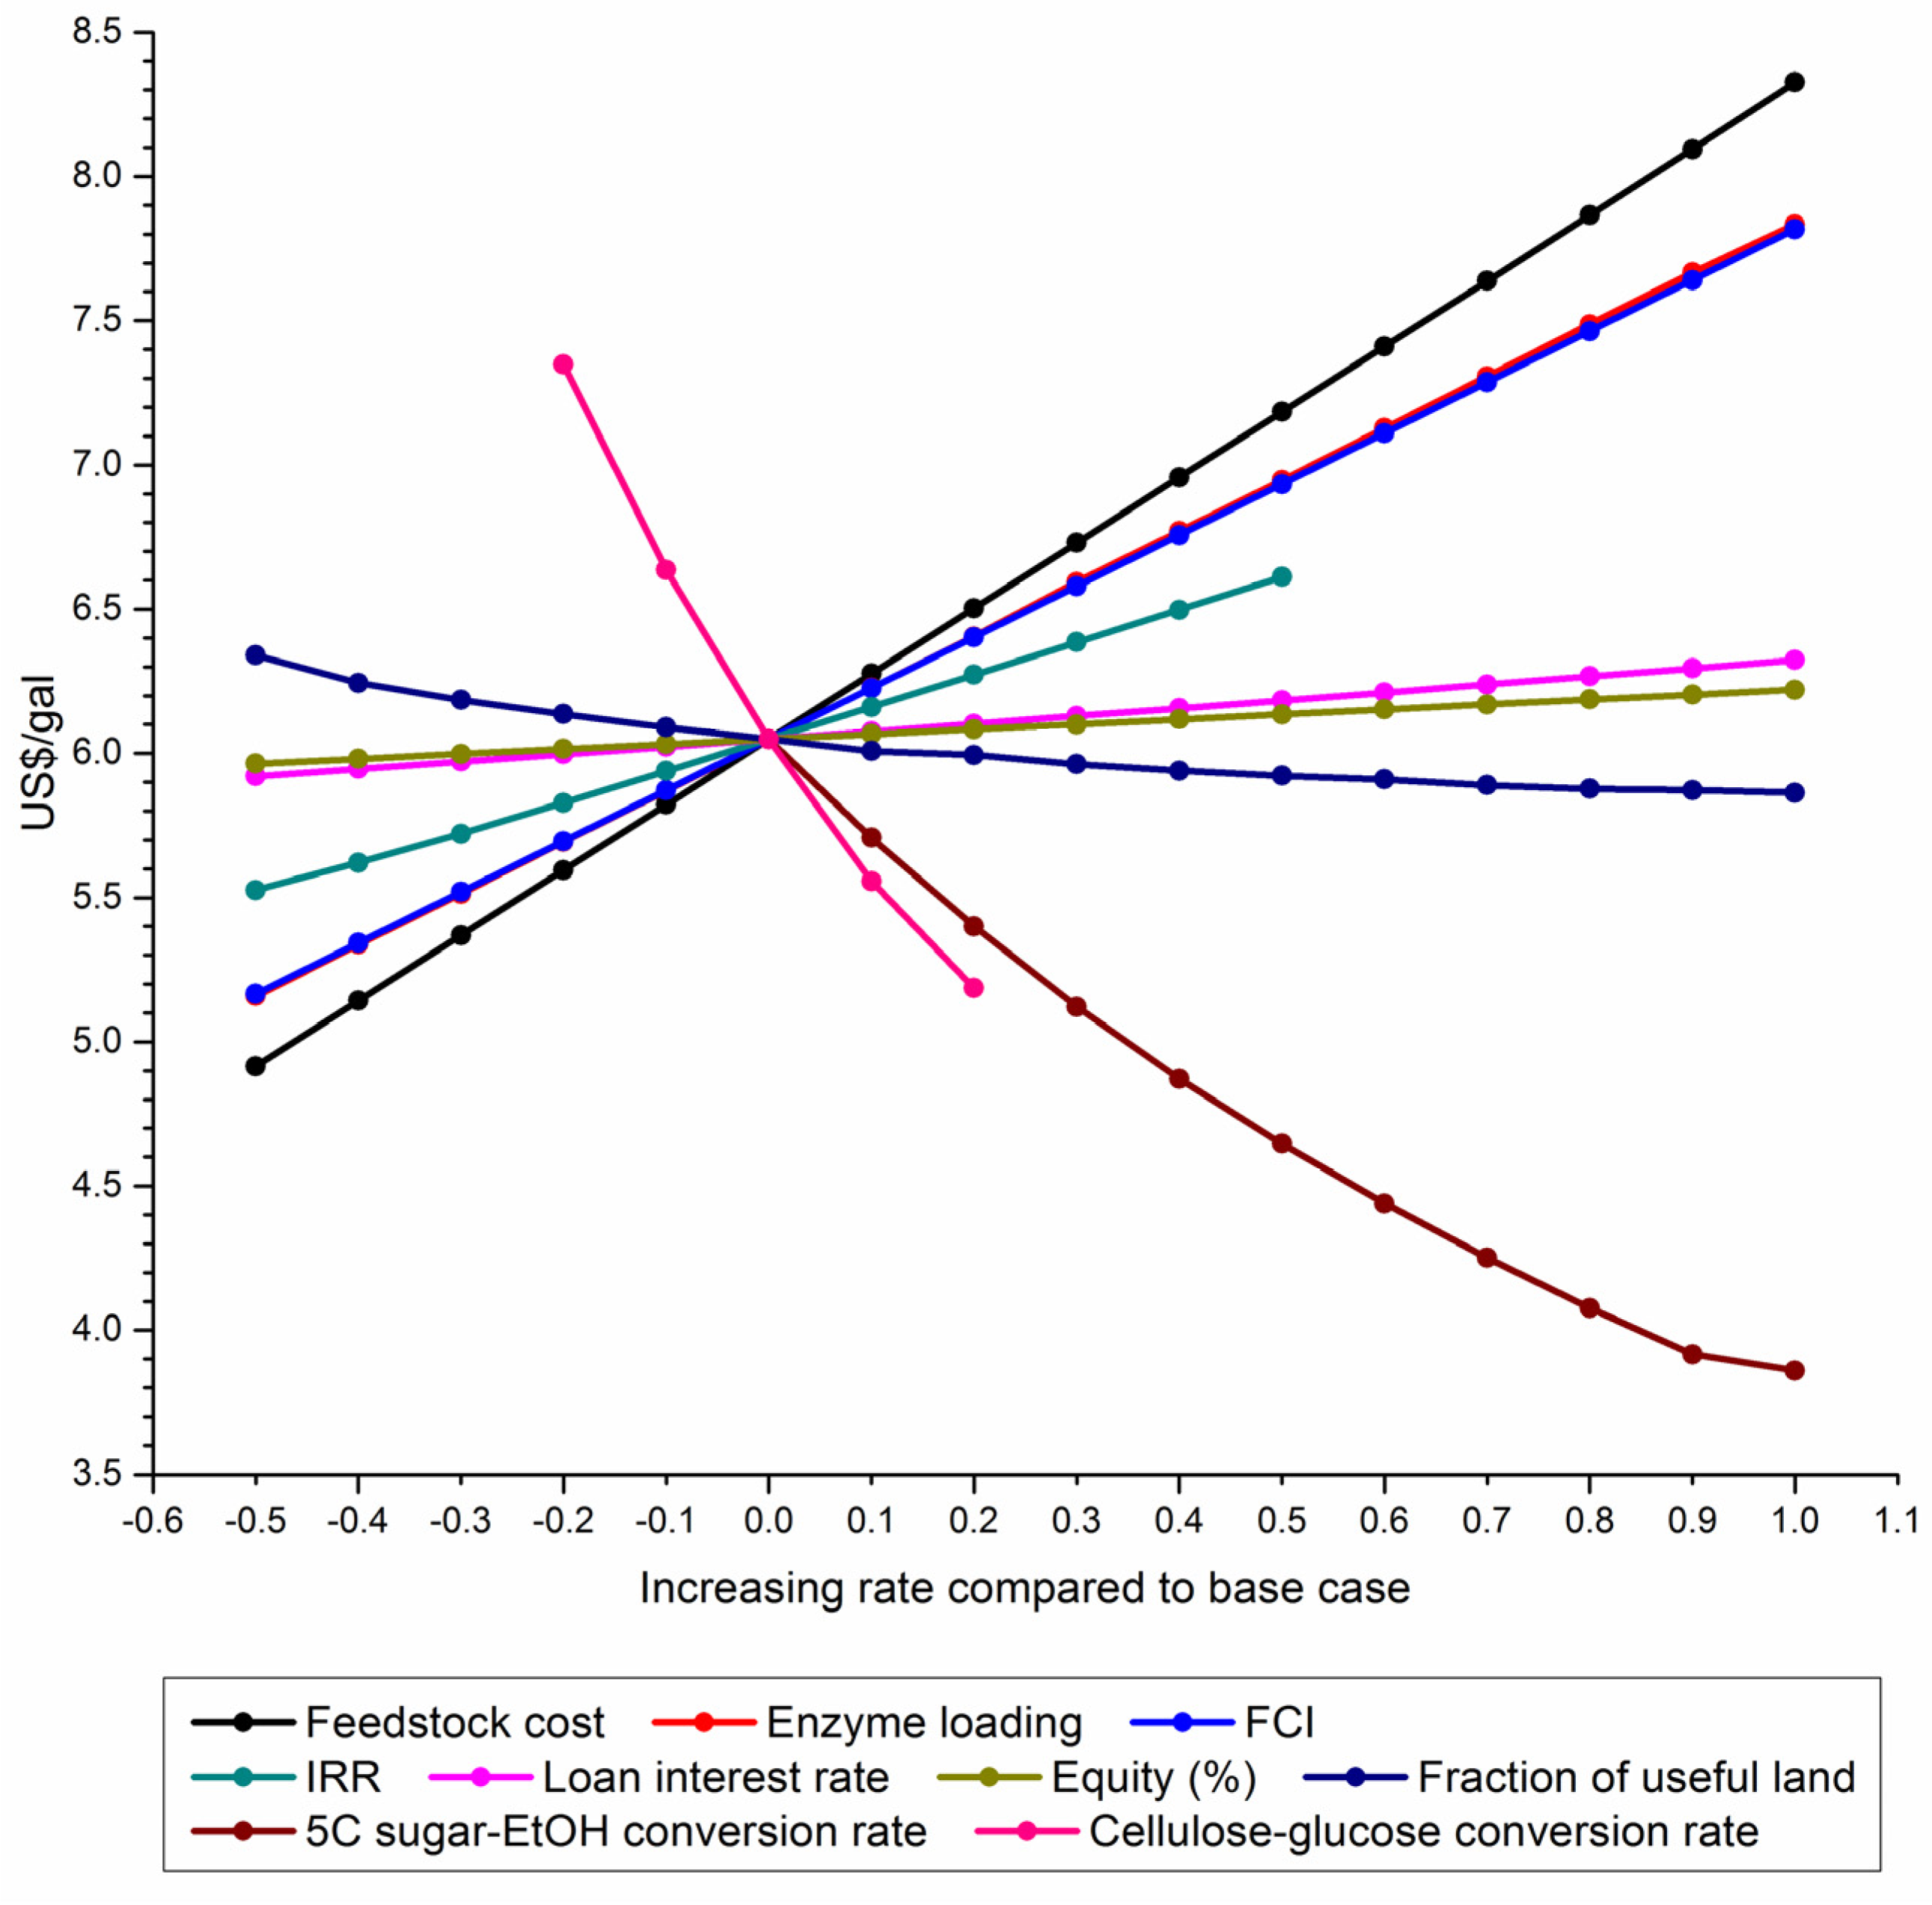
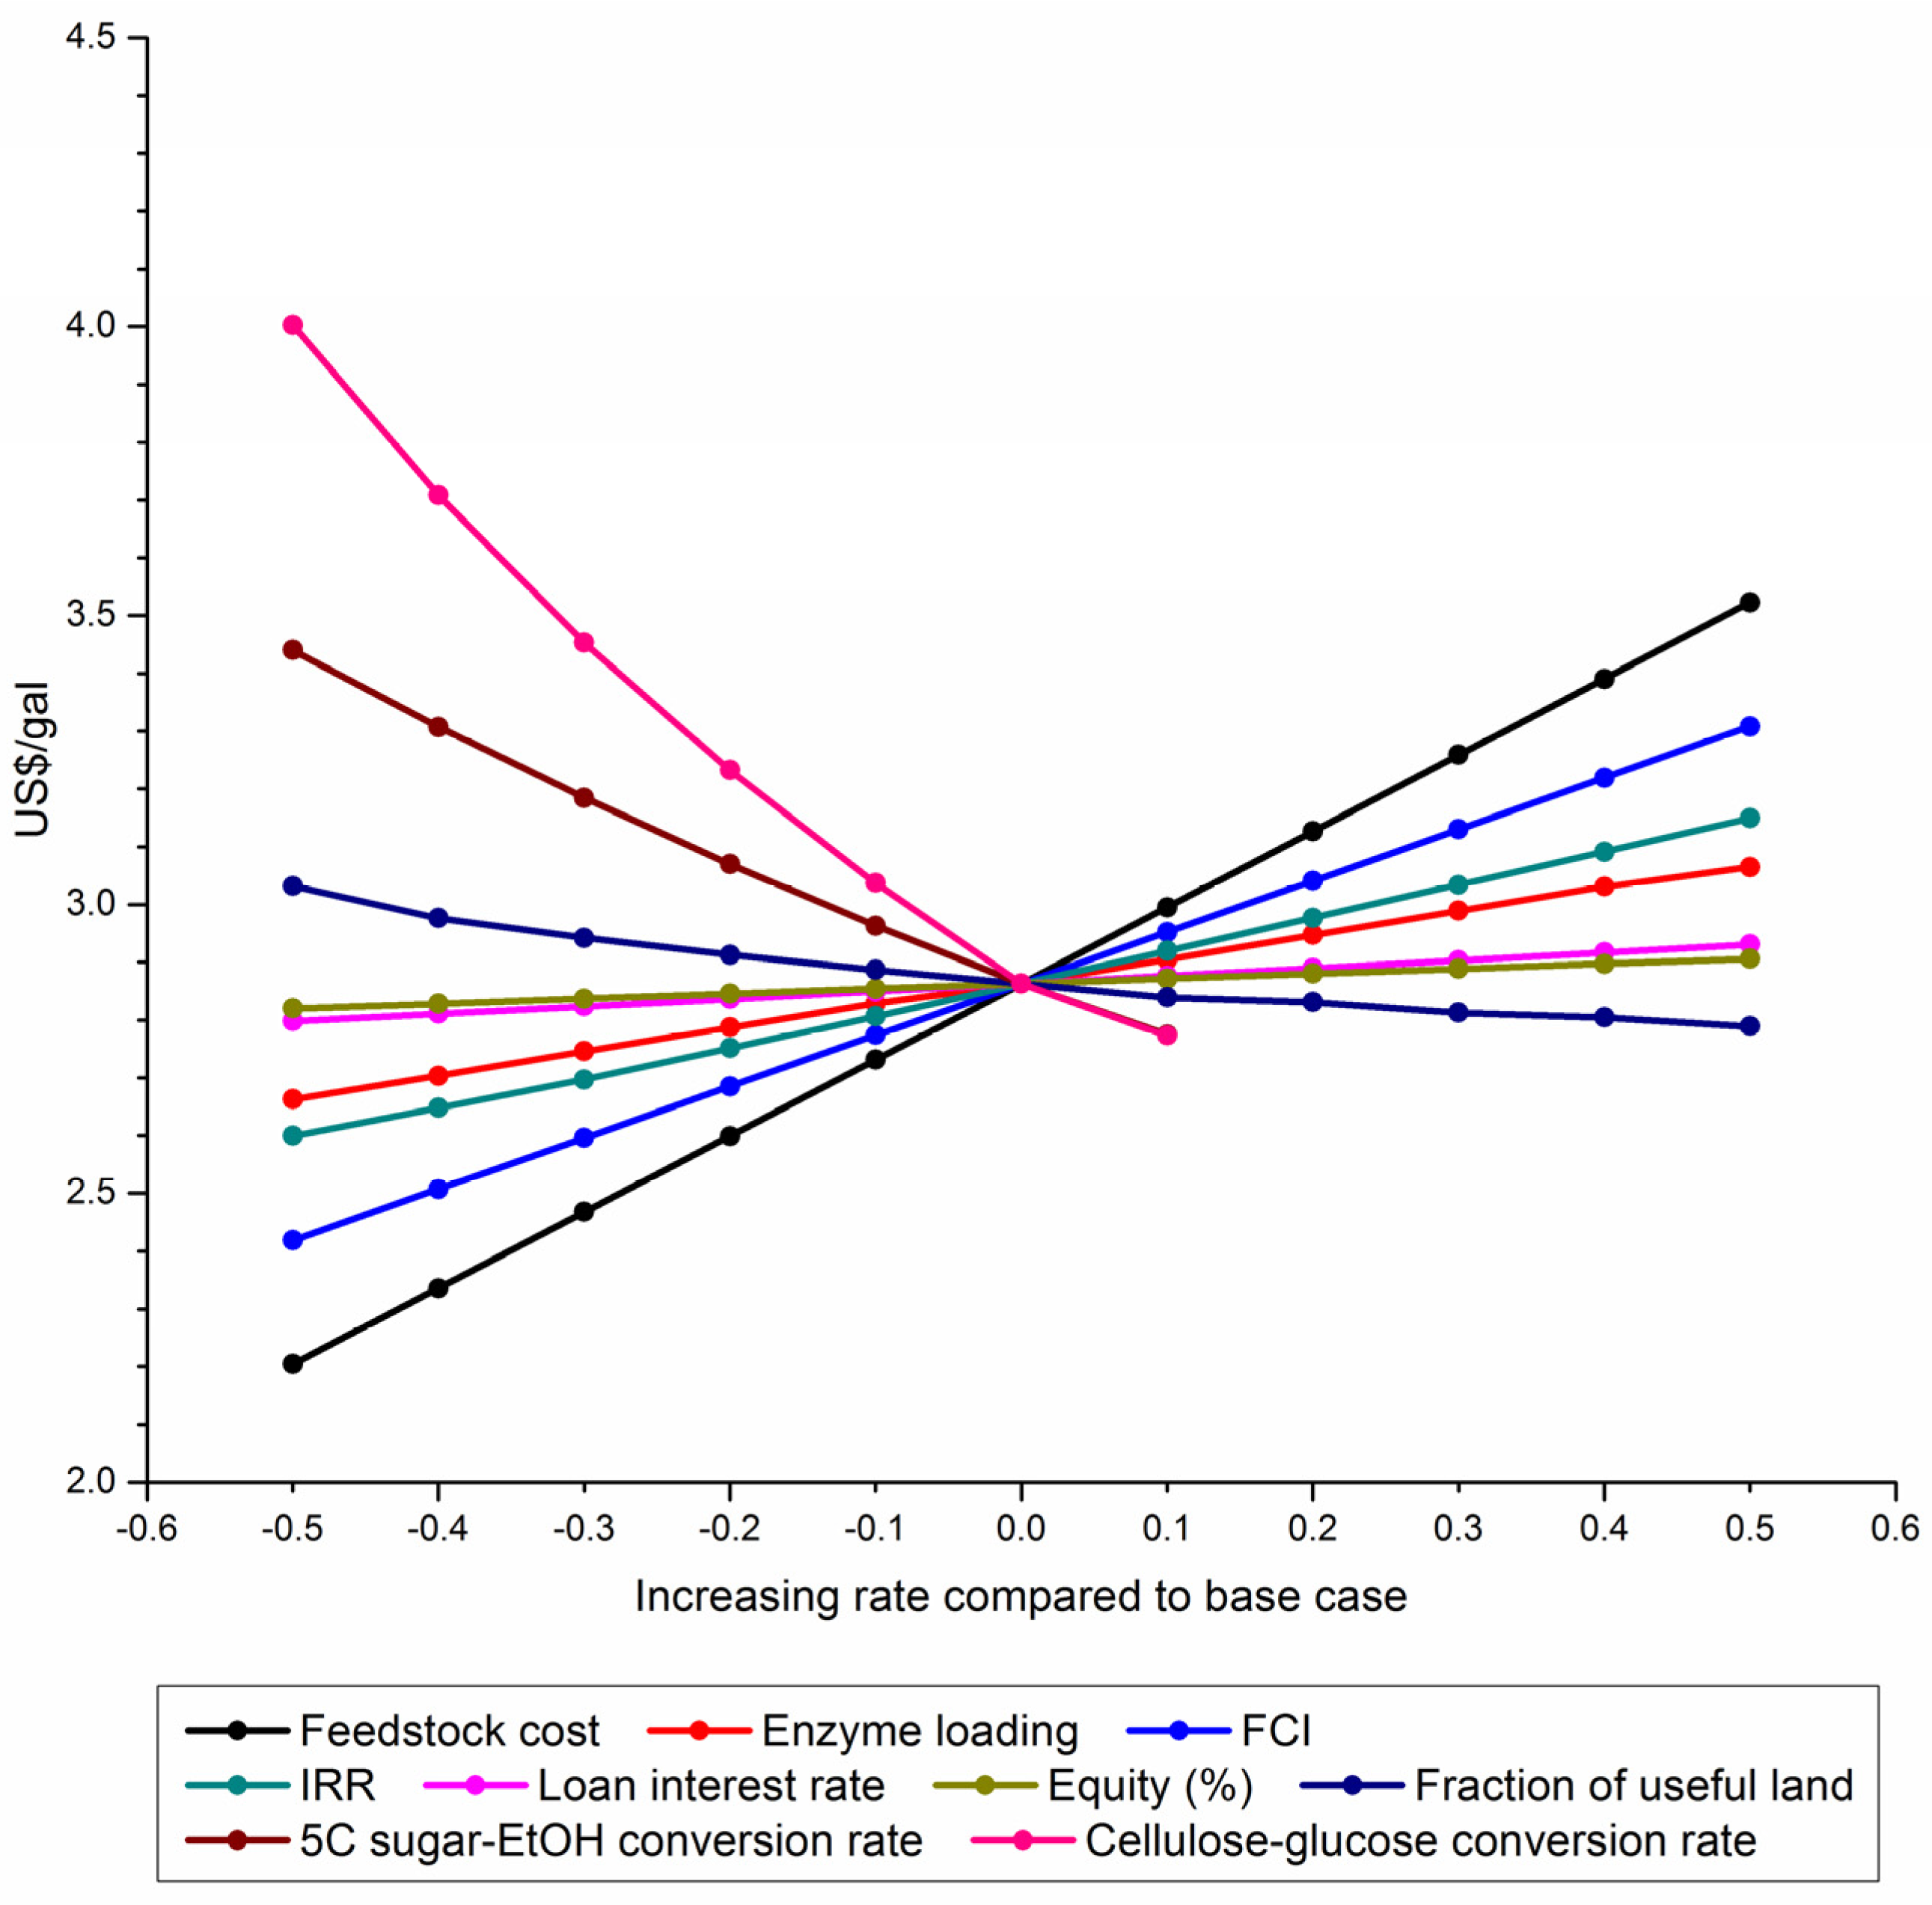
7. Sensitivity Analysis
To further identify the factors which have the most significant impact on ethanol FGP, the paper conducted a sensitivity analysis by modifying related economic data and key simulation parameters using ASPEN Plus in both Scenario CN_1 and Scenario NREL-CN_1.
Result of Sensitivity Analysis in Scenario CN_1
The results of sensitivity analyses are shown in Figure 10 and Figure 11, which indicate that in both scenarios, the following factors have great impact on ethanol PGP: (1) cellulose-glucose conversion rate, (2) five-carbon sugar-to-ethanol conversion rate, (3) feedstock cost, and (4) fixed capital investment (FCI). The following factors have some impact on the price: (1) the internal rate of return (IRR), and (2) the fraction of useful land where the feedstock is grown. Whereas, the following factors have much less impact on the price: (1) loan interest rate, and (2) equity of TCI.
Notably, the enzyme cost has quite different impacts on PGP in the two scenarios. In NREL-CN_1 the impact is much less, since enzyme production technology in that scenario is more advanced and therefore has much less potential for cost reduction.
Figure 10.
Sensitivity of bioethanol PGP to commonly concerned components in scenario CN_1. Note: The lines from top to bottom in the right side of the figure represent the following components: (1) feedstock cost; (2) enzyme loading; (3) FCI; (4) IRR; (5) loan interest rate; (6) equity (%); (7) fraction of useful land; (8) five-carbon sugar-EtOH conversion rate, and (9) cellulose-glucose conversion rate. It should be noticed that the lines for enzyme loading and FCI almost overlap each other.
Figure 11.
Sensitivity of bioethanol PGP to commonly concerned components in scenario NREL-CN_1. Note: The lines from top to bottom in the left side of the figure represent the following components: (1) cellulose-glucose conversion rate; (2) five-carbon sugar-EtOH conversion rate; (3) fraction of useful land; (4) equity (%); (5) loan interest rate; (6) enzyme loading; (7) IRR; (8) FCI, and (9) feedstock cost.
8. Conclusions and Policy Proposals
At present, bioethanol based on lignocellulosic biomass is not able to compete with fossil gasoline in China. Even in the most optimistic Scenario CN_6, the PGP of ethanol product is $1.23/gal (2500 yuan/t) higher than the wholesale price of bioethanol under current China’s pricing policy. However, if the key technical barriers are removed and technical conversion targets in NREL-CN scenarios are achieved, the development pathway is promising and has the potential to be profitable in China. The highest PGP in the scenarios constructed here is $2.86/gal (5842 yuan/t), which is much lower than current bioethanol selling price ($3.45/gal in 2013). Incentive policies and direct subsidies are thus imperative for the promotion of lignocellulosic ethanol technology. The following policy proposals are made by the authors based on the above results:
- l)
- R&D promotion: Strong support should be given to the R&D of the key technologies involved in ligocellulosic ethanol production, including technologies for five-carbon sugar ethanol conversion, and low-cost cellulase enzyme preparation, as they have a significant impact on the PGP of bioethanol.
- 2)
- Tax preference: It is suggested the consumption tax be exempted and VAT be refunded upon collection.
- 3)
- Feed-in tariff and compulsory purchase of electricity: To obtain byproduct credit, it is suggested that the excess electricity produced by the ethanol plant be purchased compulsorily by the grid under a certain feed-in tariff program.
- 4)
- Direct subsidy. Subsidy is imperative, since the plant will suffer from financial loss even in the most optimistic scenario (Scenario CN_6) under China’s technical status quo. The amount of subsidy is suggested at a minimum of $1.23/gal EtOH (2,500 yuan/t EtOH).
Acknowledgments
The study is co-supported by the National Natural Science Foundation of China (Project No.71203119, No. 71103109, and No.71373142) and the Sino-Danish Renewable Energy Development Program (RED).
Author Contributions
Lili Zhao performed the techno-economic analysis, built the Bioethanol Plant-Gate Price Assessment Model (BPAM) adapted it to China, and collected most of the data for the analysis; Shiyan Chang conceived the concept of the research and built the Feedstock Cost Estimation Model (FCEM); Xiliang Zhang helped develop the methodology of the study; Jie Xu provided key technical parameters of the technical process analyzed in the paper; Xunmin Ou and Maorong Wu also helped in methodology development. All authors contributed to the editing and reviewing of the document.
Nomenclature
| BAU | Business as usual |
| BPAM | Bioethanol Plant-Gate Price Assessment Model |
| CN | China |
| ES | Education Surcharge |
| EtOH | Ethanol |
| FCEM | Feedstock Cost Estimation Model |
| FCI | Fixed capital investment |
| FGP | Plant-gate price |
| FOC | Fixed operating cost |
| GHG | Greenhouse gas |
| IRR | Internal rate of return |
| NPV | Net present value |
| NREL | National Renewable Energy Laboratory |
| SL | Straight line |
| TCI | Total capital investment |
| TEPC | Total equipment purchasing cost |
| TPC | Total plant cost |
| UMCT | Urban Maintenance and Construction Tax |
| VAT | Value-added tax |
| VOC | Variable operation cost |
Supplementary Materials
Supplementary materials with the detailed data for calculation of TCI, variable and fixed operating costs, and feedstock cost, as well as details for discounted cash flow analysis and cost breakdown analysis can be accessed at: http://www.mdpi.com/1996-1073/8/5/4096/s1.
Conflicts of Interest
The authors declare no conflict of interest.
References
- Domestic and International Oil and Gas Industry Development Report; Institute of CNPC Economics Technology Research: Beijing, China, 2014.
- Chinese Academy of Engineering. Medium and Long Term Energy Development Strategy in China: Electricity, Oil & Gas, Nuclear and Environment; Science Press: Beijing, China, 2011; Volume 1. [Google Scholar]
- Tong, X.; Zhao, L.; Wang, R. Several thoughts on overseas oil dependence ratio in China. Res. Econ. Manag. 2008, 1, 60–65. (In Chinese) [Google Scholar]
- Ma, L.W.; Fu, F.; Li, Z.; Liu, P. Oil development in China: Current status and future trends. Energy Policy 2012, 45, 43–53. [Google Scholar] [CrossRef]
- Chang, S.; Zhao, L.; Timilsina, G.R.; Zhang, X. Biofuels development in china: Technology options and policies needed to meet the 2020 target. Energy Policy 2012, 51, 64–79. [Google Scholar] [CrossRef]
- International Energy Agency. Technology Roadmap: Biofuels for Transport; OECD/IEA: Paris, France, 2011. [Google Scholar]
- China National Renewable Energy Center. The Renewable Energy Industrial Development Report 2013; China Environmental Science Press: Beijing, China, 2014; p. 98. [Google Scholar]
- Humbird, D.; Davis, R.; Tao, L.; Kinchin, C.; Hsu, D.; Aden, A.; Schoen, P.; Lukas, J.; Olthof, B.; Worley, M.; et al. Process Design and Economics for Biochemical Conversion of Lignocellulosic Biomass to Ethanol: Dilute-Acid Pretreatment and Enzymatic Hydrolysis of Corn Stover; NREL/TP-5100-47764; National Renewable Energy Laboratory: Golden, CO, USA, 2011.
- National Development and Reform Commission. Pilot Program Extension Plan of Ethanol Alcohol Gasoline for Vehicles; National Development and Reform Commission: Beijing, China, 2004.
- National Development and Reform Commission. Detailed Rules of Implementation for the Extension of the Pilot Program of Ethanol Alcohol Gasoline for Vehicles; National Development and Reform Commission: Beijing, China, 2004.
- The Standing Committee of the National People’s Congress of China. Renewable Energy Law of the People’s Republic of China [revised]; The Standing Committee of the National People’s Congress of China: Beijing, China, 2009.
- Cavalcanti, M.; Szklo, A.; Machado, G.; Arouca, M. Taxation of automobile fuels in Brazil: Does ethanol need tax incentives to be competitive and if so, to what extent can they be justified by the balance of ghg emissions? Renew. Energy 2012, 37, 9–18. [Google Scholar] [CrossRef]
- Martines-Filho, J.; Burnquist, H.L.; Vian, C.E.F. Bioenergy and the rise of sugarcane-based ethanol in brazil. Choices 2006, 21, 94. [Google Scholar]
- NREL. Process Design for Biochemical Conversion of Biomass to Ethanol (dw1111a); U.S. National Renewable Energy Laboratory (NREL): Golden, CO, USA, 2012.
- Yang, J.; Jiang, P. Overview of Chemical Engineering Design; China Petrochemical Press: Beijing, China, 2005. [Google Scholar]
- Overend, R.P. The average haul distance and transportation work factors for biomass delivered to a central plant. Biomass 1982, 2, 75–79. [Google Scholar] [CrossRef]
- Nguyen, M.H.; Prince, R.G.H. A simple rule for bioenergy conversion plant size optimisation: Bioethanol from sugar cane and sweet sorghum. Biomass Bioenergy 1996, 10, 361–365. [Google Scholar] [CrossRef]
- Pang, F. Study on Combination of Steam Explosion and Microwave Irradiation Pretreatment of Corn Stover. Ph.D. Thesis, Tianjin University, Tianjin, China, 2012. [Google Scholar]
- Song, J. Studies on Synergism of Cellulase, Esterase, and Xylanase on Corn Stalk. Master Thesis, Xinjiang Agricultural Univeristy, Urumqi, Xinjiang, China, 2011. [Google Scholar]
- Chen, X. Production Study of L-lactic Acid by Immobilized Rhizopus Oryzae from Corn Stalk hydrolyzate. Ph.D. Thesis, Chongqing University, Chongqing, China, 2012. [Google Scholar]
- Zhang, Q.; Ji, W.; Wang, Y. Research progress of strains using pentoses and hexoses in ethanol production. Chem. Ind. Eng. Prog. 2013, 32, 151–155. [Google Scholar]
- Li, X. Parameter & Data 2011—Sinopec Project Feasibility Study Technical Economy; SINOPEC Economic Research Institute: Beijing, China, 2011; pp. 1–97. [Google Scholar]
- Yin, Q.; Feng, R. Tax System of China, 1st ed.; Tsinghua University Press: Beijing, China, 2011. [Google Scholar]
- Ministry of Finance. Detailed Rules for the Implementation of the Provisional Regulation of the People’s Republic of China on Value-Added Tax; Ministry of Finance: Beijing, China, 1993.
- Ministry of Finance. Detailed Rule for the Implementation of the Provisional Regulation of the People’s Republic of China on Consumption Tax; Ministry of Finance: Beijing, China, 1993.
- Yuan, Z.; Xu, J. Analysis of Technology Development of China Biofuels; Guangzhou Institute of Energy Conversion: Beijing, China, 2014; p. 41. [Google Scholar]
- Huang, J.; Qiu, H. Studies on the Socioeconomic Impact and Strategies of Bioethanol Development in China; Science Press: Beijing, China, 2010. (In Chinese) [Google Scholar]
- Zhaopin.com. Laborors’ salary at the fuel ethanol station. Available online: http://jobs.zhaopin.com/153493313250062.htm?ssidkey=y&ss=201&ff=03 (accessed on 20 December 2013).
- Zhaopin.com. Salary of truck drivers. Available online: http://jobs.zhaopin.com/137940357251296.htm?ssidkey=y&ss=201&ff=03 (accessed on 20 December 2013).
- Zhaopin.com. Salary of liquid tank truck drivers. 2013. Available online: http://jobs.zhaopin.com/137940357251296.htm?ssidkey=y&ss=201&ff=03 (accessed on 20 December 2013).
- Zhao, D. Report on 3E Models and LCA for a Power Generation System from Selected Agriculture and Forestry Biomass. China Renewable Energy Scale-up Program; Guangzhou Institute of Energy Conversion: Guangzhou, China, 2008. [Google Scholar]
- Ou, X.; Zhang, X.; Chang, S.; Guo, Q. Energy consumption and GHG emissions of six biofuel pathways by lca in (the) people’s republic of china. Appl. Energy 2009, 86, S197–S208. [Google Scholar] [CrossRef]
- China Machinery Industry Information & Publication. Machinery and Electronic Products Quotation Manual; China Machinery Industry Press: Beijing, China, 2012. [Google Scholar]
- Wang, W.; Zhong, S. China Statistical Abstract 2013; China Statistics Press: Beijing, China, 2013.
- Ministry of Land and Resources of China. The State Criterion on Minimum Assignment Price of Land for Industry Use; Ministry of Land and Resources of China: Beijing, China, 2006.
- Zheng, S. Techno-economic analysis of cellulosic ethanol fuel. Master Thesis, Beijing Univeristy of Chemical Technology, Beijing, China, 2011. [Google Scholar]
- 2012 report of COFCO biochemical (Anhui) Co., Ltd. Avaliable online: http://www.cninfo.com.cn/finalpage/2013-06-22/62602877.PDF (accessed on 20 December 2013).
- Salary of maintenance supervisor. Avaliable online: http://jobs.zhaopin.com/458619017250110.htm?ssidkey=y&ss=201&ff=03 (accessed on 20 December 2013).
- Salary of maintenance technician. Avaliable online: http://jobs.zhaopin.com/594358227250060.htm?ssidkey=y&ss=201&ff=03 (accessed on 20 December 2013).
- International Energy Agency. World Energy Outlook 2013; International Energy Agency: Paris, France, 2013. [Google Scholar]
- Slary of lab technician. Avaliable online: http://jobs.zhaopin.com/472283822250024.htm?ssidkey=y&ss=201&ff=03 (accessed on 20 December 2013).
- Slary of shift supervisors. Avaliable online: http://jobs.zhaopin.com/310456719250185.htm?ssidkey=y&ss=201&ff=03 (accessed on 20 December 2013).
- Slary of shift operators. Avaliable online: http://jobs.zhaopin.com/148064466250263.htm?ssidkey=y&ss=201&ff=03 (accessed on 20 December 2013).
- Slary of sales manager. Avaliable online: http://jobs.zhaopin.com/532761829250019.htm?ssidkey=y&ss=201&ff=03 (accessed on 20 December 2013).
- Slary of salesman. Avaliable online: http://search.51job.com/job/52857570,c.html (accessed on 20 December 2013).
- Slary of clerks & secretaries. Avaliable online: http://jobs.zhaopin.com/47776791090250794000.htm?ssidkey=y&ss=201&ff=03 (accessed on 20 December 2013).
- South China Institute of Environmental Sciences, Ministry of Environmental Protection of China. Environmental Impact Report on the Cassava-Based Fuel Ethanol Project with a Capacity of 300,000 t/y(phase i ) of Guangdong Can Alcohol co; South China Institute of Environmental Sciences, Ministry of Environmental Protection of China: Guangzhou, Beijing, 2010. [Google Scholar]
- Sandong Industrial Research and Design Institute. Feasibility Study Report on Industrial Lignocellulosic Waste-Based Fuel Ethanol Project Using Enzymatick Hydrolysis Technology; Sandong Industrial Research and Design Institute: Zibo, China, 2011. [Google Scholar]
- Donghai County Shuntai alcohol Factory Co., Ltd. Proposal Report on the Fuel Ethanol Project with Capacity of 300,000 t in Donghai, Jiangsu province, China; Donghai County Shuntai alcohol Factory Co., Ltd.: Donghai, China, 2006. [Google Scholar]
- Fu, Z. Project for the Project on 0.1 Million Ton Annual Output of Ethanol; Sichuan University: Chengdu, China, 2007. [Google Scholar]
© 2015 by the authors; licensee MDPI, Basel, Switzerland. This article is an open access article distributed under the terms and conditions of the Creative Commons Attribution license (http://creativecommons.org/licenses/by/4.0/).