Article

Integrated Power Management of Conventional Units and Industrial Loads in China’s Ancillary Services Scheduling

1
School of Electrical Engineering, Beijing Jiaotong University, Beijing 100044, China
2
State Grid Energy Research Institute, Beijing 102209, China
3
Energy and Resources Group, University of California, Berkeley, CA 94701, USA
*
Author to whom correspondence should be addressed.
These authors contributed equally to this work.
Energies 2015, 8(5), 3955-3977; https://doi.org/10.3390/en8053955
Submission received: 15 February 2015 / Revised: 28 April 2015 / Accepted: 28 April 2015 / Published: 6 May 2015
(This article belongs to the Special Issue Energy Conservation in Infrastructures)

Abstract

:
With the development of the smart grid in China, new opportunities for responsive industrial loads to participate in the provision of ancillary services (AS) will become accessible. This paper summarizes AS in China and analyzes the necessary characteristics and advantages of industrial users to provide AS according to their response mechanism. Cement manufacturing and aluminum smelter processes are selected as two representatives of responsive industrial loads. An agent-based model that includes generation, industrial user, and grid agents is proposed. Using two case studies, we analyze the integrated power management of conventional units and industrial loads in day-ahead and real-time AS scheduling based on real device parameters, price mechanisms and production data. The simulation results indicate that the participation of responsive industrial loads in the provision of AS, in China, can improve the coal consumption rate and the system-wide load factor as well as reduce the total system cost for the provision of AS significantly.

1. Introduction

In China, the industrial sector is the largest consumer of electricity, accounting for approximately 72% of the total electricity consumption [1]. In recent years, in line with efforts to reduce the need for generation and transmission, and in order to reach their ambitious fossil fuel consumption reduction targets, the Chinese government has promoted energy efficiency improvements in energy-intensive industries [2]. A summary of energy consumption and intensity data from several Chinese energy-intensive industries in 2013 is shown in Table 1. Although the energy intensity of the presented industrial products is approaching that of developed countries, the marginal benefits of further energy saving efforts might be limited. For this reason, in addition to increasing efficiency, managing load in energy intensive industries is a key focus for the long-term, low-carbon development of the future electric grid.
Table 1. Energy intensity of major energy-intensive products in China (2013) [2].
Industrial ProductsElectricity Consumption (Billion kWh)Electricity Consumption Intensity (kWh/t) aEnergy Consumption Intensity (kgce/t) b
ChinaDeveloped Countries c
Steel362.2465662610
Aluminum smelter303.113,74013,74012,900
Cement210.287125118
Ammonia59.510351532990
Calcium carbide76.5342334233000
Caustic soda66.52326972910
a Electricity consumption intensity represents the power that the production of a ton of product consumes; b Energy consumption intensity represents the energy that the production per ton product consumes, which is converted to coal equivalent. But we choose electricity consumption intensity as the comparison data in aluminum smelter and calcium carbide industry due to the high proportion of electricity in their total energy consumption (in kWh/t); c We choose the average of the energy intensity for each industrial product across developed countries to represent the developed country standard in every industry. The only exception is in the cement industry, as we chose Japan to represent such standard.
AS are required for reliable power system operations. With existing dispatching practices and grid infrastructure, different kinds of AS are mostly provided by coal-fired units in China. These units typically have slow response speeds and restricted ramp rates, and result in increasing pressure for energy conservation and emission reduction [3,4]. With the gradual development and implementation of smart grid infrastructure around the world, load flexibility has sparked research on the role that loads could play in the operation of an increasingly smarter power system [5]. In recent years, public attention on demand response (DR) in the U.S. and Europe has been mainly focused on the commercial and residential sector due to the sectors’ high proportion of electricity consumption in their systems. Hao et al. [6] indicated that HVAC in existing commercial buildings in the U.S. could provide about 70% of the current national regulation reserve requirements in a specified frequency band. Nistor et al. [7] investigated the capability of dish washers and washing and drying machines equipped with communication modules, to act as operating reserves for the system operator. Keep et al. [8] performed similar work with using responsive refrigeration loads. Zakariazadeh et al. [9] presented a method for the integrated operational planning of a distribution system, electric vehicles were considered as responsive loads that could participate in AS programs by providing reserve to the system. Given the contribution from the residential and commercial sectors to the total electricity consumption in those systems, the papers aforementioned show potential for managing residential and commercial loads in the provision of AS. Although the contribution to the total electricity consumption from these sectors in China is growing, in the near term, industrial loads will continue to dominate the panorama. For this reason, research on the role and potential of industrial loads in the provision of AS is particularly important in China.
Traditional ideas hold that industrial loads should focus on maintaining a flat curve due to the pressure of maintaining economic production [10]. Nevertheless, sparked interest on industrial load flexibility has occurred due to the growing share of electricity generation from renewable energy resources, which results in huge demands for AS capacities. Paulus and Borggrefe [11] briefly estimated the technical and economic potential of energy-intensive industries to provide demand side management in German electricity and balance markets through 2030, including chloralkali processes, mechanical wood pulp production, aluminum electrolysis, electric arc furnaces, and cement mills. Olsen et al. [12] examined the characteristics of cement plants and their ability to shed or shift load to participate in DR. Swanepoel et al. [13] developed a computerized operations system that integrated all the components of the cement plant, and noticed that energy and emission reductions would be possible by changing the load profile of cement production plants. Todd et al. [14] investigated the available opportunities of one aluminum smelter facility in the AS market, and discussed the possibilities and capabilities of aluminum smelters to provide reliability services. Jiang et al. [15] designed a demand side frequency control scheme in an isolated wind power system, and evaluated the potential of aluminum smelting loads to participate in frequency regulation. Alcazar-Ortega et al. [16] analyzed the flexibility potential of customers in one meat industry based on the management of the most energy consuming process in this type of segment: cooling production and distribution, which is one of the most representative sectors in Spain.
However, previous analyses are mainly limited in that they are mainly case studies for a single industrial plant or sector and few researchers have considered models where multiple industrial users, together with conventional generators, aim at the provision of optimal AS scheduling. Furthermore, AS classifications and standards in different countries and regions are quite different due to different development levels, power system structures, pricing mechanisms and so on. Even in different regions of the same country, AS classifications and standards can vary. In addition, all power management methods in China’s AS scheduling only considered the participation of generators and neglected the flexibility of responsive loads. In this paper, based on the analysis of industrial users for AS according to their response mechanism, we propose an agent-based model to simulate the integrated power management of conventional generation and industrial loads in the existing Chinese AS mechanism, and verifies the capability of industrial loads to participate in the provision of AS scheduling.
The paper is organized as follows. In Section 2, a brief summary of the framework and implementation rules for AS in China is presented. In Section 3, the response mechanism of cement producers and aluminum smelters is established in consideration of their own production characteristics and requirements. Section 4 presents an agent-based model and defines assumptions and settings of the simulations. Section 5 discusses simulation results, followed by conclusions in Section 6.

2. Overview of Ancillary Service in China

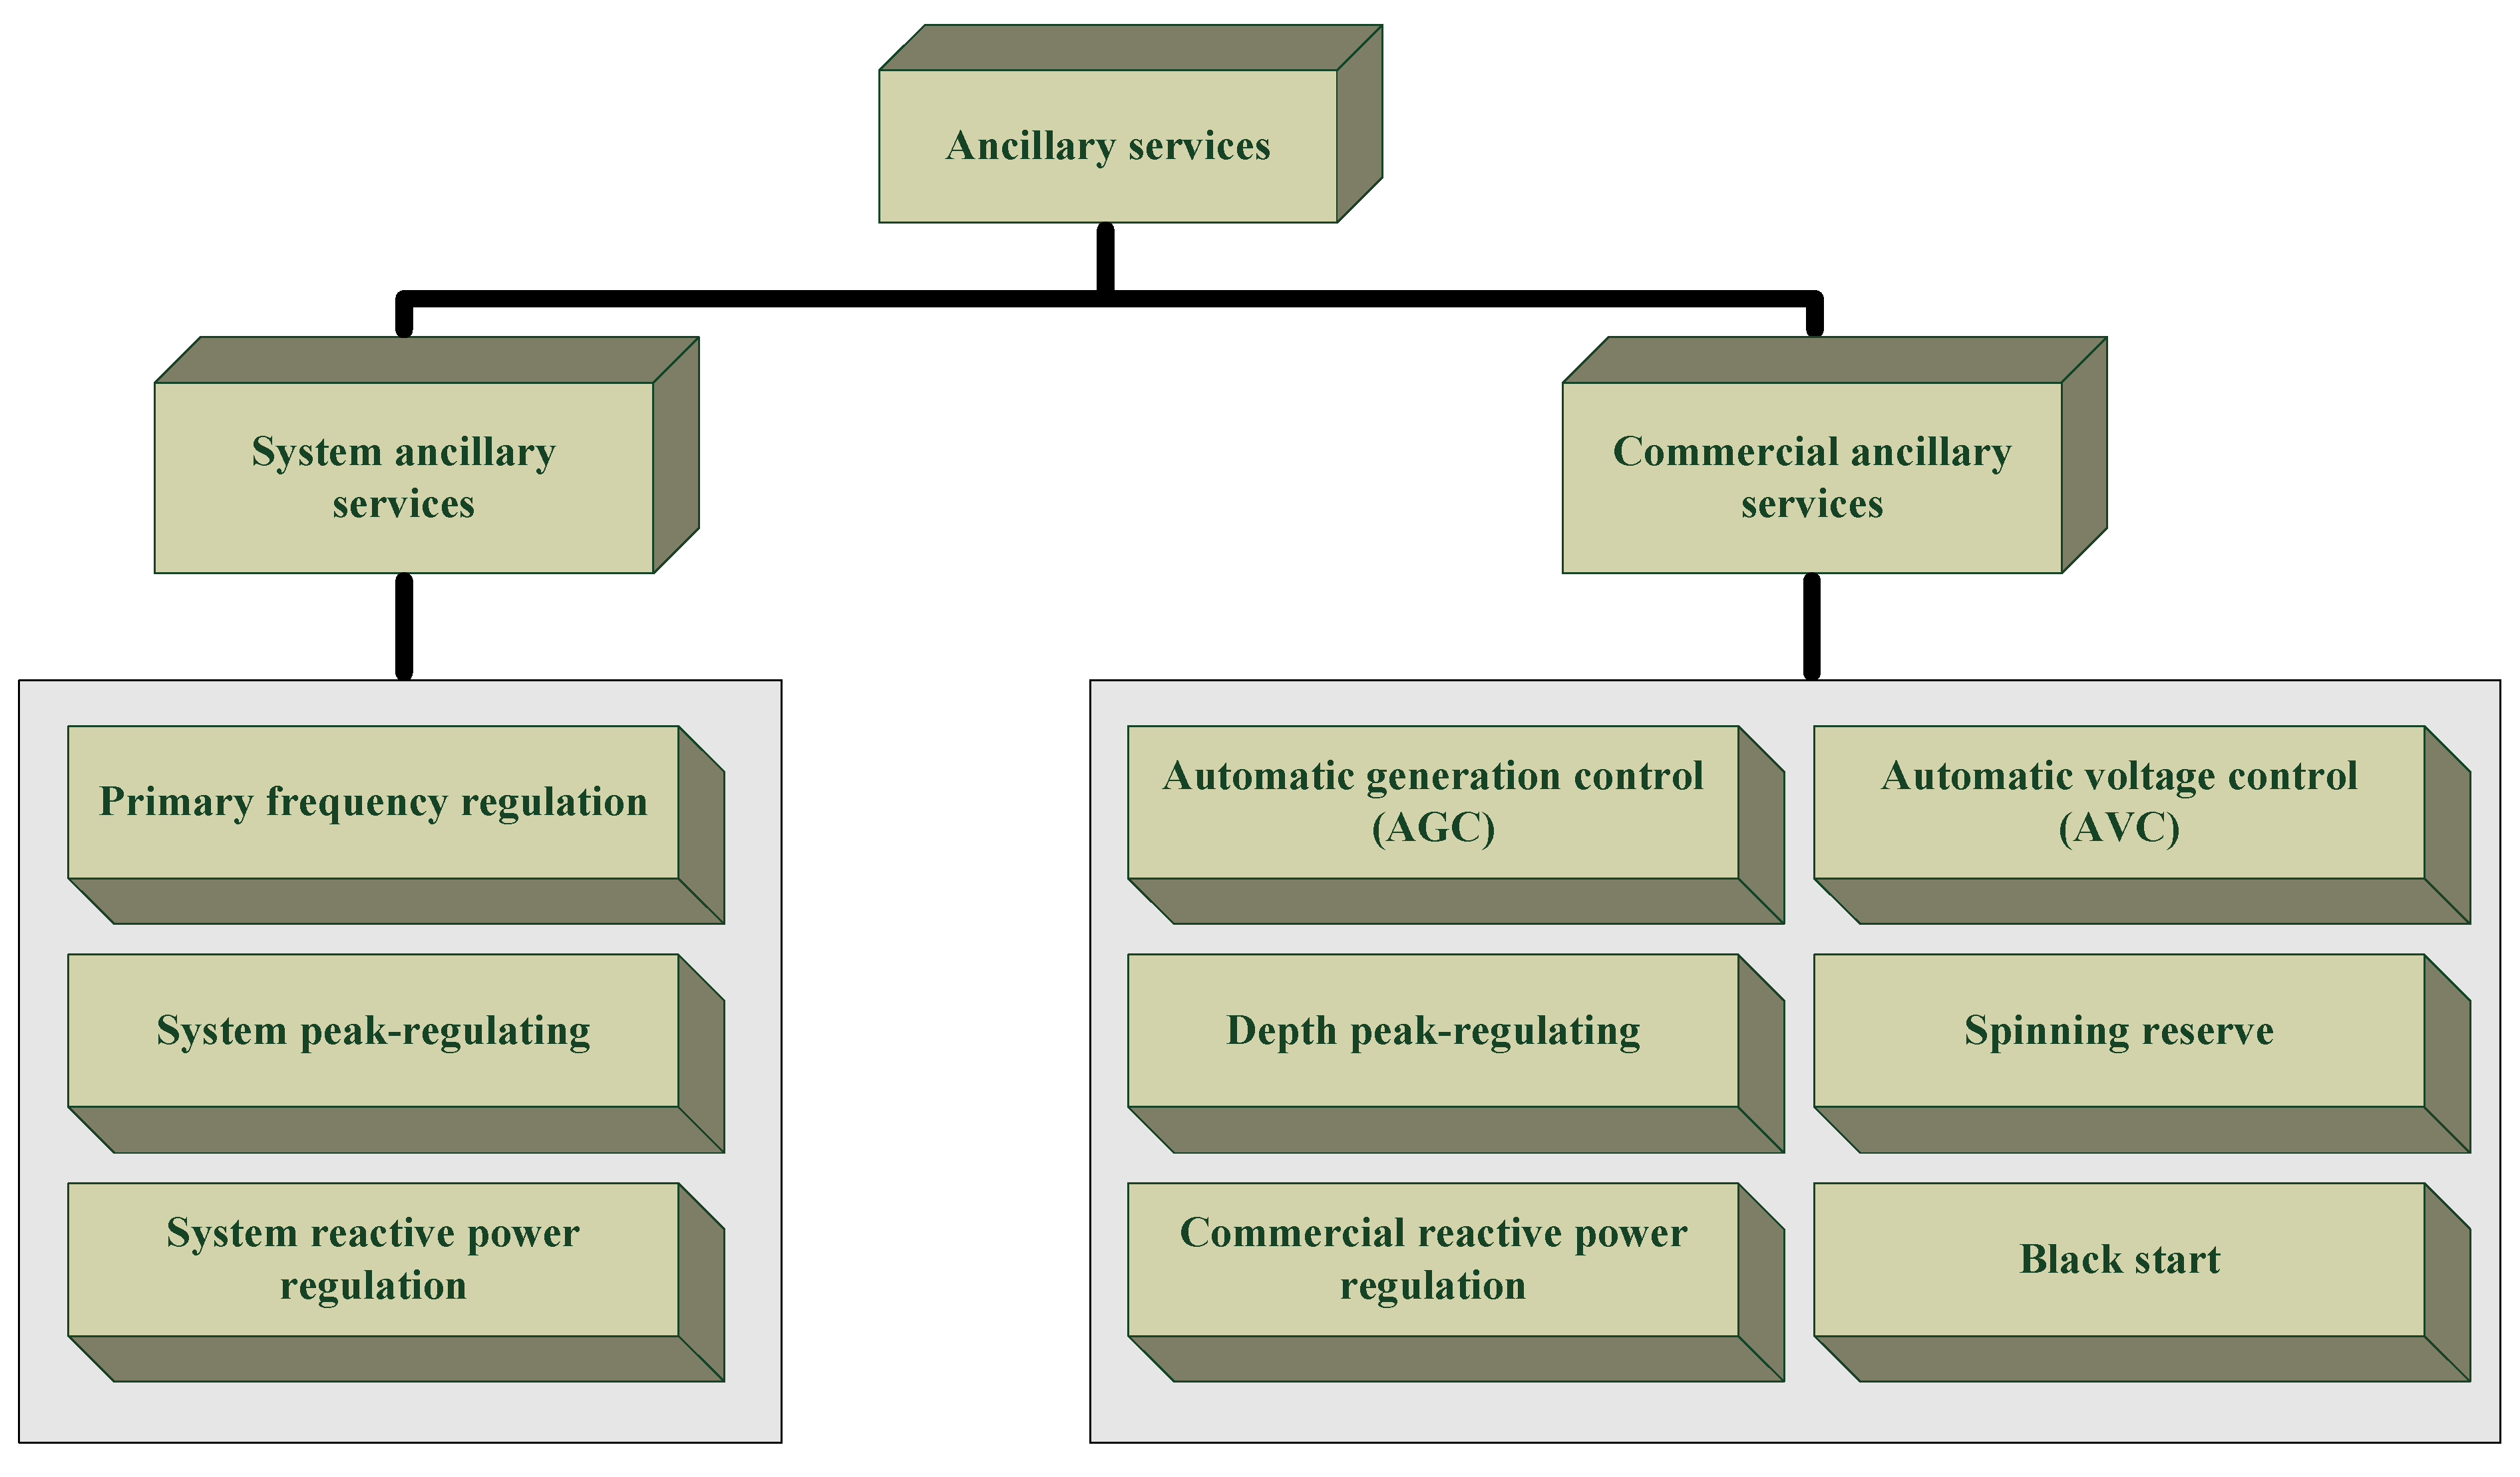
In order to guide the development for the provision of AS, in 2006, the Chinese government promulgated the “Interim Measures for AS Management of Grid-connected Power Plant” (“Interim Measures” for short), which defined the groups of AS that fitted with the Chinese electricity development reality [17]. The framework for the provision of AS is shown in Figure 1. Although AS include system and commercial services and each of the type can be further subdivided into active and reactive power applications, considering the limitation of demand side resources, this paper focuses only on active power AS and covers the following:
  • Regulation service: Also called automatic generation control (AGC). Requires generators to provide continuous response to power system operator commands for minute-to-minute up and down fluctuations.
  • Peak-regulating service: Can be divided into system peak-regulating and commercial peak-regulating services. System peak-regulating services are provided by generators that track the load change between low demand and peak hours. Currently, this service is free in China, despite the revenue risk for power plants. Commercial peak-regulating services require generators to participate in shifting peak load or load fluctuation that makes them exceed the range of system peak regulating. It might require start-up/shut-down events within a fixed time. Commercial peak-regulating services need compensation from the dispatching regulator on account of the decreased efficiency of participating units.
  • Reserve service: Requires generators to reserve generating capacity in case of unplanned load increases or decreases. Reserve services can be divided into spinning and non-spinning reserve services. The Chinese government regulations stipulate that the compensation is due only to spinning reserves.
Figure 1. AS framework in China.
Energies 08 03955 g001
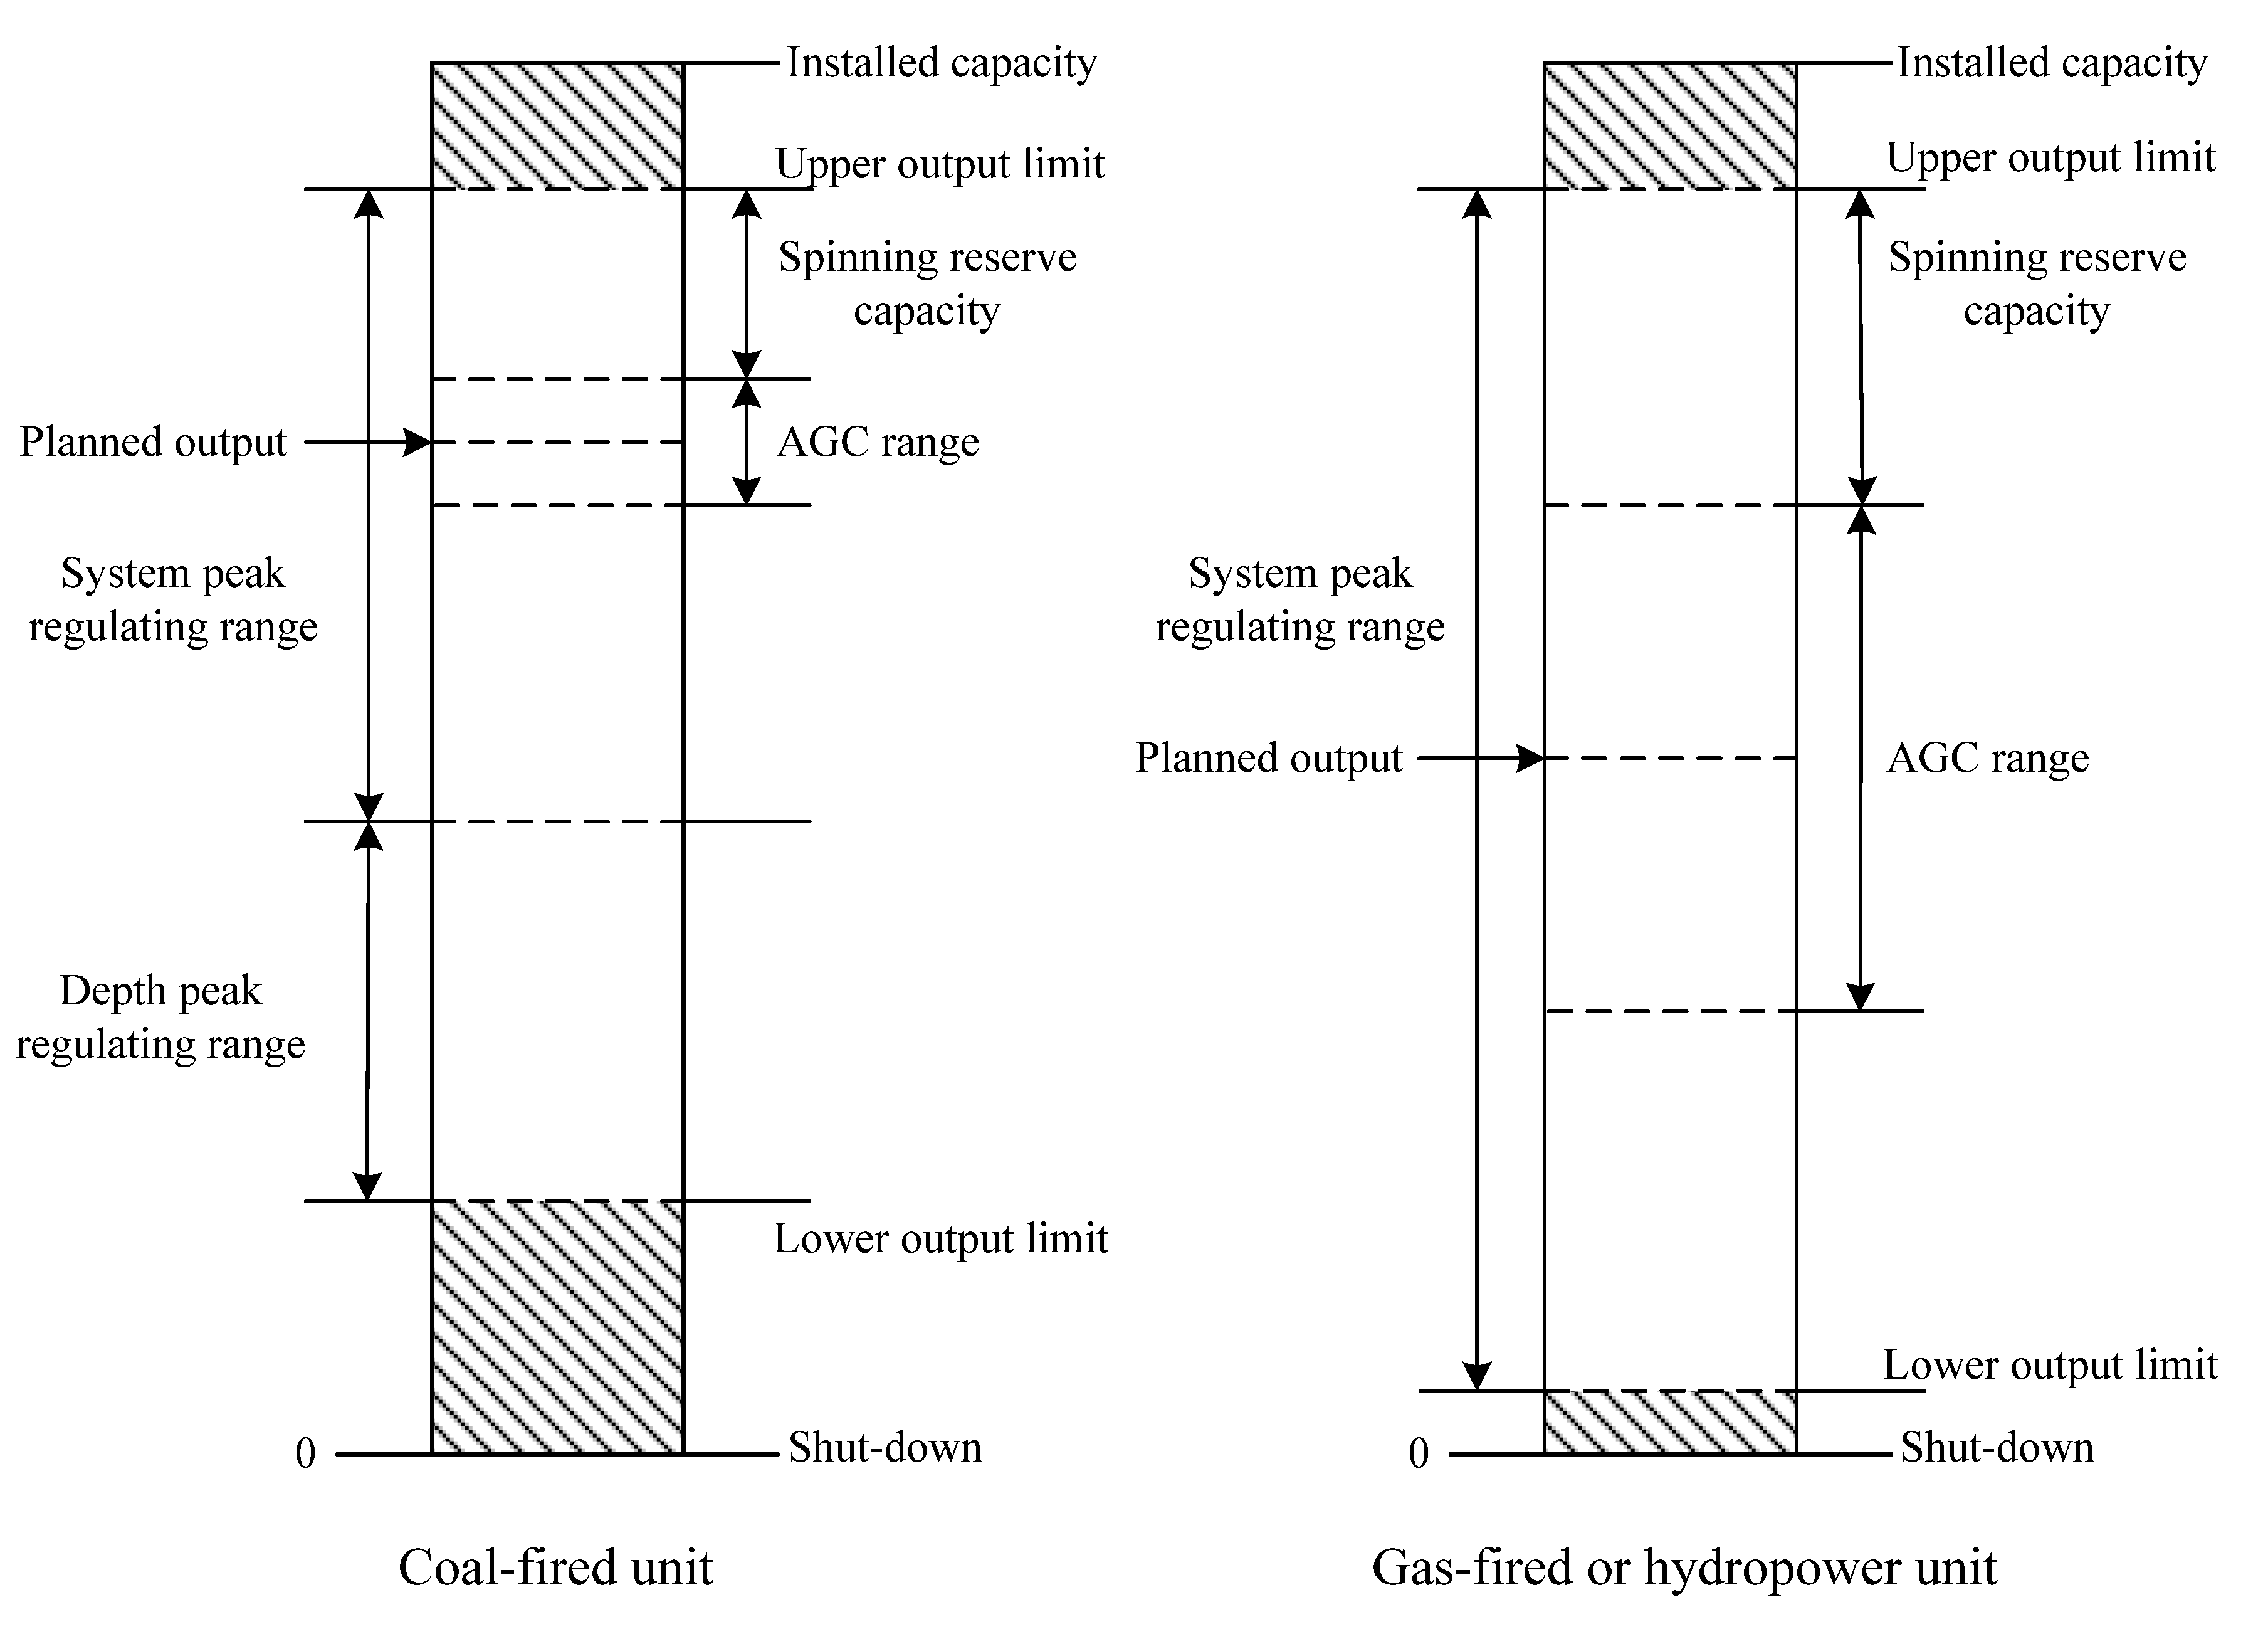
The capacity allocation of different types of units in China can be shown in Figure 2. It is obvious that revenues from providing AS for coal-fired units come from three services: AGC, commercial peak-regulating and spinning reserve services. The revenue from commercial peak-regulating service also contains depth peak-regulating and start-up/shut-down compensations. Gas-fired and hydropower units are required to provide peak-regulating services in China because of their rapid ramp rate, and therefore they only obtain revenues from provision of AGC and spinning reserve services. Although a power system with higher share of gas-fired and hydropower units will have more flexibility, there are considerable gaps between the total installed capacity of these two types of units and that of coal-fired units in China. Therefore, coal-fired units are the primary provider of AS in China, which will result in significant ramp up/down costs and extra carbon emissions. Some units may also operate in uneconomic fashion, for example when the output of wind power unit unexpectedly fails [18]. For this reason, in this paper, our model’s generation units are considered to be exclusively coal-fired power plants.
Figure 2. The capacity allocation of different types of units.
Energies 08 03955 g002
Based on the Interim Measures, the Chinese regional electric power regulators issued implementation guidelines separately, and different parameters and standards were set due to various power mixes at the different regional levels. These parameters and standards will be discussed in detail in Section 4. Existing guidelines only considered the participation of generators and neglected the flexibility of responsive loads. The smart grid allows the real-time communication between supply and demand side based on modern information and communication technologies, as well as improved sensors and controls. It enables DR to participate as a resource with considerable potential apart from thermal generation. Technically, DR can be as effective as generation response for restoring the generation/load imbalances at the center of most power system reliability concerns [19].

3. Industrial Loads Response

3.1. Response Mechanism of Energy-Intensive Industries

Industrial loads, especially for the production of steel, nonferrous metals, building materials, and other energy-intensive processes in China, have a much larger consumption footprint and peak load contribution but are also ahead of other loads in their implementation of smart grid technologies in some aspects [20]. Affected by the impact of industrial structure adjustment policy, the profitability of energy-intensive industries has been put into question in recent years. In addition, due to the reduction in production pressures, these policies have also freed some additional response potential.
Small industrial users, such as food processing factories, have a typical daily load pattern with a morning ramp-up, double peak and evening ramp down as shown in Figure 3 [21,22]. Like food processing factories, other industrial users have frequent load swings. However, energy-intensive industrial users, having three (8-h) daily shifts, generally operate at 80 percent or greater load factor with little or no perturbation on the electric system. This is very unlike other industrial users where load swings are frequent. Therefore, when exploring the potential of energy-intensive industries to provide AS, it is important to understand their response mechanism. This paper considers two typical types of response mechanisms for energy-intensive industrial users as follows:
  • Response based on thermal balance: Thermal balance is managed in many industrial production processes. During some processes of production, the equipment and environment temperatures need to be controlled within a small fluctuation range to ensure a successful production process. For example, the main target in order to maintain thermal balance during smelting processes is to conduct chemical reactions at optimal equipment conditions. Controlling environment temperature is desirable in production processes, such as drying and refrigeration.
  • Response based on storage capacity: Some industrial users that have complex manufacturing process usually produce a series of intermediate products before final products are completed. A close relationship among different production processes exists and thus, the load change in one of the processes will influence the whole production flow. In order to deal with equipment maintenance, unexpected accidents and other unplanned situations during the production process, these types of industrial users usually have a certain storage capacity of intermediate products that could be processed with planning to keep the production continuity for the next process. These industrial users could participate in the provision of AS according to their storage capability along different production processes.
Figure 3. The daily load curve of typical industrial users in China.
Energies 08 03955 g003

3.2. Aluminum Smelter

Aluminum smelters are chosen as the representative of energy intensive industrial response resources that maintain thermal balance, and a target for efficiency gains in China. For a typical aluminum smelter, electricity consumption accounts for 40% to 50% of the overall cost of producing primary aluminum [14]. Compared with other energy-intensive industries, it has a fairly simple production process. Aluminum smelting pots, which are the core piece of equipment in aluminum production and consumes the vast majority of electrical energy, is electronically controlled, and could potentially follow AS scheduling commands accurately [15,23]. The thermal balance in the smelting pot is important and is maintained by adjusting the incoming voltage and, therefore, the power consumption of each pot. The thermal balance of the smelting pot is very important and is maintained by controlling the energy input of the pot. As long as the average power over a few hours remains unchanged, reducing or increasing the input voltage of each pot, thereby reducing or increasing electricity consumption, will not affect the overall production process and could be used to achieve fast response. Furthermore, control actions can be precisely achieved within seconds. For example, an aluminum smelter with a 100 MW average energy requirement could swing between 97 MW and 103 MW in order to supply 3 MW of AS capacity. While providing AS, the load is managed up and down continuously, averaging 100 MW and maintaining thermal balance in the pot.

3.3. Cement

This paper chooses cement production processes as the representative of industrial response resources with storage capacity. The main electrically intensive portions of cement manufacturing involve the raw mill, kiln and cement mill. During the production process, only the kiln must keep running, while the operation time of the raw mill and cement mill can be shifted as needed. These two adjustable sub processes account for 60%–70% of the total electricity consumption in cement production [24]. A simplified process diagram of cement production in a large cement plant is shown in Figure 4. In terms of the manufacturing process, the potential of cement manufacturing for the provision of AS is dependent on the storage silo capacity and the mill configuration. For example, if the production rate of the raw mill preceding the silo is greater than the production rate of the kiln, the electrical load of the raw mill can be shifted [13], while maintaining material supply for the kiln from the raw silo until the mill comes back online. Maximum and minimum storage levels at various points in the cement process will determine the response duration for each of the sub processes. Larger cement plants with more storage capacity and multiple mills configuration have greater flexibility compared with smaller plants with one mill configurations.
Figure 4. Production diagram for cement manufacturing process (A “2:2” raw to cement mill configuration is shown).
Energies 08 03955 g004

4. Agent-Based Integrated Power Management Model

4.1. Model Design

There is a long way to go before establishing an ideal power market mechanism in China. Fixed framework methods and models have limited usefulness in the research context of the Chinese power system and AS scheduling. Due to its inherent flexibility, we present, in this section, an agent-based model for AS dispatching that includes conventional generators, power grid and industrial agents.
In a perfectly competitive electricity market, generators will withhold capacity from the energy market to sell into the AS markets. The bid price for the generator to supply an AS is based primarily on the difference between the generator’s production cost and the electricity sale price at that time. This means that costs for each AS are driven primarily by opportunity cost. Nevertheless, in China, there is no market mechanism to motivate supply and demand side resources to participate in the provision of AS. Instead, the AS prices are set by Chinese electricity regulators as shown in Table 2 [25,26,27,28,29], and they vary across different regions. In the north, central and northwest China grids, the compensation price for start-up/shut-down regulating service is dependent on the unit capacity. Meanwhile, in the northeast grid, a compensation factor is presented for the start-up/shut-down service and in eastern China, the continuously off-time duration is also considered. In this model, we choose the most widespread compensation standard of the north, central, and northwest China grids to design model parameters.
Table 2. Compensation standard for AS in different regions of China.
RegionDepth Peak-Regulating ($/MWh)Spinning Reserve ($/MWh)Start-Up/Shut-Down ($/MW)
<100 MW100–400 MW>400 MW
Northeast China833.3<200200–800>800
North China8.31.683167167
Central China33253367133
East China178.3133–300167–667333–833
Northwest China20-67133133
For responsive loads, the participation model and evaluation criterion have not been established and their role in system operation is passive at present, for example, curtailment during instances of power rationing. To avoid production penalties for reduced efficiency, in the presented model, high responsive constraints for industrial users are set. One consequent model assumption is that industrial users are willing to participate in AS for benefits associated. Industrial users usually could not provide all types of AS and perform their basic function at the same time. Another assumption in the model is that industrial users can provide peak-regulating service by the dispatching operator. Aluminum smelters have a higher compensation than cement manufacturing plants in this model since they are able to provide up and down capacity from the smelting pot.
For evaluating the effect of integrated power management, daily system coal consumption is accounted in this model as shown in Equation (1):
C coal = i = 1 N t = 1 T f i P i _ t i = 1 N t = 1 T P i _ t
where Pi_t is the power output of unit i at time t, fi is coal consumption factor of unit i, N is the total number of generator units, T is the total number of hours to be studied, which tends to be 24 h.

4.2. Generation Agent

The generation agent represents conventional generators with different functional orientations, including base-load units, peak-regulating units and peak-load units, each of which has different fuel costs and start-up costs. For a given load demand from the grid agent, the generation agent will allocate power to each production unit in the following priority order: base-load units, peak-regulating units and peak-load units. In other words, base-load units are always producing the maximum output after start-up. Peak-regulating units are dispatched as flexible when needed to meet the supply and demand imbalance. And for following the rules given in Interim Measures, each peak-regulating unit will be just compensated for providing the depth peak-regulating service when its real-time power is out of the range of system peak-regulating service. For simplicity, this paper assumes the output of peak-regulating units keep unchanged within each hour, so the regulation up/down compensation for generation units can be ignored.
The aim of the generation agent in this model is set to maximize the total payoff. For conventional generator units, the objective includes the following benefits and costs,
(1) Generating benefit
Generating benefit of unit i at time t is,
G B i _ t = λ i P i _ t
where λi is the feed in tariff of unit i.
(2) Fuel cost
Fuel cost of unit i at time t is,
F C i _ t = γ f i P i _ t
where γ is the coal price.
(3) Start-up cost
S C i _ t = { h c o s t i      M D i X i _ t o f f H i o f f c c o s t i       X i _ t o f f > H i o f f
H i o f f = M D i + c s h o u r i
where X i _ t off is the duration of uninterrupted downtime for unit i at time t, MDi is the minimum uninterrupted downtime of unit i, cshouri is the cold start hour of unit i.
(4) AS compensation
A C i _ t = A C i _ t DP + A C i _ t UD + A C i _ t SR
A C i _ t DP = { C DP t = 1 T ( q i P i _ max P i _ t ) I i _ t      P i _ min P i _ t q i P i _ max   0                                          q i P i _ max P i _ t P i _ max
A C i _ t UD = C UD P i _ max ( I i _ t ( 1 I i _ t 1 ) + I i _ t 1 ( 1 I i _ t ) )
A C i _ t SR = C SR I i _ t ( P i _ max P i _ t )
where ACi_t represents the AS revenue of unit i at time t, A C i _ t DP , A C i _ t UD and A C i _ t SR are respectively the revenue of unit i for offering depth peak-regulating, start-up/shut-down and spinning reserve services, Pi_max and Pi_min are the upper and lower output limit of unit i, qi is the depth peak-regulating service factor of unit i, CDP, CUD and CSR are respectively the relevant compensation price for depth peak-regulating, start-up/down and spinning reserves services respectively, Ii_t is the on/off status of unit i at time t, where 1 represents on, 0 represents off.
To sum up, the revenue function of generation agent is,
F G A = t = 1 T i = 1 N ( G B i _ t I i _ t F C i _ t I i _ t I i _ t ( 1 I i _ t 1 ) S C i _ t + A C i _ t )
the objective of generation agent is to maximize FGA.
Assuming the normal operation of each unit, the generation limits and minimum on/off time constraints are included in this model:
P i _ min P i P i _ max
( 1 I i _ t + 1 ) M U i X i _ t o n          I i _ t = 1 I i _ t + 1 M D i X i _ t o f f                  I i _ t = 0 }
where MUi/MDi are minimum uninterrupted on/off time of unit i, X i _ t on is the duration of uninterrupted on/off of unit i at time t.

4.3. Industrial User Agent

4.3.1. Aluminum Smelter Agent

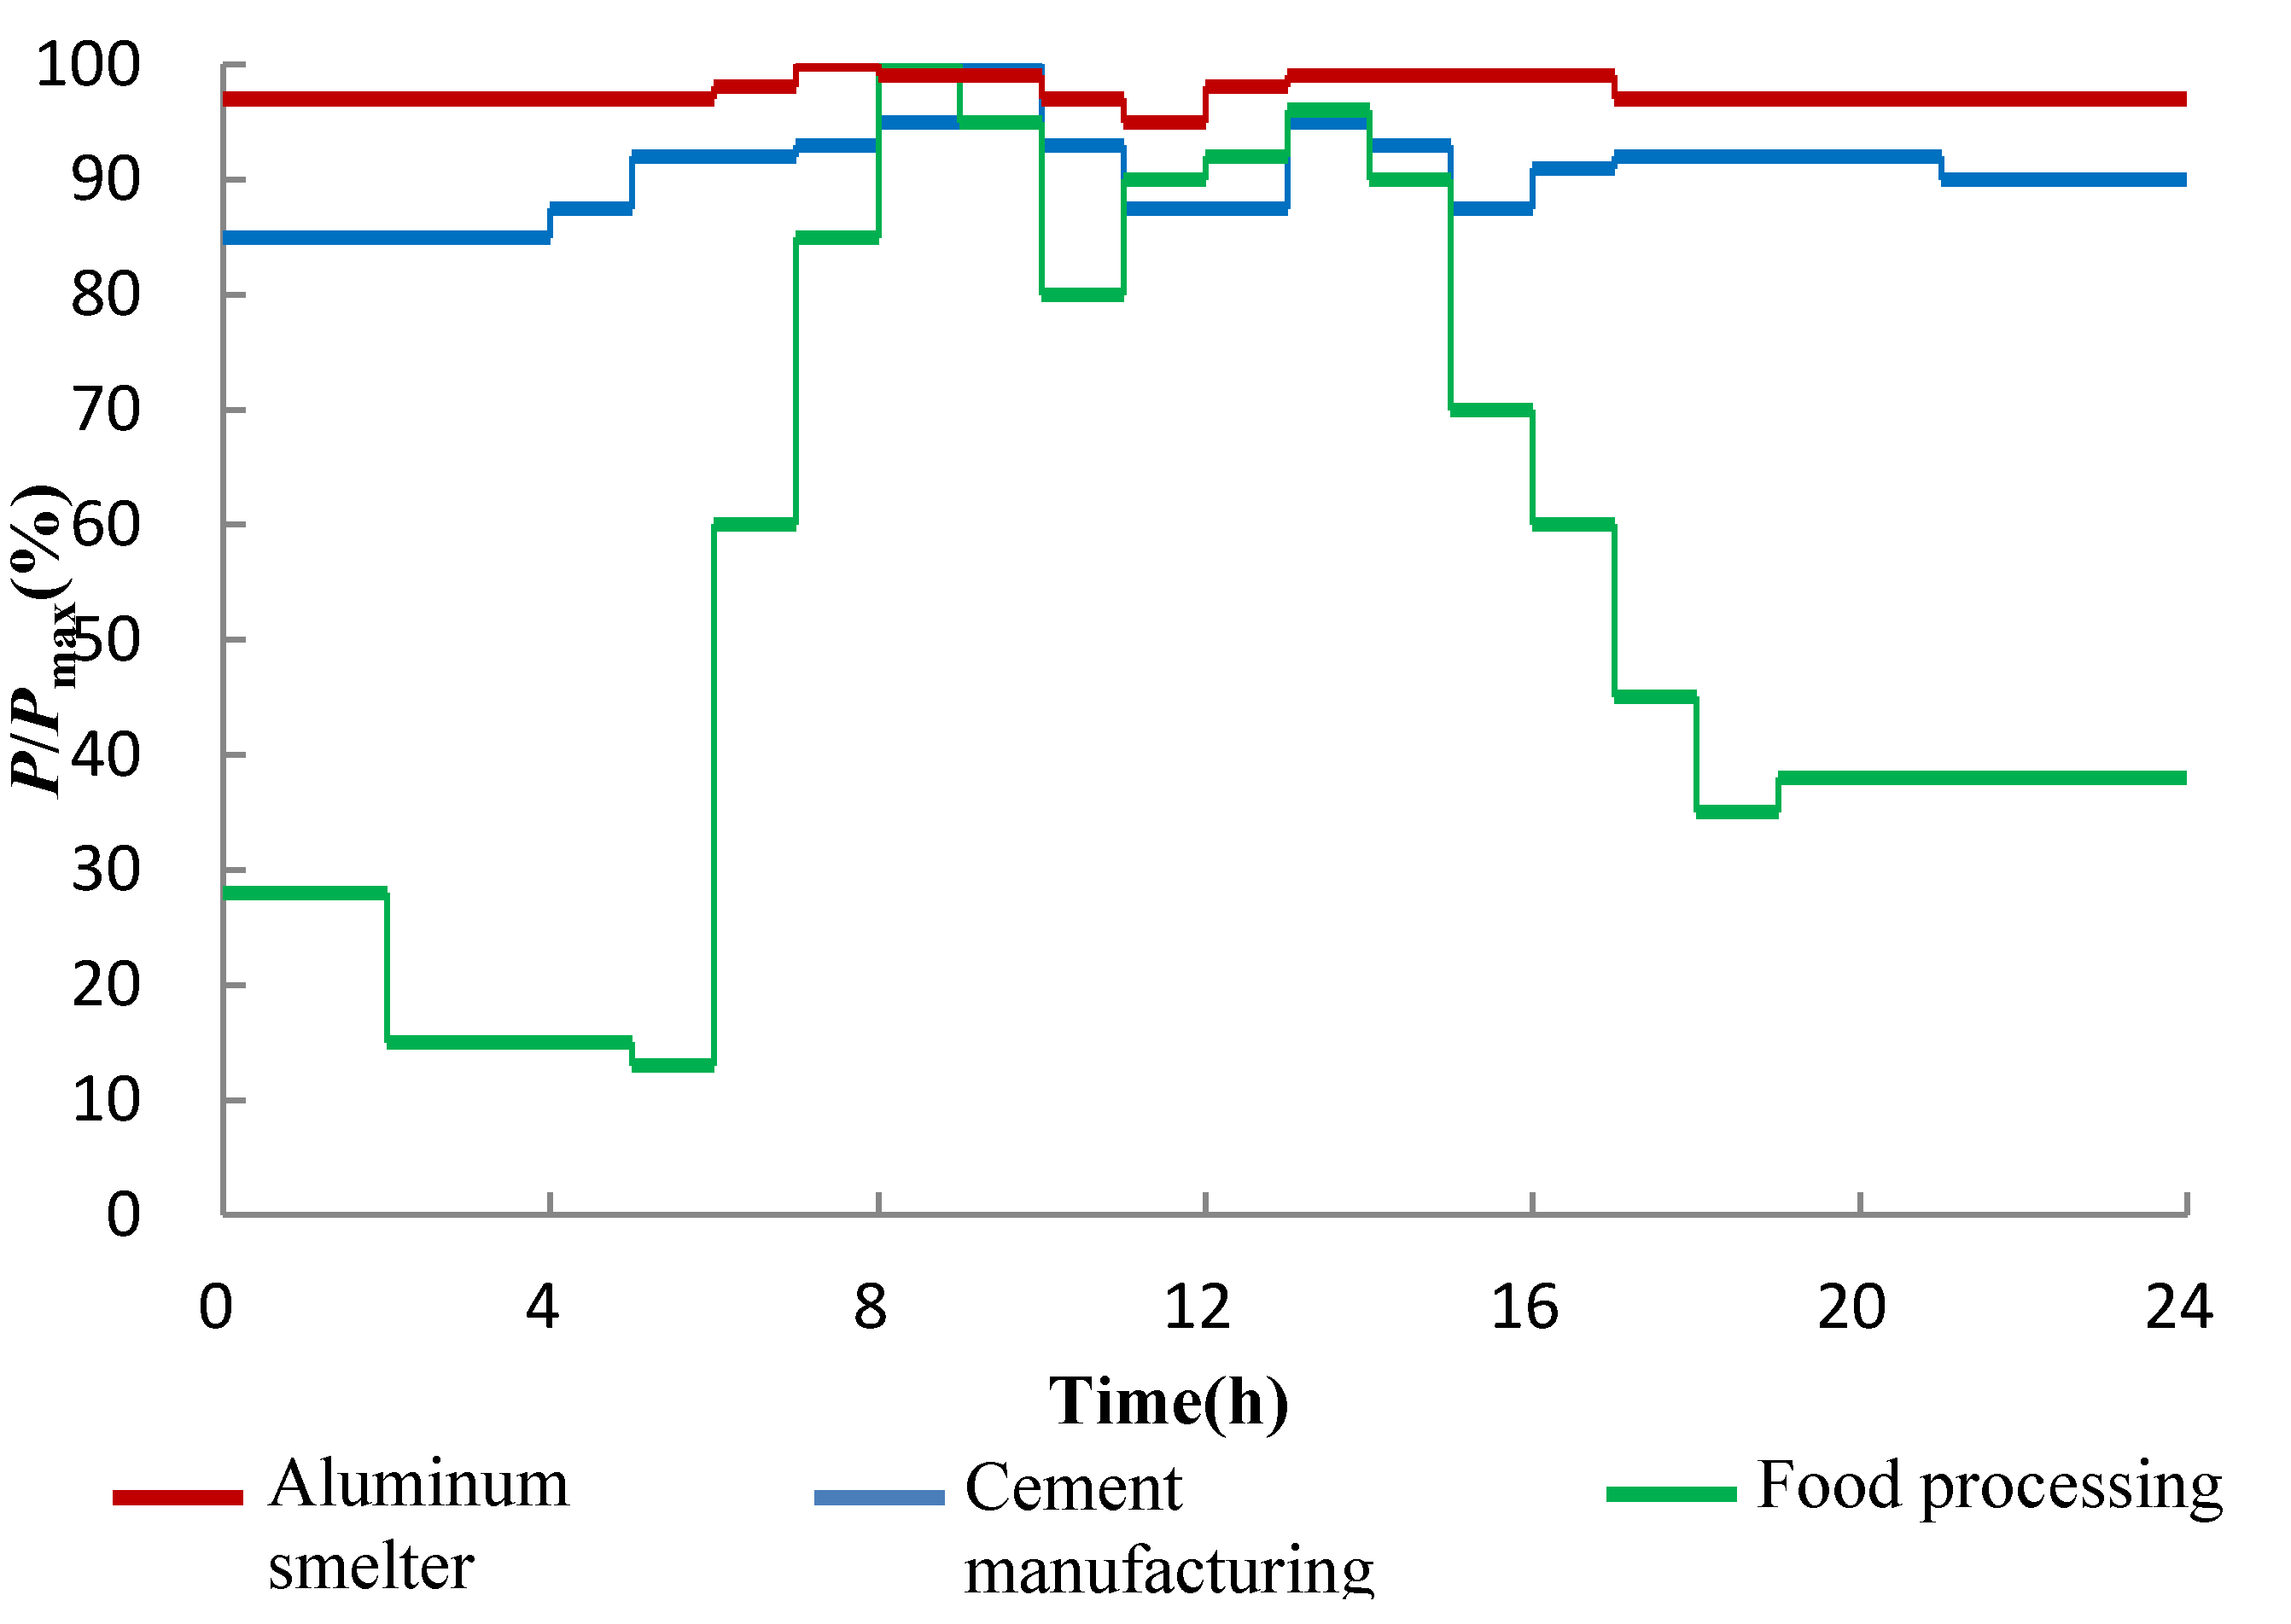
In this model, an aluminum smelter agent is designed as a flexible response resource by controlling the smelting pot. The smelting process power consumption is generally constant, typically operating at, or above, 95 percent load factor, as shown in Figure 3, we assume that the power of smelter agent remains unchanged in daily operation if it doesn’t take AS into account. When considering AS benefits, the smelter will try to modify the smelting pot power for more benefits as shown in Figure 5. And in this process, the response direction of the aluminum smelter agent is determined by the AS signal, but the actual response capacity of the aluminum smelter agent is determined by its own decision-making. Due to thermal inertia, if the power swings are small enough, the production of aluminum will not be affected by the provision of AS. The real-time power of smelter k following the dispatching commands at time t can be expressed as Equation (13):
P k _ t = P k + A L k _ t
where Pk represents the daily baseline load of aluminum smelter k without providing AS, and ALk_t is the response capacity of smelter k at time t, which can be either positive or negative. The response capacity has a negative value when the smelter provides positive response capacity and vice versa.
Figure 5. The load curve of aluminum smelter k.
Energies 08 03955 g005
On the basis of above analysis, the associated benefits and costs of aluminum smelter k to the provision of AS include the following:
(1) Load fluctuation cost
The movement of mechanical tap changers on the rectifiers necessary to adjust power could accelerate the wear and tear of these devices. This cost can be presented as a quadratic function of the response capacity as in Equation (14):
L C k _ t = a k + b k A L k _ t J k _ t + c k A L k _ t 2
where ak, bk and ck are wear coefficients of smelter k, Jk_t is the load change direction of smelter k at time t, with 1 representing provision of negative response capacity by increasing demand, −1 representing provision of positive response capacity by decreasing demand, and 0 representing no response.
(2) AS benefit
A C k _ t = C IL_a A L k _ t J k _ t
where CIL_a is the compensation price of aluminum smelters for offering peak-regulating service.
(3) Production benefit
P B k = M k ( S a ( e c o s t k + o c o s t k ) ) = M k ( S a ( Δ μ k d k + o c o s t k ) )
Δ μ k = t = 1 T μ t P k _ t t = 1 T P k _ t
where Mk is the aluminum production of smelter k within time period T, Sa is the market price per ton of aluminum, ecostk is the electricity consumption cost of smelter k, Δμk is the average electricity price of smelter k within T, dk is the electricity intensity of smelter k, μt is the electricity price for energy-intensive users at time t, ocostk includes additional costs of smelter k, including aluminum oxide, carbon block and labor cost, etc.
To sum up, the objective revenue function of aluminum smelter agent k is shown in Equation (18).
F A L _ k = P B k + t = 1 T ( A C k _ t L C k _ t )
Some constraints of aluminum smelter are taken into account. Firstly, since the operation of aluminum smelters is subject to the thermal balance, so a response capacity limit within T is considered, as shown in Equation (19), to ensure that the positive capacity and negative capacity are equal. Secondly, since aluminum smelters tend to have a high stability and performance requirement, an upper limit on its supplying capacity is set, as shown in Equation (20). Thirdly, the duration of unidirectional positive or negative response duration should not be long, and it is constrained by Equation (21).
t = 1 T A L k _ t = 0
A L k _ t J k _ t P k η max
( 1 J k _ t + 1 ) ( M R X k _ t u p ) 0        J k _ t = 1 ( 1 + J k _ t + 1 ) ( M R X k _ t d o w n ) 0       J k _ t = 1 }
where ηmax is the maximum responsive capacity factor that one smelter could provide, MR is the maximum response duration limit of smelter, which tends to be 2 h.

4.3.2. Cement Agent

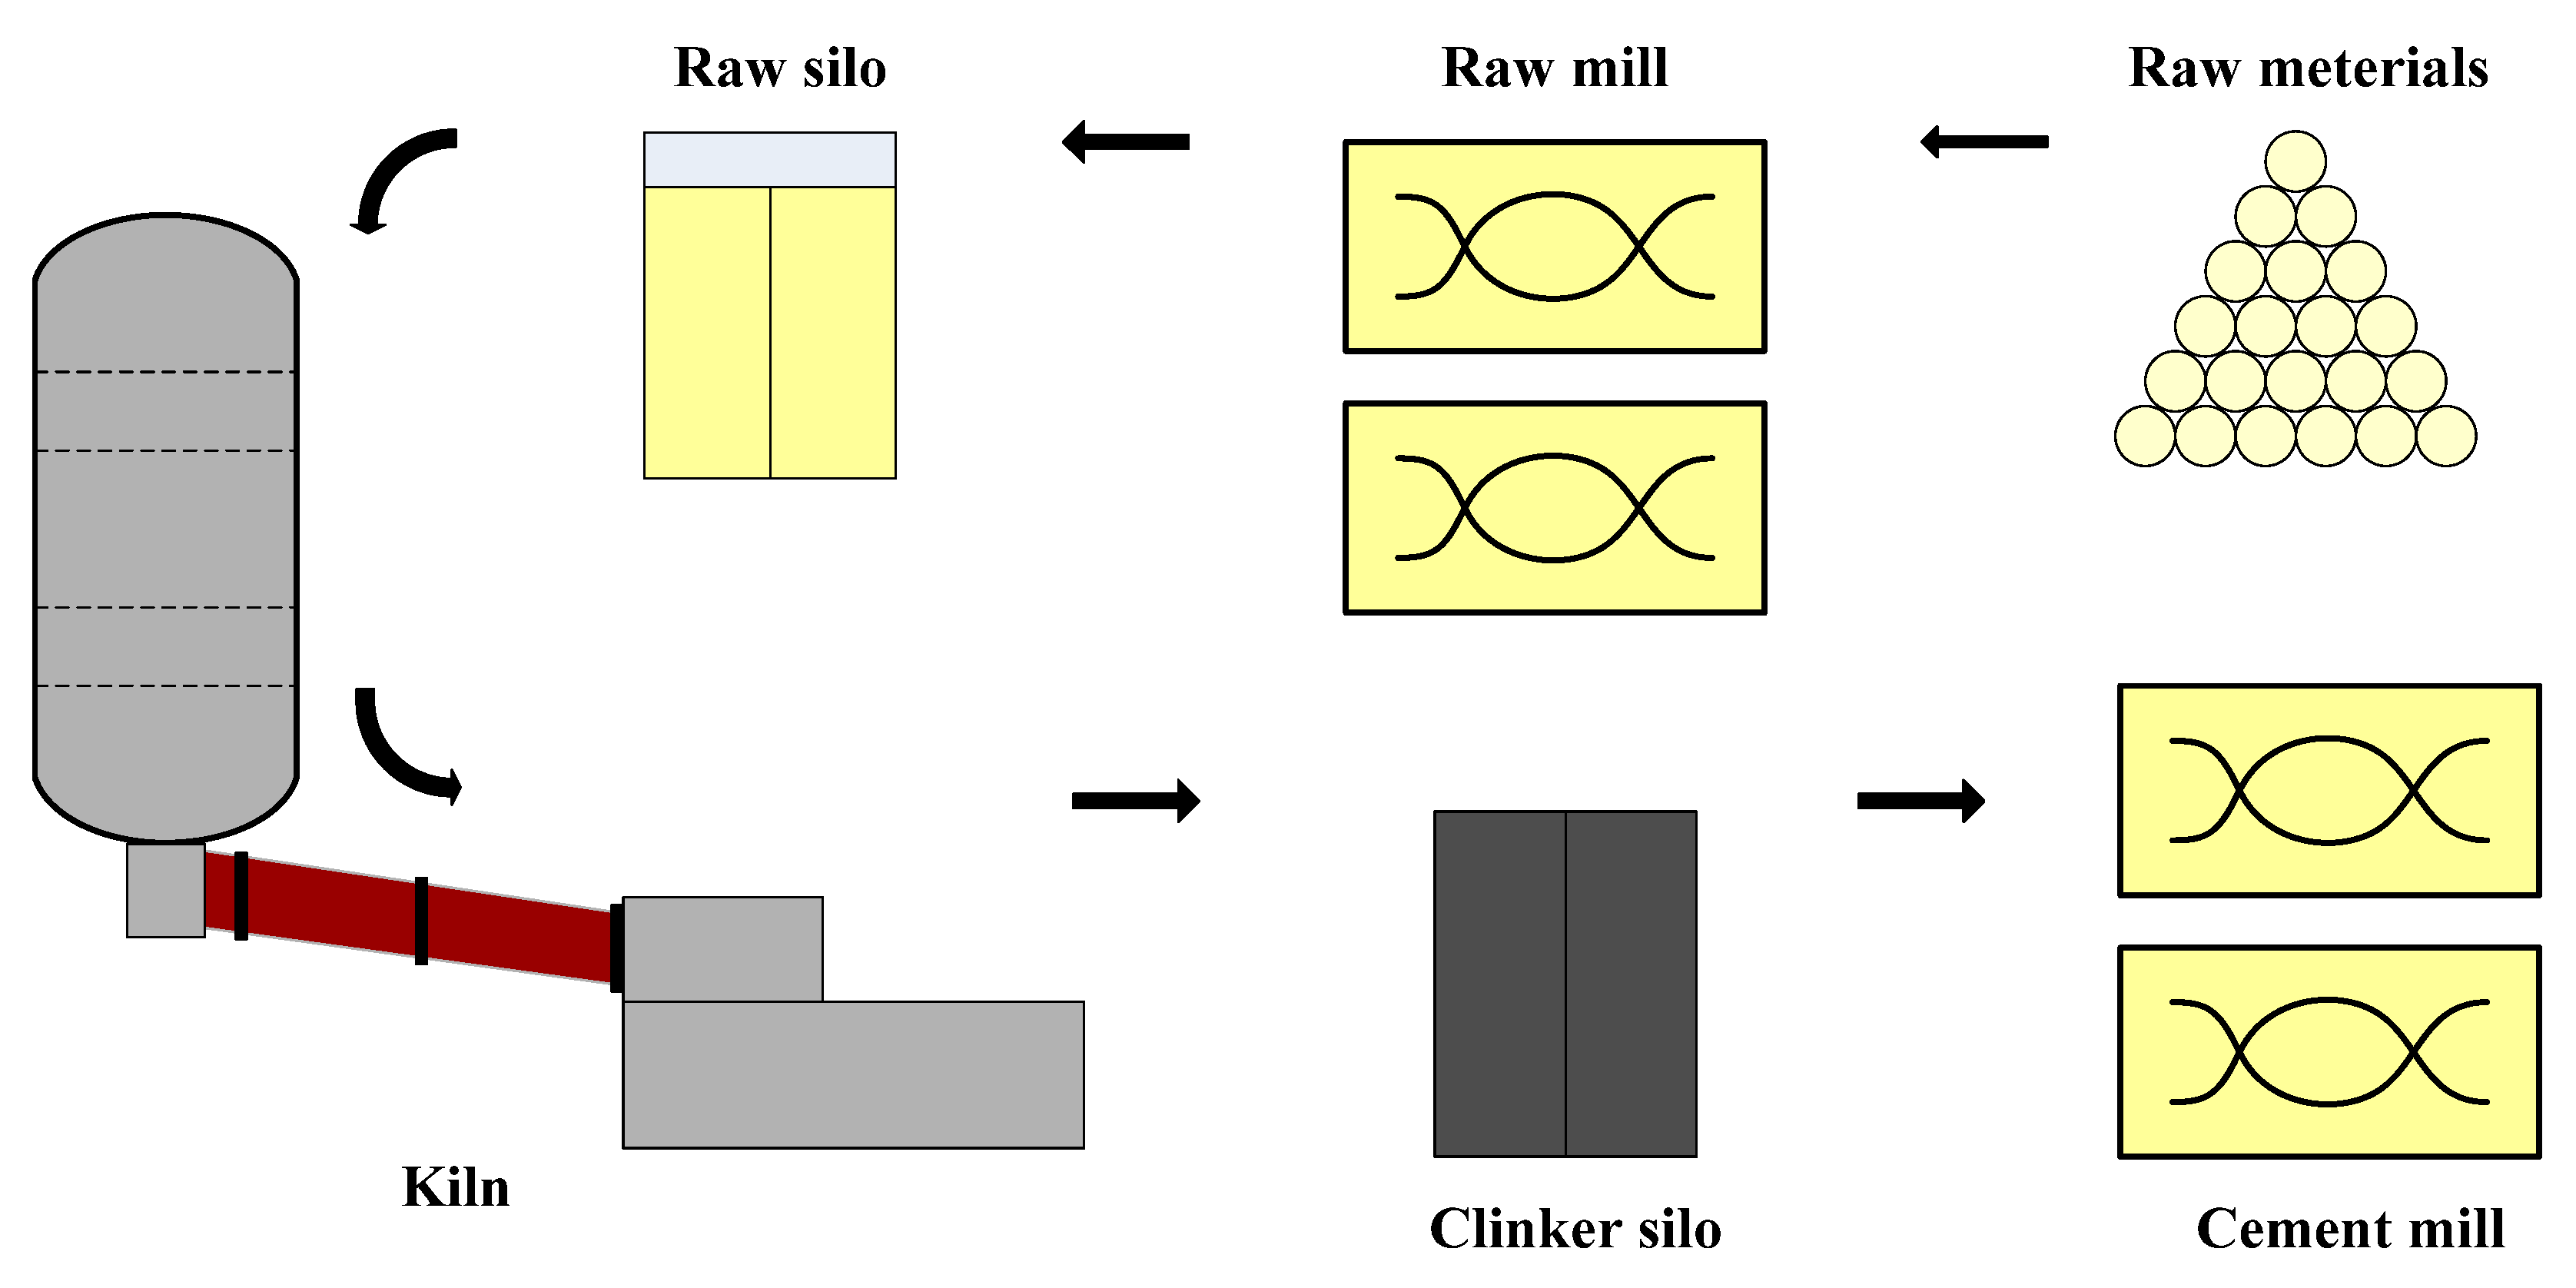
In this model, we assume that each cement agent just contains just two responsive devices: a raw mill and a cement mill, and that the responsive potential of each device is determined by the storage capacity and device configuration. Each cement agent can provide AS by controlling the curtailment of the raw mill and the cement mill. The agent’s cement production is based on the control of flows and stocks of its production process as shown in Figure 6. These flows and stocks relationships are described in Equations (22)–(26):
Figure 6. The diagram of flows and stocks in relation to AS in cement j.
Energies 08 03955 g006
R F j _ t = a j R P j X j _ t
R S j _ t = R F j _ t X j _ t K F j _ t + R S j
C L F j _ t = k K F j _ t
C L S j _ t = C L F j _ t C E F j _ t Y j _ t + C L S j
C E F j _ t = b j C P j Y j _ t
where RPj and CPj are respectively the response capacity of raw mill and cement mill in cement j respectively, RFj_t, KFj_t, CLFj_t and CEFj_t are the material flow of various production processes in cement j at time t, RSj_t and CLSj_t are the material stock of cement j in the raw silo and clinker silos at time t respectively, RSj and CLSj are the initial stock value of cement j in its raw silo and clinker silo respectively, k is the loss factor on ignition from the raw material to the clinker, Xj_t and Yj_t are the on/off status of raw mill and cement mill in cement j at time t, with 1 represents on, and 0 represents off.
Based on the above analysis, the associated benefits and costs of cement j for the provision of AS include the following,
(1) Interruption cost
I C j _ t = c j ( X j _ t 1 ( 1 X j _ t ) + Y j _ t 1 ( 1 Y j _ t ) )
where cj is the interruption cost coefficient of cement j.
(2) AS benefit
A C j _ t = C IL_c ( R P j X j _ t 1 ( 1 X j _ t ) + C P j Y j _ t 1 ( 1 Y j _ t ) )
where CIL_c is the compensation price of cements for offering peak-regulating service.
(3) Production benefit
P B j = ( S c ( e c o s t j + o c o s t j ) ) t = 1 T C E F j _ t = ( S c ( Δ μ j d j + o c o s t j ) ) t = 1 T C E F j _ t
Δ μ j = t = 1 T μ t ( R P j X j _ t + C P j Y j _ t + B P j ) t = 1 T ( R P j X j _ t + C P j Y j _ t + B P j )
where Sc is the cement market price per ton, ecostj is the electricity consumption cost of cement j, Δμj is the average electricity price of cement j within T, dj is the electricity intensity of cement j, BPj is the power of kiln in cement j, ocostj includes additional costs of cement j, including limestone, coal and labor cost, etc.
Combining the associated costs and benefits presented above, the revenue function for a cement agent j is shown in Equation (31):
F C E _ j = P B j + t = 1 T ( A C j _ t I C j _ t )
Two types of constraints on cement agent in out model are set within T: the storage and responsive times limits, as shown below,
R S j _ min R S j _ t R S j _ max
C L S j _ min C L S j _ t C L S j _ max
t = 1 T X j _ t 1 ( 1 X j _ t ) R N max
t = 1 T Y j _ t 1 ( 1 Y j _ t ) C N max
where RSj_max and RSj_min are the upper and lower storage limit of the raw silos in cement j respectively, CLSj_max and CLSj_min are the upper and lower storage limit of the clinker silos in cement j, RNmax and CNmax are the maximum responsive times of raw mill and cement mill, respectively, in cement j.

4.4. Grid Agent

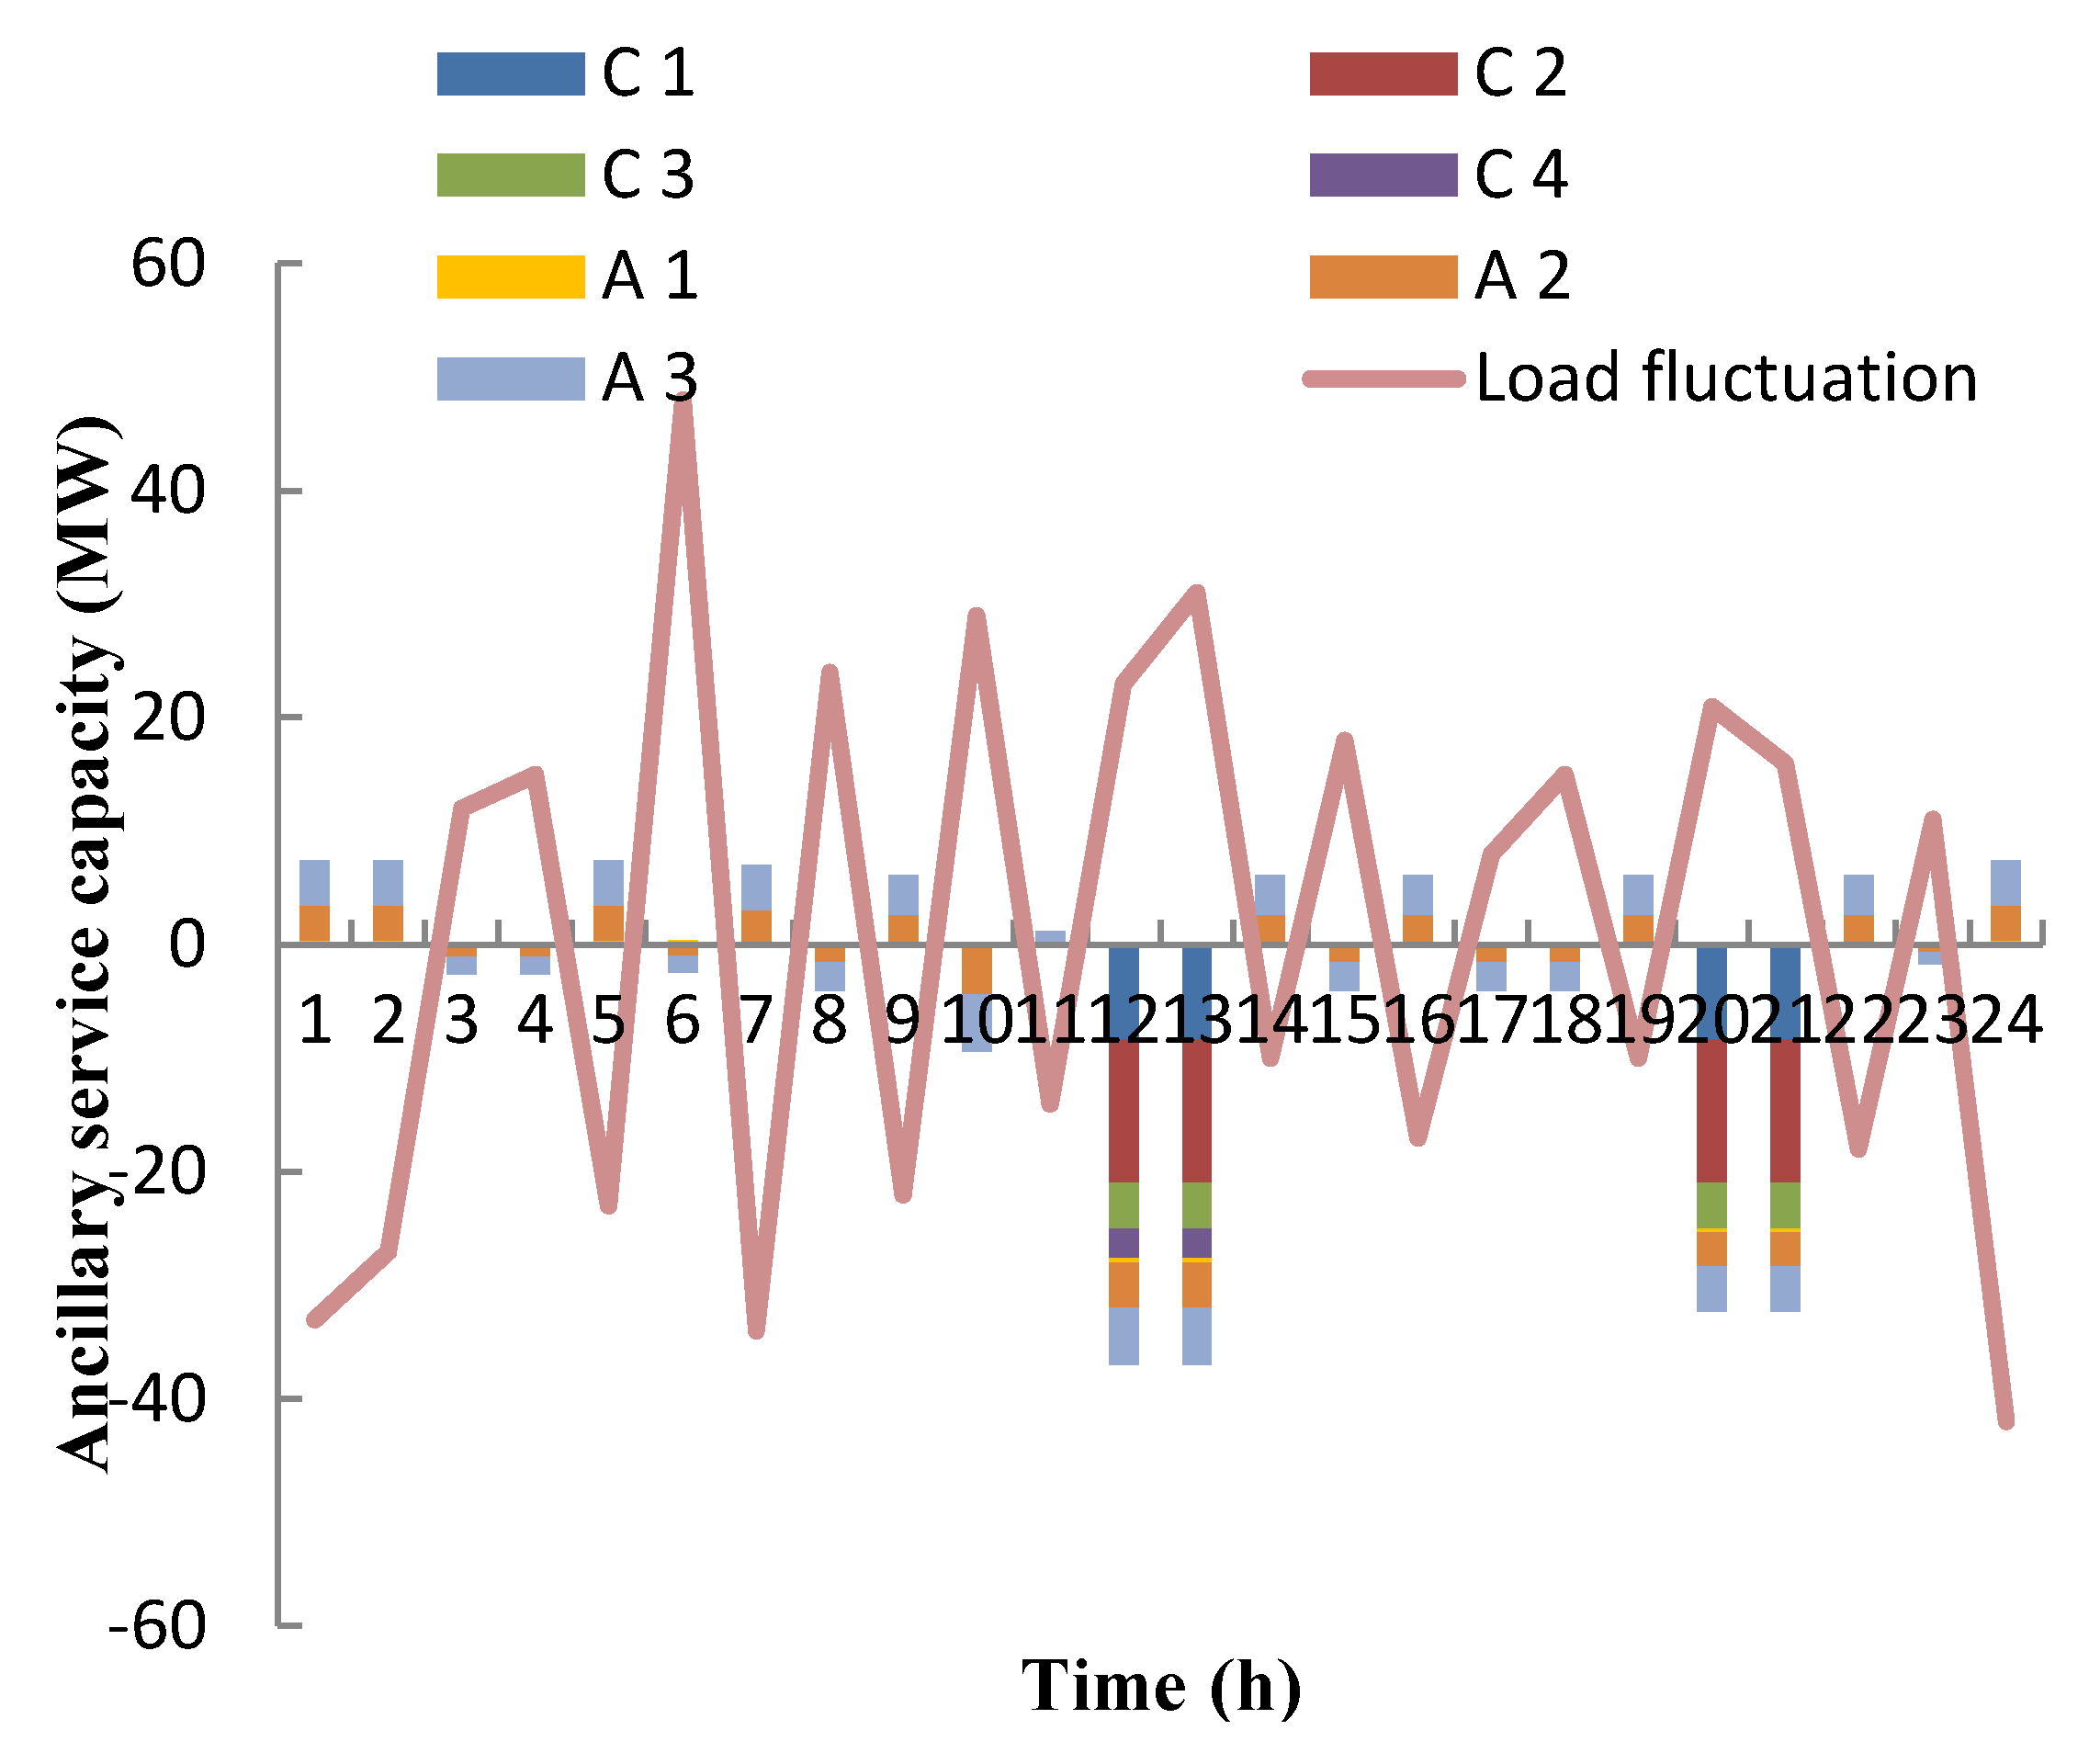
The objective of the grid agent in this model is to regulate the power and AS markets in order to maintain reliability and support power system’s primary function of delivering energy to users. First, the grid agent forecasts the load demand for the next dispatching period, which includes the demand of industrial users based on the Chinese peak-valley price mechanism. It does not take strategic actions at this stage. Then the grid agent delivers demand messages to generators. After all the generators have finished their decision-making processes, the grid agent gathers and categorizes all of the supply and demand information. The grid agent, aiming at minimizing the system coal consumption, establishes feasible AS requirements of consumption for industrial users and considers the available capacity from industrial users as able to substitute coal-fired units. Once it receives a load fluctuation signal, the grid agent will dispatch responsive resources in the following priority order: aluminum smelter agents, cement agents and then generation agents. It is worth mentioning that whichever resources dispatched first will receive more challenging responsive signals than the others. Therefore, we choose to place aluminum smelters first, as smelters can instantaneously follow the responsive signal with higher accuracy. After the supply and demand is balanced, the grid agent informs the generation agent and industrial user agent of their generation schedule.
In addition, the constraints associated with the optimal scheduling problem by the grid agent include power balance and AS capacity, as shown in Equations (36) and (37).
(1) Power balance constraint
i = 1 N ( P i _ t I i _ t ) = L D t + k = 1 K A L k _ t j = 1 J ( R P j X j _ t 1 ( 1 X j _ t ) + C P j Y j _ t 1 ( 1 Y j _ t ) ) + P L t
where i = 1 N ( P i _ t I i _ t ) is the sum of generation agents output, LDt is the original load demand at time t, PLt is network loss, while it is assumed that network loss has been considered within LDt, so PLt = 0.
(2) AS capacity constraint
i = 1 N ( P i _ max I i _ t ) + k = 1 K ( η max P k ) + j = 1 J ( R P j X j _ t + C P j Y j _ t ) L D t + P L t + A S t
where i = 1 N ( P i _ max I i _ t ) is the sum of the maximum output capacity of all participating generation agents, ASt is AS capacity at time t.

5. Simulation of Integrated Power Management for AS

5.1. Basic Data

The model considers a generation agent with ten available units. Of those ten, three are base-load units, three are peak-regulating units and four are peak-load units. Their associated parameters are shown in Table 3. In addition, the coal price is 82 $/tce, and the feed in tariff is 64$/MWh. The related coefficients of start-up costs can be found in [30,31].
Table 3. The parameters of generation agent for providing AS.
Unit TypeFunctionPmax (MW)Pmin (MW)f (gce/kWh)MU (Hour)MD (Hour)q
Unit 1Base-load45515033088-
Unit 2Peak-regulating4551503308850%
Unit 3Base-load1302035855-
Unit 4Base-load1302035955-
Unit 5Peak-regulating162253546644%
Unit 6Peak-regulating80203633340%
Unit 7Peak-load85253663340%
Unit 8Peak-load55103681135%
Unit 9Peak-load55103691135%
Unit 10Peak-load55103701135%
In this model, three aluminum smelter agents and four cement agents with different factors are designed. The production parameters are derived from surveys on aluminum-processing enterprises in central China are used as the data sources. As for cement producers, the economic and technical indices for various sub processes in this model are selected from reference [32]. The chosen parameters for both types of agents are shown in Table 4 and Table 5. Additionally, the cement and aluminum market price are $32/ton and $2420/ton respectively. The loss factor on ignition from the raw material to the clinker at the cement manufacturing process is 0.95. The interruption cost coefficient for each mill is $250 per event. The initial stock value in the raw and clinker silos in each cement agent is assumed to be 50%.
Table 4. Cement agent parameters for the provision of AS.
Cementd (MWh/t)ocost ($/t)BP (MW)CLF (t/h)RSmin (t)RSmax (t)CLSmin (t)CLSmax (t)Raw MillCement Mill
a (t/MWh)RP (MW)RNmaxb (t/MWh)CP (MW)CNmax
C 10.12321.68.516714,40021,60020,00024,00038.53.9 × 2228.14.2 × 22
C 20.11519.811.616714,40021,60020,00024,00068.24.4226.84.1 × 22
C 30.10822.96.313311,76017,64016,00019,20061.34.0229.32.9 × 22
C 40.09421.11.230240036003500470050.01.0224.61.3 × 22
Table 5. Aluminum smelter agent parameters for the provision of AS.
Aluminum SmelterPk (MW)a ($/h)b ($/MWh)c ($/MWh2)M (t/d)d (MWh/t)ocost ($/t)ηmax
A 133040155514.413275%
A 2111020519213.913105%
A 3215015438313.512925%
The various prices for AS and the original load demand and peak-valley electricity prices are shown in Table 6 and Table 7. It is obviously that the peak period is set from 10 to 13 and from 20 to 21, and the valley period is from 1 to 7 and from 23 to 24.
Table 6. The AS price of each type of suppliers.
Unit TypeGeneration UnitIndustrial User
<100 MW100–400 MW>400 MWAluminum SmelterCement
CDP ($/MWh)323648--
CUD ($/MW)4080160--
CSR ($/MWh)888--
CLC ($/MWh)---3632
Table 7. The original load demand and peak-valley electricity price.
Time (hour)Load (MW)Electricity Price ($/MWh)Time (Hour)Load (MW)Electricity Price ($/MWh)Time (Hour)Load (MW)Electricity Price ($/MWh)
170064913007217100072
2750641014009618110072
3850641114509619120072
4950641215009620140090
51000641314009621130090
61100641413007222110072
7115064151200722390064
8120072161050722480064

5.2. Case 1: Day-ahead AS Scheduling

In day-ahead scheduling, industrial users have sufficient time to arrange their production plans, and participate in load shedding and shifting without interrupting plant operation. In Case 1, we study the role of industrial users in the provision of day-ahead AS. The production decision-making mechanism of each industrial user agent is based on the peak-valley electricity price, presented in Table 7, and their particular constraints of production. For Case 1, industrial users participate in the day-ahead scheduling only during the peak-valley period.
The output of conventional units in Case 1 is shown in Figure 7. It shows that industrial users in demand side have the potential and capacity to participate in day-ahead AS provision, working alongside with traditional generators on supply side. When comparing the planned and actual load curve in Figure 7, the load factor has increased by 1.5%, as a result of dispatching resources from industrial users. The compensation comparison between planned and actual AS scheduling is shown in Table 8. When comparing the planned and actual output of conventional units, it is also easy to find that industrial users have replaced the output of conventional Units 9 and 10, and that the total cost has been reduced by 10.6%. These cost reductions in cost illustrate the advantages of demand side resources.
Figure 7. Output of conventional units when industrial users participate in day-ahead AS scheduling.
Energies 08 03955 g007
Table 8. Compensation comparison between planned and actual AS scheduling.
ScenarioTotal Compensation ($)Aluminum Smelter ($)Cement ($)Generation Unit
Depth Peak-Regulating ($)Start-Up/Shut Down ($)Spinning ($)
Planned169478.9--23,830.9111,520.034,128.0
Actual151468.42613.66707.223,074.698,300.020,773.0
As shown in Figure 8, the cement agent with more responsive devices and storage capacity has more flexibility available in day-ahead scheduling, which can ensure that neither significant downtime nor inventory shortages during the production cycle occurs. As for aluminum smelter agents, their responsive potentials are limited by the constraint on responsive periods duration. The actual response capacities of three modeled smelters in one day just account for 9.1%, 21.9% and 15.4% of their maximum response capacities respectively. The industrial users’ revenue comparison between the planned and actual scheduling strategies is shown in Table 9. If there is no additional compensation for flexible industrial users, there is no motivation for industrial users to change their load curves due to load fluctuation costs. Evidently, industrial users could be willing to provide AS if greater net revenue is possible. To further incentivize participation without punishing those that cannot participate, the load fluctuation cost can be partly offset by a decline in electricity consumption cost.
Figure 8. Power deviation from industrial users providing day-ahead AS.
Energies 08 03955 g008
Table 9. Revenue comparison between planned and actual AS scheduling.
User TypePlanned SchedulingActual Scheduling
ecost ($/t)PB ($)F ($)ecost ($/t)PB ($)F ($)
A 11072.32587.40587.401071.34641.16606.96
A 21035.0914,383.3614,383.361032.8414,815.5014,855.90
A 31005.3034,724.1034,724.101003.7635,159.5835,360.90
C 19.1624,022.8324,022.838.7626,271.3127,382.51
C 28.5635,001.6135,001.618.2336,762.4537,681.65
C 38.0416,549.1716,549.177.7417,802.5418,312.94
C 46.9010,738.8610,238.866.8010,900.3210,566.72

5.3. Case 2: Real-Time AS Scheduling

In Case 2, we assume that industrial user agents are willing to provide real-time response flexibility for increased benefits, and are assumed to have passed the required eligibility testing to be eligible to participate in real-time AS scheduling.
The real-time load fluctuation signal and response capacities for industrial users in Case 2 are shown in Figure 9. Without considering the effect of demand side flexibility, the deviation between actual and forecasted loads will cause the system load factor to fall from 75.3% to 74.2%. Engaging industrial users to participate in the provision of AS causes the load factor to remain unchanged, even though the maximum and minimum loads have differed from the forecasted results. The results show that aluminum smelters can provide positive capacity by decreasing demand when the real-time load demand rises and provide negative capacity by increasing demand if a negative fluctuation occurs. The actual response capacities of the three modeled aluminum smelters are respectively 13.1%, 41.4% and 29.8% of their maximum response capacities, all of which are higher than their response capacities in day-ahead scheduling. However, compared with aluminum smelter agents, cement agents have less flexibility in real-time scheduling due to the uncertainty in load fluctuation direction.
The output of Units 2, 5 and 6 is shown in Figure 10a–c respectively. The operation of Unit 2 is smoother and has a higher load factor compared with the scenario with no industrial user participation, and the average output of Units 5 and 6 is significantly reduced. This means that the coordination between cement manufacturers and aluminum smelters decreases the dispatching requirement for the large peak-regulating unit and makes them more able to respond to the load fluctuation. In addition, the coal consumption rate on the supply side is also improved from 336.97 gce/kWh to 336.84 gce/kWh due to the peak-regulating units output changes. The main reason behind the decrease in coal consumption rate is that Unit 2, which has a lower coal consumption rate, contributes more to the total output if industrial users also provide flexibility. Meanwhile, the units that have relatively higher coal consumption rate, such as Units 5 and 6, have a lower output.
Figure 9. Power deviation for industrial users providing AS in real-time scheduling.
Energies 08 03955 g009
Figure 10. (a) Output of unit 2 in real-time scheduling; (b) Output of unit 5 in real-time scheduling; (c) Output of unit 6 in real-time scheduling.
Energies 08 03955 g010

6. Conclusions

In this paper, we designed an integrated power management method that implements supply and demand side resources based on actual status of China’s AS scheduling, and proposed an agent-based model considering generation, industrial users and grid agents. Two case studies on day-ahead and real-time scheduling verified that the capability of industrial users to participate in the provision of AS.
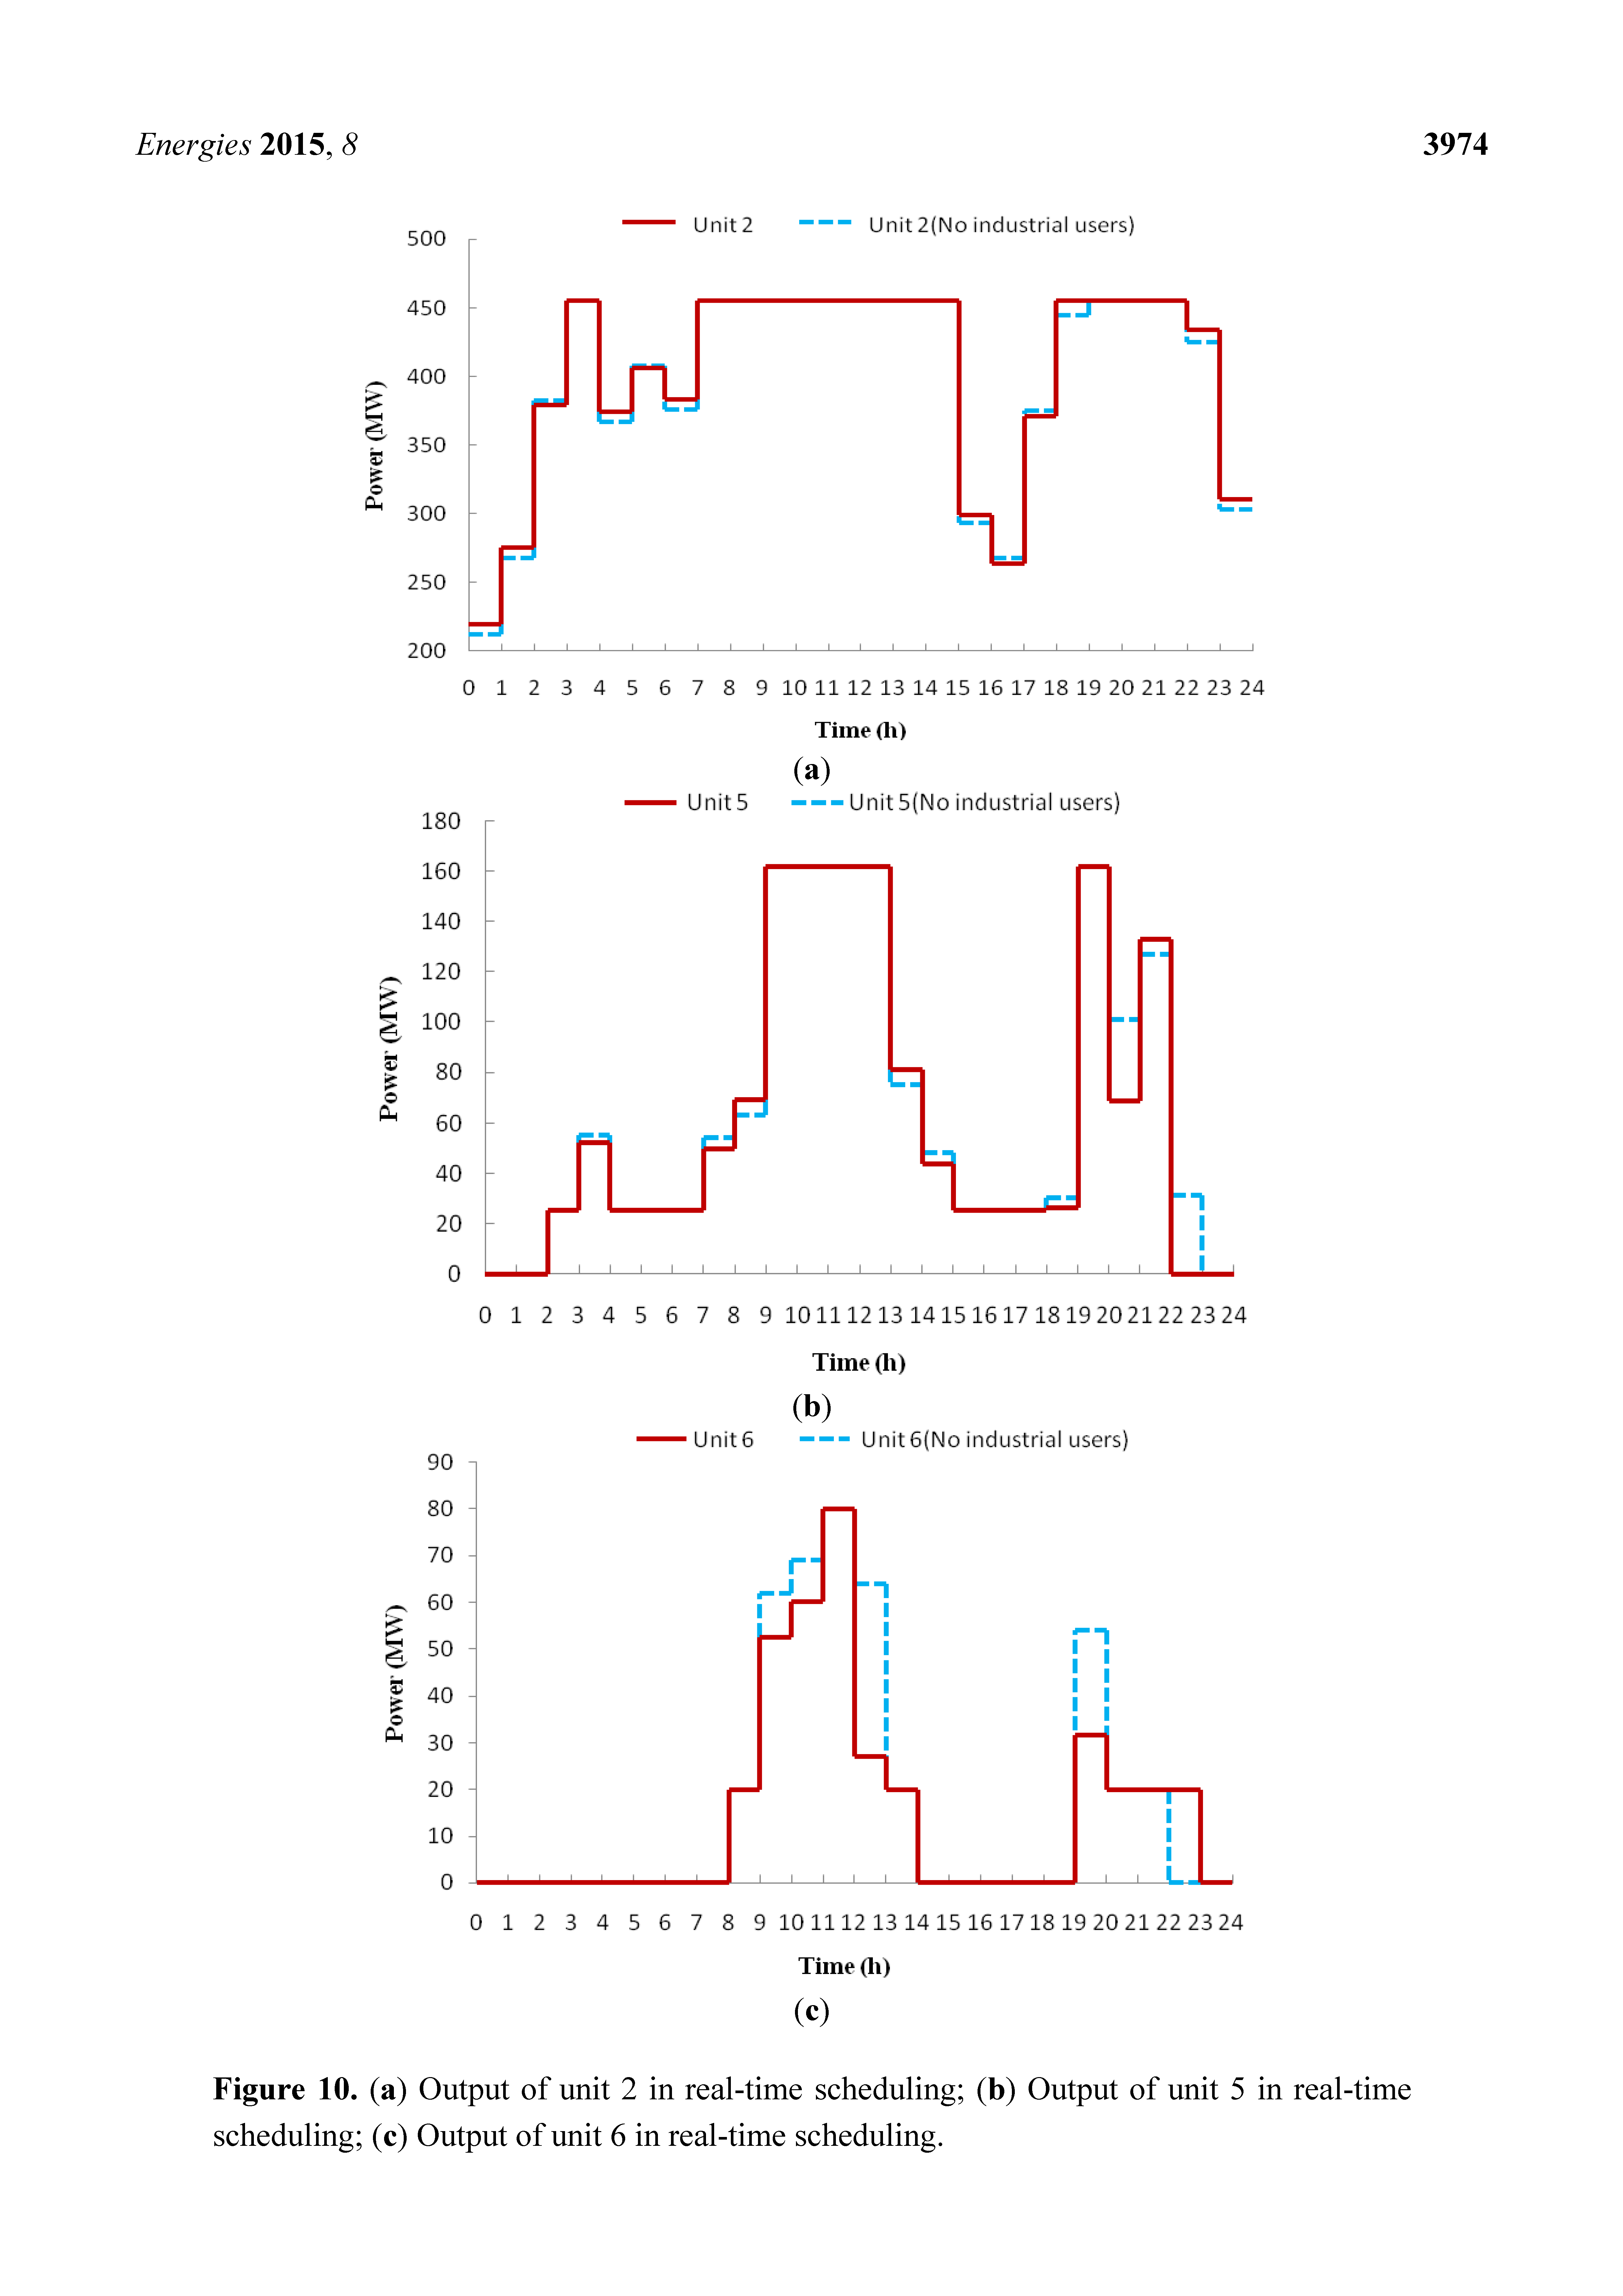
In day-ahead scheduling, this paper considered the pricing mechanism of peak-valley electricity price and analyzed the impact of industrial responsive loads during the peak and valley periods. It was found, that the participation of industrial users replaced some of the output of the two peak-load units with the highest coal consumption rate and therefore reduced the total system cost associated to the provision of AS. In real-time scheduling case, peak-regulating units had more flexibility to respond to the load imbalances with the help from flexible industrial users, and the output from the higher coal consumption units decreased. In both of the two case studies, the coal consumption rate and load factors were both improved due to the contributions of demand side resources. Through this approach, it can be concluded that aluminum smelter plants are more suitable for participation in real-time AS scheduling, and cement plants, having more responsive devices and storage capacity have more flexibility in day-ahead AS scheduling. Without significant benefits, industrial users are unwilling to modify the existing production processes and therefore to provide flexibility to the grid. A relatively efficient incentive mechanism is essential, and it should be specially designed for industrial users.

Acknowledgments

This work is sponsored by State Grid Science and Technology Program (XMERI2010KJKF001421) and the Fundamental Research Funds for Central Universities (2012YJS111). The authors gratefully acknowledge the contributions of Yichuan Power Group Corporation and ShenHuo Group Ltd. in Henan province, enterprises engaging in aluminum processing throughout China.

Author Contributions

Mingtao Yao and Zhaoguang Hu have built the agent-based model, Froylan Sifuentes and Ning Zhang have improved the models and built the scenario simulation and done the simulation analysis.

Conflicts of Interest

The authors declare no conflict of interest.

References

  1. China Electricity Council. Electric Power Industry Statistical Manual 2012; China Electricity Council: Beijing, China, 2013. [Google Scholar]
  2. State Grid Energy Research Institute. The Analysis Report of Energy Conservation and Power Saving in China; China Electric Power Press: Beijing, China, 2014. [Google Scholar]
  3. US Department of Energy. Load Participation in Ancillary Service; US Department of Energy: Washington, DC, USA, 2011.
  4. Mehta, N.; Sinitsyn, N.A.; Backhous, S.; Lesieutre, B.C. Safe control of thermostatically controlled loads with installed timers for demand side management. Energy Convers. Manag. 2014, 86, 784–791. [Google Scholar] [CrossRef]
  5. Aghaei, J.; Alizadeh, M. Demand response in smart electricity grids equipped with renewable energy sources: A review. Renew. Sustain. Energy Rev. 2013, 18, 64–72. [Google Scholar] [CrossRef]
  6. Hao, H.; Lin, Y.S.; Kowli, A.S.; Barooah, P.; Meyn, S. Ancillary service to the grid through control of fans in commercial building HVAC systems. IEEE Trans. Smart Grid 2014, 5, 2066–2074. [Google Scholar] [CrossRef]
  7. Nistor, S.; Wu, J.Z.; Sooriyabandara, M.; Ekanayake, J. Capability of smart appliances to provide reserve services. Appl. Energy 2015, 1388, 590–597. [Google Scholar] [CrossRef]
  8. Keep, T.M.; Sifuentes, F.E.; Auslander, D.M.; Callaway, D.S. Using load switches to control aggregated electricity demand for load following and regulation. In Proceedings of the 2011 IEEE Power and Energy Society General Meeting, San Diego, CA, USA, 24–29 July 2011.
  9. Zakariazadeh, A.; Jadid, S.; Siano, P. Integrated operation of electric vehicles and renewable generation in a smart distribution system. Energy Convers. Manag. 2015, 89, 99–110. [Google Scholar] [CrossRef]
  10. Ma, O.; Alkadi, N.; Coppers, P.; Denholm, P.; Dudley, J.; Goli, S.; Hummon, M.; Kiliccote, S.; Macdonald, J.; Matson, N.; et al. Demand response for ancillary services. IEEE Trans. Smart Grid 2013, 4, 1988–1995. [Google Scholar] [CrossRef]
  11. Paulus, M.; Borggrefe, F. The potential of demand-side management in energy-intensive industries for electricity markets in Germany. Appl. Energy 2011, 88, 432–441. [Google Scholar] [CrossRef]
  12. Olsen, D.; Goli, S.; Faulkner, D.; Mckane, A.T. Opportunities for Energy Efficiency and Demand Response in the California Cement Industry; LBNL-4849E; Lawrence Berkeley National Laboratory: Berkeley, CA, USA, 2010. [Google Scholar]
  13. Swanepoel, J.A.; Mathews, E.H.; Vosloo, J.; Liebenberg, L. Integrated energy optimisation for the cement industry: A case study perspective. Energy Conver. Manag. 2014, 78, 765–775. [Google Scholar] [CrossRef]
  14. Todd, D.; Caufield, M.; Helms, B.; Starke, M.R.; Kirby, B.J.; Kueck, J.D. Providing Reliability Services Through Demand Response: A Preliminary Evaluation of the Demand Response Capabilities of Alcoa Inc.; ORNL/TM-2008/233; Federal Energy Regulatory Commission: Washington, DC, USA, 2009. [Google Scholar]
  15. Jiang, H.; Lin, J.; Song, Y.H.; Gao, W.; Xu, Y.; Shu, B.; Li, X.; Dong, J. Demand side frequency control scheme in an isolated wind power system for industrial aluminum smelting production. IEEE Trans. Power Syst. 2014, 29, 844–853. [Google Scholar] [CrossRef]
  16. Alcazar-Ortega, M.; Alvarez-Bel, C.; Escrivá-Escrivá, G.; Domijan, A. Evaluation and assessment of demand response potential applied to the meat industry. Appl. Energy 2012, 92, 84–91. [Google Scholar] [CrossRef]
  17. State Electricity Regulatory Commission of China (SERC). Interim Measures for Ancillary Services Management of Grid-Connected Power Plant; SERC: Beijing, China, 2006. [Google Scholar]
  18. Aunedi, M.; Kountouriotis, P.A.; Calderon, J.E.O.; Angeli, D.; Strbac, C. Economic and environmental benefits of dynamic demand in providing frequency regulation. IEEE Trans. Smart Grid 2013, 4, 2036–2048. [Google Scholar] [CrossRef]
  19. Kirby, B.; Starke, M.; Adhikari, S. NYISO Industrial Load Response Opportunities: Resource and Market Assessment-Task 2 Final Report; ORNL/TM-2009/147; Oak Ridge National Laboratory: Oak Ridge, TN, USA, 2009. [Google Scholar]
  20. Samad, T.; Kiliccote, S. Smart grid technologies and applications for the industrial sector. Comput. Chem. Eng. 2012, 47, 76–84. [Google Scholar] [CrossRef]
  21. Chen, H. Steady-State Analysis of Power System; China Electric Power Press: Beijing, China, 2007. [Google Scholar]
  22. National demand side management platform. Available online: http://portal.dsm.gov.cn (accessed on 12 June 2014).
  23. Garcia, A.M.; Kessler, M.; Bueso, M.C.; Fuentes, J.A.; Gómez-Lázaro, E.; Faura, F. Modeling aluminum smelter plants using sliced inverse regression with a view towards load flexibility. IEEE Trans. Power Syst. 2011, 26, 282–293. [Google Scholar] [CrossRef]
  24. Madlool, M.A.; Saidur, R.; Hossain, M.S. A critical review on energy use and savings in the cement industries. Renew. Sustain. Energy Rev. 2011, 15, 2042–2060. [Google Scholar] [CrossRef]
  25. Electricity Regulatory Bureau of Northeast China. Implementation Guidelines for Ancillary Services Management of Grid-Connected Power Plant in Northeast China; Electricity Regulatory Bureau of Northeast China: Shenyang, China, 2011. [Google Scholar]
  26. Electricity Regulatory Bureau of North China. Implementation Guidelines for Ancillary Services Management of Grid-Connected Power Plant in North China; Electricity Regulatory Bureau of North China: Beijing, China, 2011. [Google Scholar]
  27. Electricity Regulatory Bureau of Central China. Implementation Guidelines for Ancillary Services Management of Grid-Connected Power Plant in Central China; Electricity Regulatory Bureau of Central China: Wuhan, China, 2011. [Google Scholar]
  28. Electricity Regulatory Bureau of East China. Implementation Guidelines for Ancillary Services Management of Grid-Connected Power Plant in East China; Electricity Regulatory Bureau of East China: Shanghai, China, 2011. [Google Scholar]
  29. Electricity Regulatory Bureau of Northwest China. Implementation Guidelines for Ancillary Services Management of Grid-Connected Power Plant in Northwest China; Electricity Regulatory Bureau of Northwest China: Xi’an, China, 2011. [Google Scholar]
  30. Turkay, B.E.; Zeybekoglu, Y. An enhanced particle swarm optimization approach for the unit commitment problem. In Proceedings of the 2011 7th International Conference on IEEE Electrical and Electronics Engineering, Bursa, Turkey, 1–4 December 2011; pp. 1198–1202.
  31. Saber, A.Y.; Venayagamoorthy, G.K. Intelligent unit commitment with vehicle-to-grid—A cost-emission optimization. J. Power Sources 2010, 195, 898–911. [Google Scholar] [CrossRef]
  32. Yan, S.; Chang, J.; Cheng, L. The New Type Dry Cement Process Design Manual; China Building Material Press: Beijing, China, 2007. [Google Scholar]

