1. Introduction
One of the most well-known and currently preferred renewable energy sources is wind power. The wind power resource is on average 50% higher offshore than onshore; however, the cost to install and run offshore wind power units is around double [
1]. This has raised the challenge of optimizing the economical perspectives of offshore wind power. The generation of wind power is mainly located in areas within a distance of 5−50 km from the coastline, where the water depth is generally greater than 20 m. Studies have shown that the traditional fixed foundations will not be economically viable for offshore wind turbines in waters deeper than 30 m [
2], which is why the concept of a floating foundation is a promising alternative. Four main concept types have been developed: semi-submersible, TLP, spar buoy and barge [
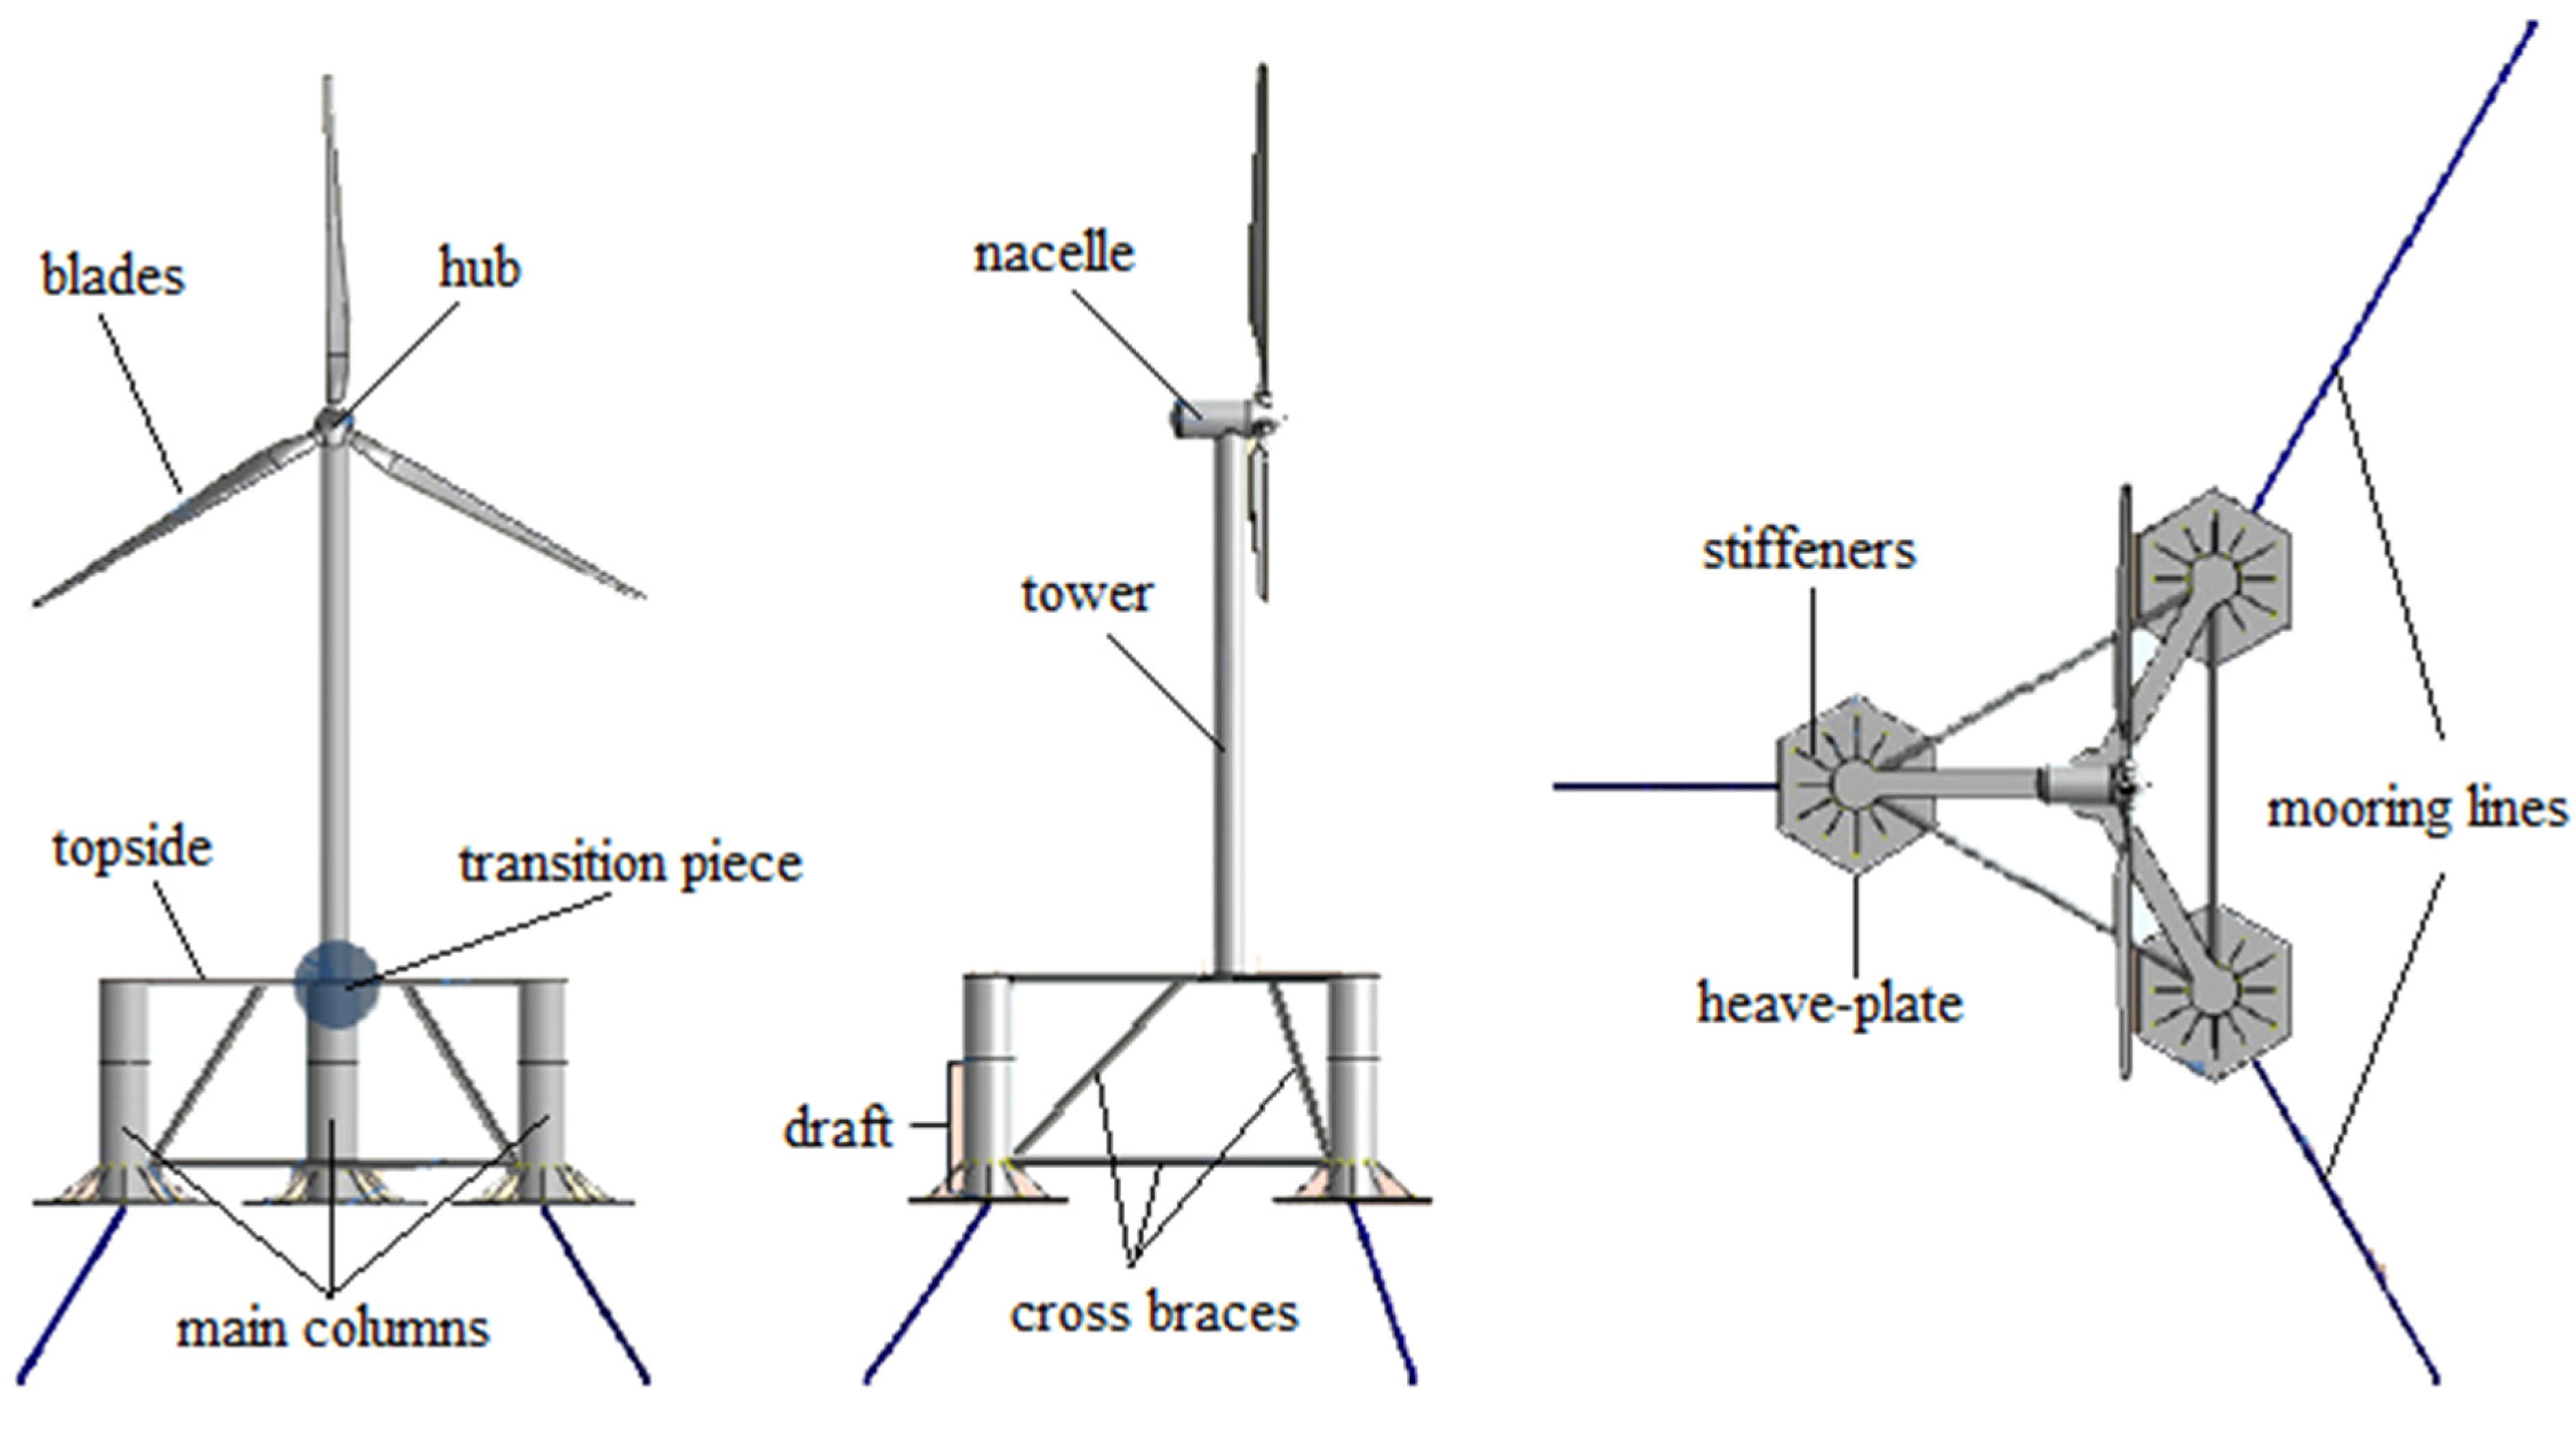
3]. This paper will focus on the conceptual semi-submersible prototype, see
Figure 1.
Figure 1.
Conceptual semi-submersible prototype.
Figure 1.
Conceptual semi-submersible prototype.
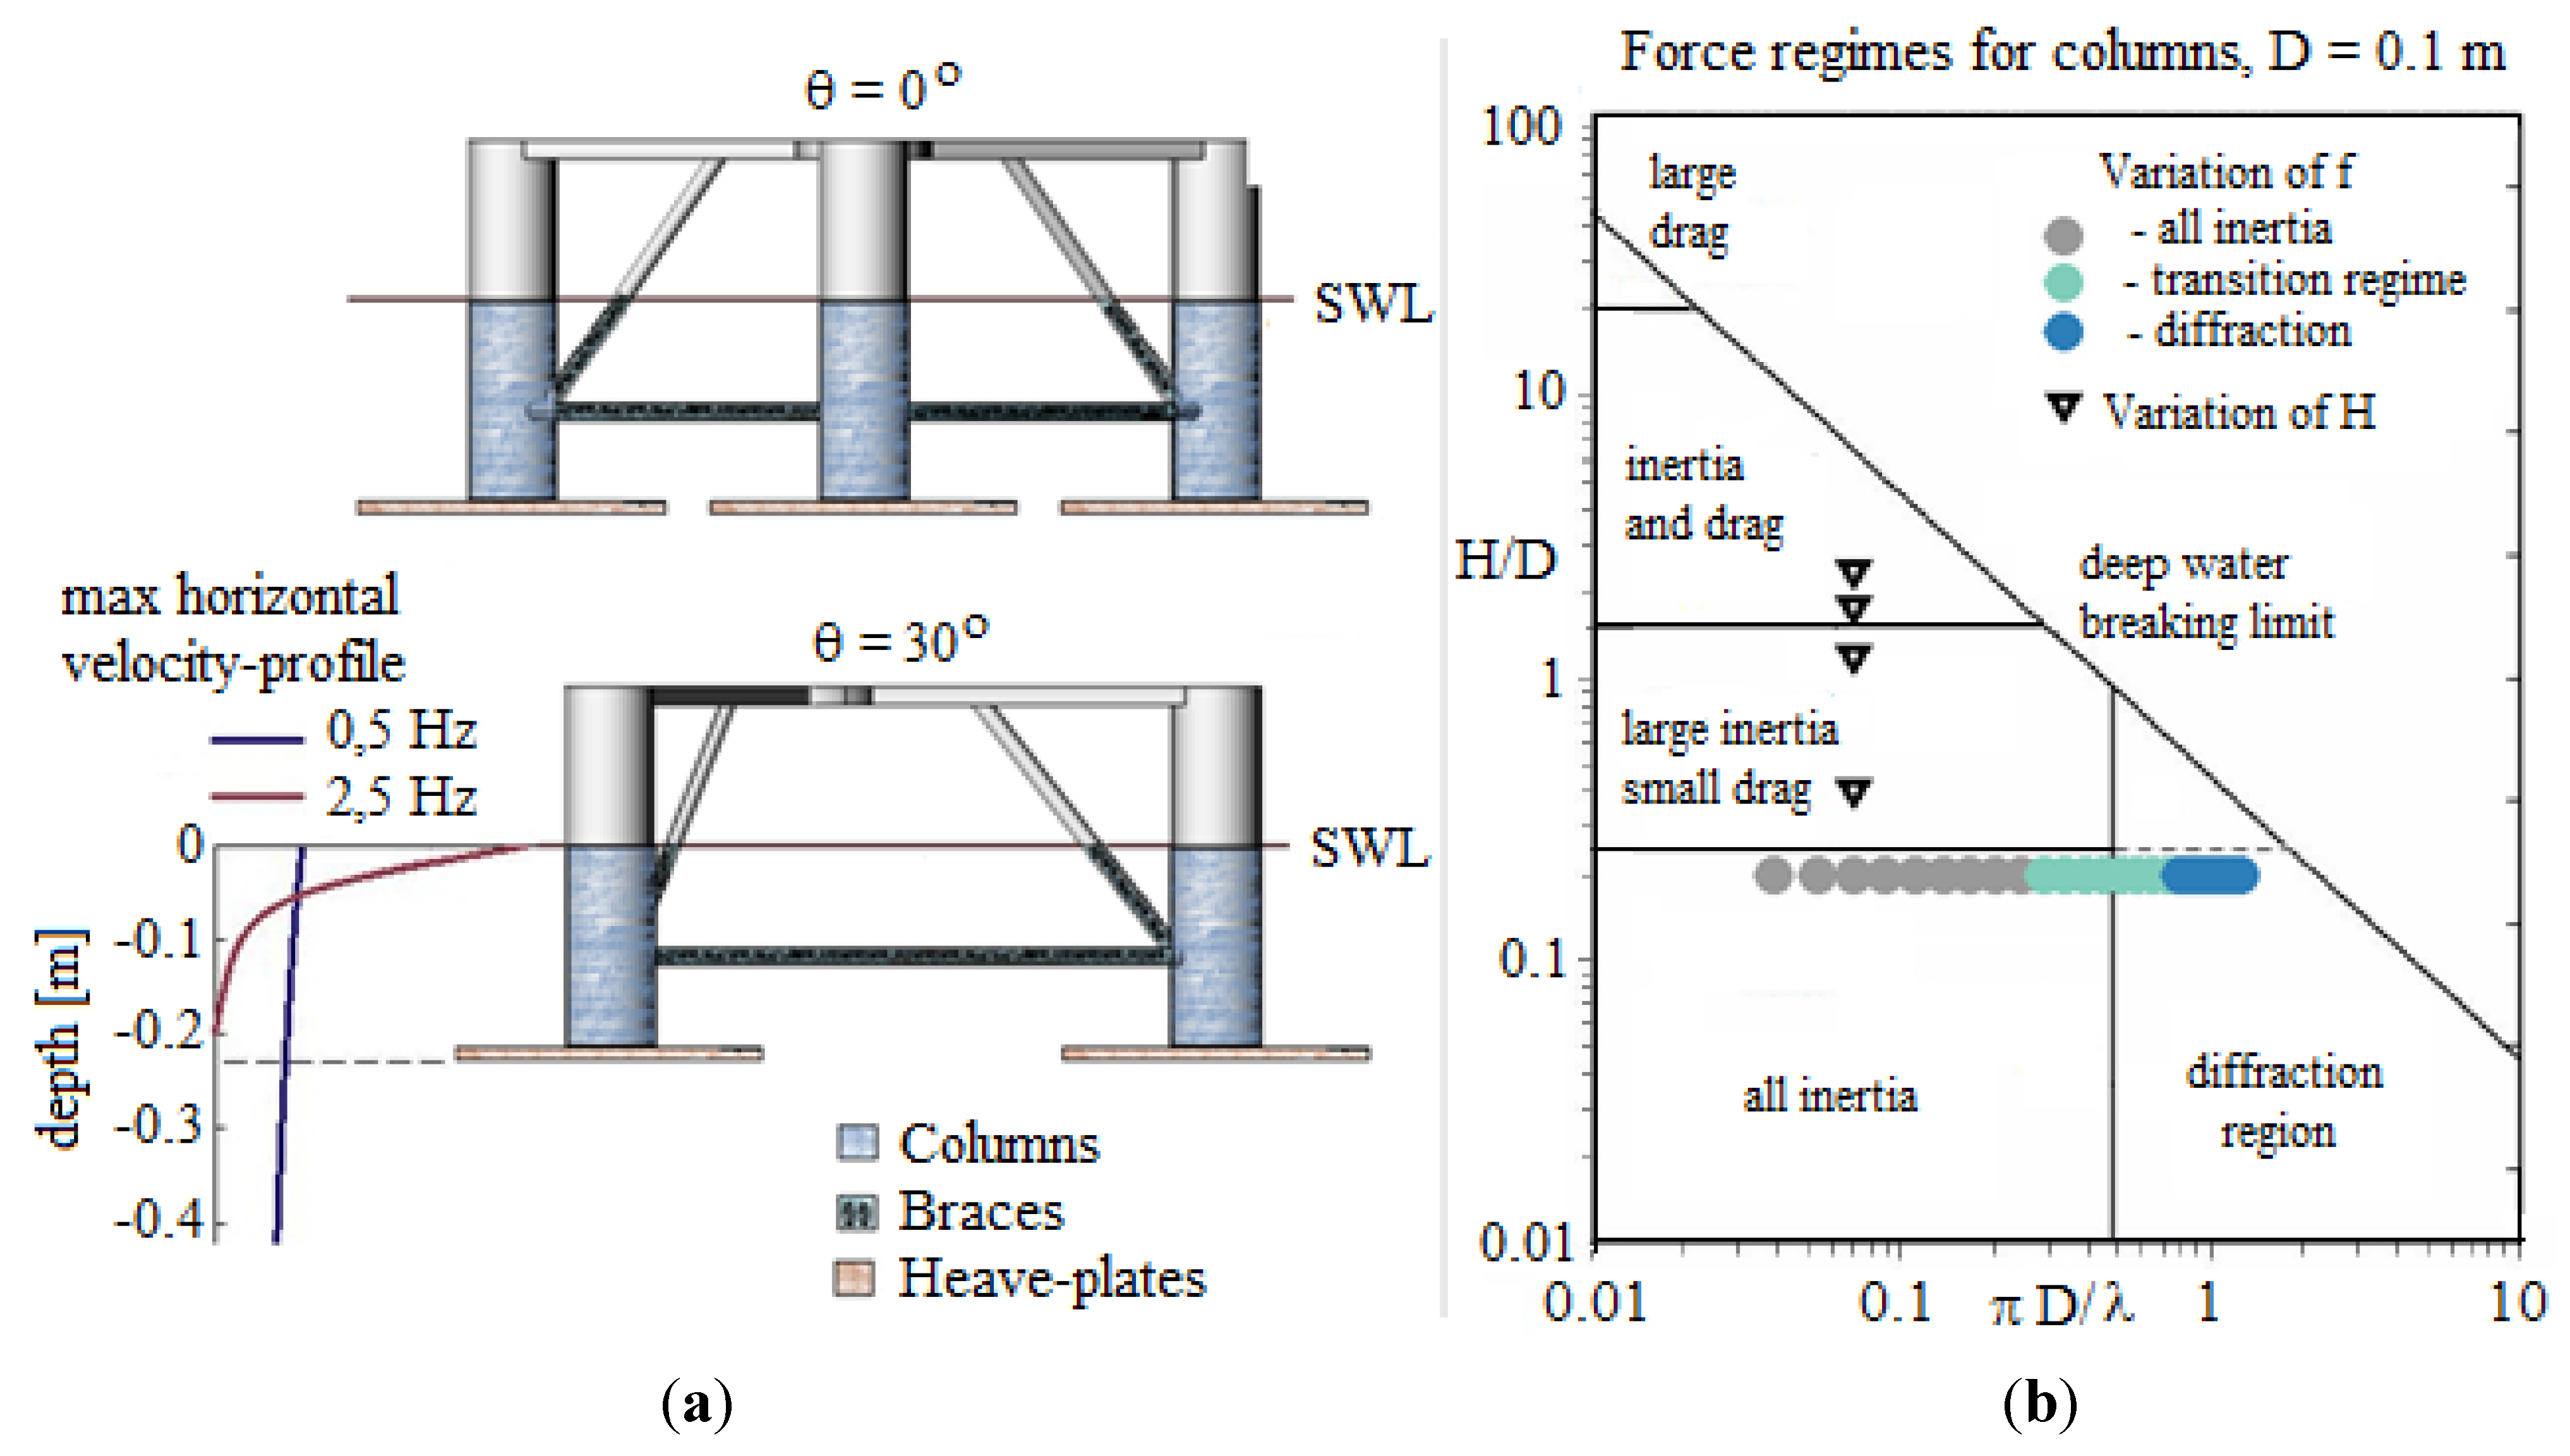
As conceptual designs of floating foundations are proposed, the evaluation of structural response is of high priority and a key element in the design [
4]. This requires a fundamental determination and physical understanding of the wave force acting on the structure. One of the important parameters due to its high influence on hydrodynamic impact is the geometry. The dominating wave force regimes on cylindrical structures depend on the ratios of wave height to column diameter (H/D) and of column diameter to wavelength (D/L) [
5]. For many reasons like separation, reflection, omni-directionality, three-dimensionality, turbulence, diffraction, refraction, flow-induced vibrations,
etc., a full structural design is beyond current computational capacity [
6], so the current design philosophy for wave induced loads is often determined by empirical or first principle calculations of simple models and geometry (such as Morison [
7]), which is why the validity of the applied methods for more complex structures is questionable [
8].
In a recent test campaign on a semi-submersible 1/50 scale model in a wave basin, the recommendation was more research focusing on validation of the hydrodynamic loads by component-level tests [
8]. Further, the modelling of wave loads by a definition of the wave spectrum is seen as a sufficient approach to a given design. A frequency domain analysis shows that specific wave periods of regular waves and the direction of incident waves have significant effects on the excitation forces and motion of the structure [
9]. The analysis of the global motion response for a semi-submersible floating wind turbine has previously been examined [
10]. The study concluded that an uncoupled frequency domain analysis was sufficient to assess the global motion response as long as the aerodynamic forces were taken into account. For numerical evaluation of wave/structure interaction, the Boundary Element Method (BEM) is used to compute diffraction/radiation theory in related studies of wave force on a semi-submerged platform [
11].
This paper deals with experimental analysis of the wave excitation force in surge on a conceptual prototype model of a semi-submersible foundation for an offshore wind turbine from Ramboll [
12]. The concept is considered in three structural parts: columns (primary), heave-plates (secondary) and braces (tertiary). Because of the complex geometry, it is appropriate to analyse the excitation of wave induced loads on the structure in a component level test by analysing the influence of different parameters. The wave basin model test (Froude-based scale; 1/80) is conducted to observe and examine the wave load in surge. The model was fixed to simplify the influence of dynamic parameters by neglecting the motions.
The wave induced load is measured and compared with computed results of the diffraction/radiation problem in the open source BEM code, Nemoh [
13], in order to obtain a feasible difference of simplified calculations of a complex geometric structure. Nemoh is based on linear diffraction theory, which neglects viscous effect. The diffraction effects are expected to be dominating due to the ratios H/D (0.01 < H/D < 1.5) and D/L (πD/L > 0.5), which make Nemoh applicable for the numerical computation. The model scaled experiment will together with the computed Nemoh results provide the basis of a parametrical analysis of the influence of a complex geometry on the excitation force in surge on a floating foundation prototype.
Table 1 lists the parameter variation ranges.
Table 1.
Parameters of tested wave set.
Table 1.
Parameters of tested wave set.
| Parameter | Range | Ratio | Range |
|---|
| Wave height (H) | 2 cm–16 cm | π D/L (diffraction parameter) | 0.05–1.26 |
| Wave period (T) | 0.4 s–2.5 s |
| Wave length (L) | 0.25 m–5.87 m | H/D (wave steepness) | 0.20–1.60 |
| Incident wave direction (θ) | 0°–90° |
3. Experimental Setup
The experiments were conducted in a wave basin at The Hydraulic and Coastal Engineering Laboratory, Aalborg University, Denmark between 11/8-2014 and 26/9-2014. The software Awasys 6 [
16] controls the wave maker by inputs of f and H. Measurements of H by wave gauges are used in data processing. The tests were conducted with a water depth of 0.65 m and a temperature of ~20 °C.
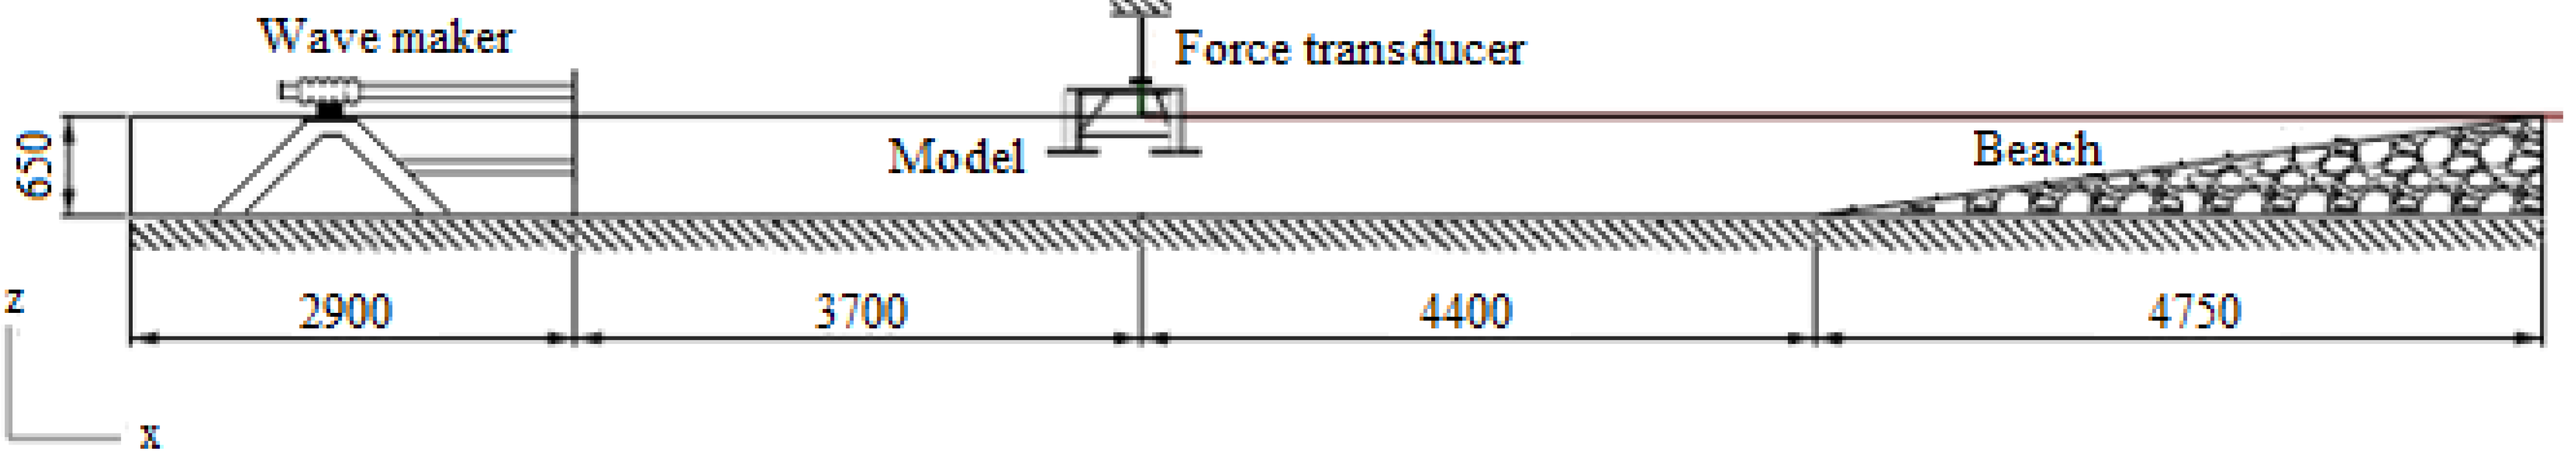
Figure 4 illustrates the test setup. The wave maker is at one end of the basin with an absorbing gravel beach installed at the opposite end.
Figure 4.
Illustration of experimental setup of wave basin [mm].
Figure 4.
Illustration of experimental setup of wave basin [mm].
The paddle system is of the snake front type with translator movements. A Multi-Axis Force/Torque (FT) Sensor (ATI F/T: Delta IP65, 330-30:
http://www.ati-ia.com/products/ft/ft_ models.aspx?id=Delta) is mounted on top of the model and rigidly connected to the support by stiffeners. The FT measures all six components of force and torque from all three axes (x, y, and z).
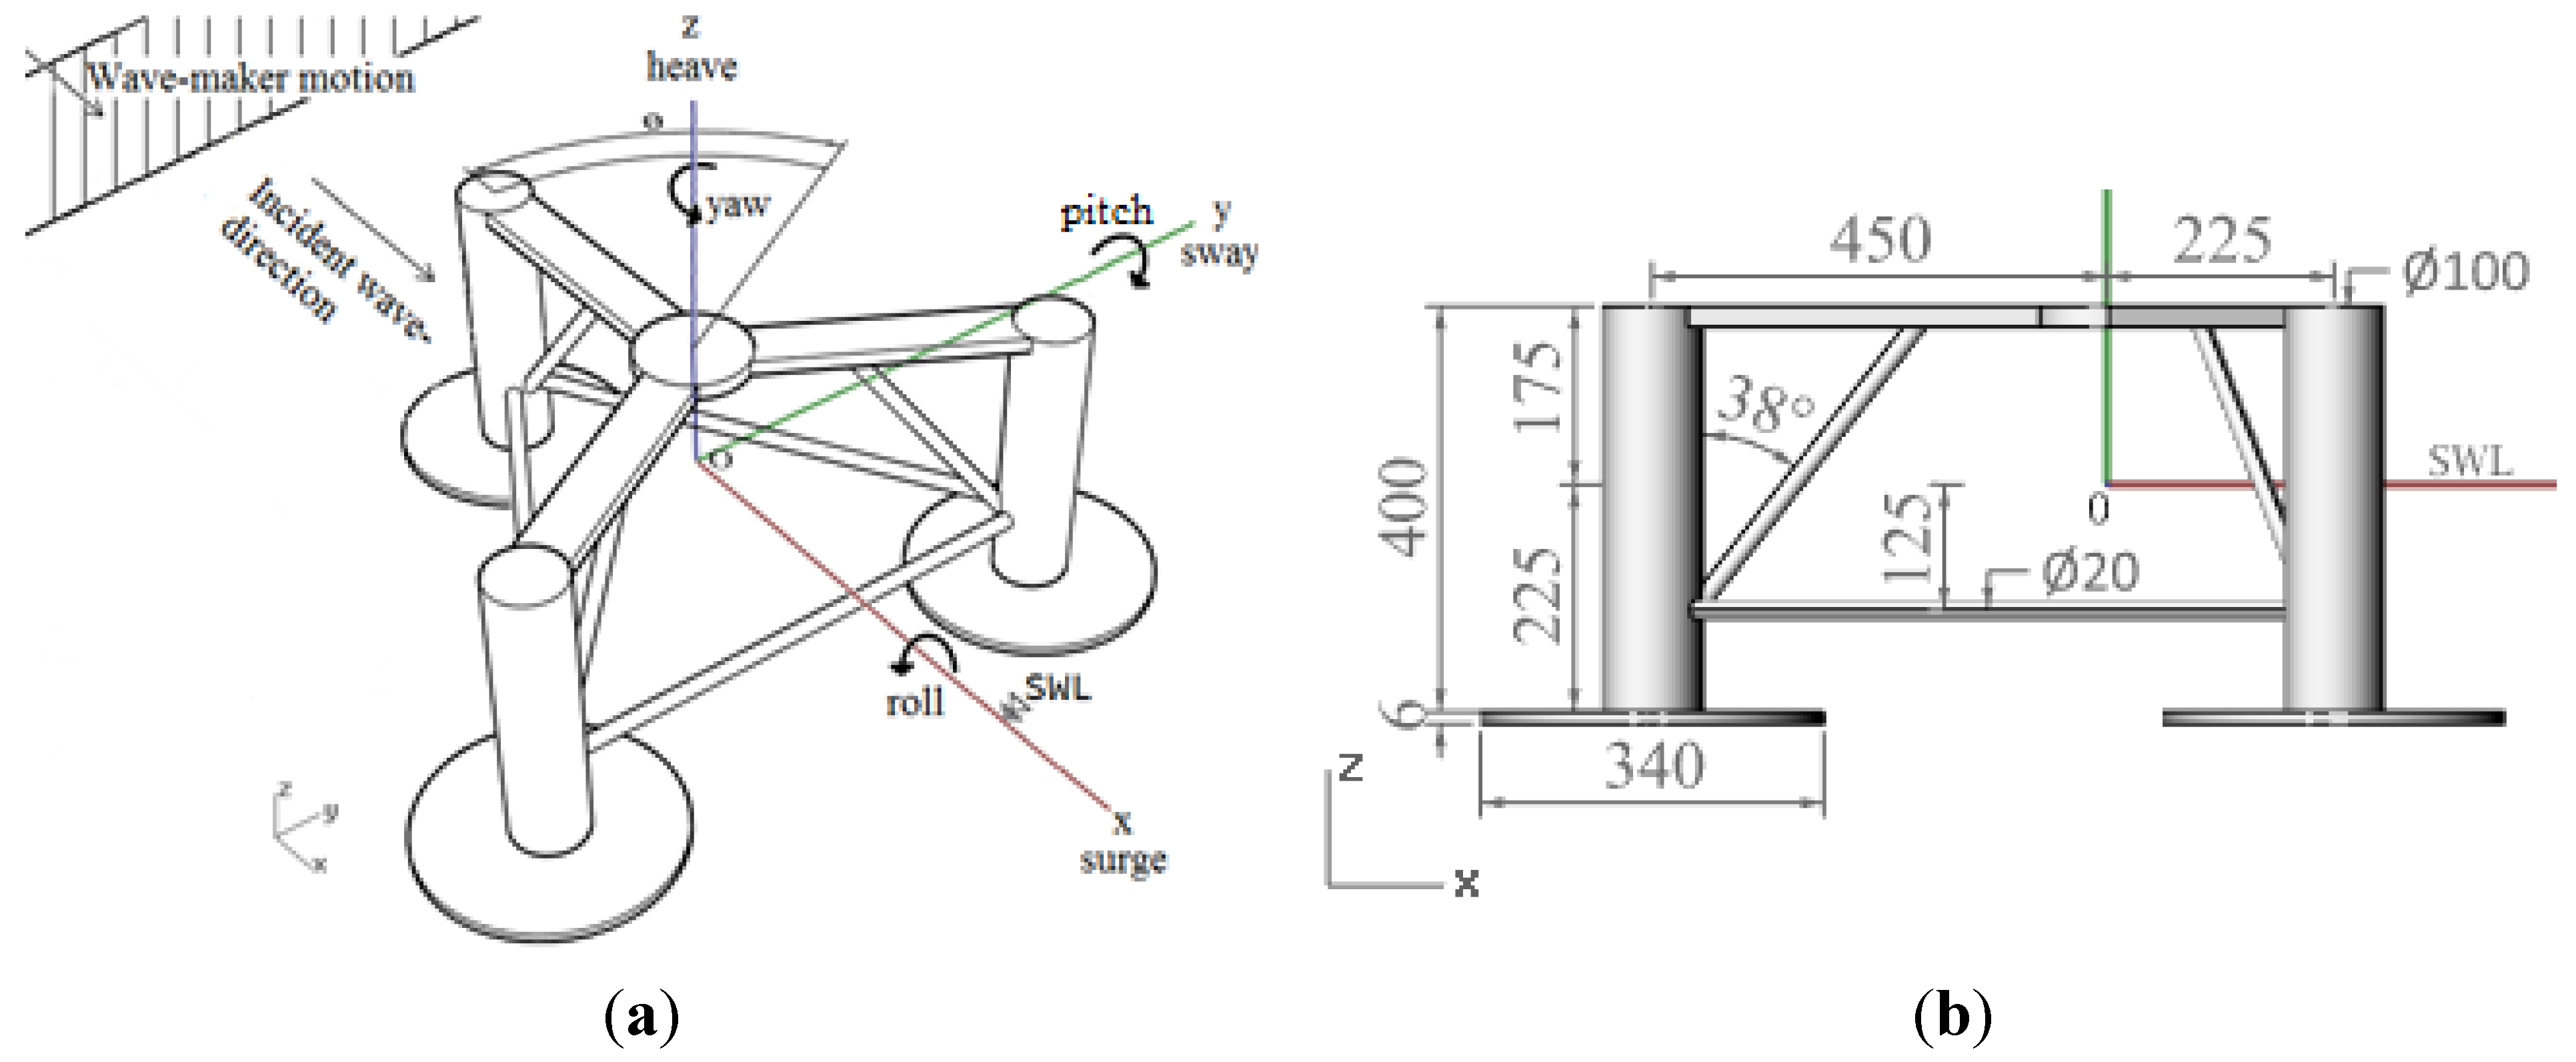
The origin is placed at the centre of the structure at SWL, as seen in
Figure 5. All results have the origin as point of reference. Froude-based scaling of a conceptual prototype is applied.
Table 3 shows the model specifications.
Figure 5.
(
a) Notation of DoFs according to [
5]; (
b) model dimensions [mm].
Figure 5.
(
a) Notation of DoFs according to [
5]; (
b) model dimensions [mm].
Table 3.
Model specifications.
Table 3.
Model specifications.
| Scale: ~1/80 | Model | Prototype |
|---|
| Weight | 7.45 kg | 3469 ton |
| CoG, z(SWL = 0 m) | −37 mm | 2.16 m |
| Draft | 225 mm | 18.00 m |
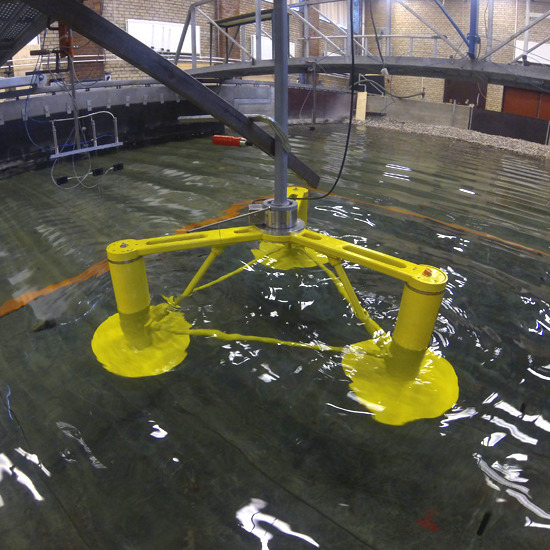
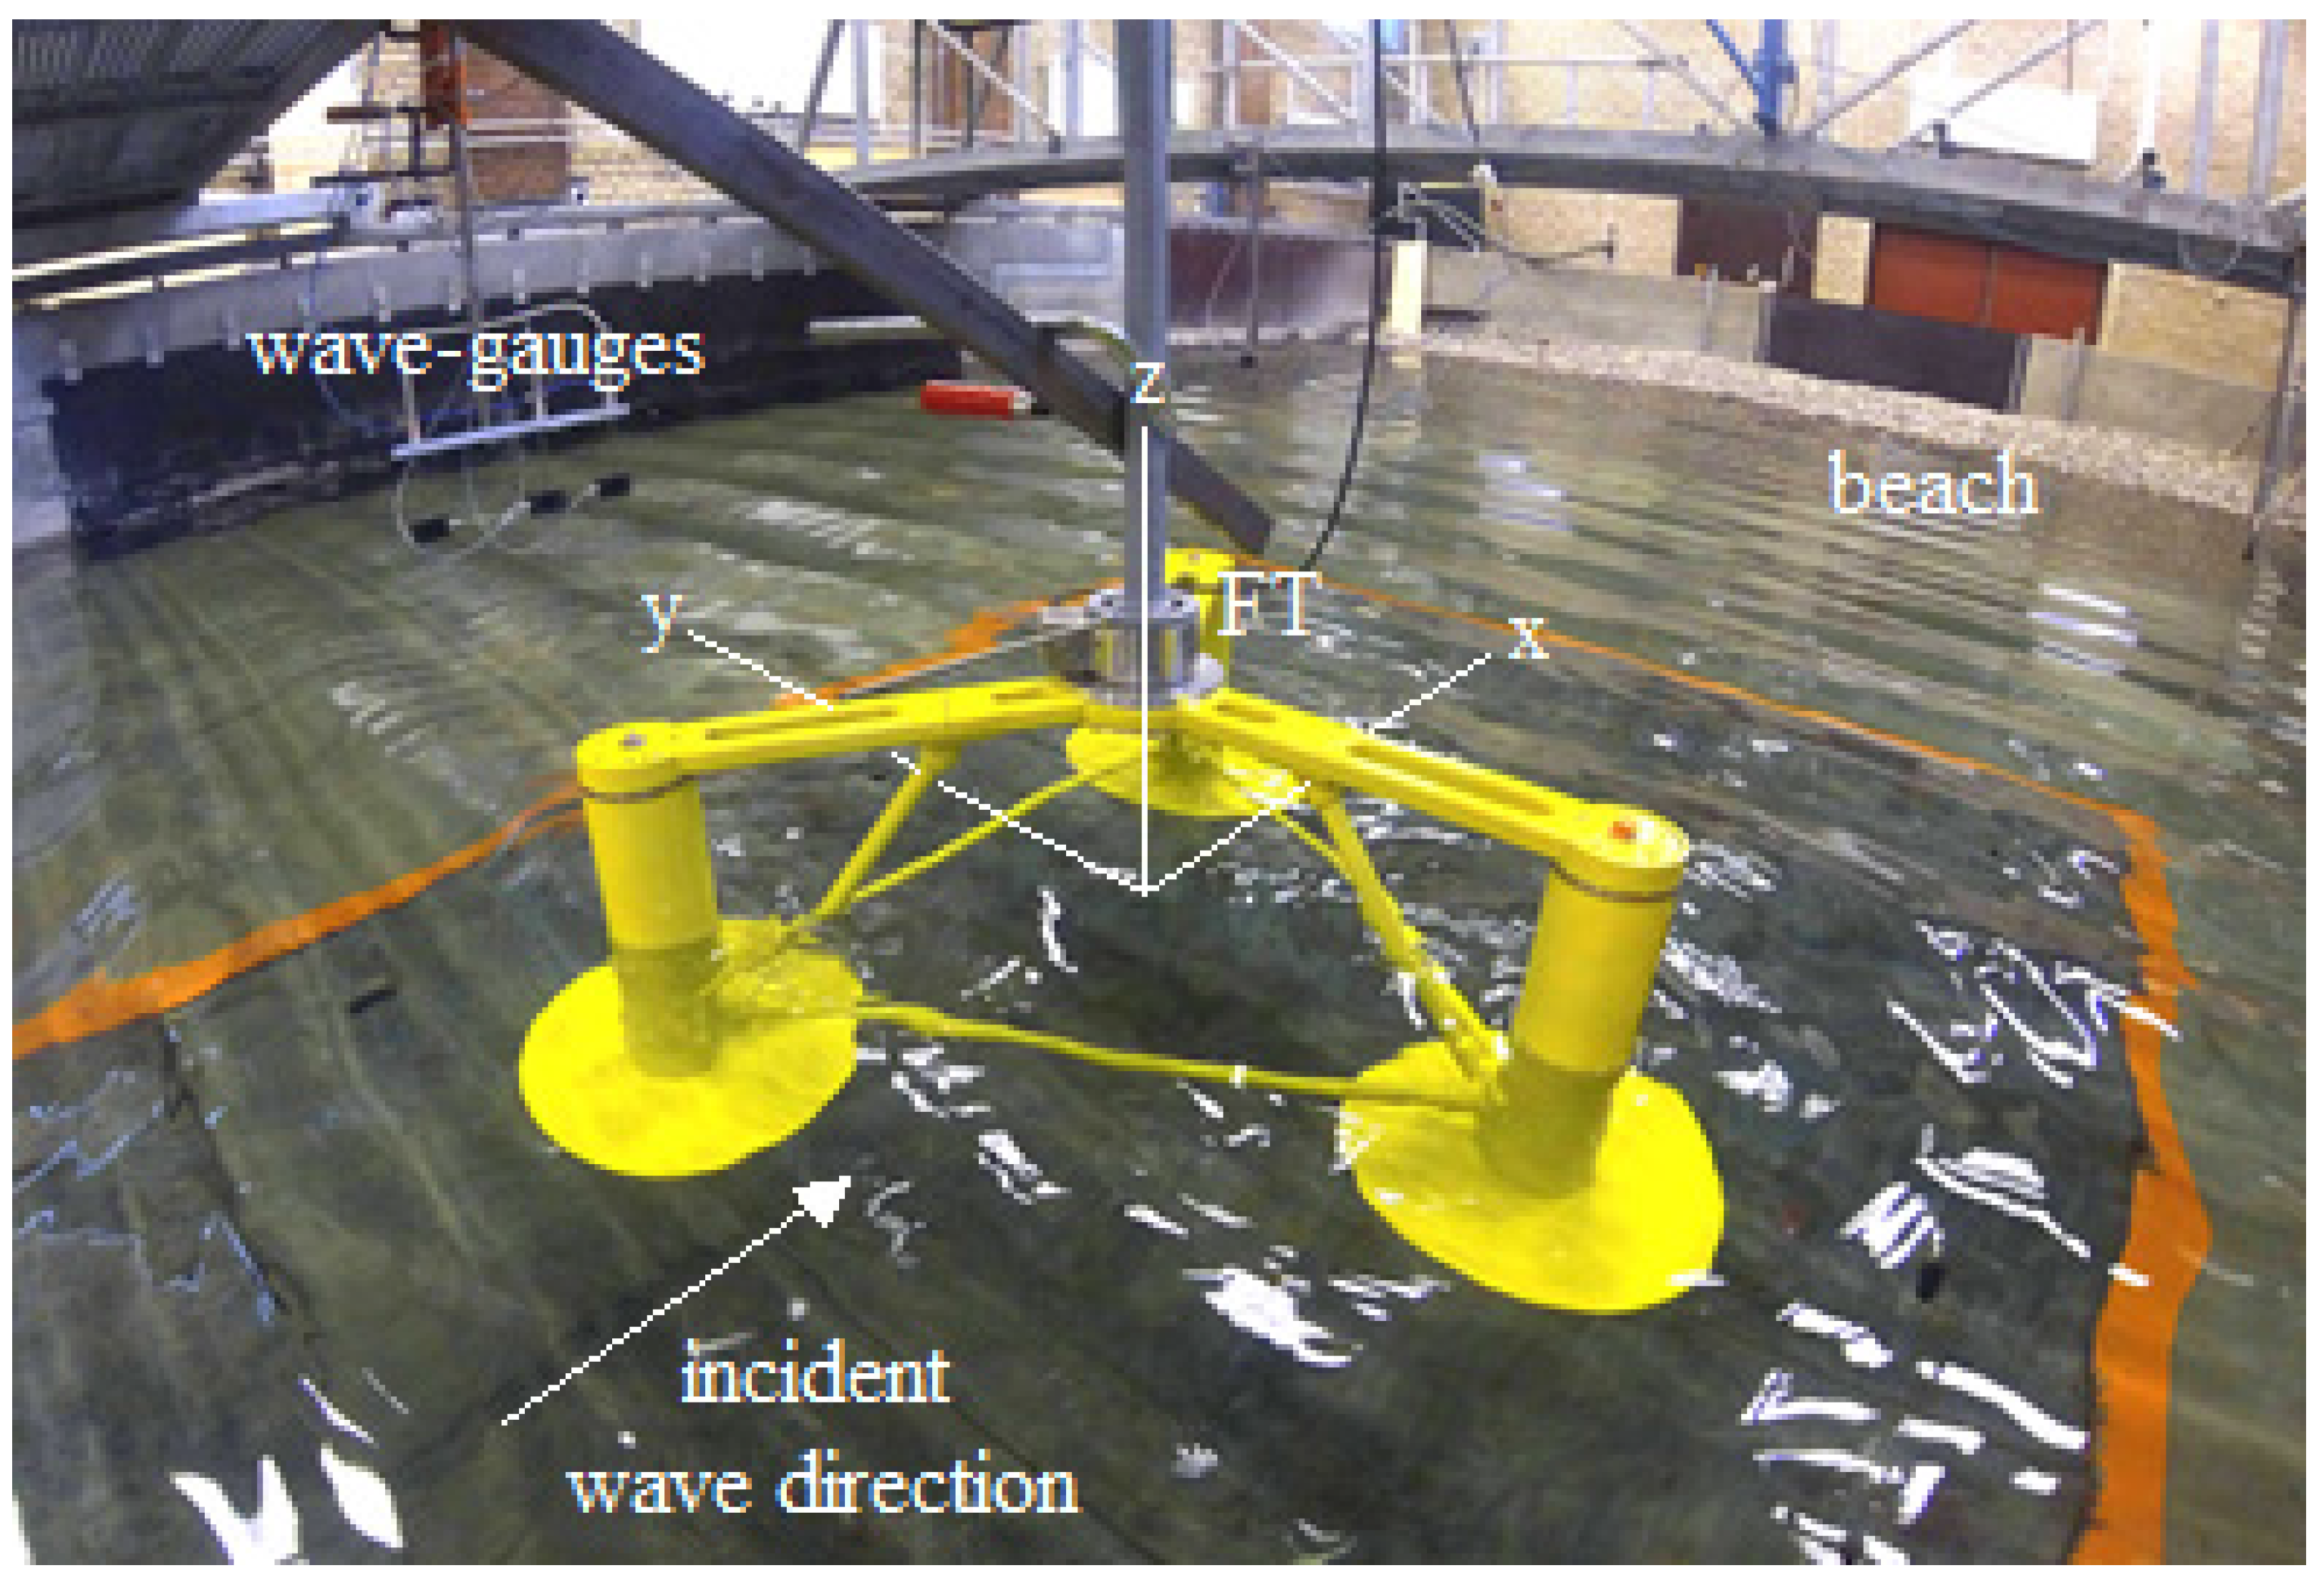
Wave gauges are placed in the same distance from the wave maker as the model, but 2 m a side, see
Figure 6.
Figure 6.
Picture of the model in the wave basin with illustration of the x-, y- and z-axis.
Figure 6.
Picture of the model in the wave basin with illustration of the x-, y- and z-axis.
4. Results
For data processing, an FFT analysis of the measuring signal is applied in the determination of T, H and force amplitude in surge (Fx). The results are presented in graphs showing the parameters θ, f, H and modification of structure. All plots are normalized with respect to density (ρ), gravity (g), wave height (H), column radius (a) and water depth (d).
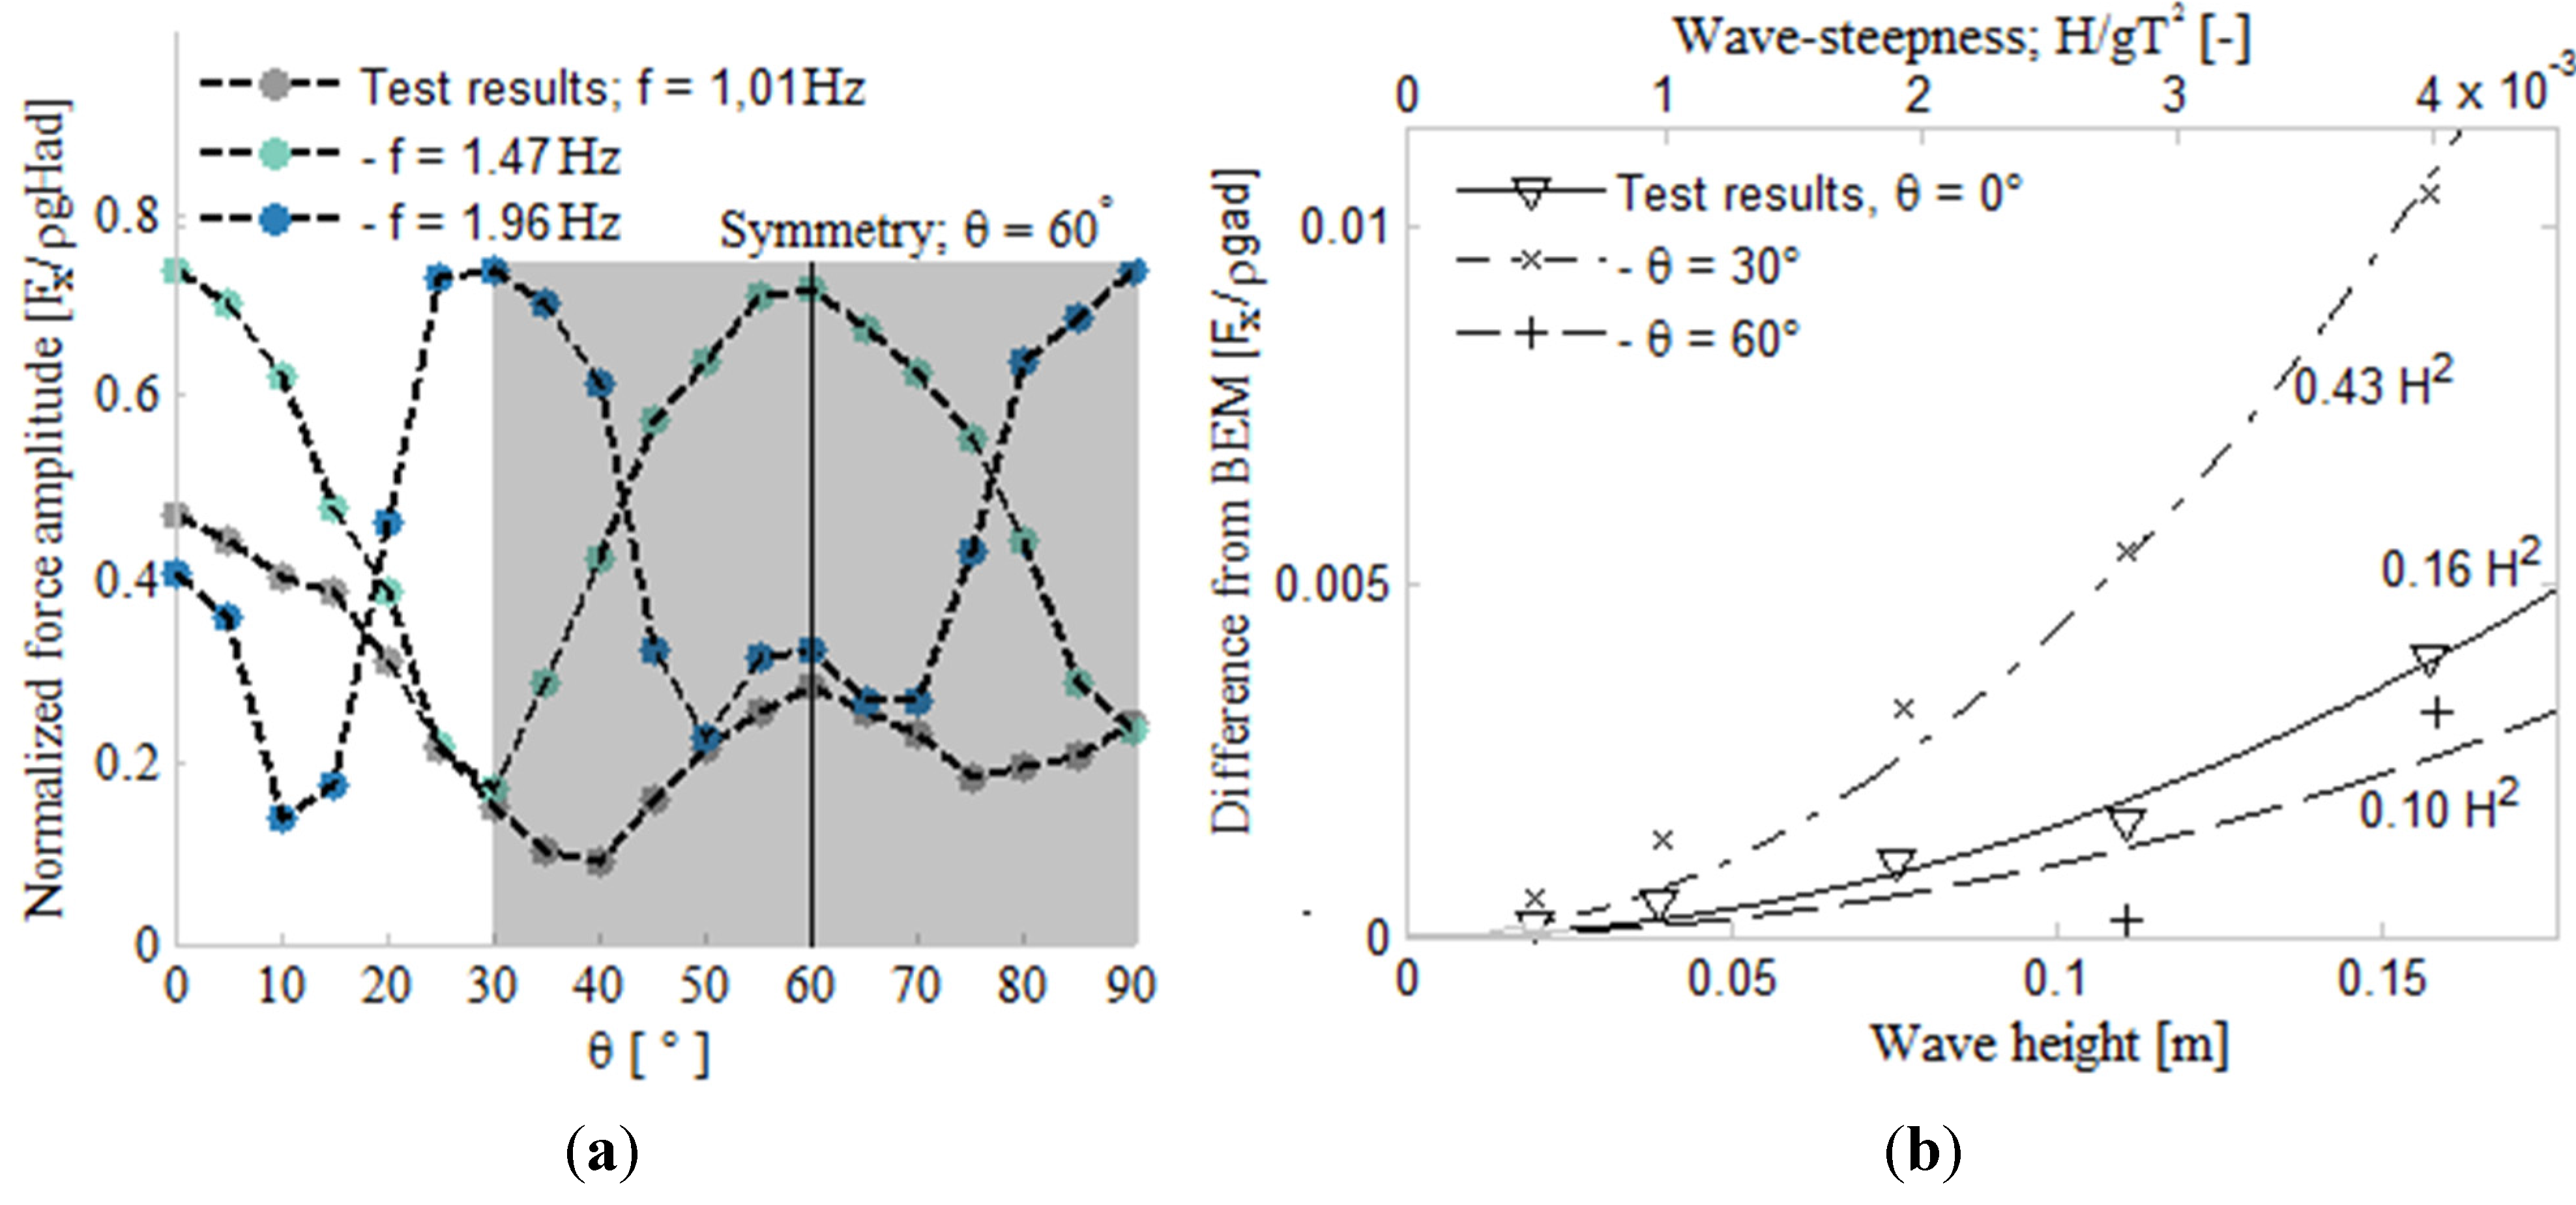
Figure 7.
(a) Variation of Fx against θ on model with heave-plates (b) Fx, difference between test results with heave-plates and Nemoh by increasing H.
Figure 7.
(a) Variation of Fx against θ on model with heave-plates (b) Fx, difference between test results with heave-plates and Nemoh by increasing H.
As presented in
Section 2, the scatter plot and test results symbols are linked to the variation of f (interval of 0.1 Hz) and, thereby, the dominant force regime, see
Figure 2b.
Figure 7a shows the normalized F
x by the influence of θ with an interval of 5° and constant f. Peaks are observed around 0°, 30°, 60° and 90°. The tendency of the test results substantiate the expected axis of symmetry at 60°, with manual configuration of θ taken into account.
Figure 7b shows that by increasing H the test results diverge exponentially to Nemoh, which is due to violation of assumptions in potential theory. The influence of incident wave direction is considered to be caused by uncertainties in measurements, where non-symmetry affects the FT by moments around z-axis.
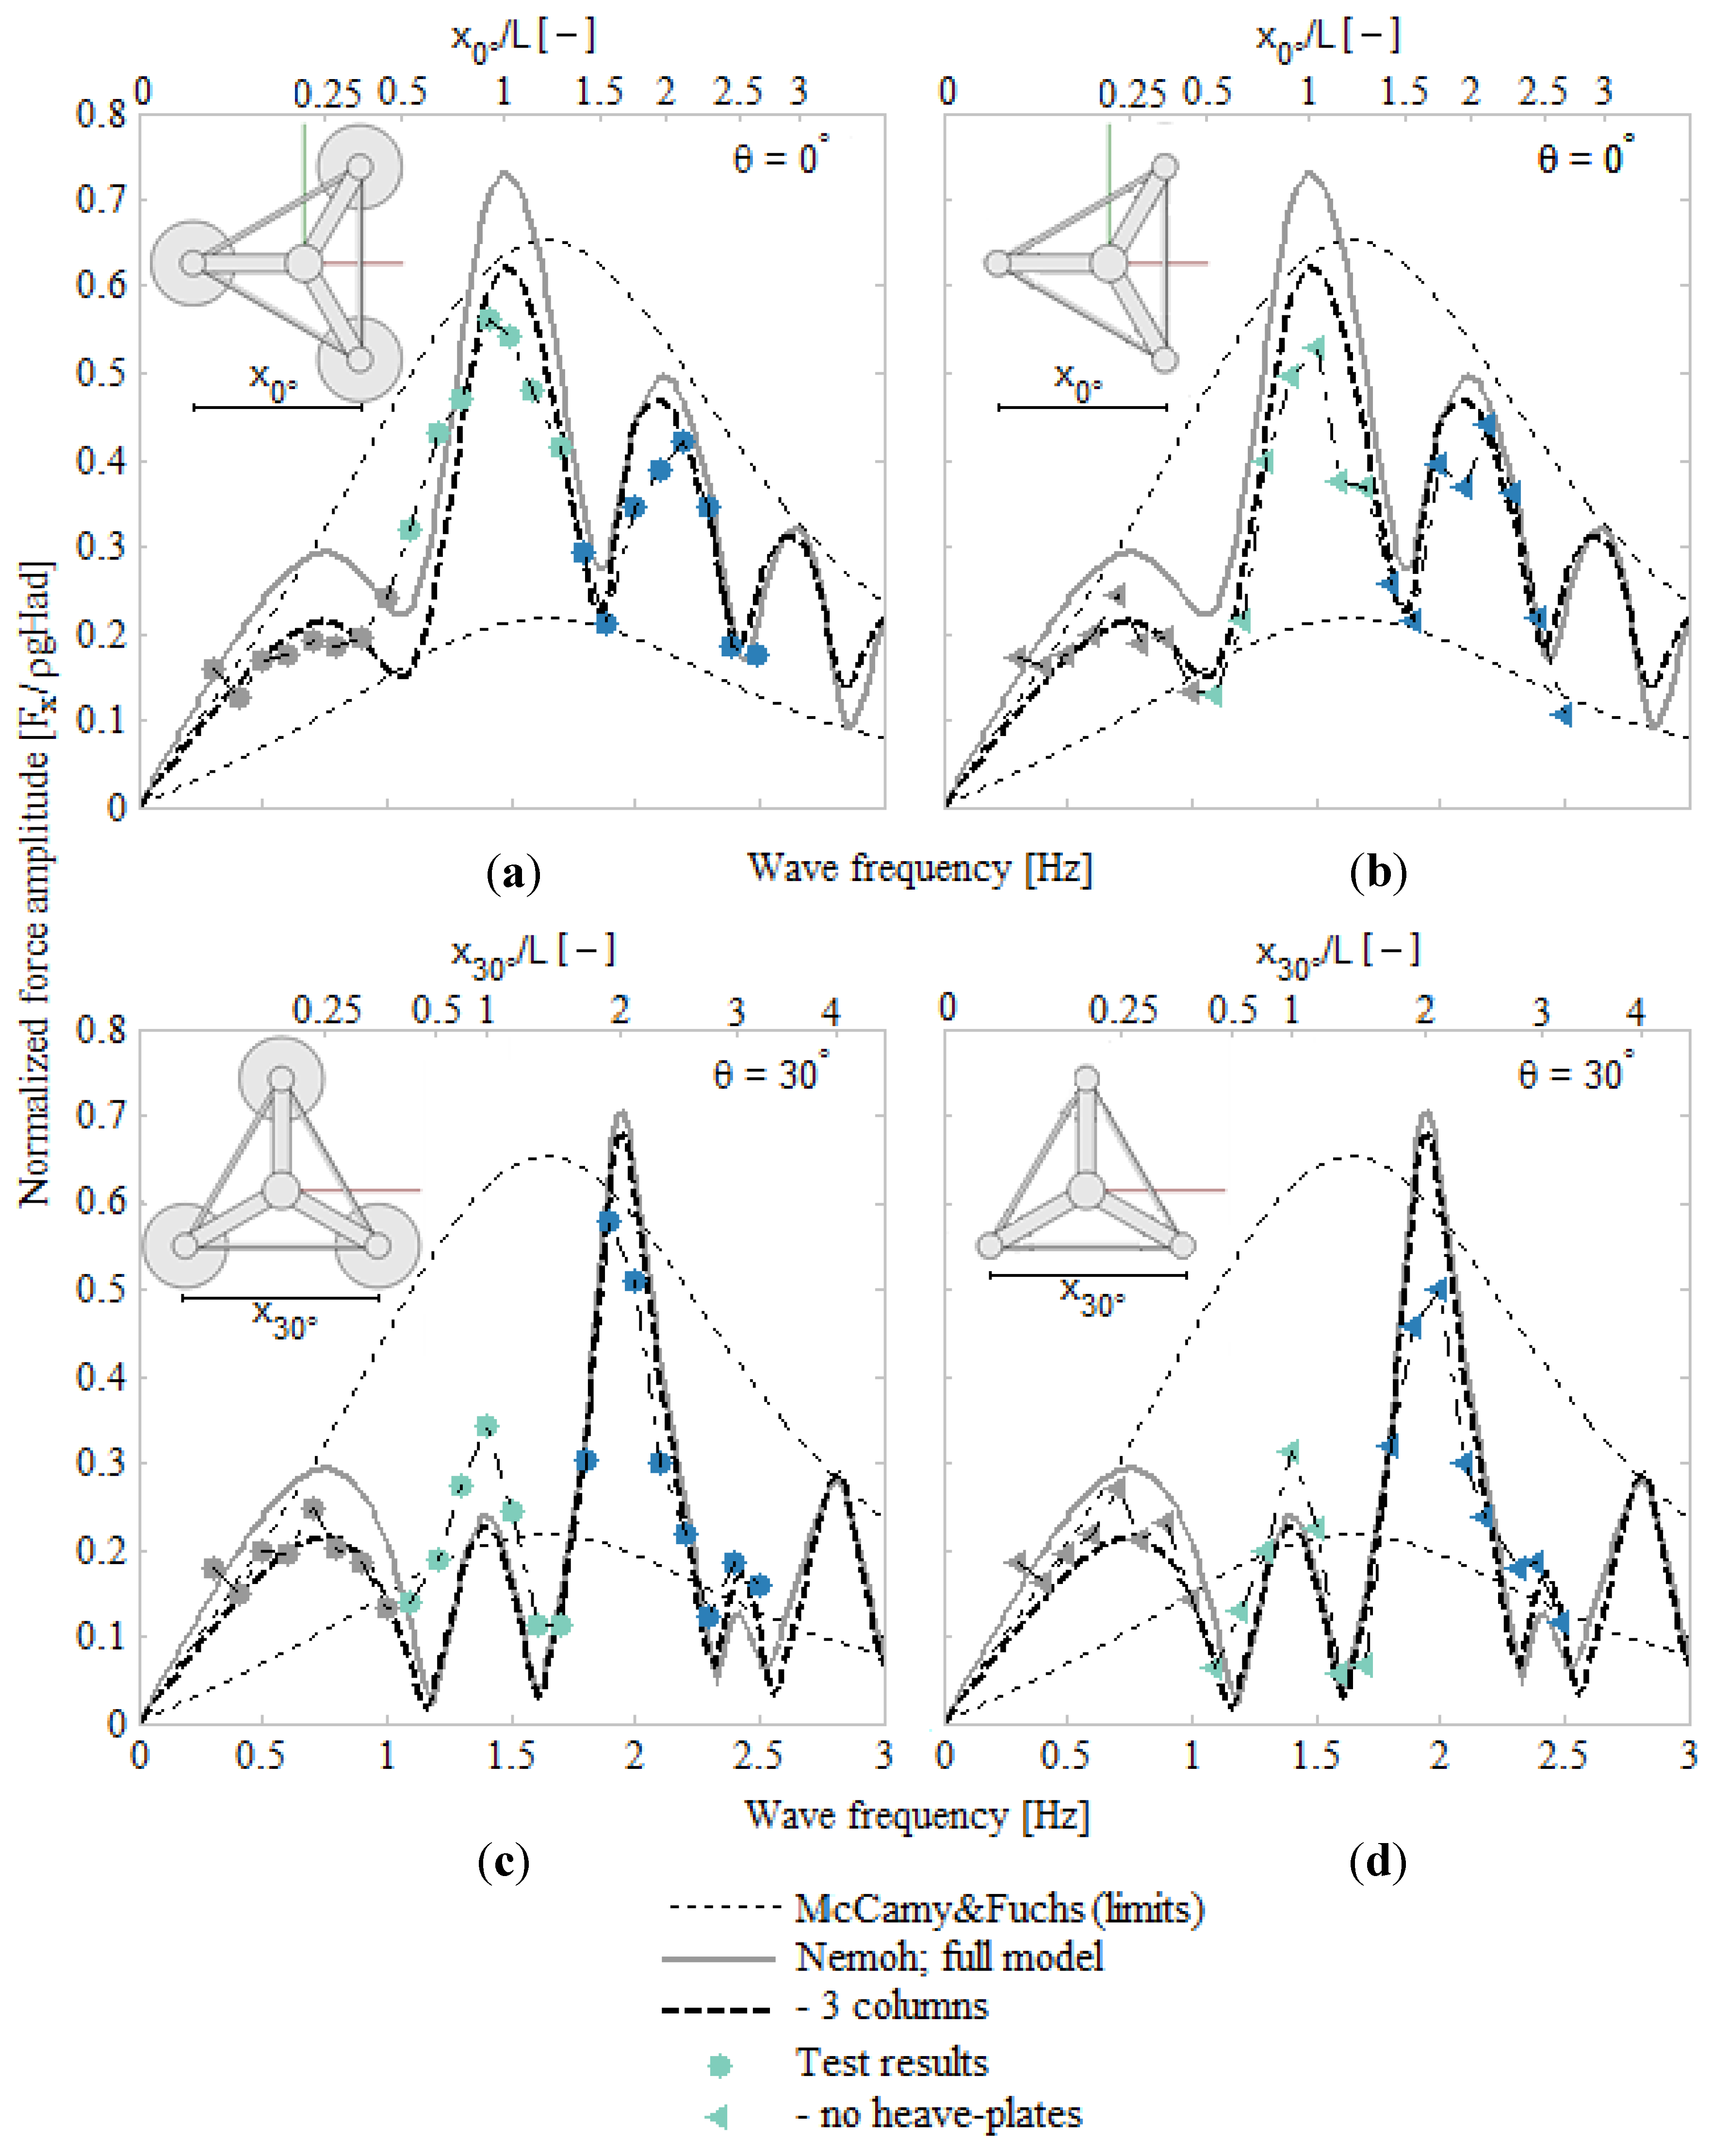
Figure 8.
Fx force exerted at (a) θ = 0° (b) θ = 0°, - no heave-plates (c) θ = 30° (d) θ = 30°, - no heave-plates.
Figure 8.
Fx force exerted at (a) θ = 0° (b) θ = 0°, - no heave-plates (c) θ = 30° (d) θ = 30°, - no heave-plates.
In
Figure 8 and
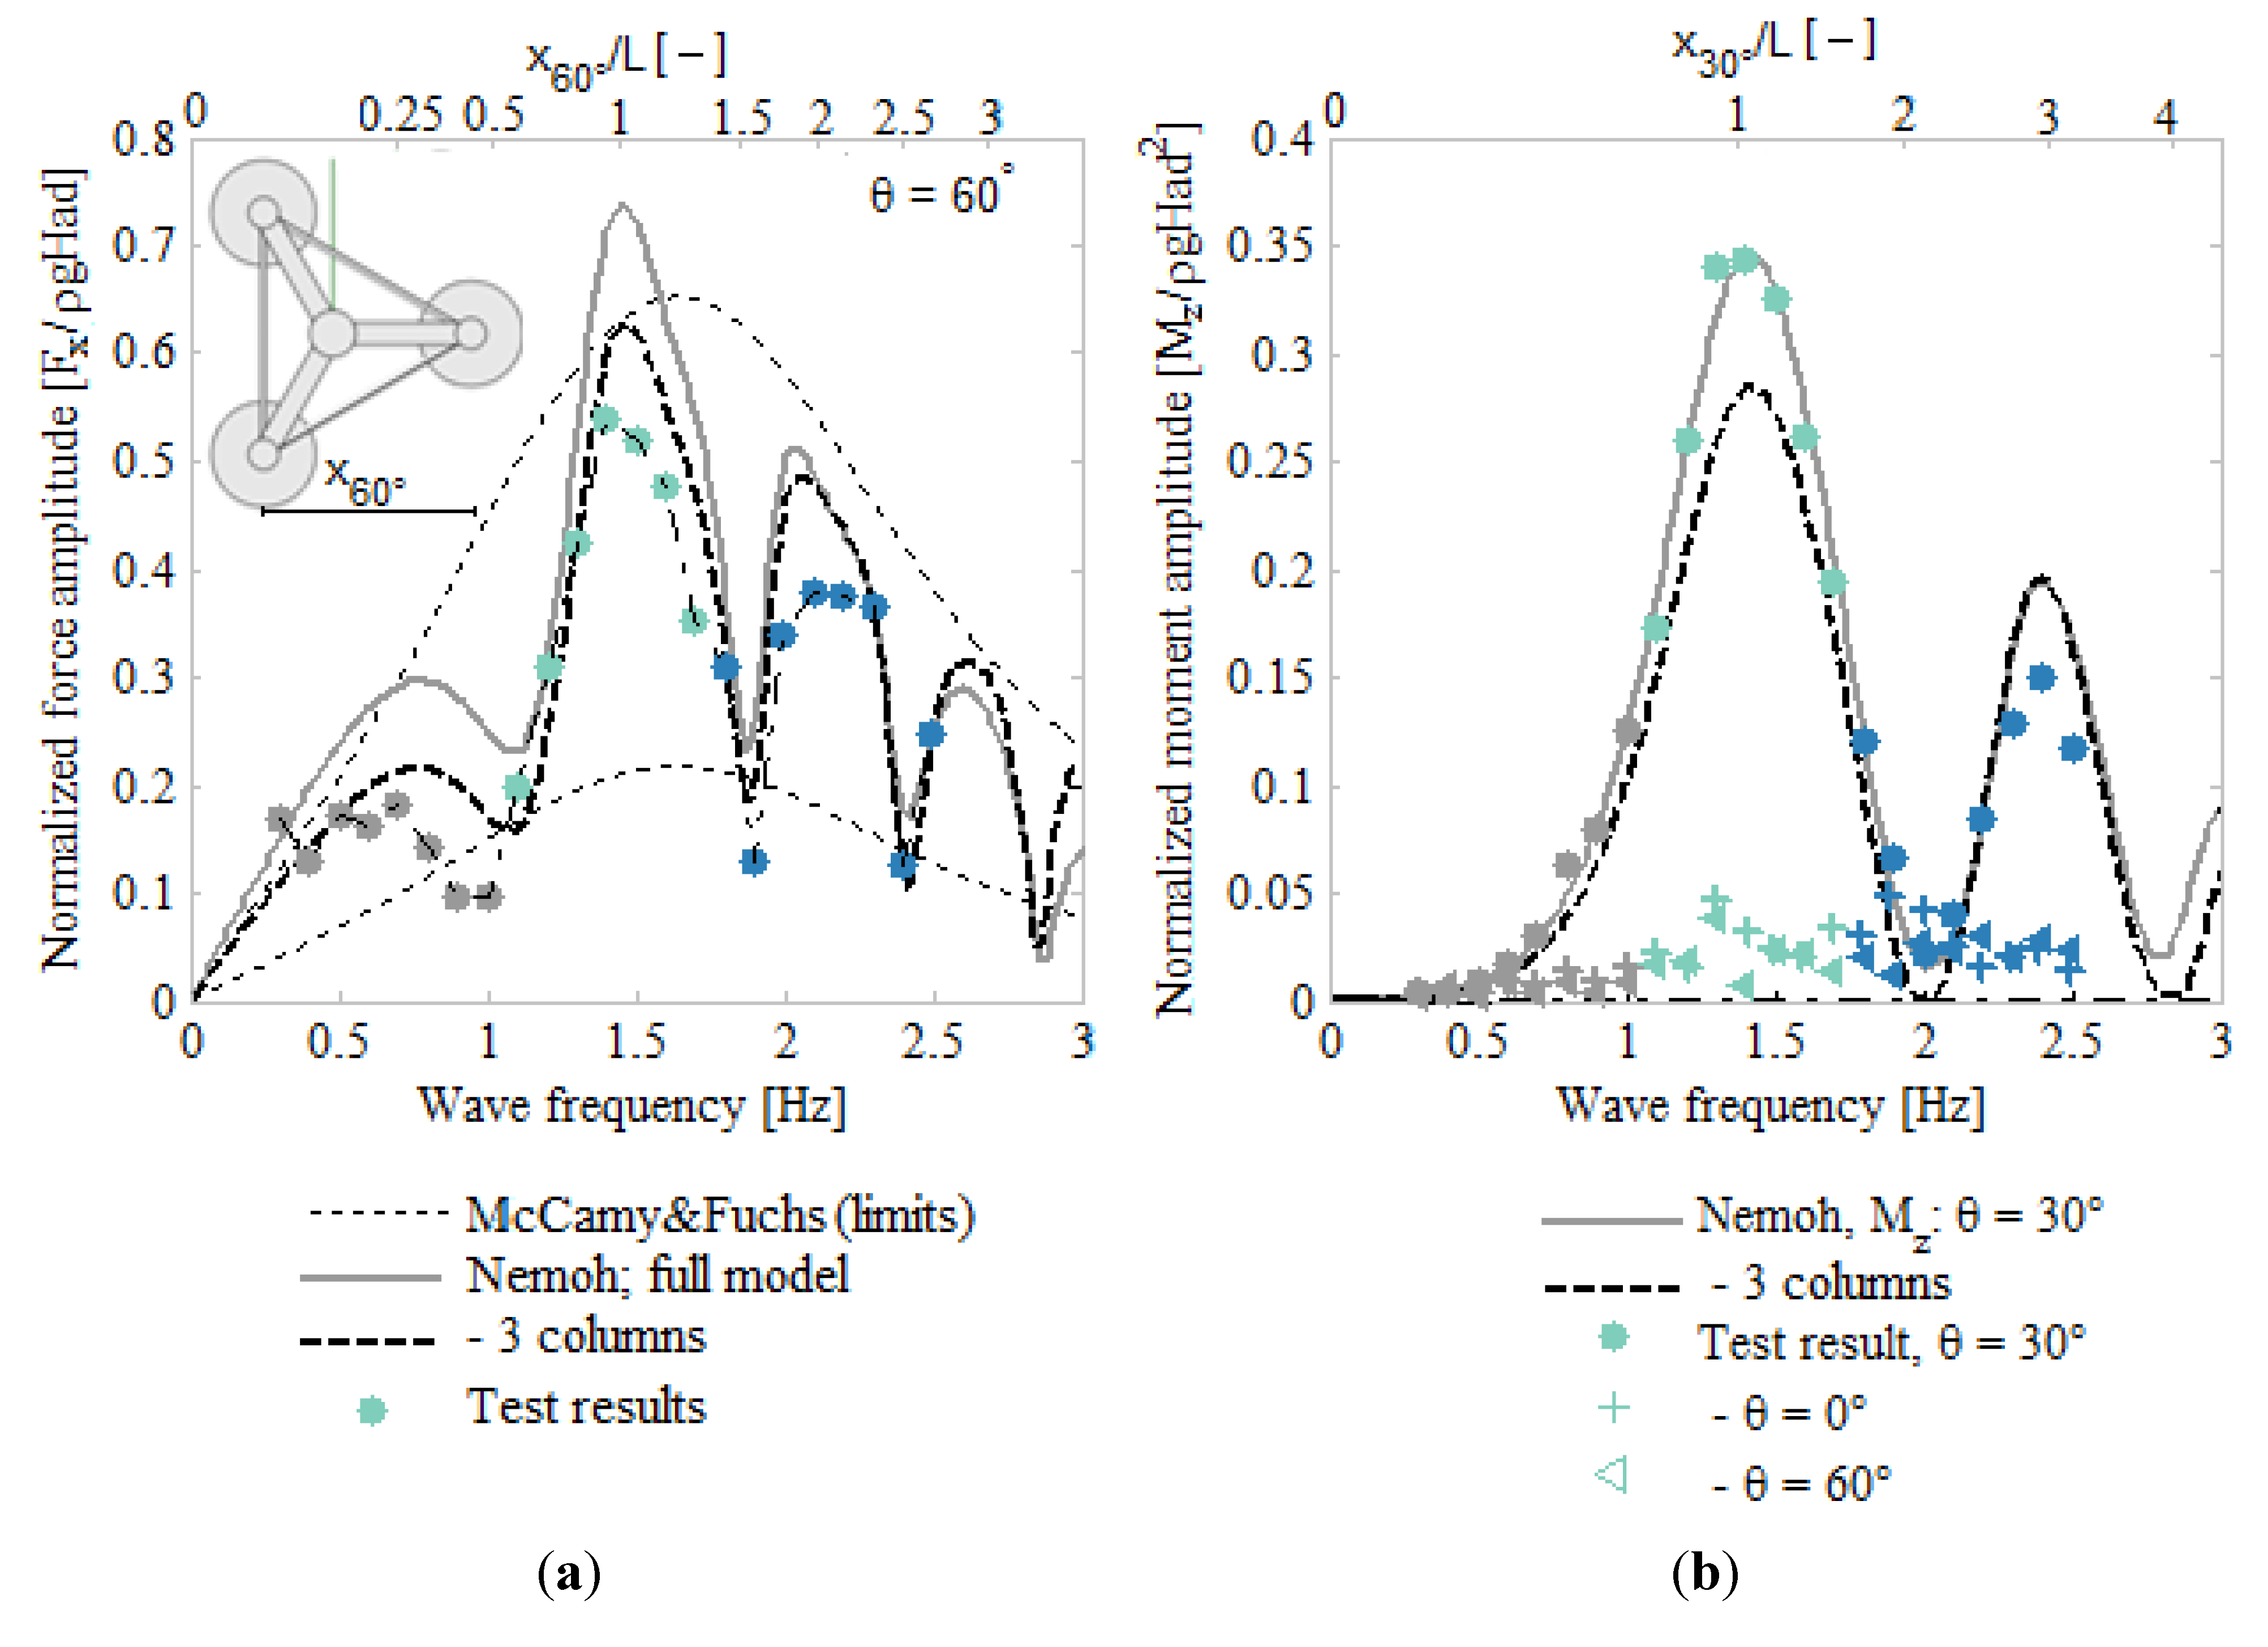
Figure 9a, F
x is plotted by influence of θ, f and
, where
is the maximum distance (in the incident wave direction) between the columns. As expected, the local maxima and minima can be expressed by the ratio
, where maxima occurs at integers. The Nemoh-computed full model results diverge more to the test results at the peaks than with computation of primary structural parts only. The test results without heave-plates follow Nemoh better at local minima.
In
Figure 9b, the normalized moment amplitude (M
z) of excitation moment in yaw is plotted by influence of θ, f and
. The Nemoh computation of θ = 0° and 60° have M
z = 0 due to symmetry, thus the test results diverge with a light increasingly small amplitude at higher frequencies. The moment amplitude for θ = 30° follows the Nemoh computation for the full model.
Figure 9.
(a) Fx force exerted, θ = 60° (b) moment exerted in yaw, Mz.
Figure 9.
(a) Fx force exerted, θ = 60° (b) moment exerted in yaw, Mz.
5. Discussion
Figure 8 and
Figure 9a are a comparison of the frequency dependent excitation force for three different directions. The force is almost similar for low frequencies, but with higher frequencies it depends on the incident wave direction. The excitation force for 0° and 60° is generally in the range of lower and upper limits by the McCamy and Fuchs solution whereas the interval for 30° exceeds the lower limits due to a three-positioned placement of columns parallel to the incident wave direction. As seen in
Figure 8 and
Figure 9a, the frequency for all local minima and maxima can be expressed by the geometric ratio
, which leads to a simple determination of peak frequency and peak force regime.
By determining the peak frequency and corresponding force regime, it is possible to solve excitation forces for peaks only and thereby decrease the number of equations (
) significantly, see Equation (3):
where
,
and
is number of: DoFs, incident wave direction and frequencies.
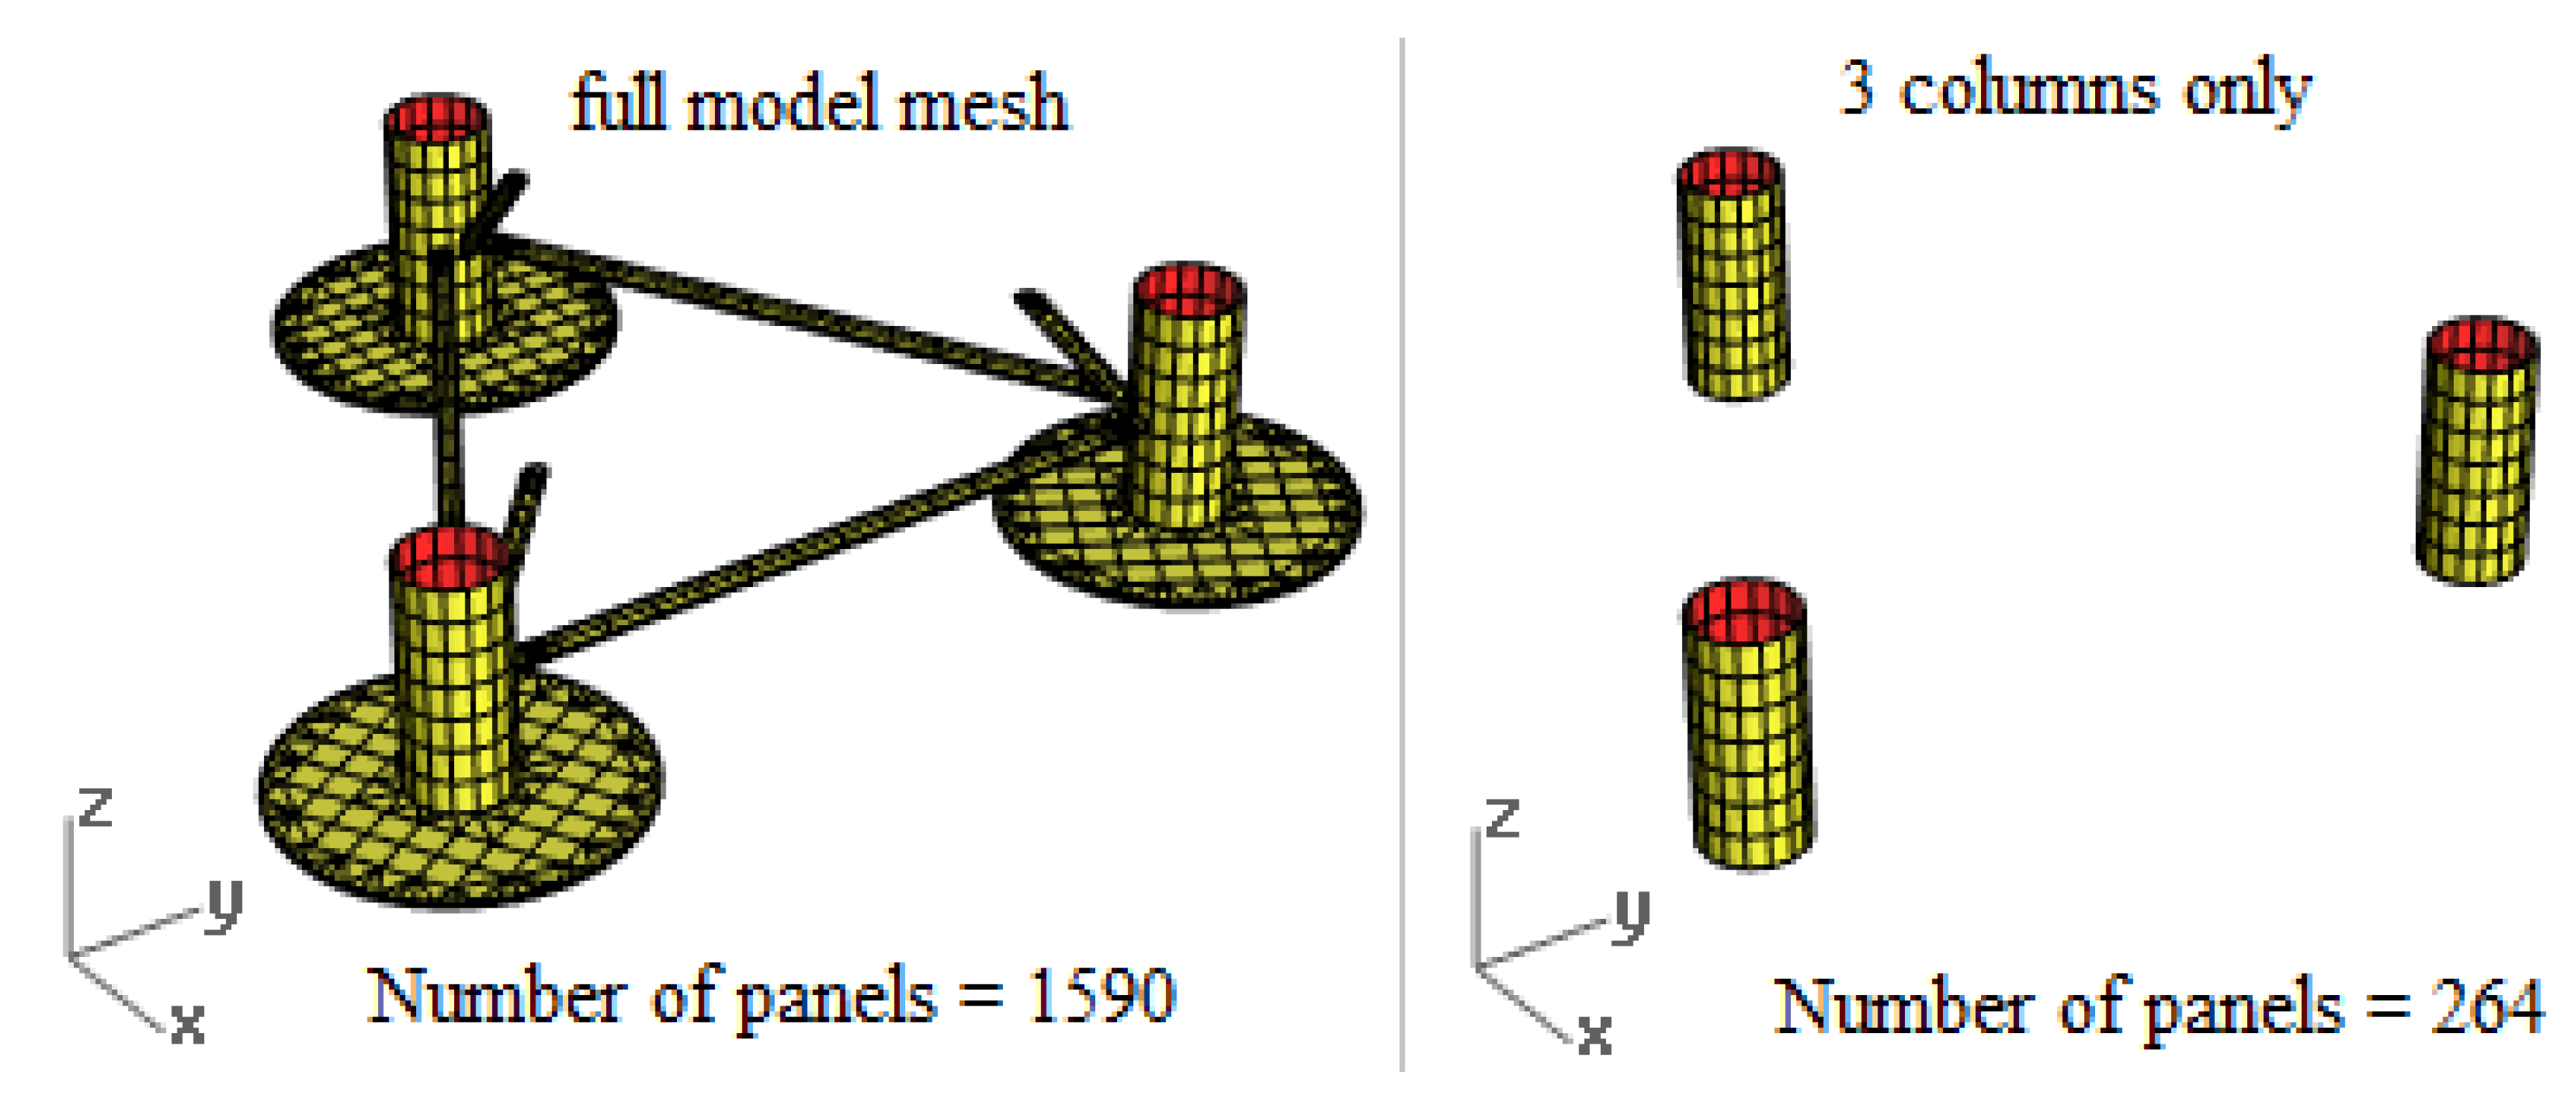
Table 4 shows the influence of
and number of panels in computation time. The number of panels is observed to affect the computation time with a factor of ~8 times the ratio between meshes where
affects it linearly.
Table 4.
Duration of Nemoh computation for applied meshes and frequencies(where nDoFs = nθ = 3).
Table 4.
Duration of Nemoh computation for applied meshes and frequencies(where nDoFs = nθ = 3).
| Mesh | Frequencies | Time * | Time [%] |
|---|
| Full model (1590 panels) | All (nf = 150) | 54.1 h | 100% |
| Peak (nf = 8) | 2.8 h | 5.3% |
| 3 columns (264 panels) | All (nf = 150) | 1.1 h | 2.1 % |
| Peak (nf = 8) | 3.6 min | 0.1% |
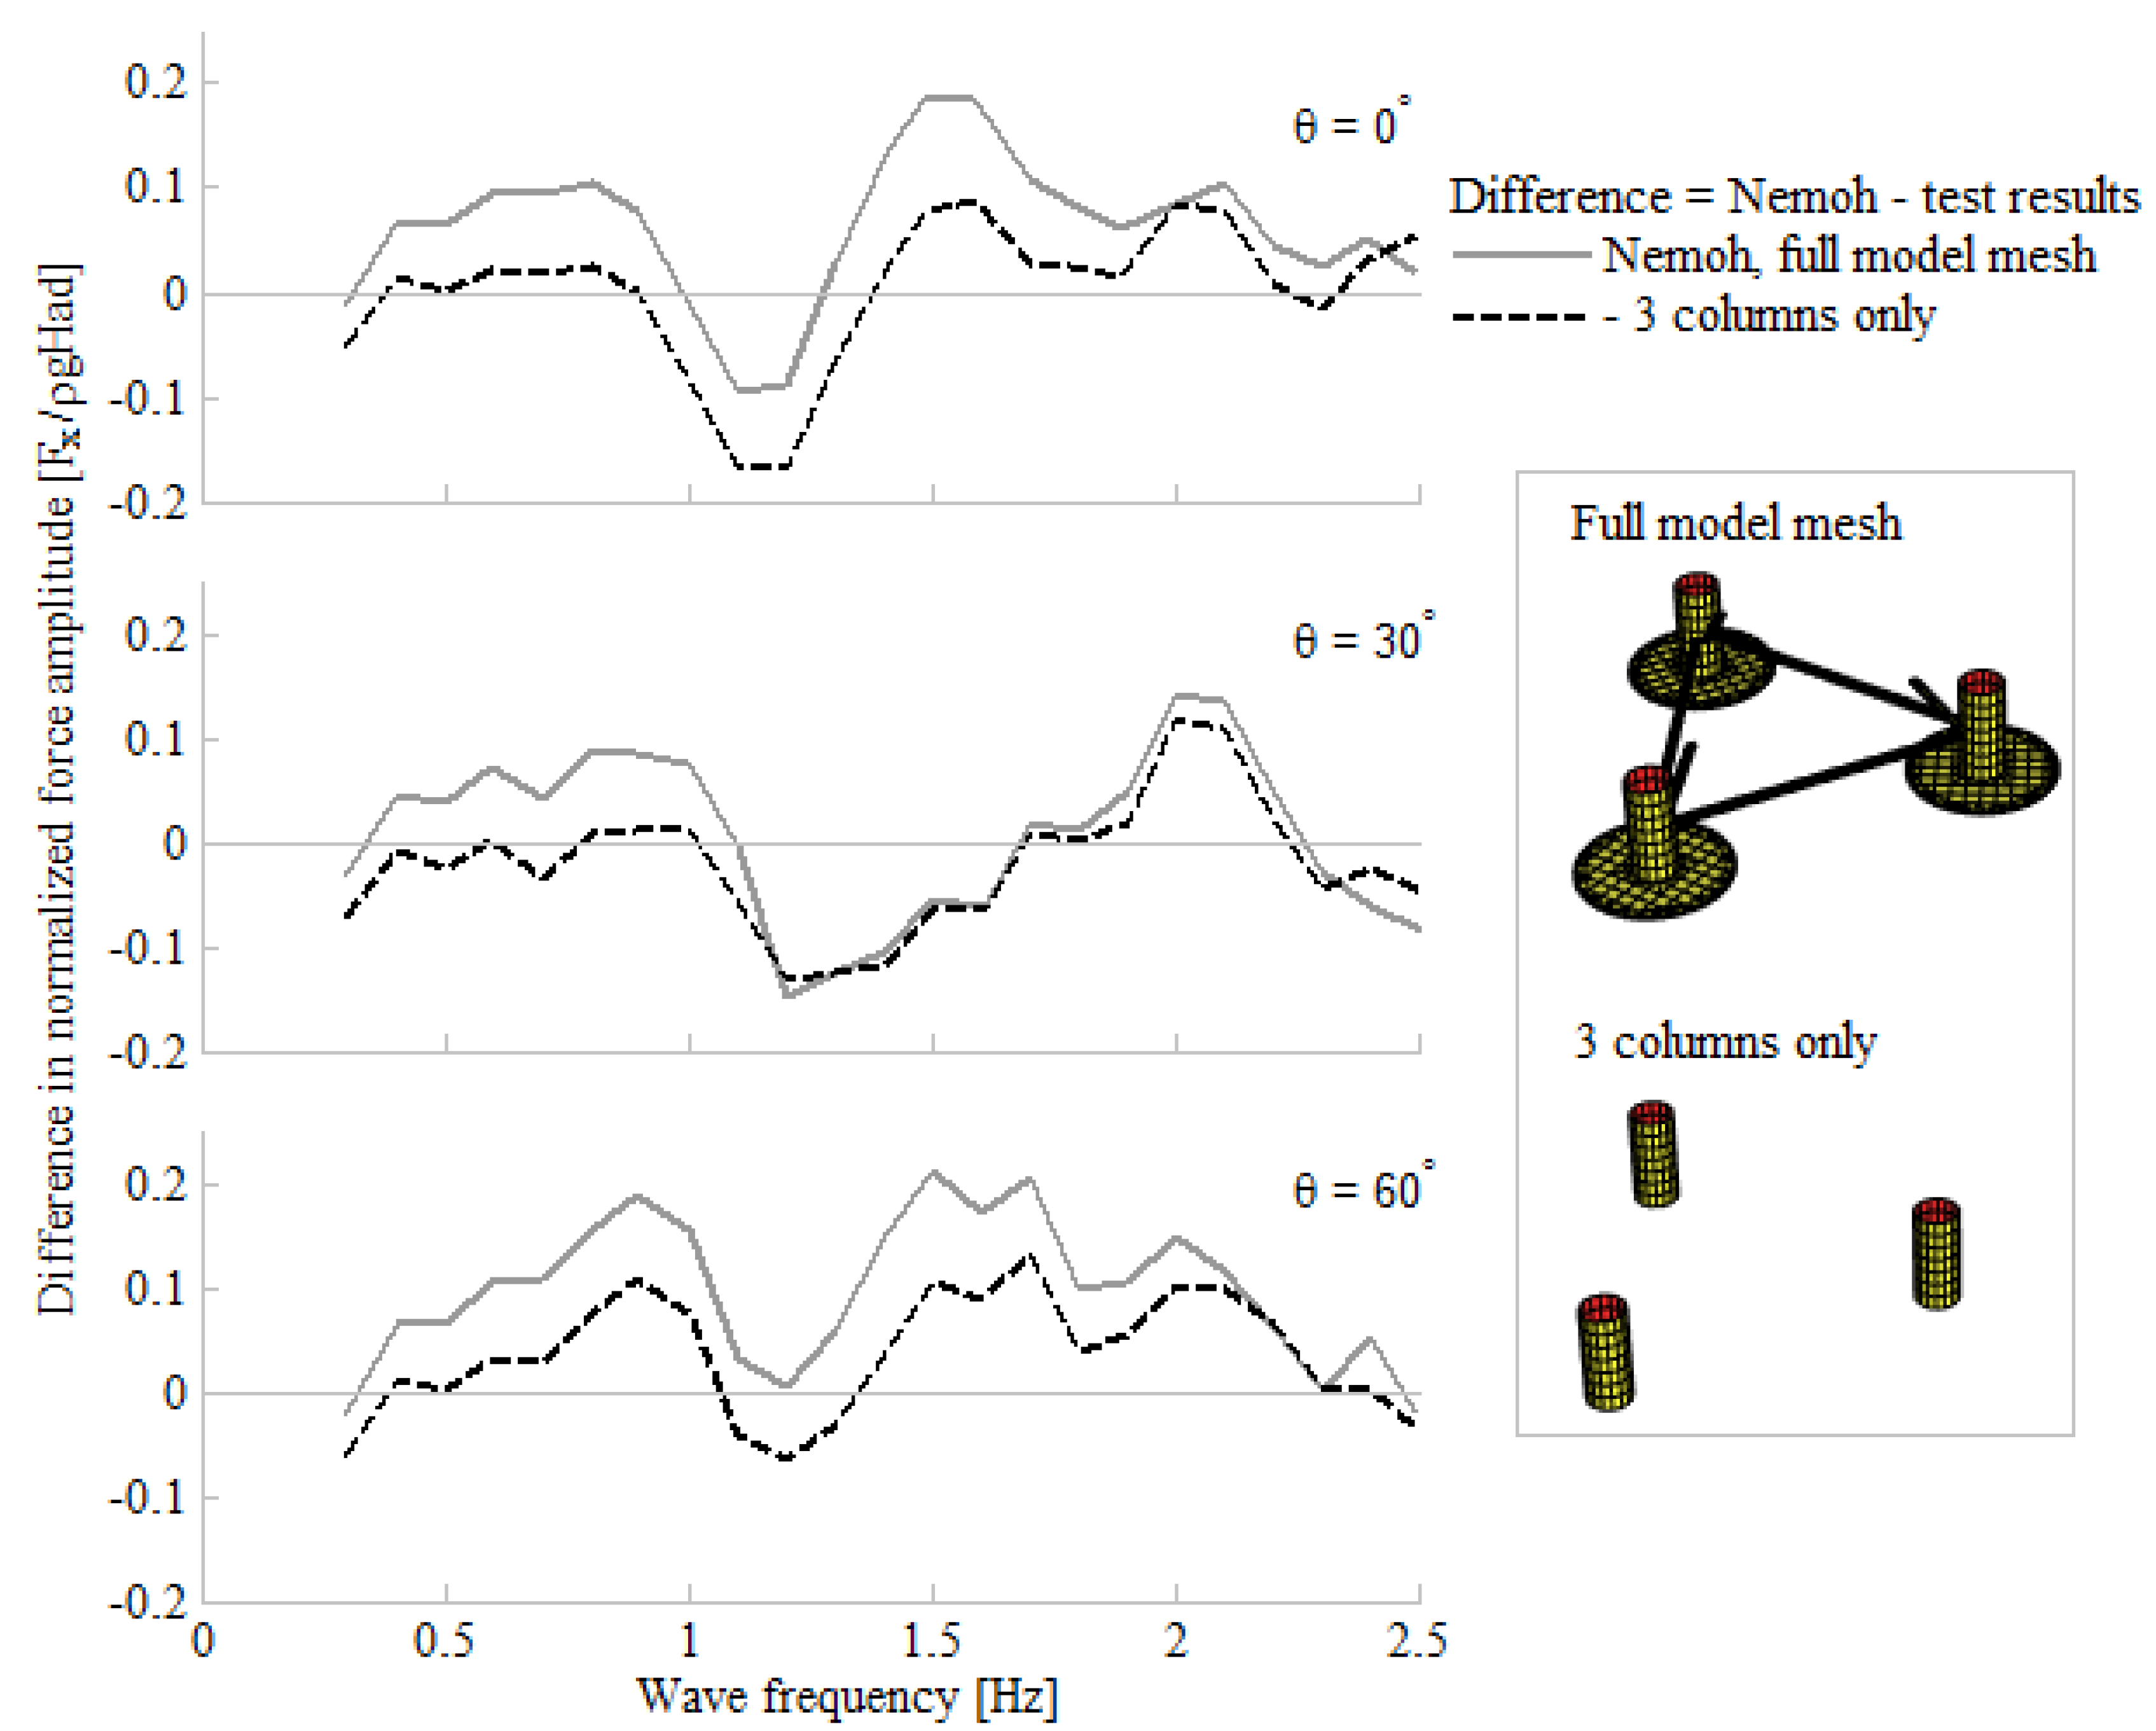
Figure 10 shows the difference between the Nemoh computed results of a mesh of the full model, a mesh of three columns only and the test results. As seen, the difference between computed results and test results is generally lower when only primary structural parts are computed. This is important because of the large difference in panels.
Figure 10.
Difference between Nemoh-computed results and test results in normalized force amplitude.
Figure 10.
Difference between Nemoh-computed results and test results in normalized force amplitude.
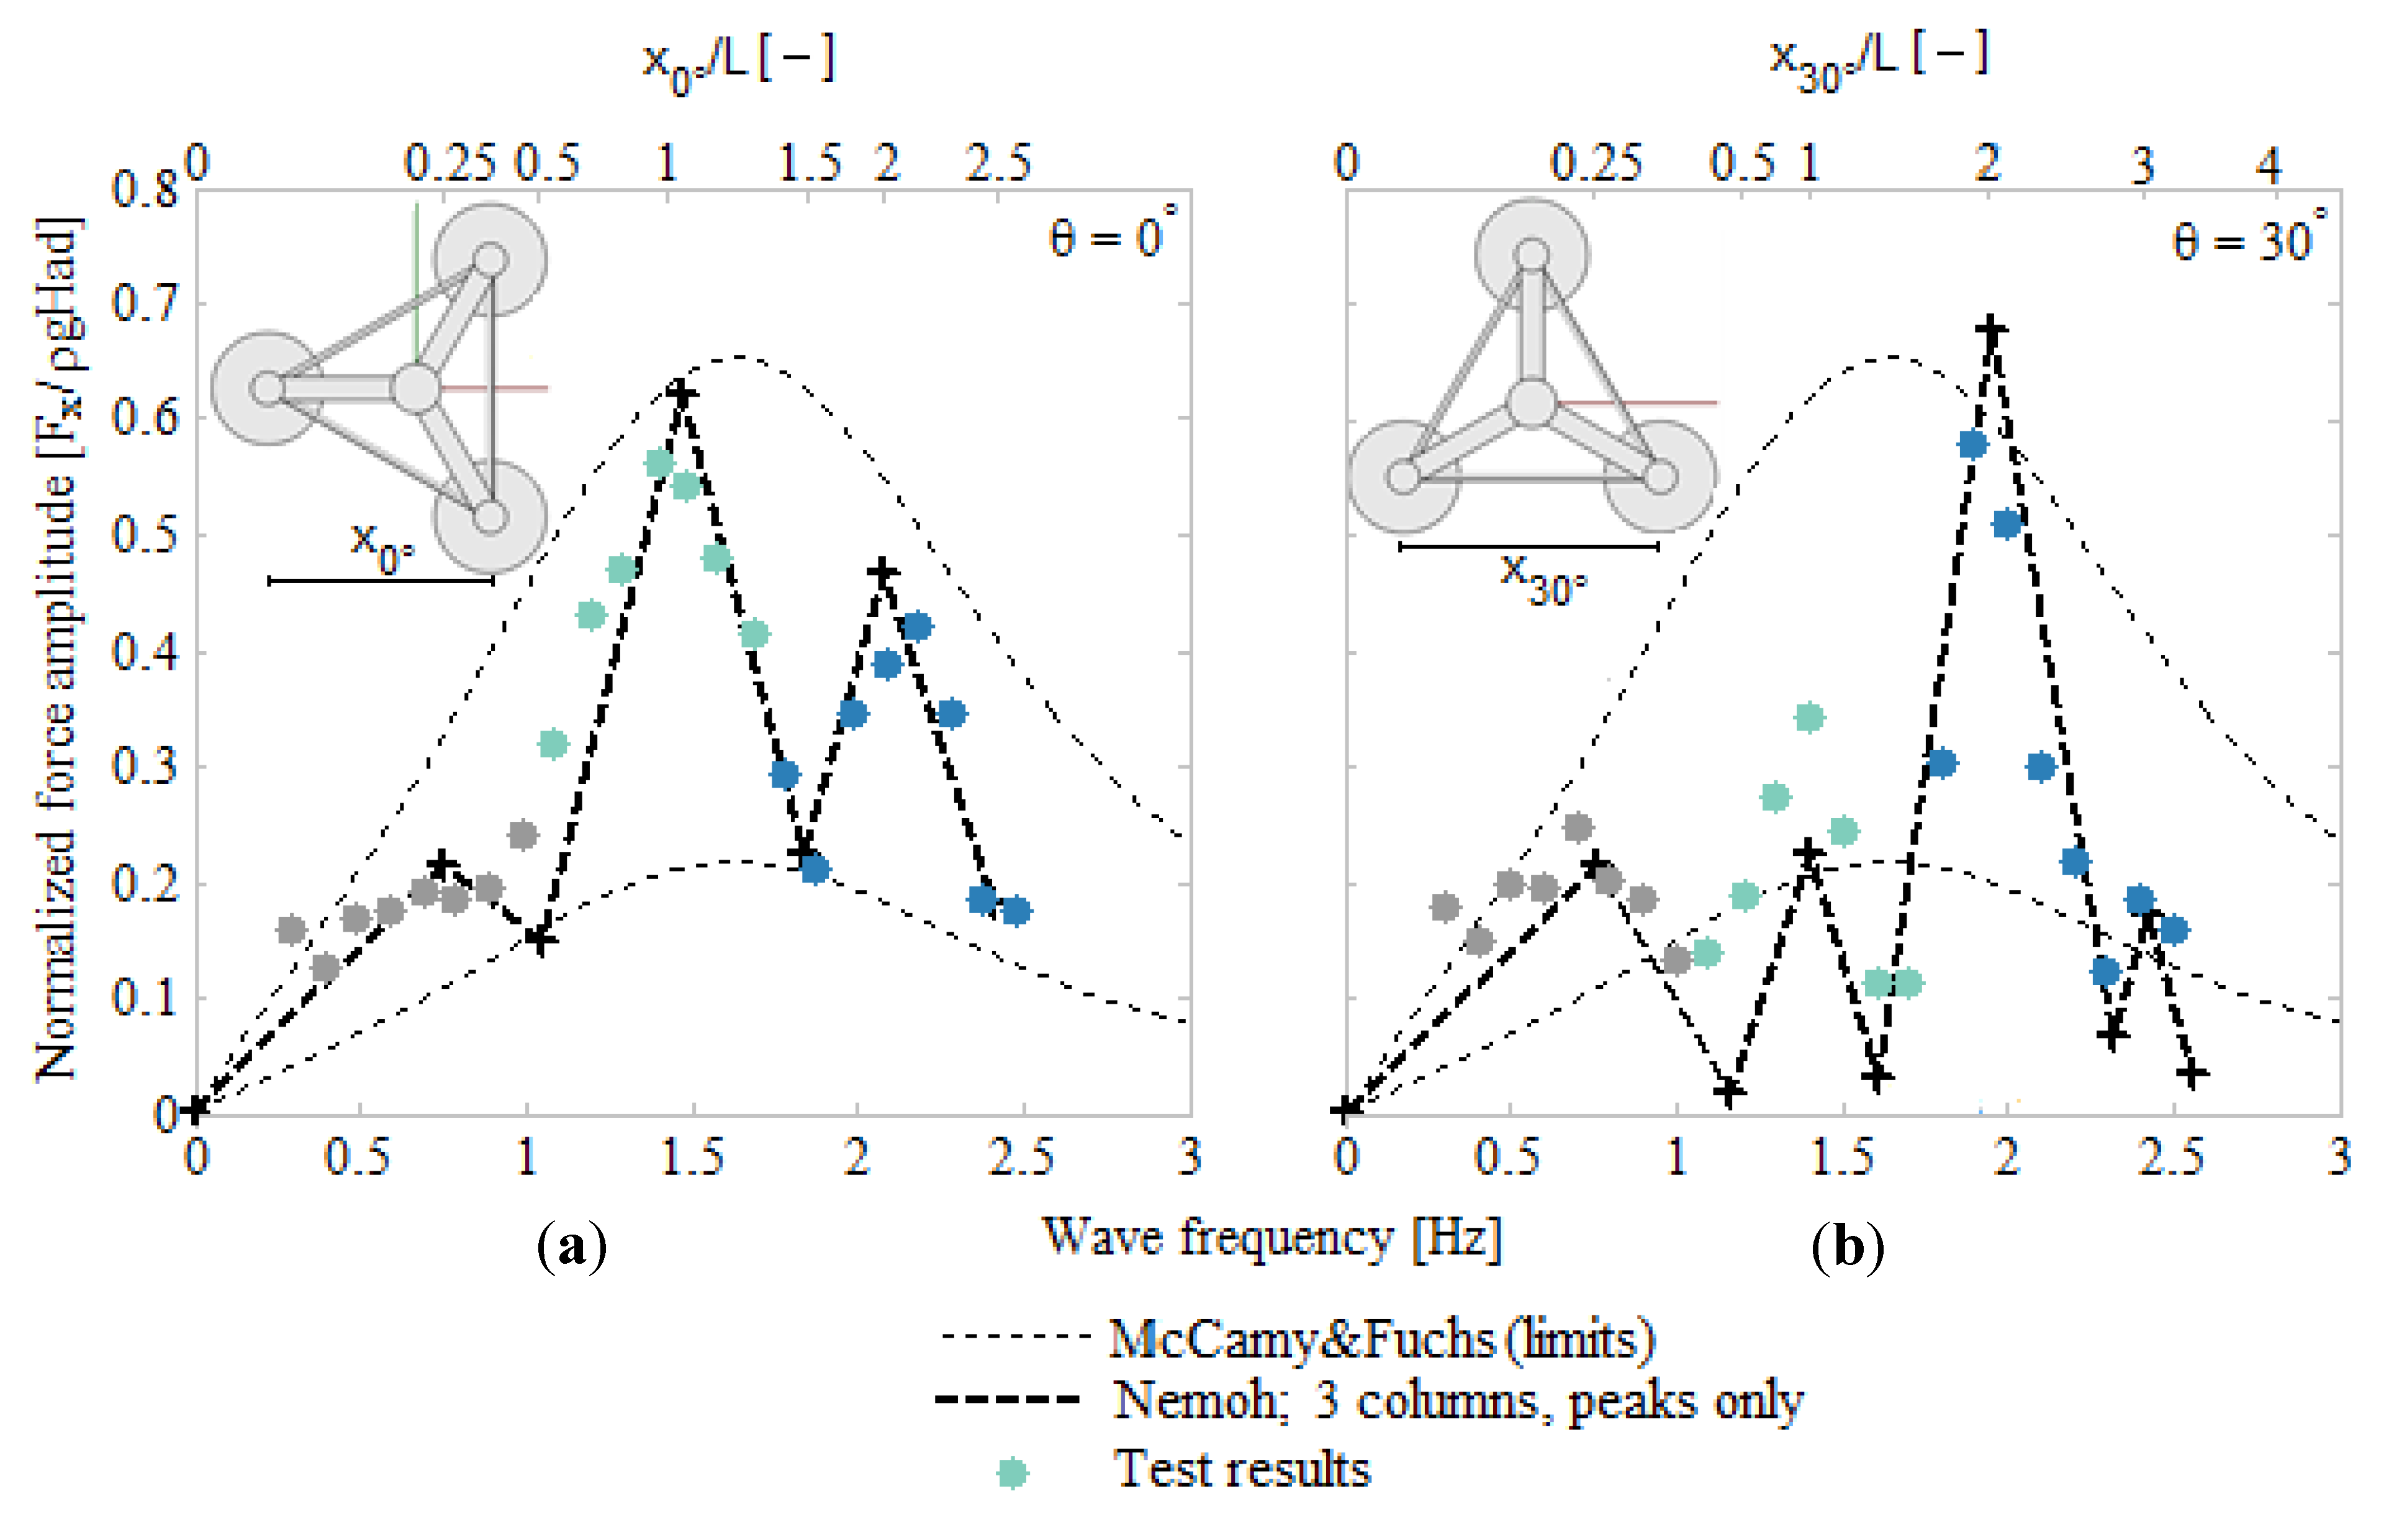
Figure 11 shows the simple computation of the three-columned mesh for peak frequencies only, which reduces the computation time to 0.1% of full model mesh for all frequencies (see
Table 3). Despite the high reduction of computed panels and frequencies, the Nemoh computation is in good agreement with the test results. For the potential shadow effects in situation with in-line columns in incident wave direction (θ = 30°), the yaw excitation
of the structure is considered, see
Figure 9b. The results show that
are close to zero for 0° and 60°, and the deviation could be due to a small error in the angle of the wave direction. For θ = 30°, a minimum close to zero is reached at
and, thereby, indicates the shadow effect as negligibly small. This corresponds to the assumption of a no interference effect for an in-line placed cylinder in an oscillating flow when
x30° > 4D [
17]. Since there is no indication of shadow effects, the theoretical solution by McCamy and Fuchs including consideration of re-positioning of columns is applicable and sufficient.
Figure 11.
Nemoh computation of 3-columned model mesh for local peak frequencies at incident wave direction of (a) θ = 0° (b) θ = 30°.
Figure 11.
Nemoh computation of 3-columned model mesh for local peak frequencies at incident wave direction of (a) θ = 0° (b) θ = 30°.
When increasing H, the excitation force moves towards the drag regime, cf.
Figure 2b. Because the calculation is based on linear diffraction theory, no viscous effects are taken into account and an increasing deviation in respect to the wave height is expected.
Figure 7b shows the normalized test result for a varying wave steepness at f = 0.5 Hz in comparison with Nemoh. The test result deviates from Nemoh-computed results, which is considered to be primarily due to the increasing significance of the viscous effects and deviation from the linear wave elevation.
6. Conclusions
Because of the complex geometry, the determination of the hydrodynamic excitation force is doubtful due to the limitation of commonly used simplified methods. This paper shows good agreement between the test results of the applied model and the calculated results obtained by applying diffraction theory in the open source BEM code, Nemoh. Furthermore, the agreement between the calculated results and the test results gets stronger when applying a simplified panel mesh consisting of primary structural parts only. The peaks are especially estimated significantly better. The average difference between Nemoh computations and test results are around 40% higher for full model mesh than for model mesh of primary structures only which have ~6 times fewer mesh panels. By simplifying the model mesh into primary structures, more realistic solutions are thereby achieved. This can be caused by mitigating effects due to non-achievement of ideal situations of full wave excitation force on secondary and tertiary structural parts (heave-plates and braces).
The peak frequencies can be predicted by the ratio of the distance between the columns (in the incident wave direction) and the wavelength, which is why the necessary frequencies for computation, and as such the computation time, can be reduced significantly. By computing peak frequencies and mesh of primary structures only, the computation time is reduced to 0.1% of full model mesh for all frequencies. The results by reduced computation demonstrate a significantly more effective method which shows good agreement with the test results.
For low frequencies, the result with heave-plates diverge more from the ideal situation solved by potential theory than the results without heave-plates. This is due to the disturbance of the particle motion and the presence of skin friction over the heave-plates. By considering the excitation moment in yaw, the shadow effects of columns in surge are observed as negligibly small. This supports the assumption of a no interference effect for an in-line placed cylinder in an oscillating flow when the distance between columns (in incident wave direction) is higher than four times the column diameter.


