Review

Recent Advances in the Characterization of Gaseous and Liquid Fuels by Vibrational Spectroscopy

by
Johannes Kiefer
1,2,3
1
Technische Thermodynamik, Universität Bremen, Badgasteiner Str. 1, Bremen 28359, Germany
2
School of Engineering, University of Aberdeen, Fraser Noble Building, Aberdeen AB24 3UE, Scotland, UK
3
Erlangen Graduate School in Advanced Optical Technologies (SAOT), Universität Erlangen-Nürnberg, Erlangen 91052, Germany 
Energies 2015, 8(4), 3165-3197; https://doi.org/10.3390/en8043165
Submission received: 9 February 2015 / Revised: 27 March 2015 / Accepted: 10 April 2015 / Published: 20 April 2015

Abstract

:
Most commercial gaseous and liquid fuels are mixtures of multiple chemical compounds. In recent years, these mixtures became even more complicated when the suppliers started to admix biofuels into the petrochemical basic fuels. As the properties of such mixtures can vary with composition, there is a need for reliable analytical technologies in order to ensure stable operation of devices such as internal combustion engines and gas turbines. Vibrational spectroscopic methods have proved their suitability for fuel characterization. Moreover, they have the potential to overcome existing limitations of established technologies, because they are fast and accurate, and they do not require sampling; hence they can be deployed as inline sensors. This article reviews the recent advances of vibrational spectroscopy in terms of infrared absorption (IR) and Raman spectroscopy in the context of fuel characterization. The focus of the paper lies on gaseous and liquid fuels, which are dominant in the transportation sector and in the distributed generation of power. On top of an introduction to the physical principles and review of the literature, the techniques are critically discussed and compared with each other.

Graphical Abstract

1. Introduction

Modern energy conversion technology relies on primary sources based on fossil as well as renewable fuels. The major part of these fuels is converted by combustion in power plants, engines, and boilers to produce electricity, mechanical power and heat. An overview of the production and consumption of different fuels as well as predictions of future behavior can be found in a number of sources, such as the World Energy Outlook of the International Energy Agency [1], the EU Energy in Figures Pocketbook [2], or the Transportation Energy Data Book [3] with a special focus on the US transport sector.
All fuels from fossil and renewable resources are natural products and thus represent complex mixtures of a multitude of chemical compounds. Moreover, the composition and properties of these mixtures can vary significantly depending on the region where and the time when they are produced. This poses a challenge to developers and operators of combustion-based energy conversion facilities as the performance of a given device will change with changing fuel properties. Hence, suitable control strategies are required. This, in turn, establishes a need for analytical technologies capable of characterizing these fuels.
Gaseous and liquid fuels represent the major part of the energy mix. This is illustrated in Figure 1 based on data from the recent EU Energy in Figures Pocketbook 2014 [2]. These latest figures from 2011 suggest that ~53% of the overall global fuel consumption is related to fossil oil and gas resources. The third large slice with ~29% represents solid fuels like coal. Coal and other solid fuels are commonly used in large scale power plants for base load coverage. On the other hand, mobile and flexible energy conversion technology, including automotive propulsion and gas turbines for balancing peak electricity demands, are predominantly based on gaseous and liquid fuels. In the following, the term fuel refers to gases and liquids, and solids will not be covered.
Figure 1. World gross inland consumption by fuel. The “renewable (other)” slice comprises hydro, geothermal, solar, and wind power. The data are taken from the EU Energy in Figures Pocketbook 2014 [2].
Energies 08 03165 g001
Many commercial fuels are nowadays blends of a fraction from the petrochemical industry (like natural gas, gasoline, and diesel) and a biofuel (like biogas, bioethanol or biodiesel). When fuels are blended, the physicochemical properties and hence the performance in an engine may vary substantially. As an example, Table 1 compares selected properties of iso-octane, which is often used as a simple one-component surrogate of gasoline, and ethanol, which is a typical biofuel admixed into gasoline in most commercial fuels for spark-ignition engines. Obviously, the spray formation [4] and combustion [5,6,7] in a given engine will be different for both fuels as the relevant properties change. These effects have been a subject of research for a long time and are still not fully understood. In a blend of both fluids the properties will most likely lie somewhere in between the values of the pure substances. This assumption of a thermodynamically ideal mixture allows one to predict the behavior. However, should the mixture be non-ideal, the mixture properties may be totally unpredictable from the knowledge of the pure substance properties. A prominent example of such non-ideal mixing behavior is the solution of one part dimethyl sulfoxide (DMSO) and two parts of water. While the pure substance melting points are +18 °C and 0 °C, respectively, the mixture melts at −70 °C [8,9]. Therefore, it is important to characterize a mixture, in particular when it is a multi-component system like most commercial fuels are.
Table 1. Selected properties of iso-octane and ethanol.
PropertyIso-octane, C8H18Ethanol, C2H5OH
Density (@ 25 °C) in kg/m3688785
Viscosity (@ 25 °C) in mPa s0.4731.040
Surface tension (@ 25 °C) in dyn/cm18.322.4
Latent heat of vaporization in kJ/mol35.142.3
Boiling temperature in °C99.378.5
Energy content in MJ/kg44.326.8
Research Octane Number RON100108.6
There is a large variety of experimental methods that can be used to characterize a fuel representing a mixture of multiple chemical compounds. In some situations, the measurement of a single characteristic value may be sufficient, for example the calorific value determined with a calorimeter [10]. Other applications may require a detailed compositional analysis. For this purpose, chromatographic methods such as gas chromatography (GC) [11,12] and high-performance liquid chromatography (HPLC) are the state-of-the-art [13]. However, chromatography normally requires sampling, and it is time-consuming and relatively expensive (investment plus operational costs). To overcome these limitations, spectroscopic methods have found more and more applications for the analysis and characterization of fuels in recent years. In particular, vibrational spectroscopic techniques appear attractive in this context as they are species-specific and fast, and they can be applied in situ and online. This article reviews the recent advances of vibrational spectroscopy in terms of infrared absorption (IR) and Raman spectroscopy in the area of fuel characterization. Section 2 introduces the principles of the techniques and describes suitable approaches for data evaluation. Section 3 gives an overview of the literature dealing with the characterization of gaseous fuels, while Section 4 focuses on liquid fuels. Section 5 concludes and gives an outlook briefly introducing selected special applications such as the use of new light sources and advanced nonlinear optical techniques.

2. Vibrational Spectroscopy

The basis of any vibrational spectroscopy is the existence of discrete, species-specific vibrations in a molecule due to the non-static nature of covalent bonds between atoms. As an approximation for a simple two-body system, the normal frequency v of the harmonic vibration between two bodies of masses m1 and m2, and the bond strength k (equivalent to the force constant of a spring connecting the bodies) is given by:
ν = 1 2 π k ( m 2 + m 1 ) m 2 m 1
In a more complicated molecule with multiple atoms and a complex electron distribution, such normal stretching modes are supplemented by a multitude of bending, scissoring, rocking, wagging and twisting vibrations yielding a unique molecular fingerprint. For spectroscopy, these modes are normally expressed as values of the corresponding energy states given in Joule or in the more common unit of reciprocal centimeters, cm−1 (wavenumber). The wavenumber is the energy normalized by the product of the Planck constant and the speed of light in vacuum. At the same time, it represents the reciprocal value of the wavelength of photons with the same energy, and hence it is a very useful and sensible unit in all fields of optical spectroscopy.
A detailed description of vibrational states and their coupling with molecular rotation can be found in the common physics and spectroscopy texts, see for example Haken and Wolf [14] and Banwell and McCash [15]. In the following sub-sections, brief introductions to IR and Raman spectroscopy will be given, their experimental implementation will be addressed, and their advantages and disadvantages will be discussed.

2.1. Infrared Spectroscopy

Only a brief account of the basics of IR spectroscopy and its implementation is given here. For a detailed description, the reader is referred to the literature, see for example the texts of Schrader [16], Griffiths [17], and Haken and Wolf [14].

2.1.1. Fundamentals

Infrared (IR) spectroscopy is based on the direct absorption of electromagnetic radiation by a molecule, when the energy of the photon to be absorbed matches the energy difference between two molecular ro-vibrational energy levels. In other words, the frequency of the electromagnetic wave must be equal to the oscillating frequency of a molecular vibrational mode. For completeness, we note that near-infrared (NIR) spectroscopy, in which vibrational overtone and combination bands are probed, is very similar. In this article, however, the focus is on the mid-infrared spectral range, where the fundamental vibrational modes can be found. A few selected NIR applications will be mentioned in the review section though. The mid-infrared spectral range is normally specified as 2.5–50 µm (200–4000 cm−1) and the near-infrared covers the range 0.75–2.5 µm (4000 to 13,333 cm−1).
A requirement for IR absorption is that an oscillating dipole moment be produced during the vibrational motion of the molecule. This pre-requisite can be expressed mathematically by:
( μ q ) 0 ,
where μ is the dipole moment and q is the normal coordinate. When Equation (2) is fulfilled, the molecule or a specific vibrational mode is called IR-active. As an absorption-based technique, in IR spectroscopy the intensity I of the light transmitted by a sample of thickness d can in principle be described by the Beer–Lambert relation:
A = log ( I I 0 ) = ε ( λ ) c d ,
with the incident light intensity I0, the extinction coefficient ε as a function of wavelength λ, and the concentration c of absorbing molecules. The parameter A represents the absorbance (note that this is not equal to the absorption, which is defined as 1 ‒ transmission). An IR spectrum eventually comprises all individual contributions, i.e., all the different vibrations from all the molecules in the system under investigation. Hence, Equation (3) can only be used to extract quantitative information from a spectrum whenever the target species exhibits an isolated peak that is not sensitive to molecular interactions. In most cases, however, more sophisticated approaches are required for analyzing spectra recorded in complex mixtures. This will be discussed in Section 2.3.

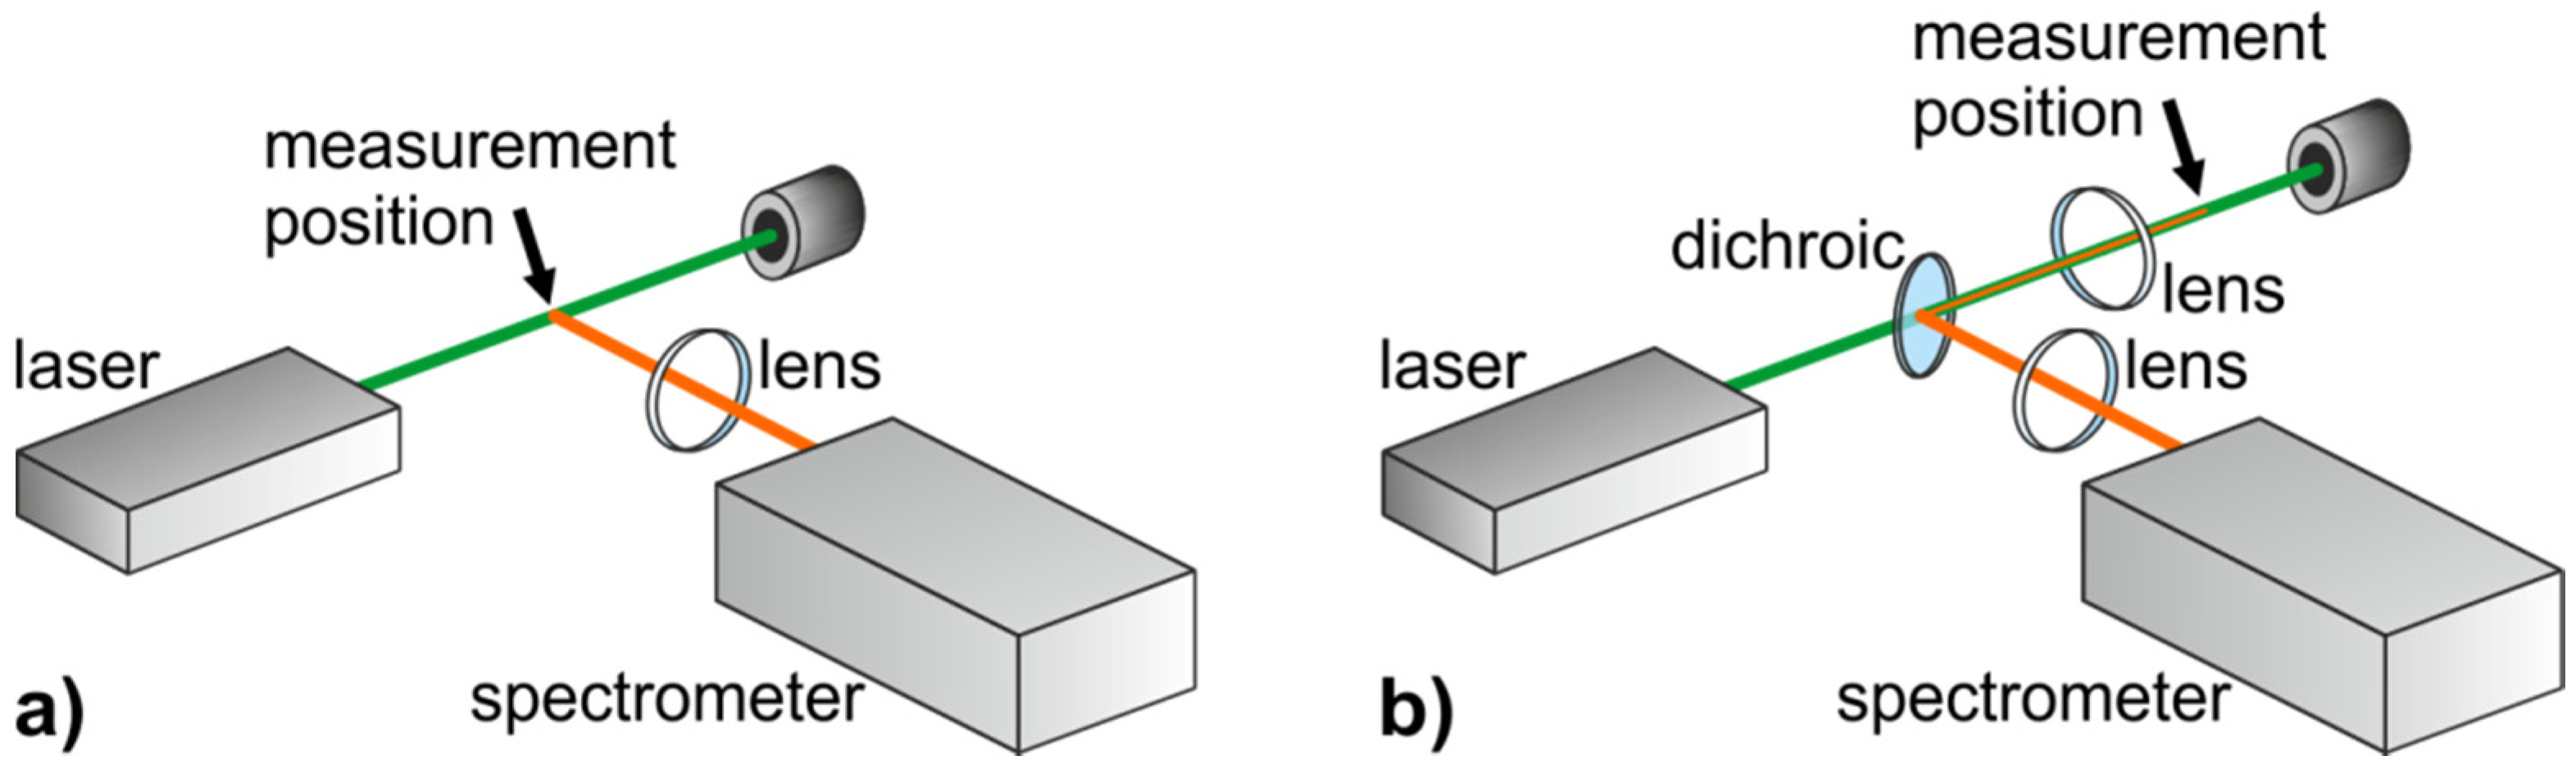
2.1.2. Experimental Realization

Typical sources of infrared radiation are glowing black-body radiators and spectral dispersion of the signal is normally achieved by an interferometric analysis (Michelson interferometer). The interferogram is then Fourier transformed to obtain the spectrum in the frequency domain. Most commercial instruments are such Fourier-transform IR (FTIR) spectrometers.
There is a variety of different approaches to realize an interaction of the radiation with the sample, two of which are commonly used in fuel applications: transmission and attenuated total reflection. In transmission measurements, the sample is placed in-between two transmissive plates/windows, and the transmitted light intensity in the infrared region is recorded as a function of wavelength, yielding the characteristic IR spectrum. The appropriate sample thickness depends on the absorption coefficient and the molecular density of the target species. A sufficient amount of photons needs to be transmitted even at the wavelengths, where the molecules absorb, in order to ensure the measurement is sensitive to concentration changes. For liquids, typical sample thicknesses lie in the range 25–500 µm. For gases, the required optical path length can be in the order of meters or even kilometers, when small quantities of a compound need to be detected. Note that there are methods to realize an optical path length of several kilometers in a small cell, e.g., using cavity enhanced techniques [18,19]. As the material of the plates must be transmissive for the IR radiation, conventional borosilicate or fused silica quartz glasses cannot be employed. Crystalline materials, such as KBr, CaF2 and NaCl, are better suited. However, one serious problem arises, as these salt materials may be affected and be irreversibly damaged by water in the samples. Consequently, many applications of IR spectroscopy of liquids employ an alternative approach termed attenuated total reflection (ATR) spectroscopy. In such an experiment, the IR radiation is propagating in a transmissive high-refractive-index material (often ZnSe or a diamond crystal), the internal reflection element (IRE, with refractive index nIRE). The sample, which has a lower refractive index, nsample, is in contact with the surface of the crystal. The radiation is reflected at an angle α at this surface (total internal reflection), so that the evanescent field can interact with the sample under investigation and is partly absorbed. As a consequence, the reflected beam is attenuated and carries the spectroscopic information.
An advantage of the transmission arrangement is its well-defined sample thickness, which is given by the geometry of the measurement cell. To analyze transmission spectra, the Beer-Lambert relation can often be applied in a straightforward manner. In contrast, in ATR experiments, the penetration depth, dp, of the evanescent wave is a complicated function of the wavelength (recall that the refractive index is a function of wavelength) and must be taken into account when ATR IR spectra are interpreted quantitatively [20]. It is commonly given as:
d p = λ 2 π n IRE ( sin 2 α ( n sample n IRE ) 2 ) 1 2 .
However, the effective path length, deff, is usually the actual parameter of interest. It represents the corresponding sample thickness that would lead to the same absorption in a transmission experiment [21]. Note that the effective path length is a kind of auxiliary parameter, which cannot be determined in a straightforward manner [20,21,22].

2.1.3. Advantages and Disadvantages

Infrared absorption spectroscopy has a number of advantages, but also some disadvantages compared to other methods. Advantages include the following:
  • High sensitivity can be achieved. With conventional IR spectroscopy a limit of detection (LOD) in the order of 0.1% (depending on the species, it can be even better) can be obtained. Special arrangements, e.g., cavity enhancement, can improve the sensitivity further and an LOD at ppm-level is possible.
  • When only one or a few species need to be detected (in other words, when the absorption measurement of one or a few selected wavelengths is sufficient), the experiment can be miniaturized and in principle be implemented as a kind of lab-on-chip technology. The absorption measurement at only a few selected wavelengths allows using simpler and cheaper light sources and detectors.
  • Fiber-coupled ATR probes facilitate in situ measurements in liquid systems. Such probes can be installed in the same way as thermocouples or pressure transducers. Hence, there is no need for optical access to the sample.
  • The technique allows fast measurements at high repetition rate. The measurement time can be as short as a few milliseconds. However, it must be kept in mind that the shorter the measurement/acquisition time, the lower the sensitivity and accuracy as the noise level increases.
On the other hand, disadvantages include:
  • Homonuclear diatomic molecules (such as hydrogen, oxygen, and nitrogen) are not IR-active and hence cannot be detected. This may be a problem when gaseous fuels are analyzed.
  • Background black-body radiation may be detected as an interference signal when the fluid or parts of the analytical device exhibit elevated temperature.
  • Saturation of the absorbing transition and overlapping peaks may lead to nonlinearities and deviations from the Beer-Lambert law and hence represent a potential problem when the signal needs to be quantified.
  • Strongly absorbing species may virtually completely absorb the wavelength of interest and hence the measurement is not sensitive to changes in concentration any longer.
  • Fiber-coupled ATR probes are not suitable for gases due to the small penetration depth and with it a short absorption path length. To avoid confusion in this context, it should be mentioned that occasionally vapor peaks, for example from water, can be observed in ATR IR spectra. These peaks are not a result of absorption in the evanescent field at the IRE, but from vapor in the path of the radiation inside the instrument. Such interfering signals can be avoided using appropriate background correction and/or purging the instrument with nitrogen or using a vacuum model of the instrument.
  • Water is a strong absorber in the infrared spectral range and may represent an interference making the evaluation of the signal difficult.

2.2. Raman Spectroscopy

Like for IR spectroscopy, only a brief account of the basics of Raman spectroscopy and its implementation is given here. For a detailed description, the reader is referred to the literature, see for example Schrader [16], Haken and Wolf [14], and Banwell and McCash [15].

2.2.1. Fundamentals

Raman spectroscopy is based on the inelastic scattering of light. This means that the scattered radiation is frequency shifted with respect to the incident light. In other words, an energy exchange takes place during the light-matter interaction. In the case of Stokes Raman scattering, which is the physical process relevant for characterizing fuels, the scattered light is shifted towards lower frequency (called a red-shift). This means that energy is transferred from the incident light to the molecule and it reaches an excited state via this indirect two-photon process (in IR spectroscopy the same state is reached directly by absorption). The frequency difference between the incident and scattered light is molecule specific. The final energy state is reached via an intermediate, so-called virtual level, which is not allowed from the quantum mechanical point of view. Therefore, physically speaking, the entire process is not an absorption and can be considered instantaneous.
A requirement for Raman scattering is a change in the polarizability α of the molecule during the vibrational motion. This pre-requisite can be expressed mathematically by:
( α q ) 0 ,
where q is the normal coordinate again. When Equation (5) is fulfilled, the molecule or a specific vibrational mode is called Raman-active.
In general, the integrated signal intensity IRS for a Stokes Raman line is often simplified and considered to be linearly dependent on the species number density c, the intensity of the incident light I0, the solid angle of the signal collection optics Ω and the Raman scattering cross-section, σ / Ω . The commonly used relation is given by:
I RS = k exp Ω σ Ω c l I 0
where kexp is a constant of the experiment and l is the length of the collection volume. Like IR, a Raman spectrum comprises the contributions from all the different vibrations from all the molecules in the system under investigation. Hence, Equation (6) can only be used to extract quantitative information from a spectrum, if the target species exhibits an isolated peak that is not sensitive to molecular interactions. Sophisticated approaches for data analysis are introduced later.
It should be emphasized that Raman scattering is a non-resonant process. This means that the wavelength of the light source can in principle be chosen arbitrarily. There are a few effects, however, to be taken into account. First, the Raman scattering cross-section is a strong function of wavelength (proportional to λ−4). This means that a short wavelength laser (visible or ultraviolet) will give a stronger signal than a near-infrared one with the same power. Second, some species in the measurement volume may fluoresce upon laser excitation, which can represent a severe interference. In the context of fuel characterization, aromatic compounds are likely to emit fluorescence, when they are excited in the ultraviolet or visible spectral range. An overview of techniques to suppress fluorescence interference in Raman spectra can be found in reference [23].

2.2.2. Experimental Realization

The main components for a Raman spectroscopy experiment are a light source and a spectrograph or monochromator equipped with a sensitive detector in order to record the weak signals as a function of wavelength. The specification of the light source (normally a laser, but recent developments have made light-emitting diodes suitable alternatives as well [24,25]) depends on the measurement task. For example, for gas-phase analysis, high optical power (in the order of W) is required as the molecule density is low, whereas for liquids a commercial laser pointer (mW) may be sufficient. Suitable detectors are, e.g., intensified CCD cameras, back-illuminated CCD cameras, and photo-multiplier tubes (PMTs).
There are two common experimental arrangements for Raman spectroscopy. They are illustrated in Figure 2. In the 90°-setup, the scattering signal generated in the measurement volume is collected by a lens and delivered to a spectrometer. The signal collection is arranged in direction perpendicular to the laser propagation. In the spectrometer, the signal is spectrally dispersed and detected as a function of wavelength. This setup can easily be arranged with only a small number of optical components. Another advantage is that the signal can be enhanced with a multi-pass setup, in which the laser crosses the measurement volume several times in order to increase the local laser intensity. A disadvantage, however, is the sensitivity against small misalignments of the optics. This can lead to a reduced robustness of the setup.
The other common arrangement is the backscattering geometry, in which the signal scattered against the laser propagation direction is collected and analyzed. An advantage of this setup is its robustness as the laser beam and signal are partly guided by the same optical components. Disadvantages are potential interferences from scattering and fluorescence signals generated in the optical components and windows/cell materials confining the sample. Moreover, there are fewer simple possibilities for enhancing the signal intensity. The backscattering principle is also used in Raman microscopy and fiber-coupled Raman probes for process monitoring.
Figure 2. Typical experimental arrangements for Raman spectroscopy. (a) Signal collection in direction perpendicular to the laser beam propagation (90°-setup); (b) Signal collection under 180° with respect to laser beam propagation (backscattering setup).
Energies 08 03165 g002

2.2.3. Advantages and Disadvantages

Raman spectroscopy has a number of advantages, but also some disadvantages compared to other methods. Advantages include the following:
  • The wavelength of the light source can, in principle, be chosen arbitrarily. Due to the non-resonant nature of the Raman scattering process, the incident light does not have to match a molecular transition in the species of interest. Consequently, all Raman-active species can be detected with a single laser source at the same time.
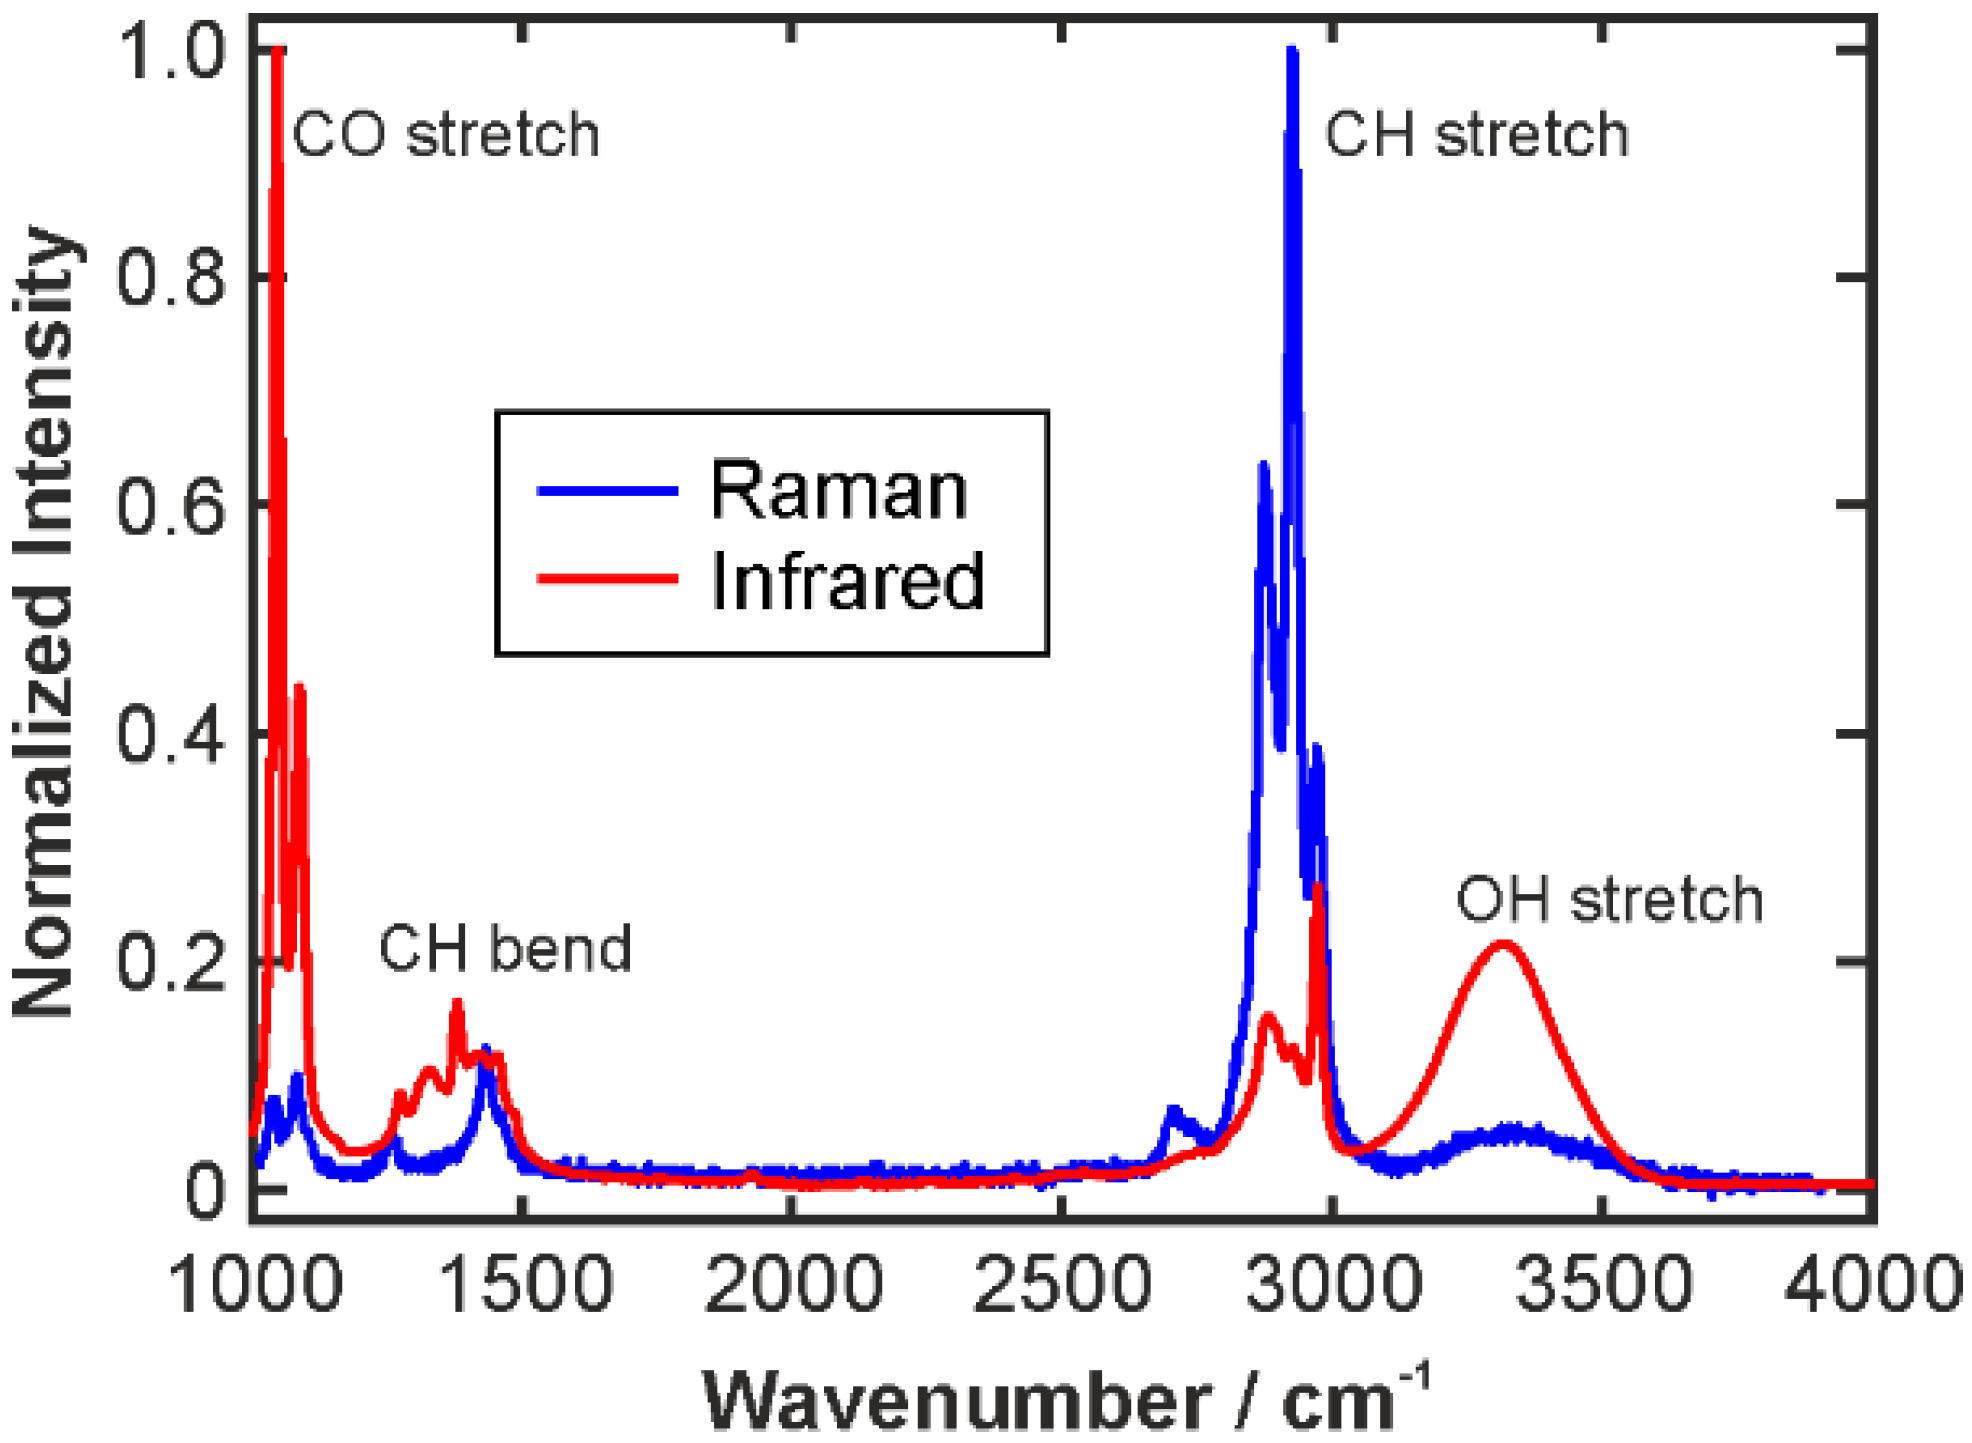
  • Most molecules, in particular those in typical fuels, are Raman-active and hence can be detected simultaneously. This includes the homo-nuclear diatomics, which cannot be measured using IR spectroscopy.
  • Good sensitivity can be obtained. Depending on the scattering cross-section it can be in the order of ~0.1%. Multi-pass arrangements, the use of cavities, resonant or near-resonant excitation, and the utilization of plasmonic enhancement (surface enhanced Raman scattering, SERS) allow a further significant improvement of the sensitivity for selected species. An LOD in the order of ppm and sub-ppm can be achieved.
  • Fiber-coupled probes allow in situ measurements without the requirement of large optical accesses to the sample.
  • The technique allows fast measurements at high repetition rate. The measurement time can be sub-second. However, it must be kept in mind that the shorter the measurement/acquisition time the lower the sensitivity and accuracy as the noise level increases. Pulsed laser sources are suitable to bring acquisition times down to nanoseconds should extremely high temporal resolution be required.
  • Water has a weak Raman scattering cross section. Therefore, even in aqueous systems, Raman scattering does not suffer from water interference like in IR.
On the other hand, disadvantages include:
  • Accurate gas-phase measurements often require high power laser sources in order to generate sufficient signal photons.
  • Interference from laser-induced fluorescence may be a problem in some applications. In order to avoid such effects a number of approaches have been developed including near-infrared Raman [26], deep-UV Raman [27], polarization-resolved detection Raman [28], and shifted-excitation Raman difference spectroscopy (SERDS) [29,30,31,32]. An overview can be found in reference [23].
  • The 90°-setup normally requires three optical accesses, which cannot always be arranged in a technical object.
  • The presence of phase boundaries, e.g., when the sample contains small particles or droplets, can result in interference from elastically scattered light (Rayleigh scattering and Mie-Lorentz scattering). This scattering can be orders of magnitude stronger than the Raman signal. Therefore, suitable spectral filters may be required, for example holographic notch filters or long-pass filters, or a combination of the two.

2.3. Signal Evaluation

This section will introduce methods for evaluating spectroscopic data. In order to get an idea of how a vibrational spectrum looks like, the Raman and IR spectra of liquid ethanol are displayed in Figure 3. Some peaks are weak in one spectrum, while they are very strong in the other, and some features appear in only one of the two. Hence, the best suited method for a given application needs to be selected carefully.
Figure 3. Experimental vibrational spectra (Raman and IR) of liquid ethanol and assignment of the main peaks.
Energies 08 03165 g003
In the following, we discuss simulated spectra of three different fictive species and their mixtures in order to demonstrate the methods in a clear way. The three pure species spectra are plotted in Figure 4 together with their ternary mixture (20% species 1, 50% species 2 and 30% species 3). The peak positions were chosen so that some peaks of different species are overlapping with each other and some peaks are isolated.
Figure 4. Fictive spectra of three notional species (spc1–3) and their ternary mixture (mix).
Energies 08 03165 g004

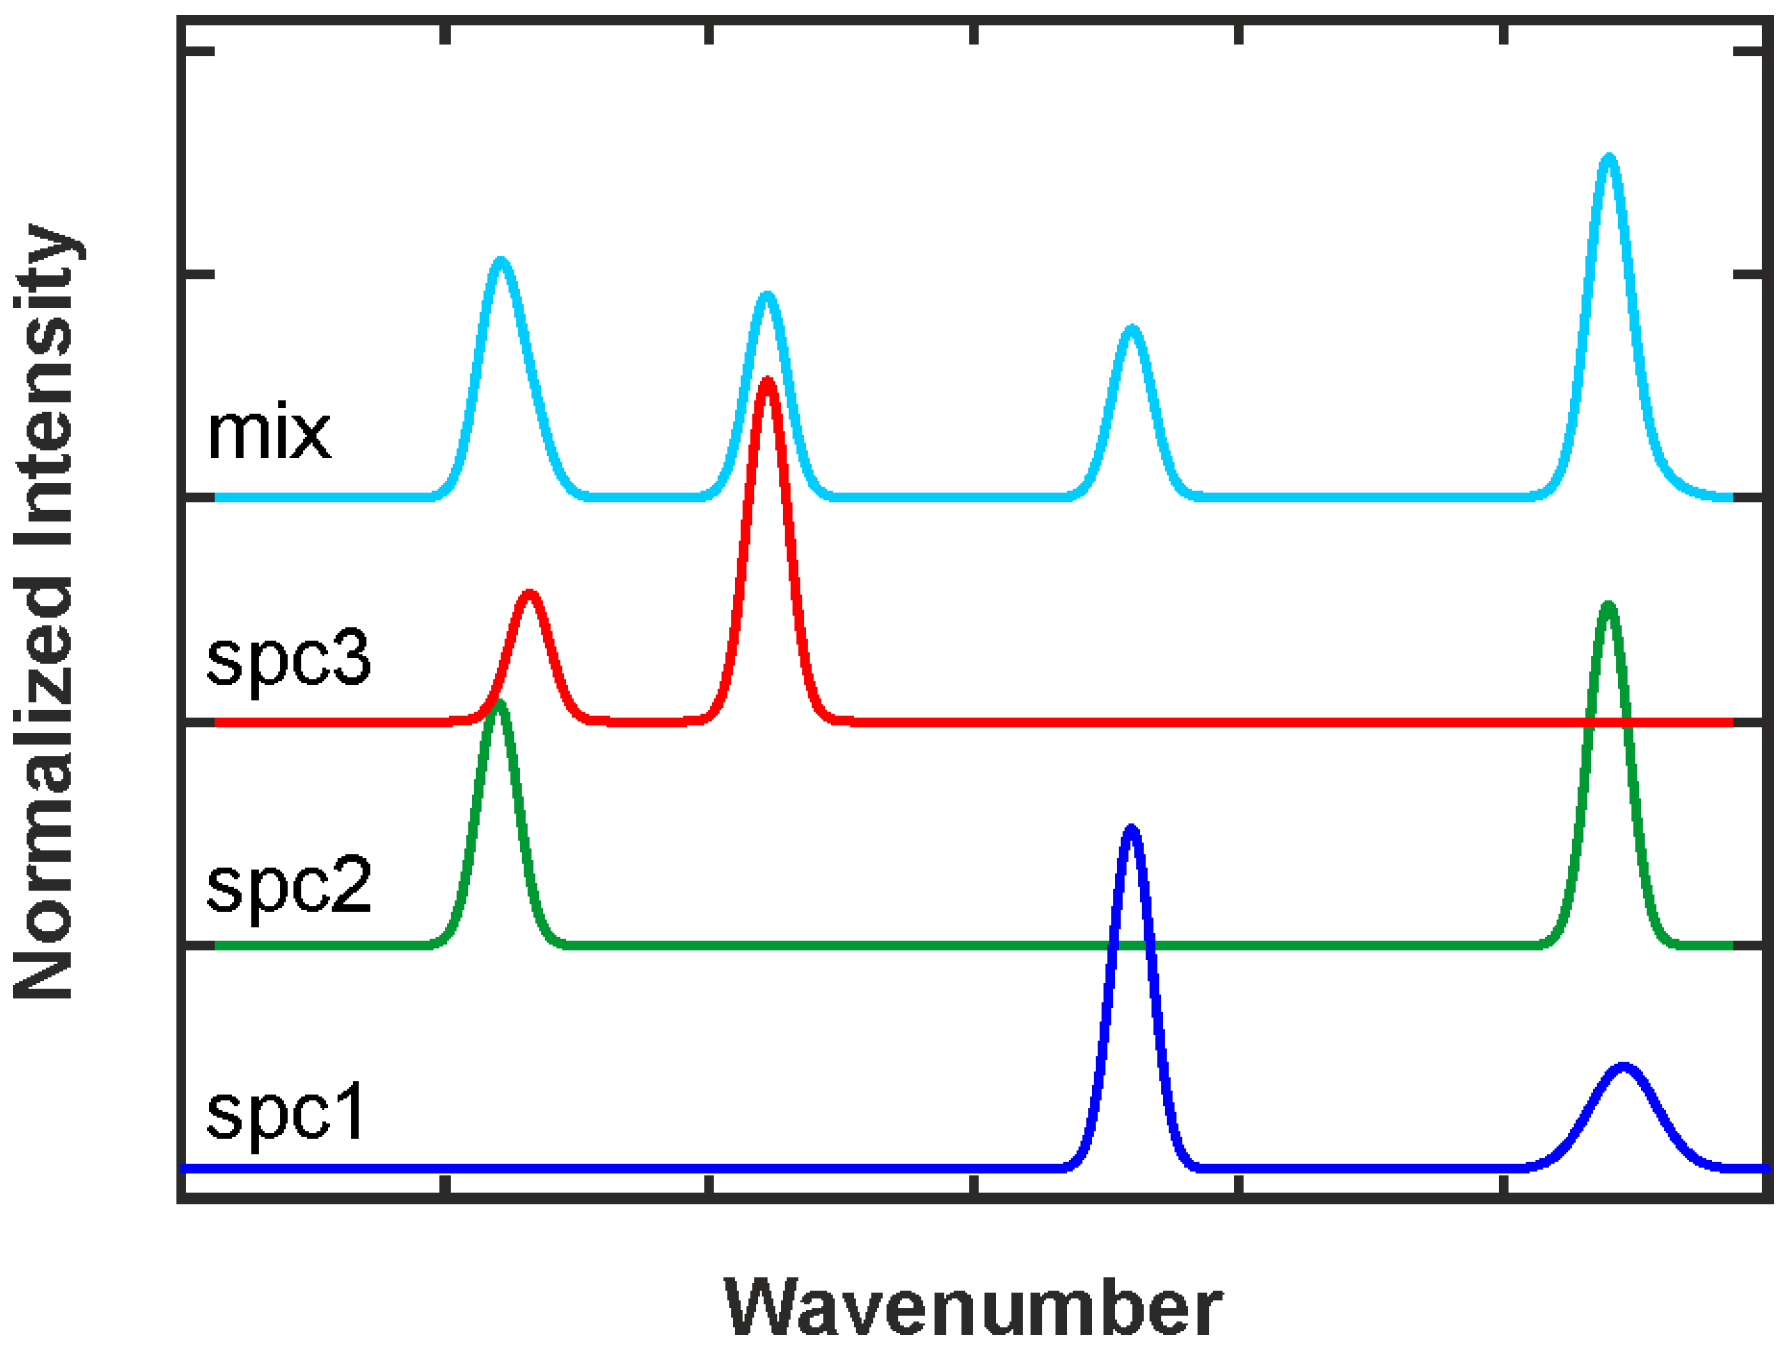
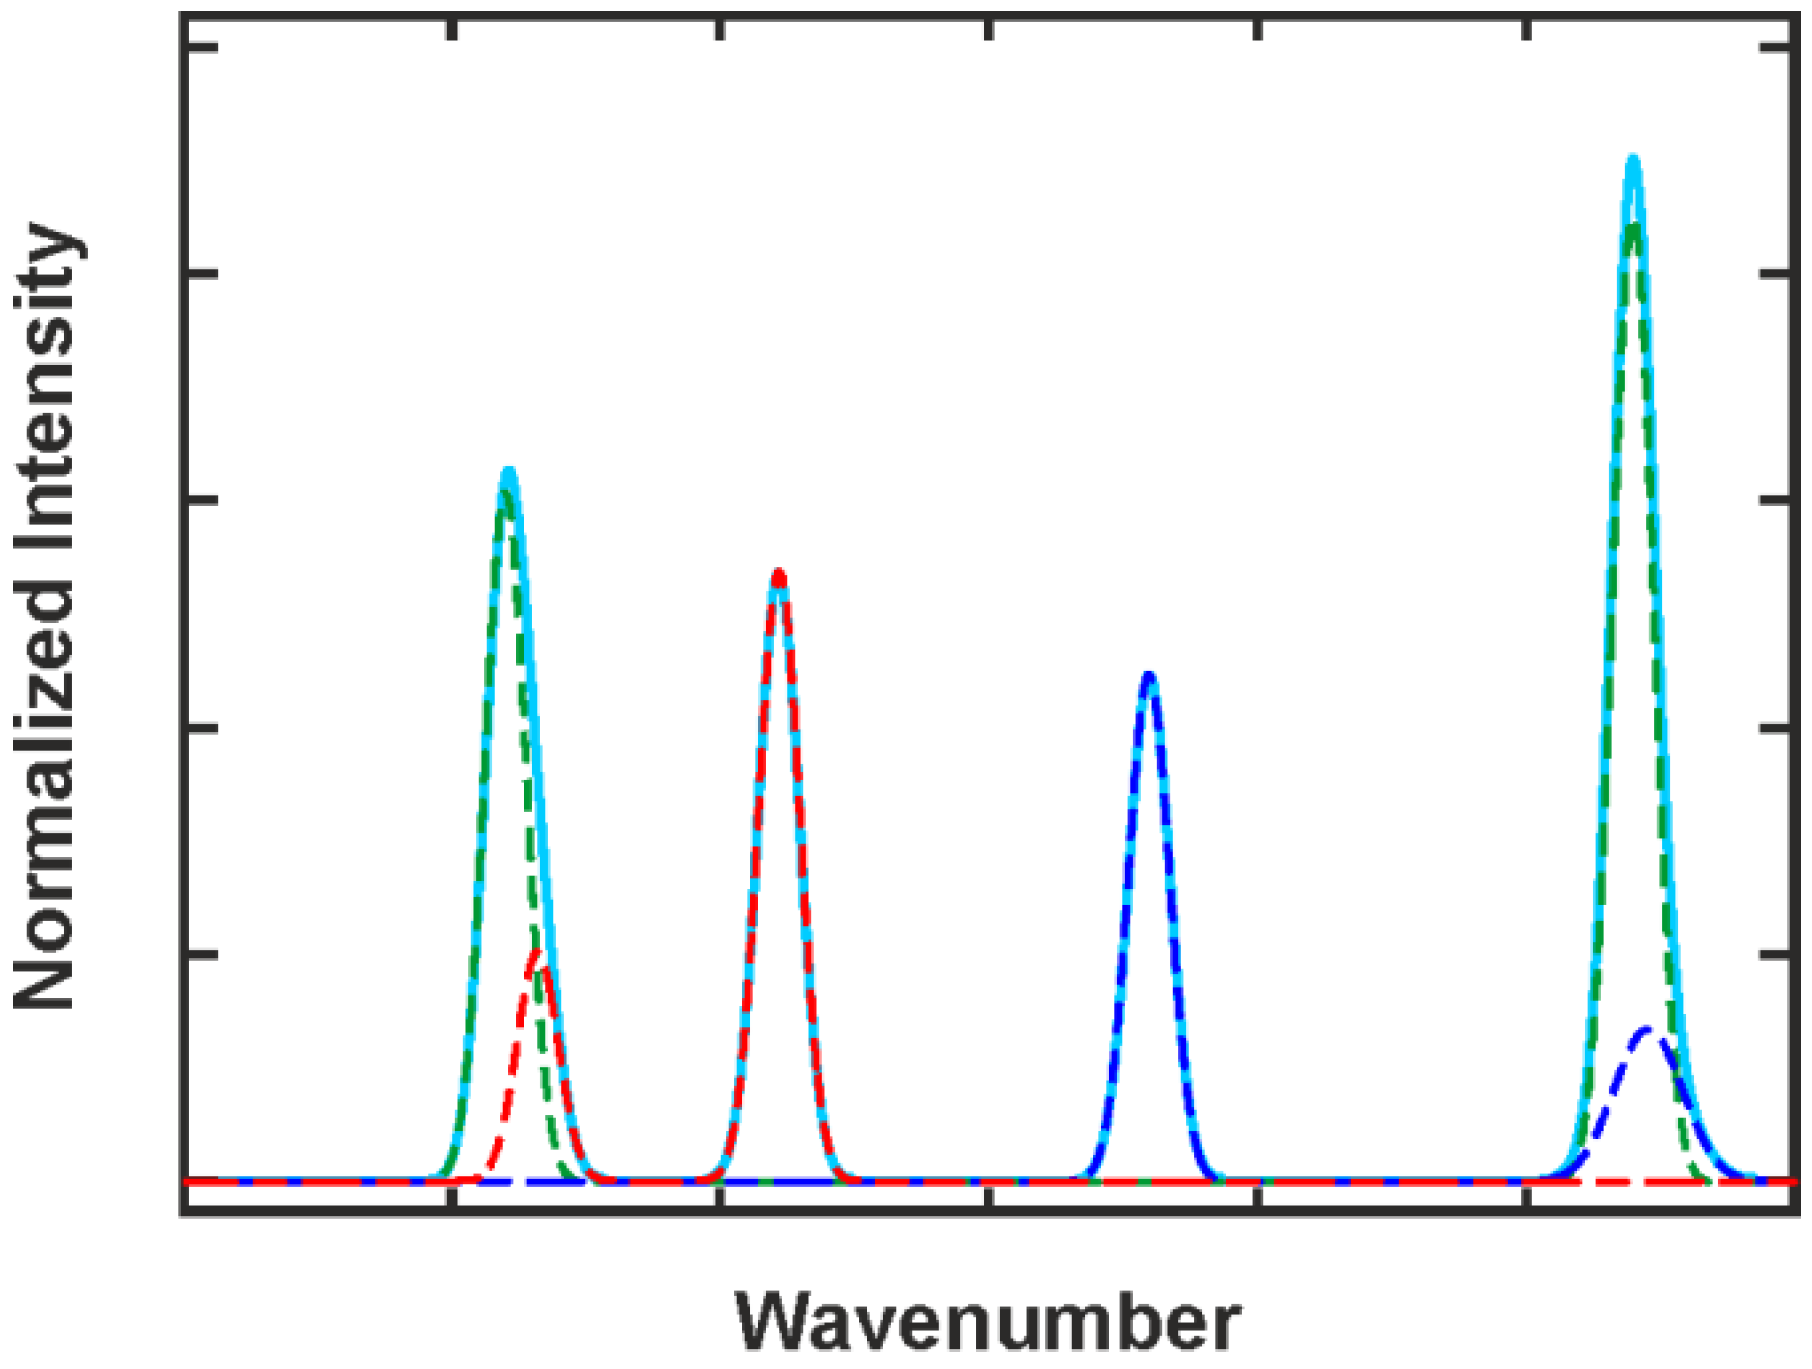
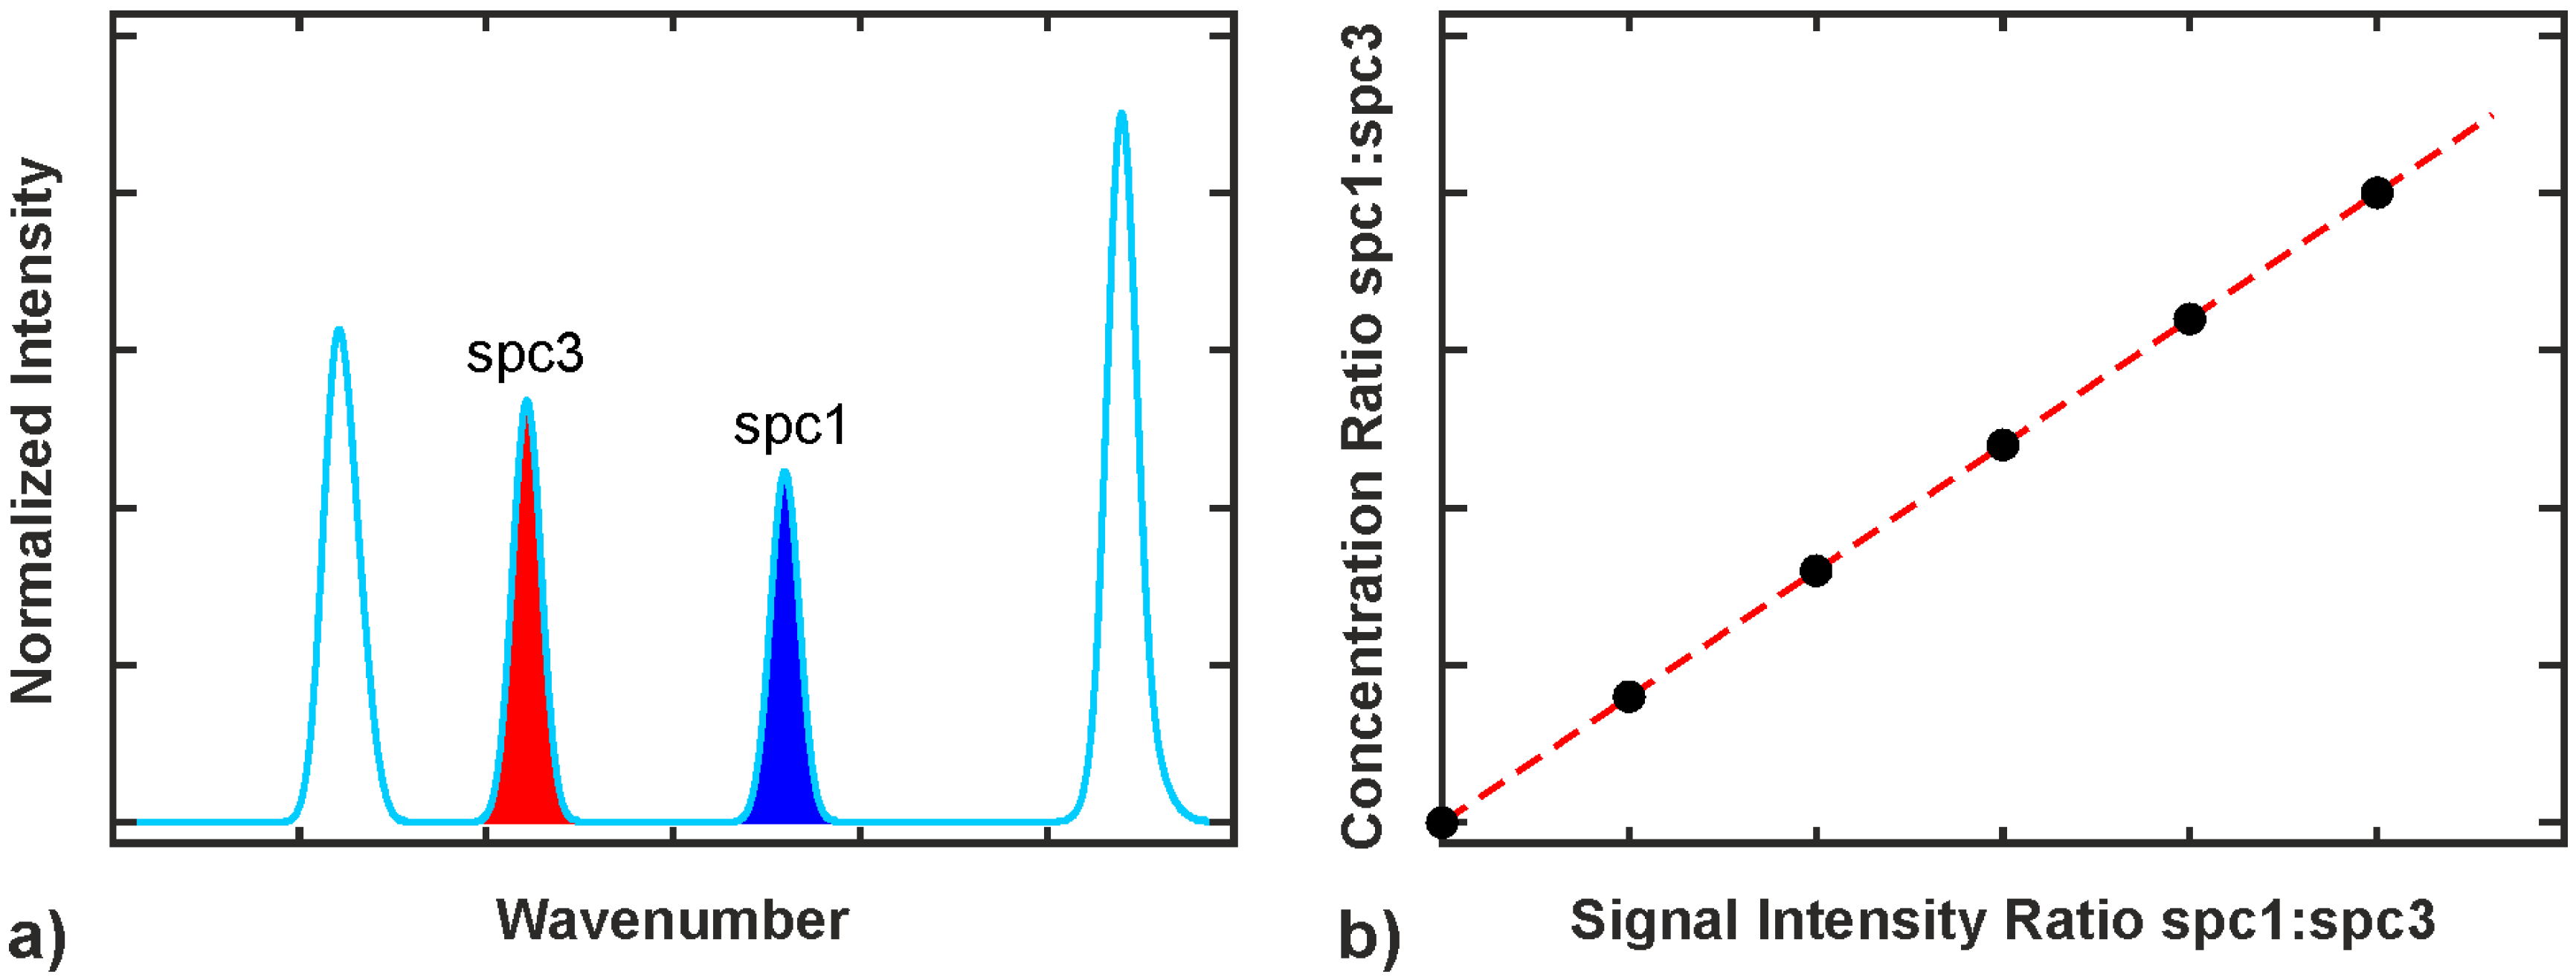
2.3.1. Intensity and Intensity Ratio Calibration

The most straightforward method to extract quantitative information from a vibrational spectrum is to calibrate the intensity of a single peak against the concentration of the corresponding species according to Equations (3) and (6) for IR and Raman spectra, respectively. This approach can be used, if the peaks are isolated and if they are not significantly altered by molecular interactions (note that strong molecular interactions such as hydrogen bonding and polar interactions can lead to frequency shifts [33] and changes in the peak intensity [34]). In order to make the method more robust against statistical fluctuations due to noise in the spectra, a commonly used technique is to not only consider a single peak, but to take the ratio of two peaks from different species into account. This intensity ratio can be calibrated for the concentration ratio of the two species, hence a relative concentration is determined initially. If this is done for all species with respect to the same reference species, all the relative concentrations add up to 1. Hence, absolute concentration values can be derived [35]. The ratio method can even be used when there are overlapping peaks. But it should be noted that the resulting calibration curve will become non-linear.
For the given example, the intensity ratio of the two isolated peaks as indicated in Figure 5a can be calibrated against their concentration ratio. The resulting calibration curve is plotted in Figure 5b. As both peaks are not overlapping with contributions from other species, the calibration curve is a linear function.
Figure 5. Peak intensity ratio calibration. Panel (a) shows the mixture spectrum with two selected peaks marked; and panel (b) shows the resulting calibration plot.
Energies 08 03165 g005

2.3.2. Spectral Soft Modeling

Another straightforward method to obtain compositional analysis of a mixture spectrum is spectral soft modeling (note that the term soft modeling is sometimes used in the literature for other approaches as well, but it is used within this article in a consistent manner). In spectral soft modeling the spectrum of a mixture is considered as a linear combination of the weighted spectra of the pure components in the mixture [36]. The weighting factors of the individual species are determined in a simple fitting, e.g., minimizing the residual between the experimental spectrum and a synthetic spectrum calculated from the weighted pure species spectra. After calibration, the weighting factors of the individual species can be converted to concentration values. In order to avoid that the results are affected by changes in the overall intensity, for example due to intensity fluctuations of the light source, it is useful to normalize all spectra before feeding them into the calibration or evaluation routine. Normalization means dividing all intensity values of the spectrum by the maximum intensity so that the resulting spectrum ranges from 0 to 1 across the spectral range.
This approach only works as long as there are no spectral line shifts or changes in the signal intensity owing to non-ideal mixture behavior. Therefore, the method is mainly used in gases [37] and simple liquid mixtures [38]. For our example, the mixture spectrum and the weighted pure components spectra are illustrated in Figure 6.
Should only individual peaks in the spectrum exhibit non-ideal behavior in terms of line shifts and intensity changes, the spectral range used for evaluation can be restricted to those parts which are not affected. Thus, the soft modeling approach may be applicable in spite of an actually complicated mixture behavior.
Figure 6. Spectral analysis by soft modeling. The dashed lines represent the weighted pure component spectra.
Energies 08 03165 g006

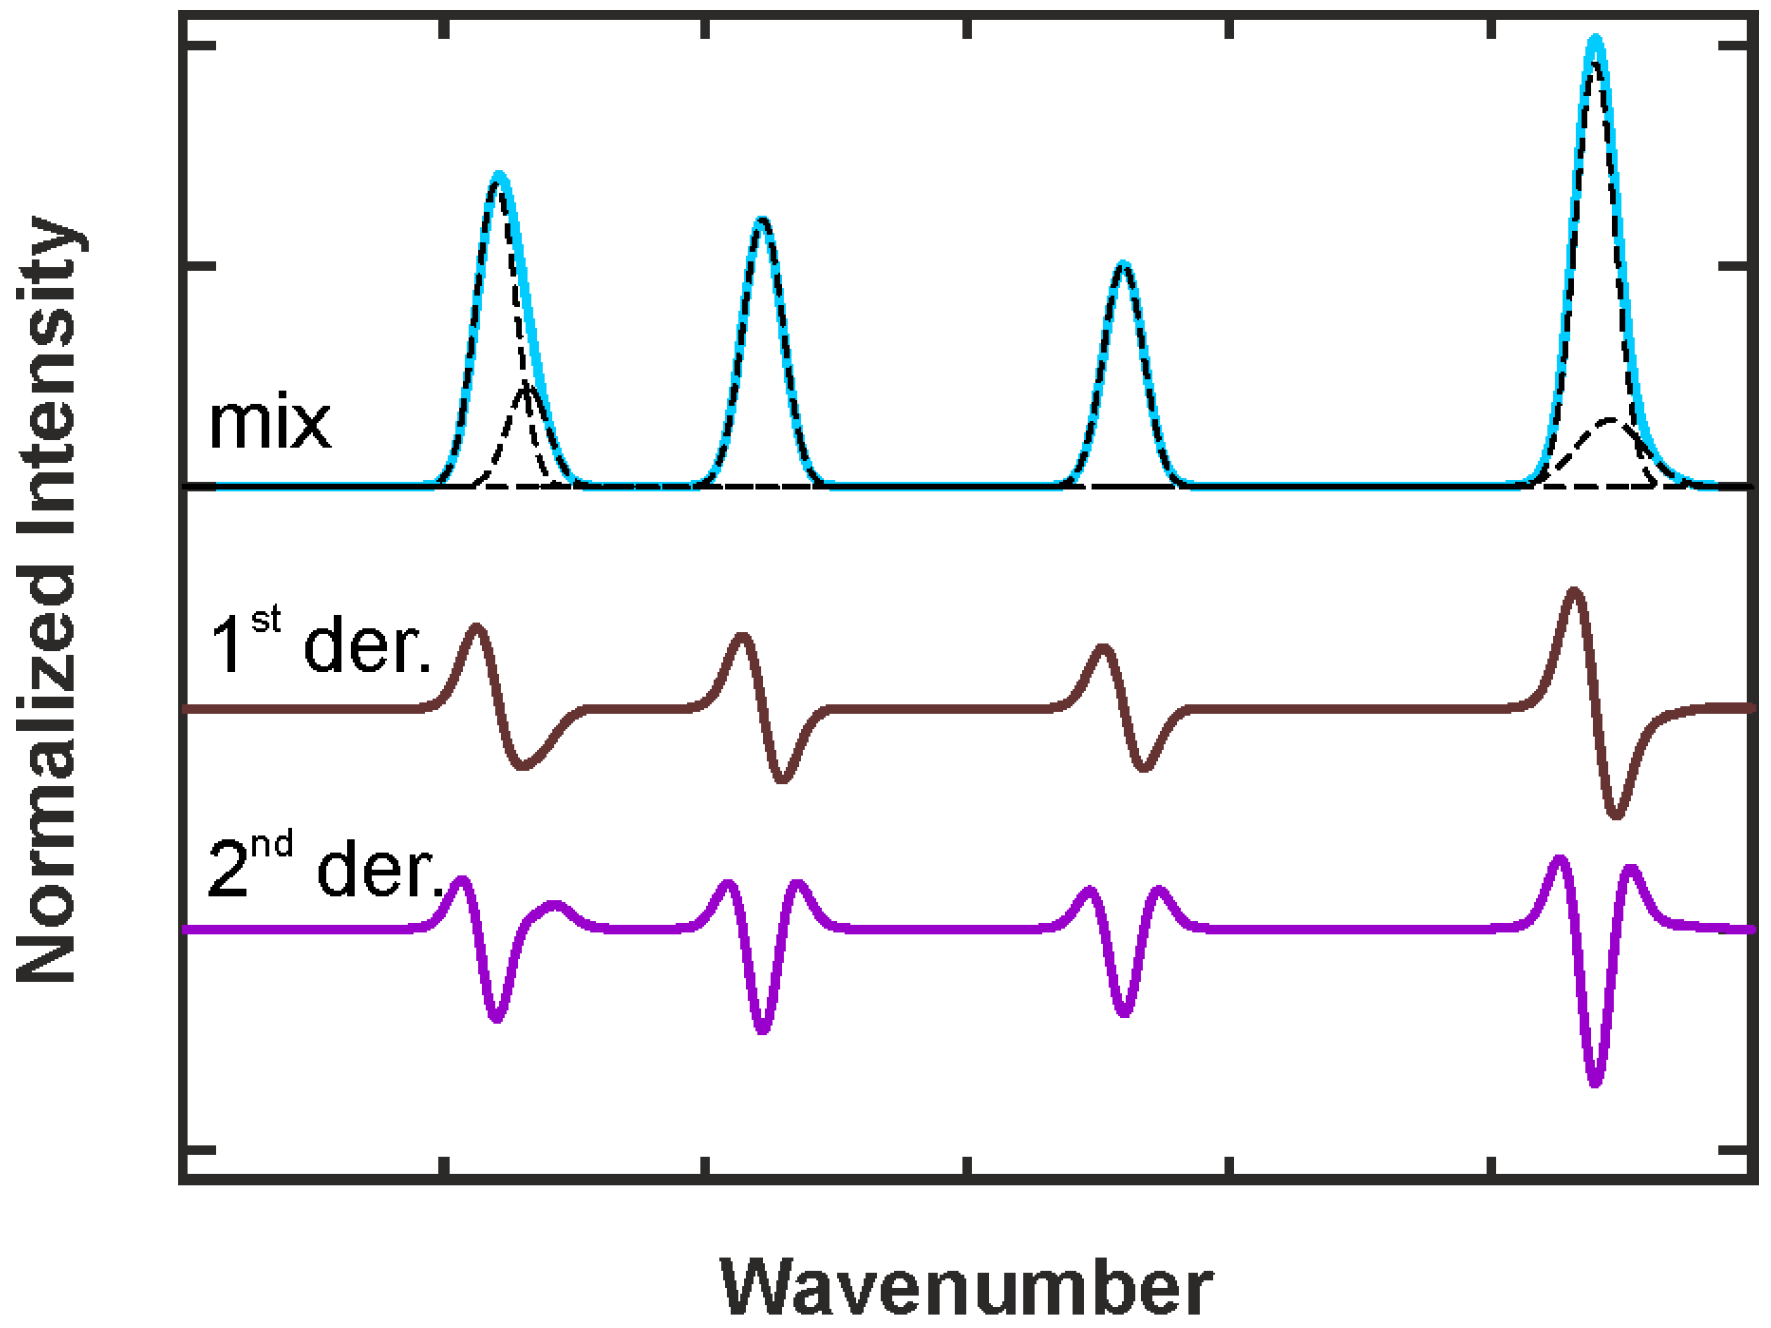
2.3.3. Deconvolution, Peak Fitting and Indirect Spectral Hard Modeling

More versatile approaches to spectral analysis are deconvolution, peak fitting and indirect spectral hard modeling. In all three, the spectrum is considered as a sum of individual peaks typically represented by Gaussian, Lorentzian or Voigt profiles. Deconvolution and peak fitting are basically the methods for identifying peaks and their spectral parameters such as center wavenumber, intensity, line shape, and bandwidth.
When peak fitting is applied, the experimental spectrum is fitted to a sum of individual lines (some of the spectral parameters may be fixed during this procedure) in order to obtain a good representation of the measured spectrum. In contrast, deconvolution algorithms determine these parameters computationally as a first step. For instance, the first and second derivative spectra are derived and the position of a peak in the original spectrum can be identified at the extreme values of the second derivative spectrum. This works even for overlapping peaks. For our example mixture, the derivative spectra are plotted in Figure 7. It can be clearly seen, that the original mixture spectrum exhibits peaks, where the derivative spectrum has an extreme value. The deconvolution is particularly useful, when the signal exhibits a high signal-to-noise ratio. When the noise level is high, however, the analysis via derivative spectra becomes problematic as statistical fluctuations may incorrectly be identified as peaks by automatic deconvolution algorithms.
Eventually, the peak parameters can be calibrated against the mixture composition and hence, when these parameters are determined in a spectrum of an unknown mixture, the compositional information can be obtained. This procedure is known as indirect spectral hard modeling [39,40]. In order to reduce the computational cost, it is reasonable to reduce the spectral window of interest to a minimum. In other words, a limited spectral region with contributions from all species of interest is chosen before a detailed analysis is carried out.
Figure 7. Derivative spectra and resulting deconvolved peaks (dashed lines).
Energies 08 03165 g007

2.3.4. Chemometrics

Chemometrics represents the most universal toolbox for spectral analysis, but it is at the same time mathematically complicated and computationally demanding. Chemometrics is based on statistics and hence it can be considered a purely empirical approach. It has great advantages when large data sets with a large number of variables (e.g., spectra depending on composition, pressure, temperature etc.) need to be evaluated in a systematic manner. In order to reduce the number of variables, the initial step is usually a principal or independent component analysis (PCA or ICA, respectively). For this purpose, an orthogonal transformation is employed to convert a set of measured data of possibly correlated variables into a set of values of linearly uncorrelated variables [41]. These uncorrelated variables are called the principal components. A principal component, for instance, can be a characteristic spectral signature, which reflects changes in the concentration of a species in the mixture, but it does not necessarily have to be a peak of this species.
As a second step, a regression analysis relates the parameters determined with the quantity of interest. Common methods use a partial linear least squares regression (PLSR), but also non-linear higher-order approaches such as support vector machines (SVM) can be utilized [32]. A more comprehensive description of chemometrics can be found in the literature, e.g., in the textbooks of Bakeev [42], and Mark and Workman [43].

3. Characterization of Gaseous Fuels
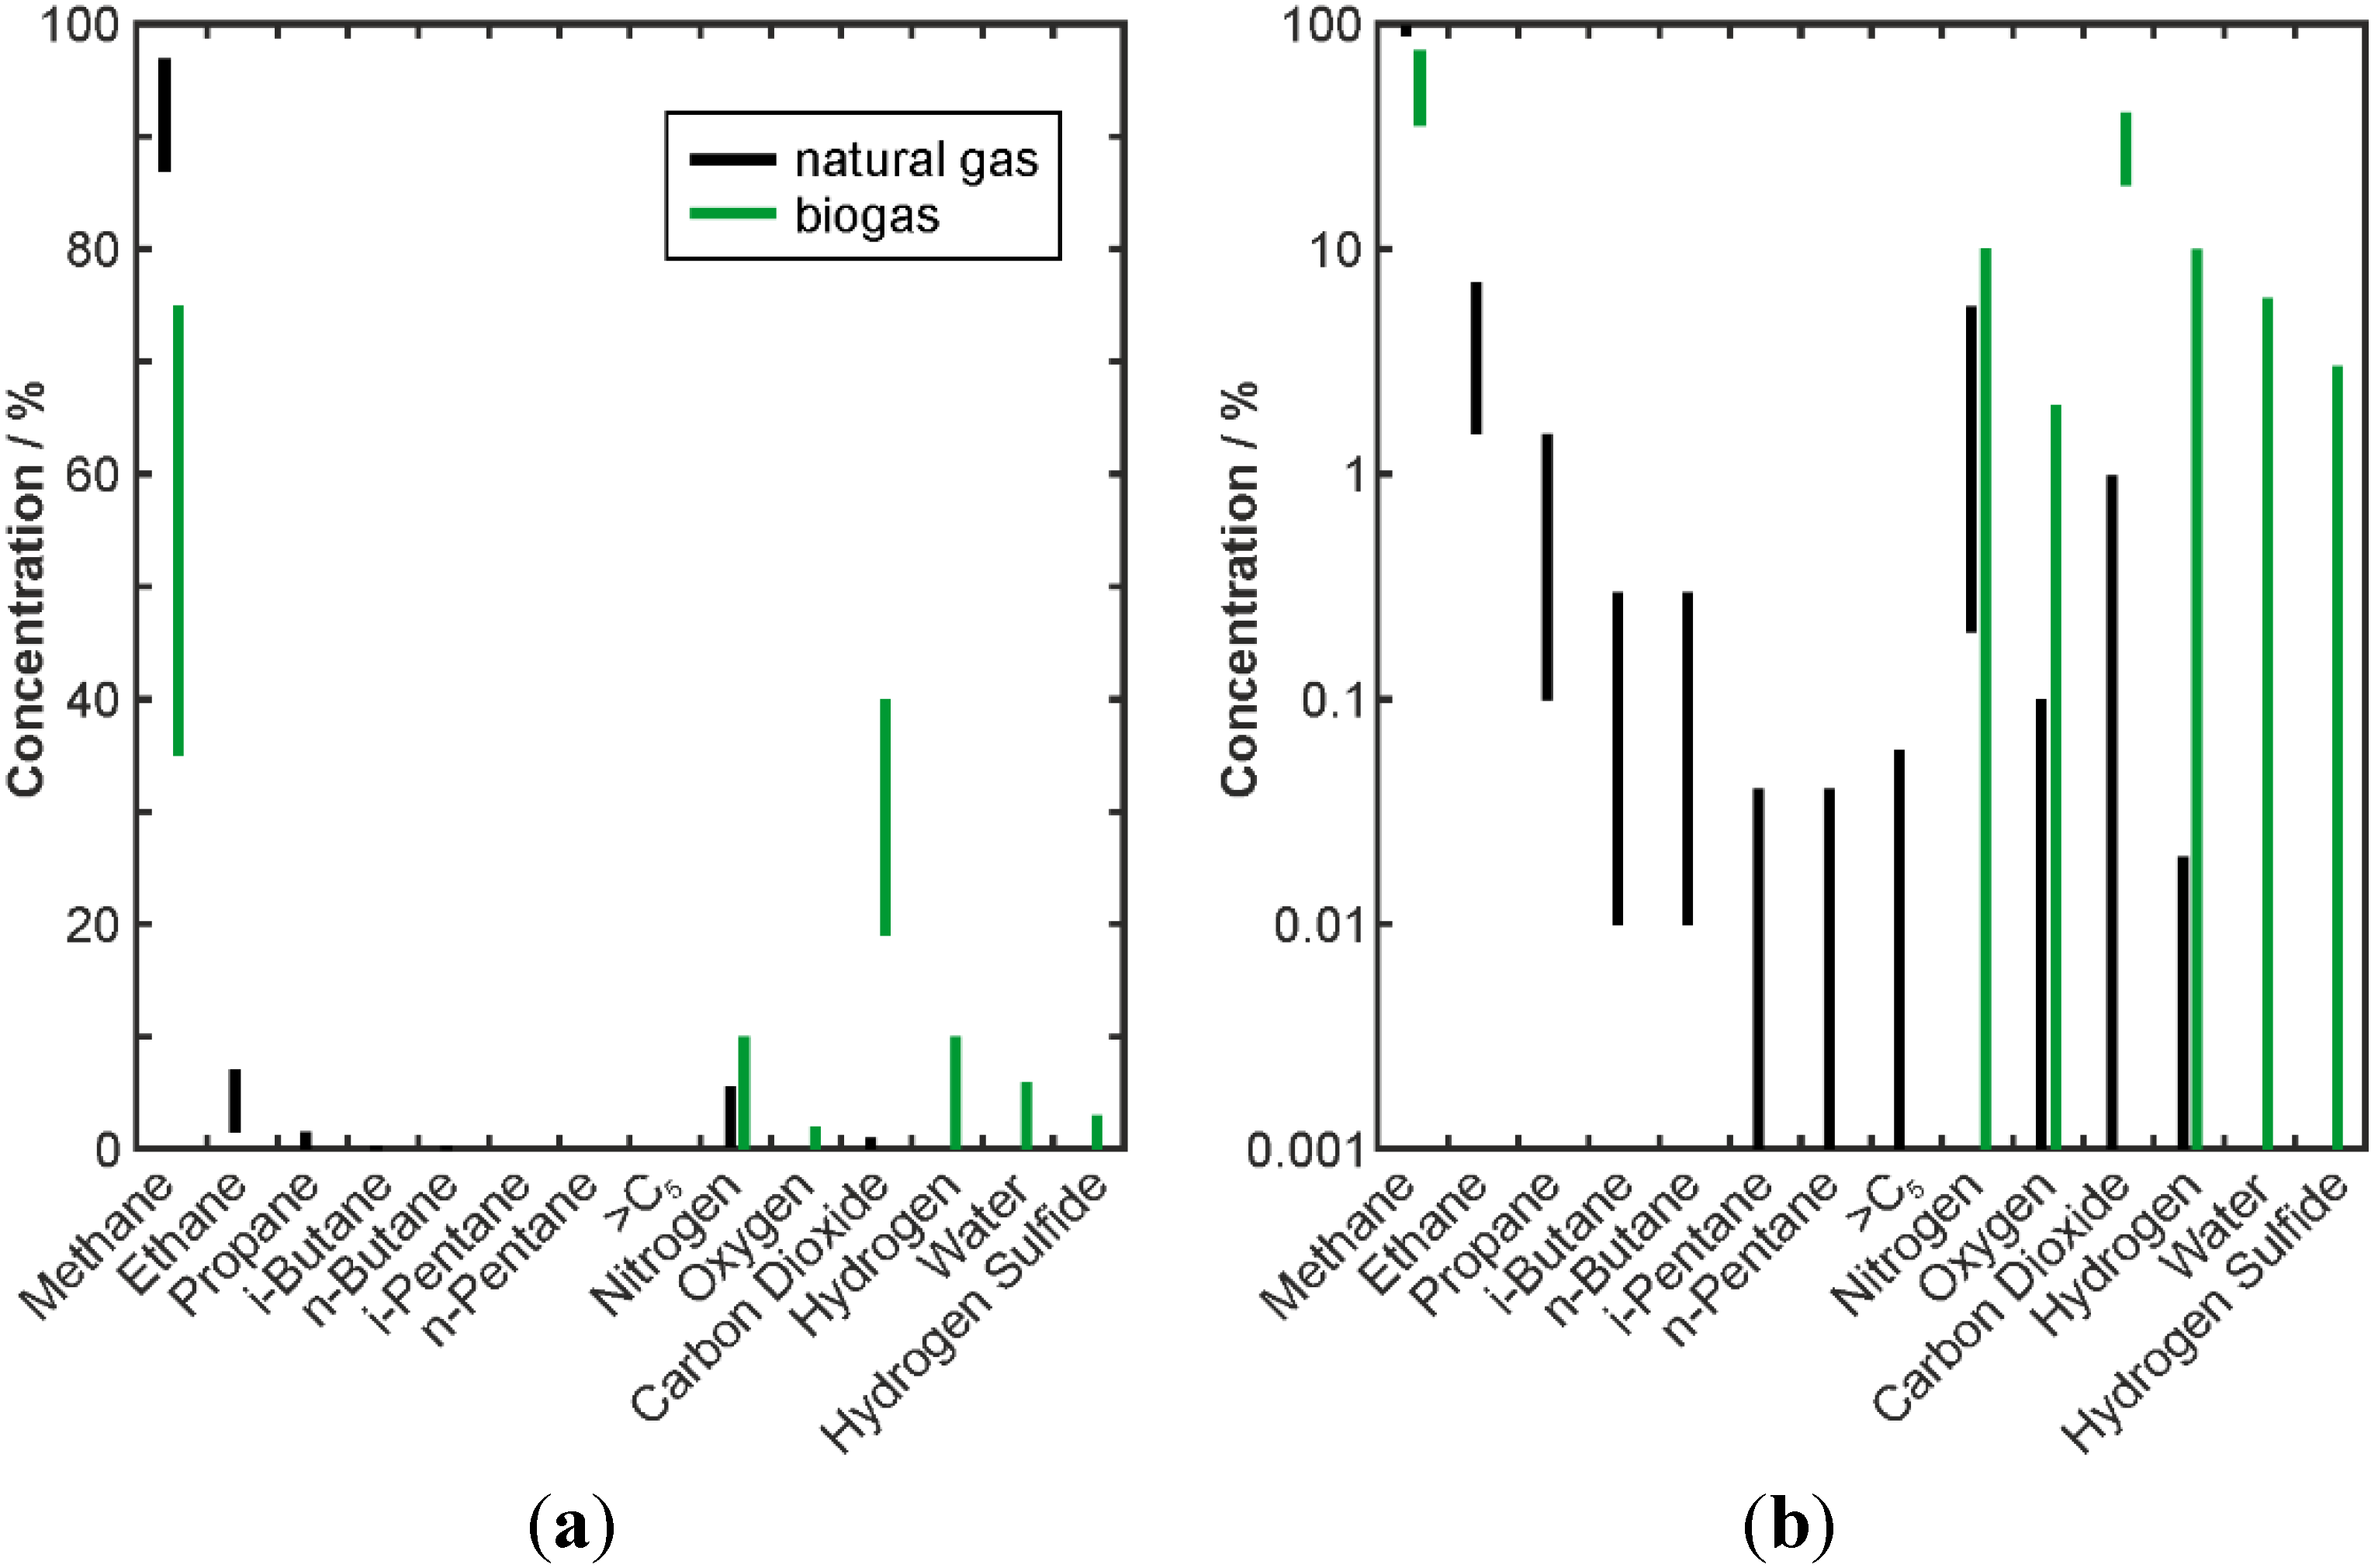
This chapter gives an overview of vibrational spectroscopy applications to gaseous fuels. Specifically the analysis of natural gas, biogas and other alternatives such as syngas will be reviewed. However, before going into detail of the published work, we need to clarify, which parameters are usually of interest for the characterization of a gaseous fuel.
The full and most comprehensive analysis would be to determine the concentration of each individual component (typical concentration ranges of the main components of natural gas and biogas are illustrated in Figure 8). The practitioner, e.g., the operator of a pipeline or a gas turbine, however, may not be interested in such details. In many cases, the knowledge about the energy content of the fuel and the presence of potentially harmful substances (e.g., toxic or corrosive species) may be sufficient. Hence, there is a need to convert the concentration information obtained from a vibrational spectrum to characteristic parameters such as the calorific value, the relative density, and the Wobbe index. The latter represents the ratio of the superior heating value and the square root of the relative density. This definition of the Wobbe index establishes a comparability and exchangeability of gaseous fuels. In other words, for a given burner system, one fuel can be replaced by another when they exhibit the same Wobbe index, without the need for modifying the burner settings and configuration. The commonly applied rules for this conversion of parameters are summarized for natural gas in the international standard ISO 6976 [44], where further details can be found.
Figure 8. Typical concentration ranges of natural gas and biogas. The data are plotted on linear scale (a) and logarithmic scale (b) for readability.
Energies 08 03165 g008

3.1. Natural Gas

Natural gas is normally a mixture of small hydrocarbons, mainly methane and ethane, with certain amounts of inert gases such as nitrogen and sometimes carbon dioxide. Due to its high hydrocarbon content, it is classified as a high-calorific-value gas (H-gas). However, its composition can differ dramatically depending on the region where it is produced. A good overview can be found in the Gas Composition Transition Agency Report 2013 [45].
The application of vibrational spectroscopy to natural gas or related gas mixtures focused on the determination of the mixture composition or the concentration of selected species of interest. For the latter, absorption spectroscopy in the mid- and near-infrared is the method of choice.
Due to the fact, that some important species such as hydrogen, oxygen and nitrogen are not IR-active, absorption-based techniques are of limited use for a comprehensive compositional analysis of natural gas. Nevertheless, applications of absorption spectroscopy to natural gas systems are broad. For example, Haus et al. [46] used FTIR spectroscopy to determine the temperature and concentrations of methane, carbon monoxide and dioxide, nitric oxide, and water vapor in the gas emitted from natural gas flares. Makhoukhi et al. [47] compared mid- and near-IR spectroscopy with chemometric analysis to determine the composition of model hydrocarbon mixtures containing methane, ethane and propane. They did a systematic investigation of different spectral ranges and resolutions, and eventually concluded that NIR is better suited than the mid-IR. Therefore, mid-IR applications are relatively rare compared to NIR, for which only a few selected pieces of work are discussed here as this article focuses on IR and Raman techniques.
Dantas et al. [48] used NIR spectroscopy to measure the methane content of natural gas. The monitoring of methane can be sufficient, when its content is highly dominating the properties of the mixture. For instance, this is the case for such types of natural gas, which mainly consist of methane and only a few percent of other compounds. Beyond this, Mullins et al. [49,50] aimed at making NIR methods suitable for characterizing gases directly in well fluids under the relevant conditions (elevated temperature and pressure). They determined the gas-oil ratio of gas-containing crude oils and accomplished a compositional analysis.
Because of its capability of detecting all relevant species simultaneously, Raman spectroscopy has experienced great interest in the context of natural gas analysis since the 1980s. An early feasibility study of the applicability of Raman spectroscopy to natural gas analysis was carried out by Diller and Chang in 1980 [51]. They studied gas mixtures with eight components (seven hydrocarbons and nitrogen) at ambient temperature and pressures up to 8 bar using an argon ion laser as excitation source (2W, 514.5 nm) in a 90°-arrangement. A measurement uncertainty of 0.1% (mole fraction) was found when the experimental setup remained undisturbed (the sensitivity of the 90°-setup to misalignment was discussed above). In order to widen the range of possible measurement conditions, Brunsgaard Hansen et al. [52] developed a high-pressure cell for the 90°-Raman setup. They were able to reach pressures as high as 150 bar and reported a remarkable detection limit of hydrogen sulfide in the order of a few mg/m3. For signal quantification, they used the ratio method described in Section 2.3.1. Other work focused on enhancing the Raman signal intensity in order to improve the measurement sensitivity and accuracy. Multi-pass arrangements are the state-of-the-art, but innovative approaches include the use of capillaries in order to increase the size of the measurement volume. For example, Buric et al. [53] utilized a hollow-core photonic crystal fiber, through which the gas was flowing. A comparison with a traditional 90°-setup revealed a signal enhancement of 2–3 orders of magnitude. Consequently, a laser with relatively low power could be employed (0.1 W, argon ion). High sensitivity with a low-power laser was also achieved by Hippler et al. [54]. They built a cavity, in which the radiation of a diode laser (10 mW, 635 nm) was enhanced by three orders of magnitude to measure hydrogen, methane and benzene vapor. These works represent a quite important step, as stable and reliable laser sources with <1 W power are becoming commercially available at reasonable cost. Hence, the light source does not represent the most expensive piece of equipment in a gas phase Raman setup any longer. This opens up new possibilities for developing compact and relatively cheap gas phase analyzers based on Raman scattering. This facilitates applications in the field instead of being in need of bringing the sample to an analytical lab.
As a consequence, there have been a number of attempts to develop Raman sensor systems for gas phase measurements. A commercial gas analyzer is available from Kaiser Optical Systems Inc. [55]. With a special focus on natural gas analysis, two further systems have been developed in the last 15 years. The group of Seeger and Leipertz et al. built a compact device utilizing the 90°-geometry. They tested solid state lasers and diode lasers as light sources [56]. The measurement errors were below 0.05% in a lab experiment with a 5-W Nd:YLF laser (532 nm). The final sensor was built as a compact and portable box (560 × 540 × 300 mm, 30 kg) and reached measurement uncertainties as low as 0.01% for the major species in natural gas [57] and measurement times significantly below a minute [58]. Equipped with a software for controlling the sensor hardware and for evaluating the Raman signals, the fully automatic device was used to monitor the composition of natural gas in a gas turbine power plant [37,59]. The software used the spectral soft modeling approach and derived values of the calorific value and the Wobbe index from the gas composition determined. Excellent agreement with reference gas chromatography measurements was found. In recent years, Buldakov et al. [60,61] developed a Raman analyzer for natural gas characterization as well. They obtained similar sensitivity (~0.01%) using a multi-pass arrangement and a 2-W laser (532 nm). However, their measurement time was 1000 s.

3.2. Biogas

Typical biogases are mixtures of mainly methane and carbon dioxide with relatively small amounts of other gases like nitrogen, hydrogen and hydrogen sulfide. The possible presence of molecules such as nitrogen and hydrogen, which are not IR-active, make Raman scattering the method of choice for characterizing biogases. This is reflected by the fact that mainly Raman spectroscopy was used to analyze biogas and related gas mixtures.
For the development and improvement of Raman methods for biogas analysis, simplified model gas mixtures are normally used. Seitz et al. [62] carried out a detailed analysis of the signal characteristics recorded in binary mixtures of carbon dioxide and methane. They accomplished simultaneous measurements of mixture composition and pressure at ambient temperature and pressures up to 700 bar. Buric et al. [63] utilized the back-scattered Raman signal from methane and carbon dioxide inside a hollow-core photonic crystal fiber and achieved detection of ~100 ppm with high temporal resolution (1–20 s). A similar approach was used by Pearman et al. [64], who developed a metal-coated capillary tube as a multi-pass gas cell for analyzing carbon dioxide-methane mixtures with high sensitivity. These developments make Raman spectroscopy a suitable method for leak detection and environmental monitoring of pipes carrying biogas. Kiefer et al. [37] showed that their sensor system developed for natural gas analysis is also capable of characterizing biogas. For this purpose, they tested a mixture of nitrogen, carbon dioxide, methane and hydrogen. They concluded that the spectral soft modeling algorithm works without the need for re-calibration although the concentration ranges of the individual components in the biogas were significantly different from the calibrated model gas.
A few applications to real (i.e., no artificial model gases) biogases have been reported very recently. Numata et al. [65] used a commercial Raman spectrometer with an argon ion laser (488 nm) to analyze fermentation gases containing methane, hydrogen and carbon dioxide. Calibration measurements were carried out in binary and ternary gas mixtures, and good agreement with reference values was found. For signal evaluation, the intensity ratio method was used taking advantage of the fact that the three gases under investigation exhibit Raman peaks well separated from each other. In more complicated mixtures, i.e., with more components and overlapping peaks, the spectral soft modeling approach was applied successfully by Seeger et al. [66,67]. They modified their natural gas analyzer [57] in order to meet the special needs of biogas systems [67]. For example, the spectral range was extended and a multi-pass arrangement was implemented in order to enable detection of the weak Raman signals from water vapor. Moreover, a detailed investigation of temperature and pressure effects on the spectral properties was carried out in order to improve the flexibility of the system. Eventually, this allowed gas monitoring at various points in a biogas plant. In this facility, biogas was produced by fermentation and further processed in order to meet the specifications of a gas distribution system. The measurement time was about 60 s, which is longer than in the previous natural gas experiments [37]. However, it must be pointed out that the natural gas analysis was carried at elevated pressure (35 bar) while the biogas was analyzed at ambient pressure; hence a significantly lower gas density. Schlüter et al. [66] further improved the system and achieved measurement times in the order of 1 s maintaining an uncertainty of about 0.1% at ambient pressure. The fully automatic instrument was successfully tested at different places in a biogas plant, in which food leftovers were fermented [66].

3.3. Alternative Gaseous Fuels and Special Applications

Raman spectroscopy has found a number of further applications to characterize fuel gases. For example, synthesis gas (also known as syngas), which represents mixtures mainly comprising of carbon monoxide and hydrogen, were analyzed by Raman techniques. Eichmann et al. [68] carried out a systematic investigation of the pressure and temperature influence on the Raman spectra of carbon dioxide/hydrogen mixtures in order to develop an approach for determining the composition of syngas. Moreover, they discussed the suitability of different spectral ranges used for data evaluation and concluded that the fingerprint region from 300 to 1600 cm−1 provides the best accuracy. For syngas containing carbon monoxide, this range would need to be extended to ~2300 cm−1, which is possible in a straightforward manner. Eichmann et al. [68] substituted carbon monoxide by carbon dioxide for safety reasons, as CO is a highly toxic substance and can be harmful even at low concentration [69]. Therefore, syngas applications require high safety standards and gas leakage must be detected as early as possible; hence the need for highly sensitive analytical methods. For very sensitive detection of carbon monoxide, Rae and Khan [70] applied surface enhanced Raman spectroscopy (SERS). They developed a substrate with mixed silver/palladium nanoparticles and achieved qualitative detection of CO in a gas stream containing 1% CO employing a low-power laser source (1 mW), which is remarkable for a gas phase system. These results show the potential of developing low-cost Raman instruments for gas phase analysis. Translating these results to Raman systems with a high power laser, the detection limit can be in the order of ppm.
Other areas, where the detection, quantification and characterization of typical fuel gases is important are those in which the gas is dissolved in a fluid or bound in a solid material. Li et al. [71,72,73] built a Raman system with a multi-pass near-confocal cavity to analyze the gas separated from transformer oil. The gas of interest contained hydrogen, nitrogen, carbon monoxide and dioxide, as well as small hydrocarbons. The cavity enhancement allowed detection of ppm-levels of the different gases employing a 200-mW laser with a wavelength of 532 nm.
Raman spectroscopy was also successfully applied to gas hydrates. Hydrates (or clathrates) are ice-like, crystalline structures, in which small non-polar gas molecules are trapped inside cages of hydrogen-bonded water molecules. Large quantities of methane hydrates can be found on the seabed of the ocean [74] making these compounds a possible alternative source of fuels. Therefore, there is an ever increasing interest in characterizing hydrates. Methane hydrates are most frequently studied by Raman spectroscopy. Due to the presence of relatively large amounts of water, the applicability of absorption spectroscopy in the infrared is limited. Uchida et al. [75] used Raman spectroscopy to measure the hydration number, i.e., molecular ratio of methane and water in the hydrate, in artificially prepared and natural clathrates. They showed that the hydration number was virtually independent of the formation conditions. Natural hydrates were studied directly on the seabed in terms of structure and composition with a subsea Raman instrument by Hester et al. [76]. Interestingly, they identified small amounts of hydrates, in which hydrogen sulfide was the guest molecule inside the water cage. The same group also expanded the range of possible guest molecules to other small hydrocarbons commonly found in natural gas [77,78], such as ethane, propane, butane and pentane. They found similar structure, composition and heterogeneity in artificially prepared and natural hydrates. This led to the conclusion that the synthetic preparation of hydrates under controlled lab conditions is capable of simulating the processes occurring naturally on the seabed. Similar conclusions were drawn by Uchida et al. [79], who studied hydrates formed from gas mixtures containing methane, ethane, propane, and butane. Moreover, the results obtained subsea [76,77] proved the potential of Raman spectroscopy for the application to a complicated type of material in a very challenging environment.

4. Characterization of Liquid Fuels

This chapter gives an overview of vibrational spectroscopy applications to liquid fuels. Gasoline and diesel are the most prominent examples and represent the most widely used types of liquid fuels. However, owing to the ongoing depletion of the natural resources of petrochemicals, significant effort is currently being made to replace fossil fuels by renewable alternatives, at least in part. For this purpose, conventional fuels are commonly blended with certain amounts of biofuels and hence the need for characterizing these mixtures. Needless to say, that the fossil fuels are complicated mixtures themselves as well.
The parameters of interest, when a liquid fuel is characterized are (besides its chemical composition) its calorific value, the research octane number (RON) for gasoline, and the cetane number (CN) for diesel. The RON indicates how much a fuel can be compressed in an engine before it undergoes auto-ignition, which can damage the engine. The CN is a measure of the combustion behavior, e.g., in terms of the characteristic ignition delay. A detailed account of automotive fuels and their characteristics can be found in reference [80].

4.1. Petrochemical Liquid Fuels

For the analysis of primary well fluids, such as crude oils, infrared and near-infrared spectroscopy are established methods. Raman spectroscopy has not been used for this purpose, because well fluids are typically opaque in the relevant spectral range. Hence, making Raman spectroscopy work would mean a substantial effort. In FTIR and NIR, this problem can be overcome by using the ATR-technique, in which the sample is penetrated by an evanescent field and transmission of radiation is not required. A common approach is to record spectra in mixtures with known composition and properties and feed the data into a large data base. The spectrum from an unknown sample can then be compared using appropriate numerical algorithms, e.g., Venkataramanan’s fluid comparison algorithm (FCA) [81] or a conventional cross-correlation method [82].
Jingyan et al. [83] used FTIR to distinguish between highly similar crude oils. For evaluating the spectroscopic data, a moving window correlation algorithm was used. A comparison with NIR data showed that the mid-infrared spectra lead to a more reliable differentiation between the samples. In the context of crude oil characterization it is a common analytical task to determine the so-called saturate, aromatic, resin, asphaltenic (SARA) compounds [84,85,86]. For this purpose, FTIR and NIR are commonly employed in combination with multivariate data analysis. This is the method of choice because of the high complexity of the data sets and the large number of variables.
Liquid natural gas (LNG), liquefied petroleum gas (LPG), and gasoline are mixtures of hydrocarbon compounds with relatively short chain lengths. There have been quite a few applications of vibrational spectroscopy to characterize these fluids. In 1996, Rest et al. [87] analyzed the NIR spectra of the liquid C1–C7 alkanes. As expected, the spectra exhibit many similarities and it was concluded that it would be impossible to determine the concentration of the individual compounds in an LNG sample without the aid of chemometric techniques.
Gasoline samples were extensively studied by means of vibrational spectroscopy. Kardamakis et al. [88,89] used FTIR spectroscopy and chemometrics to identify the different constituents of commercial gasoline samples. Their approach facilitated to differentiate between gasoline fractions from processing through fluid catalytic cracking, catalytic reforming, alkylation, isomerization, and dimerization. NIR spectroscopy was used for the same purpose by Balabin et al. [90,91]. They compared a large variety of state-of-the-art chemometrics with modern sophisticated data analysis methods such as support vector machines (SVM) and probabilistic neural networks (PNN). It was concluded that the latter two are the most effective ones. Other groups used Raman [92] and infrared [93] spectroscopy for classifying gasoline samples with respect to the production facility and brand. Different brands are often characterized by certain additives admixed to the initially obtained petrochemical fraction. Consequently, even different brands of gasoline produced in the same refinery can be distinguished with respect to the spectroscopic fingerprint. A particularly interesting spectroscopy application in this context was the use of Raman spectroscopy to identify adulterated gasoline [94]. For this purpose, a low-cost Raman system was developed employing a miniature spectrometer and a low power laser (50 mW). A measurement time of 10 s was achieved allowing an online monitoring of the gasoline quality.
Other work focused on the determination of the concentration of selected species or functional groups, and the prediction of certain fuel properties. The Shell Oil Company developed an IR method for measuring the olefin concentration in different gasoline samples as early as 1948 [95], and Diehl et al. [96] quantified the amount of aromatic hydrocarbons in gasoline by GC/FTIR. Reboucas et al. [97] used NIR spectroscopy to determine the fractions of aromatics, saturates, olefins and benzene as well as the relative density, while Pinto et al. [98] combined IR and NIR spectroscopy to obtain information about the specific mass and distillation temperature of gasoline samples. The determination of the octane number was demonstrated using NIR [99] and Raman [100] instruments. In addition, the Raman method [100] allowed deriving the Reid vapor pressure (RVP), which is another important fuel property. The RVP characterizes the volatility of a petrochemical fuel and is defined as the absolute vapor pressure exerted at a temperature of 100 F (37.8 °C).
In contrast to gasoline analysis, the application of vibrational spectroscopy to diesel fuels is not very common. The compounds in diesel exhibit longer hydrocarbon chains and therefore the spectra become more complicated. Al-Degs et al. [101] derived the higher heating value of diesel samples using IR spectra analyzed by principal component analysis and partial least squares regression. A quite comprehensive study was published by Santos Jr. et al. [102]. They applied partial least squares regression and artificial neural network approaches to IR, NIR and Raman data of diesel fuels in order to determine cetane number, density, viscosity, distillation temperature and total sulfur content. The best performance was found for the combination of Raman spectroscopy with artificial neural network data analysis. In order to develop an online tool for monitoring and optimizing the blending of diesel fuel, Alves et al. [103] applied support vector regression (SVR) to NIR spectra. They determined the flash point and the cetane number, and the results were in good agreement with their conventional reference method.

4.2. Blends with Biofuels

Many commercial fuels represent blends of petrochemical fluids and biofuels. For example, gasoline is often mixed with bioethanol and diesel with biodiesel. Most biofuels exhibit oxygen containing compounds, which is a significant difference compared to their petrochemical counterparts. The latter typically consist of hydrocarbons with no oxygen incorporated, while biofuels contain alcohols, ethers and esters. Consequently, the properties and spectral signatures change significantly and may pose a challenge to established analytical methods.
Ether and alcohol compounds are typically admixed to gasoline. Many applications of vibrational spectroscopy aimed at measuring the concentration of the added substances. Cooper and co-workers [104] compared Raman, IR, and NIR methods for the determination of the amount of oxygenated species in commercial gasoline containing small fractions of methyl tert-butyl ether (MTBE). The data were analyzed using partial least squares regression. While Raman and IR were found to yield comparable results, the potential of Raman spectroscopy as a candidate for online measurements was concluded to be higher, because of the significant transmission losses of IR radiation in fiber probes. In the NIR spectra merely minor changes with oxygenate content could be identified. Raman spectroscopy was also the method of choice for measuring the methanol content of methanol-gasoline blends [105]. For data analysis, a hard modeling approach was developed in order to account for nonlinearities in the spectral behavior. Such nonlinearities can make the application of conventional linear regression methods difficult, so that alternative procedures need to be developed. Spectral hard modeling is one possibility [105], another one is the use of support vector regression [32].
The most frequently studied mixtures are ethanol-gasoline blends, which are often abbreviated by EX, where X is the percentage of ethanol. For example, E10 means gasoline blended with 10% v/v ethanol. In order to learn something about the physicochemical effects and phenomena going on in such mixtures, blends of ethanol and well defined gasoline surrogates were studied [106,107]. Suitable surrogates are either a single chemical or a simple mixture of known composition [108,109]. Van Ness et al. [106] studied binary ethanol solutions of heptane and toluene using IR spectroscopy in the OH stretching region. They put the spectra into context with heats of mixing and derived information about the thermodynamics and the molecular structure of the mixtures. Corsetti et al. [107] used a two-component surrogate—a binary mixture of heptane and iso-octane—and mixed it with ethanol with different ratios. A detailed analysis of the solvent-induced frequency shifts of the IR peaks and excess absorbance behavior allowed deriving information about molecular interactions and microscopic mixing effects in the solutions. Moreover, they tested several approaches for ethanol quantification and concluded, that the intensity ratio method with carefully selected spectral windows yields the most accurate results. Such quantitative measurements were the aim whenever mixtures containing real gasoline were investigated spectroscopically. For this purpose, the intensity ratio method was found suitable for evaluating Raman [110] and IR [111,112,113] spectra. For analyzing NIR spectra of ethanol-gasoline mixtures, partial least squares was the method of choice [114]. In the same study, mixtures of gasoline with a higher alcohol, namely butanol [114], were analyzed by NIR spectroscopy.
On the other hand, diesel is often blended with biodiesel, which refers to a diesel fuel based on vegetable oil or animal fat consisting of long-chain alkyl esters. Similar to the EX number defining the composition of gasoline-ethanol mixtures, blends of biodiesel and conventional hydrocarbon-based diesel are characterized by a BX number stating the amount of biodiesel in a given fuel. For example, B10 would mean 10% biodiesel and 90% petro-diesel. A good and recent overview of biodiesel characterization using infrared and near-infrared methods was given by Zhang [115]. The review shed light on spectroscopy for biodiesel feedstock selection, transesterification reaction monitoring, determination of biodiesel blend level, and the analysis of biodiesel properties and contaminants. Therefore, only a few selected studies are mentioned here.
The esters in biodiesel can differ quite a bit depending on its origin. For example, soybean oil and used frying oil will result in significantly different biodiesels. Mazivila et al. [116] analyzed six different B5 blends with different types of biodiesel using FTIR spectroscopy. Applying a partial least squares discriminant analysis yielded 100% correct classification. FTIR was combined with NIR spectroscopy to predict density, sulfur content and distillation temperature in diesel blends by De Lira et al. [117]. All these results demonstrate that vibrational spectroscopy is a suitable means of determining the quality of a biodiesel blend. Consequently, the methods were successfully employed to identify adulterated diesel fuels [118,119]. The most common application of vibrational spectroscopic methods to diesel blends, however, aimed at determining the amount of biodiesel [120,121,122,123,124]. In all these studies, absorption techniques were combined with multivariate data analysis.
In conclusion, taking a rather general look at the work summarized in this sub-section on fuel blends, a rather clear trend is obvious. While IR and NIR spectroscopy is predominantly used in diesel blends, the Raman technique was the method of choice in most gasoline studies. This split is likely due to the optical properties of the different fuels. Diesel and its blends tend to exhibit low transmission in the wavelength range from ultraviolet to near-infrared. This part of the spectrum is normally exploited in Raman spectroscopy; hence a straightforward implementation is not possible. Absorption based methods, on the other hand, can be arranged in attenuated total reflection (ATR) mode, in which even totally opaque samples can be analyzed.

4.3. Alternative Liquid fuels and Special Applications

Of course, liquid fuels are not exclusively based on fossil fuels. There are attempts to use aqueous solutions of alcohols or food leftovers, such as used oils and fats directly in combustion and electro-chemical devices. This section aims at giving only a brief overview in order to illustrate where future developments may take place.
Alcohols and their blends and aqueous solutions are interesting candidates, e.g., for the use as fuels in direct alcohol fuel cells [125,126,127]. There are lots of vibrational spectroscopic studies investigating the physical chemistry of alcohols and their mixtures with water, in particular the hydrogen bonding phenomena [128,129]. This is out of the scope of this article and the focus in the following will be on spectroscopic applications, in which the alcohol is considered as a fuel. Zehentbauer et al. [130] combined Raman spectroscopy with gravimetric analysis and chronoamperometry in order to characterize and monitor a direct methanol fuel cell. The Raman technique provided information about the evolution of the methanol content in the fuel. At the same time, the gravimetry yielded the overall mass of the system and the amperometry the consumption of methanol via electro-oxidation. The significant difference between the methanol concentration measured by Raman and the one calculated from the amperometric data allowed determining the Faradaic efficiency and estimating the loss of fuel through methanol cross-over and evaporation.
Aqueous solutions of ethanol were studied by Mendes et al. [131]. They tested Raman and NIR techniques combined with partial least squares analysis for determination of the ethanol content in fuel ethanol, looking at binary mixtures in the concentration range 85%–100% w/w ethanol. In the same article, they also analyzed ethanol containing beverages using gas chromatography as a reference. Interestingly, they concluded that for the beverages both spectroscopic methods performed better than the standard GC. These results demonstrate how good and reliable spectroscopic techniques can be for the analysis of real-world fluids. Another study of ethanol-water solutions was carried out by Struthers et al. [38], who monitored the ethanol concentration in the top product of a distillation column using Raman spectroscopy. The spectra were evaluated using the intensity ratio method.
These applications highlight the flexibility of vibrational spectroscopy. Its methods can be applied to a broad range of systems and fluids related to fuel characterization. This includes the analysis of reacting systems with high temporal resolution.

5. Summary and Outlook

In this article, the applications of vibrational spectroscopy to the characterization of gaseous and liquid fuels, with a focus on infrared and Raman spectroscopy, have been reviewed. In the gas-phase, most research groups favor Raman based techniques for a number of reasons:
(1)
Virtually all relevant species are Raman-active and can be detected simultaneously. This includes the homonuclear diatomic species hydrogen, nitrogen, and oxygen, all of which are not IR-active and hence cannot be detected using absorption methods.
(2)
Raman spectroscopy is relatively insensitive to water vapor due to the low scattering cross section. In contrast, IR spectra are difficult to interpret as the water signals are very strong and appear in wide ranges of the near- and mid-infrared spectrum.
(3)
The advances in the development of suitable light sources and detectors allow relatively small and fully automatic Raman gas analyzers to be built.
On the other hand, for the characterization of liquid fuels, absorption techniques have their benefits as they allow analyzing even fully opaque samples, such as crude oil, when the attenuated total reflection approach is employed. However, for optically transparent samples, Raman spectroscopy was found to be a suitable alternative.
The basis of characterizing complicated fuel systems such as gasoline and diesel using spectroscopic methods is certainly the development of advanced data evaluation protocols. Most of the procedures applied represent means of chemometrics. Besides the established methods like principal component analysis and partial least squares regression, new approaches including support vector machines and artificial neural networks facilitate to derive a multitude of fuel characteristics from spectroscopic data. This includes information about the chemical composition as well as density, viscosity, distillation temperature, contaminants, and adulteration.
The development of compact and portable instruments for fuel characterization remains to be a hot topic driven by the development of new analytical techniques and advanced hardware, i.e., light sources and detectors. For example, the use of simple laser diodes and light-emitting diodes enables not only reducing the investment costs, but also leads to novel approaches, like the recent development of multi-mode absorption spectroscopy, MUMAS [132,133] and light-emitting diode based Raman techniques [24,134]. Moreover, most applications to date employed fairly established IR and Raman methods, in which continuous wave light sources are employed. Over the last few decades, however, pulsed sources became more and more powerful, reliable, robust, and affordable. This opened up new possibilities for developing analytical techniques, which have great potential for applications in the area of fuel characterization. For example, the development of pulsed super-continuum (SC) sources covering a broad spectral bandwidth in the near-infrared allows measurements with high temporal resolution (nanoseconds) and high repetition rate (up to MHz). An overview of the generation of SC radiation and its use in chemical sensing including the detection of typical fuel molecules was given by Kaminski et al. [135]. So far, most work using SC absorption spectroscopy focused on sensing selected species such as water, carbon dioxide and small hydrocarbons in the gas phase, see for example [135,136,137,138,139]. However, future developments in this area may lead to methods for comprehensive fuel characterization. For instance, the application of chemometrics to SC spectra is very promising in this context.
Further interesting methods can be found in the area of nonlinear optical spectroscopy, in particular four-wave mixing techniques [140,141]. The most common nonlinear vibrational spectroscopic approaches for detection of fuel molecules include coherent anti-Stokes Raman scattering (CARS) [142], infrared polarization spectroscopy (IRPS) [143,144] and degenerate four-wave mixing (IR-DFWM) [145,146], as well as laser-induced gratings (LIGs) [35,147,148]. The recent advances in the development of these techniques towards high-bandwidth measurements and multi-species detection will facilitate the characterization of multi-component fuels [149,150,151,152].
In conclusion, on the one hand, vibrational spectroscopy methods in terms of FTIR, NIR and Raman spectroscopy are reliable, accurate, robust and well established tools for the characterization of fuels, not only in research labs. There have been a number of exciting field applications and the future will certainly see a further strong increase as more portable systems are becoming commercially available. On the other hand, there are emerging techniques utilizing advanced physical effects and/or employing advanced light sources having the potential of being applied to fuel characterization in the future. There is no question that vibrational spectroscopy of fuels will remain an exciting area of fundamental and applied research, as well as deployment.

Acknowledgments

The author would like to thank Thomas Seeger, Alfred Leipertz, Florian Zehentbauer, Stella Corsetti, David McGloin, and Kristina Noack for fruitful discussions over the past decade. Special thanks to Lynda Cromwell and Andrew Williamson for proofreading the manuscript.

Conflicts of Interest

The author declares no conflict of interest.

References

  1. World Energy Outlook 2014; International Energy Agency: Paris, France, 2014.
  2. EU Energy in Figures Pocketbook; Publications Office of the European Union: Luxembourg, 2014.
  3. Davis, S.C.; Diegel, S.W.; Boundy, R.G. Transportation Energy Data Book, 33rd ed.; Oak Ridge National Laboratory: Oak Ridge, TN, USA, 2014. [Google Scholar]
  4. Lehmann, S.; Lorenz, S.; Rivard, E.; Brüggemann, D. Experimental analysis and semicontinuous simulation of low-temperature droplet evaporation of multicomponent fuels. Exp. Fluids 2015, 56, 1–12. [Google Scholar]
  5. Lichty, L.C.; Phelps, C.W. Gasoline-alcohol blends in internal combustion engines. Ind. Eng. Chem. 1938, 30, 222–230. [Google Scholar]
  6. Turner, D.; Xu, H.; Cracknell, R.F.; Natarajan, V.; Chen, X. Combustion performance of bio-ethanol at various blend ratios in a gasoline direct injection engine. Fuel 2011, 90, 1999–2006. [Google Scholar]
  7. Sielghem, L.; Alekseev, V.A.; Vancoillie, J.; Nilsson, E.J.K.; Verhelst, S.; Konnov, A.A. Laminar burning velocities of primary reference fuels and simple alcohols. Fuel 2014, 115, 32–40. [Google Scholar]
  8. Kiefer, J.; Noack, K.; Kirchner, B. Hydrogen bonding in mixtures of dimethyl sulfoxide and cosolvents. Curr. Phys. Chem. 2011, 1, 340–351. [Google Scholar]
  9. Noack, K.; Kiefer, J.; Leipertz, A. Concentration dependent hydrogen bonding effects on the dimethyl sulfoxide vibrational structure in the presence of water, methanol and ethanol. ChemPhysChem 2010, 11, 630–637. [Google Scholar]
  10. Ulbig, P.; Hoburg, D. Determination of the calorific value of natural gas by different methods. Thermochim. Acta 2002, 382, 27–35. [Google Scholar]
  11. Philp, R.P. High-temperature gas-chromatography for the analysis of fossil fuels: A review. J. High Resolut. Chromatogr. 1994, 17, 398–406. [Google Scholar]
  12. Cross, R.A. Analysis of major constituents of fuel gases by gas chromatography. Nature 1966, 211, 409. [Google Scholar]
  13. Segudovic, N.; Tomic, T.; Skrobonja, L.; Kontic, L. Local round robin test for determination of aromatics in diesel fuels by HPLC. J. Sep. Sci. 2004, 27, 65–70. [Google Scholar]
  14. Haken, H.; Wolf, H.C. Molecular Physics and Elements of Quantum Chemistry; Springer: Heidelberg, Germany, 1995. [Google Scholar]
  15. Banwell, C.N.; McCash, E.M. Fundamentals of Molecular Spectroscopy, 4th ed.; McGraw Hill: London, UK, 1994. [Google Scholar]
  16. Schrader, B. Infrared and Raman Spectroscopy; VCH Verlagsgesellschaft: Weinheim, Germany, 1995. [Google Scholar]
  17. Griffiths, P.R.; De Haseth, J.A. Fourier Transform Infrared Spectrometry, 2nd ed.; Wiley: Weinheim, Germany, 2007. [Google Scholar]
  18. Rahinov, I.; Goldman, A.; Cheskis, S. Intracavity laser absorption spectroscopy and cavity ring-down spectroscopy in low-pressure flames. Appl. Phys. B 2005, 81, 143–149. [Google Scholar]
  19. Thorpe, M.J.; Moll, K.D.; Jones, R.J.; Safdi, B.; Ye, J. Broadband cavity ringdown spectroscopy for sensitive and rapid molecular detection. Science 2006, 311, 1595–1599. [Google Scholar]
  20. Kiefer, J.; Rasul, N.H.; Ghosh, P.K.; Von Lieres, E. Surface and bulk porosity mapping of polymer membranes using infrared spectroscopy. J. Membr. Sci. 2014, 452, 152–156. [Google Scholar]
  21. Averett, L.A.; Griffiths, P.R. Effective path length in attenuated total reflection spectroscopy. Anal. Chem. 2008, 80, 3045–3049. [Google Scholar]
  22. Harrick, N.J.; du Pre, F.K. Effective thickness of bulk materials and of thin films for internal reflection spectroscopy. Appl. Opt. 1966, 5, 1739–1743. [Google Scholar]
  23. Wei, D.; Chen, S.; Liu, Q. Review of fluorescence suppression techniques in Raman spectroscopy. Appl. Spectr. Rev. 2015. [Google Scholar] [CrossRef]
  24. Greer, J.S.; Petrov, G.I.; Yakovlev, V.V. Raman spectrocopy with LED excitation source. J. Raman Spectrosc. 2013, 44, 1058–1059. [Google Scholar]
  25. Schmidt, M.A.; Kiefer, J. Polarization-resolved high-resolution Raman spectroscopy with a light-emitting diode. J. Raman Spectrosc. 2013, 44, 1625–1627. [Google Scholar]
  26. Meyer, M.W.; Lupoi, J.S.; Smith, E.A. 1064 nm dispersive multichannel Raman spectroscopy for the analysis of plant lignin. Anal. Chim. Acta 2011, 706, 164–170. [Google Scholar]
  27. Liu, C.; Berg, R.W. Nonlinearity in intensity versus concentration dependence for the deep UV resonance Raman spectra of toluene and heptane. Appl. Spectr. Rev. 2013, 48, 425–437. [Google Scholar]
  28. Egermann, J.; Seeger, T.; Leipertz, A. Application of 266-nm and 355-nm Nd: YAG laser radiation for the investigation of fuel-rich sooting hydrocarbon flames by Raman scattering. Appl. Opt. 2004, 43, 5564–5574. [Google Scholar] [CrossRef] [PubMed]
  29. Shreve, A.P.; Cherepy, N.J.; Mathies, R.A. Effective rejection of fluorescence interference in Raman spectroscopy using a shifted excitation difference technique. Appl. Spectrosc. 1992, 46, 707–711. [Google Scholar] [CrossRef]
  30. Zhao, J.; Carrabba, M.M.; Allen, F.S. Automated flurescence rejection using shifted-excitation Raman difference spectroscopy. Appl. Spectrosc. 2002, 56, 834–845. [Google Scholar] [CrossRef]
  31. Maiwald, M.; Erbert, G.; Klehr, A.; Kronfeldt, H.D.; Schmidt, H.; Sumpf, B.; Trankle, G. Rapid shifted excitation Raman difference spectroscopy with a distributed feedback laser emitting at 785 nm. Appl. Phys. B 2006, 85, 509–512. [Google Scholar] [CrossRef]
  32. Noack, K.; Eskofier, B.; Kiefer, J.; Dilk, C.; Bilow, G.; Schirmer, M.; Buchholz, R.; Leipertz, A. Combined shifted-excitation Raman difference spectroscopy and support vector regression for monitoring the algal production of complex polysaccharides. Analyst 2013, 138, 5639–5646. [Google Scholar] [CrossRef] [PubMed]
  33. Joseph, J.; Jemmis, E.D. Red-, blue-, or no-shift in hydrogen bonds: A unified explanation. J. Am. Chem. Soc. 2007, 129, 4620–4632. [Google Scholar] [CrossRef] [PubMed]
  34. Kiefer, J.; Molina Martinez, M.; Noack, K. The peculiar nature of molecular interactions between an imidazolium ionic liquid and acetone. ChemPhysChem 2012, 13, 1213–1220. [Google Scholar] [CrossRef] [PubMed]
  35. Kiefer, J.; Kozlov, D.N.; Seeger, T.; Leipertz, A. Local fuel concentration measurements for mixture formation diagnostics using diffraction by laser-induced gratings in comparison to spontaneous Raman scattering. J. Raman Spectrosc. 2008, 39, 711–721. [Google Scholar] [CrossRef]
  36. Zehentbauer, F.M.; Kiefer, J. Detection of unexpected species in soft modelling of vibrational spectra. Chimica Oggi-Chemistry Today 2012, 30, 54–56. [Google Scholar]
  37. Kiefer, J.; Seeger, T.; Steuer, S.; Schorsch, S.; Weikl, M.C.; Leipertz, A. Design and characterization of a Raman-scattering-based sensor system for temporally resolved gas analysis and its application in a gas turbine power plant. Meas. Sci. Technol. 2008, 19. [Google Scholar] [CrossRef]
  38. Struthers, H.C.; Zehentbauer, F.M.; Ono-Sorhue, E.; Kiefer, J. Chemical composition monitoring in a batch distillation process using Raman spectroscopy. Ind. Eng. Chem. Res. 2011, 50, 12824–12830. [Google Scholar] [CrossRef]
  39. Alsmeyer, F.; Koß, H.-J.; Marquardt, W. Indirect spectral hard modeling for the analysis of reactive and interacting mixtures. Appl. Spectrosc. 2004, 58, 975–985. [Google Scholar]
  40. Viell, J.; Marquardt, W. Concentration measurements in ionic liquid-water mixtures by mid-infrared spectroscopy and indirect hard modeling. Appl. Spectrosc. 2012, 66, 208–217. [Google Scholar] [CrossRef] [PubMed]
  41. Wold, S.; Esbensen, K.; Geladi, P. Principal Component Analysis. Chemom. Intell. Lab. Syst. 1987, 2, 37–52. [Google Scholar] [CrossRef]
  42. Bakeev, K.A. Process Analytical Technology, 2nd ed.; Wiley-Blackwell: Hoboken, NJ, USA, 2010. [Google Scholar]
  43. Mark, H.; Workman, J., Jr. Chemometrics in Spectroscopy; Academic Press: New York, NY, USA, 2007. [Google Scholar]
  44. ISO 6976: Natural Gas—Calculation of Calorific Values, Density, Relative Density and Wobbe Index from Composition; International Organization for Standardization: Geneva, Switzerland, 1996.
  45. Denys, F.; de Vries, W. Gas Composition Transition Agency Report 2013; Gas Composition Transition Agency: Assen, The Netherlands, 2013. [Google Scholar]
  46. Haus, R.; Wilkinson, R.; Heland, J.; Schäfer, K. Remote sensing of gas emissions on natural gas flares. Pure Appl. Opt. 1998, 7, 853–862. [Google Scholar] [CrossRef]
  47. Makhoukhi, N.; Pere, E.; Creff, R.; Pouchan, C. Determination of the composition of a mixture of gases by infrared analysis and chemometric methods. J. Mol. Struct. 2005, 744–747, 855–859. [Google Scholar] [CrossRef]
  48. Dantas, H.V.; Barbosa, M.F.; Nascimento, E.C.L.; Moreira, P.N.T.; Calvao, R.K.H.; Aroujo, M.C.U. Screening analysis of natural gas with respect to methane content by near-infrared spectrometry. Microchem. J. 2014, 114, 210–215. [Google Scholar] [CrossRef]
  49. Mullins, O.C.; Daigle, T.; Crowell, C.; Groenzin, H.; Joshi, N.B. Gas-oil ratio of live crude oils determined by near-infrared spectroscopy. Appl. Spectrosc. 2001, 55, 197–201. [Google Scholar] [CrossRef]
  50. Fujisawa, G.; van Agthoven, M.A.; Jenet, F.; Rabbito, P.A.; Mullins, O.C. Near-infrared compositional analysis of gas and condensate reservoir fluids at elevated pressures and temperatures. Appl. Spectrosc. 2002, 56, 1615–1620. [Google Scholar] [CrossRef]
  51. Diller, D.E.; Chang, R.F. Composition of mixtures of natural gas components determined by Raman spectroscopy. Appl. Spectrosc. 1980, 34, 411–414. [Google Scholar] [CrossRef]
  52. Brunsgaard Hansen, S.; Berg, R.W.; Stenby, E.H. High-pressure measuring cell for Raman spectroscopic studies of natural gas. Appl. Spectrosc. 2001, 55, 55–60. [Google Scholar]
  53. Buric, M.P.; Chen, K.P.; Falk, J.; Woodruff, S.D. Enhanced spontaneous Raman scattering and gas composition analysis using a photonic crystal fiber. Appl. Opt. 2008, 47, 4255–4261. [Google Scholar] [CrossRef] [PubMed]
  54. Salter, R.; Chu, J.; Hippler, M. Cavity-enhanced Raman spectroscopy with optical feedback cw diode lasers for gas phase analysis and spectroscopy. Analyst 2012, 137, 4669–4676. [Google Scholar] [CrossRef] [PubMed]
  55. Kaiser Optical Systems Inc. Available online: http://www.kosi.com (accessed on 8 February 2015).
  56. Egermann, J.; Jonuscheit, J.; Seeger, T.; Leipertz, A. Untersuchung von diodenlaserbasierten Mehrkomponenten-Konzentrationsmesssystemen zur Gasanalyse. Tech. Messen 2001, 68, 400–405. (In German) [Google Scholar]
  57. Seeger, T.; Kiefer, J.; Leipertz, A. A. Sensor system for accurate, quantitative analysis of natural gas in gas turbine. In Proceedings of the International Gas Union Research Conference (IGRC), Paris, France, 8–10 October 2008; pp. 1–11.
  58. Seeger, T.; Kiefer, J.; Leipertz, A. Entwicklung eines laserbasierten Sensorsystems zur schnellen Gasanalyse. GWF Gas/Erdgas 2007, 148, 548–552. (In German) [Google Scholar]
  59. Schorsch, S.; Kiefer, J.; Steuer, S.; Seeger, T.; Leipertz, A.; Gonschorek, S.; Abröll, B.; Käß, M. Entwicklung eines Echtzeitanalyse-Systems zur Charakterisierung von Brenngasgemischen in Gasturbinenkraftwerken. Chem. Ing. Tech. 2011, 83, 247–253. (In German) [Google Scholar] [CrossRef]
  60. Buldakov, M.A.; Korolev, B.V.; Matrosov, I.I.; Petrov, D.V.; Tikhomirov, A.A. Raman gas analyzer for determining the composition of natural gas. J. Appl. Spectroscopy 2013, 80, 124–128. [Google Scholar] [CrossRef]
  61. Buldakov, M.A.; Korolkov, V.A.; Matrosov, I.I.; Petrov, D.V.; Tikhomirov, A.A.; Korolev, B.V. Analyzing natural gas by spontaneous Raman scattering spectroscopy. J. Opt. Technol. 2013, 80, 426–430. [Google Scholar] [CrossRef]
  62. Seitz, J.C.; Pasteris, J.D.; Chou, I.M. Raman spectroscopic characterization of gas mixtures. 2. Quantitative composition and pressure detrmination of the CO2-CH4 system. Am. J. Sci. 1996, 296, 577–600. [Google Scholar] [CrossRef]
  63. Buric, M.P.; Chen, K.P.; Falk, J.; Woodruff, S.D. Improved sensitivity gas detection by spontaneous Raman scattering. Appl. Opt. 2009, 48, 4424–4429. [Google Scholar] [CrossRef] [PubMed]
  64. Pearman, W.F.; Carter, J.C.; Angel, M.; Chan, J.W.J. Quantitative measurements of CO2 and CH4 using a multipass Raman capillary cell. Appl. Opt. 2008, 47, 4627–4632. [Google Scholar] [CrossRef] [PubMed]
  65. Numata, Y.; Shinohara, Y.; Kitayama, T.; Tanaka, H. Rapid and accurate quantitative analysis of fermentation gases by Raman spectroscopy. Process Biochem. 2013, 48, 569–574. [Google Scholar] [CrossRef]
  66. Schlüter, S.; Seeger, T.; Popovska-Leipertz, N.; Leipertz, A. Laserbasierte On-line-Analyse von Biogasen mit einer Raman-Sonde. Tech. Messen 2014, 81, 546–553. [Google Scholar]
  67. Eichmann, S.C.; Kiefer, J.; Benz, J.; Kempf, T.; Leipertz, A.; Seeger, T. Determination of gas composition in a biogas plant using a Raman-based sensor system. Meas. Sci. Technol. 2014, 25. [Google Scholar] [CrossRef]
  68. Eichmann, S.C.; Weschta, M.; Kiefer, J.; Seeger, T.; Leipertz, A. Characterization of a fast gas analyzer based on Raman scattering for the analysis of synthesis gas. Rev. Sci. Instrum. 2010, 81. [Google Scholar] [CrossRef]
  69. Ernst, A.; Zibrak, J.D. Carbon monoxide poisoning. N. Engl. J. Med. 1998, 339, 1603–1608. [Google Scholar] [CrossRef] [PubMed]
  70. Rae, S.I.; Khan, I. Surface anhanced Raman spectroscopy (SERS) sensors for gas analysis. Analyst 2010, 135, 1365–1369. [Google Scholar] [CrossRef] [PubMed]
  71. Li, X.; Xia, Y.; Zhan, L.; Huang, J. Near-confocal cavity-enhanced Raman spectroscopy for multitrace-gas detection. Opt. Lett. 2008, 33, 2143–2145. [Google Scholar] [CrossRef] [PubMed]
  72. Li, X.; Xia, Y.; Huang, J.; Zhan, L. Diagnosis of multiple gases separated from transformer oil using cavity-enhanced Raman spectroscopy. Chin. Phys. Lett. 2008, 25, 3326–3329. [Google Scholar] [CrossRef]
  73. Li, X.Y.; Xia, Y.X.; Huang, J.M.; Zhan, L. A Raman system for multi-gas-species analysis in power transformer. Appl. Phys. B 2008, 93, 665–669. [Google Scholar] [CrossRef]
  74. Buffett, B.; Archer, D. Global inventory of methane clathrate: Sensitivity to changes in the deep ocean. Earth Planet. Sci. Lett. 2004, 227, 185–199. [Google Scholar] [CrossRef]
  75. Uchida, T.; Hirano, T.; Ebinuma, T.; Narita, H.; Gohara, K.; Mae, S.; Matsumoto, R. Raman spectroscopic determination of hydration number of methane hydrates. Environ. Energy Eng. 1999, 45, 2641–2645. [Google Scholar]
  76. Hester, K.C.; Dunk, R.M.; White, S.N.; Brewer, P.G.; Peltzer, E.T.; Sloan, E.D. Gas hydrate measurements at Hydrate Ridge using Raman spectroscopy. Geochim. Cosmochim. Acta 2007, 71, 2947–2959. [Google Scholar] [CrossRef]
  77. Hester, K.C.; White, S.N.; Peltzer, E.T.; Brewer, P.G.; Sloan, E.D. Raman spectroscopic measurements of synthetic gas hydrates in the ocean. Marine Chem. 2006, 98, 304–314. [Google Scholar] [CrossRef]
  78. Hester, K.C.; Dunk, R.M.; Walz, P.M.; Peltzer, E.T.; Sloan, E.D.; Brewer, P.G. Direct measurements of multi-component hydrates on the seafloor: Pathways to growth. Fluid Phase Equilibria 2007, 261, 396–406. [Google Scholar] [CrossRef]
  79. Uchida, T.; Takeya, S.; Kamata, Y.; Ohmura, R.; Narita, H. Spectroscopic measurements of binary, ternary, and quaternery mixed-gas molecules in clathrate structures. Ind. Eng. Chem. Res. 2007, 46, 5080–5087. [Google Scholar] [CrossRef]
  80. Dabelstein, W.; Reglitzky, A.; Schütze, A.; Reders, K. Automotive fuels. In Ullmann’s Encyclopedia of Industrial Chemistry; Wiley-VCH: Weinheim, Germany, 2007. [Google Scholar]
  81. Venkataramanan, L.; Fujisawa, G.; Mullins, O.C.; Vasques, R.R.; Valero, H.P. Uncertainty analysis of visible and near-infrared data of hydrocarbons. Appl. Spectrosc. 2006, 60, 653–662. [Google Scholar] [CrossRef] [PubMed]
  82. Diniz, P.S.R.; da Silva, E.A.B.; Netto, S.L. Digital Signal Processing: System Analysis and Design, 2nd ed.; Cambridge University Press: Cambridge, UK, 2010. [Google Scholar]
  83. Jingyan, L.; Xiaoli, C.; Songbai, T.; Wanhen, L. The identification of highly similar crude oils by infrared spectroscopy combined with pattern recognition method. Spectrochim. Acta A 2013, 112, 457–462. [Google Scholar] [CrossRef]
  84. Wilt, B.K.; Welch, W.T.; Rankin, J.G. Determination of asphaltenes in petroleum crude oils by Fourier transform infrared spectroscopy. Energy Fuels 1998, 12, 1008–1012. [Google Scholar] [CrossRef]
  85. Aske, N.; Kallevik, H.; Sjöblom, J. Determination of saturate, aromatic, resin, and asphaltenic components in crude oils by means of infrared and near-infrared spectroscopy. Energy Fuels 2001, 15, 1304–1312. [Google Scholar] [CrossRef]
  86. Gawel, B.; Eftekhardadkhah, M.; Oye, G. Elemental composition and Fourier transform infrared spectroscopy analysis of crude oils and their fractions. Energy Fuels 2014, 28, 997–1003. [Google Scholar] [CrossRef]
  87. Rest, A.J.; Warren, R.; Murray, S.C. Near-infrared study of the light liquid alkanes. Appl. Spectrosc. 1996, 50, 517–520. [Google Scholar] [CrossRef]
  88. Pasadakis, N.; Kardamakis, A.A. Idenfying constituents in commercial gasoline using Fourier transform-infrared spectroscopy and independent component analysis. Anal. Chim. Acta 2006, 578, 250–255. [Google Scholar] [CrossRef] [PubMed]
  89. Kardamakis, A.A.; Mouchtaris, A.; Pasadakis, N. Linear predictive spectral coding and independent component analysis in identifying gasoline constituents using infrared spectroscopy. Chemom. Intell. Lab. Syst. 2007, 89, 51–58. [Google Scholar] [CrossRef]
  90. Balabin, R.M.; Safieva, R.Z.; Lomakina, E.I. Gasoline classification using near inrared (MI) spectroscopy data: Comparison of mulitvariate techniques. Anal. Chim. Acta 2010, 671, 27–35. [Google Scholar] [CrossRef] [PubMed]
  91. Balabin, R.M.; Safieva, R.Z. Gasoline classification by source and type based on near infrared (NIR) spectroscopy data. Fuel 2008, 87, 1096–1101. [Google Scholar] [CrossRef]
  92. Li, S.; Dai, L.K. Classification of gasoline brand and origin by Raman spectroscopy and a novel R-weighted LSSVM algorithm. Fuel 2012, 96, 146–152. [Google Scholar] [CrossRef]
  93. da Silva, M.P.F.; Rodrigues e Brito, L.; Honorato, F.A.; Paim, A.P.S.; Pasquini, C.; Pimentel, M.F. Classification of gasoline as with or without dispersant and detergent additives using infrared spectroscopy and multivariate classification. Fuel 2014, 116, 151–157. [Google Scholar]
  94. Tan, K.M.; Barman, I.; Dingari, N.C.; Singh, G.P.; Chia, T.F.; Tok, W.L. Toward the development of Raman spectroscopy as a nonperturbative online monitoring tool for gasoline adulteration. Anal. Chem. 2013, 85, 1846–1851. [Google Scholar] [CrossRef] [PubMed]
  95. Johnston, R.W.B.; Appleby, W.G.; Baker, M.O. Determination of olefins in gasoline—Application of infrared spectroscopy. Anal. Chem. 1948, 20, 805–812. [Google Scholar] [CrossRef]
  96. Diehl, J.W.; Finkbeiner, J.W.; DiSanzo, F.P. Determination of aromatic hydrocarbons in gasoline by gas chromatography/Fourier transform infrared spectroscopy. Anal. Chem. 1995, 67, 2015–2019. [Google Scholar] [CrossRef]
  97. Reboucas, M.V.; Santos, J.B.; Pimentel, M.F.; Teixeira, L.S.G. A novel approach for development of a multivariate calibration model using a Doehlert experimental design: Application for prediction of key gasoline properties by near-infrared spectroscopy. Chemom. Intell. Lab. Syst. 2011, 107, 185–193. [Google Scholar] [CrossRef]
  98. Pinto, L.A.; Galvao, R.K.H.; Araujo, M.C.U. Ensemble wavelet modelling for detrmination of wheat and gasoline properties by near and middle infrared spectroscopy. Anal. Chim. Acta 2010, 682, 37–47. [Google Scholar] [CrossRef] [PubMed]
  99. Özdemir, D. Determination of octane number of gasoline using near infrared spectroscopy and genetic multivariate calibration methods. Pet. Sci. Technol. 2005, 23, 1139–1152. [Google Scholar] [CrossRef]
  100. Flecher, P.E.; Welch, W.T.; Albin, S.; Cooper, J.B. Determination of octane numbers and Reid vapor pressure in commercial gasoline using dispersive fiber-optic Raman spectroscopy. Spectrochim. Acta A 1997, 53, 199–206. [Google Scholar]
  101. Al-Degs, Y.S.; Al-Ghouti, M.; Walker, G. Determination of higher heating value of petro-diesels using mid-infrared spectroscopy and chemometry. J. Therm. Anal. Calorim. 2012, 107, 853–862. [Google Scholar] [CrossRef]
  102. Santos, V.O., Jr.; Oliveira, F.C.C.; Lima, D.G.; Petry, A.C.; Carcia, E.; Suarez, P.A.Z.; Rubim, J.C. A comparative study of diesel analysis by FTIR, FTNIR and FT-Raman spectroscopy using PLS and artificial neural network analysis. Anal. Chim. Acta 2005, 547, 188–196. [Google Scholar] [CrossRef]
  103. Alves, J.C.L.; Henriques, C.B.; Poppi, R.J. Determination of diesel quality parameters using support vector regression and near infrared spectroscopy for an in-line blending optimizer system. Fuel 2012, 97, 710–717. [Google Scholar] [CrossRef]
  104. Cooper, J.B.; Wise, K.L.; Welch, W.T.; Bledsoe, R.R.; Sumner, M.B. Determination of weight percent oxygen in commercial gasoline: A comparison between FT-Raman, FT-IR and dispersive near-IR spectroscopies. Appl. Spectrosc. 1996, 50, 917–921. [Google Scholar] [CrossRef]
  105. Li, J.; Dai, L. A hard modeling approach to determine methanol concentration in methanol gasoline by Raman spectroscopy. Sens. Actuators B 2012, 173, 385–390. [Google Scholar] [CrossRef]
  106. Van Ness, H.C.; van Winkle, J.; Richtol, H.H.; Hollinger, H.B. Infrared spectra and the thermodynamics of alcohol-hydrocarbon systems. J. Phys. Chem. 1967, 71, 1483–1494. [Google Scholar] [CrossRef]
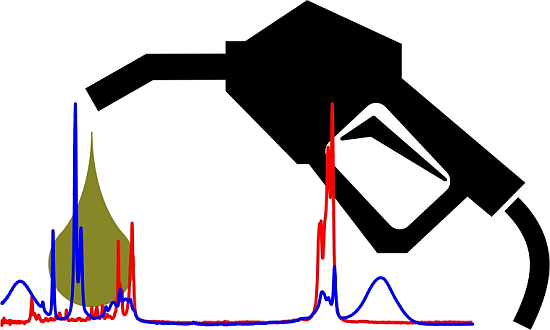
  107. Corsetti, S.; Zehentbauer, F.M.; McGloin, D.; Kiefer, J. Characterization of gasoline/ethanol blends by infrared and excess infrared spectroscopy. Fuel 2015, 141, 136–142. [Google Scholar] [CrossRef]
  108. Pitz, W.J.; Mueller, C.J. Recent progress in the development of diesel surrogate fuels. Prog. Energy Combust. Sci. 2011, 37, 330–350. [Google Scholar] [CrossRef]
  109. Sileghem, L.; Alekseev, V.A.; Vancoillie, J.; van Geem, K.M.; Nilsson, E.J.K.; Verhelst, S.; Konnov, A.A. Laminar burning velocity of gasoline and the gasoline surrogate components iso-octane, n-heptane and toluene. Fuel 2013, 112, 355–365. [Google Scholar] [CrossRef]
  110. Ye, Q.; Xu, Q.; Yu, Y.; Qu, R.; Fang, Z. Rapid and quantitative detection of ethanol proportion in ethanol-gasoline mixtures by Raman spectroscopy. Opt. Commun. 2009, 282, 3785–3788. [Google Scholar] [CrossRef]
  111. Battiste, D.R.; Fry, S.E.; White, F.T.; Scoggins, M.W.; McWilliams, T.B. Determination of ethanol in gasohol by infrared spectrometry. Anal. Chem. 1981, 53, 1096–1099. [Google Scholar] [CrossRef]
  112. Balabin, R.M.; Syunyaev, R.Z.; Karpov, S.A. Quantitative measurement of ethanol distribution over fractions of ethanol-gasoline fuel. Energy Fuels 2007, 21, 2460–2465. [Google Scholar] [CrossRef]
  113. Ravi Prasad, P.; Rama Rao, K.S.; Bhuvaneswari, K.; Praveena, N.; Srikanth, Y.V.V. Determination of ethanol in blend petrol by gas chromatography and Fourier transform infrared spectroscopy. Energy Sources A 2008, 30, 1534–1539. [Google Scholar] [CrossRef]
  114. Ahmed, M.K.; Levenson, J. Application of near-infrared spectroscopy to the quality assurance of ethanol and butanol blended gasoline. Petroleum Sci. Technol. 2012, 30, 115–121. [Google Scholar] [CrossRef]
  115. Zhang, W.B. Review on analysis of biodiesel with infrared spectroscopy. Renew. Sustain. Energy Rev. 2012, 16, 6048–6058. [Google Scholar] [CrossRef]
  116. Mazivila, S.J.; De Santana, F.B.; Mitsutake, H.; Gontijo, L.C.; Santos, D.Q.; Neto, W.B. Discrimination of the type of biodiesel/diesel blend (B5) using mid-infrared spectroscopy and PLS-DA. Fuel 2015, 142, 222–226. [Google Scholar] [CrossRef]
  117. De Lira, L.F.B.; De Vasconcelos, F.V.C.; Pereira, C.F.; Paim, A.P.S.; Stragevitch, L.; Pimentel, M.F. Prediction of properties of diesel/biodiesel blends by infrared spectroscopy and multivariate calibration. Fuel 2010, 89, 405–409. [Google Scholar] [CrossRef]
  118. Oliveira, F.C.C.; Brandao, C.R.R.; Ramalho, H.F.; Da Costa, L.A.F.; Suarez, P.A.Z.; Rubim, J.C. Adulteration of diesel/biodiesel blends by vegetable oil as determined by Fourier transform (FT) near infrared spectrometry and FT-Raman spectroscopy. Anal. Chim. Acta 2007, 587, 194–199. [Google Scholar] [CrossRef] [PubMed]
  119. Soares, I.P.; Rezende, T.F.; Fortes, I.C.P. Study of the behavior changes in physical-chemistry properties of diesel/biodiesel (B2) mixtures with residual oil and its quantification by partial least-squares attenuated total reflection-Fourier transformed infrared spectroscopy (PLS/ATR-FTIR). Energy Fuels 2009, 23, 4143–4148. [Google Scholar] [CrossRef]
  120. Guarieiro, L.L.N.; Pinto, A.C.; De Aguiar, P.F.; Ribeiro, N.M. Metodologia analitica para quantificar o teor de biodiesel na mistura biodiesel: Diesel utilizando espectroscopia na regiao do infravermelho. Quimica Nova 2008, 31, 421–426. (In Portuguese) [Google Scholar] [CrossRef]
  121. Oliveira, J.S.; Montalvao, R.; Daher, L.; Suarez, P.A.Z.; Rubim, J.C. Determination of methyl ester contents in biodiesel blends by FTIR-ATR and FTNIR spectroscopies. Talanta 2006, 69, 1278–1284. [Google Scholar] [CrossRef] [PubMed]
  122. De Carvalho Rocha, W.F.; Nogueira, R.; Vaz, B.G. Validation of model of multivariate calibration: An aplication to the determination of biodiesel blend levels in diesel by near-infrared spectroscopy. J. Chemom. 2012, 26, 456–461. [Google Scholar] [CrossRef]
  123. Gontijo, L.C.; Guimaraes, E.; Mitsutake, H.; De Santana, F.B.; Santos, D.Q.; Neto, W.B. Quantification of soybean biodiesels in diesel blends according to ASTM E1655 using mid-infrared spectroscopy and multivariate calibration. Fuel 2014, 117, 1111–1114. [Google Scholar] [CrossRef]
  124. Pimentel, M.F.; Ribeiro, G.M.G.S.; Da Cruz, R.S.; Stragevitch, L.; Pacheco Filho, J.G.A.; Teixeira, L.S.G. Determination of biodiesel content when blended with mineral diesel fuel using infrared spectroscopy and multivariate calibration. Microchem. J. 2006, 82, 201–206. [Google Scholar] [CrossRef]
  125. Song, S.Q.; Maragou, V.; Tsiakaras, P. How far are direct alcohol fuel cells from our energy future? J. Fuel Cell Sci. Technol. 2007, 4, 203–209. [Google Scholar] [CrossRef]
  126. Yu, E.H.; Krewer, U.; Scott, K. Principles and materials aspects of direct alkaline alcohol fuel cells. Energies 2010, 3, 1499–1528. [Google Scholar] [CrossRef]
  127. Leo, T.J.; Raso, M.A.; Navarro, E.; Mora, E. Long term performance study of a direct methanol fuel cell fed with alcohol blends. Energies 2013, 6, 282–293. [Google Scholar] [CrossRef]
  128. Burikov, S.; Dolenko, T.; Patsaeva, S.; Starokurov, Y.; Yuzhakov, V. Raman and IR spectroscopy research on hydrogen bonding in water-ethanol systems. Mol. Phys. 2010, 108, 2427–2436. [Google Scholar] [CrossRef]
  129. Nedic, M.; Wassermann, T.N.; Wugt Larsen, R.; Suhm, M.A. A combined Raman- and infrared jet study of mixed methanol-water and ethanol-water clusters. Phys. Chem. Chem. Phys. 2011, 13, 14050–14063. [Google Scholar] [CrossRef] [PubMed]
  130. Zehentbauer, F.M.; Bain, E.J.; Kiefer, J. Multiple parameter monitoring in a direct methanol fuel cell. Meas. Sci. Technol. 2012, 23. [Google Scholar] [CrossRef]
  131. Mendes, L.S.; Oliveira, F.C.C.; Suarez, P.A.Z.; Rubim, J.C. Determination of ethanol in fuel ethanol and beverages by Fourier transform (FT)-near infrared and FT-Raman spectrometries. Anal. Chim. Acta 2003, 493, 219–231. [Google Scholar] [CrossRef]
  132. Arita, Y.; Ewart, P. Infra-red multi-mode absorption spectroscopy of acetylene using an Er/Yb: Glass micro-laser. Opt. Express 2008, 16, 4437–4442. [Google Scholar] [CrossRef] [PubMed]
  133. Northern, J.H.; Thompson, A.W.J.; Hamilton, M.L.; Ewart, P. Multi-species detection using multi-mode absorption spectroscopy (MUMAS). Appl. Phys. B 2013, 111, 627–635. [Google Scholar] [CrossRef]
  134. Kiefer, J. Instantaneous shifted-excitation Raman difference spectroscopy (iSERDS). J. Raman Spectrosc. 2014, 45, 980–983. [Google Scholar] [CrossRef]
  135. Kaminski, C.F.; Watt, R.S.; Elder, A.D.; Frank, J.H.; Hult, J. Supercontinuum radiation for applications in chemical sensing and microscopy. Appl. Phys. B 2008, 92, 367–378. [Google Scholar] [CrossRef]
  136. Werblinski, T.; Engel, S.R.; Engelbrecht, R.; Zigan, L.; Will, S. Temperature and multi-species measurements by supercontinuum absorption spectroscopy for IC engine applications. Opt. Express 2013, 21, 13656–13667. [Google Scholar] [CrossRef] [PubMed]
  137. Hult, J.; Watt, R.S.; Kaminski, C.F. High bandwidth absorption spectroscopy with a dispersed supercontinuum source. Opt. Express 2007, 15, 11385–11395. [Google Scholar] [CrossRef] [PubMed]
  138. Sych, Y.; Engelbrecht, R.; Schmauss, B.; Kozlov, D.N.; Seeger, T.; Leipertz, A. Broadband time-domain absorption spectroscopy with a ns-pulse supercontinuum source. Opt. Express 2010, 18, 22762–22771. [Google Scholar] [CrossRef] [PubMed]
  139. Walewski, J.; Sanders, S.T. High-resolution wavelength-agile laser source based on pulsed super-continua. Appl. Phys. B 2004, 79, 415–418. [Google Scholar] [CrossRef]
  140. Kiefer, J.; Ewart, P. Laser diagnostics and minor species detection in combustion using resonant four-wave mixing. Prog. Energy Combust. Sci. 2011, 37, 525–564. [Google Scholar] [CrossRef] [Green Version]
  141. Roy, S.; Gord, J.R.; Patnaik, A.K. Recent advances in coherent anti-Stokes Raman scattering spectroscopy: Fundamental developments and applications in reacting flows. Prog. Energy Combust. Sci. 2010, 36, 280–306. [Google Scholar] [CrossRef]
  142. Beyrau, F.; Seeger, T.; Malarski, A.; Leipertz, A. Determination of temperatures and fuel/air ratios in an ethene-air flame by dual-pump CARS. J. Raman Spectrosc. 2003, 34, 946–951. [Google Scholar] [CrossRef]
  143. Li, Z.S.; Linvin, M.; Zetterberg, J.; Kiefer, J.; Aldén, M. Mid-infrared polarization spectroscopy of C2H2: Non-intrusive spatial-resolved measurements of polyatomic hydrocarbon molecules for combustion diagnostics. Proc. Combust. Inst. 2007, 31, 817–824. [Google Scholar] [CrossRef]
  144. Li, Z.S.; Rupinski, M.; Zetterberg, J.; Aldén, M. Mid-infrared PS and LIF detection of CH4 and C2H6 in cold flows and flames at atmospheric pressure. Proc. Combust. Inst. 2005, 30, 1629–1636. [Google Scholar] [CrossRef]
  145. Germann, G.J.; Farrow, R.L.; Rakestraw, D.J. Infrared degenerate four-wave mixing spectrsocopy of polyatomic molecules: CH4 and C2H2. JOSA B 1995, 12, 25–32. [Google Scholar] [CrossRef]
  146. Sun, Z.W.; Li, Z.S.; Li, B.; Alden, M.; Ewart, P. Detection of C2H2 and HCl using mid-infrared degenerate four-wave mixing with stable beam alignment: Towards practical in situ sensing of trace molecular species. Appl. Phys. B 2010, 98, 593–600. [Google Scholar] [CrossRef]
  147. Roshani, B.; Flügel, A.; Schmitz, I.; Kozlov, D.N.; Seeger, T.; Zigan, L.; Kiefer, J.; Leipertz, A. Simultaneous measurements of fuel vapor concentration and temperature in a flash-boiling propane jet using laser-induced gratings. J. Raman Spectrosc. 2013, 44, 1356–1362. [Google Scholar] [CrossRef]
  148. Seeger, T.; Kiefer, J.; Weikl, M.C.; Leipertz, A.; Kozlov, D.N. Time-resolved measurement of the local equivalence ratio in a gaseous propane injection process using laser-induced gratings. Opt. Express 2006, 14, 12994–13000. [Google Scholar] [CrossRef] [PubMed]
  149. Bohlin, A.; Kliewer, C.J. Single-shot hyperspectral coherent Raman planar imaging in the range 0–4200 cm−1. Appl. Phys. Lett. 2014, 105. [Google Scholar] [CrossRef]
  150. Bohlin, A.; Kliewer, C.J. Two-beam ultrabroadband coherent anti-Stokes Raman spectroscopy for high resolution gas-phase multiplex imaging. Appl. Phys. Lett. 2014, 104. [Google Scholar] [CrossRef]
  151. Tedder, S.A.; Wheeler, J.L.; Cutler, A.D.; Danehy, P.M. Width-increased dual-pump enhanced coherent anti-Stokes Raman spectroscopy. Appl. Opt. 2010, 49, 1305–1313. [Google Scholar] [CrossRef] [PubMed]
  152. Roy, S.; Meyer, T.R.; Brown, M.S.; Velur, V.N.; Lucht, R.P.; Gord, J.R. Triple-pump coherent anti-Stokes Raman scattering (CARS): Temperature and multiple-species concentration measurements in reacting flows. Opt. Commun. 2003, 224, 131–137. [Google Scholar] [CrossRef]

