
The Effect of Electric Load Profiles on the Performance of Off-Grid Residential Hybrid Renewable Energy Systems

Abstract
:1. Introduction
2. Energy Usage in Off-Grid Electrical Power Systems
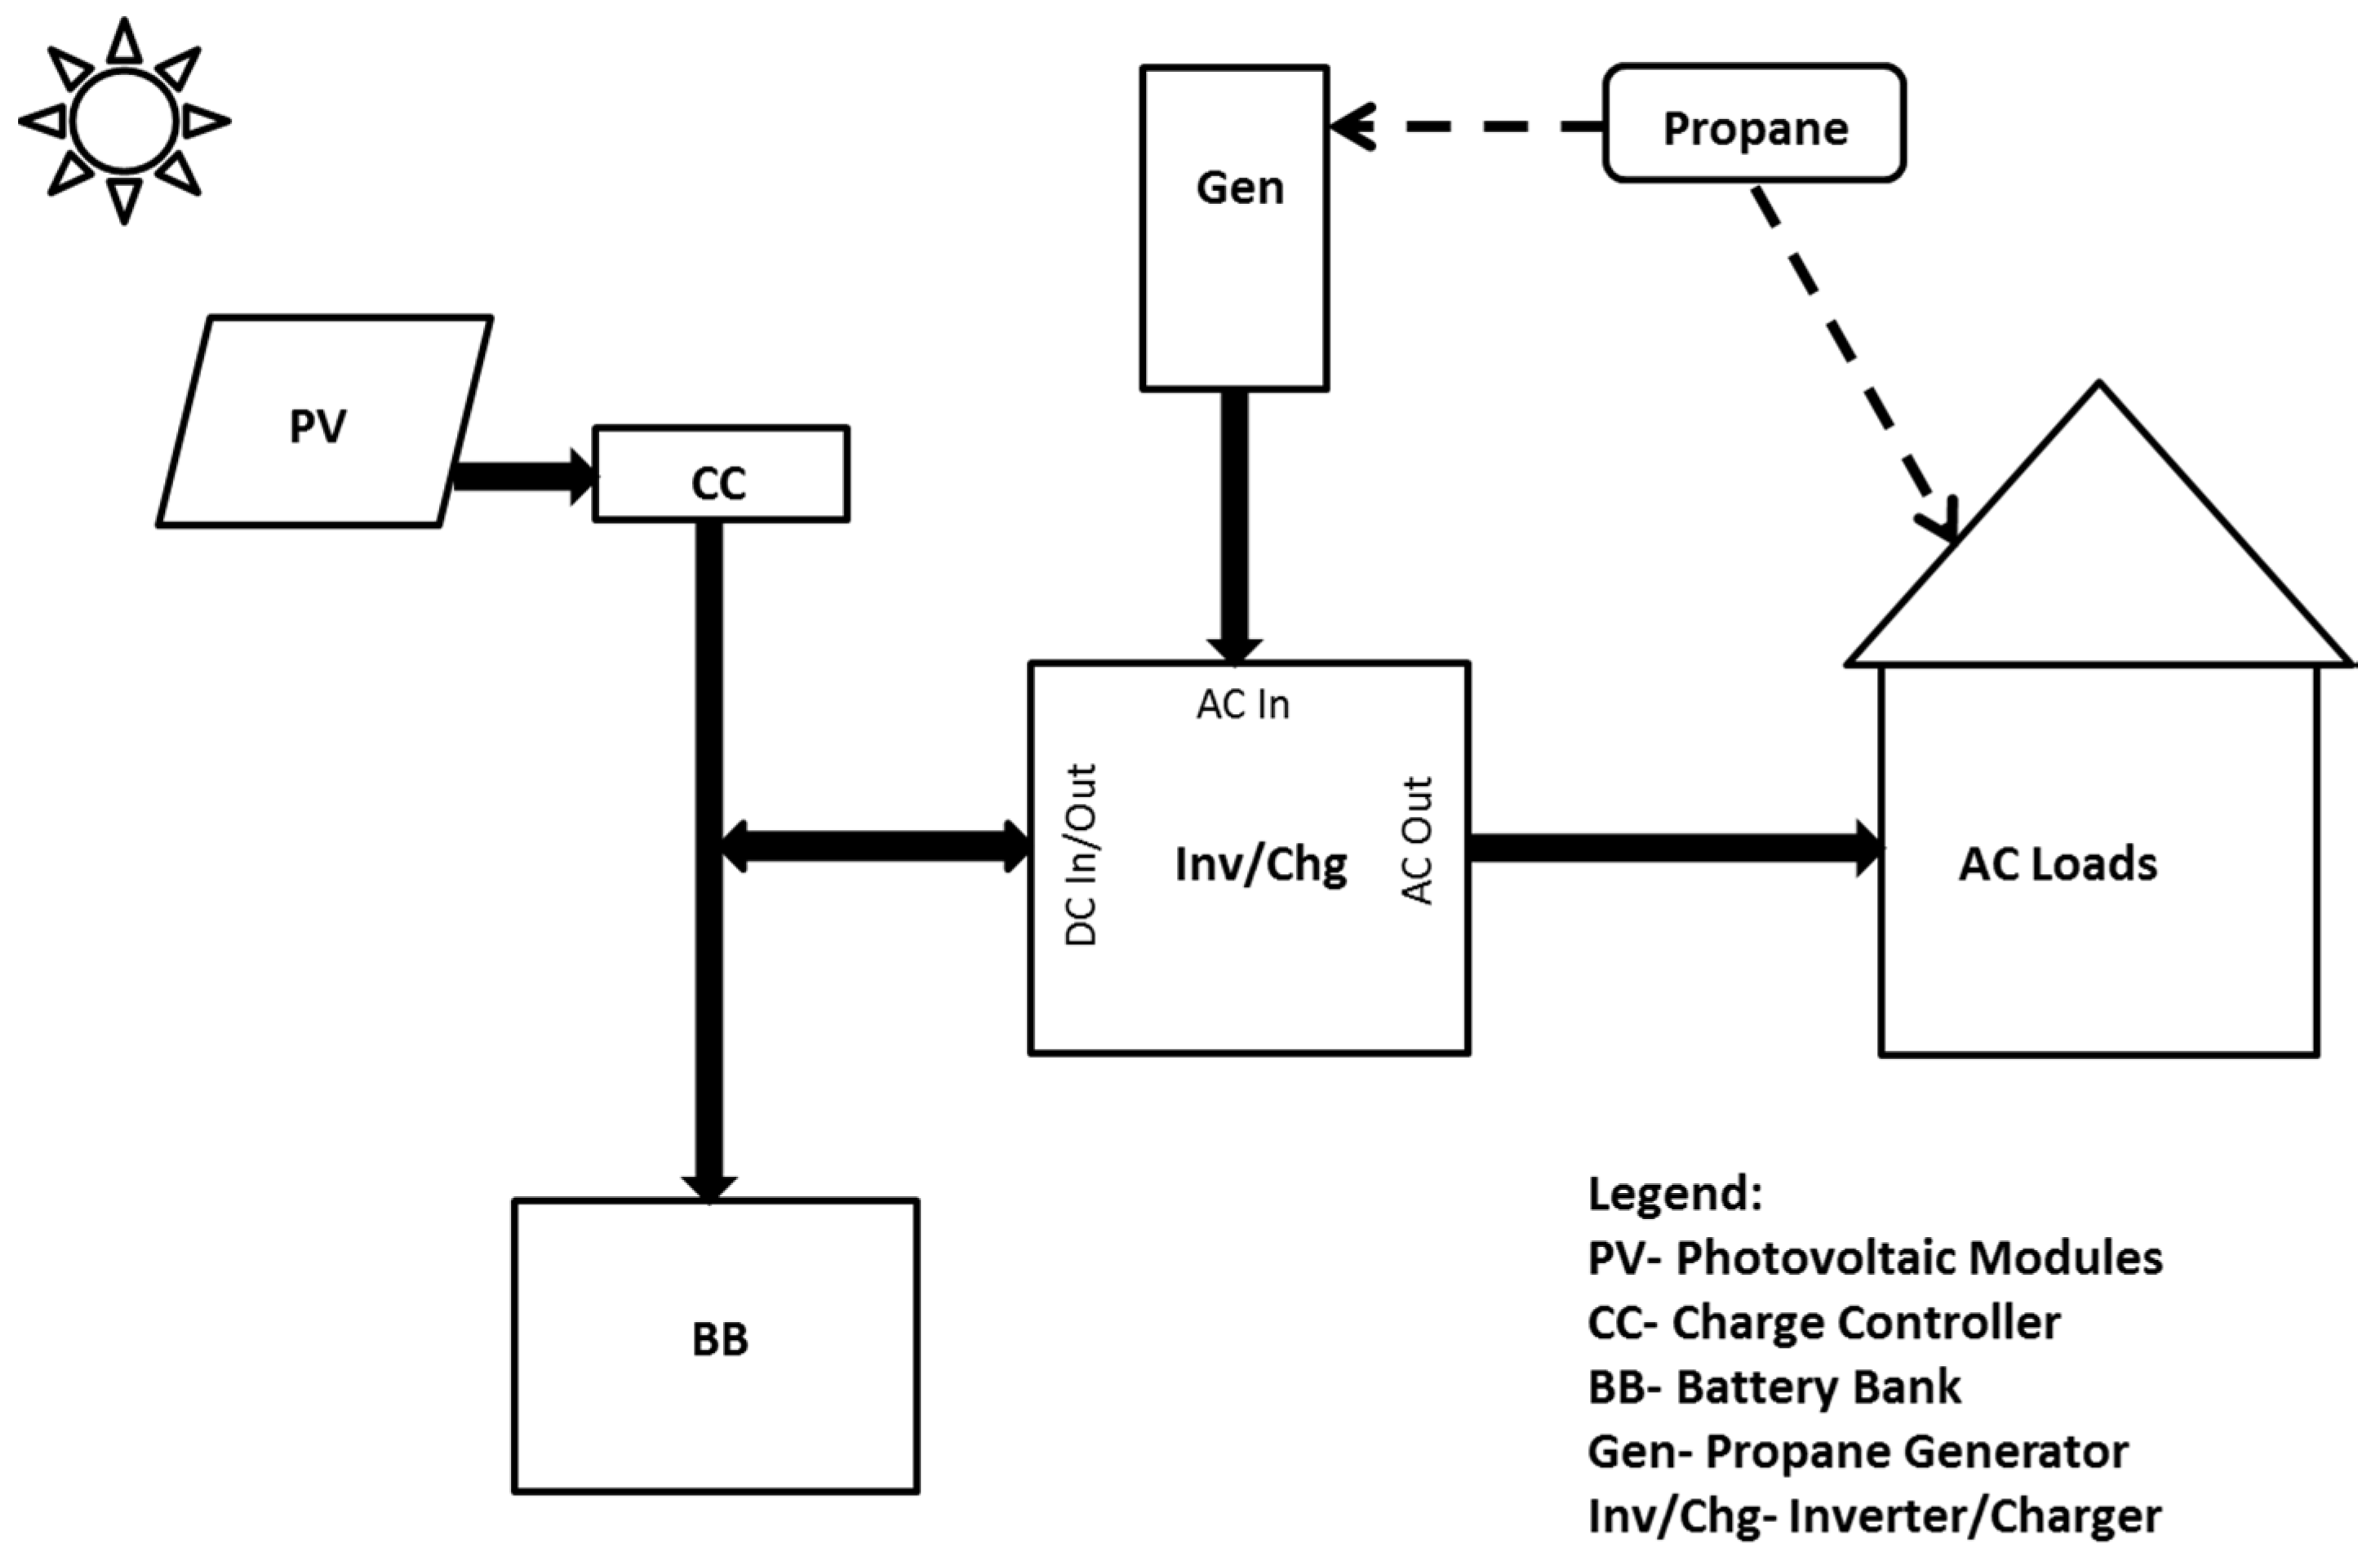
2.1. Typical Off-Grid Residential Electric Power System

2.2. Typical System Sequence of Operation
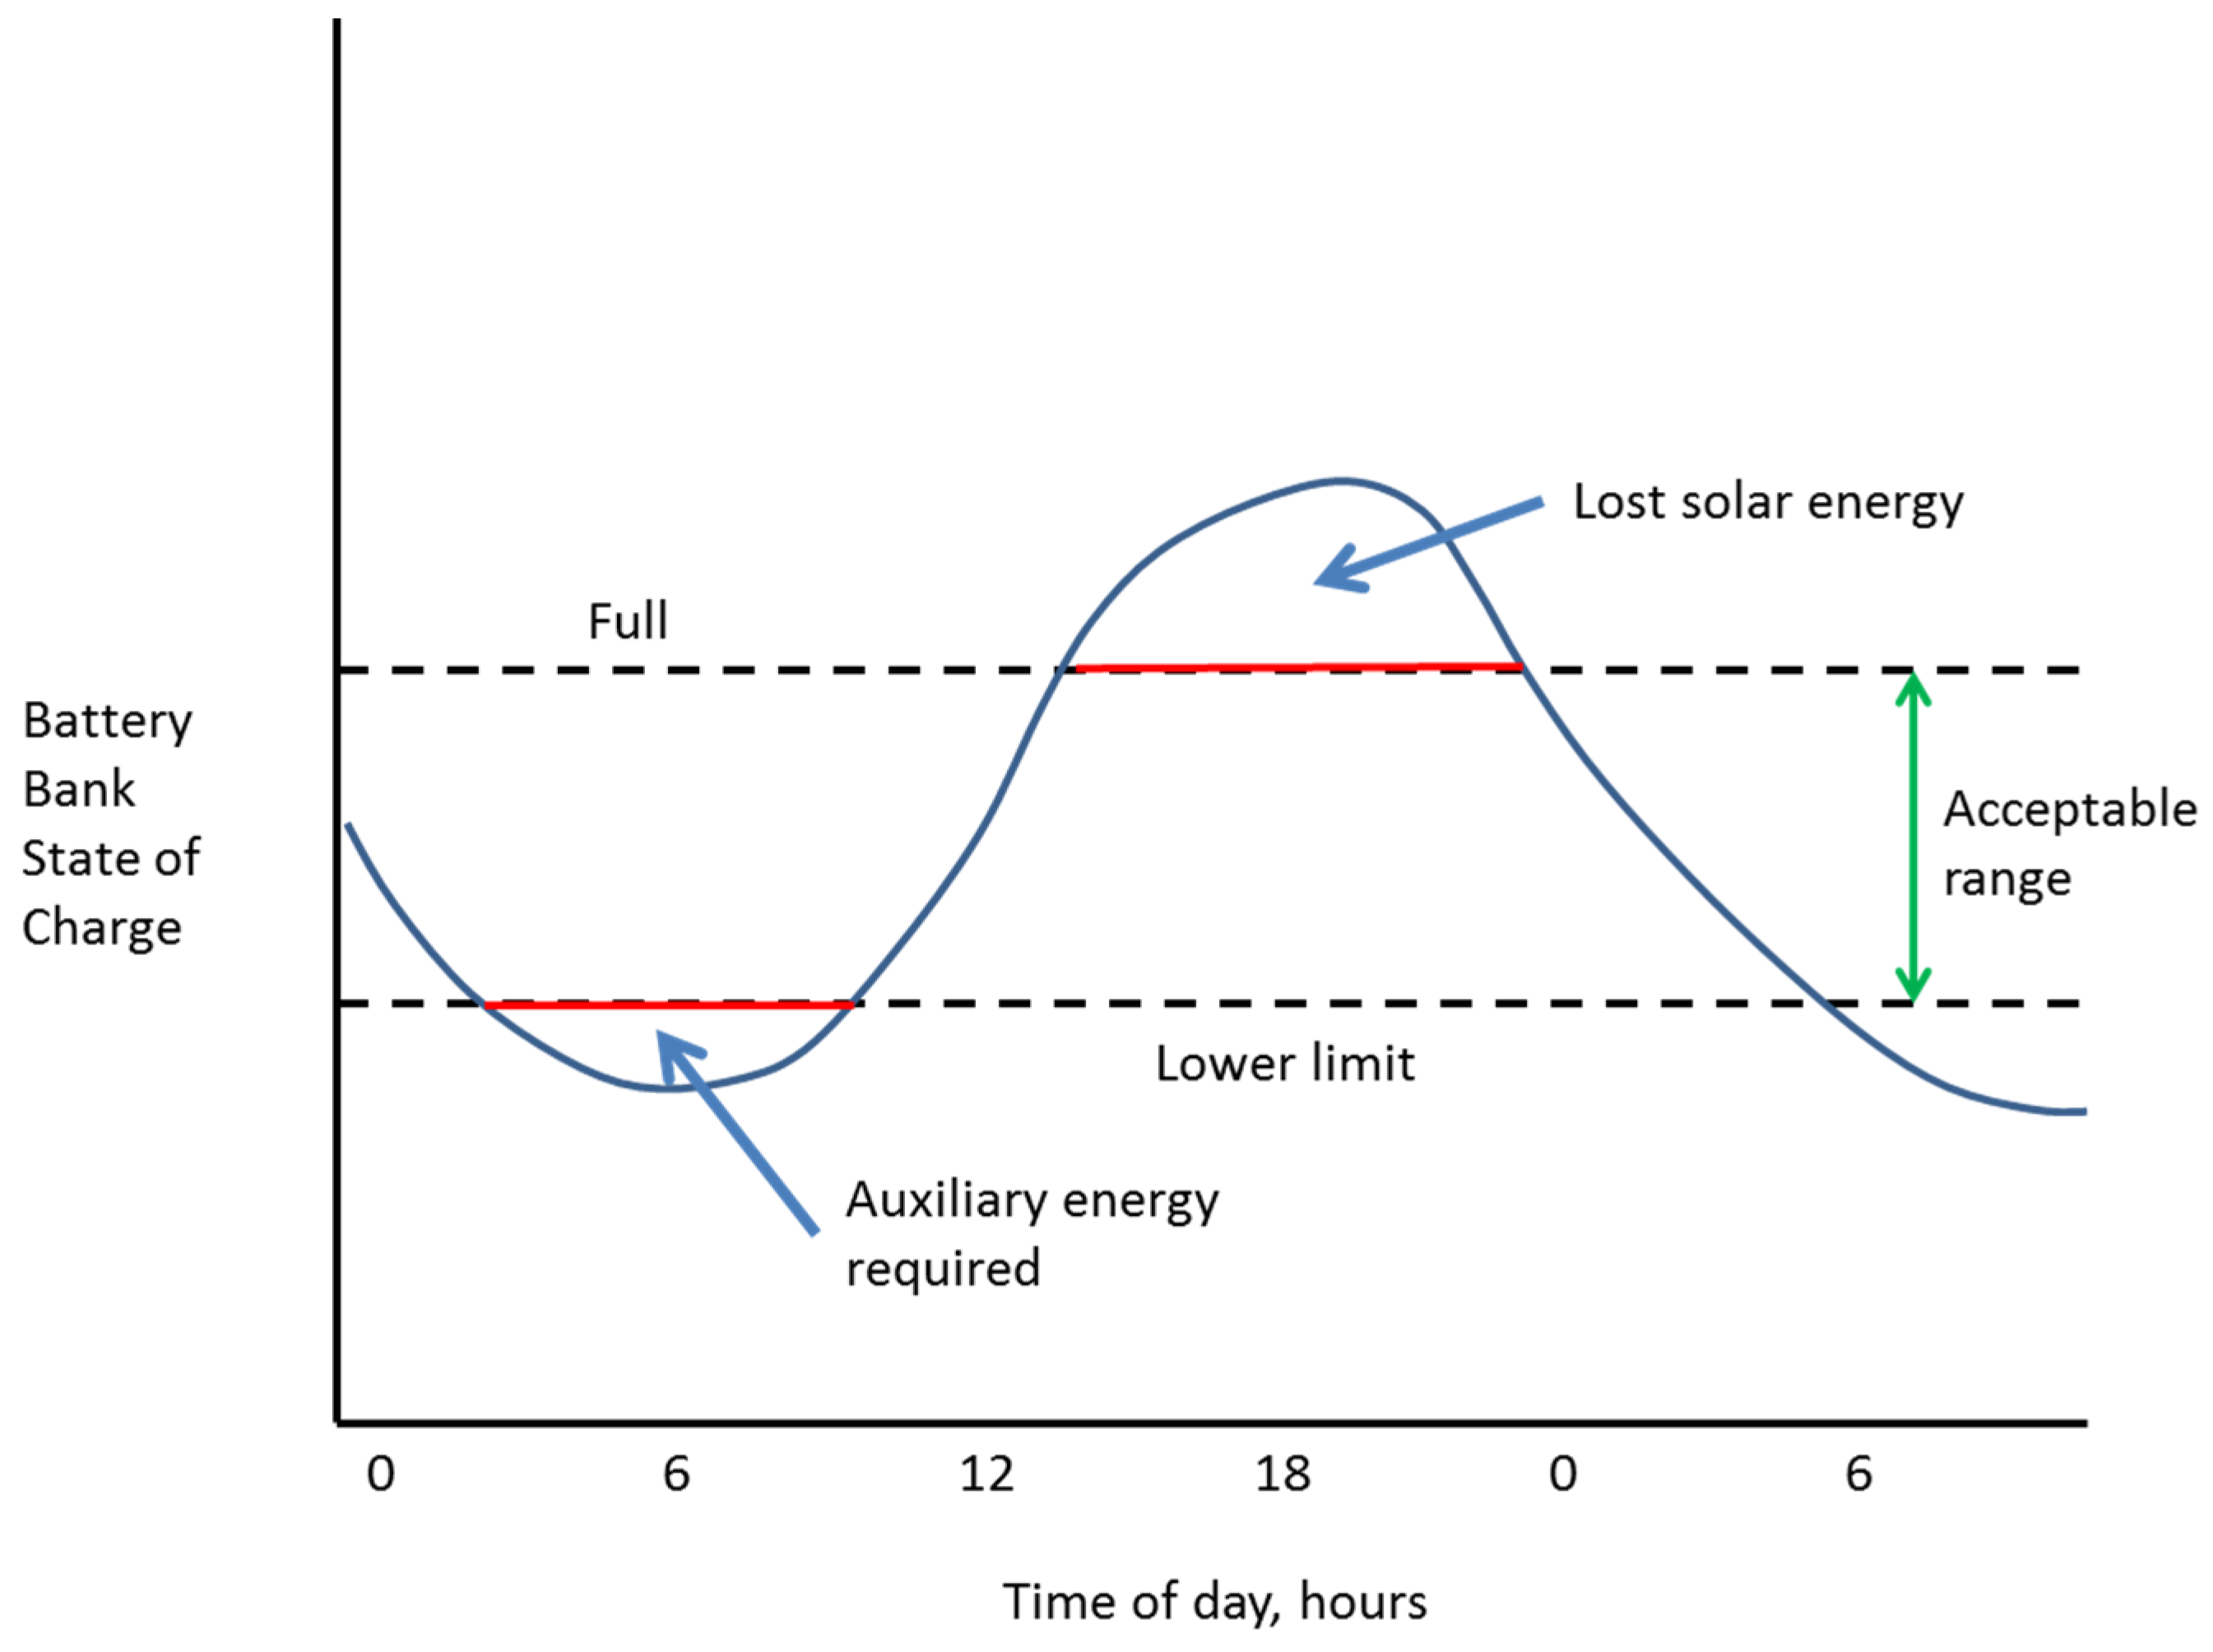
2.3. Residential Electrical Power Load Profiles and Energy Performance
- Battery bank storage depleted.
- Battery bank fully charged.

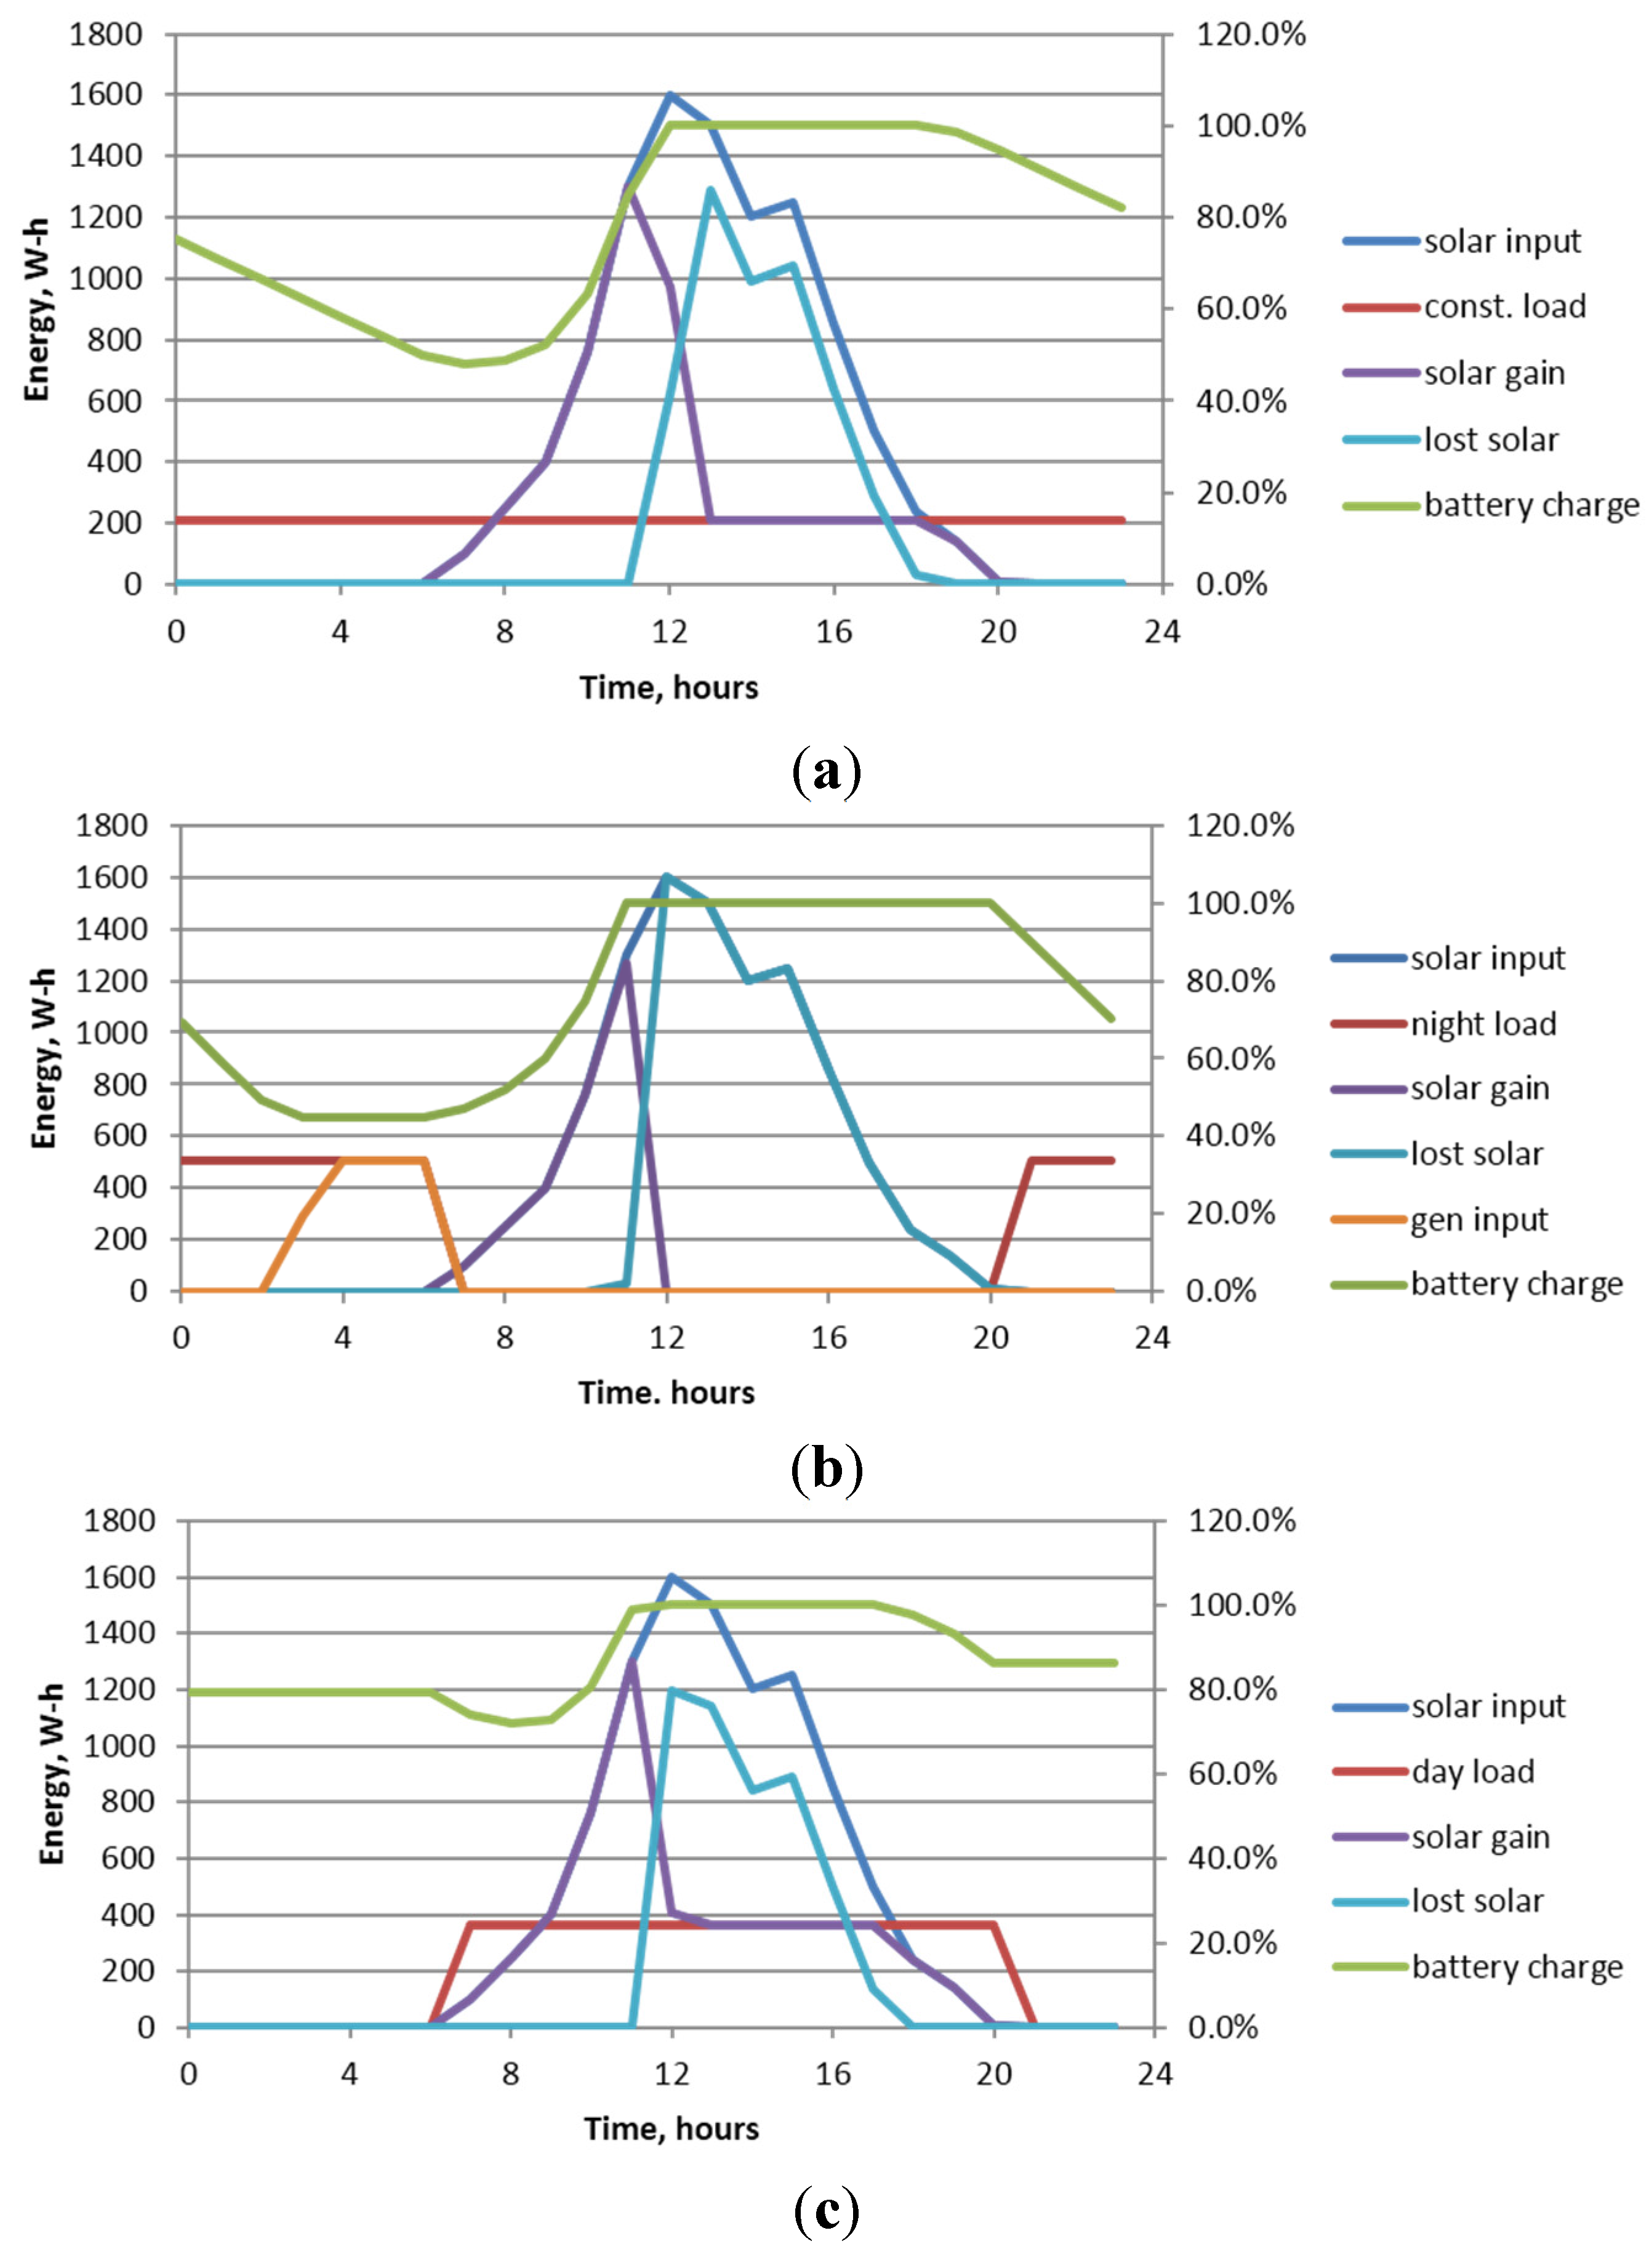
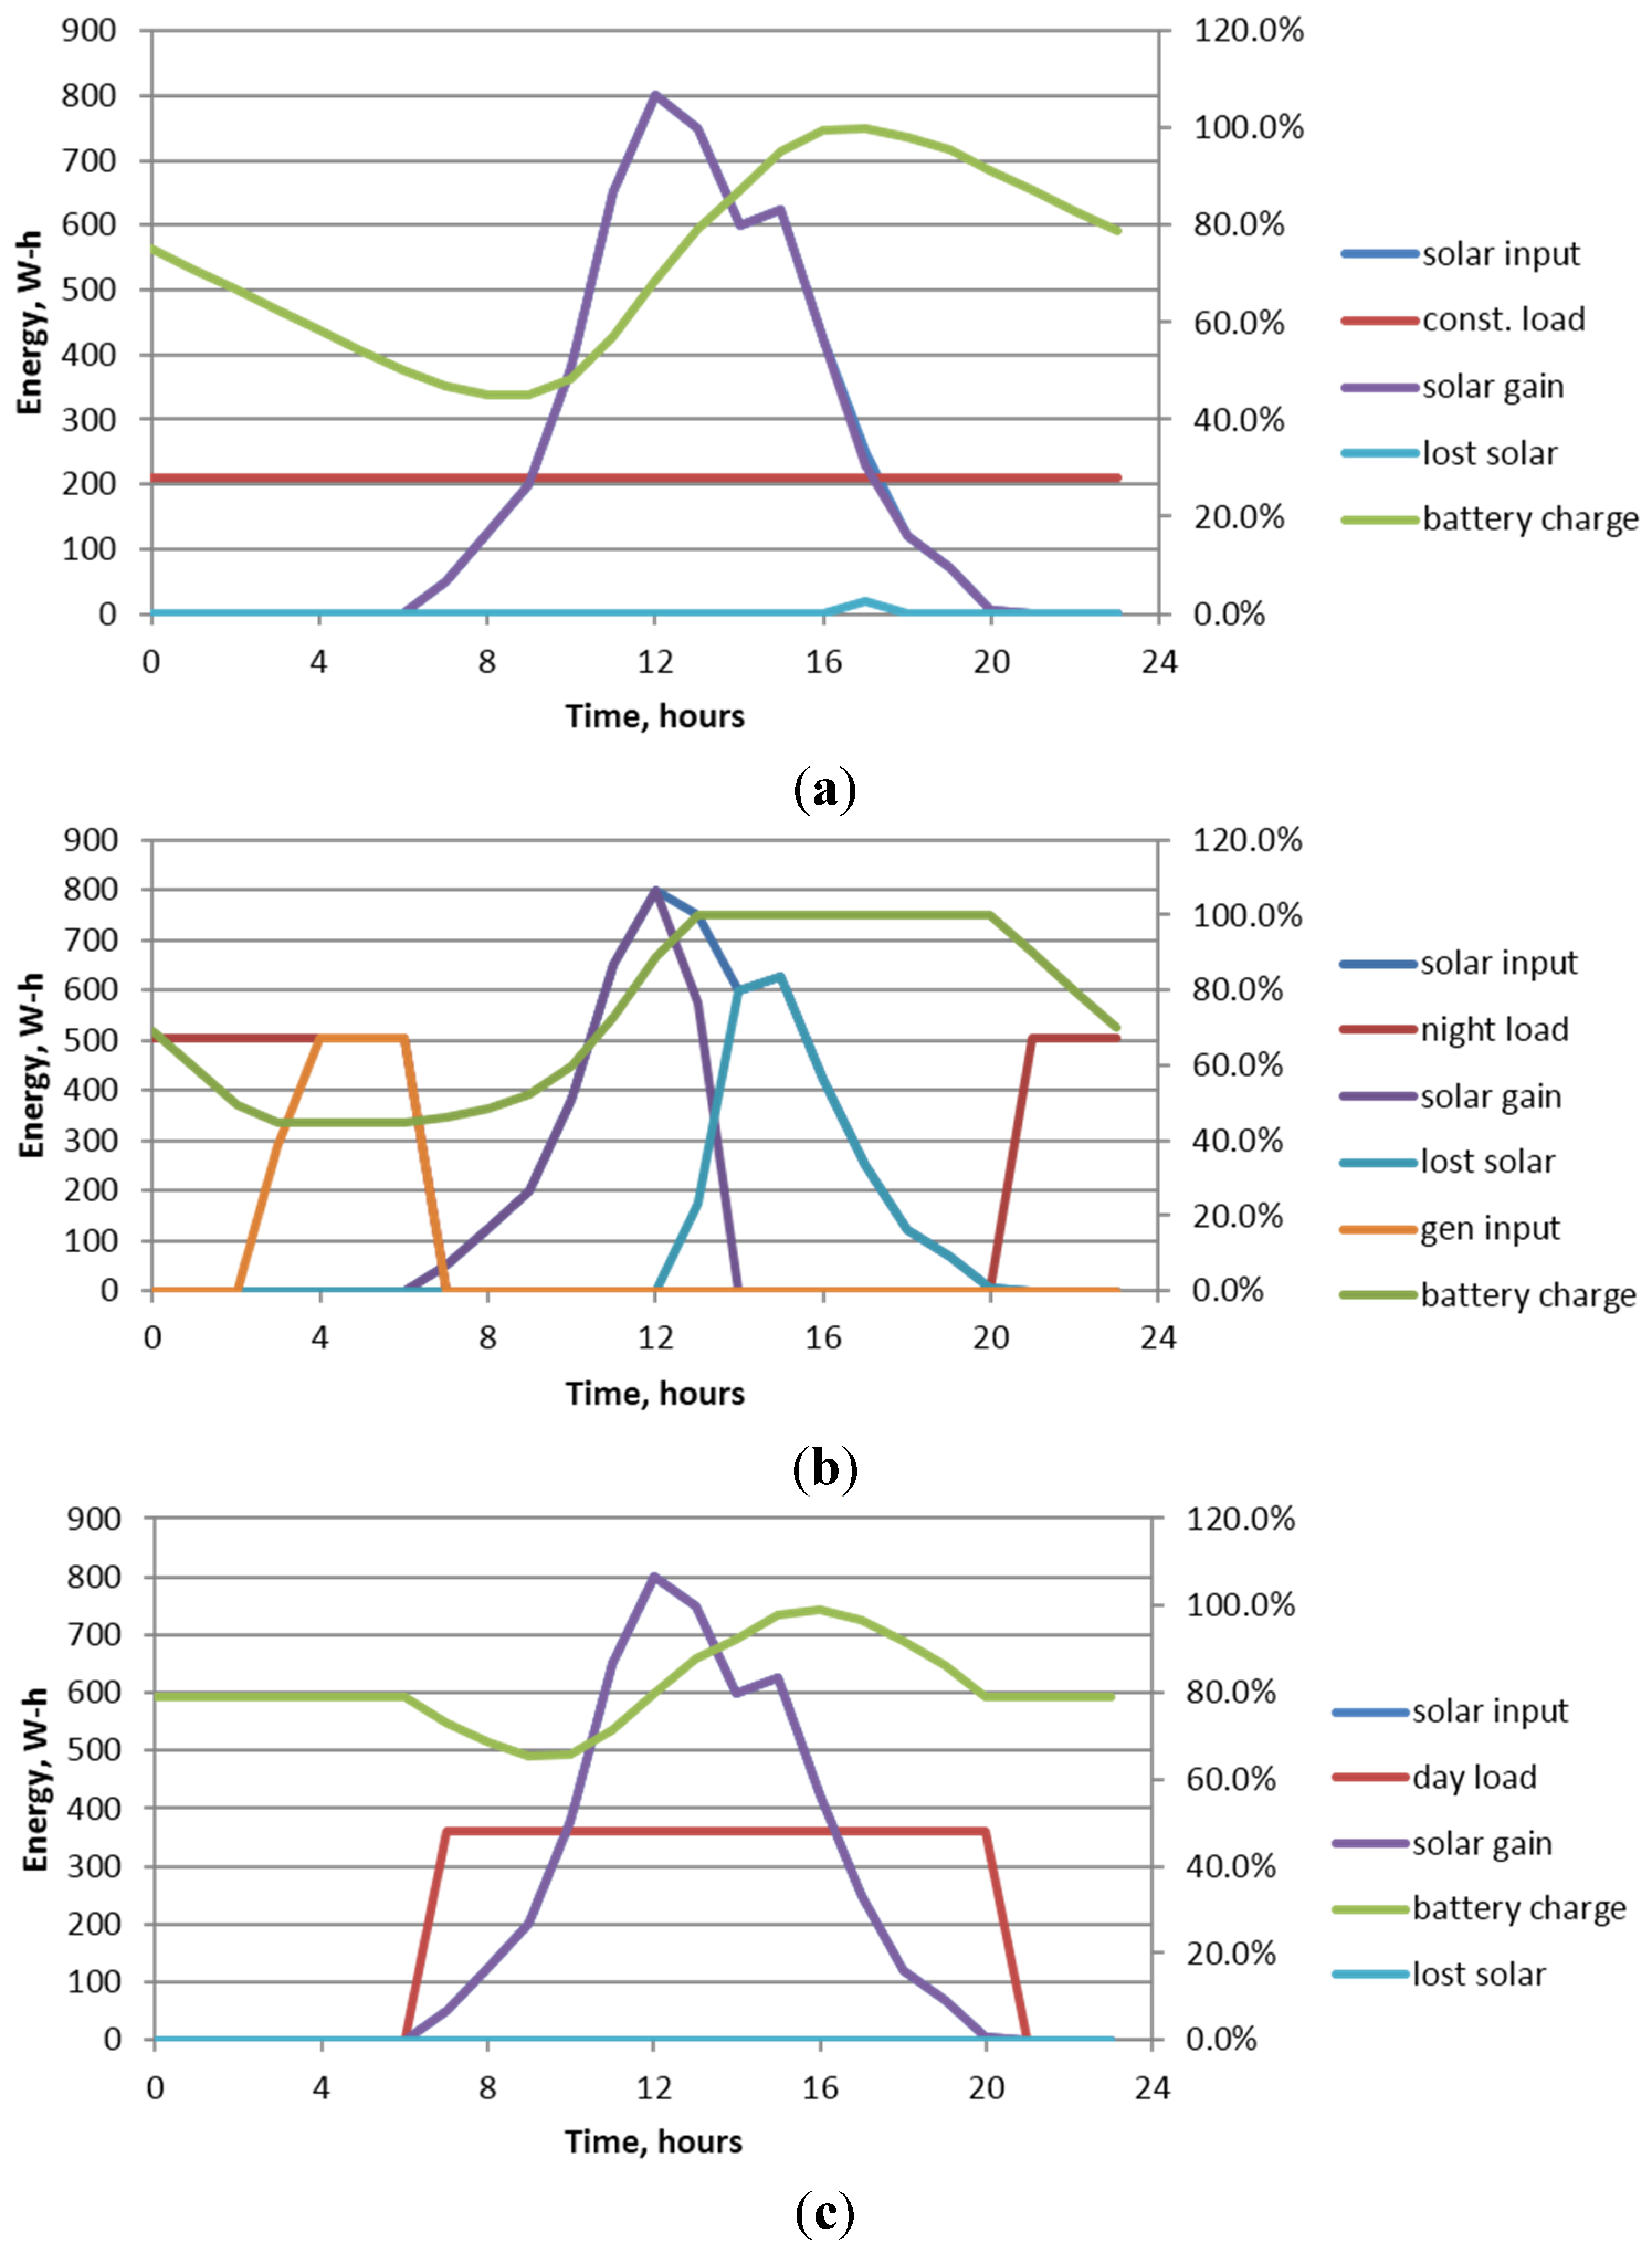
- With the constant 24 h load (Figure 3a), the battery bank charge drops to about 45% before gradually recovering to a fully charged condition in the late afternoon (hour 17). Typically, the system controlling the charging of a battery bank will not allow the state of charge to drop below about 40% or 50% to prevent possible damage or reduced life, so this level of discharge would be acceptable, and no additional power from the propane generator would be required. Also, the energy extracted from the battery bank in the early morning hours (hours 0–6) results in a state of charge of 50% when the PV system starts to produce electrical power as the sun rises, so almost all of the available solar energy can be harvested while also meeting all of the electrical load. A small amount of lost solar is occurs at hour 17 when the battery bank becomes fully charged and thus cannot accept any more power.
- In contrast, when the electrical loads are concentrated during the nighttime hours (Figure 3b), the battery bank charge quickly drops below 50%, and if allowed would become almost completely discharged before eventually recovering to fully charged at hour 18. As mentioned above, the charge control system generally will not allow the battery bank charge to drop to that extent, so in actuality, the propane generator would be activated during hour 3, thereby meeting the load and preventing the battery bank charge from dropping below 45% . As a result, propane will be consumed until the load drops to zero, and the solar energy will charge the battery until it reaches a fully charged condition (hour 13, at which time no more charging will occur and 40% of the available solar energy will be lost.
- When the load is concentrated during the daylight hours (Figure 3c), the battery bank charge never drops below 65%, and all of the load will be met by solar energy, and all of the solar energy will be harvested.


| Scenario | Solar Fraction, % | Solar Utilization, % | Auxiliary Input, W·h/day |
|---|---|---|---|
| 24 hour constant load, low solar | 100 | 99.6 | 0 |
| nighttime load, low solar | 64.3 | 45.0 | 1805 |
| daylight load, low solar | 100 | 100 | 0 |
| 24 hour constant load, high solar | 100 | 51.5 | 0 |
| nighttime load, high solar | 64.3 | 27.5 | 1805 |
| daylight load, high solar | 100 | 53.6 | 0 |
| 24 hour constant load, high solar, 2x storage | 100 | 64.0 | 0 |
| nighttime load, low solar, 2x storage | 64.3 | 74.2 | 1300 |
- 1
- Conduct an hourly annual analysis, after first specifying all of the various electrical load profiles and solar availability;
- 2
- Develop a method for estimating the annual energy performance based on site and system characteristics that are known.
3. Methodology for Analyzing Off-Grid Hybrid Electric Power Systems
- Mode 1: If solar PV AC power is greater than or equal to the building AC load, and the battery bank charge is above the minimum allowed, the generator will be off and the building AC loads will be met by the solar PV AC power from the inverter, with any excess power available for battery bank charging.
- Mode 2: If solar PV AC power is less than the building AC load, and the battery bank charge is above the minimum allowed, the generator will be off and the building AC loads will be met by a combination of solar PV power and power from the battery bank from the inverter.
- Mode 3: If solar PV AC power is greater than or equal to the building AC load, and the battery bank charge is below the minimum allowed, the generator will be on providing power to meet the building AC loads, and both the solar PV DC power and the generator will share charging of the battery bank.
- Mode 4: If solar PV AC power is less than the building AC load, and the battery bank charge is below the minimum allowed, the generator will be on and the building AC loads will be met by a combination of solar PV power and generator power, and both the solar PV DC power and the generator will share charging of the battery bank
- Mode 5: If there is no solar power, and the battery bank charge is above the minimum allowed, the generator will be off and the building AC loads will be met by the battery bank AC power from the inverter.
- Mode 6: If there is no solar power, and the battery bank charge is below the minimum allowed, the generator will be on providing power to meet the building AC loads, and charge the battery bank.
3.1. Refrigerator Energy Usage
3.2. Component Performance Characteristics
3.3. Electrical Power Supplied to the Building AC Loads
- PVDC = DC power output from the solar PV system;
- PLDBBPV = power to the AC load from the battery bank that is attributed to the solar PV, or
- PBBPV = power input to the battery bank from solar PV;
- RBBPV = fraction of total AC power supplied to the load attributable to solar PV;
- PLDBBGEN = power to the AC load from the battery bank that is attributed to the motor/generator, or
- PBBGEN = power input to the battery bank from the generator;
- RBBGEN = fraction of total AC power supplied to the load attributable to the generator.
3.4 Energy Consumption and Fuel Usage for the Hybrid System
- RPV = fraction of total AC power supplied directly by the solar PV;
- RGEN = fraction of total AC power supplied directly by the generator;
- RBB = fraction of total AC power supplied battery bank.
| Characteristic | Assumed Value |
|---|---|
| Electric Refrigerator Coefficient of Performance (COPe) | 2.0–3.0 |
| Gas Refrigerator Coefficient of Performance (COPg) | 0.6–1.0 |
| Coefficient of Performance Ratio COPR = COPe/COPg | 2–5 |
| Refrigeration Thermal Load (RTL) | 1575 kWh/year |
| Generator Efficiency (ηgen) | 0.27 |
| Inverter Efficiency (ηinv) | 0.85 |
| Charger Efficiency (ηchg) | 0.85 |
| Battery Bank Efficiency (ηbb) | 0.77 |
| Refrigerator Load Fraction | 0.25 |
| Mode | RPV | RGEN | RBB | Energy Utilization Efficiency for SF = BF = 0.5 |
|---|---|---|---|---|
| 1 | 1 | 0 | 0 | ηinv = 0.85 |
| 2 | 1-BF | 0 | BF | (RPV + RBBηbb) × ηinv = 0.75 |
| 3 | 0 | 1 | 0 | ηgen = 0.27 |
| 4 | SF | 1-SF | 0 | (RPV + RGEN ηgen) ηinv= 0.54 |
| 5 | 0 | 0 | 1 | (0.5 + ηgen ηchg) ηbb ηinv = 0.48 (assumes stored energy is half solar and half generator |
| 6 | 0 | 1 | 0 | ηgen = 0.27 |
| RPV | RGEN | RBB |
|---|---|---|
| 0.5 | 0.25 | 0.25 |
| 0.25 | 0.5 | 0.25 |
| 0.25 | 0.25 | 0.5 |
| 0.33 | 0.33 | 0.33 |
4. Results
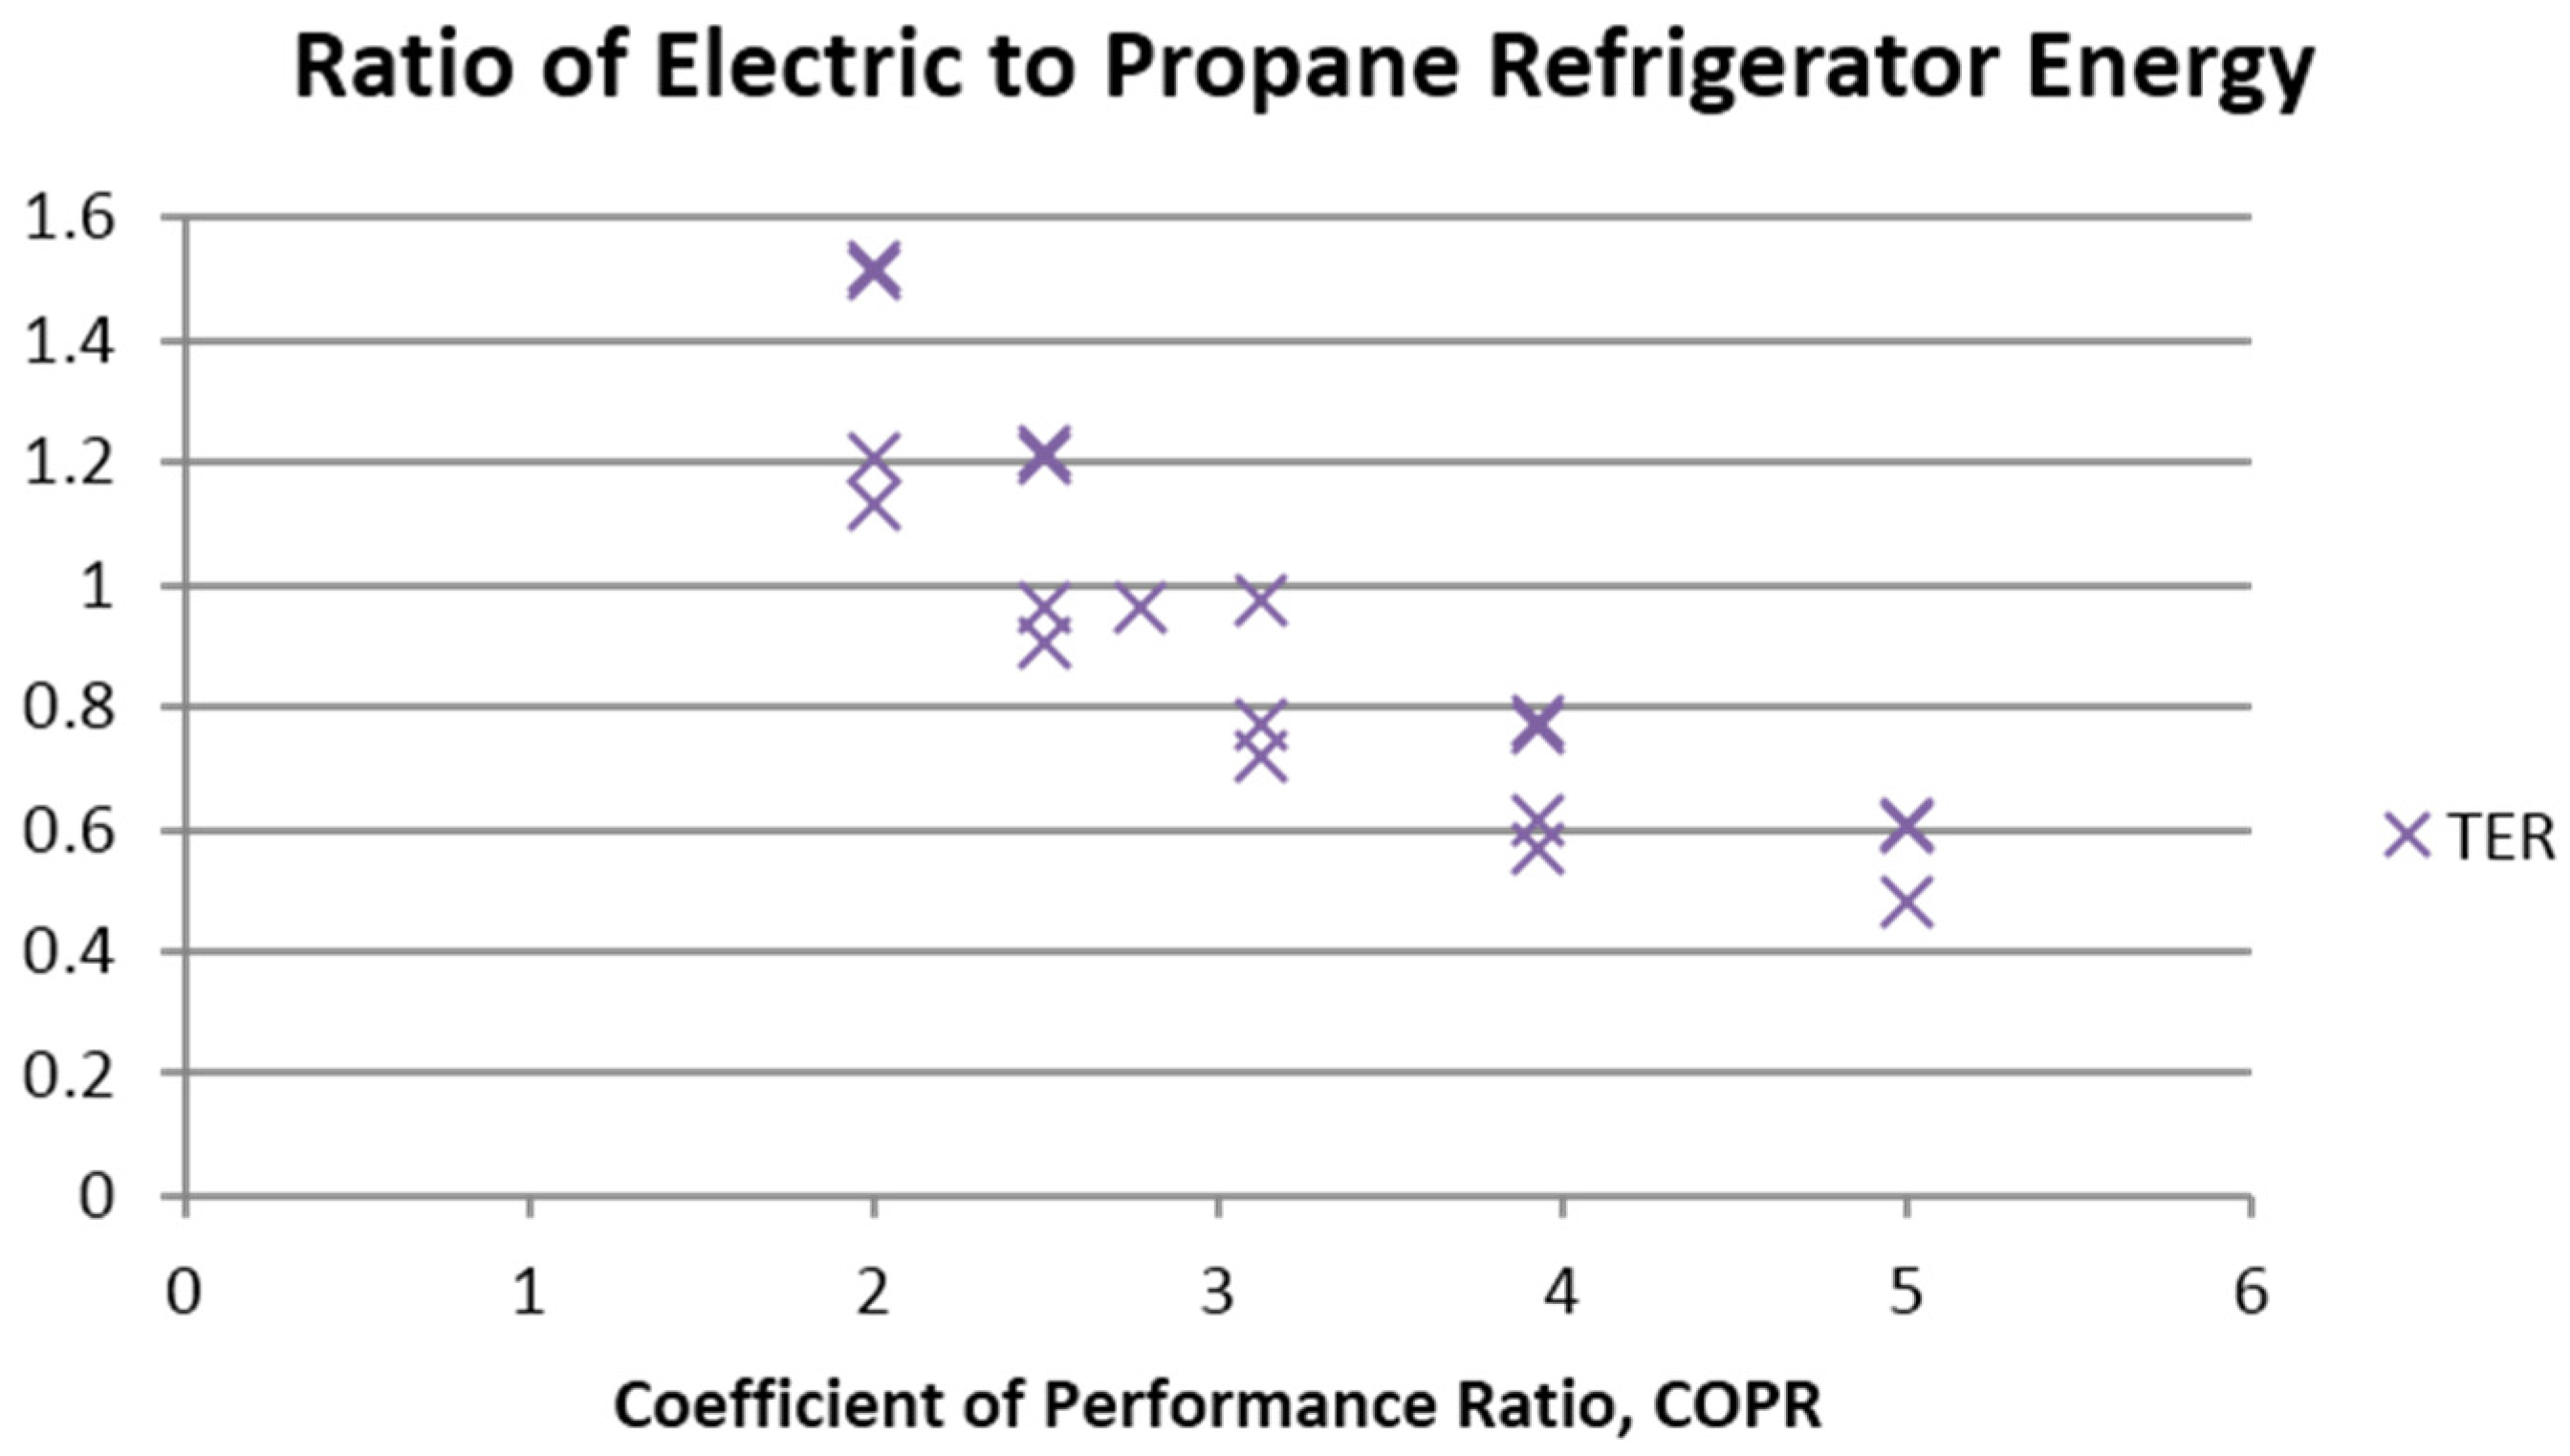
| Run # | COPe | COPg | COPR | RBB | RGEN | RPV | TER |
|---|---|---|---|---|---|---|---|
| 1 | 3 | 0.6 | 5 | 0.25 | 0.25 | 0.5 | 0.4826 |
| 2 | 3 | 0.6 | 5 | 0.25 | 0.5 | 0.25 | 0.6089 |
| 3 | 3 | 0.6 | 5 | 0.5 | 0.25 | 0.25 | 0.6035 |
| 4 | 3 | 0.6 | 5 | 0.33 | 0.33 | 0.33 | 0.5666 |
| 5 | 2.75 | 0.7 | 3.929 | 0.25 | 0.25 | 0.5 | 0.6142 |
| 6 | 2.75 | 0.7 | 3.929 | 0.25 | 0.5 | 0.25 | 0.775 |
| 7 | 2.75 | 0.7 | 3.929 | 0.5 | 0.25 | 0.25 | 0.7681 |
| 8 | 2.75 | 0.7 | 3.929 | 0.33 | 0.33 | 0.33 | 0.7211 |
| 9 | 2.5 | 0.8 | 3.125 | 0.25 | 0.25 | 0.5 | 0.7721 |
| 10 | 2.5 | 0.8 | 3.125 | 0.25 | 0.5 | 0.25 | 0.9743 |
| 11 | 2.5 | 0.8 | 3.125 | 0.5 | 0.25 | 0.25 | 0.9656 |
| 12 | 2.5 | 0.8 | 2.778 | 0.33 | 0.33 | 0.33 | 0.9065 |
| 13 | 2.25 | 0.9 | 2.5 | 0.25 | 0.25 | 0.5 | 0.9652 |
| 14 | 2.25 | 0.9 | 2.5 | 0.25 | 0.5 | 0.25 | 1.218 |
| 15 | 2.25 | 0.9 | 2.5 | 0.5 | 0.25 | 0.25 | 1.207 |
| 16 | 2.25 | 0.9 | 2.5 | 0.3 | 0.33 | 0.33 | 1.133 |
| 17 | 2 | 1 | 2 | 0.25 | 0.25 | 0.5 | 1.206 |
| 18 | 2 | 1 | 2 | 0.25 | 0.5 | 0.25 | 1.522 |
| 19 | 2 | 1 | 2 | 0.5 | 0.25 | 0.25 | 1.509 |
| 20 | 2 | 1 | 2 | 0.33 | 0.33 | 0.33 | 1.416 |
5. Discussion, Recommendations and Conclusions
- Schedule discretionary electric loads either during or before periods when solar power is expected to be available as excessive loads at night will incur propane consumption;
- Program the control system to avoid using the generator to charge the battery bank whenever possible when solar energy is expected to be available, or only use the generator to meet real time loads;
- Add a component to the system to enable utilization of any excess solar derived electrical power, such as an electric resistance water heater. These are modest in cost, simple to operate and can absorb quite a bit of energy in a useful fashion.
Acknowledgments
Conflicts of Interest
References
- Akikur, R.K.; Saidur, R.; Ping, H.W.; Ullah, K.R. Comparative study of stand-alone and hybrid solar energy systems suitable for off-grid rural electrification: A review. Renew. Sustain. Energy Rev. 2013, 27, 738–752. [Google Scholar] [CrossRef]
- Bhandari, B.; Lee, K.; Lee, C.S.; Song, C.; Maskey, R.K.; Ahn, S. A novel off-grid hybrid power system comprised of solar photovoltaic, wind, and hydro energy sources. Appl. Energy 2014, 133, 236–242. [Google Scholar] [CrossRef]
- Del Pero, C.; Butera, F.M.; Buffoli, M.; Piegari, L.; Capolongo, L.; Fattore, M. Feasibility Study of a Solar Photovoltaic Adaptable Refrigeration Kit for Remote Areas in Developing Countries. In Proceedings of the 2015 International Conference Clean Electrical Power (ICCEP), Taormina, Italy, 16–18 June 2015.
- Ismail, M.S.; Moghavvemi, M.; Mahlia, T.M.I. Design of a PV/diesel stand alone hybrid system for a remote community in Palestine. J. Asian Sci. Res. 2012, 2, 599–606. [Google Scholar]
- Shaahid, S.M.; El-Amin, I. Techno-economic evaluation of off-grid hybrid photovoltaic-diesel-battery power systems for rural electrification in Saudi Arabia—A way forward for sustainable development. Renew. Sustain. Energy Rev. 2009, 13, 625–633. [Google Scholar] [CrossRef]
- Southern California Gas Company. Guideline: Absorption Chillers; New Buildings Institute: Fair Oaks, CA, USA, 1998. [Google Scholar]
- Srikhirin, P.; Aphornratana, S.; Chungpaibulpatana, S. A review of absorption refrigeration technologies. Renew. Sustain. Energy Rev. 2001, 5, 343–372. [Google Scholar] [CrossRef]
- Santori, G.; Santamaria, S.; Sapienza, A.; Brandani, S.; Freni, A. A stand-alone solar adsorption refrigerator for humanitarian aid. Solar Energy 2014, 100, 172–178. [Google Scholar] [CrossRef]
- Boughton, B.E.; Clausing, A.M.; Newell, T.A. An Investigation of Household Refrigerator Cabinet Loads. Available online: https://www.ideals.illinois.edu/bitstream/handle/2142/9722/TR021.pdf?sequence=3 (accessed on 29 September 2015).
- Grades, E. (2011). Modelling of Domestic Refrigerators’ Energy Consumption under Real Life Conditions in Europe. Available online: http://hss.ulb.uni-bonn.de/2011/2587/2587.pdf (accessed on 29 September 2015).
- U.S. Environmental Protection Agency. Combined Heat and Power Partnership: Catalog of CHP Technologies: Section 2. Technology Characterization—Reciprocating Internal Combustion Engines. Available online: http://www3.epa.gov/chp/documents/catalog_chptech_2.pdf (accessed on 29 September 2015).
- Terrell, W. Energy Requirements of Refrigerators due to Door Opening Conditions. In Proceedings of the International Refrigeration and Air Conditioning Conference, Purdue, IN, USA, July 17–20, 2006.
- Owner’s Manual. MS Series Pure Sine Wave Inverter/Charger. Available online: https://nexusrv.com/wp-content/uploads/2015/04/Magnum_Inverter_and_Charger_Manual.pdf (accessed on 29 September 2015).
© 2015 by the authors; licensee MDPI, Basel, Switzerland. This article is an open access article distributed under the terms and conditions of the Creative Commons Attribution license (http://creativecommons.org/licenses/by/4.0/).
Share and Cite
Treado, S. The Effect of Electric Load Profiles on the Performance of Off-Grid Residential Hybrid Renewable Energy Systems. Energies 2015, 8, 11120-11138. https://doi.org/10.3390/en81011120
Treado S. The Effect of Electric Load Profiles on the Performance of Off-Grid Residential Hybrid Renewable Energy Systems. Energies. 2015; 8(10):11120-11138. https://doi.org/10.3390/en81011120
Chicago/Turabian StyleTreado, Stephen. 2015. "The Effect of Electric Load Profiles on the Performance of Off-Grid Residential Hybrid Renewable Energy Systems" Energies 8, no. 10: 11120-11138. https://doi.org/10.3390/en81011120
APA StyleTreado, S. (2015). The Effect of Electric Load Profiles on the Performance of Off-Grid Residential Hybrid Renewable Energy Systems. Energies, 8(10), 11120-11138. https://doi.org/10.3390/en81011120