1. Introduction
Renewable energy generation, such as photovoltaic (PV), wind, biomass,
etc., integrated into distribution power systems, expected to be one of the main solutions for clean power supply, will be considerably developed throughout the world during the next couple of decades. Currently, many countries have implemented or are in the process of implementing policies to promote renewable energy in the distribution network. This is because distributed energy resources (DERs) in the distribution power system could provide a better balance between the increasing electricity demand and traditional power exportation, reduce the power losses occurring in the feeders during energy transmission, as well as enhance the controllability of energy deployment, which would be the main component of the next generation distribution network framework, namely the active distribution network, with intelligent monitoring techniques and advanced management measures [
1,
2].
However, the fluctuation of DERs is still the main concern for large-scale implementation in low or medium voltage networks. Thus, the energy storage system (ESS) has to be involved to mitigate the bad effects of the DERs’ integration. Compared to other types of ESS, a battery energy storage system (BESS) is relatively the most stable, easy to access and control, as an extremely effective way to cooperate with DERs. [
3] Therefore, the operation strategies for BESS have become a research hotspot from different perspectives.
Actually, many researchers have proposed some optimal strategies to solve the BESS operation problems, as well as for EVs. In [
4], an EV scheduling scheme has been proposed with an uncertain real-time price, taking the battery degradation into account. For another, a real-time scheduling strategy for EVs was presented in [
5] to increase the voltage margin and tent to minimize the line loss. The two works above were inclined to solve the EV scheduling problem with different visions, the originality of which could also be applied in BESS scheduling. In [
6], a mathematical model for a BESS scheduling procedure was proposed to simulate the charging/discharging process, with the objective of minimizing the line losses; however, only the aspect of the power losses was taken into account. Besides, BESS used for ramp rate control, frequency droop response, power factor correction, solar time-shifting and output leveling have been mentioned in [
7], focusing on BESS operation to enable solar energy, which tends to solve BESS scheduling in a transient process. Furthermore, BESS was implemented to deal with power quality disturbances and to compensate reactive power in [
8], as well as the optimal power flow in [
9]. It is noted that the distribution network operation usually deals with power scheduling problems in the steady-state horizon, so in this paper, the BESS scheduling strategies, following the distribution network operation rules in China, are put forward with intervals of 15 min, which is also apparently a compromise decision between precision and computation quantity. Besides, Most of the strategies proposed from the works above were implemented one day ahead, considerably depending on the accuracy of prediction for renewable energy and power demand. Additionally, the errors from forecasting usually do not account for the evaluation of model validity, which may affect the applicability of the model when launching in practice. Therefore, a real-time strategy is the most effective approach for power scheduling.
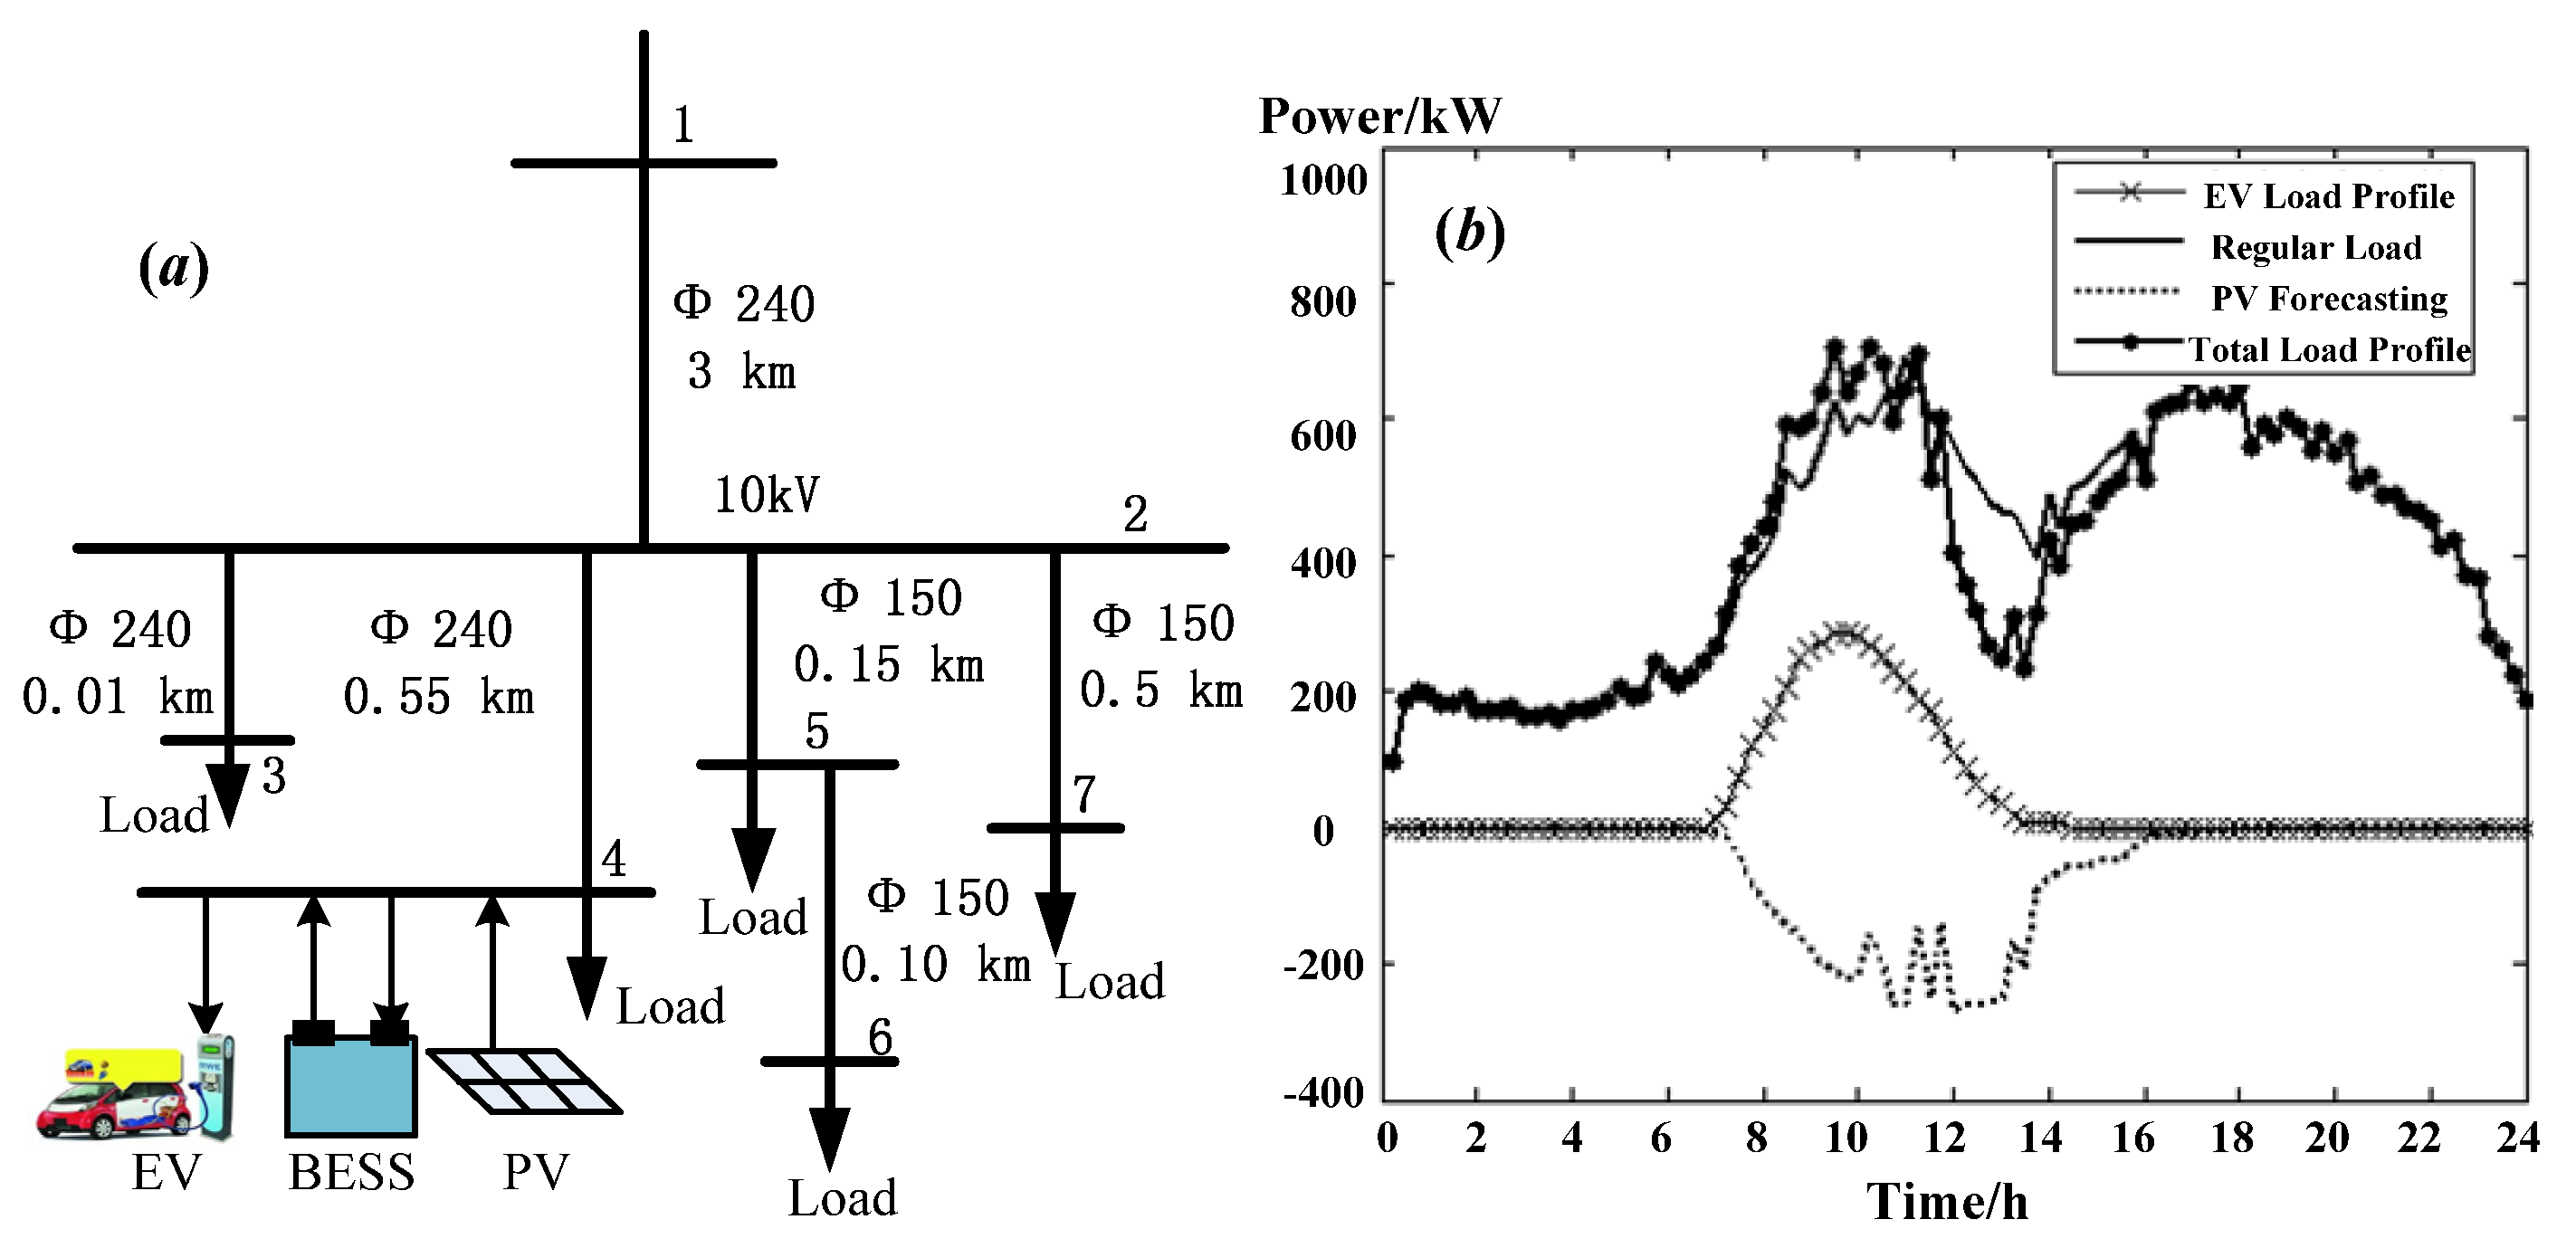
In this paper, optimal scheduling strategies for BESS operation in both the day-ahead and real-time scale have been proposed, to minimize the renewable energy curtailment, to reduce active power loss, to mitigate the voltage fluctuation, as well as to lower the electricity cost. In addition, the EVs considered as the auxiliary technique are also introduced to attenuate the DERs’ influence. Besides, all of the scheduling produced by the proposed strategies has considered the constraints of BESS and EVs’ operation, as well as the power flow. Furthermore, the proposed scheduling strategies were simulated in a real distribution network with renewable energy integration, part of Beijing Jiaotong University power network, obtaining promising results and verifying the effectiveness of the proposed strategies.
The reminder of this paper is organized as follows:
Section 2 describes the relationships between load variance and power loss, as well as between power deviation and voltage deviation. Additionally, some simplifications have been utilized.
Section 3 formulates the multi-objective optimization model.
Section 4 presents the procedure of the day-ahead and real-time strategy to solve the optimization problem, as well as the solution of the multi-objective optimization model.
Section 5 introduces our numerical studies and analyzes the results, followed by conclusions in
Section 6.
2. Problem Derivation
In [
10], it has been noted that minimizing distribution system losses could be equally considered as maximizing the load factor and minimizing load variance if the feeder is a single line from the substation with all loads at the end of the line. Actually, this conclusion could be generalized in a radial distribution system under some assumptions as follows:
Assuming that the mean value of each load in the radial distribution power system could keep constant during normal operation.
The voltage fluctuation of the initial nodes is supposed to be neglected, in consideration of these nodes usually being connected to the substation.
Besides, the reactive power in the distribution network could be ignored since the power factor correction facilities take effect.
2.1. Relationship between Load Shaving and Power Loss
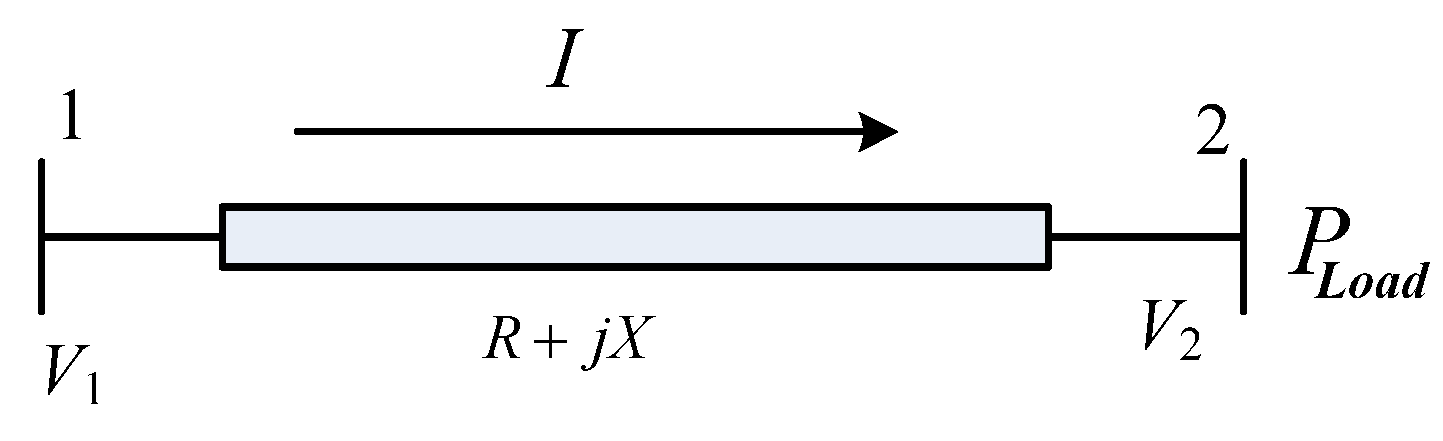
The model utilized in this derivation is shown in
Figure 1. The active power loss for this single branch could be formulated as Equation (1).
Figure 1.
Diagram of a single branch.
Figure 1.
Diagram of a single branch.
where
Ploss is the active power loss of the single branch;
It shows the current value running in the corresponding branch at time
t;
Pt represents the active power of Node 2 at time
t;
Urate means the rated voltage in the assigned level; and
R is the equivalent resistance value [
10].
The load variance could be shown as,
where
is the load variance and
is the mean value of the load;
T represents the time duration, which is 24 h in this paper.
The conclusion could be derived in Equations (3) and (4),
Equation (4) could be plugged into Equation (1); in this way, the relation between
Ploss and
is expressed in Equation (5),
In Equation (5), the active power loss is linear to the load variance in the single branch, if the deviation of the rated voltage could be neglected.
2.2. Relationship between Load Smoothing and Voltage Deviation
The voltage deviation in
Figure 1 could be shown as Equation (6), and the relationship between real power and voltage magnitude could be easily derived based on Kirchhoff’s theory in Equation (7). Then, the combination of Equations (6) and (7) contributed to Equation (8), the relationship between power deviation and voltage deviation.
In the equations above, V1,t and V2,t represent the voltage magnitude of Nodes 1 and 2 at time t, respectively. Additionally, P2,t is the real power of Node 2 at time t. When the subscript shows t + instead of t, it denotes the assigned quantity at time t + .
In Equation (7), assuming constant V1,t, with the consideration that Node 1 is close to the substation, it presents an inverted-U quadratic function relationship between P2,t and V2,t. Clearly, V2,t is definitely more than 1/2 V1,t under normal circumstances, which means it would follow the right-half rules of quadratic function; P2,t would be decreasing synchronously with the increasing of V2,t. Anyway, the variation absolute values show the same trend. Furthermore, in Equation (8), is apparently positive with the quadratic term; this also suggests the positive correlation relationship between P2,t and V2,t.
Through the derivation procedure above, the strong positive correlation between load variance and power losses is shown; likewise, the strong positive correlation between power deviation and voltage deviation. For the traditional optimization process with a distribution network, the power flow calculation must be involved with a slow computation speed and week convergence degree. Hence, the tedious iterative work could be avoided, when load variance and power deviation minimizing, to simplify, are utilized for power losses and voltage deviation minimizing, respectively.
3. Model Formulation
In a distribution network with DER integration, BESS and EV are introduced for minimizing the bad side effect from DERs’ access. An optimization framework has been proposed for reducing renewable energy curtailment, cutting feeder losses, mitigating voltage fluctuation and lowering electricity expense, considering the constraints of BESS and EV operation. The charging and discharging power of BESS and the charging period of EV are recognized to be control variables, and the optimization would be realized under minimizing one or more objective functions while satisfying the several equality and inequality constraints. Its mathematical model can be established as,
where
f is the objective function to be optimized;
g and
h are the equality and inequality constraints, respectively;
x is the vector of charging or discharging power or the period selection variable. The detailed description of the objective functions, equality and inequality constraints are stated as follows.
3.1. Minimizing Renewable Energy Curtailment
It is widely accepted that, in power system operation, the power generated is always equal to the power demand in any moment. Assuming that there is no energy storage facility in the regional distribution network, the extra DERs’ power has to be injected back to the substation or curtailed, resulting in extra power losses and unfortunate waste of renewable energy, when the DERs’ generated power is in excess of the power demand. Therefore, the BESS is integrated into the regional distribution network with renewable energy integration for minimizing DER curtailment [
11], as Equation (10) shows,
where
is the DER power curtailment.
3.2. Minimizing Feeder Losses
Minimizing feeder losses is a crucial indicator for power system economic operation and also a key means for energy conversation [
6]. In this paper, reducing feeder losses is also proposed for BESS scheduling and EV coordinated charging. In terms of the theoretical derivation in
Section 2, the load variance minimization could be used to substitute feeder loss minimization.
where
Pload,t is the load power at time
t, and
Paverage means the average power for the assigned duration.
3.3. Minimizing Voltage Deviation
With DERs integrated into the distribution network, their intermittent and fluctuation characteristics have aggravated the power and voltage volatility in the distribution power system, serving as the immediate cause of power quality reduction and electric equipment damage. Thus, the objective function of minimizing voltage deviation is proposed to mitigate the fluctuation brought by the DERs’ integration, similarly to the last optimization target, which is formulated by the power deviation in Equation (12).
3.4. Minimizing Electricity Cost
Besides the power demand of the regular load, the charging cost of BESS and EV also contribute to electricity bills. On the contrary, the discharging power of BESS and the injected power of DERs facilitate reducing the utility expense. As a consequence, through the optimal scheduling of BESS associated with EV coordinated charging, the electricity cost could be reduced as Equation (13) shows,
where
is the overall electricity cost in the distribution network with duration
T, and
ct means the time of use (TOU) electricity price at time
t.
3.5. Constraints of BESS Operation
For the optimal scheduling strategy of BESS, the constraints of BESS are presented as the charging/discharging power limitation, the energy capacity restriction and the charging/discharging balance requirement.
The constraint of charging/discharging power of BESS refers to the upper/lower power limitation during the BESS charging/discharging process; this means that the charging/discharging process should be within the allowance boundaries, as Equation (14) shows,
where
Pstorage,t represents the charging/discharging power of BESS at time
t, and −
Pmax and
Pmax signify the upper and lower boundaries of BESS power, respectively.
The constraint of the energy capacity of BESS stands for the upper/lower energy limitation during BESS operation, to guarantee the capability for emergency incidents. In this work, the energy boundaries of BESS are from 10% to 90% of the energy capacity.
In Equations (15) and (16), and are the state of energy at time t and the designed energy capacity for BESS, respectively. Moreover, indicates the initial energy state of BESS.
The constraint of the charging/discharging balance of BESS means that the charging energy is supposed to be equal to the discharging energy during a certain period.
In Equation (17), , denote the charging region and, similarly, , the discharging region. Besides, , represent the charging and discharging power, respectively. Additionally, ε stands for the permissible error of the charging/discharging balance.
It is to note that, since the BESS optimal scheduling strategy would be used in the duration of 24 h, the degradation of batteries is not considered in this paper. For long time operation, the boundaries of power and energy limitation should be reset for specified condition.
3.6. Constraints of EVs’ Operation
As an auxiliary technique, the coordinated charging strategy of EVs has been used to assist the BESS scheduling, and the constraints of EVs are presented as the constraints of the charging period and the charging pattern.
The constraint of the EV charging period refers to that the charging period selection, which should meet the transport demands of EV users. In this paper, this means the start charging moment should be restricted as Equation (18) shows,
In Equations (18) and (19), Tarrive,i, Tstart,i and Tleave,i are the arriving, start charging and leaving moment for EVi, and Tc,i represents the charging duration for EVi. Furthermore, the expression of Tc,i in Equation (19) has been given, where SOCarrive,i means the state of charge (SOC) condition of EVi when arriving at the charging spot, and Tfull stands for the full charging duration for the assigned EV model.
The constraint of the charging pattern means the constant-current constant-voltage (CC-CV) mode for individual EV charging [
12,
13,
14].
3.7. Other Constraints
In this paper, the constraints of the balance between power demand and supply and the voltage upper/lower limits are also considered in the optimization procedure.
Besides, the reverse-flow control is also introduced as Equation (20) illustrates, to eliminate the unnecessary power losses.
where
PDG,t means the sum of the DERs’ generation at time
t.
4. Solution Technique
To tackle the optimization model proposed in
Section 3, day-ahead and real-time scheduling strategies have been presented, respectively. The day-ahead strategy tends to settle the optimization problem one day ahead, which means obtaining the next day BESS operation profile globally and precisely. Alternatively, the real-time scheduling strategy is to solve it with interval updating, to avoid the related effect of regular load and DER forecasting errors.
Both of the strategies are suitable for BESS scheduling and EVs’ coordinated charging.
In terms of the positive performance of the optimization solution in [
15], both of the multi-objective optimization problems derived from the two strategies above could be tackled by fuzzification multi-objective optimization and an improved particle swarm optimization (IPSO) algorithm. More specifically, the detailed description is illustrated as follows.
4.1. Day-Ahead Strategy
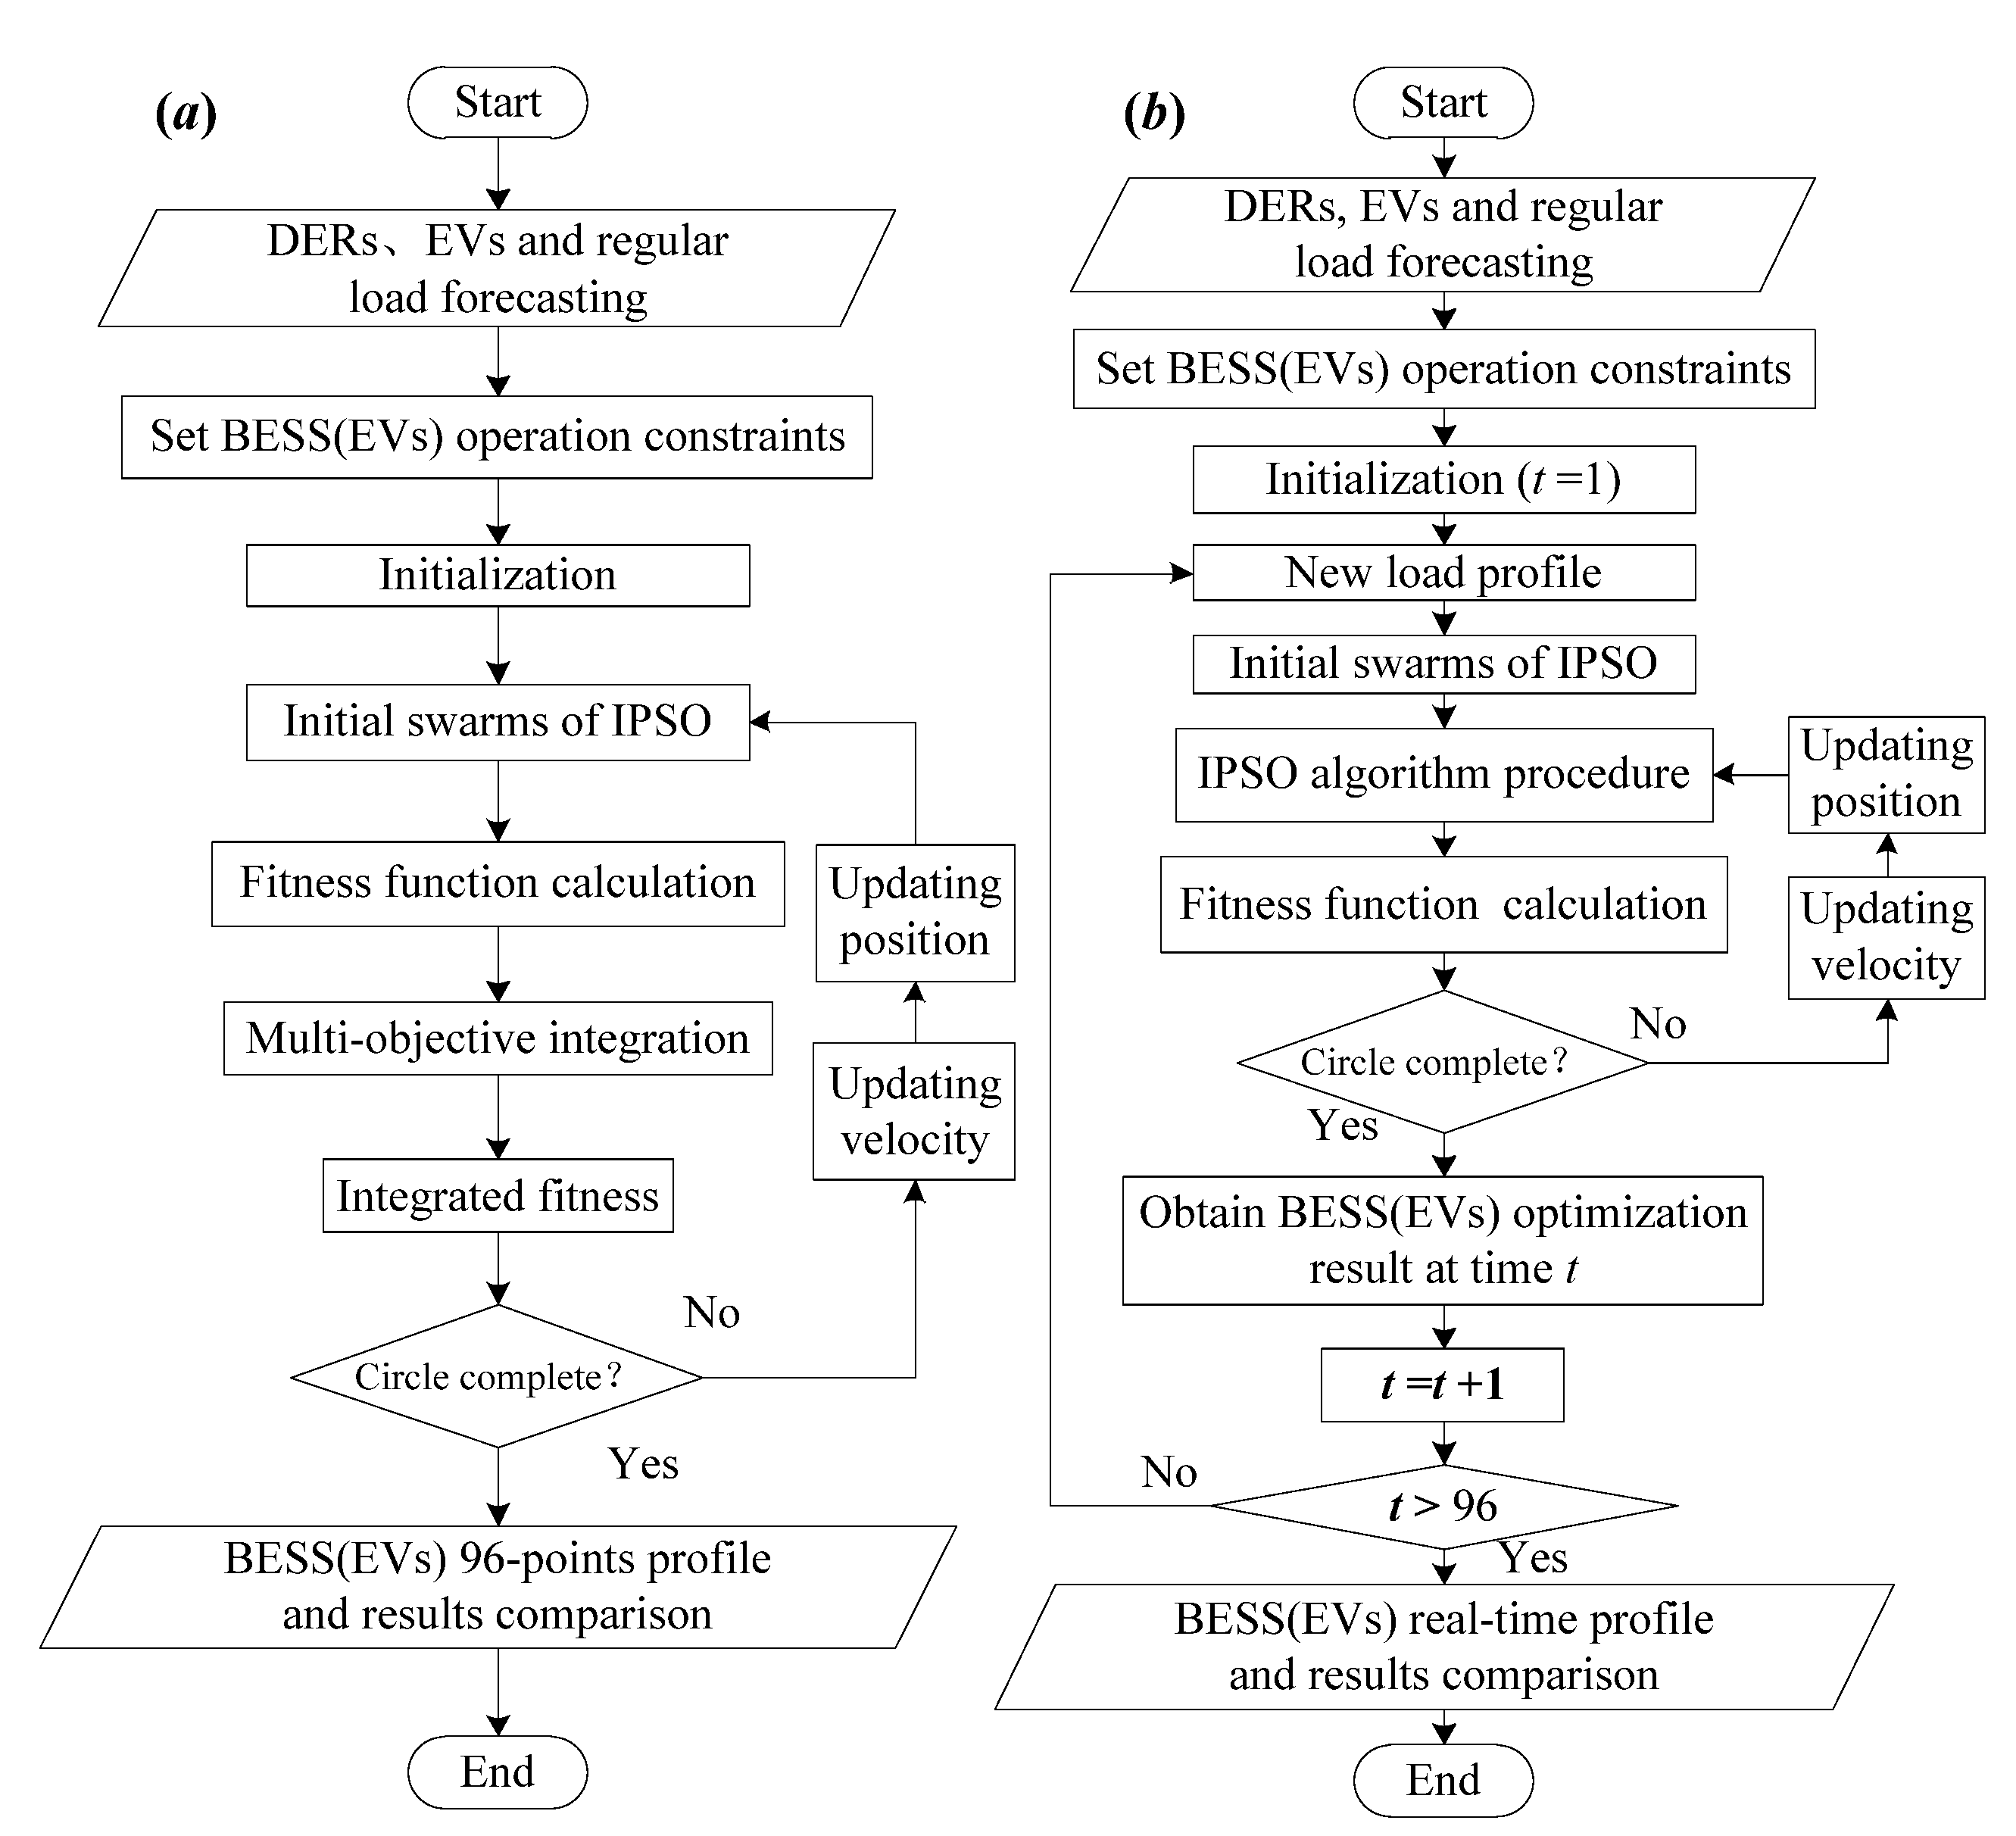
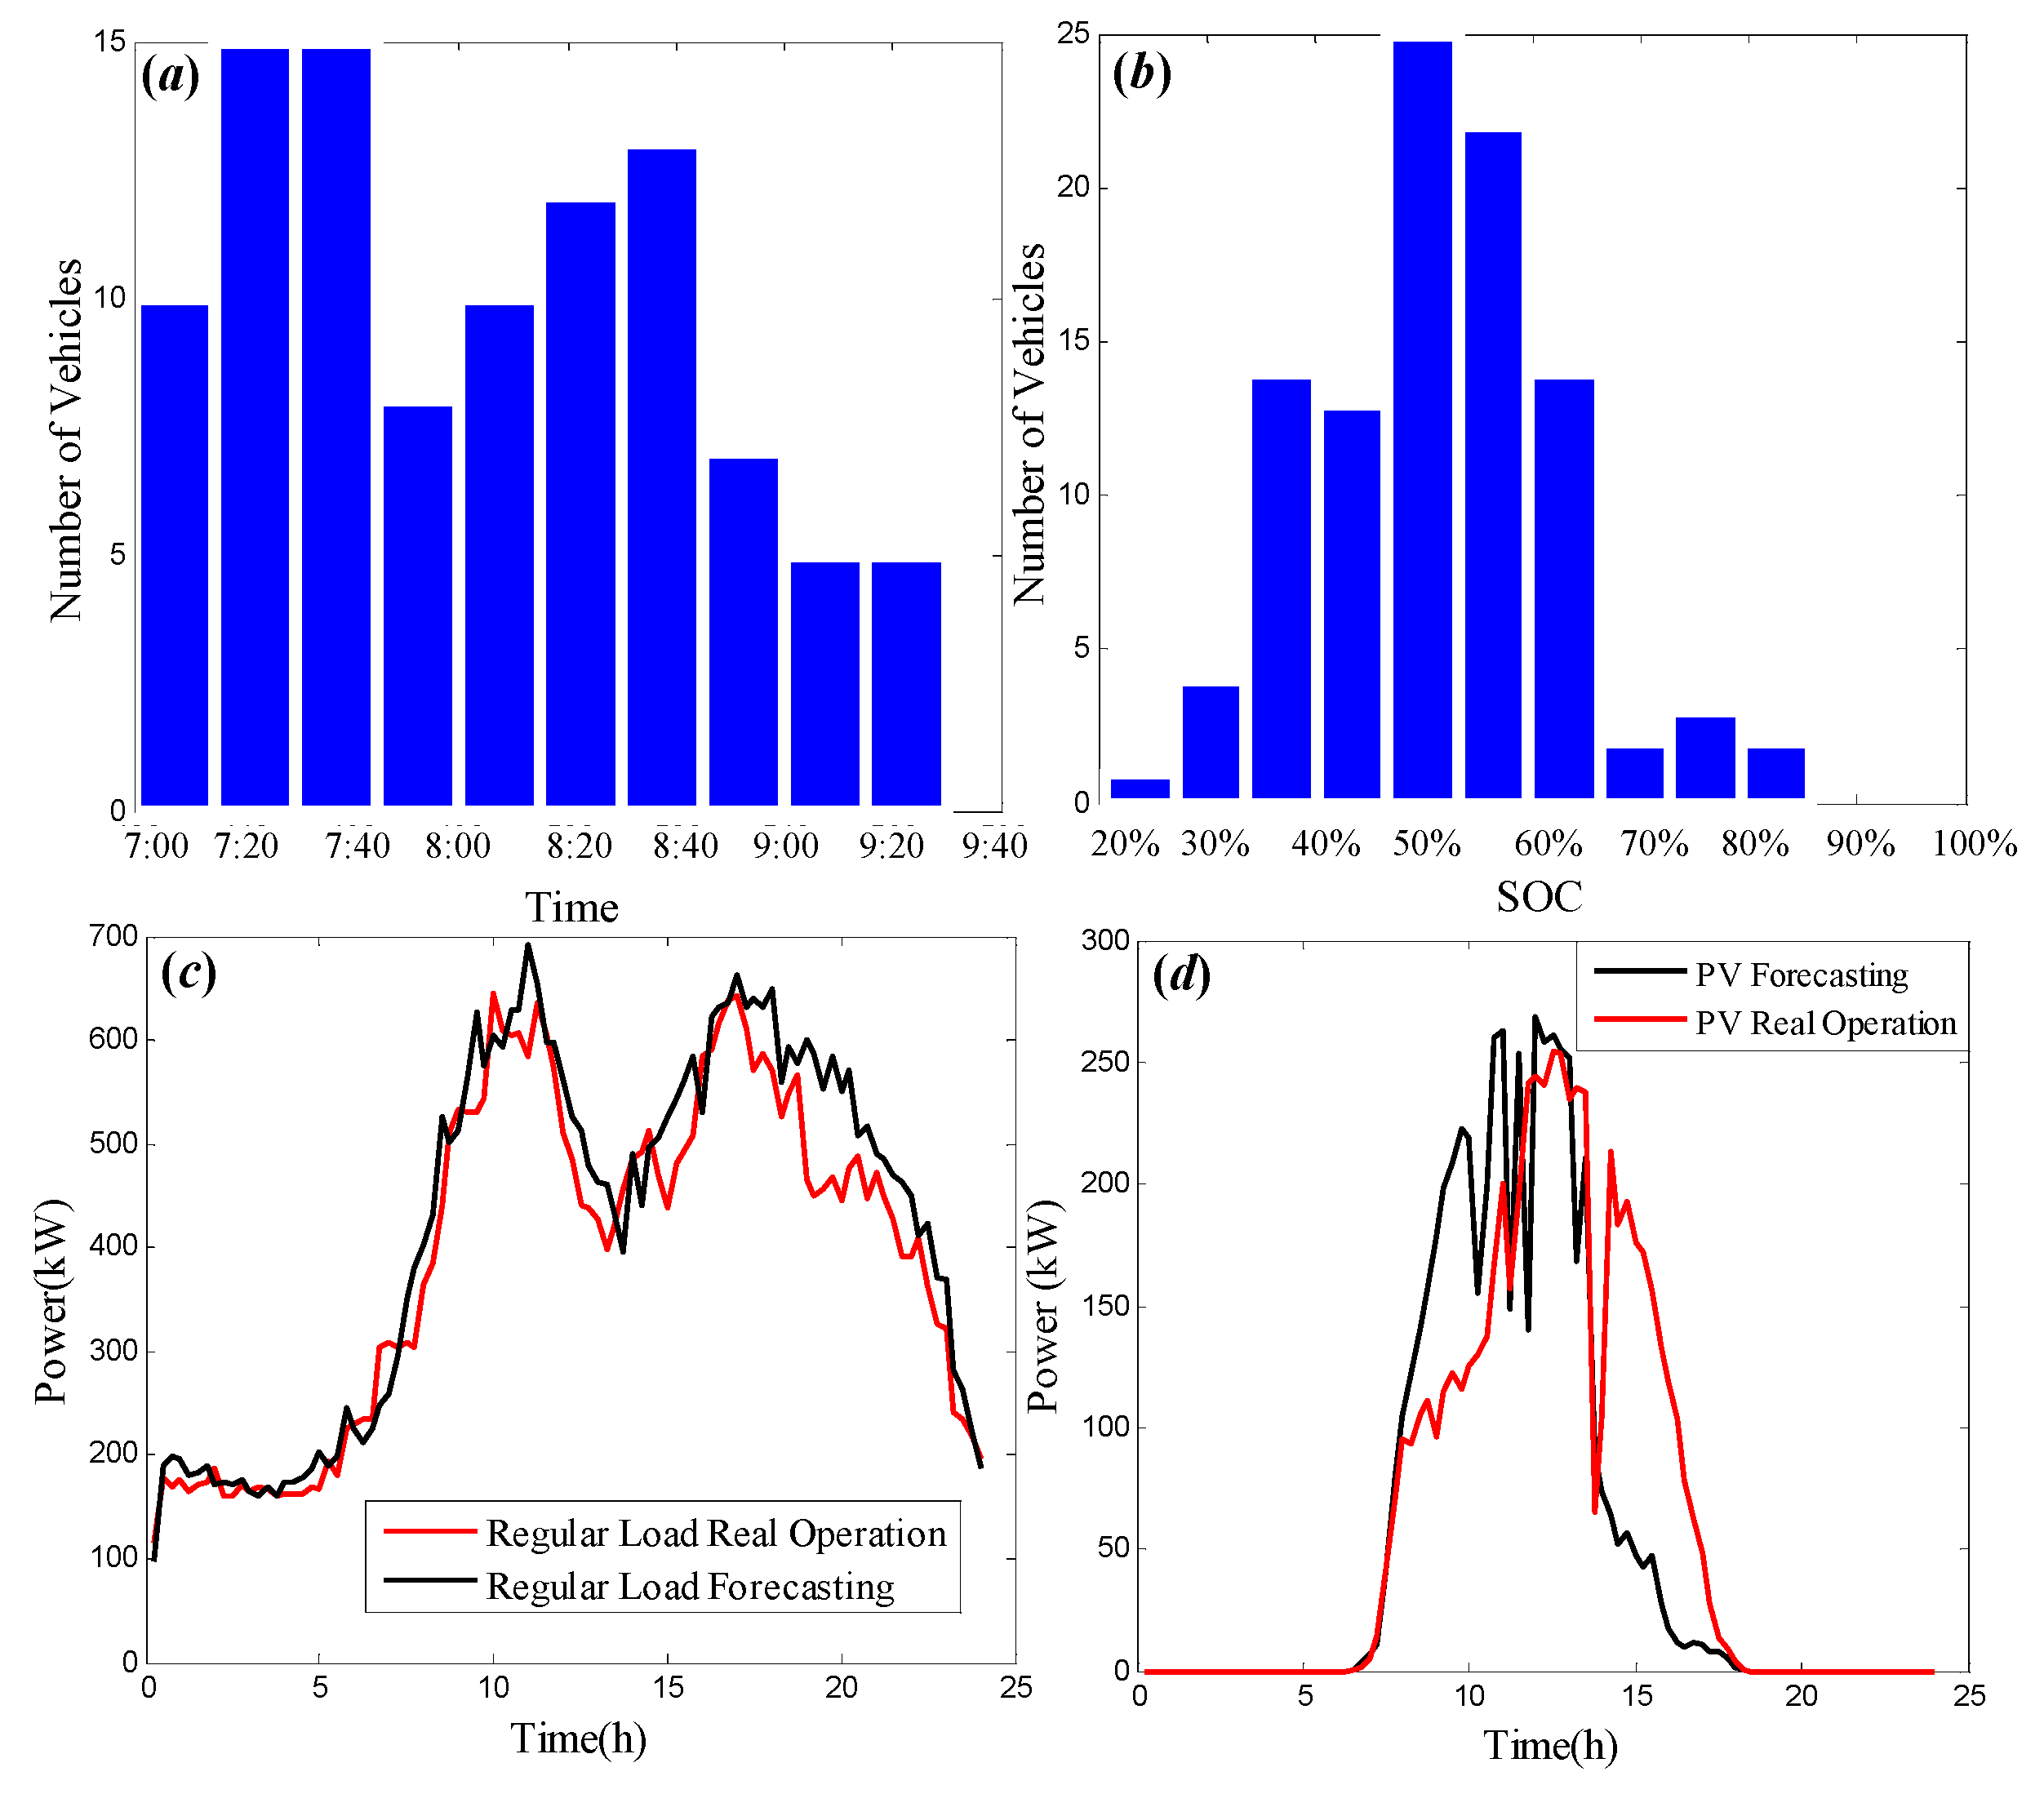
For the day-ahead strategy, DERs, EVs and regular load forecasting should be predicted before this procedure. The BESS scheduling profile of the next day with certain precise time, 15 min in this work, could be optimized, incorporated with minimizing the DERs’ curtailment, load variance, load deviation and electricity cost, to be the objective. The detailed procedure flow is demonstrated below and in
Figure 2a.
- Step 1:
According to the forecasting results of the regular load, DERs and EVs, the corresponding 96-point profiles could be set for subsequent optimizing with a 15-min interval.
- Step 2:
In the day-ahead strategy, the variables for BESS optimizing were Pstorage = [P1, P2, …, P96], and the variables for EVs’ coordinated charging were Tstart = [T1, T2, …, T96]. For better performance, the initial BESS variables would be set as a zero vector, and the initial EVs’ variables would be set as the forecasting vector.
- Step 3:
The multi-optimization procedure and intelligent algorithm were implemented as in
Section 4.3 and
Section 4.4.
Figure 2.
(a) Day-ahead strategy flow chart; (b) real-time strategy flow chart.
Figure 2.
(a) Day-ahead strategy flow chart; (b) real-time strategy flow chart.
4.2. Real-Time Strategy
In this section, a real-time strategy was proposed to solve the optimization problem, as well as to handle the dependency for forecasting errors. Both the forecasting data and real time capture data have been combined for optimizing globally and meeting the requirements of BESS or EVs’ operation.
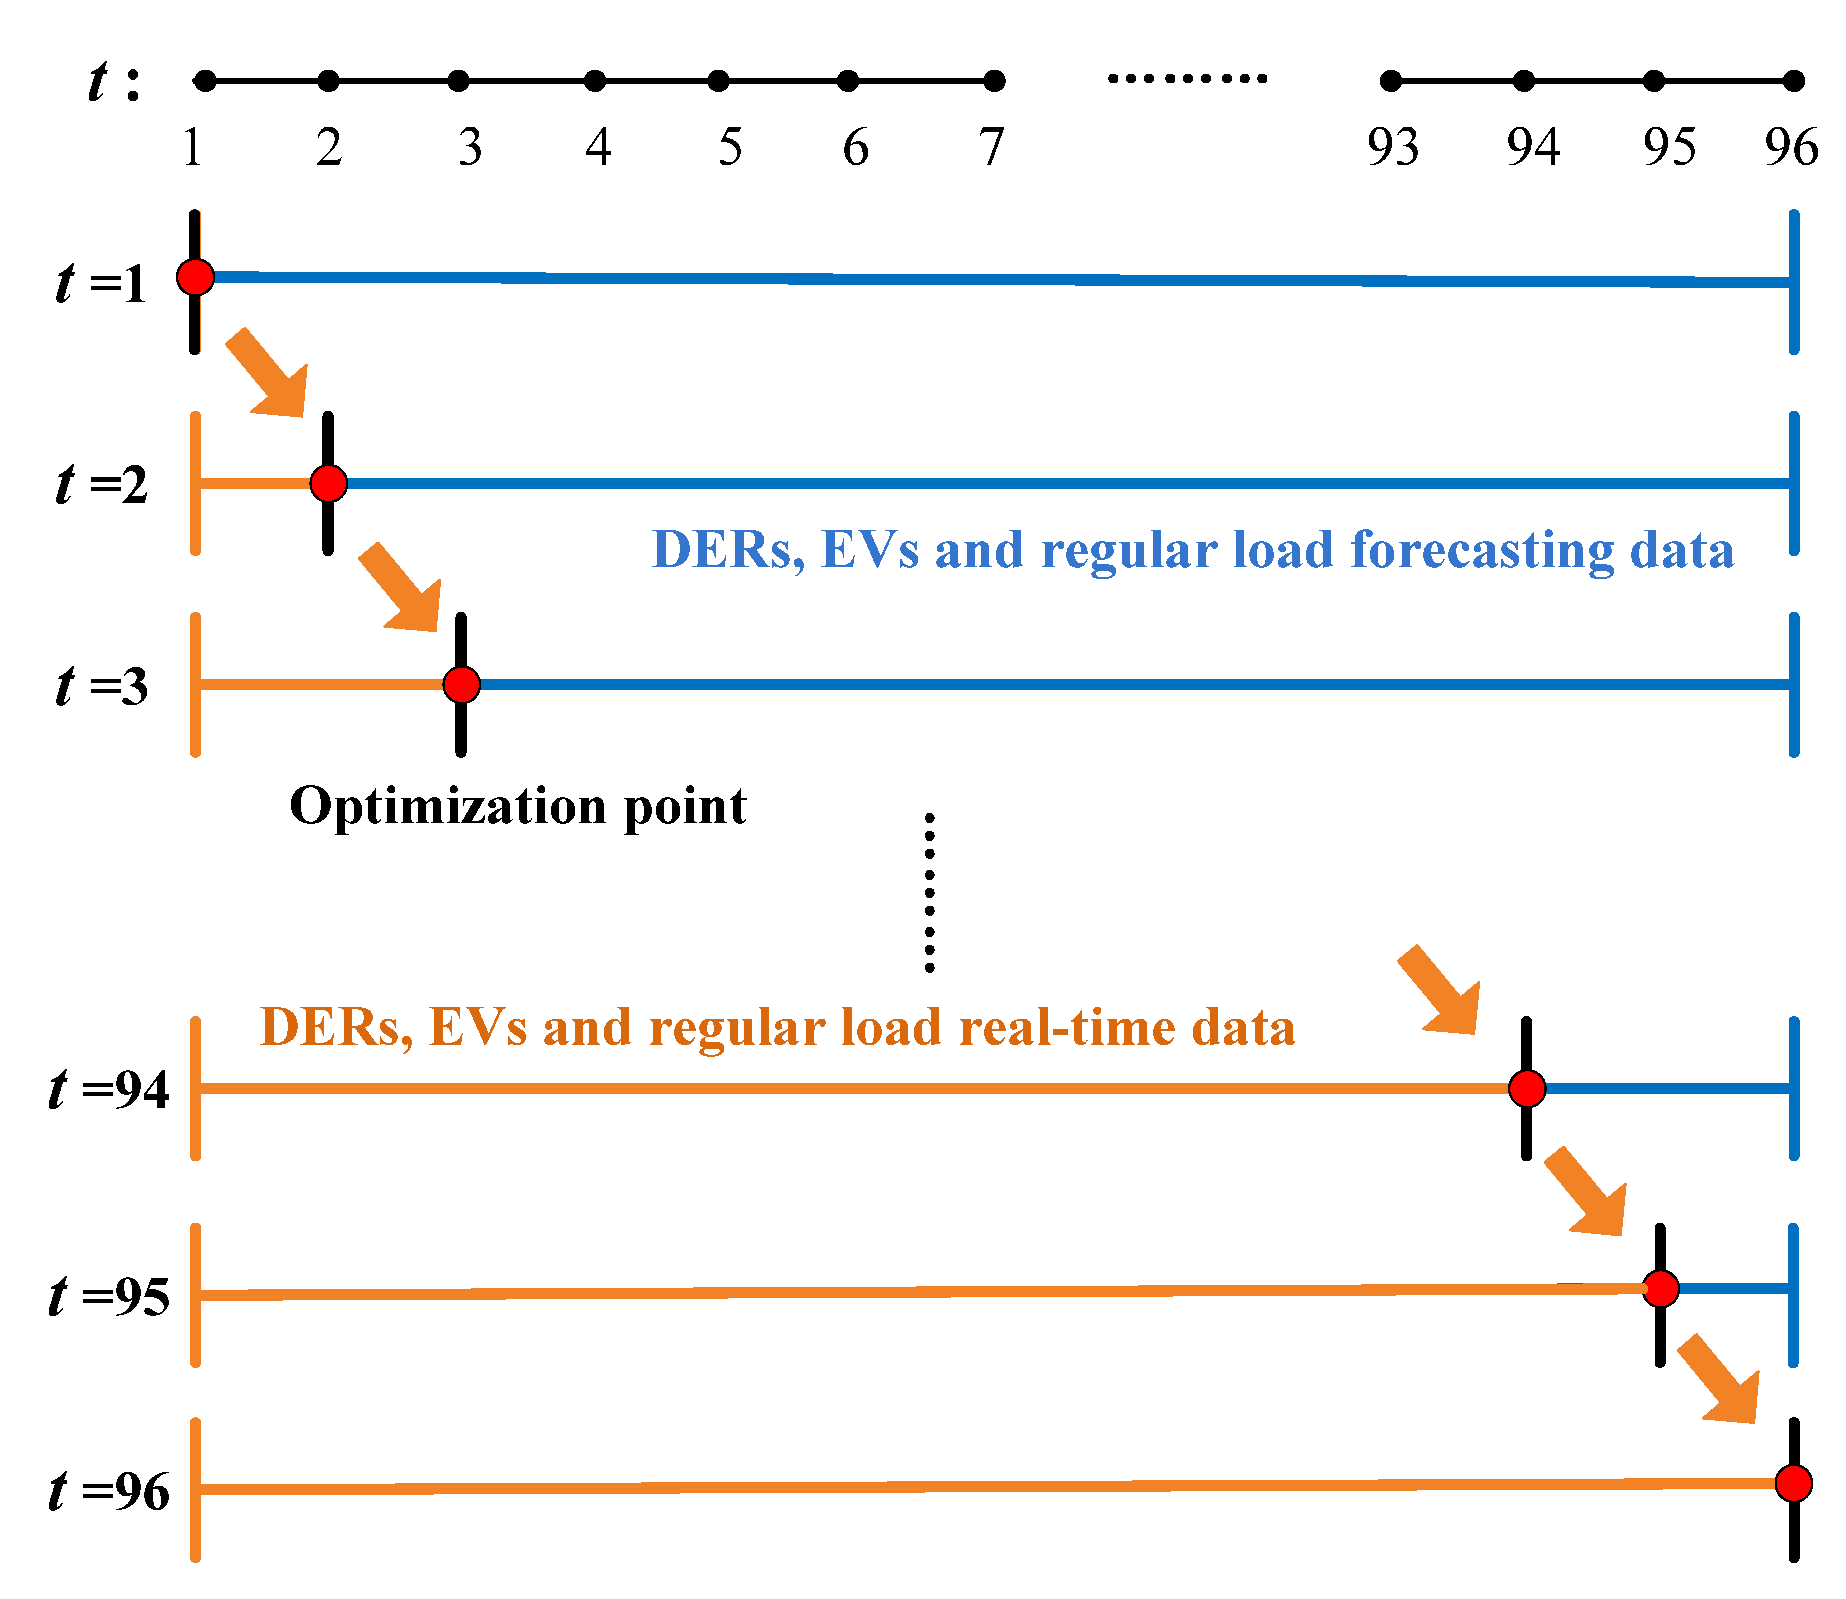
The real-time optimizing framework is illustrated in
Figure 3. In every 15 min, the optimization procedure was performed once to get the optimal operation value for the current point. Additionally, the real-time data have been used for the duration from the beginning to the current point, as the orange lines show in
Figure 3, and the forecasting data have been used for the duration from the current point to the end of the day, as the blue lines show in
Figure 3. Besides being comparable to the day-ahead strategy, another reason to have optimization in a one-day scale is to ensure the charging and discharging balance for BESS operation. Then, the detailed procedure is shown below and in
Figure 2b.
- Step 1:
According to the forecasting results of the regular load, DERs and EVs, the corresponding 96-point profiles could be prepared for subsequent optimizing with a 15-min interval.
- Step 2:
The initialization: At time t = 1 (t =1, 2, …, 96), the real-time data of the DERs, EVs and regular load at current time t = 1 replaced the forecasting data at time t = 1, and the new load profile would be used for optimization. Afterwards, the BESS or EVs’ 96-point operation results could be obtained. Only the optimal value at time t = 1 was picked to be the operation value for time t = 1.
- Step 3:
Go to the next moment t = t + 1;
- Step 4:
To make the load profile at time t, the real-time data from the beginning to time t have been used to replace the corresponding period of forecasting data. At the same time, the variables for BESS are Pstorage = [Pt, Pt+1, …, P96], 96-t + 1variables in all, and similarly, the variables for EVs are Tstart = [Tt, Tt+1, …, T96].
- Step 5:
Pt and Tt to obtain the optimal results for the current time t through the following optimization techniques.
- Step 6:
Go back to Step 3, until completing the circle of 96 points.
Figure 3.
Framework of real-time optimizing.
Figure 3.
Framework of real-time optimizing.
4.3. Fuzzy Multi-Objective Optimization
In this paper, the optimization problem is actually a multi-objective optimization problem. The fuzzy mathematics method, with the membership function, has been utilized to perform the objective function fuzzification to transfer the multi-objective optimization to a single-objective issue [
15,
16].
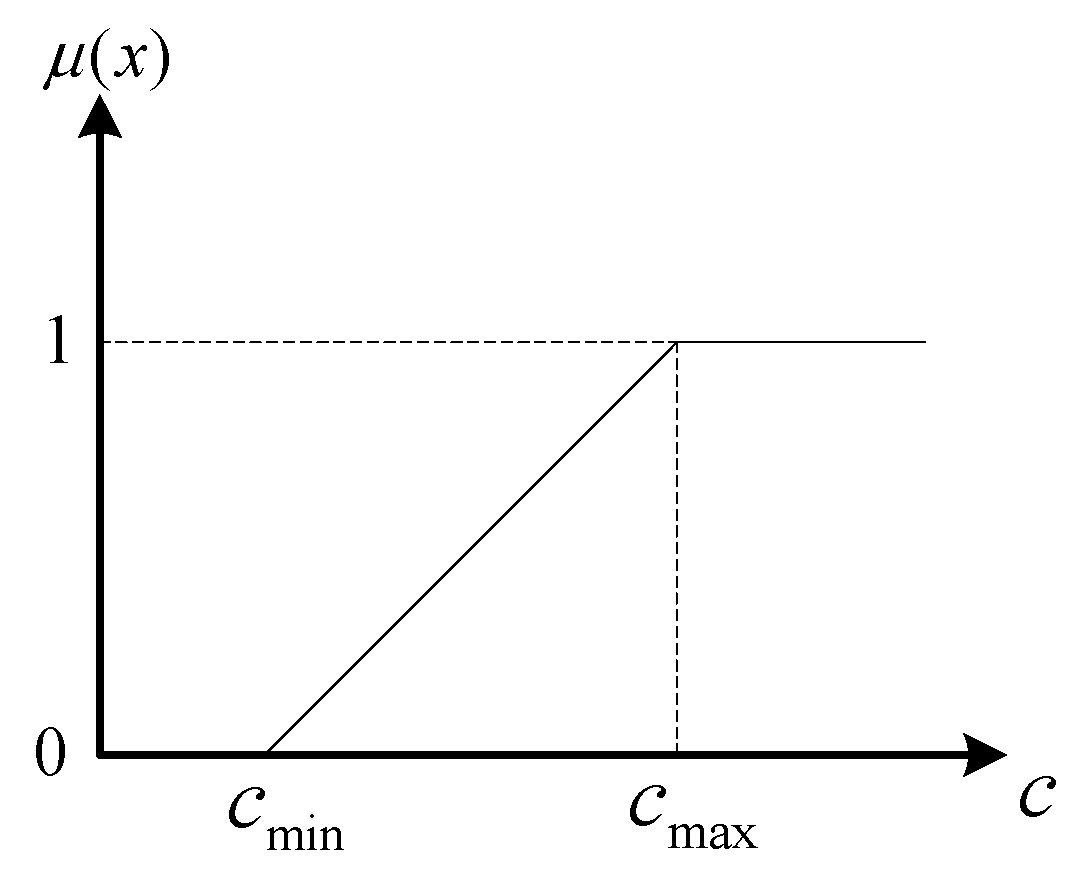
For objectively considering the weight of each optimization objective, the linear membership function is used, which can be described as:
where
is the
i-th objective function of the fuzzy multi-objective problem;
is the membership function of
;
m is the number of objective functions;
,
are the upper and lower limit values of
, respectively;
is the optimal value obtained by the single-objective function; and
is initial value of each objective function. Besides, the curves of the membership function by Equation (21) are shown in
Figure 4.
Figure 4.
Membership function of the sub-objective.
Figure 4.
Membership function of the sub-objective.
After the fuzzification, the sub-objectives also need to be integrated. In this work, minimizing the maximum of sub-objectives has been applied as shown in Equation (22),
where
fitness means the integrated fitness for multi-objective optimization.
4.4. IPSO Algorithm
The optimization model proposed above is considered as a complex multi-constraint, nonlinear optimization problem. Compared to classical algorithms, such as linear programming, quadratic programming, the gradient descending method and other numerical algorithms, the heuristic algorithms are novel algorithms for solving the optimization problem and much easier to implement and extend, such as the genetic algorithms (GA), particle swarm optimization (PSO), differential evolution (DE), artificial immune algorithm and artificial bee colony (ABC) algorithm.
The PSO algorithm possesses superior performance in its implementation and a good trade-off between exploration and exploitation ability, with a simple structure, a simple parameter setting and a fast convergence speed. It has been widely applied in function optimization, mathematical modelling, system control and some other areas [
17,
18,
19].
In basic PSO algorithms,
,
c1 and
c2 are fixed values. For the search accuracy and search speed, in this paper, the improved inertia weight is shown in Equation (25). The algorithm may adjust
dynamically via Equation (25), so that it can optimize dynamically by taking both global search and local search into account during changing The improved PSO is shown as follows:
where
and
represent the initial value and the final value of ω, respectively;
K is the maximum number of evolutionary generations;
k is the current number of evolutionary generations.
6. Conclusions
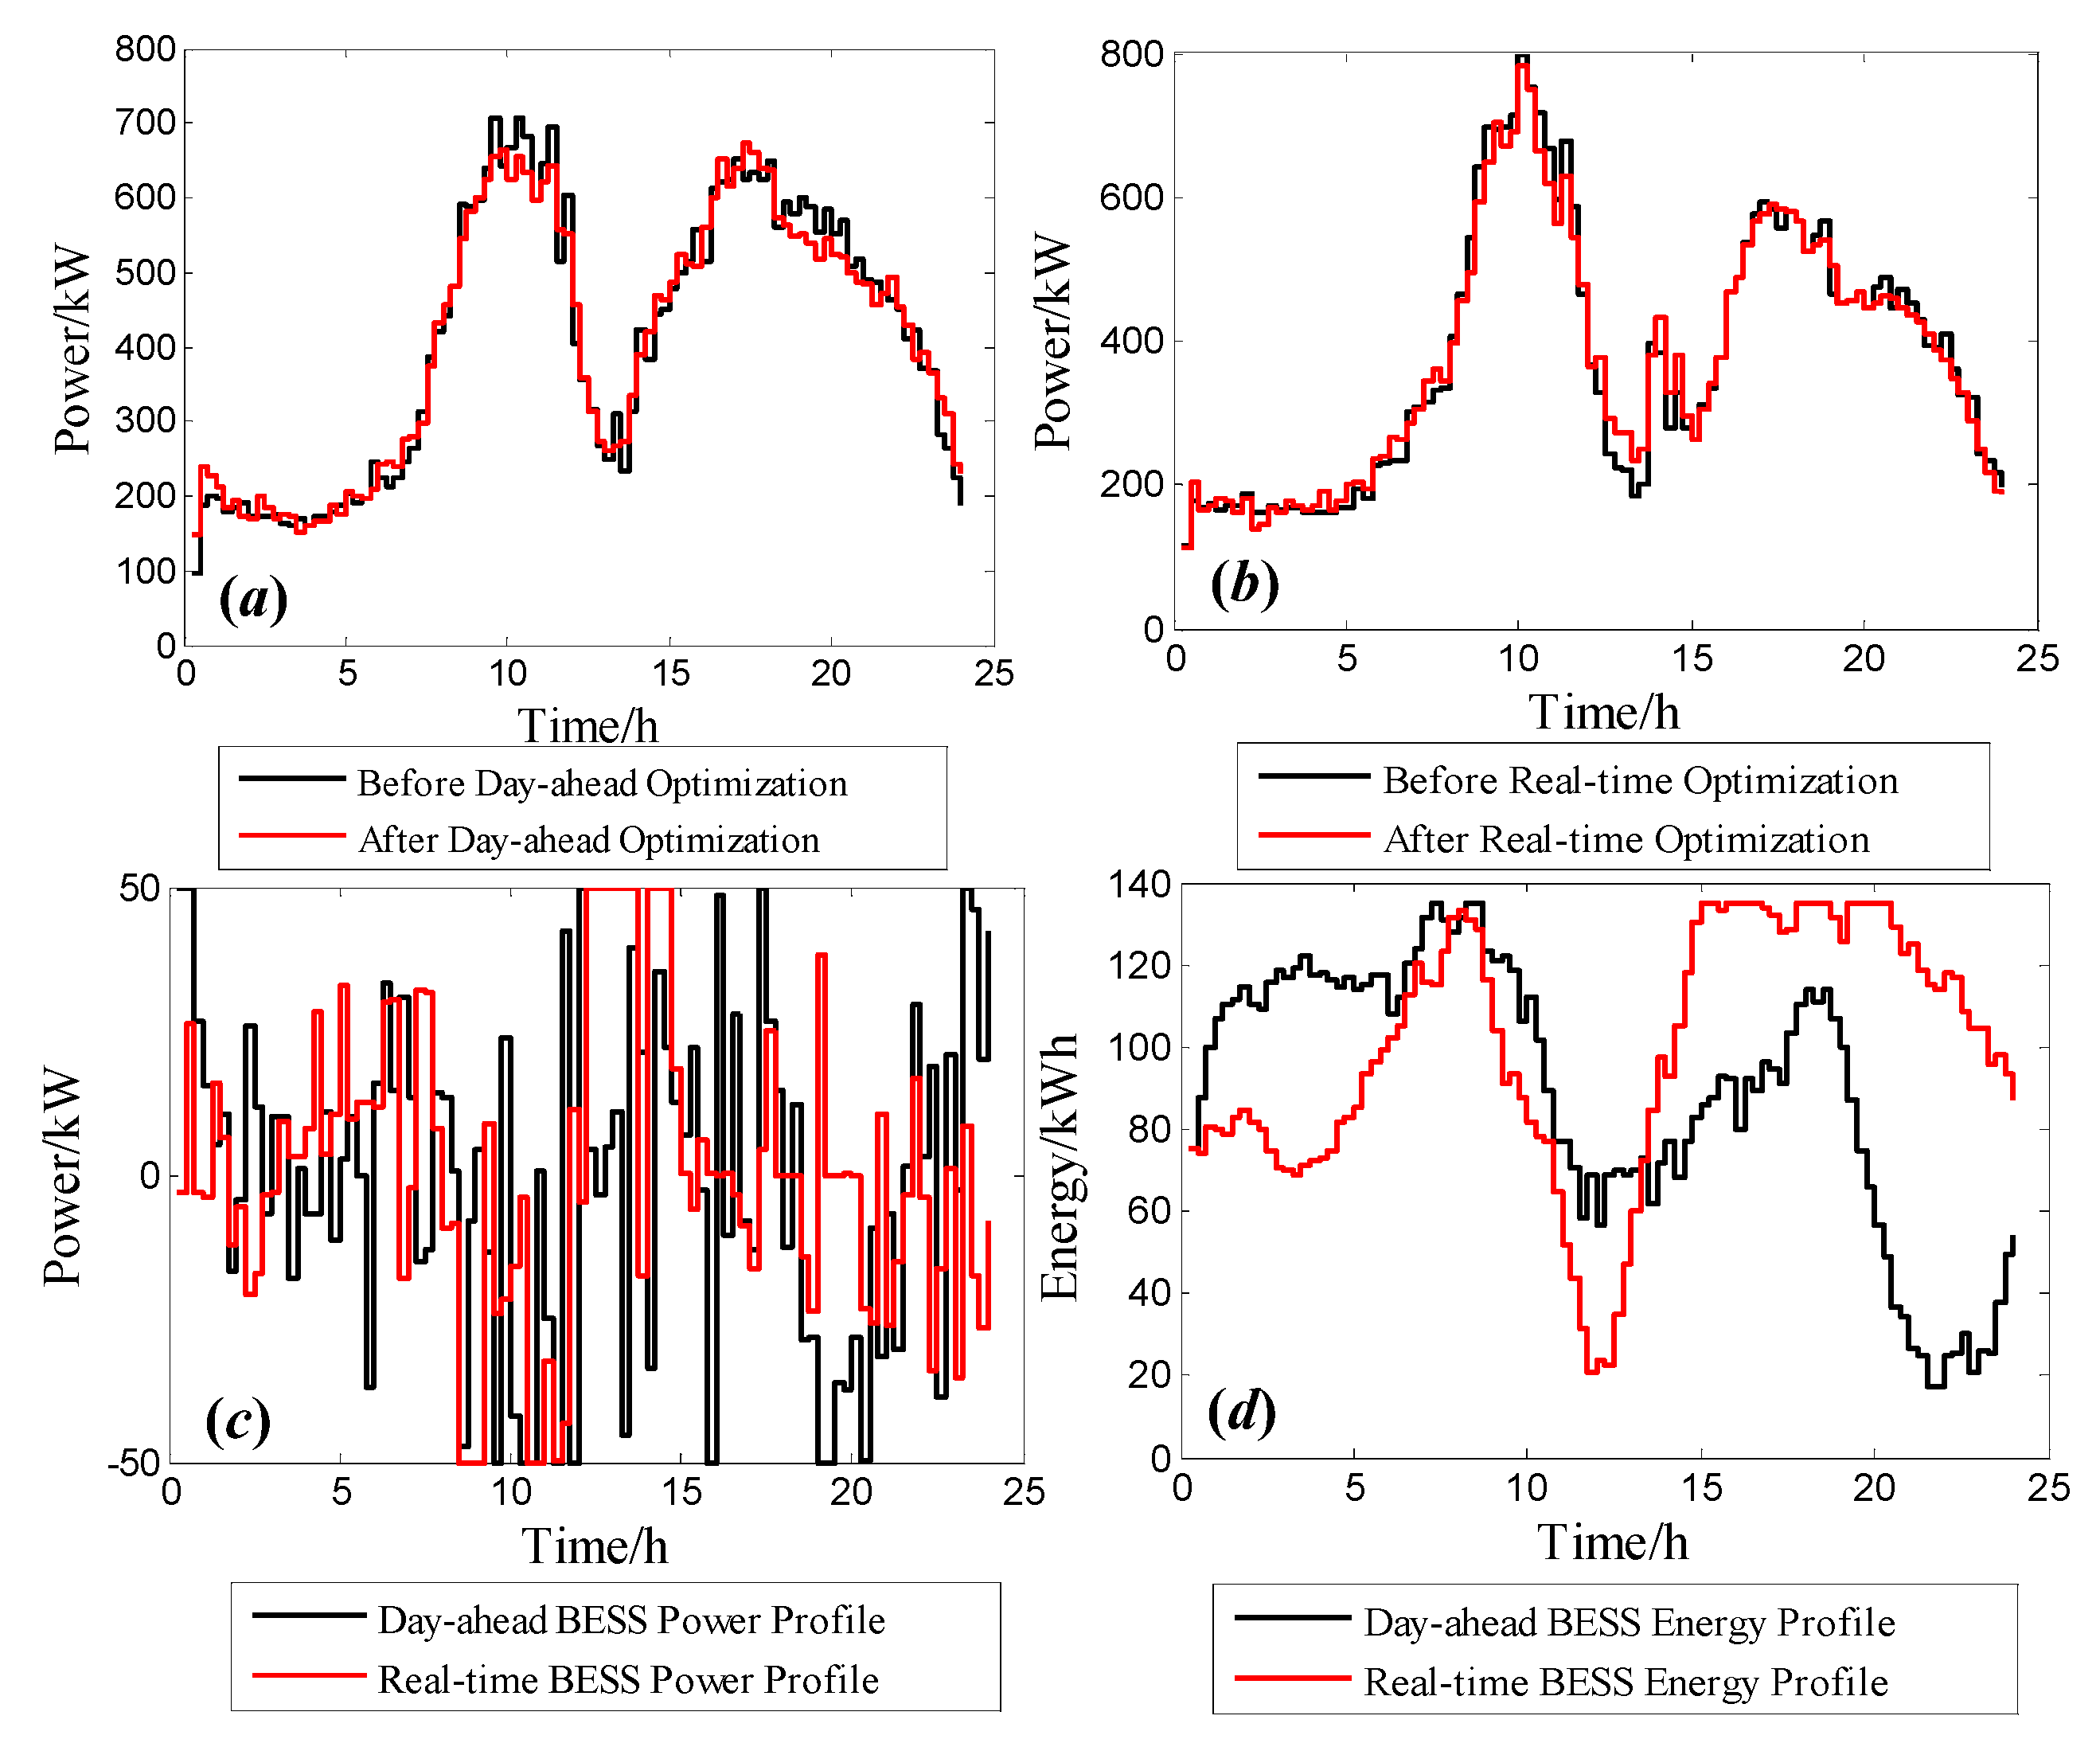
In this paper, the scheduling framework for BESS operation with EVs’ auxiliary in a distribution network with renewable energy integration has been proposed, to reduce the renewable energy curtailment, decrease the power losses, mitigate voltage deviation and lower the electricity expense. Moreover, the model also takes into account the BESS operation constraints and EVs’ charging limitation. To tackle the scheduling problem, two optimization processes are presented, the day-ahead strategy and the real-time strategy, to be incorporated into the framework, separately. To handle the multi-objective formulation, a fuzzy mathematical method has been launched to turn multi-objective optimization into a single-objective issue; from another aspect, the IPSO algorithm has been implemented to obtain the optimal scheduling results.
Through the simulation results of six cases, it could be concluded that the proposed BESS scheduling and EVs’ coordinated charging scheme are effective for the assigned distribution network, and both theday-ahead and real-time strategy procedures show significant performances. Additionally, from our perspective, the mode of the real-time strategy for BESS scheduling with EVs’ auxiliary is recommended for the cases with confined load forecasting accuracy, as well as with EVs’ access.


