Study of the Vertical Distribution of Air Temperature in Warehouses


Abstract
: Warehouses are usually large, plain industrial buildings commonly used for storage of goods. Vertical distribution of air temperature is an important aspect for indoor environment design, which must be taken into account by architects and engineers in the early stages of warehouse design. The aim of this work is to analyze the vertical temperature gradients existing in warehouses, quantifying their value and analyzing their evolution along the year. To do so, the study outlines the monitoring of several warehouses with different building typology and height located in different areas of Spain for a complete annual cycle. The results obtained when applying a simple linear regression analysis to 175,200 vertical temperature profiles show that there is a strong influence of the outdoor temperature over the stratification of the indoor air. During warm months, the ceiling and the upper strata get warmer, whereas the cold air accumulates in the lower levels, increasing the stratification of indoor air (maximum values between 0.3 °C/m and 0.7 °C/m). During cold months, the ceiling gets cold due to its contact with the outdoor air, therefore, the colder, heavier air moves down to the lower strata, registering insignificant vertical temperature differences. Air conditioning of the warehouse, besides controlling the temperature, limits the influence of the outdoor environment on the stratification of temperatures. The results of the study may be of great use for warehouses for products sensitive to temperature, which may suffer a different evolution, conservation or maturation when the temperature differences are maintained for a long time.1. Introduction
The industrial sector consumed 52% of global delivered energy in 2008, and its energy consumption grows by an average of 1.5% per year over the projection [1]. The air conditioning of warehouses and cold-storage chambers are an important part of this type of consumption in these industries. In sectors like the agricultural industry, it is necessary to carry out a rigorous control of the air temperature in warehouses, due to the sensitivity of the stored products. Temperature and relative humidity (r.h.) are the most important environmental factors affecting the sensory quality of fresh produce [2]. Inadequate storage conditions may provoke undesired physicochemical changes and loss of quality in the stored products [3–5]. In addition, certain humidity and temperature conditions may favor the presence of insect pests [6,7] which deteriorate or spoil the product. On the other hand, poor indoor environments in industries also lead to substantial costs for health care, administration and lost productivity [8]. Therefore, more research should be directed to these issues in order to innovate new practices and strategies to achieve indoor environments desired in industrial buildings.
Nowadays, there are many studies focusing their effort on the study and control of the indoor temperature of warehouses. The strategies include different systems, like the use of stored products as thermal mass to shift refrigeration loads to more favorable operational periods [9], the use of constructive solutions with passive air conditioning based on materials of great thermal inertia [10–12], the elaboration of an on-site measurement procedure to assess indoor environment quality [13], etc. Previous studies in aboveground warehouses [14] point out that the use of passive constructive solutions may imply the existence of significant vertical differences of temperature. The phenomenon of warm air rising and cold air falling is described as air stratification [15], which is responsible for the vertical variations of air temperature. A difference of temperature between different heights of the warehouse, sustained for several weeks or months, could make the product evolve in a different way or partly deteriorate.
On the other hand, previous studies carried out by numerical simulation [16] point out that a better uniformity of temperature in a refrigerated space could be achieved through the correct design and location of cooling units. Thermal stratification of air is an important aspect for indoor environment design, which must be taken into account by architects and engineers in the early stages of warehouse design.
In view of the little information about the stratification of air in warehouses, this study provides a general overview of the annual evolution of stratification in different types of warehouses. To do so, the study monitors and analyzes the vertical gradients of indoor temperature existing in four warehouses with passive air conditioning, as well as in a warehouse with air conditioning equipment, for a period of one year.
2. Materials and Methods
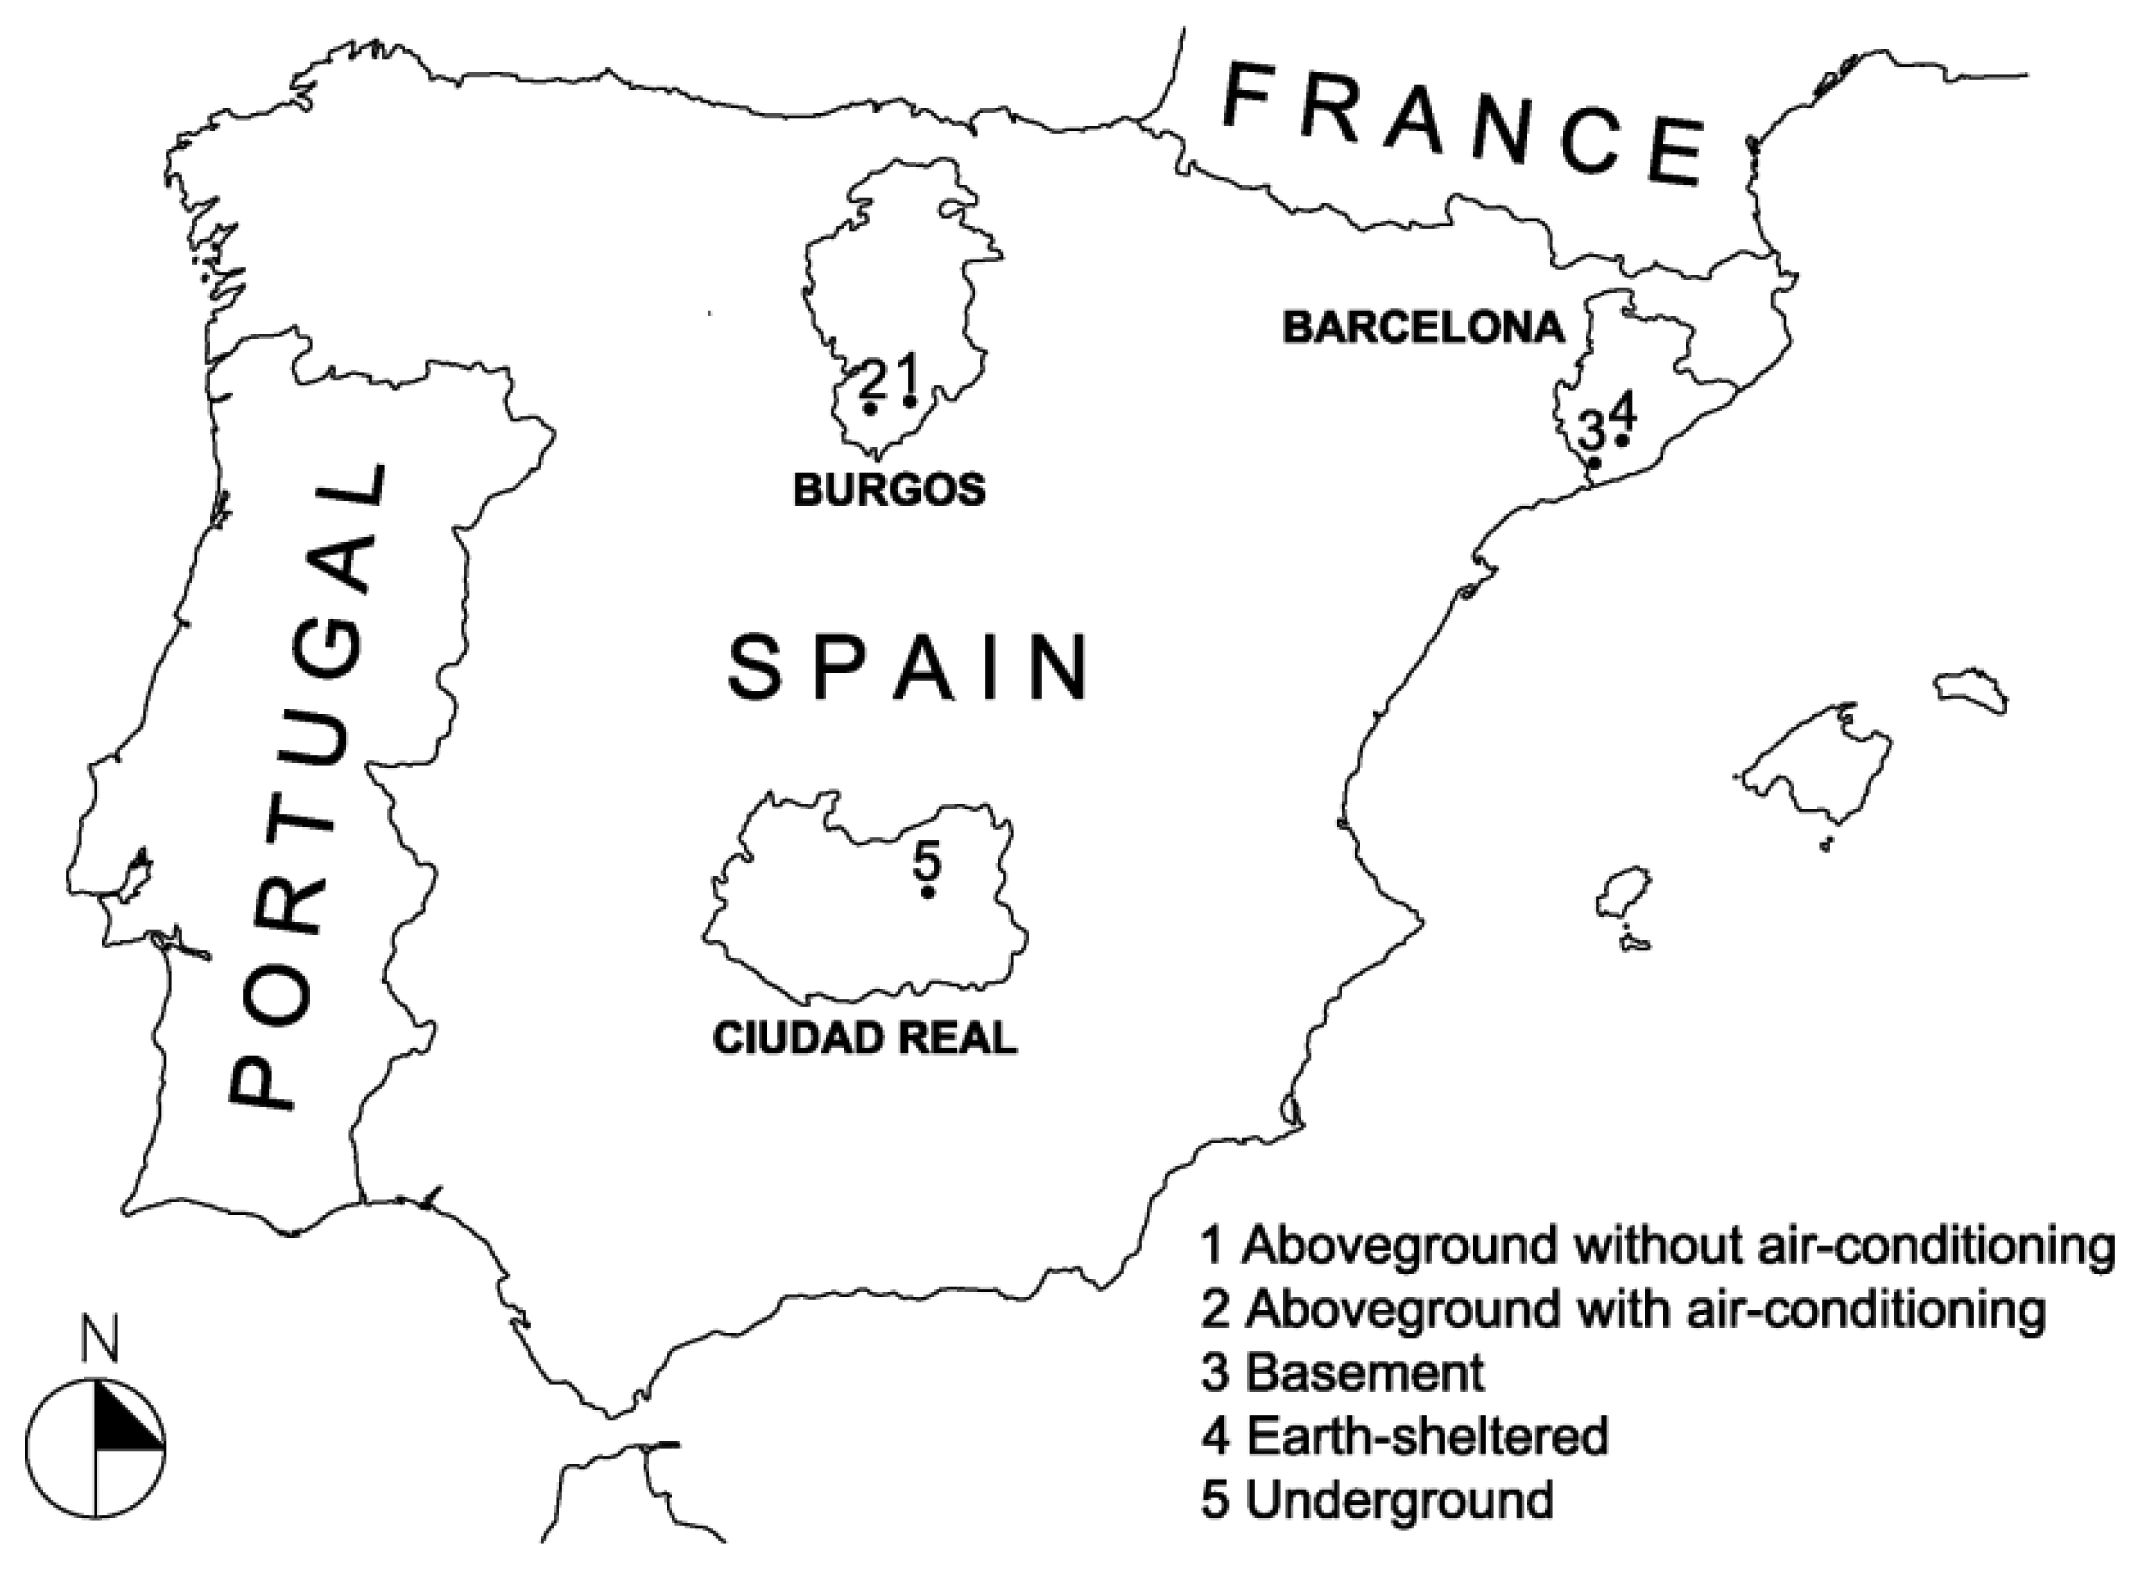
The aim of the present study is to determine the vertical temperature differences existing in warehouses, measuring their values and analyzing their evolution during the year. To do so, the study outlines the monitoring of several real warehouses with different building typology and height, located in different areas of Spain (Figure 1), for a complete annual cycle. The data obtained through the monitoring were statistically processed in order to characterize the stratification of the temperatures and the influence of the outdoor temperature.
2.1. Selected Warehouses
Spain is geographically situated in the medium latitudes of the warm area of the Northern hemisphere, without widely different climatic characteristics. The annual average temperatures in the studied regions were 15.1 °C in Barcelona, 12.4 °C in Burgos and 15.4 °C in Ciudad Real. The chosen warehouses use building strategies commonly used in the industrial sector. With that, the study tries to carry out a global approach, including a wide range of particular cases, for a long period of time.
Therefore, a typical warehouse without air-conditioning system and with an aboveground building over elevation zero; a warehouse in a basement; a warehouse buried at elevation zero but covered with earth for passive indoor temperature control and an underground warehouse excavated under the ground, were selected for the research.
Moreover, an air conditioned warehouse with an aboveground building has been also selected to analyze the effect of air conditioning. All of these warehouses have been operating during the monitoring period, being used for the storage and conservation of wine. In them, the wine is stored in wood barrels piled up at different heights. Next, the main characteristics of the selected warehouses (Figure 2) are described:
“Aboveground without air-conditioning” warehouse
The warehouse is on flat ground and separated from other facilities. The warehouse is oriented south-west, with shadows from a building positioned in parallel a few meters away, falling on the north-east side. The dimensions of the warehouse are 20 m wide and 60 m long. It is a building made of prefabricated-concrete walls with built-in insulation on which the structure of pillars and metallic arcs relies. The roof drains off in several directions. The roof consists of a metallic sandwich and its height varied between 7 m and 10 m. The indoor air renewal in the warehouse happens through the doors by natural ventilation.
“Aboveground with air-conditioning” warehouse
The building is on flat ground. The building is made of four independent units separated by two central corridors in a cross shape. The studied warehouse is located in the north-west unit. Its rectangular dimensions are 38 m long, 26 m wide and a free height of 8 m, and the longest aisle runs east-west. The structure is made of pillars and beams of reinforced concrete. The flat cover is made of ribbed metallic panels on concrete beams. The indoor conditions of temperature and relative humidity of the warehouse are controlled by an air conditioning system (fan-coil + humidifiers). It works during the warmer months to counter the high temperatures although some years it also works during the winter months to raise the temperature. The indoor temperature is kept around 16 °C during the whole year, and the relative humidity is kept at 75%–80%.
Basement warehouse
It is a building with several floors, two basement levels (Levels 1 and 2) used as warehouses and two other higher levels with industrial machinery and offices. The access to the warehouse goes through stairs or elevator from the upper levels. The study focuses on the warehouse located on Floor 1. The basement floor is at 3 m below ground and all four walls are thus in contact with the surrounding earth. The warehouse has a structure of reinforced concrete made of beams supported by square pillars (0.45 m2) with metallic reinforcements on the corners and a slab of light concrete blocks supporting the joists. The rectangular dimensions of the warehouse are 20 m wide, 30 m long and a free height of 4 m. There are no air conditioning facilities, so the indoor air renewal in the warehouse is done by natural ventilation through the staircase and the elevator.
Earth-sheltered warehouse
It is a building of 5000 m2 of total surface, out of which 2000 m2 are used as warehouses. For its construction, an excavation of several meters of depth was made first in order to build the foundations and the reinforced concrete structure of the building. Finally, the whole building was covered again with earth. The studied warehouse is limited along its longitudinal walls without other conditioned facilities, whereas its transversal walls are in contact with the terrain. The dimensions of the warehouse are 40 m long, 25 m wide and a free height of 5.5 m. The warehouse is on ground level but completely sheltered, as it is under a uniform layer of 0.80 m of earth in which vineyards and gardens with irrigation were planted to refresh the ground during the summer months. The warehouse does not have an air conditioning system, so the indoor air renewal is done through natural ventilation.
Underground warehouse
It is a traditional warehouse excavated in the ground, the envelope of which is made using the natural terrain and an indoor finishing of lime mortar. The indoor ceiling has a vaulted shape to facilitate the distribution of the loads over the terrain. The warehouse is accessed from a stairwell located in the interior patio of a rural building. The interior distribution consists of a gallery of 5 m × 19 m with an average height of 5 m. There are four ventilation openings (3 m × 3 m) in the ceiling of the warehouse, permanently open and in contact with the exterior.
2.2. Monitoring
For the monitoring of the warehouses a four channel Hobo® data-logger (Onset Computer Corporation, Bourne, MA, USA) with exterior temperature probes was used. Its precision is ±0.25 °C at 20 °C and resolution 0.03 °C at 20 °C. For the monitoring of the exterior conditions Hobo® Pro V2 data loggers were used with interior thermistor-type temperature and capacitive-type relative humidity sensors. The precision of these sensors is from ±0.18 °C at 25 °C and ±2.5% from 10% r.h. to 90% r.h., with a resolution of 0.02 °C and 0.03% r.h.
The exterior sensors were protected from solar radiation and rain with special housings. The measurement interval was set at 15 min for all the loggers, obtaining a total of 1,086,240 data points. The sensors were located in the central area of each warehouse. In each monitoring spot, four and five sensors uniformly distributed from the floor to up to a height close to the ceiling were used. In the over-ground warehouses the highest sensor could not be installed at the maximum height for technical difficulties, given the big existing height, being placed at a height slightly higher than the stored material. The period of time for the environmental monitoring has been from 1 August 2011 to 31 July 2012.
2.3. Analysis of the Data
The data obtained through the monitoring were statistically processed in order to characterize the stratification of the temperatures and the influence of the outdoor temperature. After carrying out a preliminary analysis of the temperature profiles obtained, a linear temperature variation was assumed, in which the temperature raises constantly with height. This approximation is valid for the purpose of the article (as it will be analyzed in the results), allowing to carry out a comparison between the average values of variation along the months, and between some warehouses and others.
In this way, the model that relates the difference of temperature between any height and the height close to the floor (ΔT) with the height (h) is as follows:
3. Results
3.1. Preliminary Analysis
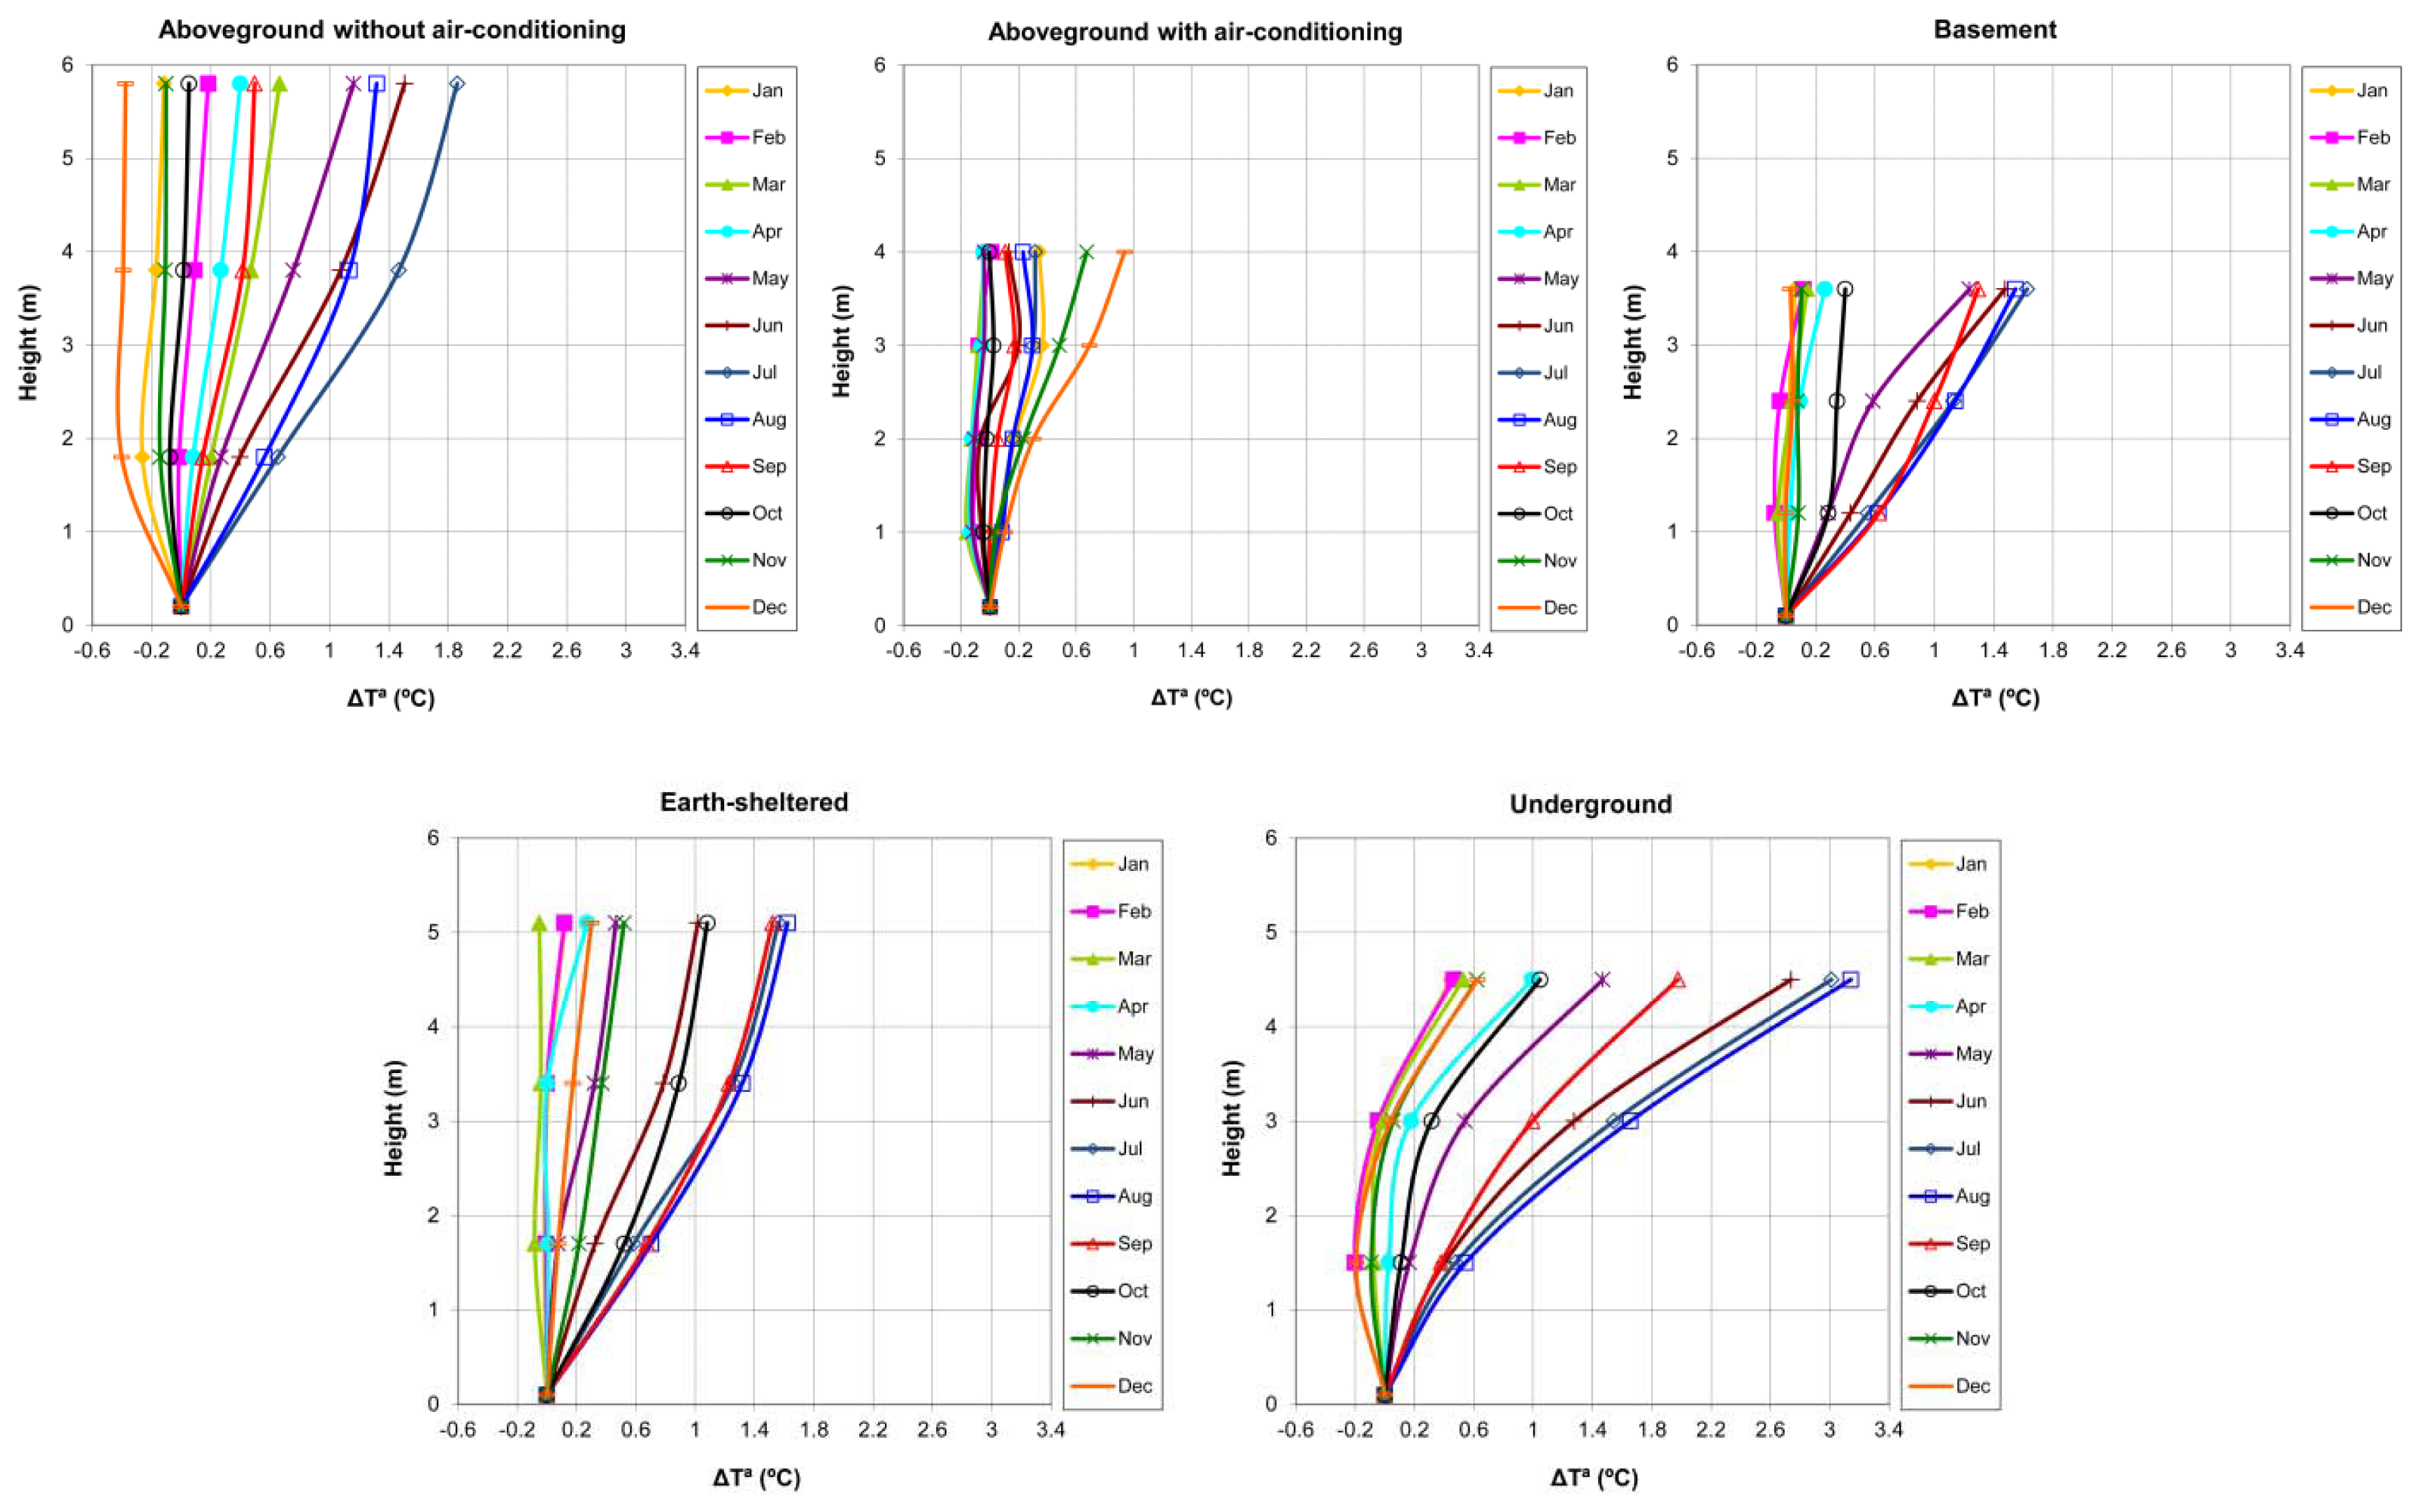
From the data obtained in the monitoring period, the monthly average of temperature for each monitored height was calculated, in each one of the studied warehouses. The monthly averages were used to represent the profile of temperature for each month, with the aim of facilitating the preliminary analysis (Figure 3).
In all the warehouses the form of the curve that defines the vertical stratification varies along the year. Equally, there is a variation in the concavity and gradient of the curve between some warehouses and others. All of this indicates differential behavior depending on the outdoor conditions and the particular conditions of the warehouse.
On the other hand, the performance of an air conditioning system installed close to the ceiling reduces significantly the temperature differences in the hottest months. Despite the existing differences, the slope of the curves of temperature is generally small, and in a great number of cases, it could approximate quite accurately to a linear variation. For that reason, to carry out a comparative study along the year, quantifying the differences of stratification between some months and the others, a simple linear regression model was chosen. That approximation is acceptable taking into account the purpose of the study, and it allows us to have a standard variable for comparison (the slope of the line of stratification), solving the problem of the change of curvature.
3.2. Regression Analysis
The linear regression analysis has been carried out for each of the 35,040 instants in which the profile of temperatures was monitored in each warehouse. The model relates the difference of temperature with respect the spot closer to the ground (ΔT) with height (h). The slope of the straight line obtained in the regression (β1) represents the temperature variation for each meter of height. Table 1 shows the monthly averages of the analysis carried out in each warehouse.
During the months where stratification reaches the highest values (summer months, except for the case of the air-conditioning warehouse), the adjustment of the model is good, with average values of R2 between 0.93 and 0.99, and a standard error of the estimation close to the precision of the sensors used. As the temperature differences decrease, the R2 of the model also tends to decrease. However, this phenomenon is explained by the fact that as the vertical temperature differences decrease, a little error or variation in the measurement of one of the sensors gains relevance over the adjustment of the model. Thus, the cases with low R2 are due to small temperature differences of (β1 close to 0), giving small estimation errors. Therefore, if we select only cases with high R2, the β1 coefficient would remain similar to those obtained with the total sample.
In this way, the selected regression model gives some valid results for the purpose of the article, allowing us to carry out a comparison between the average variation values along the months, and to compare some warehouses with others.
3.3. Analysis of the Stratification
3.3.1. Analysis of the Annual Stratification
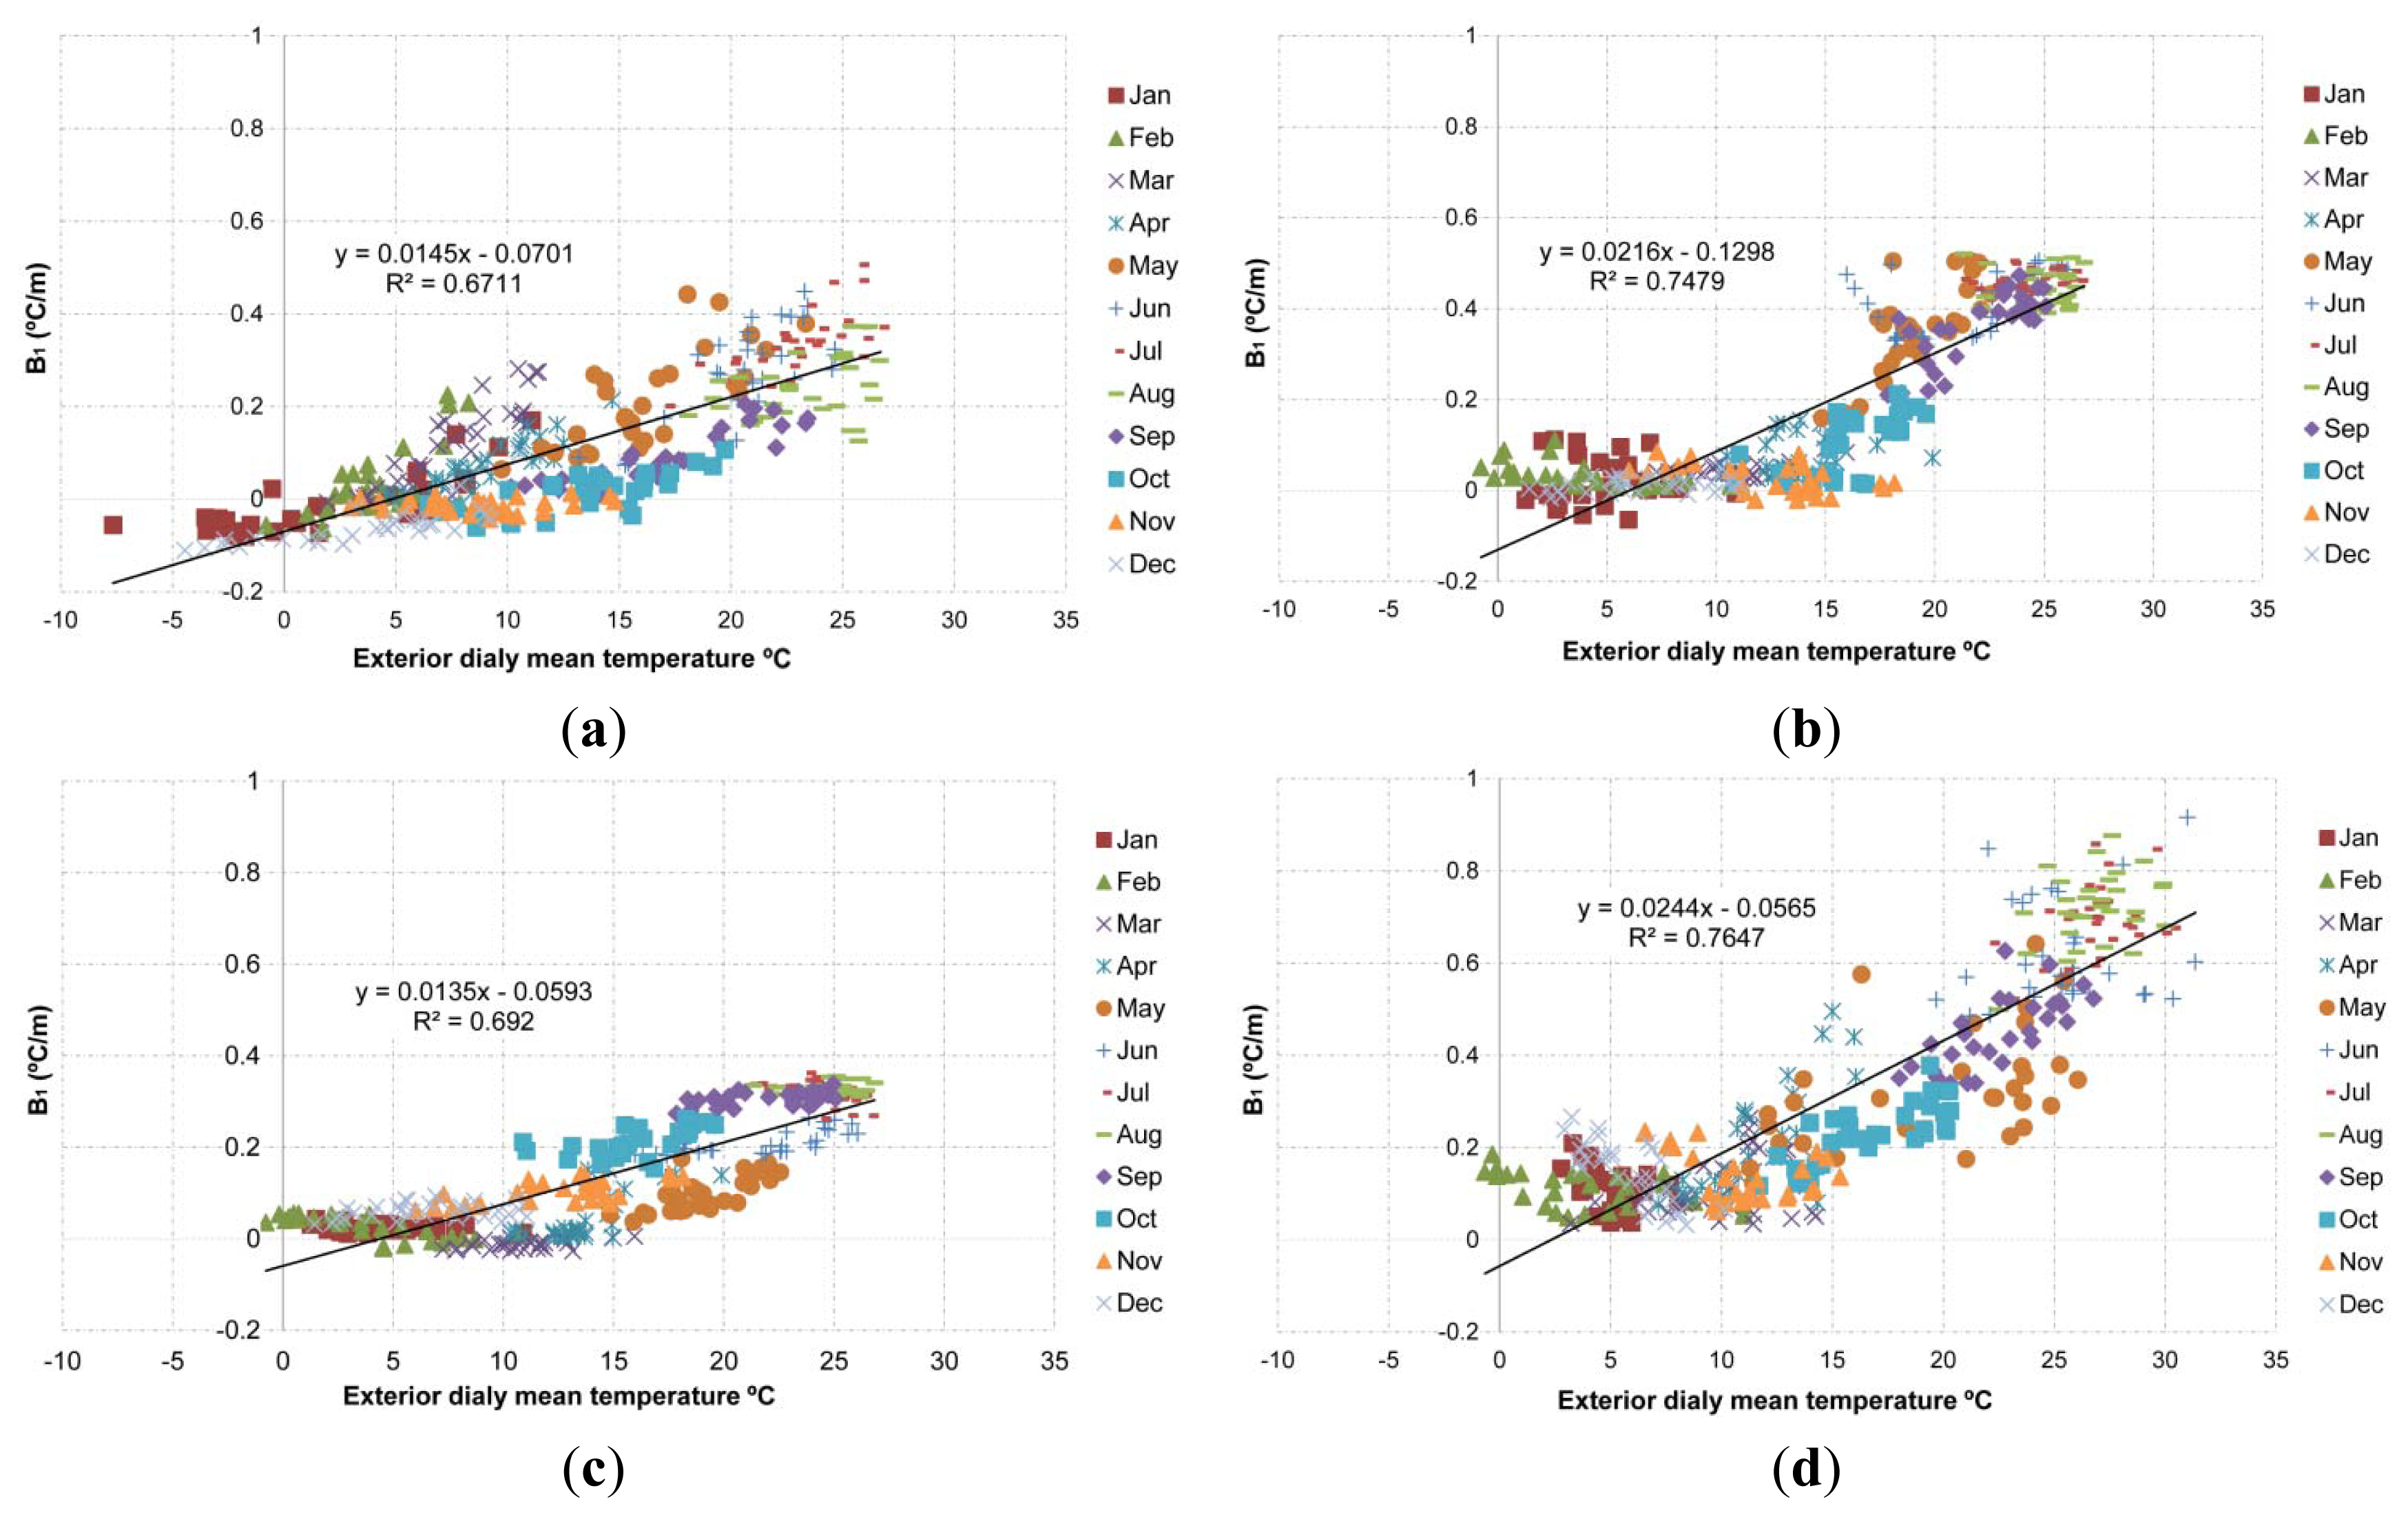
From the analysis of the unstandardized coefficients (β1), it can be concluded that there is a strong influence of the outdoor temperature over the stratification of the air inside all the studied warehouses. The β1 values increase as the outdoor temperature rises, with the biggest vertical differences appearing during the hottest months. On the contrary, the stratification decreases rapidly when the outdoor temperature is low (Figure 4). Similar results are obtained when the β1 are compared with the difference of temperature between the outdoor and the indoor.
This phenomenon seems to be a consequence of the interchange of heat through the building envelopes, particularly through the ceiling. The roof is the most exposed area to the thermal interchange with the exterior in all the warehouses analyzed: aboveground warehouses due to their greater radiation and poor thickness roof and/or insulation material; and the underground, earth-sheltered and basement due to the small volume of soil (thermal inertia) covering the celling, compared to the vertical walls, allowing higher temperature variations.
In this way, the outdoor temperature increment creates an increment of the temperature of the envelopes, specially the upper one, increasing the temperature of the higher air strata. On the contrary, the cooler indoor air accumulates close to the ground, with lower temperature at this time of the year.
As the heat increases thanks to the exterior temperature, the lighter warm air goes up and concentrates in the higher strata of the warehouse, increasing the differences with the lower levels. The maximum values obtained vary between 0.3 °C/m and 0.5 °C/m (monthly average) for the studied buildings that present enough isolation, going over even 0.7 °C/m in the extreme case of the underground warehouse, where the permanently opened openings increase the temperature.
During the months in which outdoor temperature decreases, the ceiling gets cooler in contact with the air from the exterior. When the air in contact with the upper envelope gets cooler than the temperature of the air located in lower strata, it goes down due to it being heavier. The air in the lower strata, generally warmer, goes up because it is lighter. In this way, a constant homogenization of the air happens, with very little differences in all the vertical profiles of temperature. During the winter months, with lower outdoor temperature, the β1 values vary between 0 °C/m and 0.1 °C/m in the warehouses with continuous ceilings.
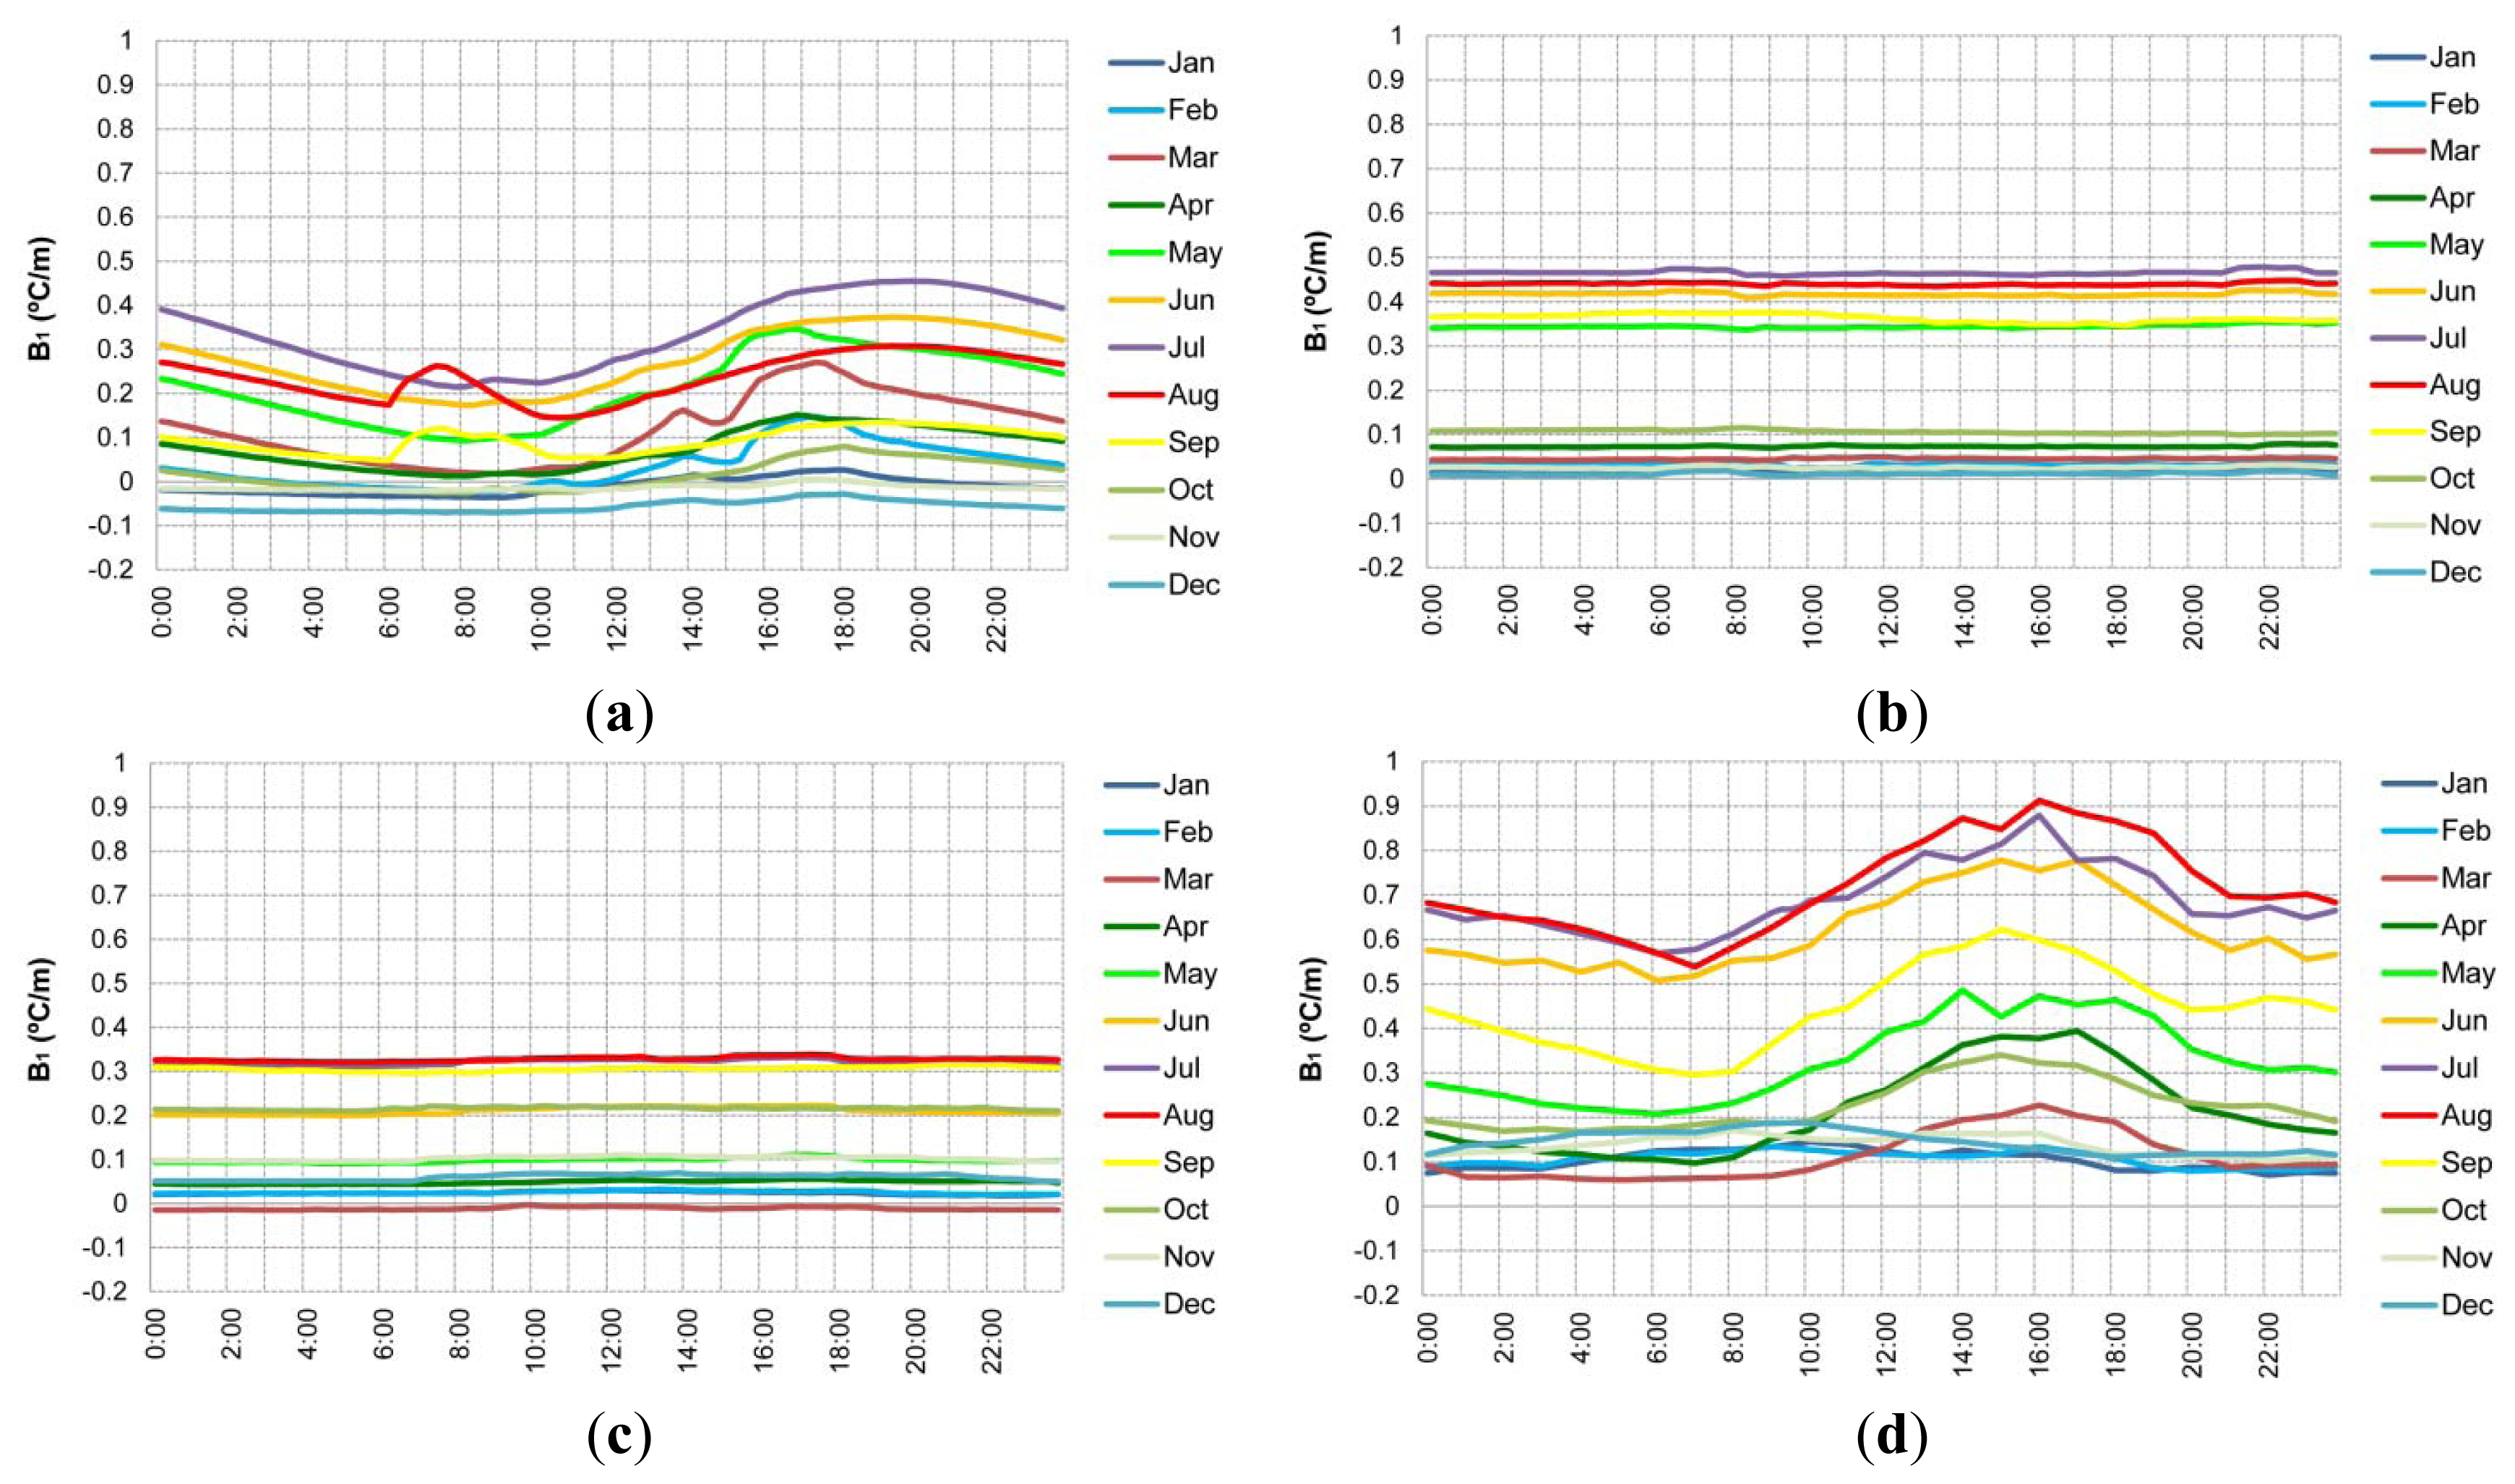
3.3.2. Analysis of the Daily Stratification
When the variations of stratification along the day are analyzed, significant differences between some building typologies and others are observed. In the warehouses most exposed to the outdoors (aboveground without air-conditioning and underground with ventilation opening), a phenomenon similar to the one previously described is observed, due to the fast warming up or cooling of the higher strata (Figure 5). In this way, both present important variations between night and day during the summer months, reaching up to several tenths of degree for each meter of height. In this way, in the hottest month, an average difference between day and night of 0.25 °C/m is registered in the aboveground warehouse without air conditioning. The average is the most extreme in the underground warehouse, much more exposed to the outdoor environment through the ceiling, going over 0.45 °C/m. In the coldest months, on the other hand, there are barely differences between day and night, because of the homogenization of air.
In the warehouses less exposed to the exterior (basement and earth sheltered), the thermal inertia of the envelopes or the adjacent rooms prevent quick temperature changes, therefore, no significant stratification changes happen along the day at any time of the year. Both typologies are recommended for storage of products that require thermal stability for their conservation (e.g., wine).
In the most exposed warehouses (aboveground without air-conditioning and underground with ventilation opening), the biggest stratification happens during the warm hours (14:00–18:00). In the underground warehouse, during the month of August, the values of maximum stratification (0.9 °C/m) happen at 16:00. The higher thermal stratification can be reduced by increasing the thermal inertia of the envelopes and/or reducing the ventilation.
It must point out the importance of the obtained data in the extreme case of the underground warehouse with permanently opened openings, which allows us to determine the essential role that the ceiling plays in stratification. Based on previous results, it would be expected that if the underground warehouse did not have the openings permanently open, its daily and annual behavior would be similar to that of the less exposed warehouses to the indoor environment, with less differences both daily and annually.
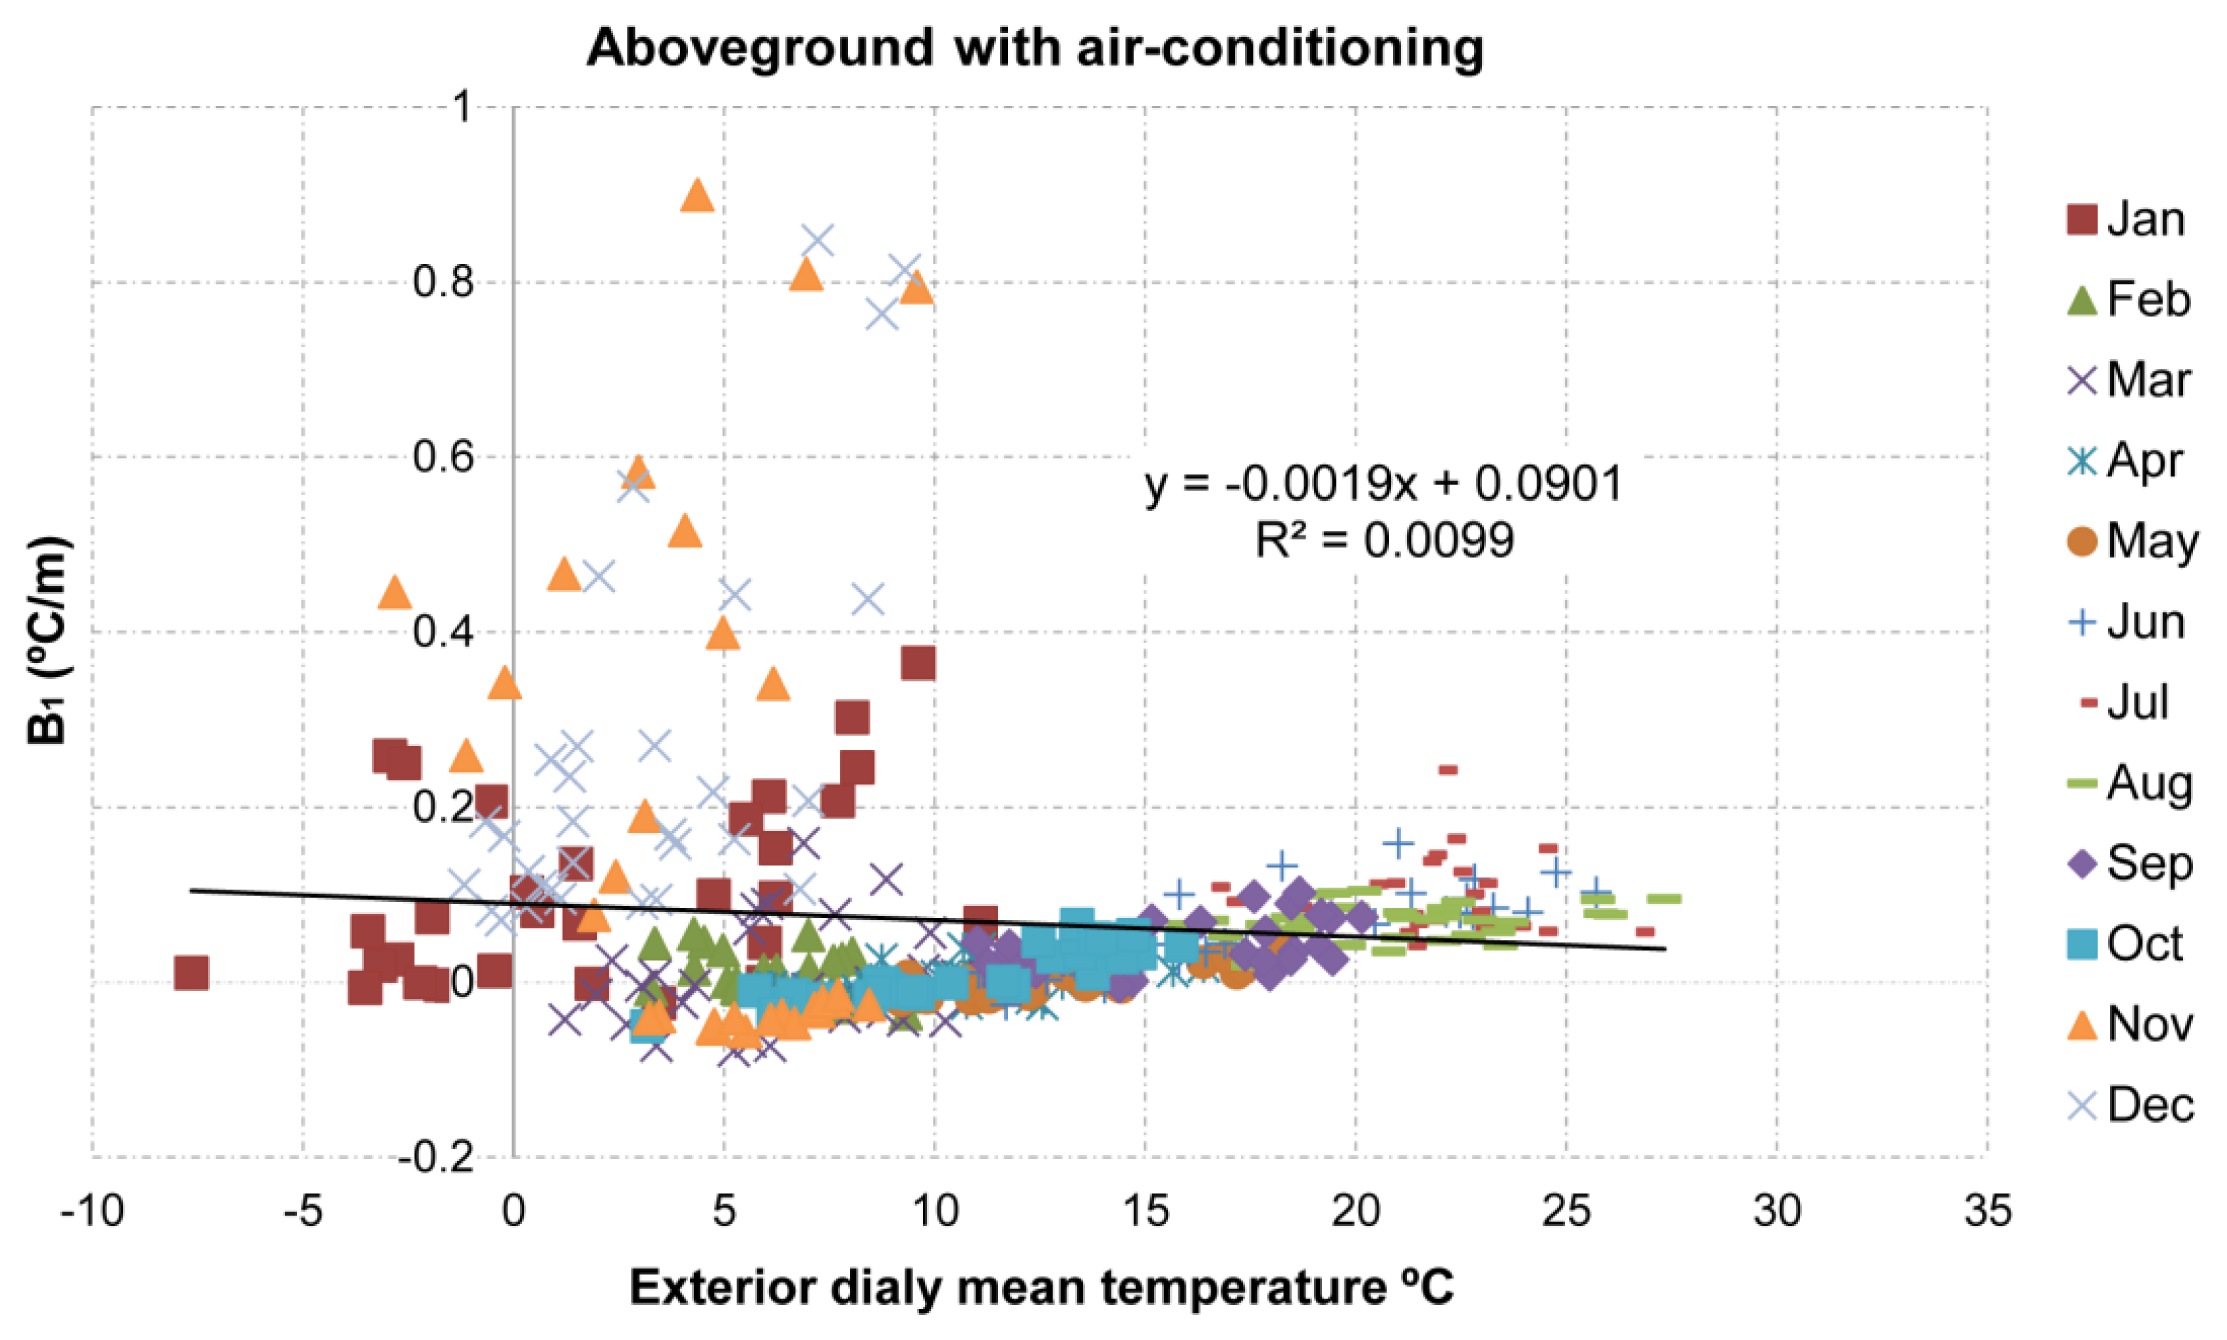
3.4. Influence of the Air Conditioning
The data obtained in the air conditioned warehouse were processed in a similar way as that of the rest of the warehouses. After that, the results were compared with those of the aboveground warehouse without air conditioning, to analyze the effect of the air conditioning on the vertical variation of temperatures. The air conditioning system presented different phases of performance, which will enable us to obtain some conclusions about its effects during both cooling and warming hours. The air conditioning cooling worked from April until September to keep the warehouse below 16 °C. In November, December and part of January, an intensive heating of the warehouse was carried out, provoking a considerable increment of the temperature, sometimes even going over 16 °C.
Unlike the other warehouses, the variation of the outdoor conditions presents an insignificant influence over the stratification of air temperatures in the air conditioned warehouse (Figure 6). In contrast the other warehouses, low thermal stratification values are obtained in the hotter months while high values are obtained in the cold months.
In the season in which the air conditioning equipment cools down the indoor air, a phenomenon similar to the one described in the colder season of the warehouse without air conditioning happens. The cool air pushed from the highest area, where the air conditioning system is located, goes down to lower levels, creating a homogenization of the air and little stratification. Therefore, in the summer months the stratification is greatly reduced (Figure 6).
In the period in which the air conditioning equipment warms up the indoor air, a phenomenon similar to the one described in the hotter season of the warehouse without air conditioning happens. The warm air pushed from the highest area accumulates in the highest strata, where the air conditioning system is located, provoking temperature differences that may reach 0.9 °C/m in days with constant performance (Figure 6). The stratification decreases rapidly when the equipment stops working, due to the cooling of the higher layers through the ceiling.
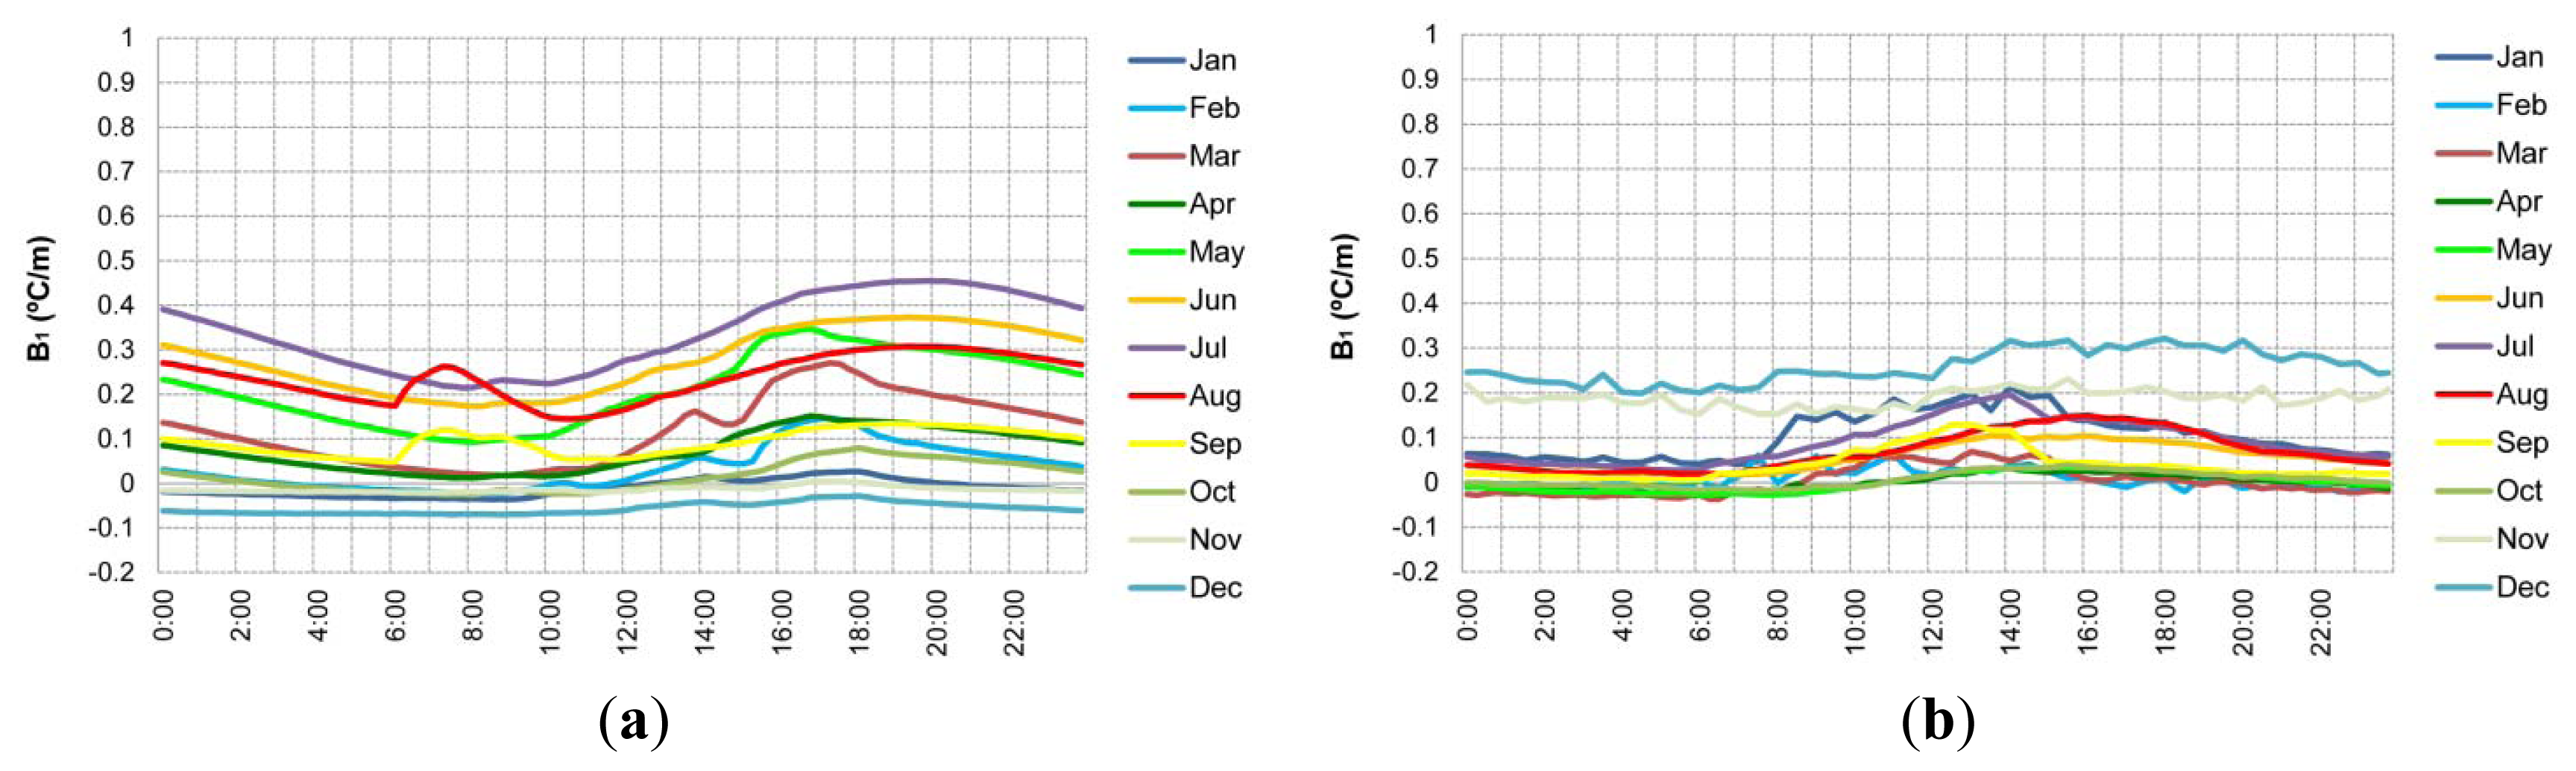
The performance of the air conditioning for cooling also reduces the vertical differences of temperature along the day to small values (Figure 7). When the equipment works warming up in a constant way, the β1 values remain relatively stable along the day, although with a higher average.
4. Conclusions
The study analyzes the vertical temperature gradients existing in warehouses with different building typology, quantifying their value and analyzing their evolution along the year. To do so, a methodology based on regression analysis is proposed, which enables us to quantify the vertical stratification of temperatures, establishing a comparison parameter between different periods and warehouses. The results show that there is a strong influence of the outdoor temperature over the stratification of indoor air of all the studied warehouses. This phenomenon seems to be a consequence of the interchange of heat through the envelopes, specially through the ceiling.
During the warm months, the higher exterior temperature and the radiation warm up the envelope and the higher air strata, whereas the cold air accumulates in the lower levels, increasing the stratification of indoor air. Monthly average values of stratification between 0.3 °C/m and 0.7 °C/m can be reached, depending on the outdoor conditions and the characteristics of the warehouse. The highest values of stratification have been found in the hours of highest outdoor temperature (between 14:00 and 18:00). In the warehouse most exposed to the outdoor maximum values of 0.9 °C/m are reached. In the cold months, the upper envelope cools down, so the heavier cold air goes down to lower strata, homogenizing the air and registering insignificant vertical differences of temperature.
The air conditioning of the warehouse, besides controlling the temperature, limits the influence of the outdoor environment in the stratification of temperatures. With equipment installed in the upper area, the pushed cold air goes down to lower levels, creating a homogenization of the air and little stratification; the pushed warm air accumulates in the higher strata, increasing the differences of temperature. The use of air-conditioning equipment helps to maintain the homogeneity of the indoor environment, breaking the stratification and decreasing the vertical temperature differences. Studies like this are necessary to generate more specific scientific information that can be used by engineers and architects for indoor environment design in warehouses. The results of the study can be of great use for the warehouses of products sensitive to temperature, which could suffer differential evolution, conservation or maturing when differences of temperature are sustained for a long time.
Acknowledgments
This study has been carried out as part of the BIA2009-09567 research project, funded by the Spanish Ministry of Science and Innovation
Conflicts of Interest
The authors declare no conflict of interest.
References
- Conti, J.; Holtberg, P. International Energy Outlook 2011; Technical Report DOE/EIA-0484; U.S. Energy Information Administration (EIA): Washington, DC, USA, 2011. [Google Scholar]
- Nunes, M.C.N.; Emond, J.P.; Rauth, M.; Dea, S.; Chau, K.V. Environmental conditions encountered during typical consumer retail display affect fruit and vegetable quality and waste. Postharvest Biol. Technol. 2009, 51, 232–241. [Google Scholar]
- Park, C.-E.; Kim, Y.-S.; Park, K.-J.; Kim, B.-K. Changes in physicochemical characteristics of rice during storage at different temperatures. J. Stored Prod. Res. 2012, 48, 25–29. [Google Scholar]
- Sirisoontaralak, P.; Noomhorm, A. Changes in physicochemical and sensory-properties of irradiated rice during storage. J. Stored Prod. Res. 2007, 43, 282–289. [Google Scholar]
- Oliveira, A.N.; Ramos, A.M.; Minim, V.P.R.; Chaves, J.B.P. Sensory stability of whole mango juice: Influence of temperature and storage time. Ciênc. Tecnol. Aliment 2012, 32, 819–825. [Google Scholar]
- Beckett, S.J. Insect and mite control by manipulating temperature and moisture before and during chemical-free storage. J. Stored Prod. Res. 2011, 47, 284–292. [Google Scholar]
- Cox, P.D.; Wakefield, M.E.; Jacob, T.A. The effects of temperature on flight initiation in a range of moths, beetles and parasitoids associated with stored products. J. Stored Prod. Res. 2007, 43, 111–117. [Google Scholar]
- Rohdin, P.; Moshfegh, B. Numerical modelling of industrial indoor environments: A comparison between different turbulence models and supply systems supported by field measurements. Build. Environ. 2011, 46, 2365–2374. [Google Scholar]
- Altwies, J.E.; Reindl, D.T. Passive thermal energy storage in refrigerated warehouses. Int. J. Refrig. 2002, 25, 149–157. [Google Scholar]
- Mazarrón, F.R.; Cid-Falceto, J.; Cañas, I. An assessment of using ground thermal inertia as passive thermal technique in the wine industry around the world. Appl. Therm. Eng. 2012, 33–34, 54–61. [Google Scholar]
- Mazarrón, F.R.; Cid-Falceto, J.; Cañas, I. Ground thermal inertia for energy efficient building design: A case study on food industry. Energies 2012, 5, 227–242. [Google Scholar]
- Mazarrón, F.R.; López-Ocón, E.; Garcimartín, M.A.; Cañas, I. Assessment of basement constructions in the winery industry. Tunn. Undergr. Space Technol. 2013, 35, 200–206. [Google Scholar]
- Della Crociata, S.; Martellotta, F.; Simone, A. A measurement procedure to assess indoor environment quality for hypermarket workers. Build. Environ. 2012, 47, 288–299. [Google Scholar]
- Mazarrón, F.R.; Cid-Falceto, J.; Cañas-Guerrero, I. Assessment of aboveground winery buildings for the aging and conservation of wine. Appl. Eng. Agric. 2012, 28, 903–910. [Google Scholar]
- Armstrong, M.; Chihata, B.; MacDonald, R. Cold weather destratification energy savings of a warehousing facility. ASHRAE Trans. 2009, 115, 513–518. [Google Scholar]
- Ho, S.H.; Rosario, L.; Rahman, M.M. Numerical simulation of temperature and velocity in a refrigerated warehouse. Int. J. Refrig. 2010, 33, 1015–1025. [Google Scholar]


| Month | Aboveground without air-conditioning | Aboveground with air-conditioning | Basement | Earth-Sheltered | Underground | |||||||||||||||
|---|---|---|---|---|---|---|---|---|---|---|---|---|---|---|---|---|---|---|---|---|
| Model summary | Unstandardized coefficient | Model summary | Unstandardized coefficient | Model summary | Unstandardized coefficient | Model summary | Unstandardized coefficient | Model summary | Unstandardized coefficient | |||||||||||
| R2 | Error | β1 | Error | R2 | Error | β1 | Error | R2 | Error | β1 | Error | R2 | Error | β1 | Error | R2 | Error | β1 | Error | |
| January | 0.50 | 0.13 | −0.01 | 0.03 | 0.61 | 0.07 | 0.10 | 0.02 | 0.49 | 0.05 | 0.02 | 0.02 | 0.60 | 0.05 | 0.02 | 0.01 | 0.49 | 0.23 | 0.10 | 0.07 |
| February | 0.59 | 0.05 | 0.04 | 0.01 | 0.22 | 0.07 | 0.01 | 0.02 | 0.29 | 0.09 | 0.03 | 0.03 | 0.75 | 0.04 | 0.03 | 0.01 | 0.48 | 0.25 | 0.11 | 0.08 |
| March | 0.82 | 0.04 | 0.12 | 0.01 | 0.36 | 0.09 | 0.00 | 0.03 | 0.64 | 0.06 | 0.05 | 0.02 | 0.27 | 0.07 | −0.01 | 0.02 | 0.52 | 0.22 | 0.11 | 0.07 |
| April | 0.81 | 0.04 | 0.07 | 0.01 | 0.13 | 0.07 | 0.00 | 0.02 | 0.87 | 0.05 | 0.07 | 0.02 | 0.39 | 0.10 | 0.05 | 0.03 | 0.73 | 0.29 | 0.21 | 0.09 |
| May | 0.99 | 0.06 | 0.21 | 0.01 | 0.11 | 0.06 | 0.00 | 0.02 | 0.95 | 0.13 | 0.34 | 0.05 | 0.95 | 0.05 | 0.10 | 0.01 | 0.88 | 0.27 | 0.33 | 0.08 |
| June | 0.97 | 0.13 | 0.28 | 0.03 | 0.38 | 0.11 | 0.06 | 0.04 | 0.99 | 0.06 | 0.42 | 0.02 | 0.98 | 0.07 | 0.21 | 0.02 | 0.94 | 0.36 | 0.62 | 0.11 |
| July | 0.97 | 0.16 | 0.34 | 0.04 | 0.87 | 0.05 | 0.09 | 0.02 | 0.98 | 0.10 | 0.47 | 0.04 | 0.98 | 0.13 | 0.32 | 0.03 | 0.96 | 0.33 | 0.69 | 0.10 |
| August | 0.93 | 0.18 | 0.24 | 0.04 | 0.77 | 0.06 | 0.07 | 0.02 | 0.98 | 0.09 | 0.44 | 0.04 | 0.97 | 0.16 | 0.33 | 0.04 | 0.97 | 0.31 | 0.72 | 0.09 |
| September | 0.89 | 0.07 | 0.09 | 0.02 | 0.55 | 0.05 | 0.04 | 0.02 | 0.95 | 0.13 | 0.36 | 0.05 | 0.97 | 0.15 | 0.31 | 0.04 | 0.96 | 0.20 | 0.45 | 0.06 |
| October | 0.70 | 0.06 | 0.01 | 0.01 | 0.50 | 0.03 | 0.01 | 0.01 | 0.68 | 0.09 | 0.11 | 0.04 | 0.95 | 0.12 | 0.22 | 0.03 | 0.83 | 0.22 | 0.23 | 0.07 |
| November | 0.33 | 0.06 | −0.01 | 0.02 | 0.81 | 0.06 | 0.19 | 0.02 | 0.56 | 0.04 | 0.03 | 0.02 | 0.95 | 0.06 | 0.10 | 0.02 | 0.64 | 0.23 | 0.14 | 0.07 |
| December | 0.54 | 0.17 | −0.06 | 0.04 | 0.93 | 0.09 | 0.26 | 0.03 | 0.52 | 0.02 | 0.01 | 0.01 | 0.93 | 0.04 | 0.06 | 0.01 | 0.56 | 0.27 | 0.15 | 0.08 |
© 2014 by the authors; licensee MDPI, Basel, Switzerland. This article is an open access article distributed under the terms and conditions of the Creative Commons Attribution license ( http://creativecommons.org/licenses/by/3.0/).
Share and Cite
Porras-Amores, C.; Mazarrón, F.R.; Cañas, I. Study of the Vertical Distribution of Air Temperature in Warehouses. Energies 2014, 7, 1193-1206. https://doi.org/10.3390/en7031193
Porras-Amores C, Mazarrón FR, Cañas I. Study of the Vertical Distribution of Air Temperature in Warehouses. Energies. 2014; 7(3):1193-1206. https://doi.org/10.3390/en7031193
Chicago/Turabian StylePorras-Amores, César, Fernando R. Mazarrón, and Ignacio Cañas. 2014. "Study of the Vertical Distribution of Air Temperature in Warehouses" Energies 7, no. 3: 1193-1206. https://doi.org/10.3390/en7031193
APA StylePorras-Amores, C., Mazarrón, F. R., & Cañas, I. (2014). Study of the Vertical Distribution of Air Temperature in Warehouses. Energies, 7(3), 1193-1206. https://doi.org/10.3390/en7031193