Article

Effects of Impermeable Boundaries on Gas Production from Hydrate Accumulations in the Shenhu Area of the South China Sea

1
Key Laboratory of Renewable Energy and Gas Hydrate, Guangzhou Institute of Energy Conversion, Chinese Academy of Sciences, Guangzhou 510640, China
2
Lawrence Berkeley National Laboratory, 1 Cyclotron Road, MS 90-1116, Berkeley, CA 94720, USA
*
Author to whom correspondence should be addressed.
Energies 2013, 6(8), 4078-4096; https://doi.org/10.3390/en6084078
Submission received: 6 May 2013 / Revised: 2 July 2013 / Accepted: 15 July 2013 / Published: 8 August 2013
(This article belongs to the Special Issue Natural Gas Hydrate 2013)

Abstract

:
Based on currently available data from site measurements and the preliminary estimates of the gas production potential from the hydrate accumulations at the SH7 site in the Shenhu Area using the depressurization method with a single horizontal well placed in the middle of the Hydrate-Bearing Layer (HBL), the dependence of production performance on the permeabilities of the overburden (OB) and underburden (UB) layers was investigated in this modeling study. The simulation results indicated that the temperature and the pressure of the HBL were affected by the permeabilities of OB and UB and the effect of depressurization with impermeable OB and UB was significantly stronger than that with permeable boundaries. Considering the percentage of hydrate dissociation, the gas production rate and the gas-to-water ratio, the hydrate deposit with impermeable OB and UB was expected to be the potential gas production target.

1. Introduction

1.1. Background

Natural gas hydrates (NGH) are solid, nonstoichiometric compounds formed by host water molecules with small guest molecules, such as CH4, C2H6, C3H8, CO2, H2S, etc. [1]. Natural gas hydrate deposits mainly involve CH4 and occur in the permafrost and in deep ocean sediments, where the necessary conditions of low temperature and high pressure for hydrate stability exist. Recent seismic explorations and geological researches have shown that natural gas hydrates in these sediments constitute a large natural gas reservoir that invites consideration as a potential strategic energy resource [2,3,4,5].
There are three main methods for gas production from hydrate deposits: depressurization [6,7,8,9,10], thermal stimulation [11,12,13,14], and inhibitor effects [15,16]. Of the above mentioned methods for hydrate dissociation for gas production, the depressurization one appears to be the most efficient [9,10,17,18,19,20,21,22]. The Mallik 2002 well provided proof of the concept that it is possible to recover energy from permafrost hydrates by combining the dissociation techniques of depressurization and thermal stimulation [1].
The Blake Ridge hydrate accumulation offshore the Carolinas [23], in which large volumes of gas hydrate are distributed in vast volumes of fine-grained and relatively undeformed sediment at low (2%–4% average) saturations, has been extensively studied since the °Cean drilling program (ODP) Leg 164 [24], and a preliminary estimate of the gas resource is up to 13.7 × 10⁹ t under standard atmospheric conditions [24]. Numerical simulations indicate that the hydrate accumulations at Blake Ridge with the free gas reservoir beneath the hydrate-bearing layer may be of economic value for industrial production [25,26].
Recent studies [10,17,18,22] have indicated that, under certain conditions, gas can be produced from natural hydrate deposits at high rates over long periods using vertical wells by means of depressurization and thermal stimulation. Simulation results indicate that horizontal wells [10,19,22] will show significant advantages over the vertical wells in gas production from Class 2 and Class 3 deposits.

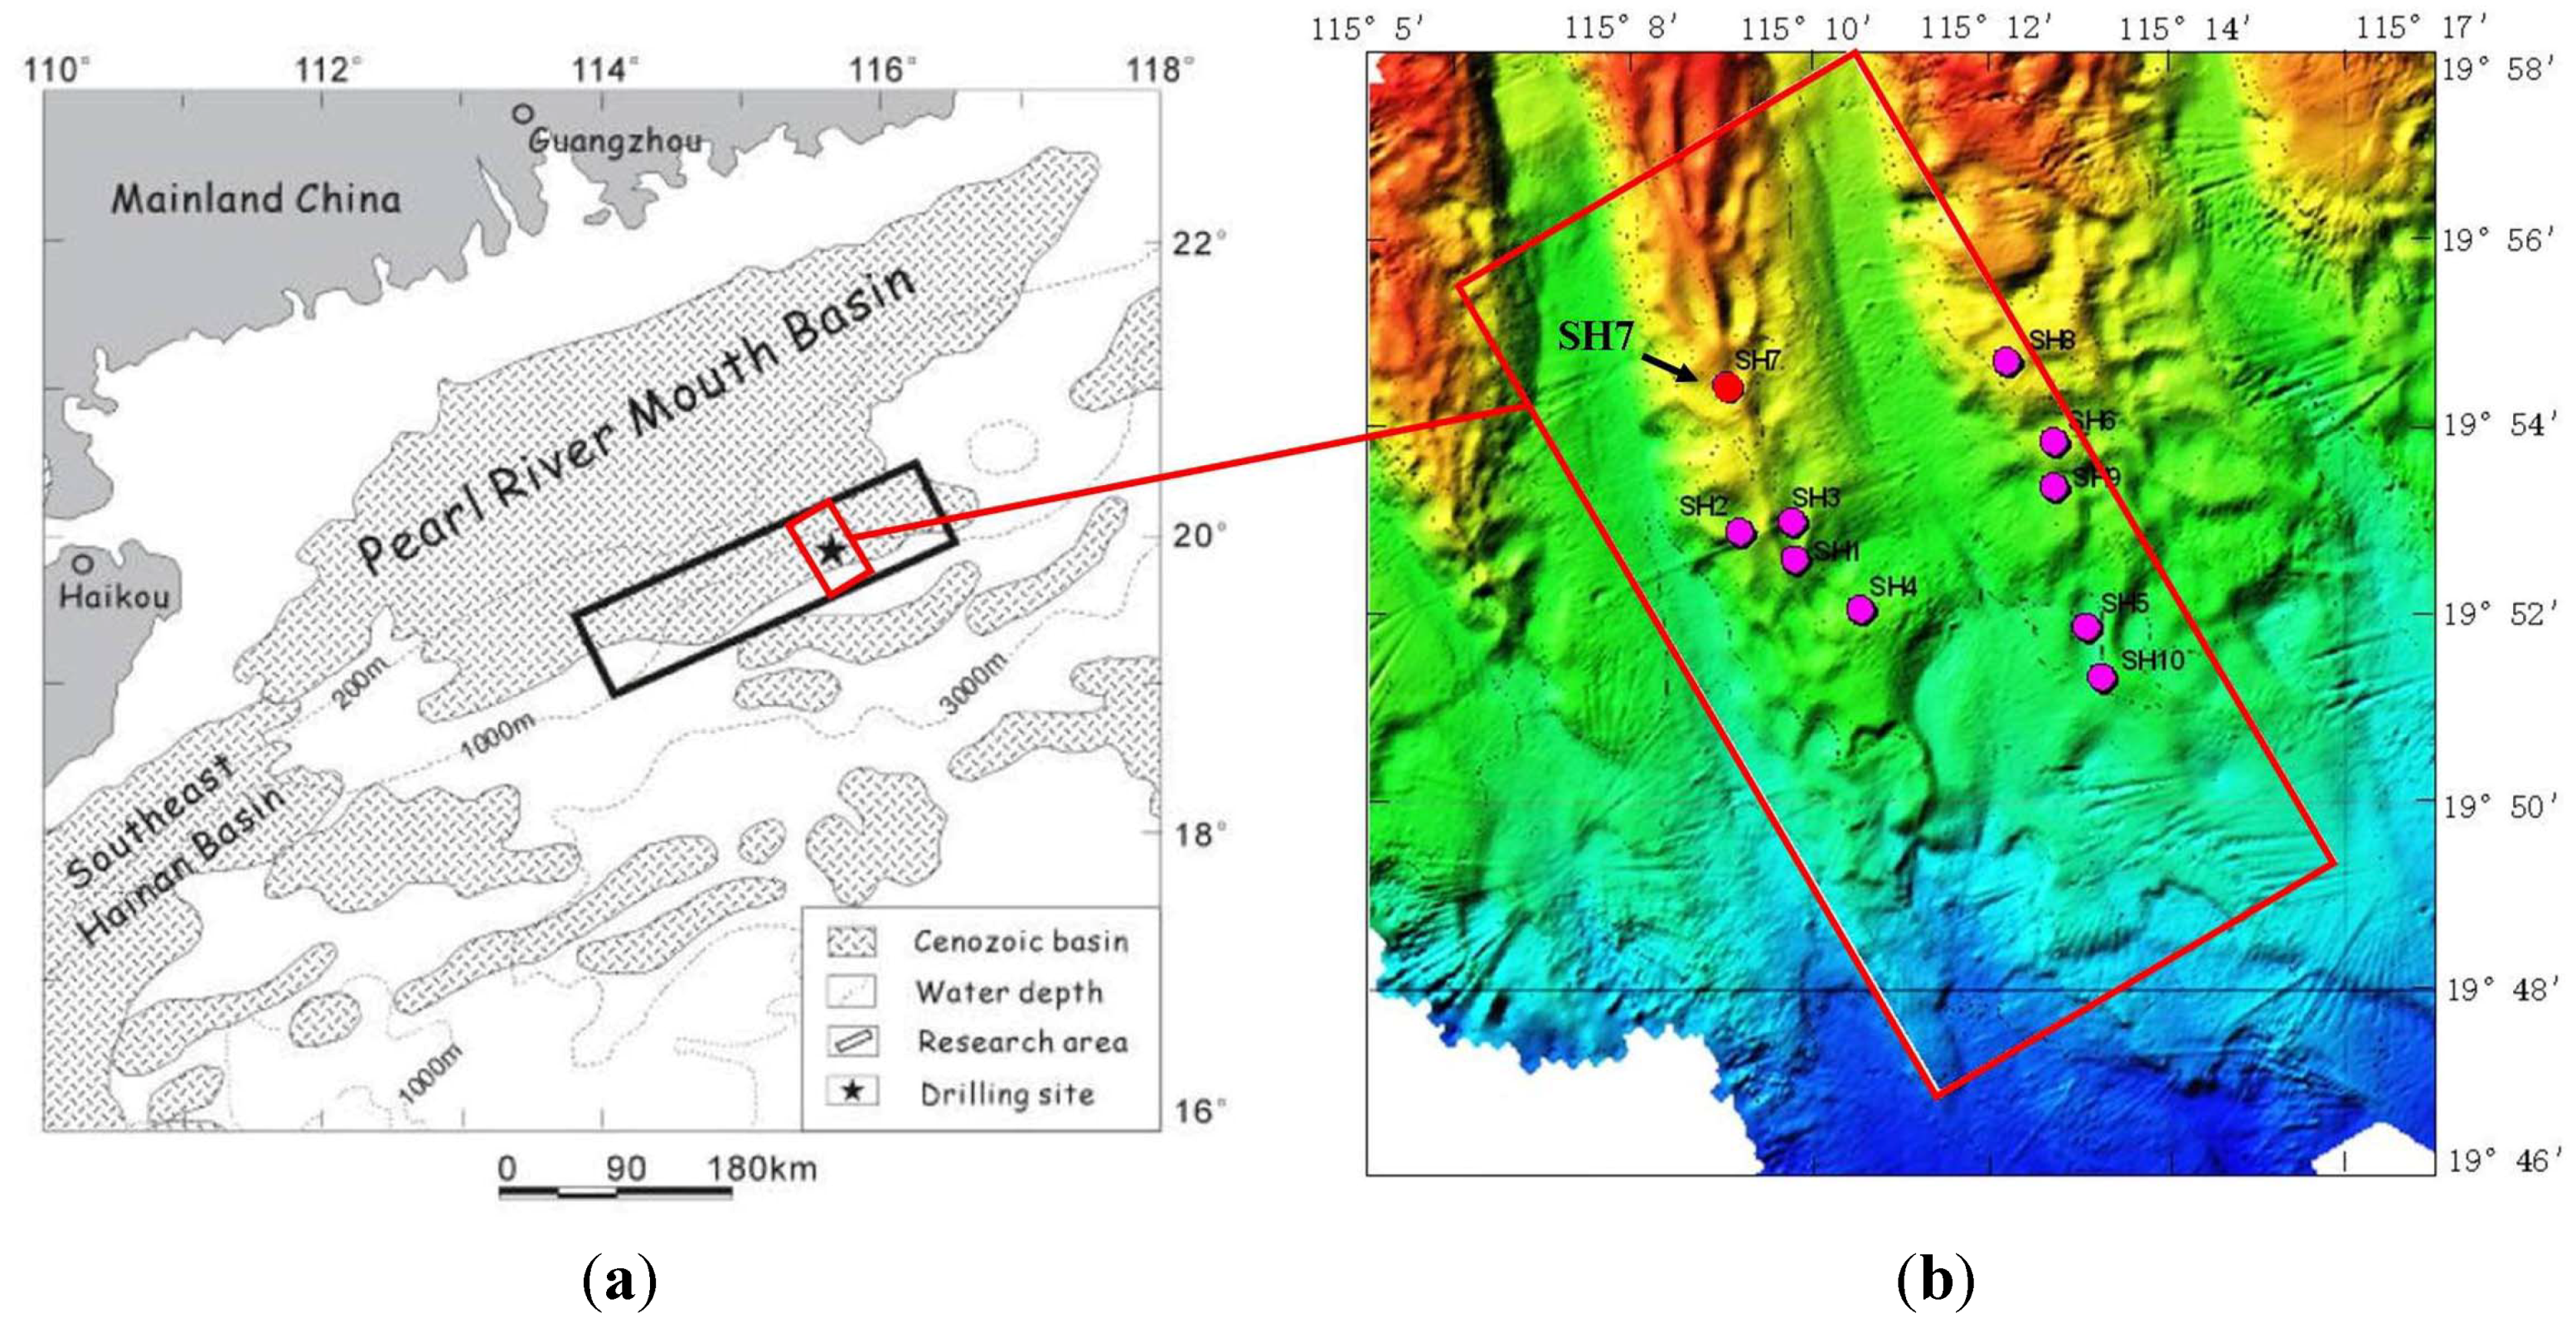
1.2. Hydrates in the Shenhu Area

Recent studies [27,28,29,30,31,32] have documented the occurrence of the significant gas hydrate deposits in the Shenhu Area of the South China Sea. The Shenhu Area is located in the near southeast of the Shenhu Underwater Sandy Bench in the middle of the north slope of the South China Sea, between the Xisha Trough and the Dongsha Islands (Figure 1). Gas hydrate samples were collected during a recent scientific expedition conducted by the China Geological Survey in the Shenhu Area of the northern South China Sea in May 2007 [28,29,30,32]. From site measurements, the heat flow in the Shenhu Area was estimated to range from 74.0 mW/m2 to 78.0 mW/m2. Estimates of the geothermal gradient ranged from 43 °C/km to 67.7 °C/km. The water temperature at the ocean floor TOF is in the 4−5 °C range for water depths exceeding 1000 m [28,30].
Figure 1. (a) Location of research area, Shenhu Area, north slope of South China Sea; (b) Bathymetric map of gas hydrate drilling area with sites drilled in the research area.
Energies 06 04078 g001
The drilling results from the hydrate layer in the Shenhu Area, measured from both non-pressure and pressurized cores, indicate that the top of the hydrate layers are located 155–229 m below seafloor (mbsf), and their thickness varies from 10 m to 43 m. These hydrate layers occur at water depths from 1108 m to 1245 m. The sediment porosity ϕ and the in situ salinity XS in the Shenhu Area, measured from the pressure cores, are 33%–48% and 0.0290–0.0315, respectively; the TOF and XS at the seafloor are 3.3–3.7 °C and 0.0328–0.0334, respectively.

1.3. Objective and Approach

The main objective of this study is to investigate the effects of the permeabilities of the boundaries, including the overburden (OB) and the underburden (UB), on the gas production potential at the SH7 drilling site of the Shenhu Area with a single horizontal well using the depressurization method. The effects of the permeabilities of OB and UB (kOB and kUB, respectively) on the gas production potential are investigated by the following three cases: (i) kOB = kUB = 75 mD; (ii) kOB = 0 mD, kUB = 75 mD; (iii) kOB = kUB = 0 mD. Case (i) has a similar numerical model, system properties and production method as the reference case in our previous work [10], which is based on the gas hydrate deposit in the South China Sea Shenhu Area, while both Case (ii) and Case (iii) are hypothetical cases. According to the previous classification of the natural hydrate accumulations [8], Case (iii) belongs to Class 3, which involves only an HBL, without underlying mobile fluid zones, and usually bounded by low-permeability OB and UB. This study makes a systematic comparison of the production performance in the cases with different permeabilities of the boundaries. In order to evaluate the production potential of the hydrate deposit, we use two criteria, an absolute criterion and a relative criterion. To satisfy the absolute criterion, a large production potential must be demonstrated, as quatified by an early large cumulative average total gas production rate Qavg (>1.70 × 10⁵ ST m3/day = 6 MMSCFD), and a large Qavg (>5.68 × 10⁴ ST m3/day = 2 MMSCFD) over the duration of production (in this work, the duration of more than 80% of the hydrate in the deposit dissociated). The relative criterion is satisfied when the gas-to-water ratio RGW = VP/VW is high, indicating a small cumulative volume of produced water VW relative to VP, where VP is the cumulative volume of the produced CH4. RGW provides a measure of the hydrate system response and the effectiveness of dissociation as a gas-producing method.

2. Production Strategies and Simulation Approach

2.1. Method of Production

Previous studies [18,20,21] show that the depressurization-induced dissociation (based on fluid removal) is a promising gas production strategy in the Shenhu Area hydrate deposit because of its simplicity and its technical and economic effectiveness. During the initial stage of production, constant-P production allows a continuous increase in the gas production rate QPT. This is caused by the continuously increasing keff in the deposit as SH declines in the course of hydrate dissociation. Furthermore, by setting the well pressure PW > PQ (i.e., the P at the quadruple point), constant-P production provides the necessary bottom pressure control to eliminate the possibility of ice formation and significantly reduce the formation of secondary hydrates. The driving force of the depressurization ∆PW = P0PW = 0.78 P0, where PW = 3.0 MPa is the constant well pressure, and P0 = 13.7 MPa is the initial pressure in the HBL at the elevation of the horizontal well (rW = 0.1 m).

2.2. Numerical Simulation Code

For this numerical simulation study, we use both the serial and parallel versions of the TOUGH + HYDRATE code [32,33]. This code can model nonisothermal hydration reactions, phase behavior, and flow of fluids and heat under the conditions typical of natural CH4-hydrate deposits in complex geologic media. In this code, the impact of the fracturing, grain migration, the volume expansion and the instability in the reservoir are neglected.

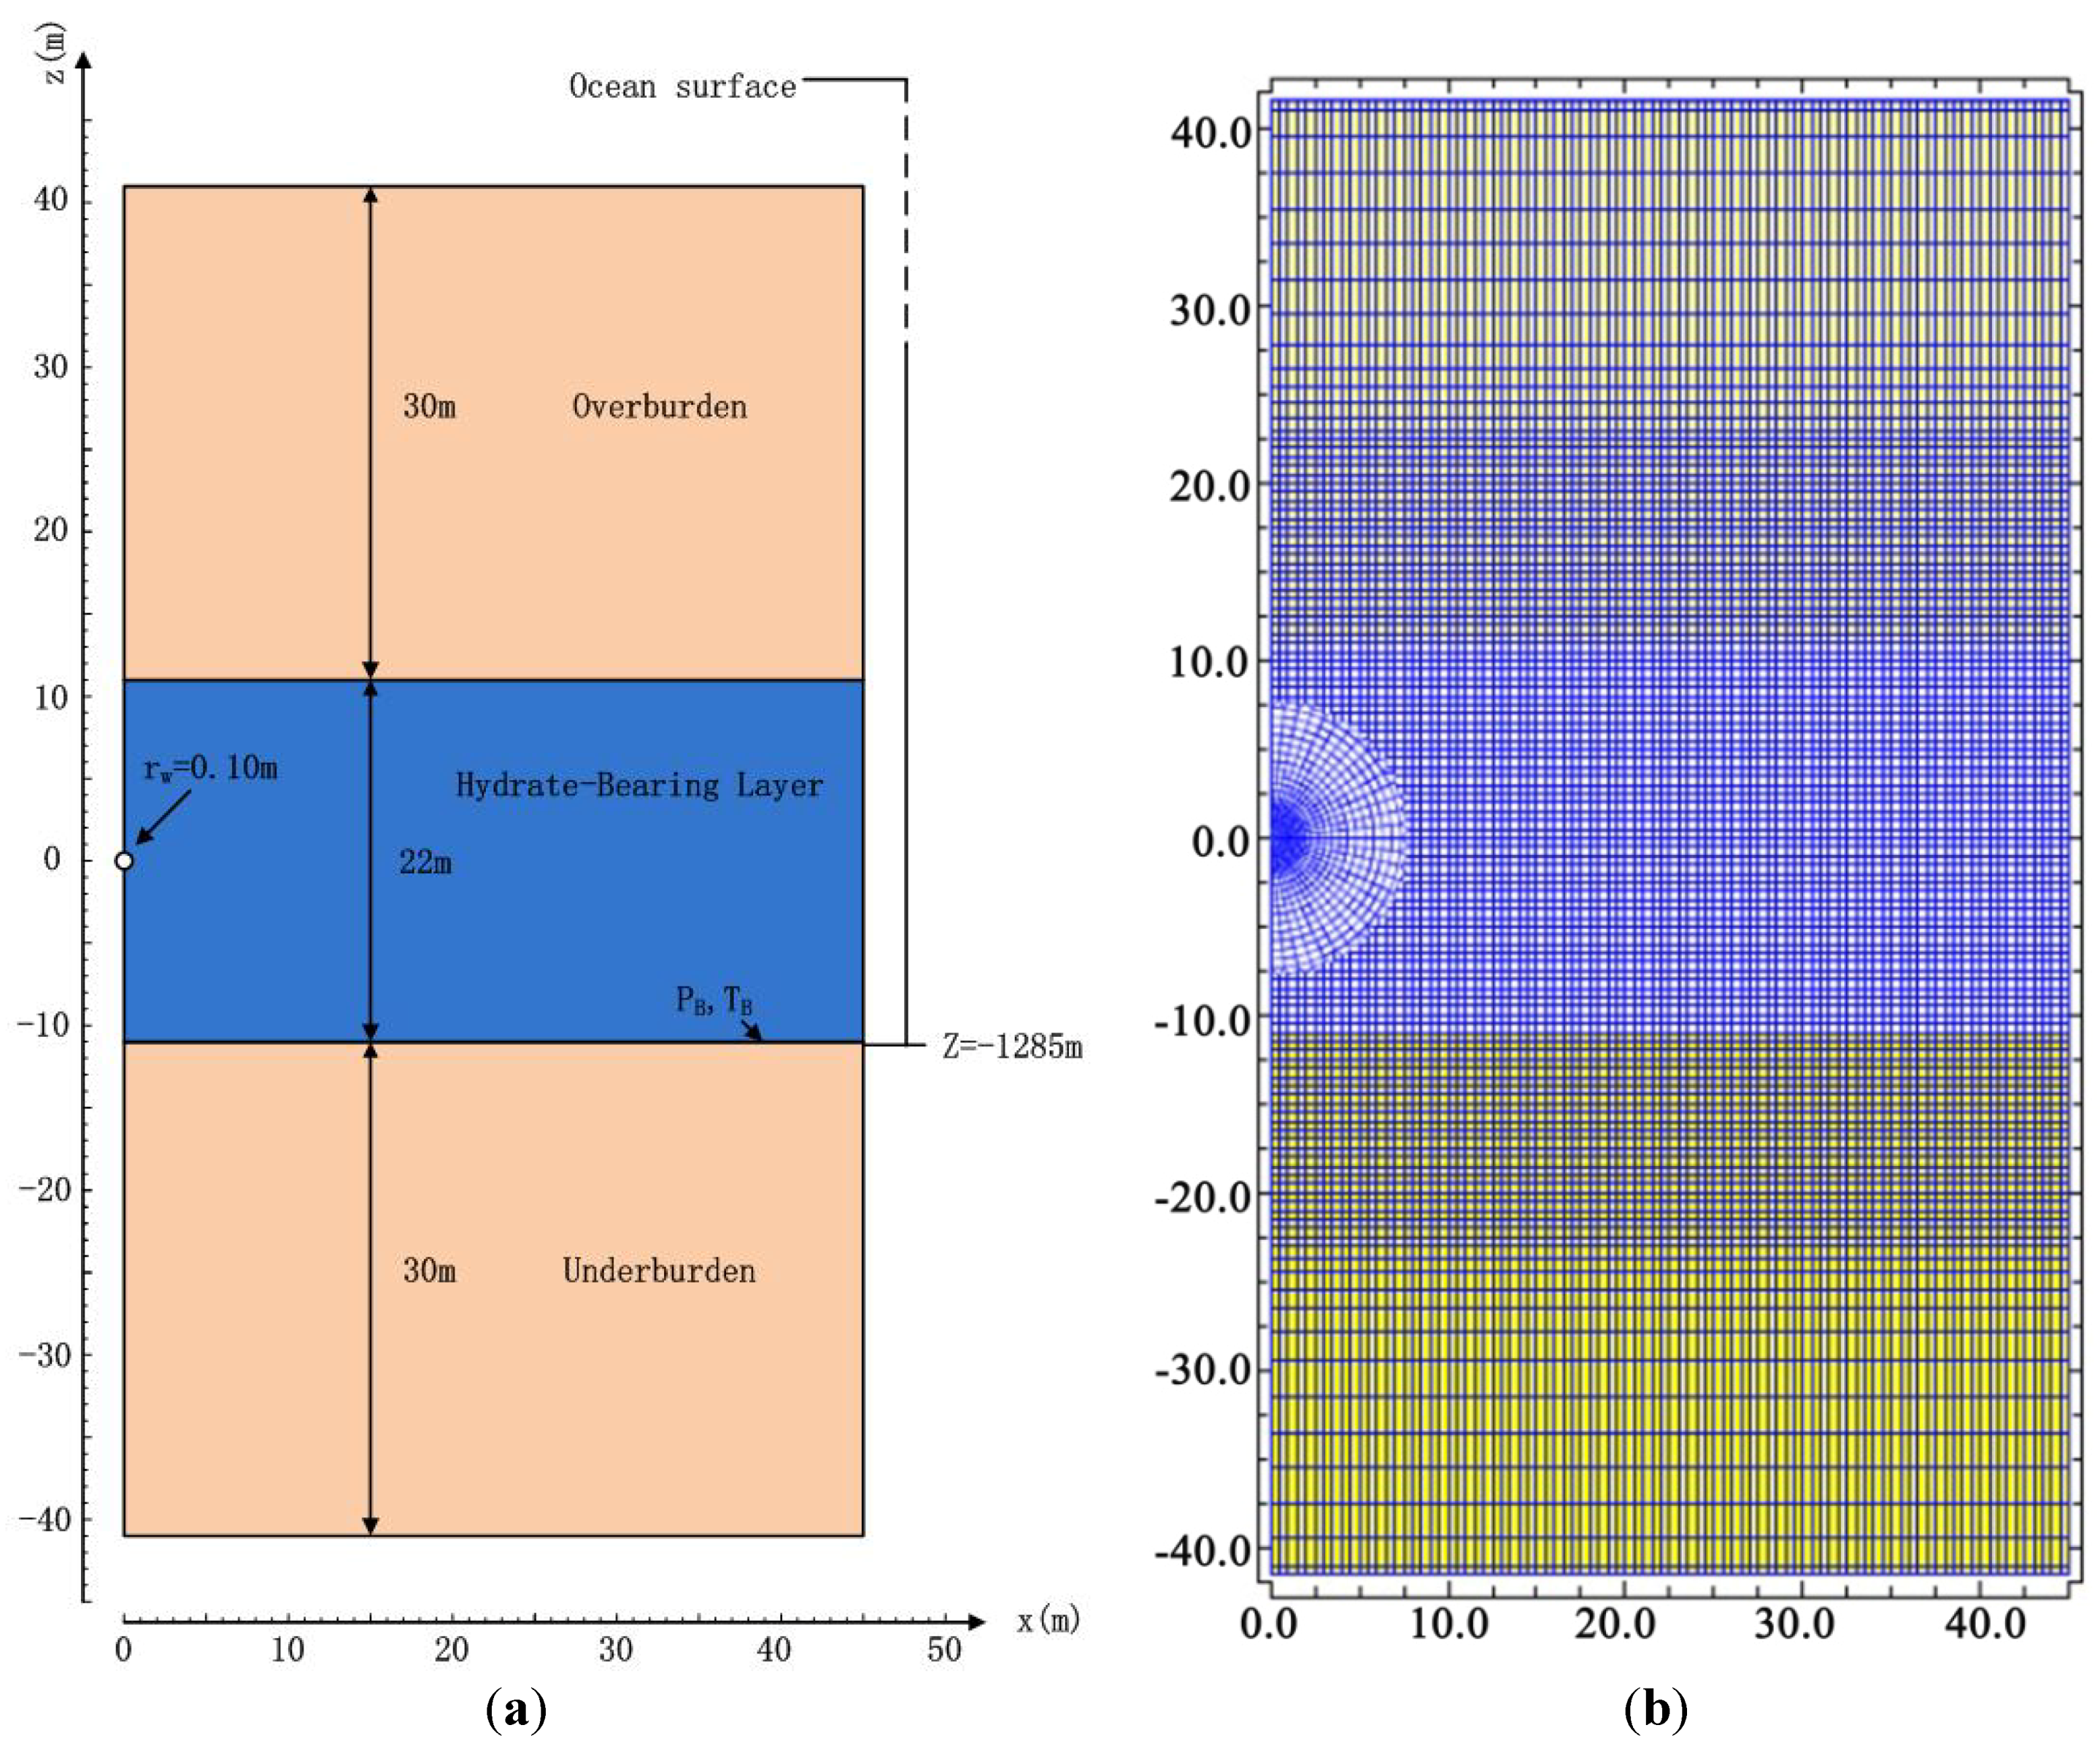
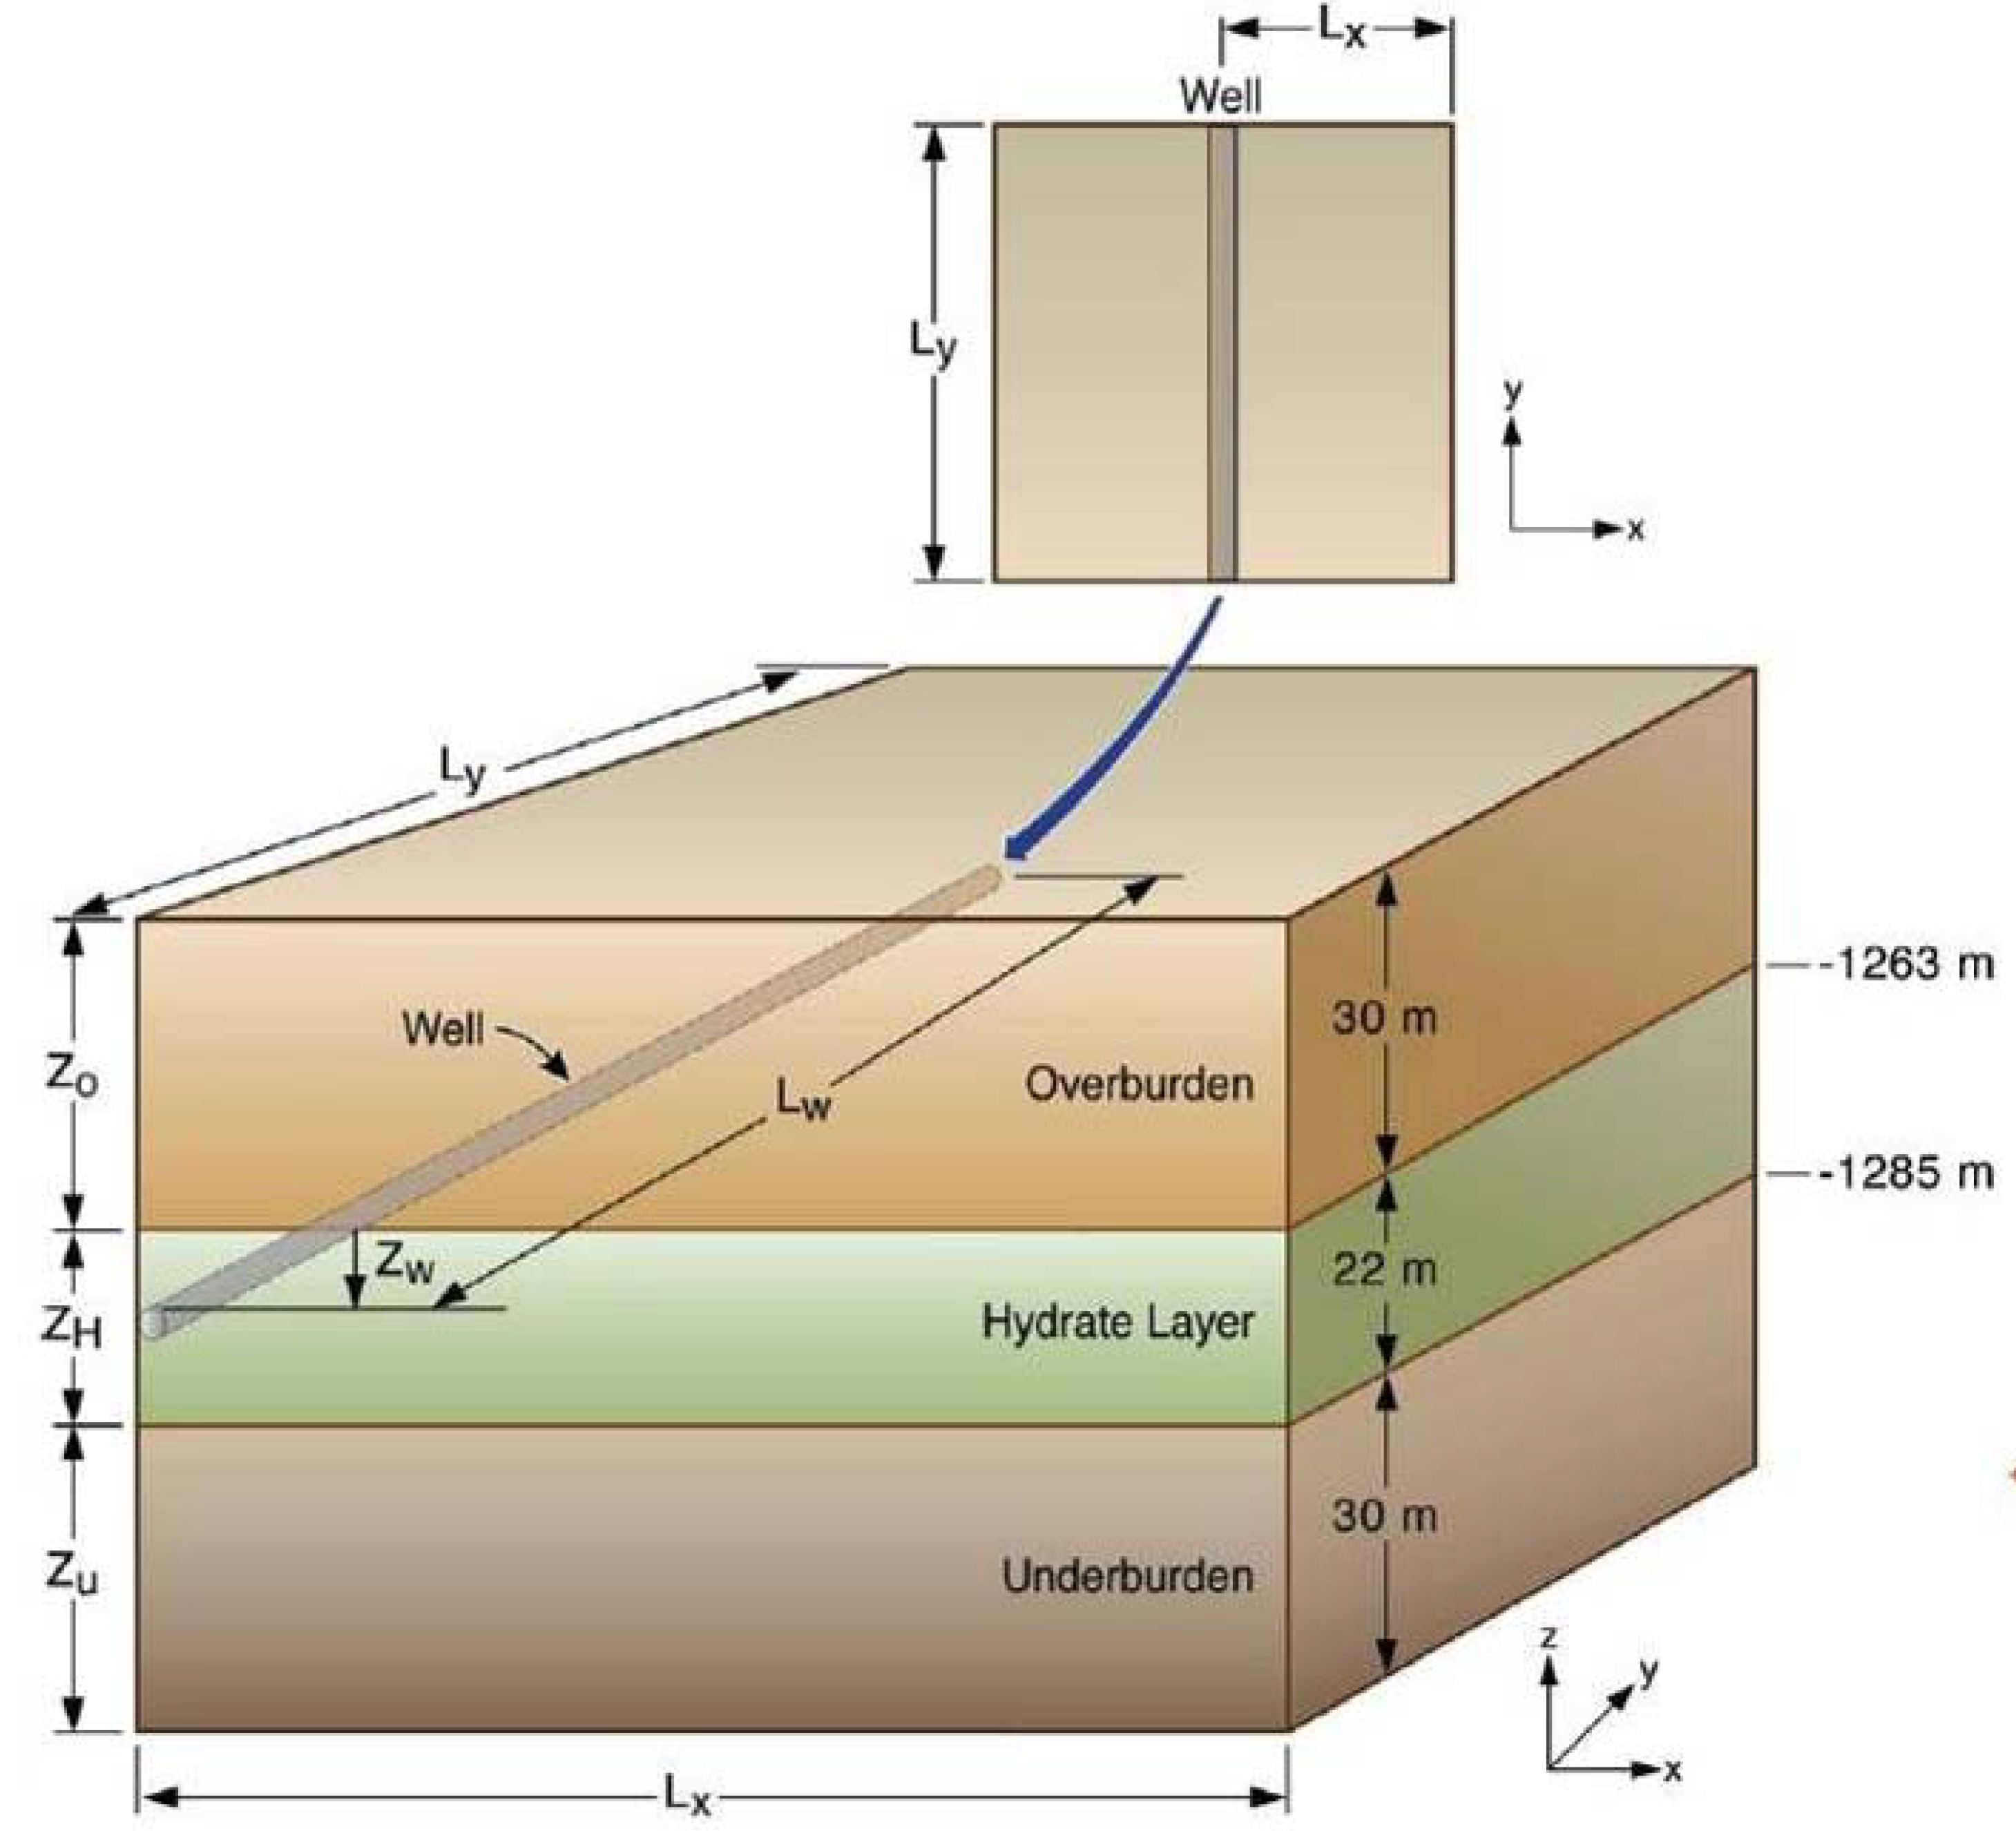
2.3. Geometry and Domain Discretization

Analysis of hydrate samples from the SH7 site at the Shenhu Area indicates almost pure (99.2%) CH4-hydrate in clayey sediments. The system properties and initial conditions that are used in the simulation are shown in Table 1. The wellbore is simulated as a pseudo-porous meium with ϕ = 1.0, k = 5.0 × 10⁻⁹ m2 (5000 Darcies), and a capillary pressure Pcap = 0. The seafloor at this site is at 1108 m depth, and the HBL extends from 155 m to 177 m interval below the seafloor (22 m thick). The domain in all the cases includes an additional 30 m underburden and overburden, which have the same flow properties as the HBL. The boundaries above the overburden and below the underburden are set to be under constant conditions (P and T).
Table 1. Properties and conditions of the hydrate deposit at site SH7 in the Shenhu area, South China Sea.
ParameterValueParameterValue
Overburden thickness ∆ZO30 mGrain density ρR (all formations)2600 kg/m3
HBL thickness ∆ZH20 mDry thermal conductivity kΘRD (all formations)1.0 W/m/K
Underburden thickness ∆ZU30 mWet thermal conductivity kΘRW (all formations)3.1 W/m/K
Well position above the HBL base ∆ZW11 mComposite thermal conductivity model [34]kΘ = kΘRD + (SA1/2 + SH1/2) (kΘRWkΘRD) + φ SIkΘI
Initial pressure PB (at base of HBL)13.83 MPaCapillary pressure model [35]Pcap = P01 [(S*)−1/λ − 1]1 – λ S* = (SASirA)/(1 − SirA)
Initial temperature TB (at base of HBL)287.31 K (14.15 °C)SirA0.29
Initial saturation in the HBLSH = 0.44, SA = 0.56λ0.45
Gas composition100% CH4P01105 Pa
Geothermal gradient0.0433 K/mRelative permeability model [34]krA = (SASirA)/(1 − SirA)n krG = (SGSirG)/(1 − SirA)nG
Water salinity (mass fraction)0.0305n = nG3.572
Intrinsic permeability of HBL kx = ky = kz7.5 × 10−14m2 (= 75 mD)SirG0.05
Porosity φ (all formations)0.41SirA0.30
Figure 2 shows the system geometry and configuration of the horizontal well. The geometry and configuration of the hydrate deposit, as well as the corresponding simulation grid, are shown in Figure 3.
Figure 2. System geometry and configuration of the horizontal well producing from the hydrate deposit at the SH7 site of the Shenhu Area, South China Sea.
Energies 06 04078 g002
Because of symmetry, only half of the domain (x ≥ 0) is simulated. Assuming uniformity of behavior along the length of the horizontal well, only a single unit of length ∆y = 1 m needs to be simulated. A no-flow boundary is applied at x = 45 m, indicating a well spacing of 90 m. A 1000 m-long well is assumed in all the cases. The hybrid grid in Figure 3b comprises 11,259 non-uniformly sized elements, of which 11,034 are active (the remaining being boundary cells). The uppermost and lowermost layers, which are inactive boundary cells, correspond to the constant −P and T conditions discussed earlier. Because of the importance of high definition in the vicinity of the well, a very fine discretization is used (with gridblocks smaller than 0.1 m across) in the region of r < 7.5 m around the well Figure 3b. Outside this region, ∆x = 0.5 m, while discretization along the z-axis is generally non-uniform. Assuming an equilibrium reaction of hydrate dissociation [34,36], this grid results in 44,136 coupled equations that are solved simultaneously.
Figure 3. (a) A schematic of the marine hydrate deposit at the SH7 site of the Shenhu Area, South China Sea; (b) The grid used in the simulations.
Energies 06 04078 g003

3. Production from Site SH7 in Shenhu Area

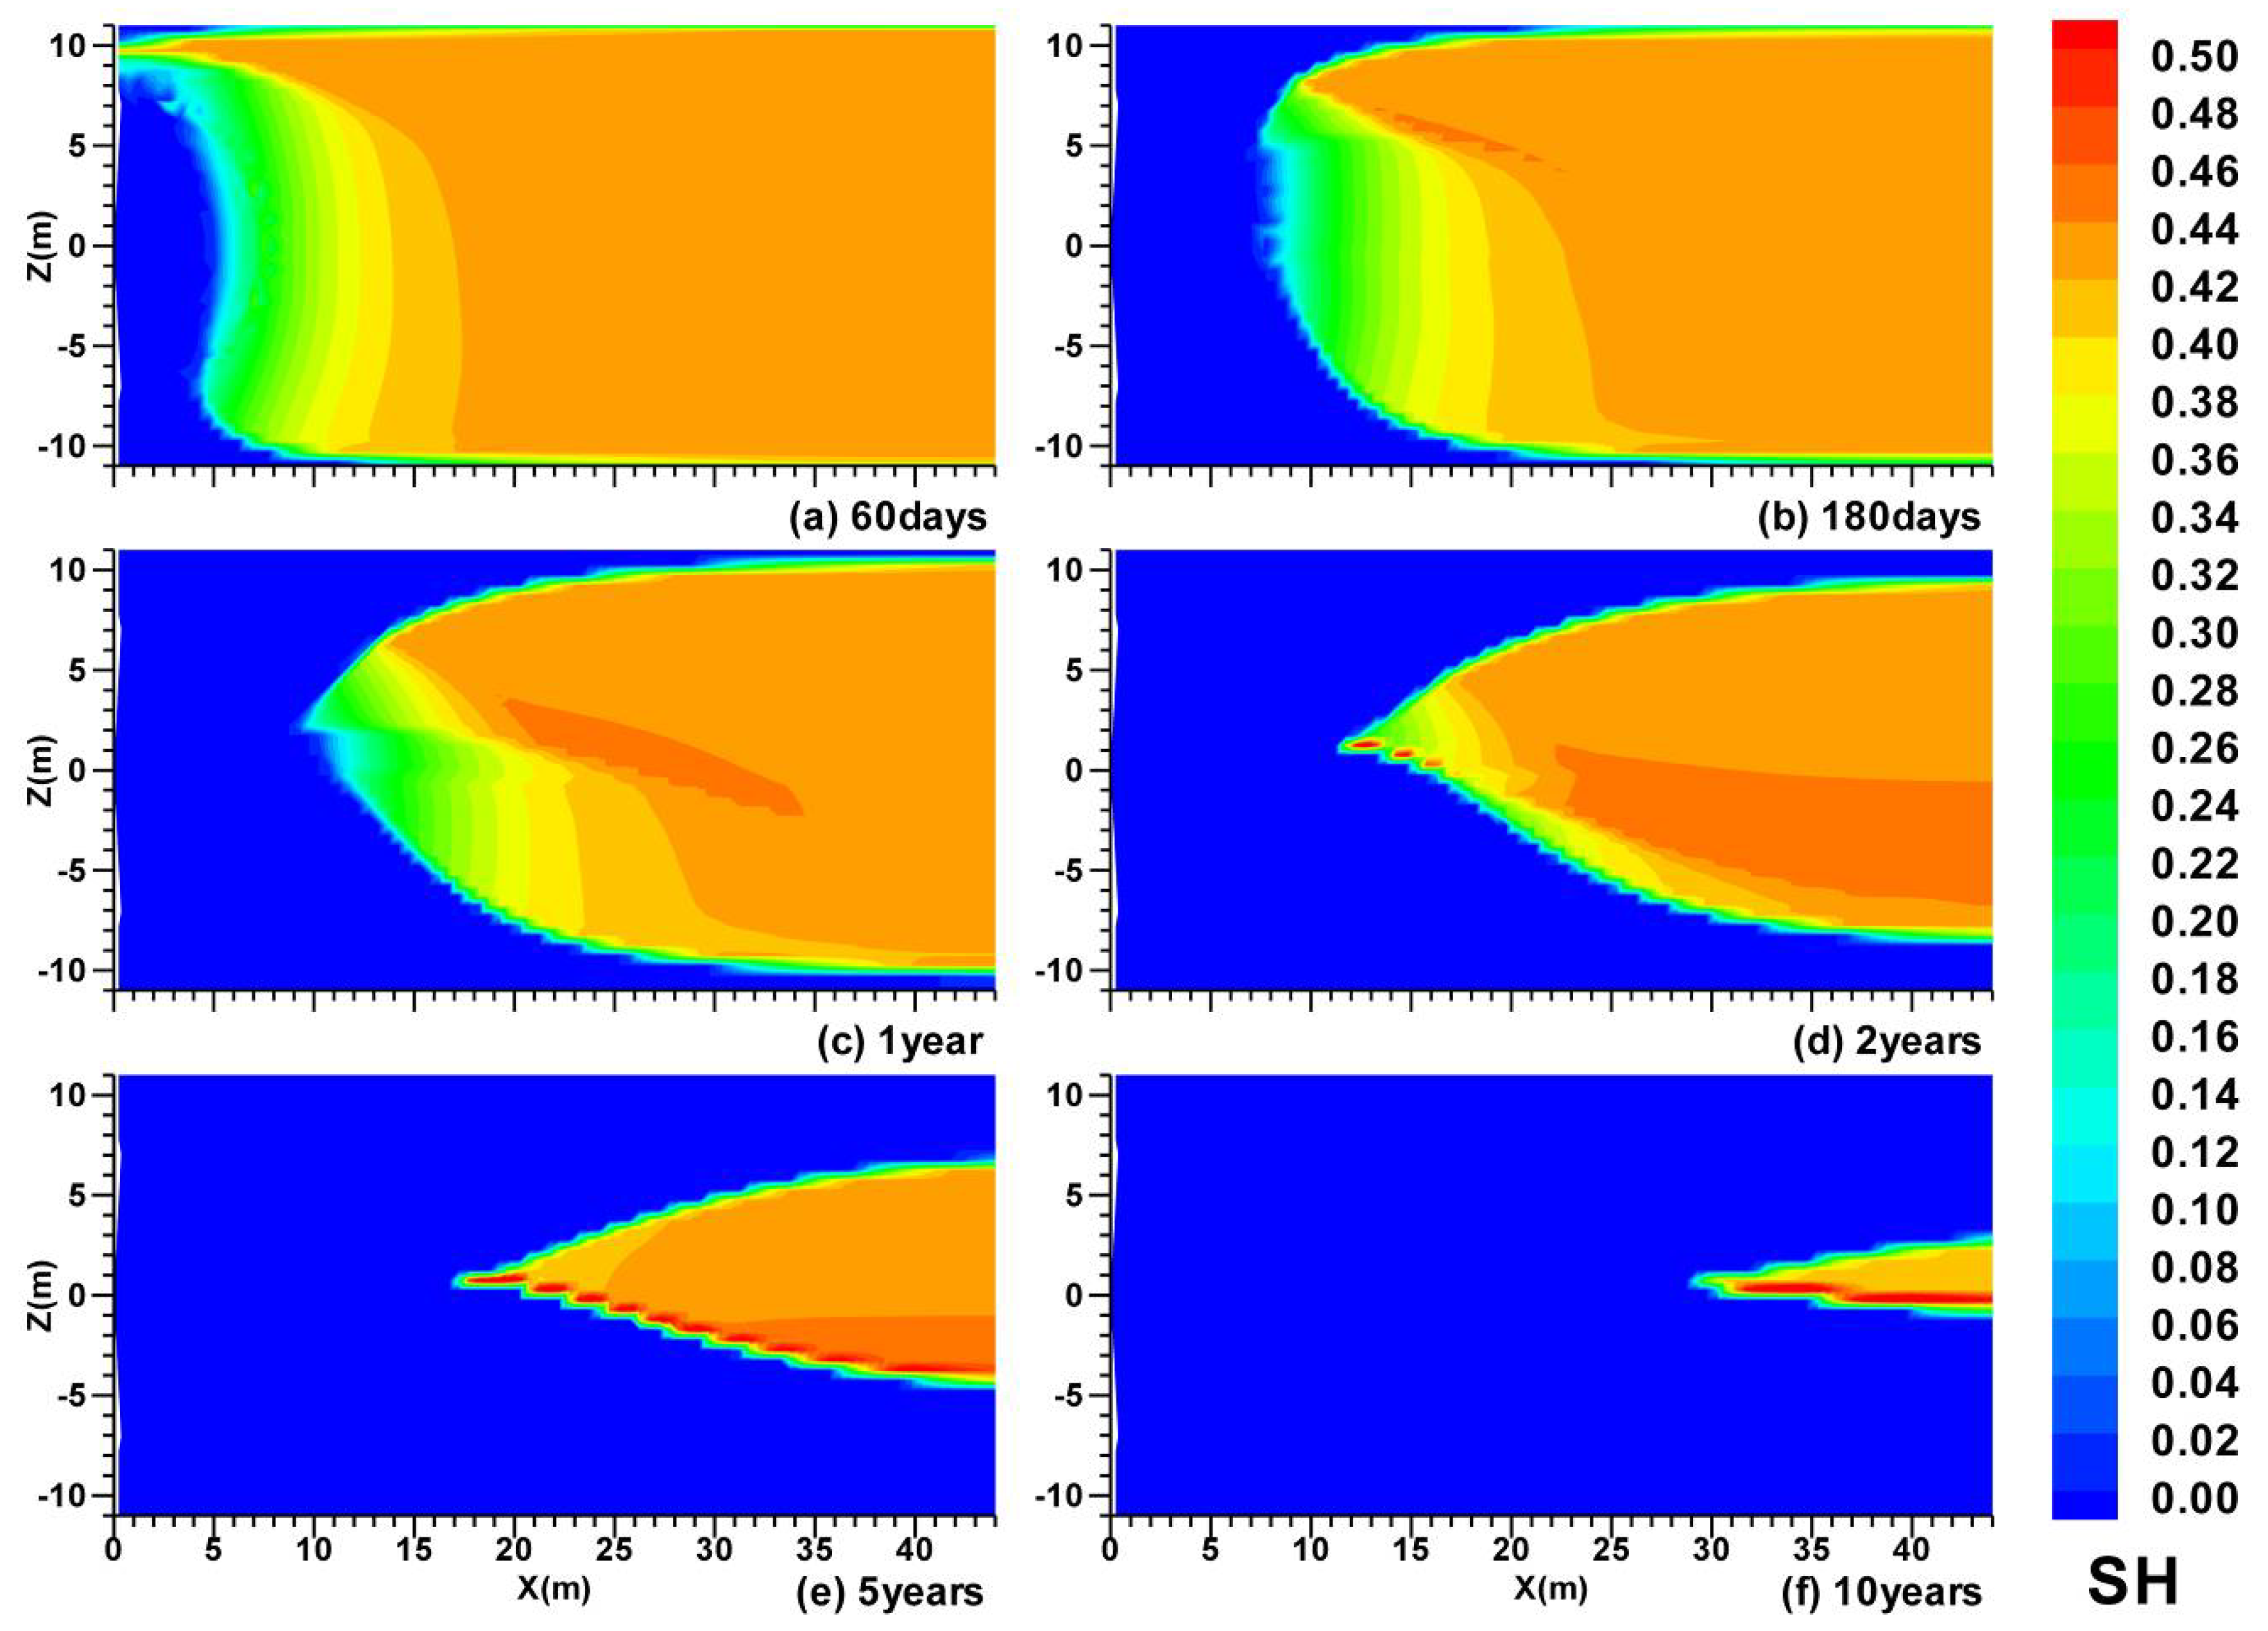
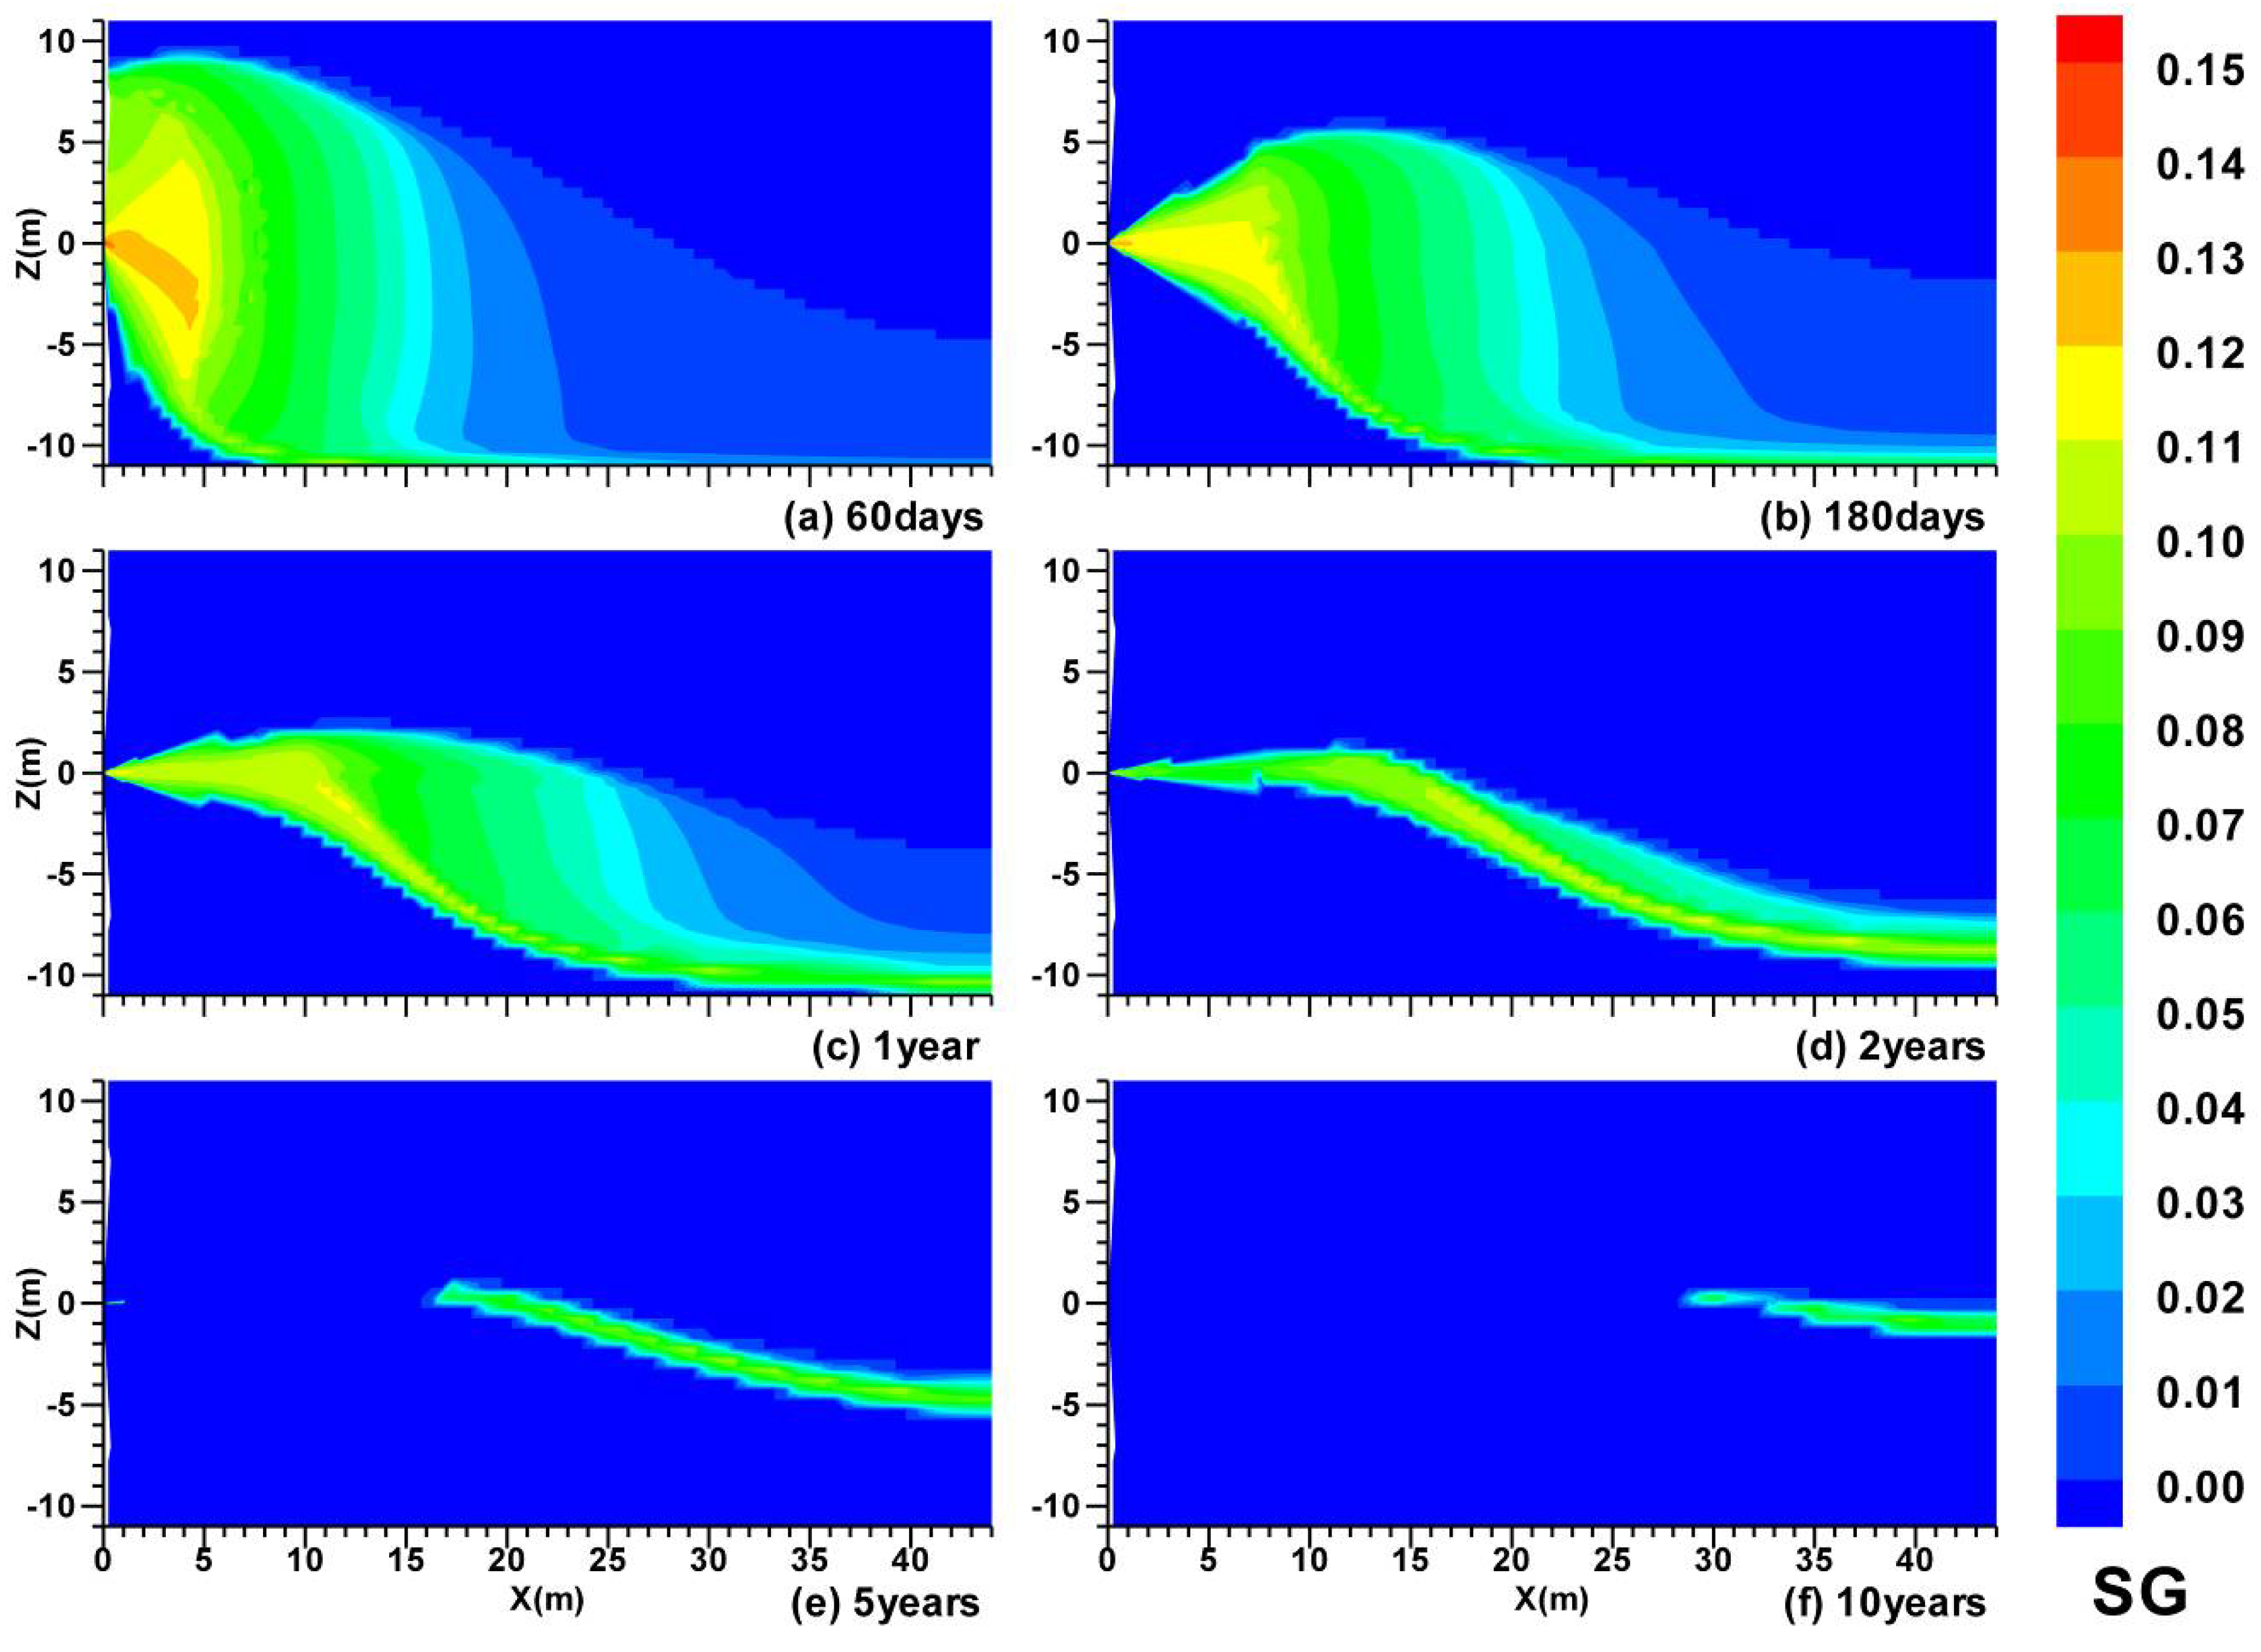
3.1. Spatial Distributions in Case (i)

In the Case (i), both of the OB and UB are permeable with kOB = kUB = 75 mD. Figure 4, Figure 5, Figure 6 and Figure 7 show the evolution of the distributions of the hydrate saturation SH, the gas saturation SG, the temperature T and the pressure P over time in the Case (i). White lines in Figure 7 indicate the initial position of the top and base of the HBL at z = 11 m and z = −11 m, respectively. The time points (a–f) in Figure 4, Figure 5, Figure 6 and Figure 7 are t = 60 days, 180 days, 1 year, 2 years, 5 years and 10 years, respectively. Comparison of the spatial distributions of 10 years to the initial HBL provides a measure of the hydrate dissociation profile.
Figure 4. Evolution of spatial distribution of SH with permeable boundaries (OB and UB) in Case (i).
Energies 06 04078 g004
Figure 4 and Figure 5 show the evolution of the SH and SG spatial distributions over time in the HBL. The figures show: (a) the evolution of the hydrate dissociation interface around the well, the upper and the lower dissociation interfaces; (b) fast hydrate dissociation rate in the vicinity of the above interfaces; (c) the evolution of the high-SH region (secondary hydrate formation) immediately above the lower dissociation front; (d) the accumulation of gas in the vicinity of the well around the hydrate dissociation interface near the well in the early stage, and then below the lower dissociation interface during the later period. Comparing with the reference case with ∆PW = 0.20 P0 in the previous study [10], the Case (i) with larger driving force ∆PW = 0.78 P0 shows some different characteristics: (a) as shown in Figure 4a, the mergence of the lower dissociation interface, the cylindrical interface around the well and the upper dissociation interface occur within approximately t = 60 days in the Case (i); (b) as shown in Figure 4, the hydrate dissociation rate is much higher and almost all the hydrate in the initial HBL are dissociated within 10 years in Case (i), while in the previous reference case, there is still a lot of hydrate undissociated in the HBL after 30 years; (c) as shown in Figure 5, the gas saturation SG, with a maximum of approximately 0.14, is higher in the Case (i) than that in the previous reference case [10] (SGmax is approximately 0.10), which is caused by the higher hydrate dissocation rate and the more gas released from the hydrate.
Figure 5. Evolution of spatial distribution of SG with permeable boundaries (OB and UB) in Case (i).
Energies 06 04078 g005
As shown in Figure 6, a low-T zone (defined as the zone with T < 12.0 °C) in Figure 6a–e occurs in the vicinity of the cylindrical interface around the well and the upper dissociation interface (Figure 4), which indicates the cooling effects of the endothermic hydrate dissociation reaction. The low-T zone shrinks in Figure 6e,f because of the encroachment by warmer water flooding from the overburden (where there is an inversion of the geothermal gradient, as a result of dissociation-induced cooling in the HBL). The warmer water rising from the UB is clearly depicted by the spatial distribution of T in the vicinity of the lower dissociation interface (Figure 4). All fluids with different source, including the original free water in the HBL, the gas and water released from hydrate dissociation, the water from the overburden, and the warmer water rising from the underburden, converge toward the production well.
Figure 7 shows: (a) the evolution of the pressure gradient around the well over time; (b) the pressure drop in the overburden and underburden; (c) the jagged P distribution and the inflexions near the interface of the dissociated and undissociated zone in the HBL. Of those, (a) and (b) are results of the characteristic of the permeabilities of the HBL and the boundaries, and (c) is a result of the fluid flow caused by gas and water dissociated from the hydrate.
Figure 6. Evolution of spatial distribution of T with permeable boundaries (OB and UB) in Case (i).
Energies 06 04078 g006
Figure 7. Evolution of spatial distribution of P with permeable boundaries (OB and UB) in Case (i).
Energies 06 04078 g007

3.2. Spatial Distributions in Case (ii)

In the Case (ii), the top boundary OB is impermeable with kOB = 0 mD, and the bottom boundary UB is permeable with kUB = 75 mD. The HBL in the Case (ii) is a semi-open system. Figure 8 shows the evolution of the SH distribution over time in the Case (ii). The time points (a–f) in Figures 8 are t = 60 days, 180 days, 1 year, 555 days, 2 years and 5 years, respectively.
Figure 8. Evolution of spatial distribution of SH with impermeable OB and permeable UB in Case (ii).
Energies 06 04078 g008
Under the same depressurization driving force (∆PW = 0.78 P0), there is no fluid flow from the OB to the HBL in the Case (ii) with impermeable OB (kOB = 0 mD), which causes the enhancement of the depressurization effect. The hydrate dissociation rate in the Case (ii) is much higher than that in the Case (i), and almost all the hydrate in the initial HBL is dissociated within 5 years Figure 8f, which is much earlier than that Figure 4f in the Case (i). Furthermore, under the more effective depressurization, the hydrate dissociation occurs all over the HBL simultaneously and the SH decreases in the entire HBL in the Case (ii) (Figure 8). Comparing the SH distributions at the same time points, such as the t = 60 days in Figure 4a and Figure 8a, the t = 2 years in Figure 4d and Figure 8e, and the t = 5 years in Figure 4e and Figure 8f, the above characteristic in Case (ii) is quite different from that in Case (i), in which most of the hydrate dissociation occurs in the vicinity of the dissociation interfaces, including the hydrate dissociation interface around the well, the upper and the lower dissociation interfaces. As shown in Figure 8a–d, the impermeability of the OB causes a “dead zone” of the fluid flow above the production well near the top of the initial HBL during the depressurization from the well, which has a negative effect on the formation and the evolution of the upper dissociation interface. The mergence of the hydrate dissociation interface around the well, as well as the upper and the lower dissociation interfaces, is much later than that in the Case (i) with the permeable OB (Figure 4).

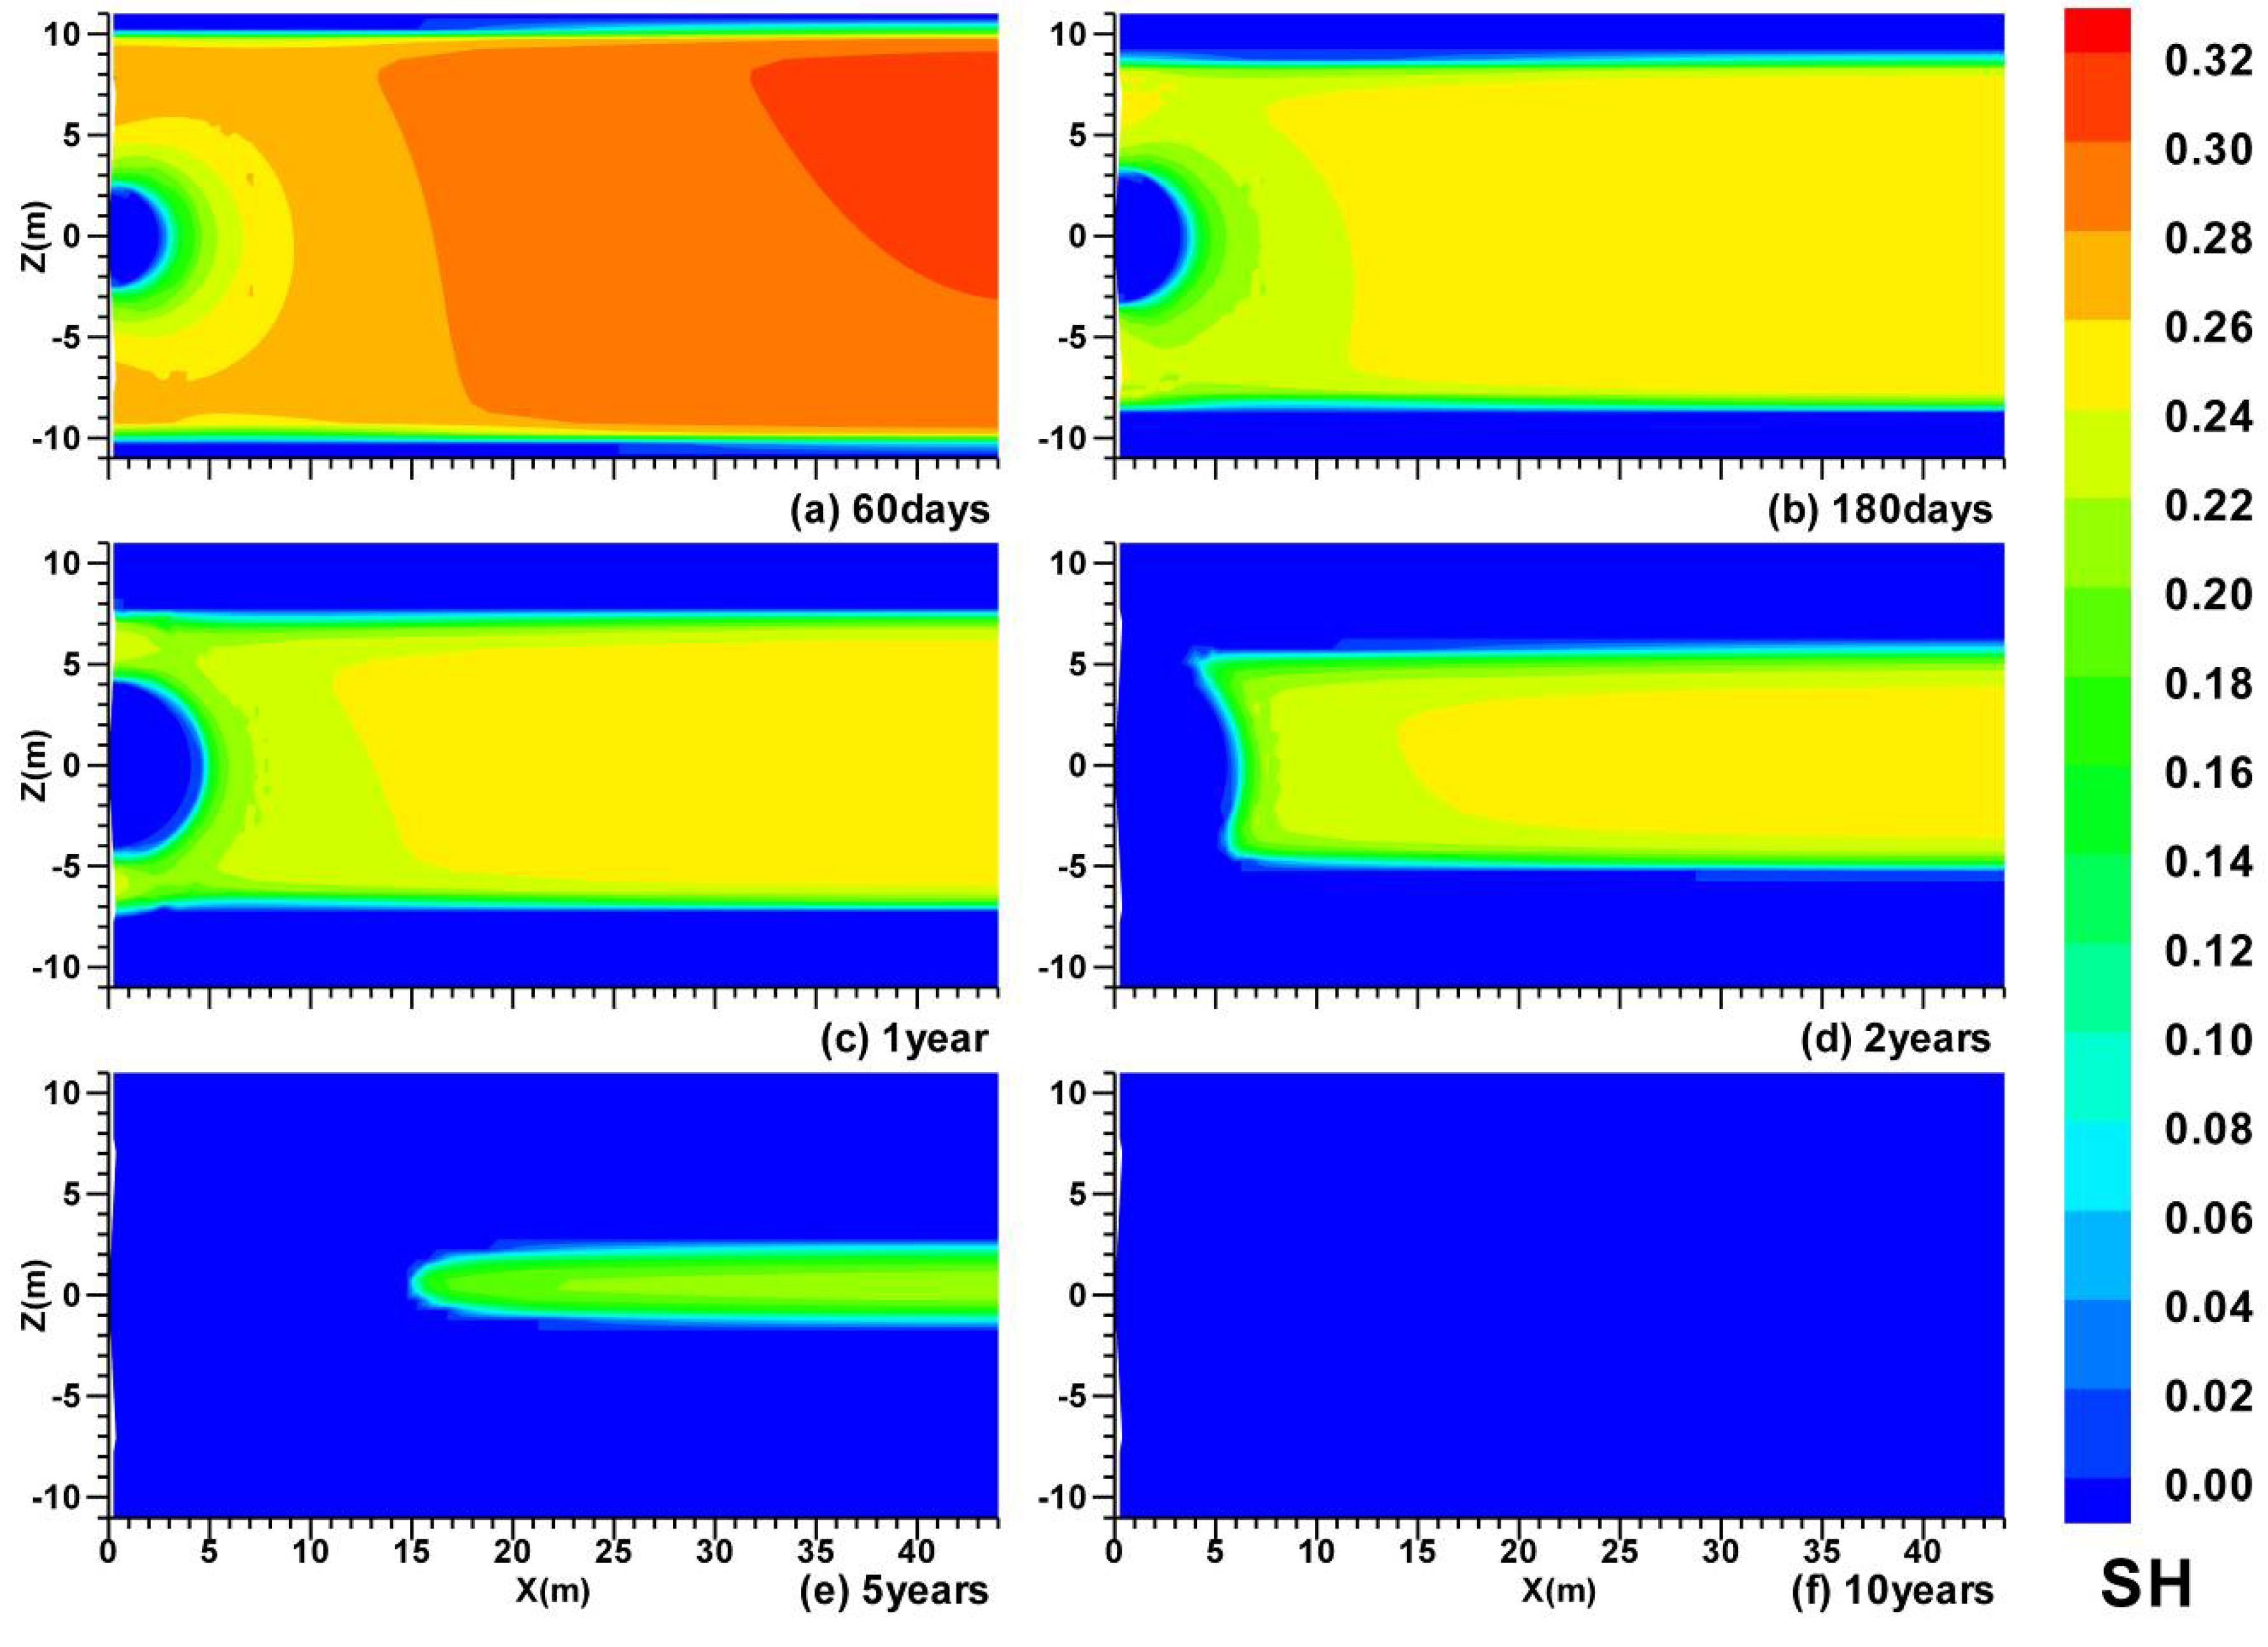
3.3. Spatial Distributions in Case (iii)

In Case (iii), both of the top and bottom boundaries OB and UB are impermeable with kOB = kUB = 0 mD. Figure 9 shows the evolution of the SH distribution over time in Case (iii). The time points (a–f) in Figures 9 are t = 60 days, 180 days, 1 year, 2 years, 5 years and 10 years, respectively. Because of symmetry of the well and a no-flow boundary (of fluids and heat) applied at x = 45 m (indicating a well spacing of 90 m), the HBL is a closed system with impermeable upper and lower boundaries (OB and UB) before gas production from hydrate.
Figure 9. Evolution of spatial distribution of SH with impermeable boundaries (OB and UB) in Case (iii).
Energies 06 04078 g009
Figure 9 shows the cylindrical hydrate dissociation interface around the well, the upper and the lower dissociation interfaces near the top and the bottom of the HBL, and the mergence of these interfaces. One of the special characteristics of the SH distribution is that both of the upper and the lower dissociation interfaces are almost horizontal during the entire production process. The reason for this is that the thermodynamic conditions (P and T) along these interfaces are always constant. In a closed system of the initial HBL in Case (iii), the effect of the depressurization is much stronger than that in the open and semi-open system of Case (i) and Case (ii), and the SH is much lower in this case (Figure 9). Furthermore, the depressurization affects the entire HBL obviously and the SH decreases all over the HBL simultaneously (Figure 9), which indicates that the hydrate dissociation occurs in the entire HBL.

3.4. Gas and Water Production

Figure 10 shows the evolutions of the volumetric rates of CH4 production in the gas phase (QPG), the total gas production (QPT) at the well, and the gas released from the hydrate dissociation (QR). Figure 11 shows the evolution of the percentage of the hydrate dissociated in the entire simulated domain.
Figure 10. Effect of the permeability of the boundaries on QPT, QPG and QR.
Energies 06 04078 g010
Figure 11. Effect of the permeability of the boundaries on the percentage of hydrate dissociated.
Energies 06 04078 g011
As shown in Figure 10, in all three cases, QPT, QPG and QR decrease with the hydrate dissociation over time. In Case (i) (black line), QPT is much higher than both QPG and QR, which indicates that the source of the majority of the produced gas is CH4 dissolved in the water, rather than from the free gas phase. The percentage of hydrate dissociated is approximately 96% at t = 3650 days (black line in Figure 11), confirming the results of the existence of the hydrates undissociated in the deposit after 10 years of production shown in Figure 4f.
In Case (ii) (red line), an inflection point on the curve of the QPT, QPG and QR is observed at approximately t = 500 days (Figure 10), when the mergence of the upper and the lower dissociation interfaces occurs Figure 8d. This is caused by the hydrate dissociation between the upper and the lower dissociation interfaces, which connect the upper dissociated zone to the production well, (the undissociated HBL with low keff plays an important role as a barrier to the downward movement of the gas and water dissociated from the hydrate along the bottom of the OB in the initial HBL). As shown in Figure 8f, there is little hydrate undissociated in the deposit after five years of production, and the percentage of hydrate dissociated is more than 98% at t = 1825 days (red line in Figure 11). As shown in Figure 10, in Case (ii) (red line), after about t = 2200 days, QPT decreases to approximately 12.0 ST m3/day/m of well and then stays constant, and both QPG and QR decrease to a very low level (<0.01 ST m3/day/m of well), which indicates that the produced gas is from the CH4 dissolved in the water in the depsoit, rather than from the free gas phase, and that this time point is the end of the hydrate dissociation process. The corresponding hydrate dissociation percentage (red line in Figure 11) approaches 1.0, which indicates that almost all the hydrate in the deposit disappears at that time.
In Case (iii) (green line), QPT, QPG and QR almost coincide until about t = 2200 days (Figure 10), which indicates that the produced gas is CH4 released from hydrate dissociation and it is in the free gas phase, rather than the gas dissolved in the water. As shown in Figure 10, in Case (iii) (green line), after about t = 2200 days of production, QR decreases rapidly to lower than 0.01 ST m3/day/m of well, and almost all the hydrate in the deposit disappears at that time (the corresponding hydrate dissociation percentage approaches 1.0, green line in Figure 11). Meanwhile, QPT and QPG still coincide and decrease over time. As shown in Figure 10, in Case (iii), the cumulative average production rate of total gas Qavg is 31 ST m3/day/m of well at time t = 730 days (2 years, the duration of more than 80% of the hydrate in the deposit dissociated), and Qavg = 86 ST m3/day/m of well at t = 200 days. The maximum Qavg is 194 ST m3/day/m of well at t = 40 days. For a well spacing of 90 m and a horizontal well with the length of 1,000 m, Qavg is 6.20 × 10⁴ ST m3/day (2.18 MMSCFD) at t = 730 days, and 1.72 × 10⁵ ST m3/day (6.06 MMSCFD) at t = 200 days, and the maximum Qavg is as high as 3.88 × 10⁵ ST m3/day (13.67 MMSCFD) at t = 40 days. It is obvious that the large production potential of the hydrate deposits in Case (iii) satisfies the absolute criterion.
As shown in Figure 11, from t = 0 to 800 days, the green line is higher than the red line, indicating that the hydrate dissociation rate in Case (iii) is higher than that in Case (ii) at early times of the production process. The reason for this is the enhancement of the effect of the depressurization in Case (iii) with the upper and the lower impermeable boundaries. With the dissociation of the hydrate in the deposit, the amount of the hydrate undissociated decreases and the temperature of the HBL declines, causing the decrease of the slope of green line in Figure 11.
Figure 12 shows the corresponding water production rates QW and gas-to-water ratios RGW. In both Case (i) (black line) and Case (ii) (red line), the water production rates QW increase rapidly to more than 2.0 × 10⁴ kg/day/m of well after approximately t = 300 days, and the long-term RGW is prohibitively low (RGW < 10 ST m3 of CH4 /m3 of H2O). This indicates that the gas production from the deposits of both Case (i) and (ii) are not economically profitable from the relative criterion point of view. Furthermore, in these two cases, for a well spacing of 90 m and a horizontal well with the length of 1000 m, the water production rate is QW = 4.0 × 10⁷ kg/day (4.0 × 10⁴ ton/D), which is unmanageable.
Figure 12. Effect of the permeability of the boundaries on QW and RGW.
Energies 06 04078 g012
As shown in Figure 12, in Case (iii) (green line), both QW and RGW show quite different profiles: (1) QW decreases rapidly to lower than 30 kg/day/m of well after approximately t = 200 days. In this case, for a well spacing of 90 m and a horizontal well with the length of 1,000 m, the water production rate is only QW = 6.0 × 10⁴ kg/day (60 ton/D); (2) RGW increases to larger than 190 ST m3 of CH4/m3 of H2O after approximately t = 200 days, which indicates that the relative criterion is satisfied. In a word, it is obvious that the impermeable boundaries showthe best effects on the gas production potential of the hydrate deposits in terms of both the absolute and the relative evaluation criterion.

4. Summary and Conclusions

In this study, we investigated the effects of the permeabilities of OB and UB on the gas production potential from marine gas hydrate deposits at the SH7 site, in the Shenhu Area of the South China Sea. From the numerical simulation results, the following conclusions are drawn:
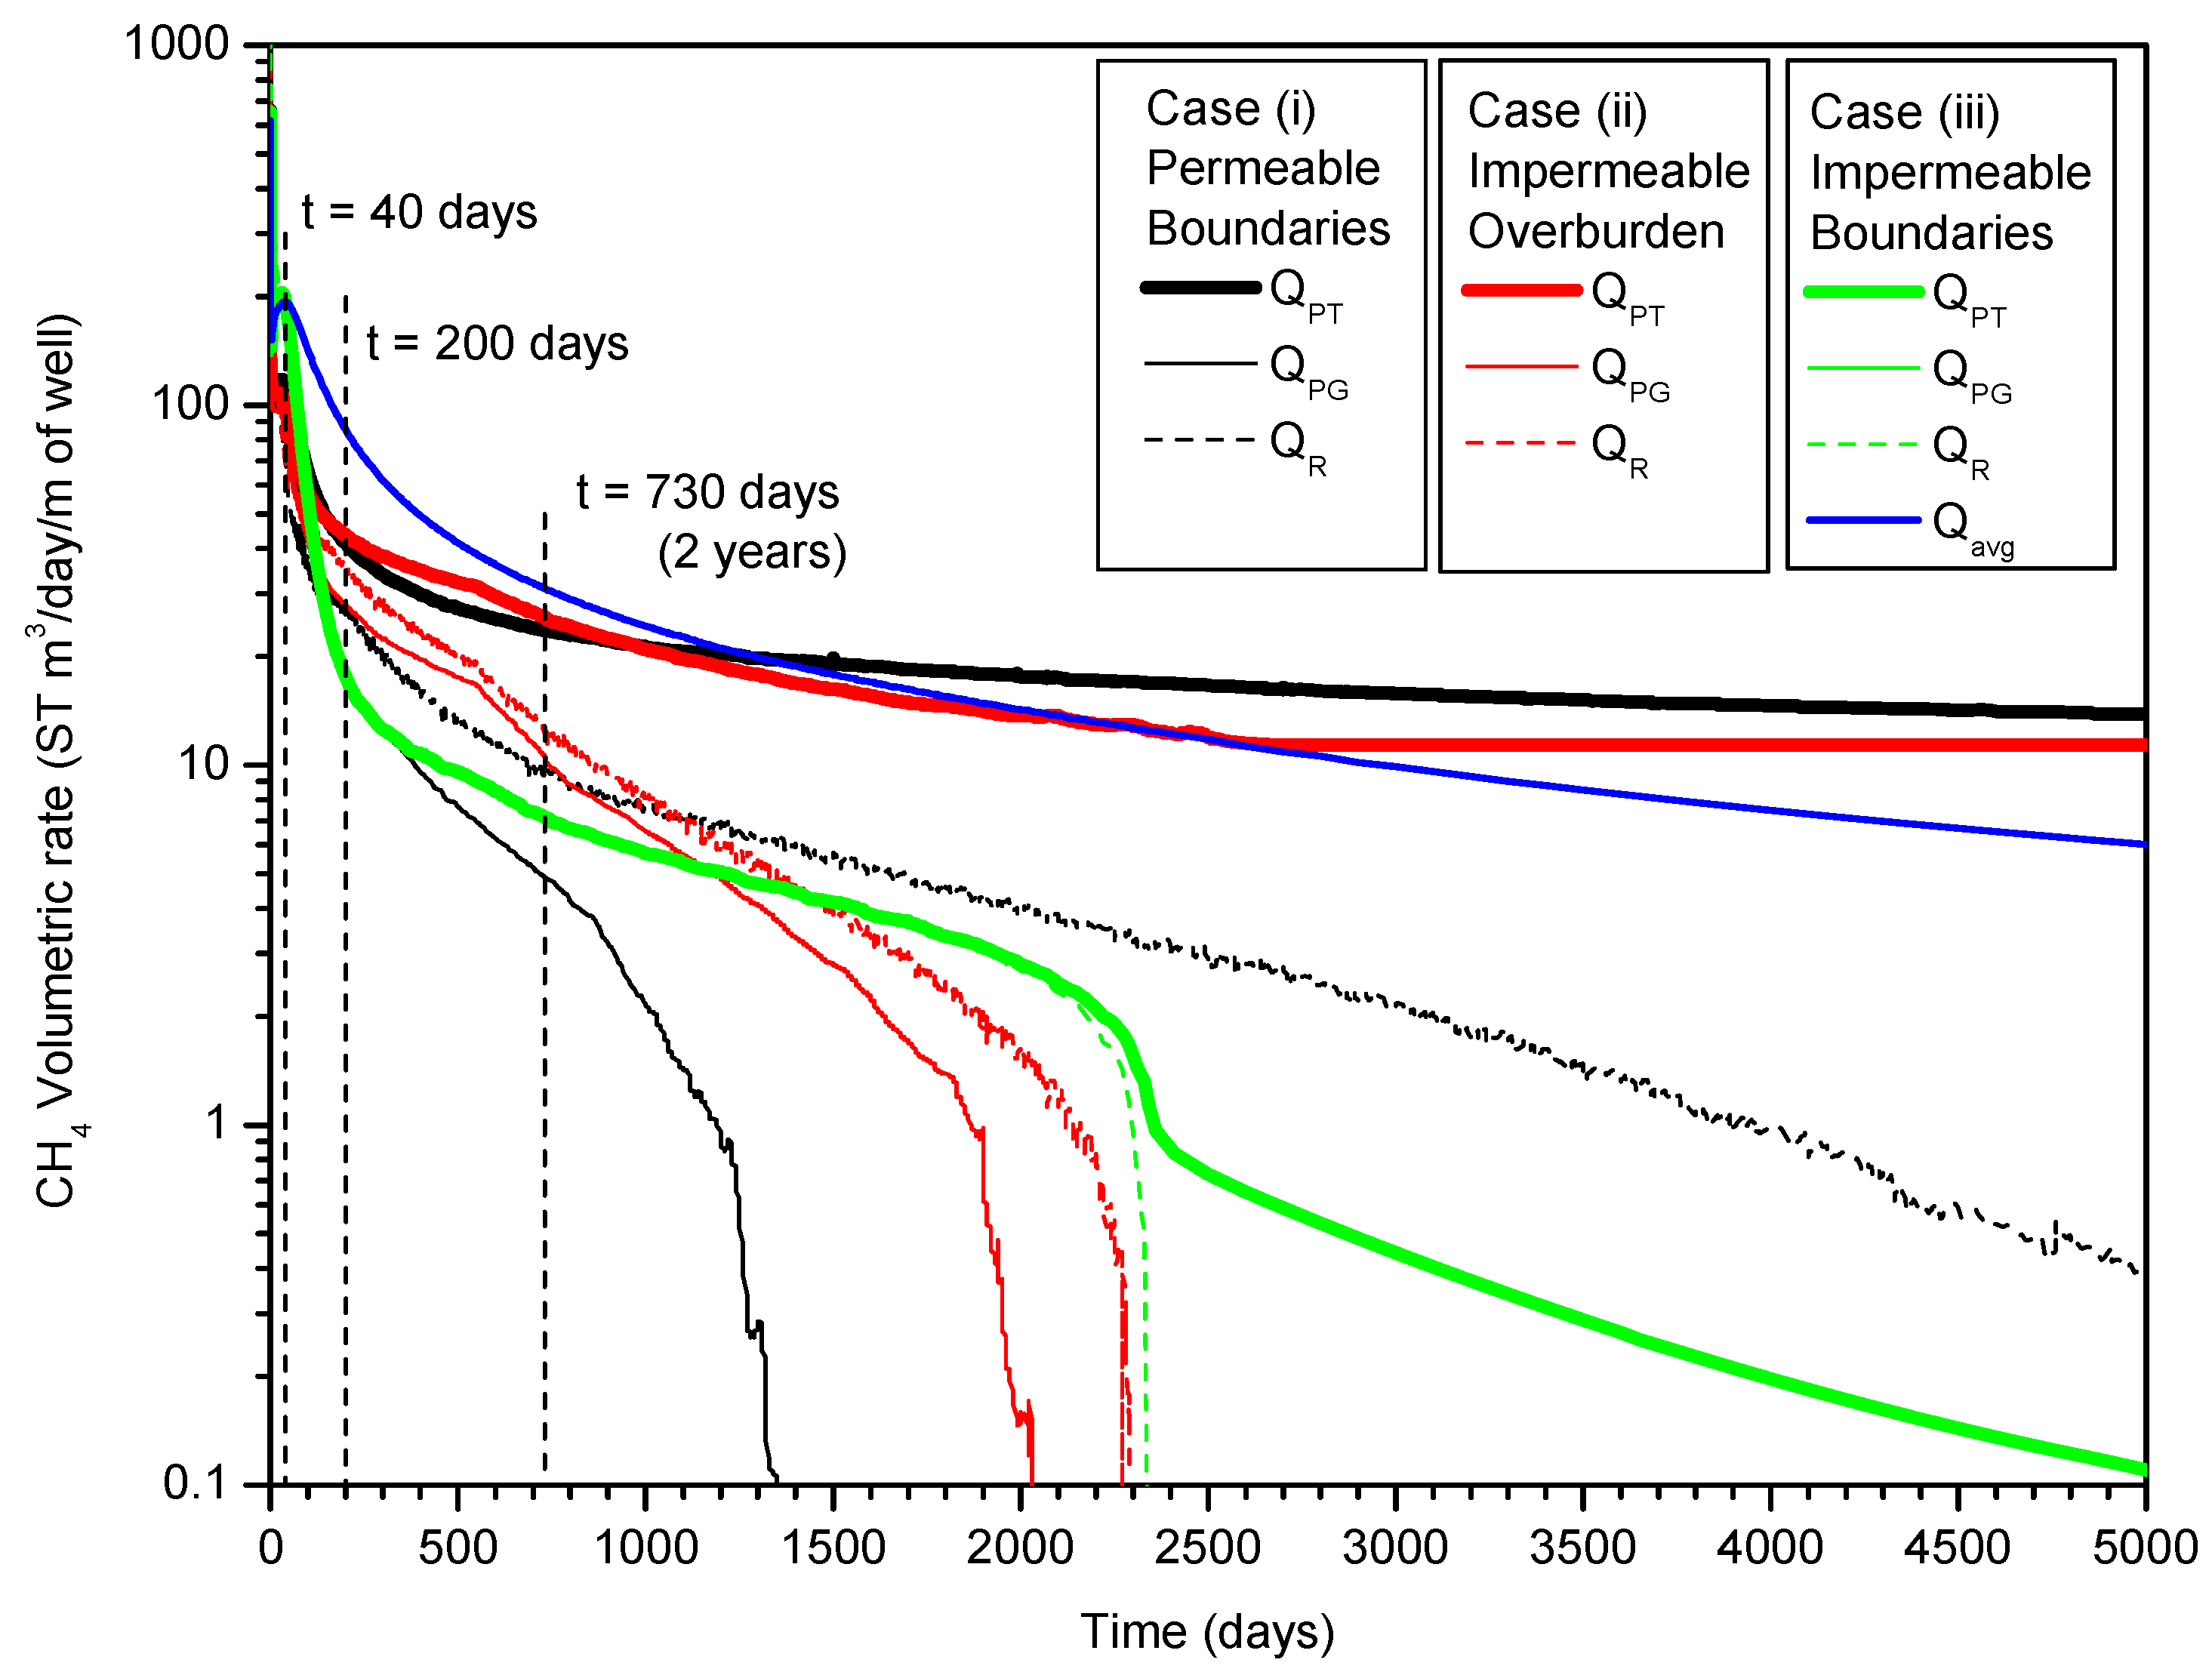
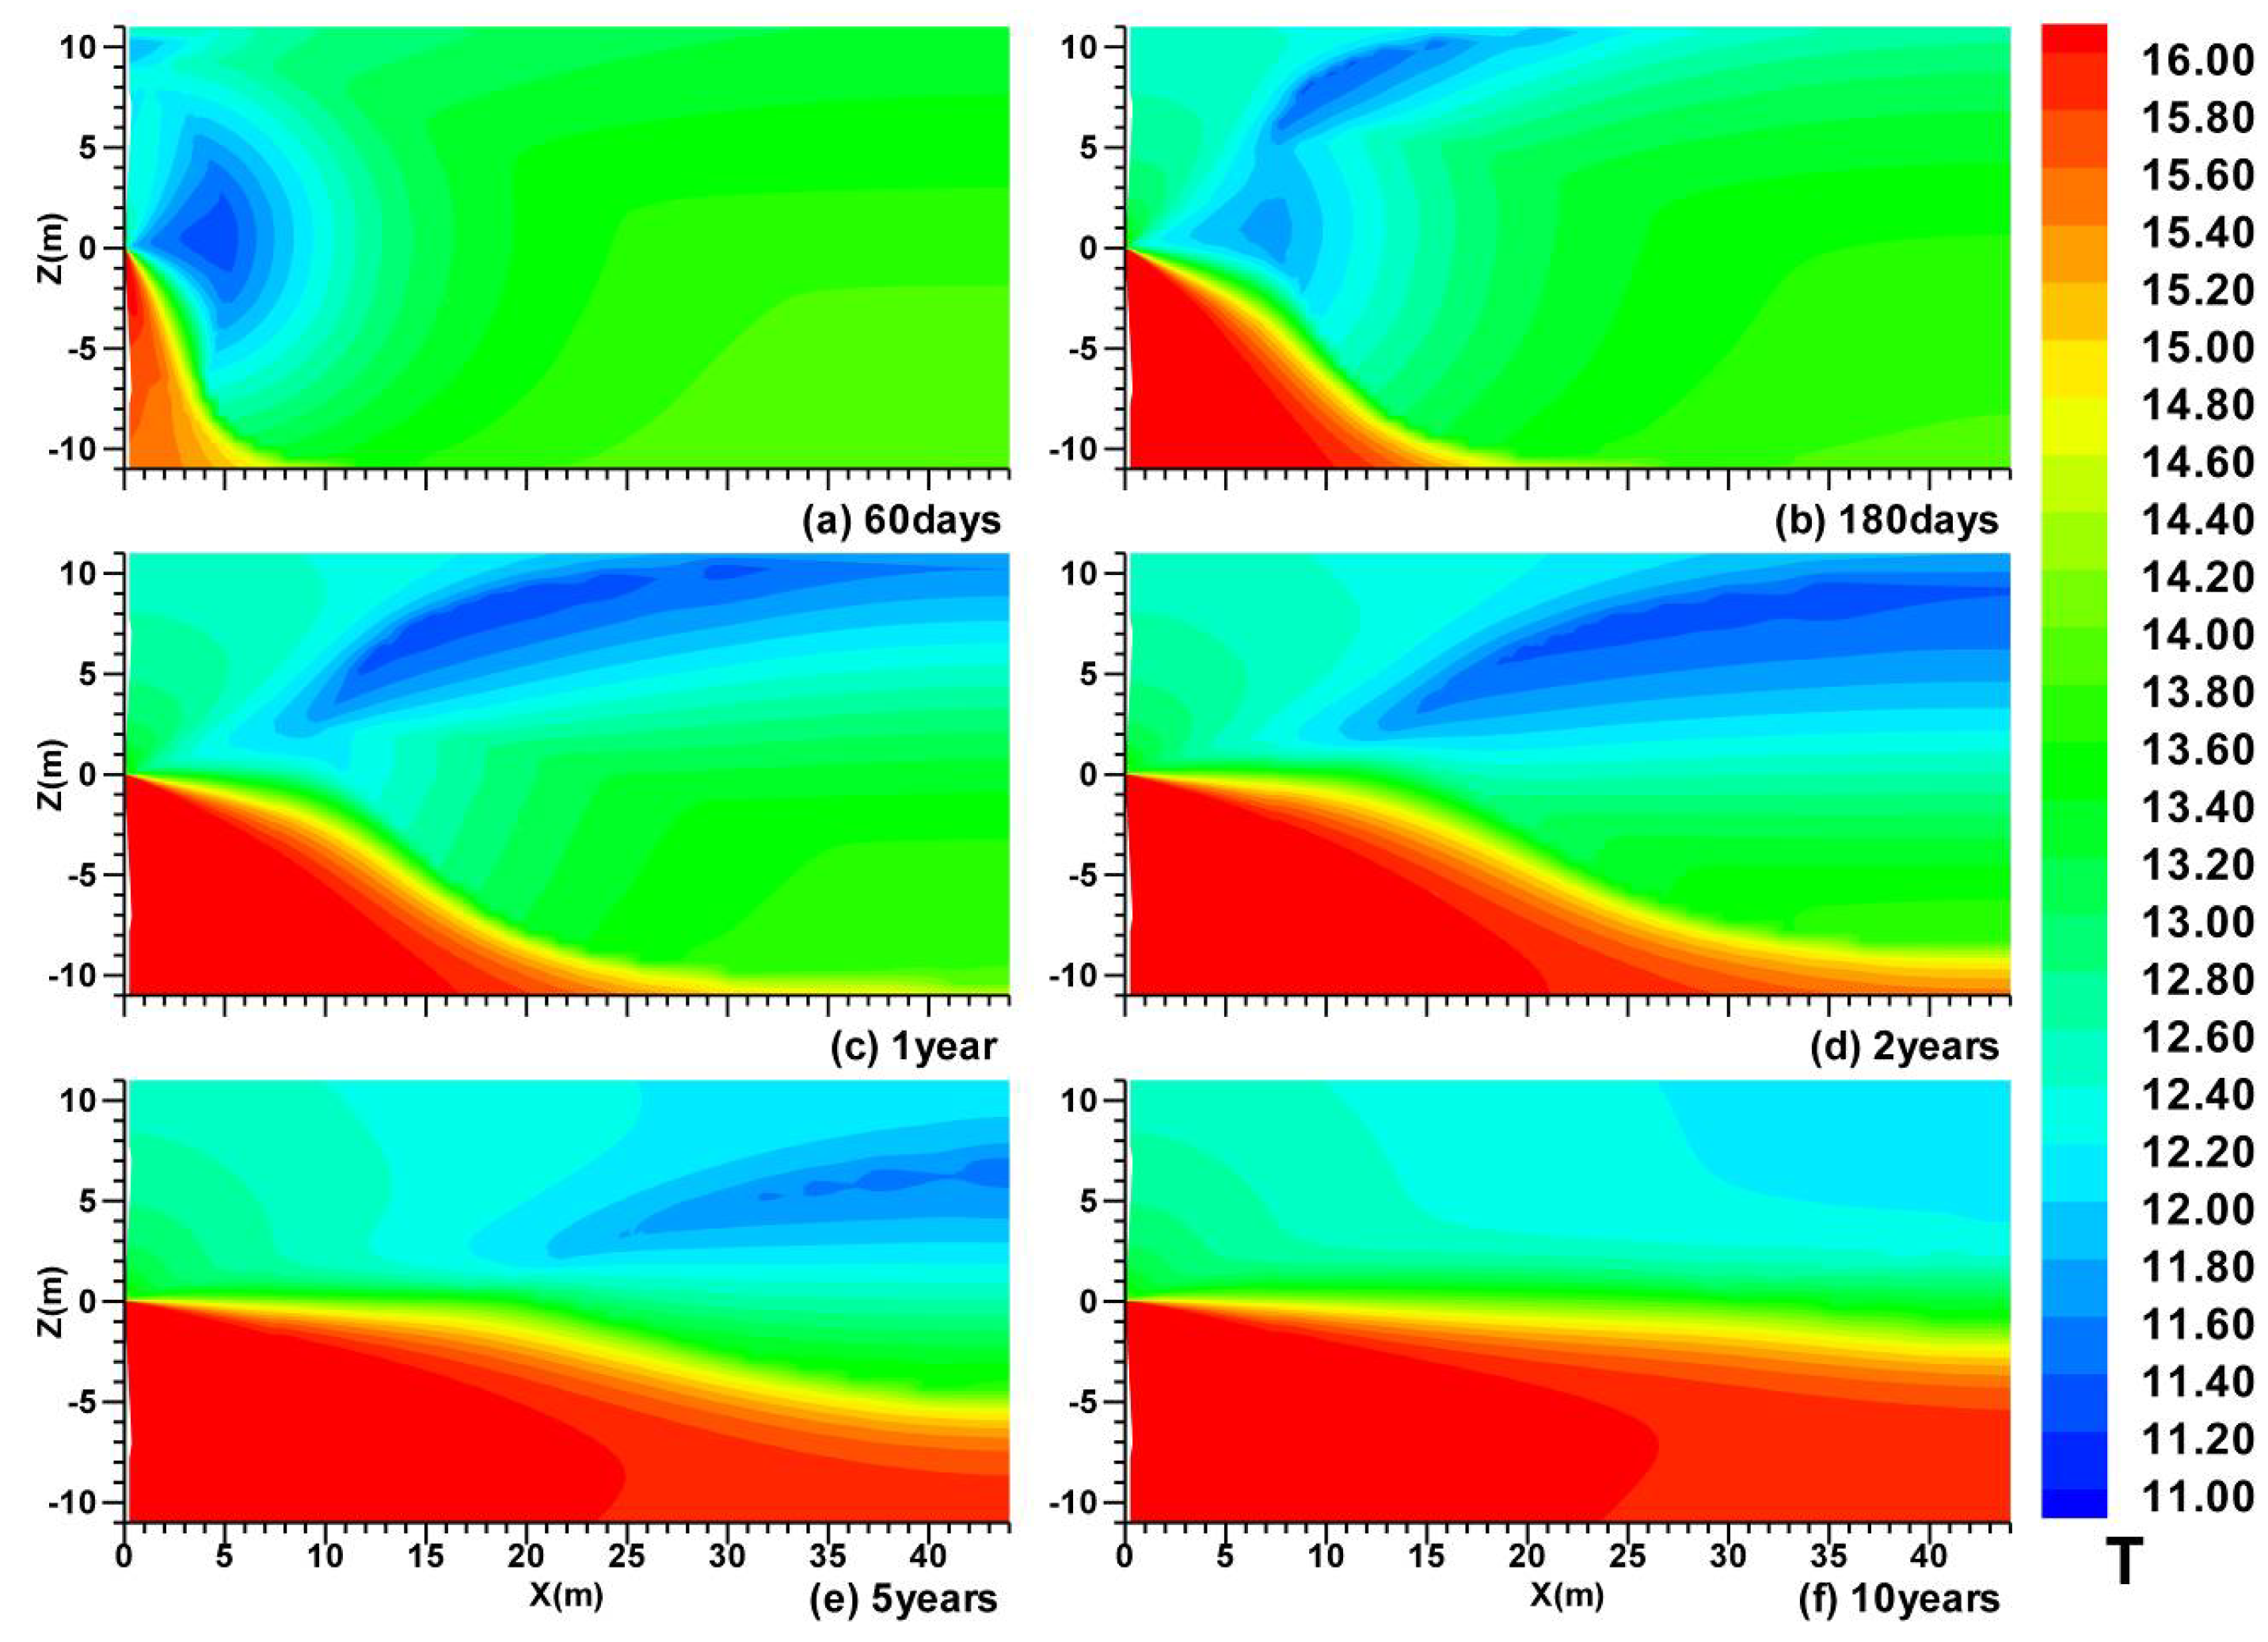
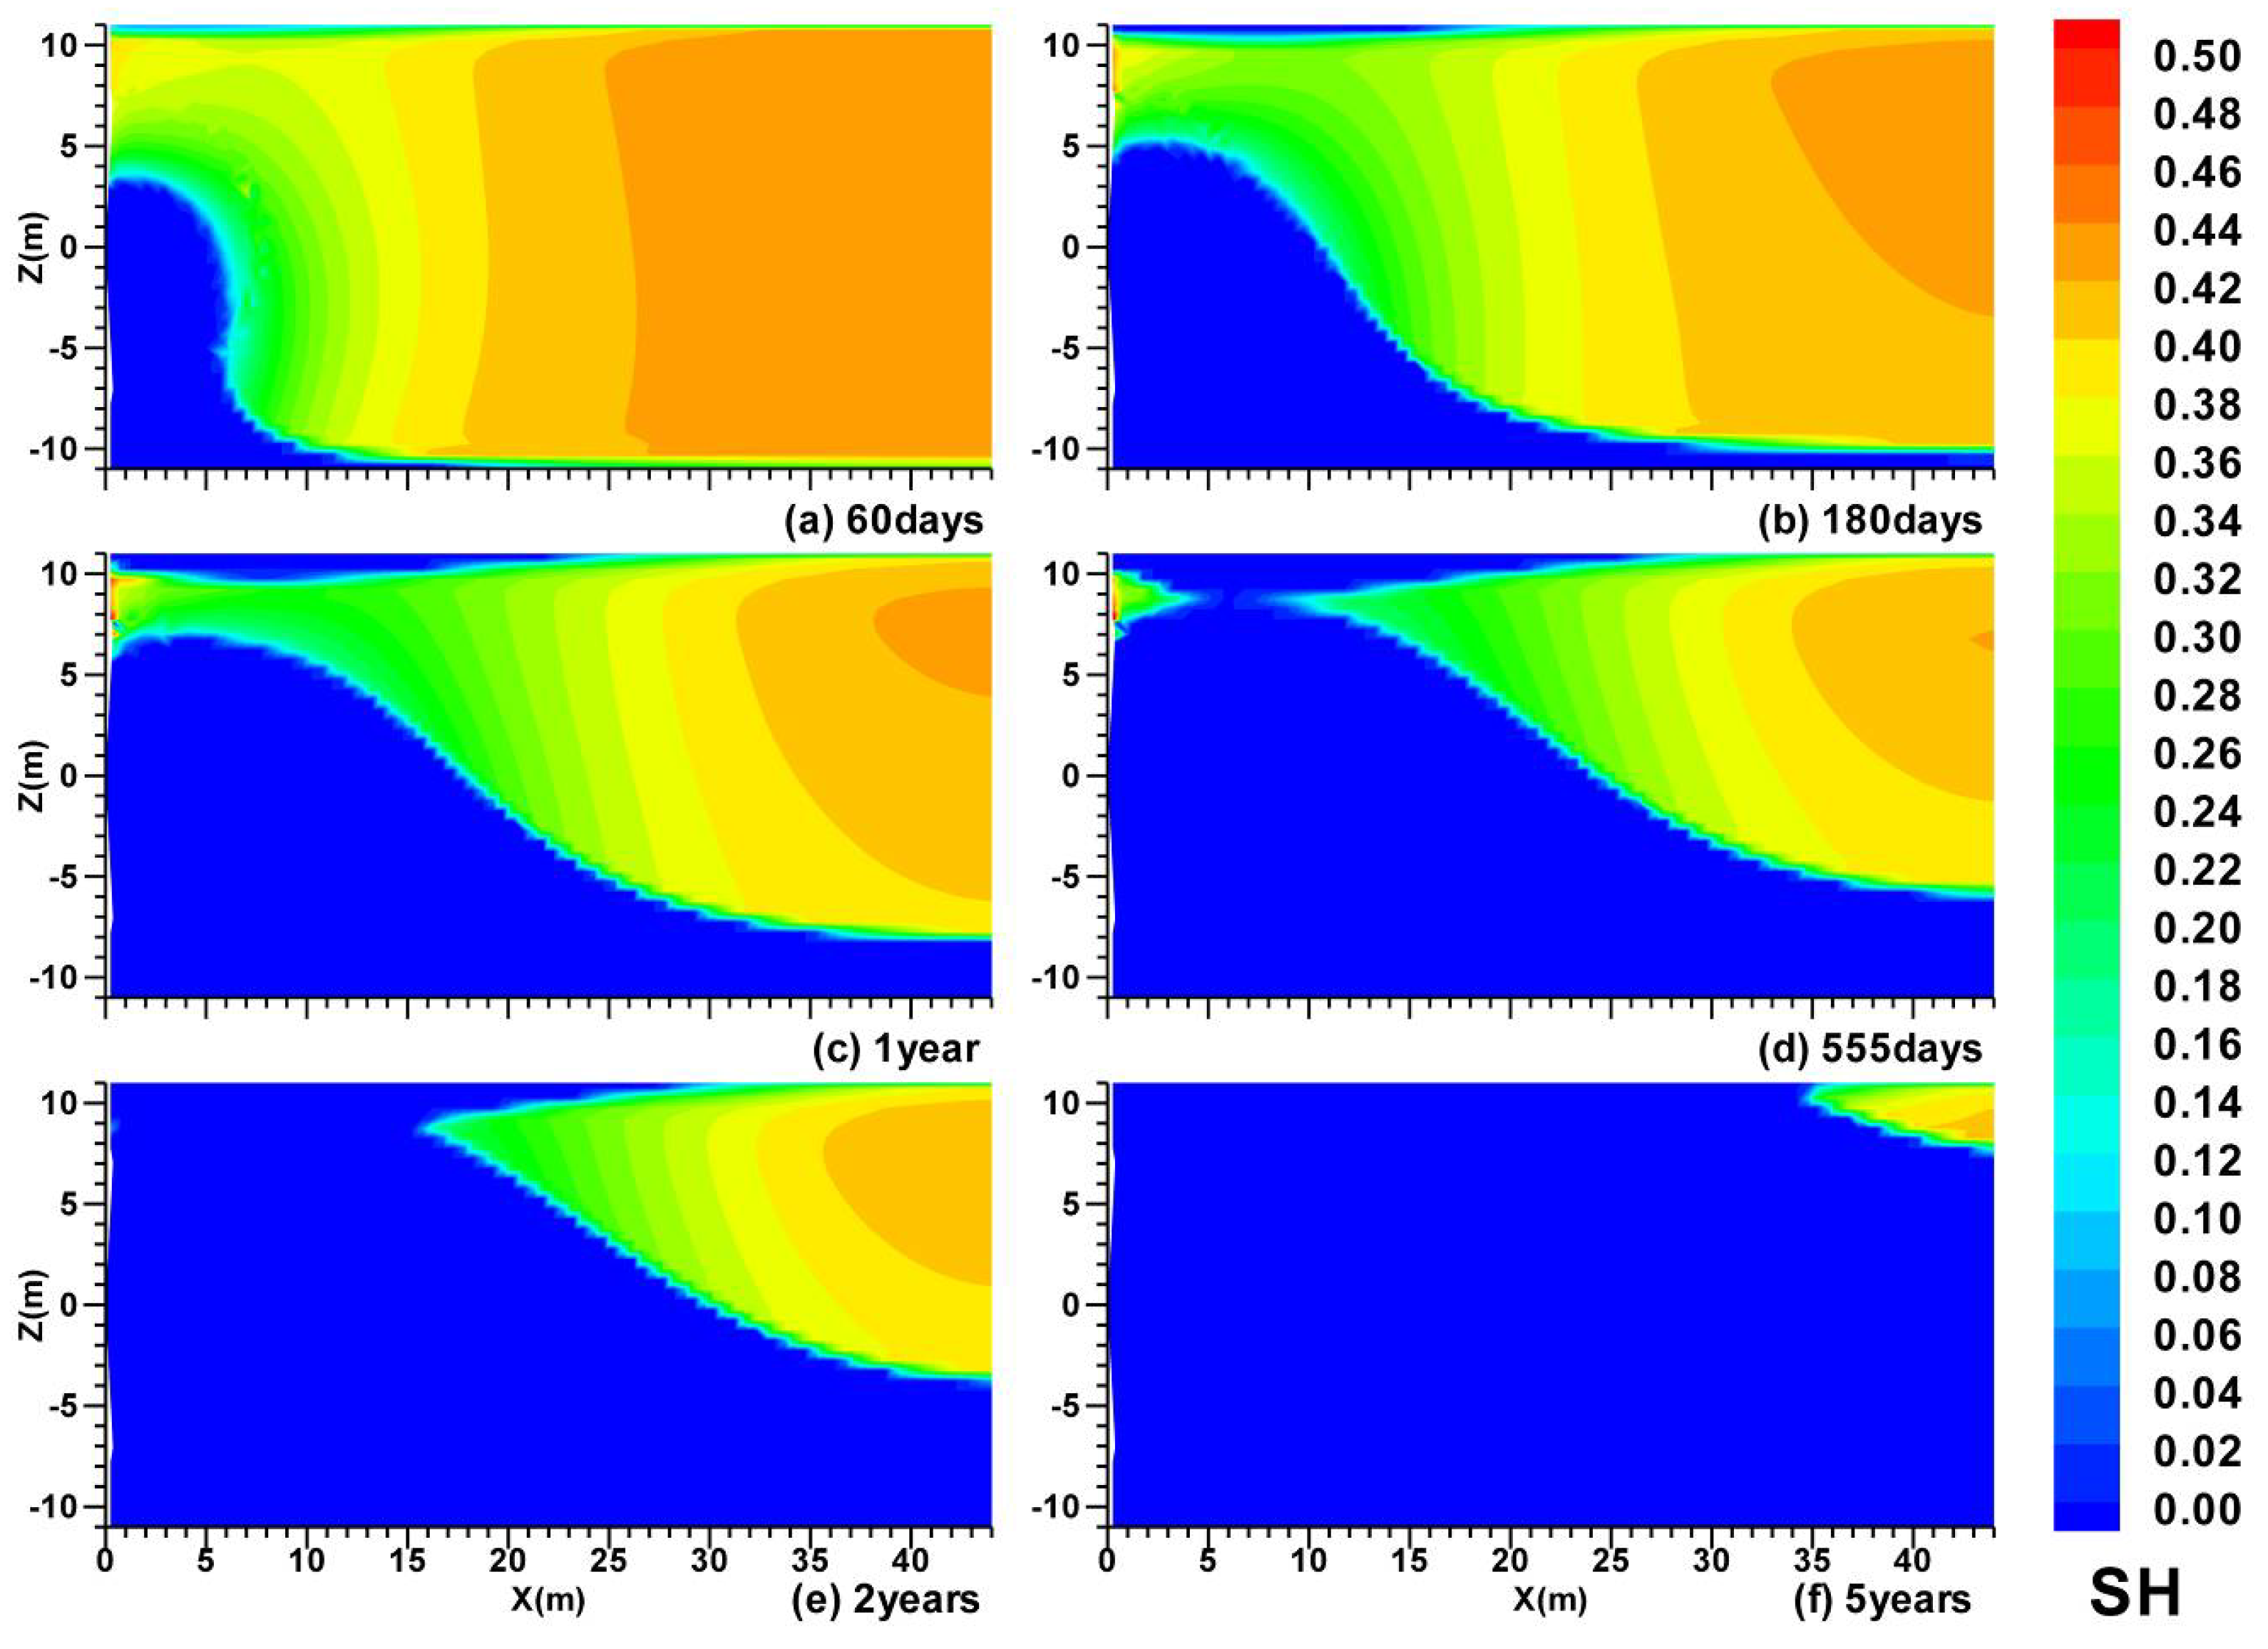
  • In Case (i) with permeable upper and lower boundaries, the dissociation is characterized by the following features: the evolution of the hydrate dissociation interface around the well, the upper and the lower dissociation interfaces, the evolution of the secondary hydrate, and the accumulation of gas in the vicinity of the well and below the lower dissociation interface. The relative warmer water rises from the UB and is produced from the well;
  • In Case (ii) with an impermeable upper boundary (OB) and permeable lower boundary (UB), with the enhancement of the effect of the depressurization in the semi-open system, the hydrate dissociation rate is much higher than that in Case (i);
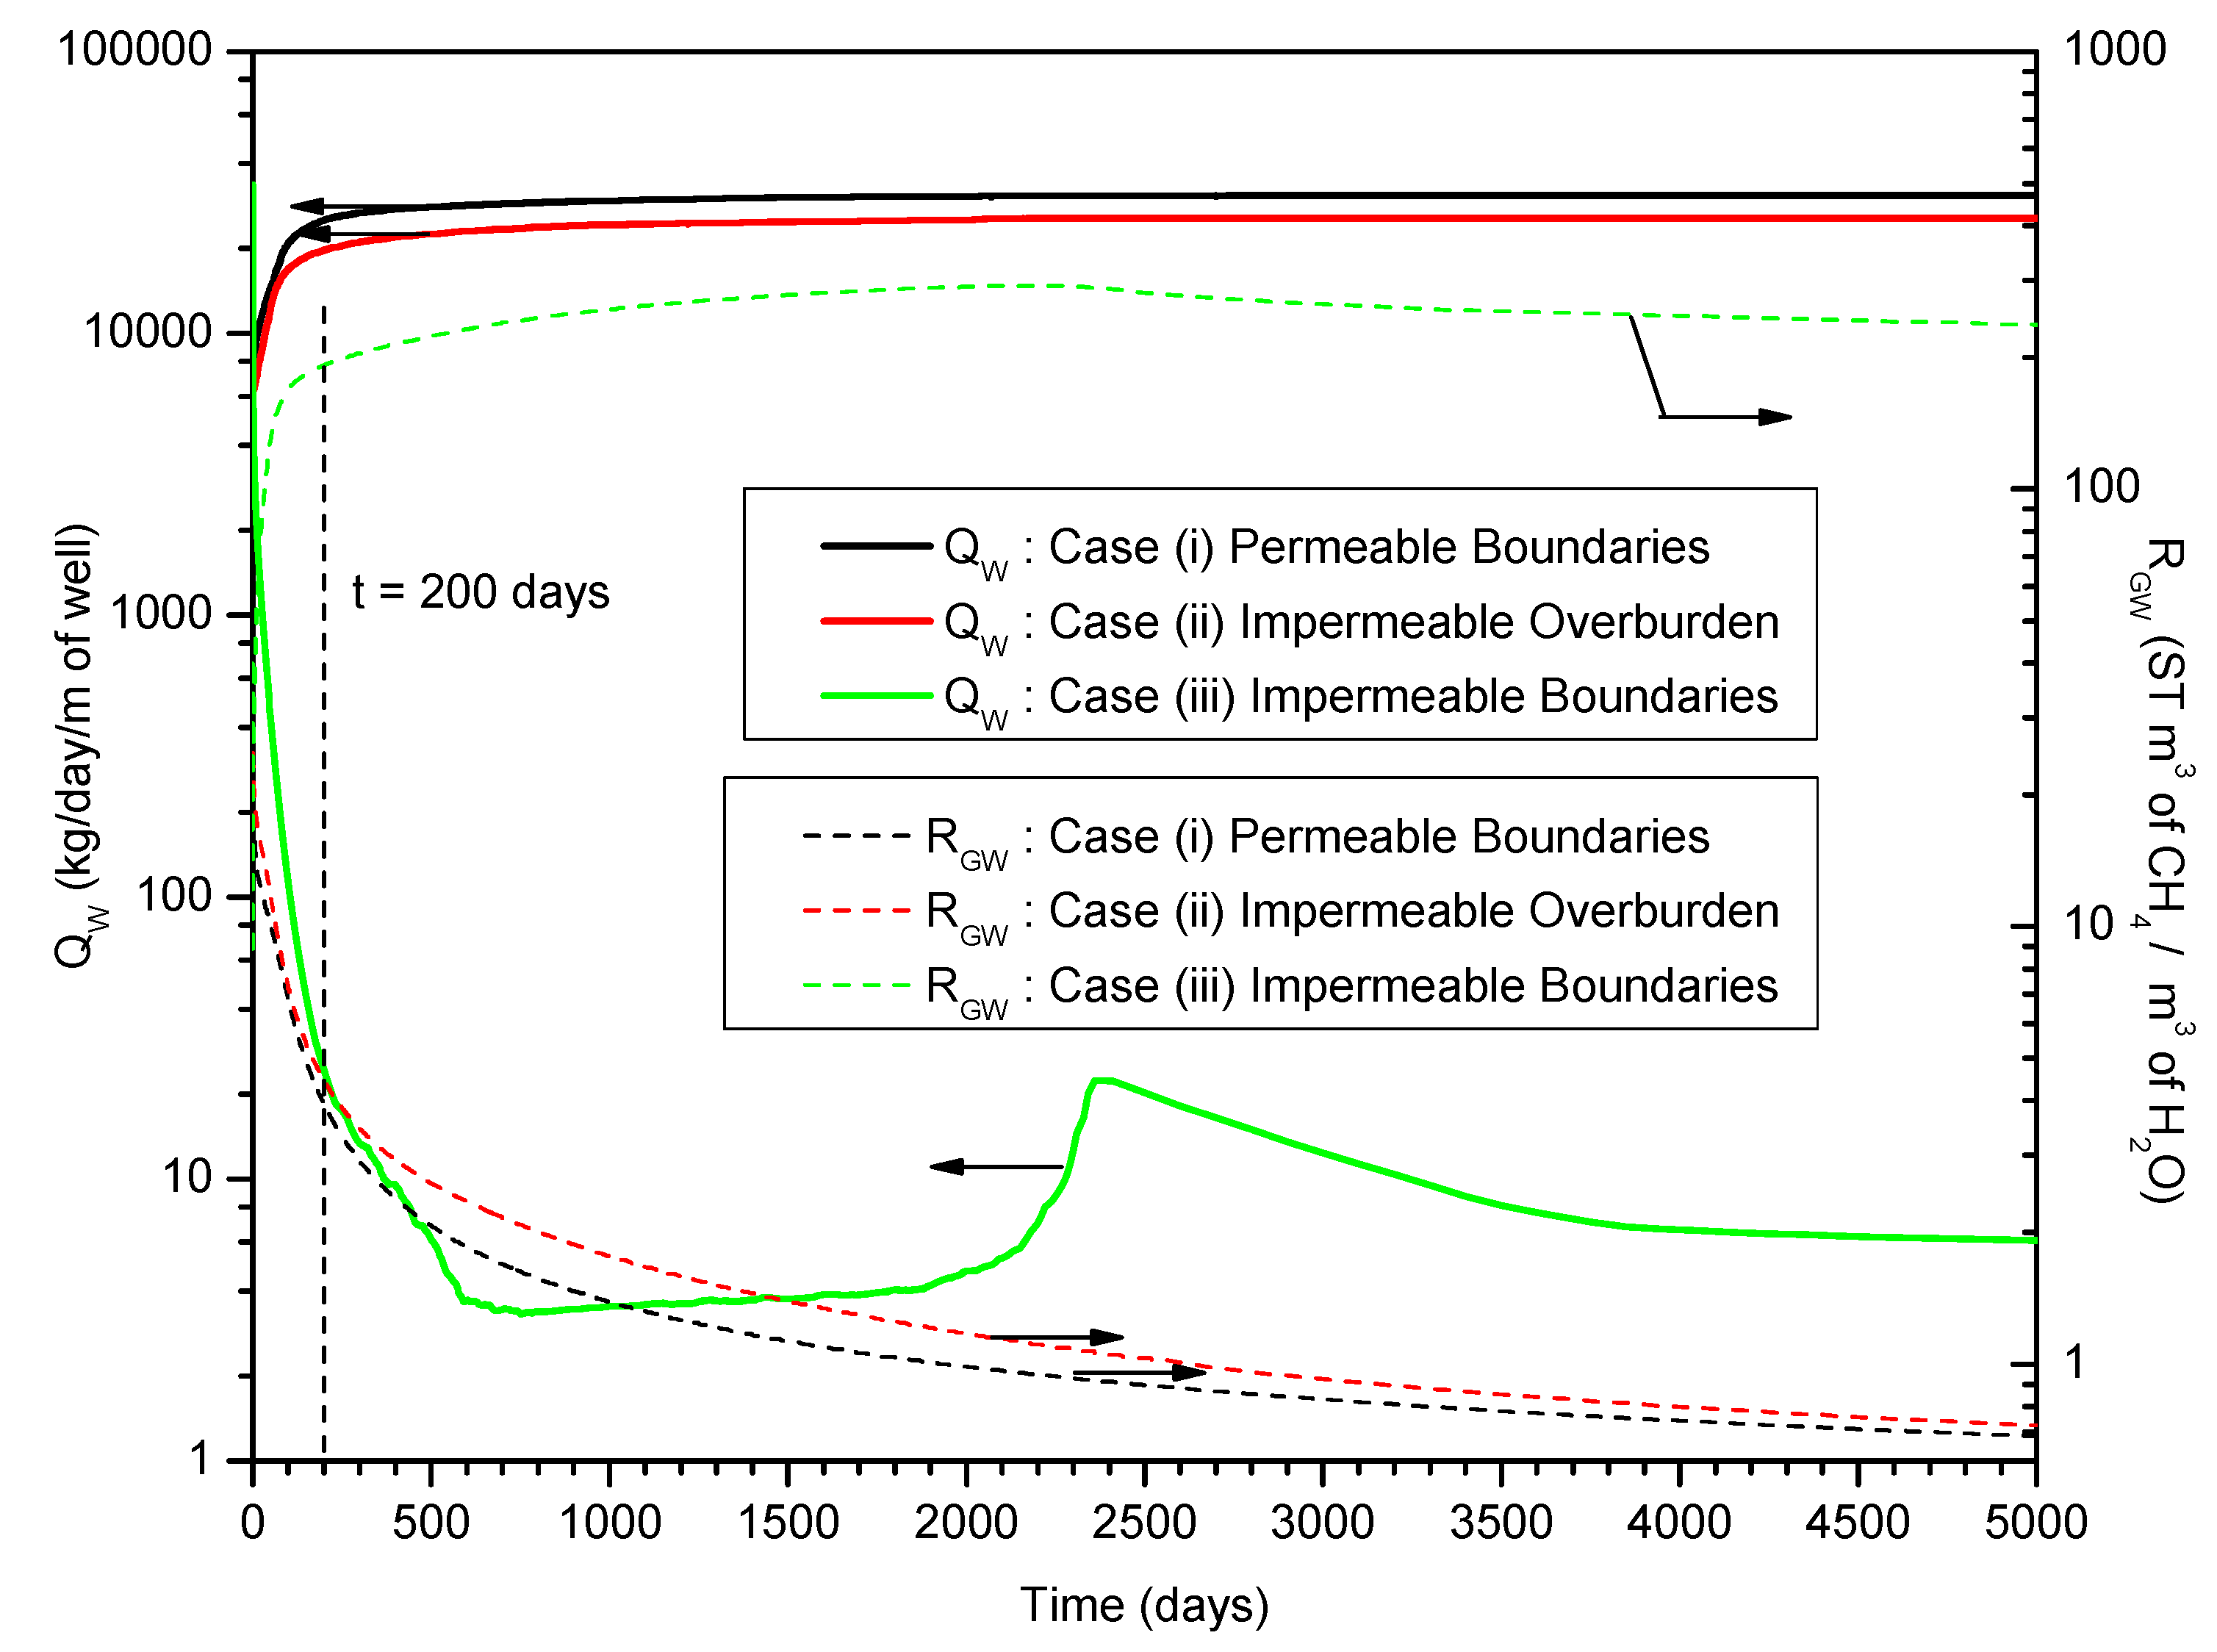
  • In both Case (i) and (ii), the water production rates QW increase rapidly after approximately t = 300 days, and the long-term RGW is prohibitively low, which indicates that the gas productions from the deposits are not economically profitable from the relative criterion point of view;
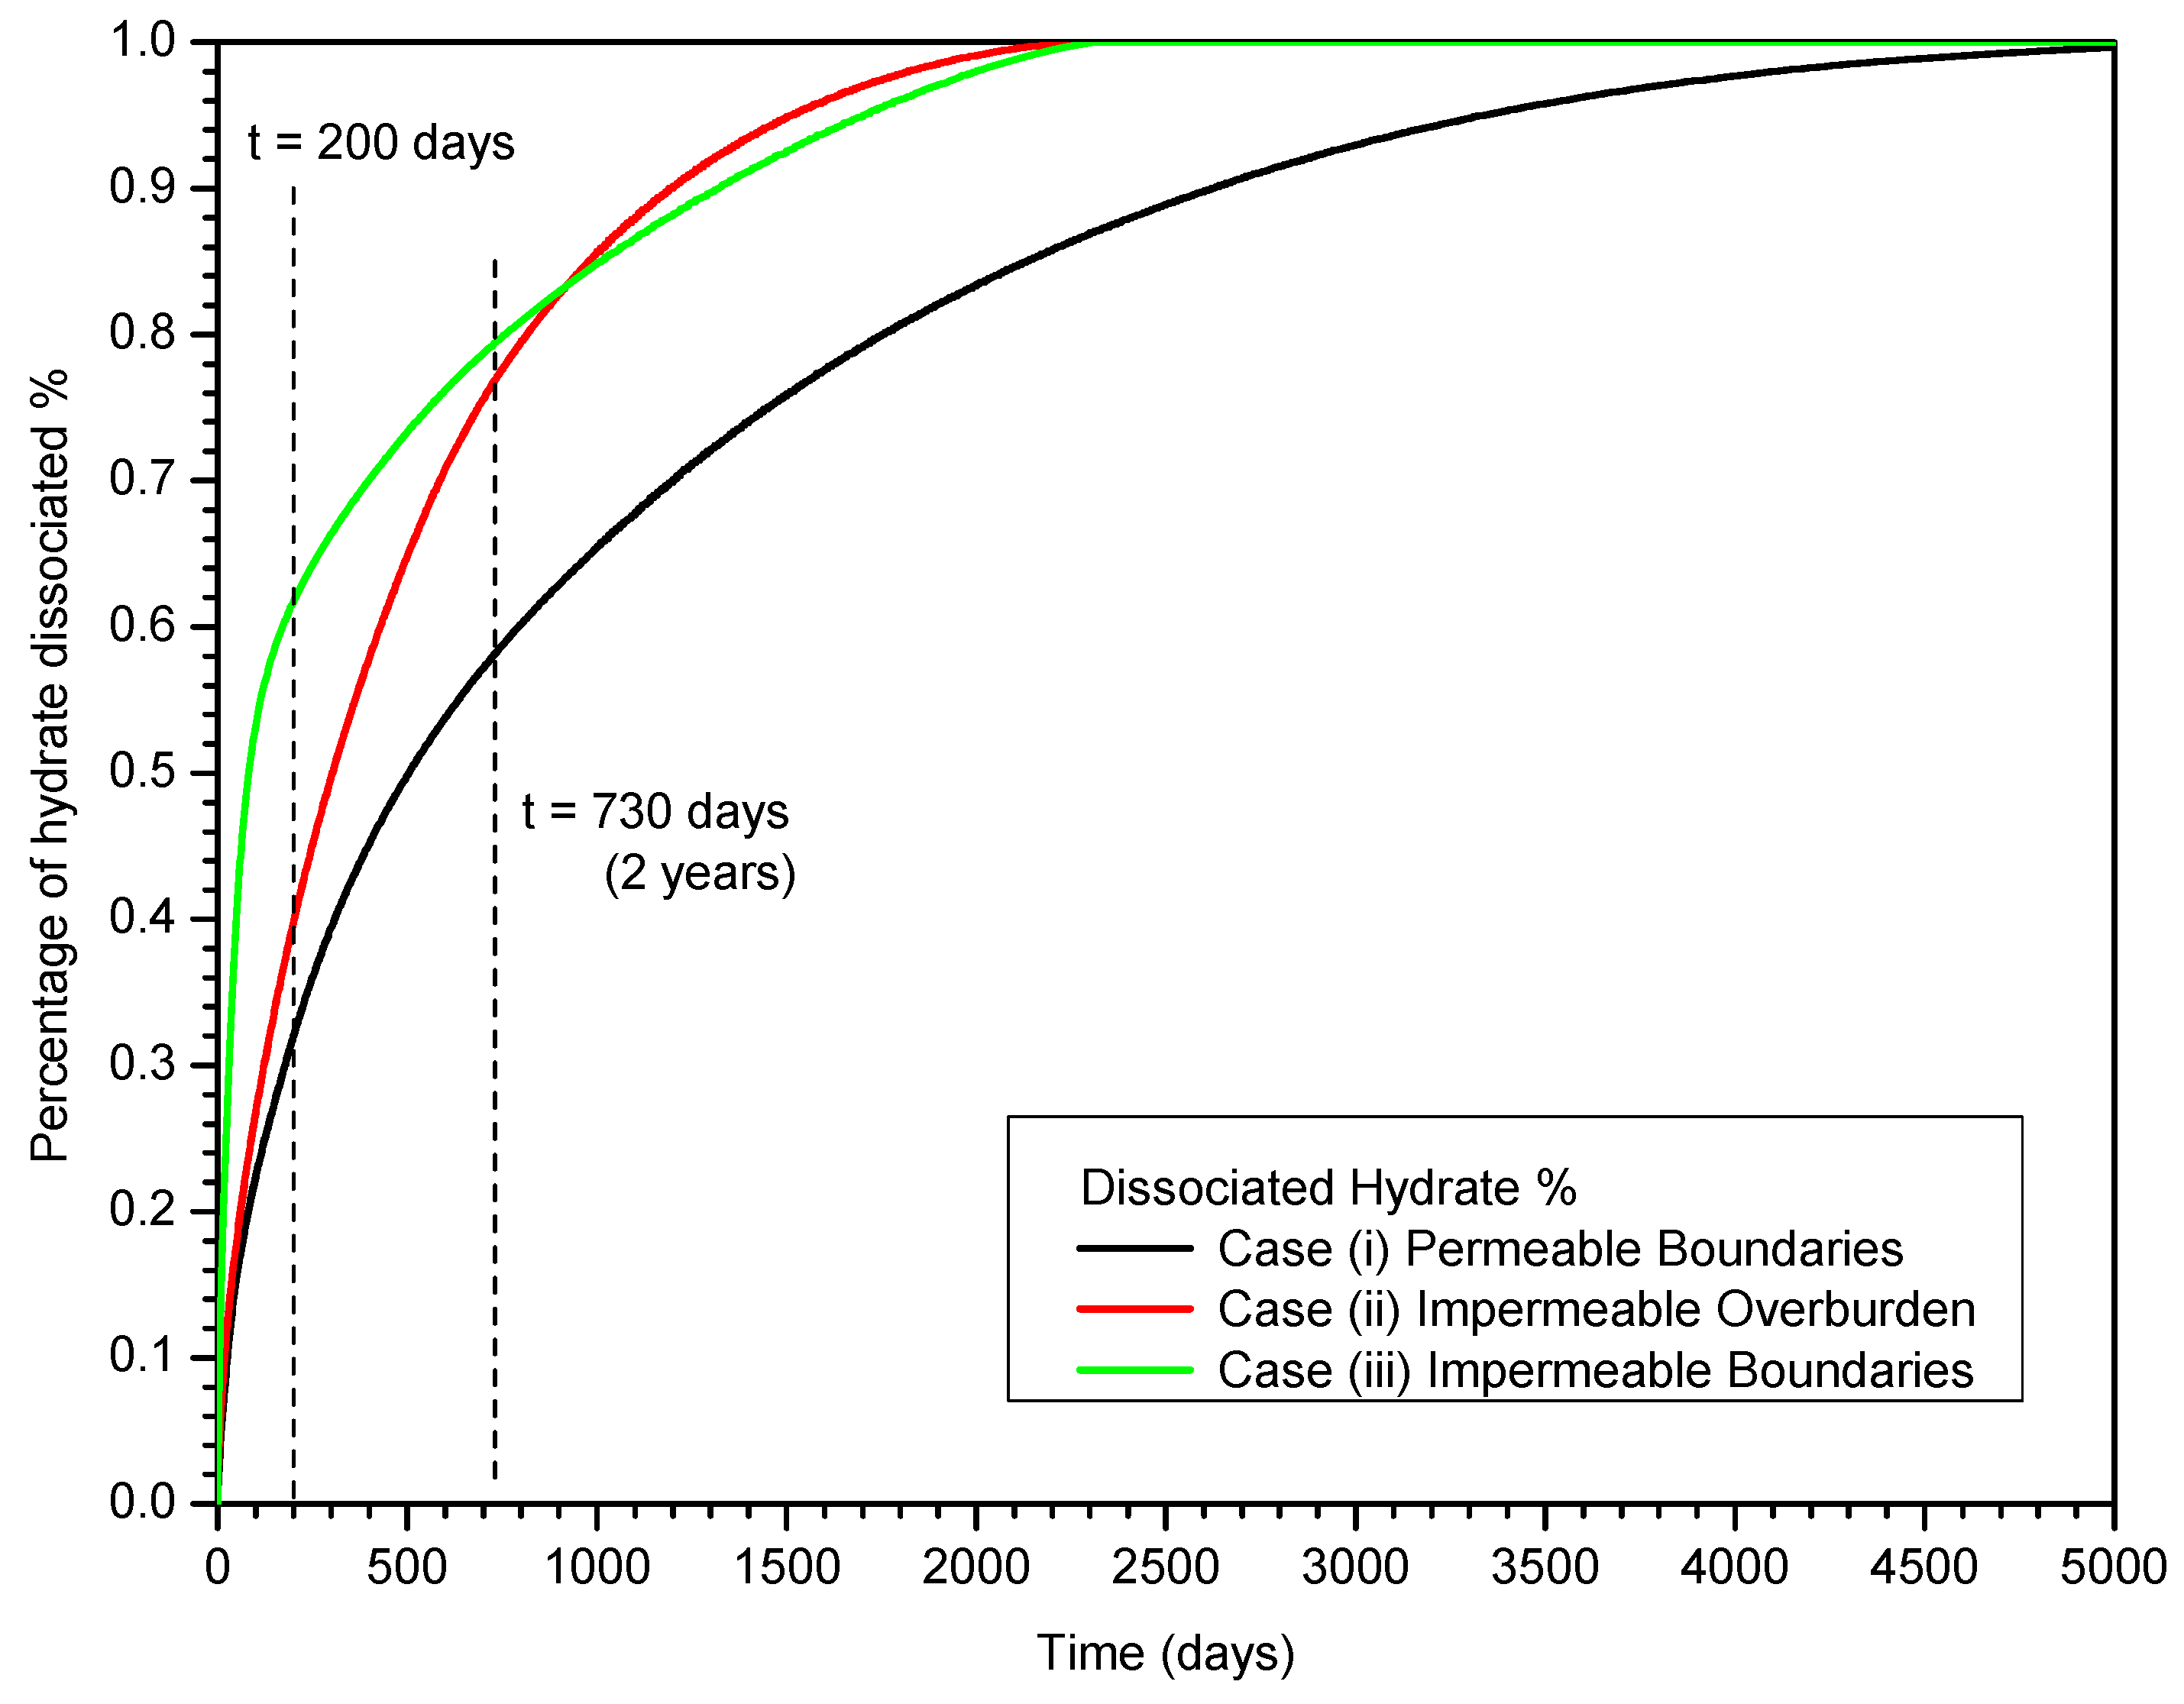
  • In Case (iii) with impermeable upper and lower boundaries, the HBL is a closed system before gas production from hydrate, and the effect of the depressurization is much stronger than that in Case (i) and Case (ii). The depressurization affects the entire HBL obviously and the hydrate dissociation occurs in the entire HBL simultaneously;
  • In Case (iii), the cumulative average gas production rate Qavg indicates that the large production potential of the hydrate deposits satisfies the absolute criterion. The RGW increases to larger than 190 ST m3 of CH4/m3 of H2O after approximately t = 200 days, which indicates that the relative criterion is satisfied;
  • In summary, comparing with the open and semi-open system, the effect of the depressurization is much stronger in the hydrate accumulation with both the impermeable upper and lower boundaries, which shows the best effects on the gas production potential of the hydrate deposits.

Nomenclature:

k
intrinsic permeability (m2)
keff
effective permeability (m2)
krA
aqueous relative permeability (m2)
krG
gas relative permeability (m2)
kΘ
thermal conductivity (W/m/K)
kΘRD
thermal conductivity of dry porous medium (W/m/K)
kΘRw
thermal conductivity of fully saturated porous medium (W/m/K)
kΘI
thermal conductivity of ice (W/m/K)
VW
cumulative volume of the produced water (m3 of H2O)
P
pressure (Pa)
P0
initial pressure in the middle of HBL (Pa)
PW
pressure at the well (Pa)
PQ
pressure at the quadruple point (Pa)
Qavg
cumulative average production rate of total CH4 at time t (ST m3/day/m of well)
QW
mass rate of aqueous phase production at the well (kg/day/m of well)
QPG
volumetric rate of CH4 production at the well in the gas phase (ST m3/day/m of well)
QPT
volumetric rate of total CH4 production at the well (ST m3/day/m of well)
QR
volumetric rate of CH4 release from hydrate dissociation (ST m3/day/m of well)
R
radius (m)
RGW
the gas to water production ratio (ST m3 of CH4 /m3 of H2O)
S
phase saturation
t
times (days)
T
temperature (°C)
TB
initial temperature at base of HBL (°C)
T0F
temperature at the ocean floor (°C)
T0
initial temperature in the middle of HBL (°C)
VP
cumulative volume of the produced CH4 (ST m3 of CH4)
x,y,z
Cartesian coordinates (m)
XS
salinity
PW
driving force of depressurization, P0—PW (Pa)
x
discretization along the x-axis (m)
z
discretization along the z-axis (m)
ZH
HBL thickness (m)
ZO
Overburden thickness (m)
ZU
Underburden thickness (m)
ZW
well position above the HBL base (m)
ϕ
porosity
ρR
grain density (kg/m3)
λ
van Genuchten exponent—Table 1

Subcripts:

0
denotes initial state
A
aqueous phase
B
base of HBL
cap
capillary
G
gas phase
H
solid hydrate phase
HBL
Hydrate-Bearing Layer
I
Ice phase
irA
irreducible aqueous phase
irG
irreducible gas
n
permeability reduction exponent—Table 1
nG
gas permeability reduction exponent—Table 1
OB
overburden
R
rock
S
salinity
UB
underburden
W
well

Acknowledgement

This work was supported by National Science Fund for Distinguished Young Scholars of China (Grant 51225603), National Natural Science Foundation of China (51076155, 51004089 and 51106160), and Science & Technology Program of Guangzhou (2012J5100012), which are gratefully acknowledged.

Conflict of Interest

The authors declare no conflict of interest.

References

  1. Sloan, E.D.; Koh, C.A. Clathrate Hydrates of Natural Gases, 3rd ed.; CRC Press: Boca Raton, FL, USA, 2008. [Google Scholar]
  2. Milkov, A.V. Global estimates of hydrate-bound gas in marine sediments: how much is really out there? Earth Sci. Rev. 2004, 66, 183–197. [Google Scholar] [CrossRef]
  3. Collett, T.S. Gas hydrates as a future energy resource. Geotimes 2004, 49, 24–27. [Google Scholar]
  4. Klauda, J.B.; Sandler, S.I. Global distribution of methane hydrate in ocean sediment. Energy Fuels 2005, 19, 459–470. [Google Scholar] [CrossRef]
  5. Makogon, Y.F.; Holditch, S.A.; Makogon, T.Y. Natural gas-hydrates—A potential energy source for the 21st Century. J. Petrol. Sci. Eng. 2007, 56, 14–31. [Google Scholar] [CrossRef]
  6. Yousif, M.H.; Abass, H.H.; Selim, M.S.; Sloan, E.D. Experimental and theoretical investigation of methane-gas-hydrate dissociation in porous media. SPE Reserv. Eng. 1991, 6, 69–76. [Google Scholar] [CrossRef]
  7. Ahmadi, G.; Ji, C.A.; Smith, D.H. Production of natural gas from methane hydrate by a constant downhole pressure well. Energy Convers. Manag. 2007, 48, 2053–2068. [Google Scholar] [CrossRef]
  8. Moridis, G.J.; Kowalsky, M.B.; Pruess, K. Depressurization-induced gas production from class 1 hydrate deposits. SPE Reserv. Eval. Eng. 2007, 10, 458–481. [Google Scholar] [CrossRef]
  9. Li, G.; Li, X.S.; Chen, Q.; Chen, Z.Y. Numerical studies of gas production from gas hydrate zone in Shenhu Area, South China Sea. Acta Chim. Sin. 2010, 68, 1083–1092. [Google Scholar]
  10. Li, G.; Moridis, G.J.; Zhang, K.; Li, X.S. Evaluation of gas production potential from marine gas hydrate deposits in Shenhu Area of South China Sea. Energy Fuels 2010, 24, 6018–6033. [Google Scholar] [CrossRef]
  11. Li, G.; Tang, L.G.; Huang, C.; Feng, Z.P.; Fan, S.S. Thermodynamic evaluation of hot brine stimulation for natural gas hydrate dissociation. J. Chem. Ind. Eng. 2006, 57, 2033–2038. [Google Scholar]
  12. Li, G.; Li, X.S.; Tang, L.G.; Li, Q.P. Control Mechanisms for Methane Hydrate Production by Thermal Stimulation. In Proceedings of the Sixth International Conference on Gas Hydrates, Vancouver, Canada, 6–10 July 2008.
  13. Li, X.S.; Wan, L.H.; Li, G.; Li, Q.P.; Chen, Z.Y.; Yan, K.F. Experimental investigation into the production behavior of methane hydrate in porous sediment with hot brine stimulation. Ind. Eng. Chem. Res. 2008, 47, 9696–9702. [Google Scholar] [CrossRef]
  14. Li, G.; Moridis, G.J.; Zhang, K.; Li, X.S. The use of huff and puff method in a single horizontal well in gas production from marine gas hydrate deposits in the Shenhu area of the South China Sea. J. Petrol. Sci. Eng. 2011, 77, 49–68. [Google Scholar] [CrossRef]
  15. Sira, J.H.; Patil, S.L.; Kamath, V.A. Study of Hydrate Dissociation by Methanol and Glycol Injection. In Proceedings of the SPE Annual Technical Conference and Exhibition, New Orleans, LA, USA, 23–26 September 1990.
  16. Li, G.; Li, X.S.; Tang, L.G.; Zhang, Y. Experimental investigation of production behavior of methane hydrate under ethylene glycol injection in unconsolidated sediment. Energy Fuels 2007, 21, 3388–3393. [Google Scholar] [CrossRef]
  17. Moridis, G.J.; Reagan, M.T. Gas Production from oceanic Class 2 Hydrate Accumulations. In Proceedings of the Offshore Technology Conference, Houston, TX, USA, 30 April–3 May 2007.
  18. Moridis, G.J.; Reagan, M.T. Strategies for Gas Production from Oceanic Class 3 Hydrate Accumulations. In Proceedings of the Offshore Technology Conference, Houston, TX, USA, 30 April–3 May 2007.
  19. Moridis, G.J.; Reagan, M.T.; Zhang, K. The Use of Horizontal Wells in Gas Production from Hydrate Accumulations. In Proceedings of the Sixth International Conference on Gas Hydrates, Vancouver, Canada, 6–10 July 2008.
  20. Moridis, G.J.; Collett, T.S.; Boswell, R.; Kurihara, M.; Reagan, M.T.; Koh, C.; Sloan, E.D. Toward production from gas hydrates: Current status, assessment of resources, and simulation-based evaluation of technology and potential. SPE Reserv. Eval. Eng. 2009, 12, 745–771. [Google Scholar] [CrossRef]
  21. Moridis, G.J.; Reagan, M.T.; Kim, S.J.; Seol, Y.; Zhang, K. Evaluation of the gas production potential of marine hydrate deposits in the Ulleung basin of the Korean East Sea. SPE J. 2009, 14, 759–781. [Google Scholar] [CrossRef]
  22. Kurihara, M.; Funatsu, K.; Ouchi, H.; Masuda, Y.; Narita, H. Investigation on Applicability of Methane Hydrate Production Methods to Reservoirs with Diverse Characteristics. In Proceedings of the 5th International Conference on Gas Hydrates, Trondheim, Norway, 12–16 June 2005.
  23. Borowski, W.S. A review of methane and gas hydrates in the dynamic, stratified system of the Blake Ridge region, offshore southeastern North America. Chem. Geol. 2004, 205, 311–346. [Google Scholar] [CrossRef]
  24. Collett, T.S.; Ladd, J. Detection of gas hydrate with downhole logs and assessment of gas hydrate concentrations (saturations) and gas volumes on the Blake Ridge with electrical resistivity log data. Proc. Ocean Drill. Program Sci. Results 2000, 164, 179–191. [Google Scholar]
  25. Moridis, G.J.; Sloan, E.D. Gas production potential of disperse low-saturation hydrate accumulations in oceanic sediments. Energy Convers. Manag. 2007, 48, 1834–1849. [Google Scholar] [CrossRef]
  26. Su, Z.; Cao, Y.; Wu, N.Y. A model for predicting gas well performance of free gas zone beneath hydrate layer. J. Petrol. Sci. Eng. 2010, 71, 179–186. [Google Scholar] [CrossRef]
  27. McDonnell, S.L.; Max, M.D.; Cherkis, N.Z.; Czarnecki, M.F. Tectono-sedimentary controls on the likelihood of gas hydrate occurrence near Taiwan. Mar. Petrol. Geol. 2000, 17, 929–936. [Google Scholar] [CrossRef]
  28. Wu, N.Y.; Zhang, H.Q.; Yang, S.X.; Liang, J.Q.; Wang, H.B. Preliminary discussion on natural gas hydrate (NGH) reservoir system of Shenhu area, north slope of South China Sea. Nat. Gas Ind. 2007, 27, 1–6. [Google Scholar]
  29. Wu, N.Y.; Zhang, H.Q.; Su, X.; Yang, S.X.; Zhang, G.; Liang, J.Q.; Lu, J.; Gong, J.; Scheltheiss, P.; Holland, M. High concentrations of hydrate in disseminated forms found in very fine-grained sediments of Shenhu area, South China Sea. Terra Nostra 2007, 1–2, 236–237. [Google Scholar]
  30. Wu, N.Y.; Yang, S.X.; Zhang, H.Q.; Liang, J.Q.; Wang, H.B.; Su, X.; Fu, S.Y. Preliminary Discussion on Gas Hydrate Reservoir System of Shenhu Area, North Slope of South China Sea. In Proceedings of the 6th International Conference on Gas Hydrates, Vancouver, Canada, 6–10 July 2008.
  31. Yang, S.X.; Zhang, H.Q.; Wu, N.Y.; Su, X.; Scheltheiss, P.; Holland, M.; Zhang, G.X.; Liang, J.Q.; Lu, J.A.; Rose, K. High Concentration Hydrate in Disseminated Forms Obtained in Shenhu Area, North Slope of South China Sea. In Proceedings of the Sixth International Conference on Gas Hydrates, Vancouver, Canada, 6–10 July 2008.
  32. Moridis, G.J.; Kowalsky, M.B.; Pruess, K. TOUGH + HYDRATE v1.1 User’s Manual: A Code for the Simulation of System Behavior in Hydrate-Bearing Geologic Media; Lawrence Berkeley National laboratory: Berkeley, CA, USA, 2009. [Google Scholar]
  33. Zhang, K.; Moridis, G.J.; Wu, Y.S.; Pruess, K. A Domain Decomposition Approach for Large-Scale Simulations of Flow Processes in Hydrate-Bearing Geologic Media. In Proceedings of the Sixth International Conference on Gas Hydrates, Vancouver, Canada, 6–10 July 2008.
  34. Wu, N.Y.; Yang, S.X.; Zhang, H.Q.; Liang, J.Q.; Wang, H.B.; Lu, J.A. Gas Hydrate System of Shenhu Area, Northern South China Sea: Wire-line Logging, Geochemical Results and Preliminary Resources Estimate. In Proceedings of the Offshore Technology Conference, Houston, TX, USA, 30 April–3 May 2007.
  35. Vanoudheusden, E.; Sultan, N.; Cochonat, P. Mechanical behaviour of unsaturated marine sediments: experimental and theoretical approaches. Mar. Geol. 2004, 213, 323–342. [Google Scholar] [CrossRef]
  36. Kowalsky, M.B.; Moridis, G.J. Comparison of kinetic and equilibrium reaction models in simulating gas hydrate behavior in porous media. Energy Convers. Manag. 2007, 48, 1850–1863. [Google Scholar] [CrossRef]

