Article

Economic Feasibility of V2G Frequency Regulation in Consideration of Battery Wear

1
Energy Technology Research Institute, National Institute of Advanced Institute of Industrial Science and Technology, Tsukuba Center 2, 1-1-1 Umezono, Tsukuba, Ibaraki 305-8568, Japan
2
Department of Electrical Engineering, Konkuk University, 120 Neungdong-ro, Gwangjin-gu, Seoul 143-701, Korea
*
Author to whom correspondence should be addressed.
Energies 2013, 6(2), 748-765; https://doi.org/10.3390/en6020748
Submission received: 20 November 2012 / Revised: 6 January 2013 / Accepted: 31 January 2013 / Published: 6 February 2013

Abstract

:
An economic feasibility study of vehicle-to-grid (V2G) frequency regulation is performed in consideration of battery wear. Usually, a transaction for frequency regulation is made in terms of power capacity while the battery-wear proceeds in proportion to the absolute amount of energy transferred. In order to relate the two quantities, we first estimate the amount of transferred energy in terms of contracted power capacity, and hence regulation income, by analyzing actual regulation signals and transactions. On the other hand, the amount of transferrable energy during the life cycle of a battery is estimated analyzing some pervasive specifications for electric vehicle (EV) batteries. The expected V2G income is then estimated and compared with battery prices to judge the economic feasibility of V2G regulation. In the latter part of the paper, the assessment result is validated with actual cycle life data of an EV battery cell. As a result, it is concluded that the estimated profit exceeds current market price of EV batteries, indicating that V2G regulation is an economically feasible service.

1. Introduction

With the highly successful commercialization of the hybrid electric vehicle (HEV), the electrification of vehicles is being accelerated. At the same time, many researches are being carried out regarding the utilization of electric-vehicle (EV) batteries for the electric grid. In the early stages of vehicle electrification, demand-respond vehicle charging may help the electric grid shift the peak loads. As the number of plug-in electric vehicles increases, they can be exploited in a more active and elaborate way by supplying the electricity back to the grid. This kind of concept is referred to as vehicle-to-grid, or V2G, and was proposed for the first time by Kempton [1]. In [2,3], the authors derived the expected earnings of the V2G services for various power markets. They concluded that the V2G is unsuitable for base-load power and is only feasible for frequency regulation or spinning reserve markets [2,3,4,5,6]. For V2G energy arbitrage (by charging when cheap and discharging when expensive), Rahman et al. [7] estimated the V2G benefit as $392 to $561 per annum for an individual EV, which may lead to users’ voluntary participation in the V2G. In their research, however, the battery aging and wear were not properly modeled in detail, and thus the effective feasibility in connection with the battery wear has always been controversial. Meanwhile, Peterson et al. have investigated the effective feasibility of the V2G service by considering the battery wear for the first time [7,8]. They estimated the annual net profits without the battery wear range from $140 to $250, while they range from $10 to $120 when the battery wear is taken into consideration. From these results, the profit alone did not appear to provide sufficient incentive to the vehicle owners. Very recently, a similar study was performed by Zhou et al. [9]. They modeled mathematically the factors that contribute to the cycle life of the battery based on experimental data, and applied their model to perform a simulation in the U.K. and China. The result showed that the V2G arbitrage is partially cost effective, depending on the operational environment.
Both studies try to assess the economic feasibility on the V2G utilizing specific experimental data that are subject to experiment conditions and battery types. The cycle life largely depends on the chemical structure of the battery, and thus the results cannot be generalized to a specific battery. Besides, those works merely focus on the V2G energy arbitrage. To the best of authors’ knowledge, the economic feasibility of V2G frequency regulation in consideration of battery wear has not yet been studied.
In this paper, we assess the economics of the V2G frequency regulation through both analytic and experimental approaches. For the analytic method, we utilize a pervasive EV battery test procedure, which is provided by the consortium of three major U.S. automakers, or USABC. This manual specifies various operational goals, including the cycle life of the automotive batteries as well as the test procedures. In general, battery manufacturers consider these criteria as minimum requirements and commercial batteries are designed to show better performance than these requirements. Consequently, if the revenue is calculated based on the USABC requirements and turns out to be sufficient enough to make the V2G regulation as economically feasible, the result can be expanded to all commercial batteries. In the later part of the paper, we provide actual cycle life data in comparison with the analytic results proving the proposed theory.
The rest of the paper is organized as follows: we first investigate in Section 2 the typical frequency regulation signal and estimate the regulation income in terms of transferred energy followed by an overview with prior researches on the battery wear. In Section 3 the factor affecting battery wear are discussed. In Section 4, the transferable energy during the life cycle of a battery is calculated using the USABC requirements. Then, the expected V2G revenue can be calculated using the average regulation price per unit energy transfer estimated in Section 2. Finally, some experimental results with an actual battery are provided in Section 5.

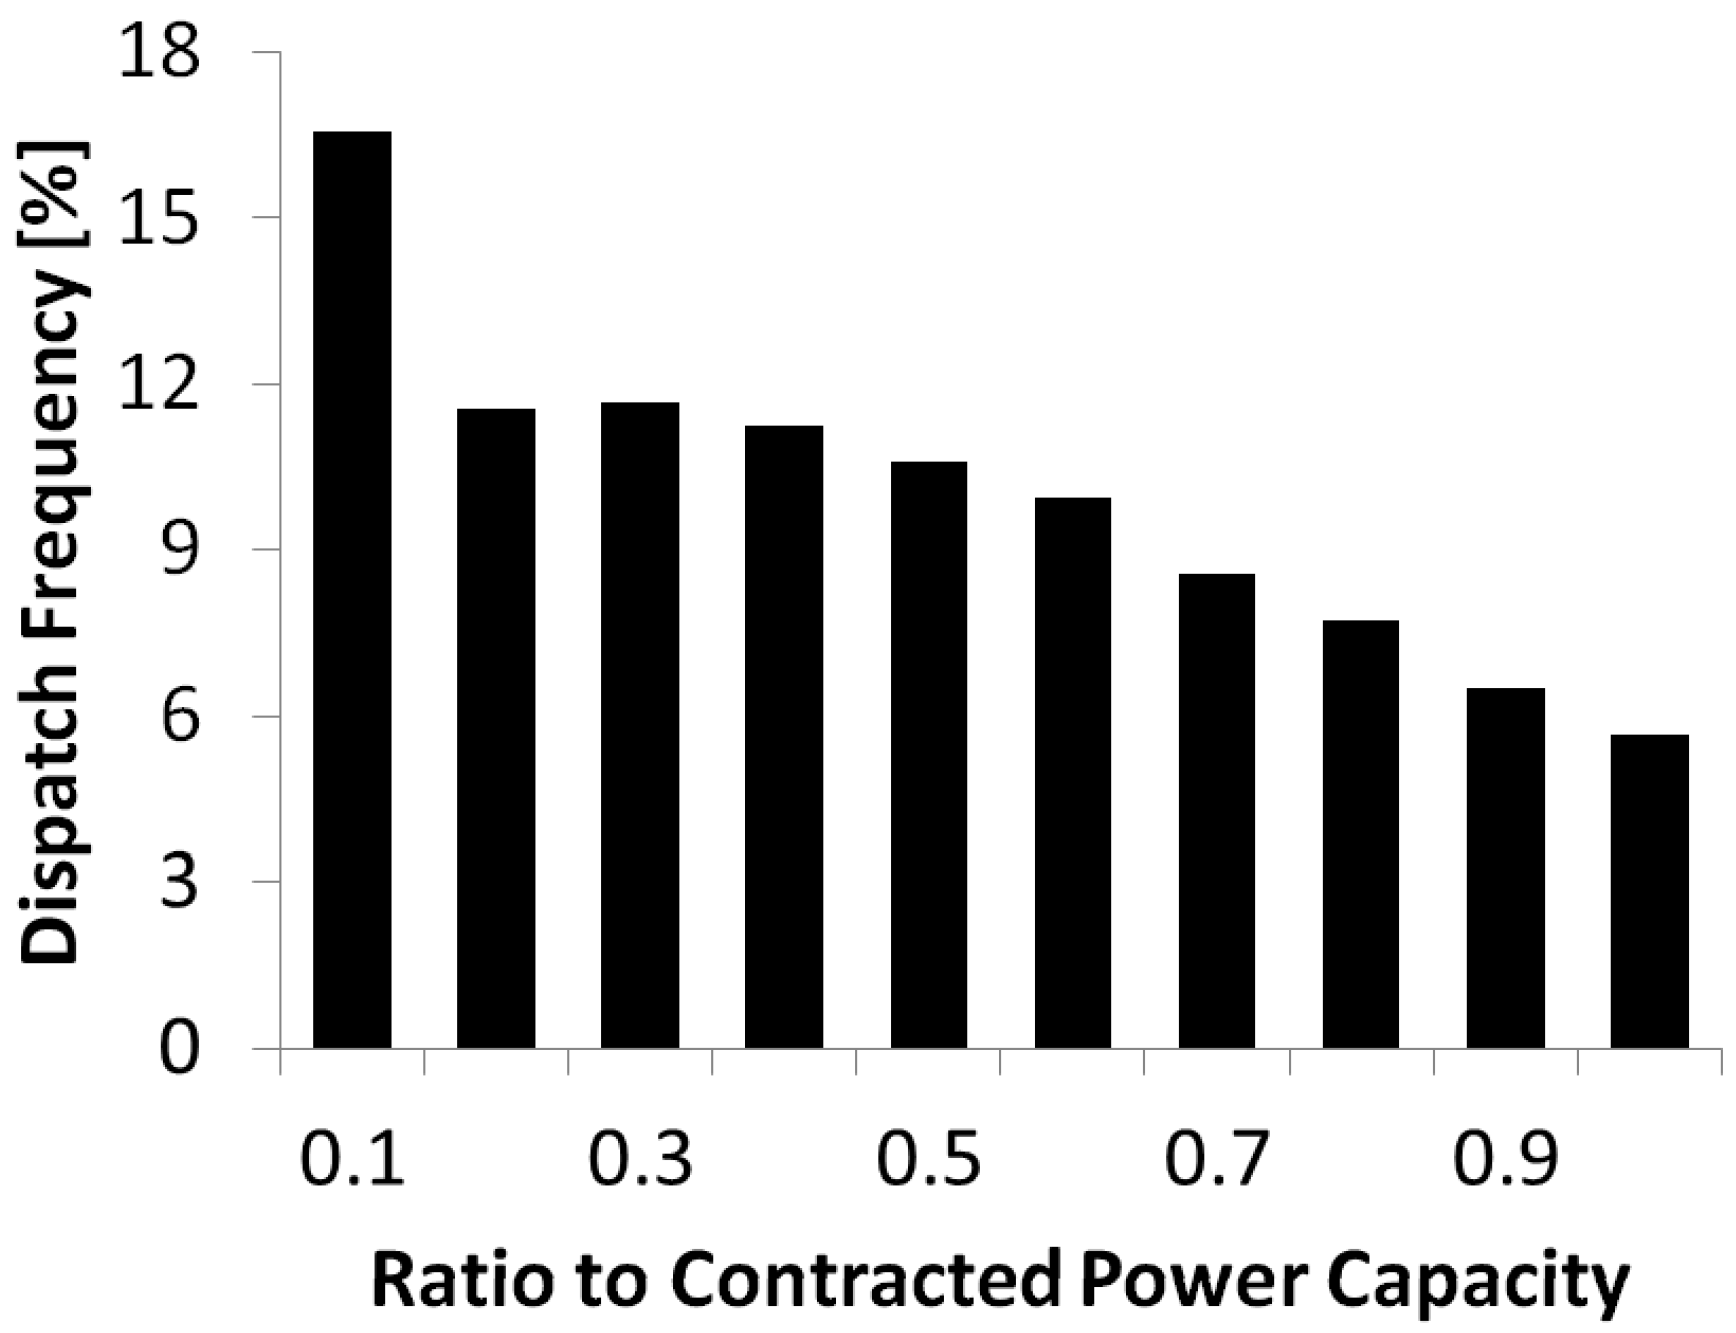
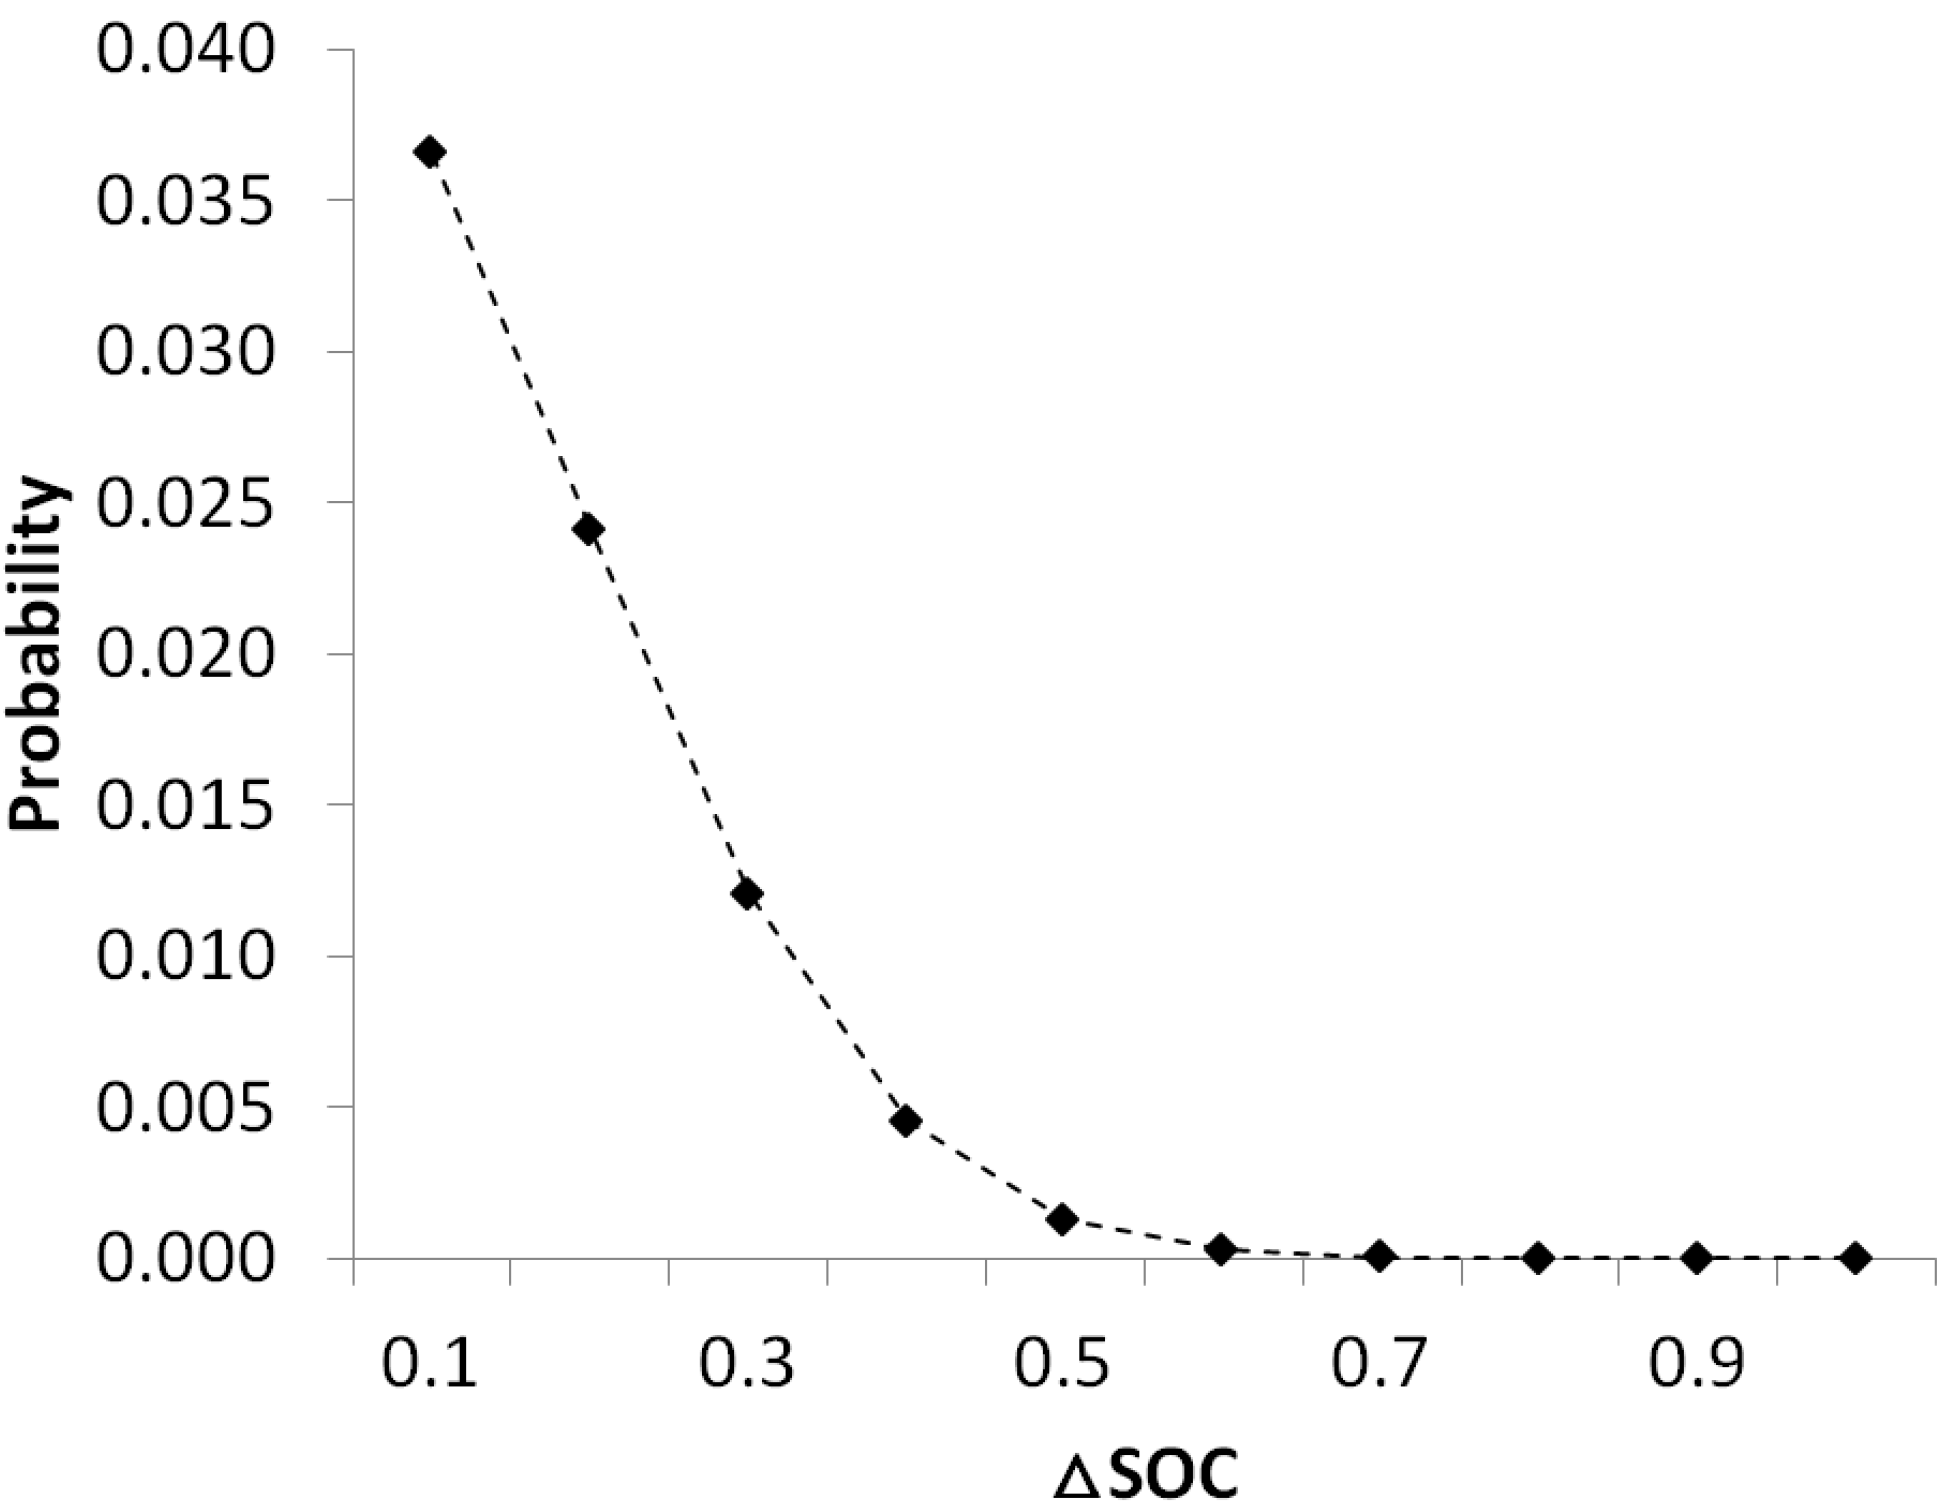
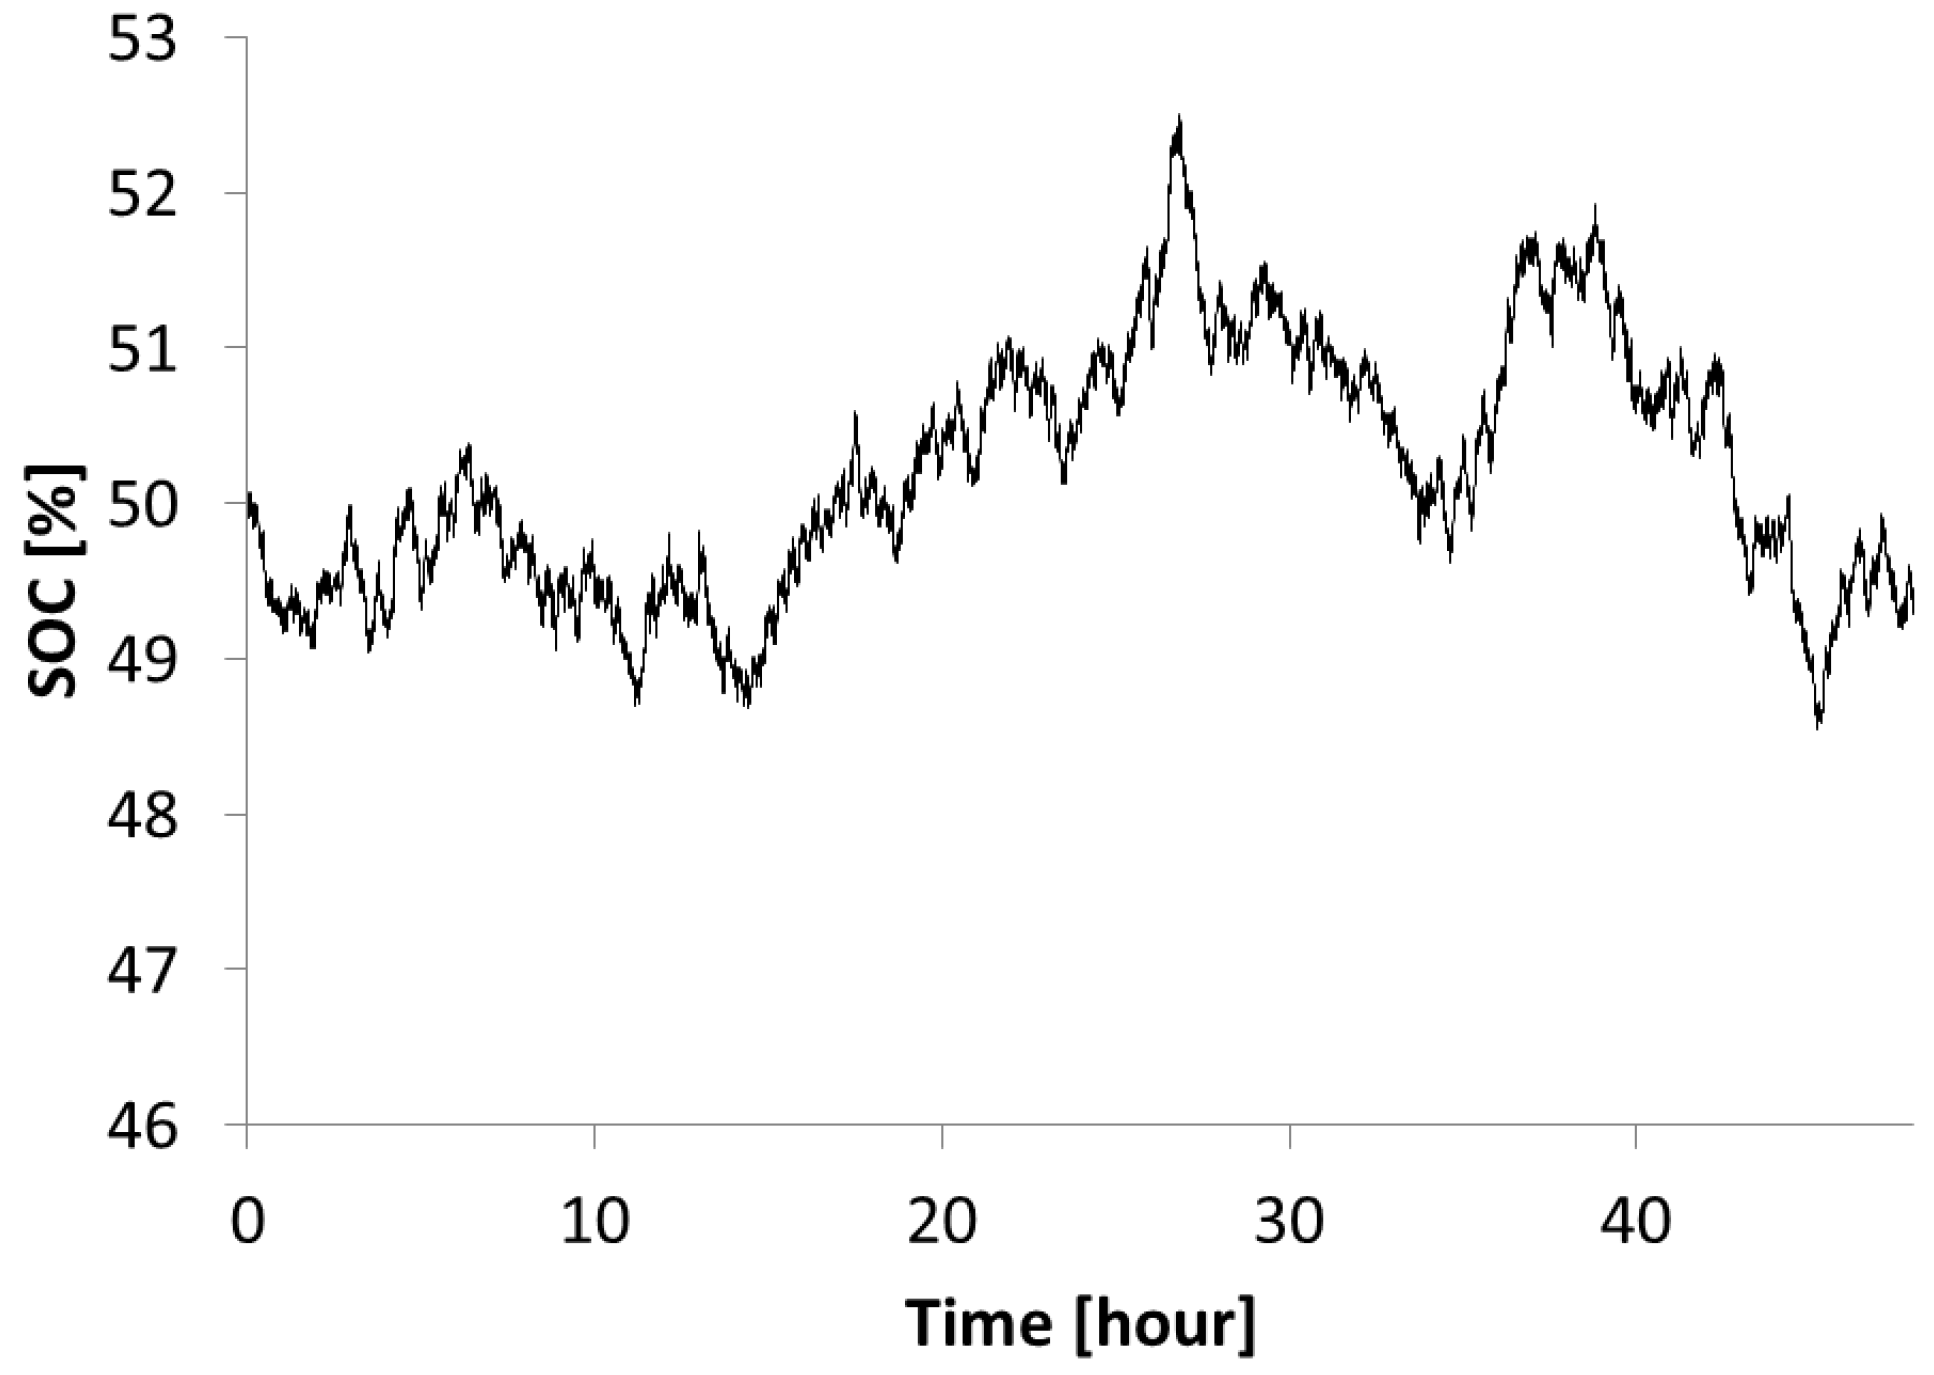
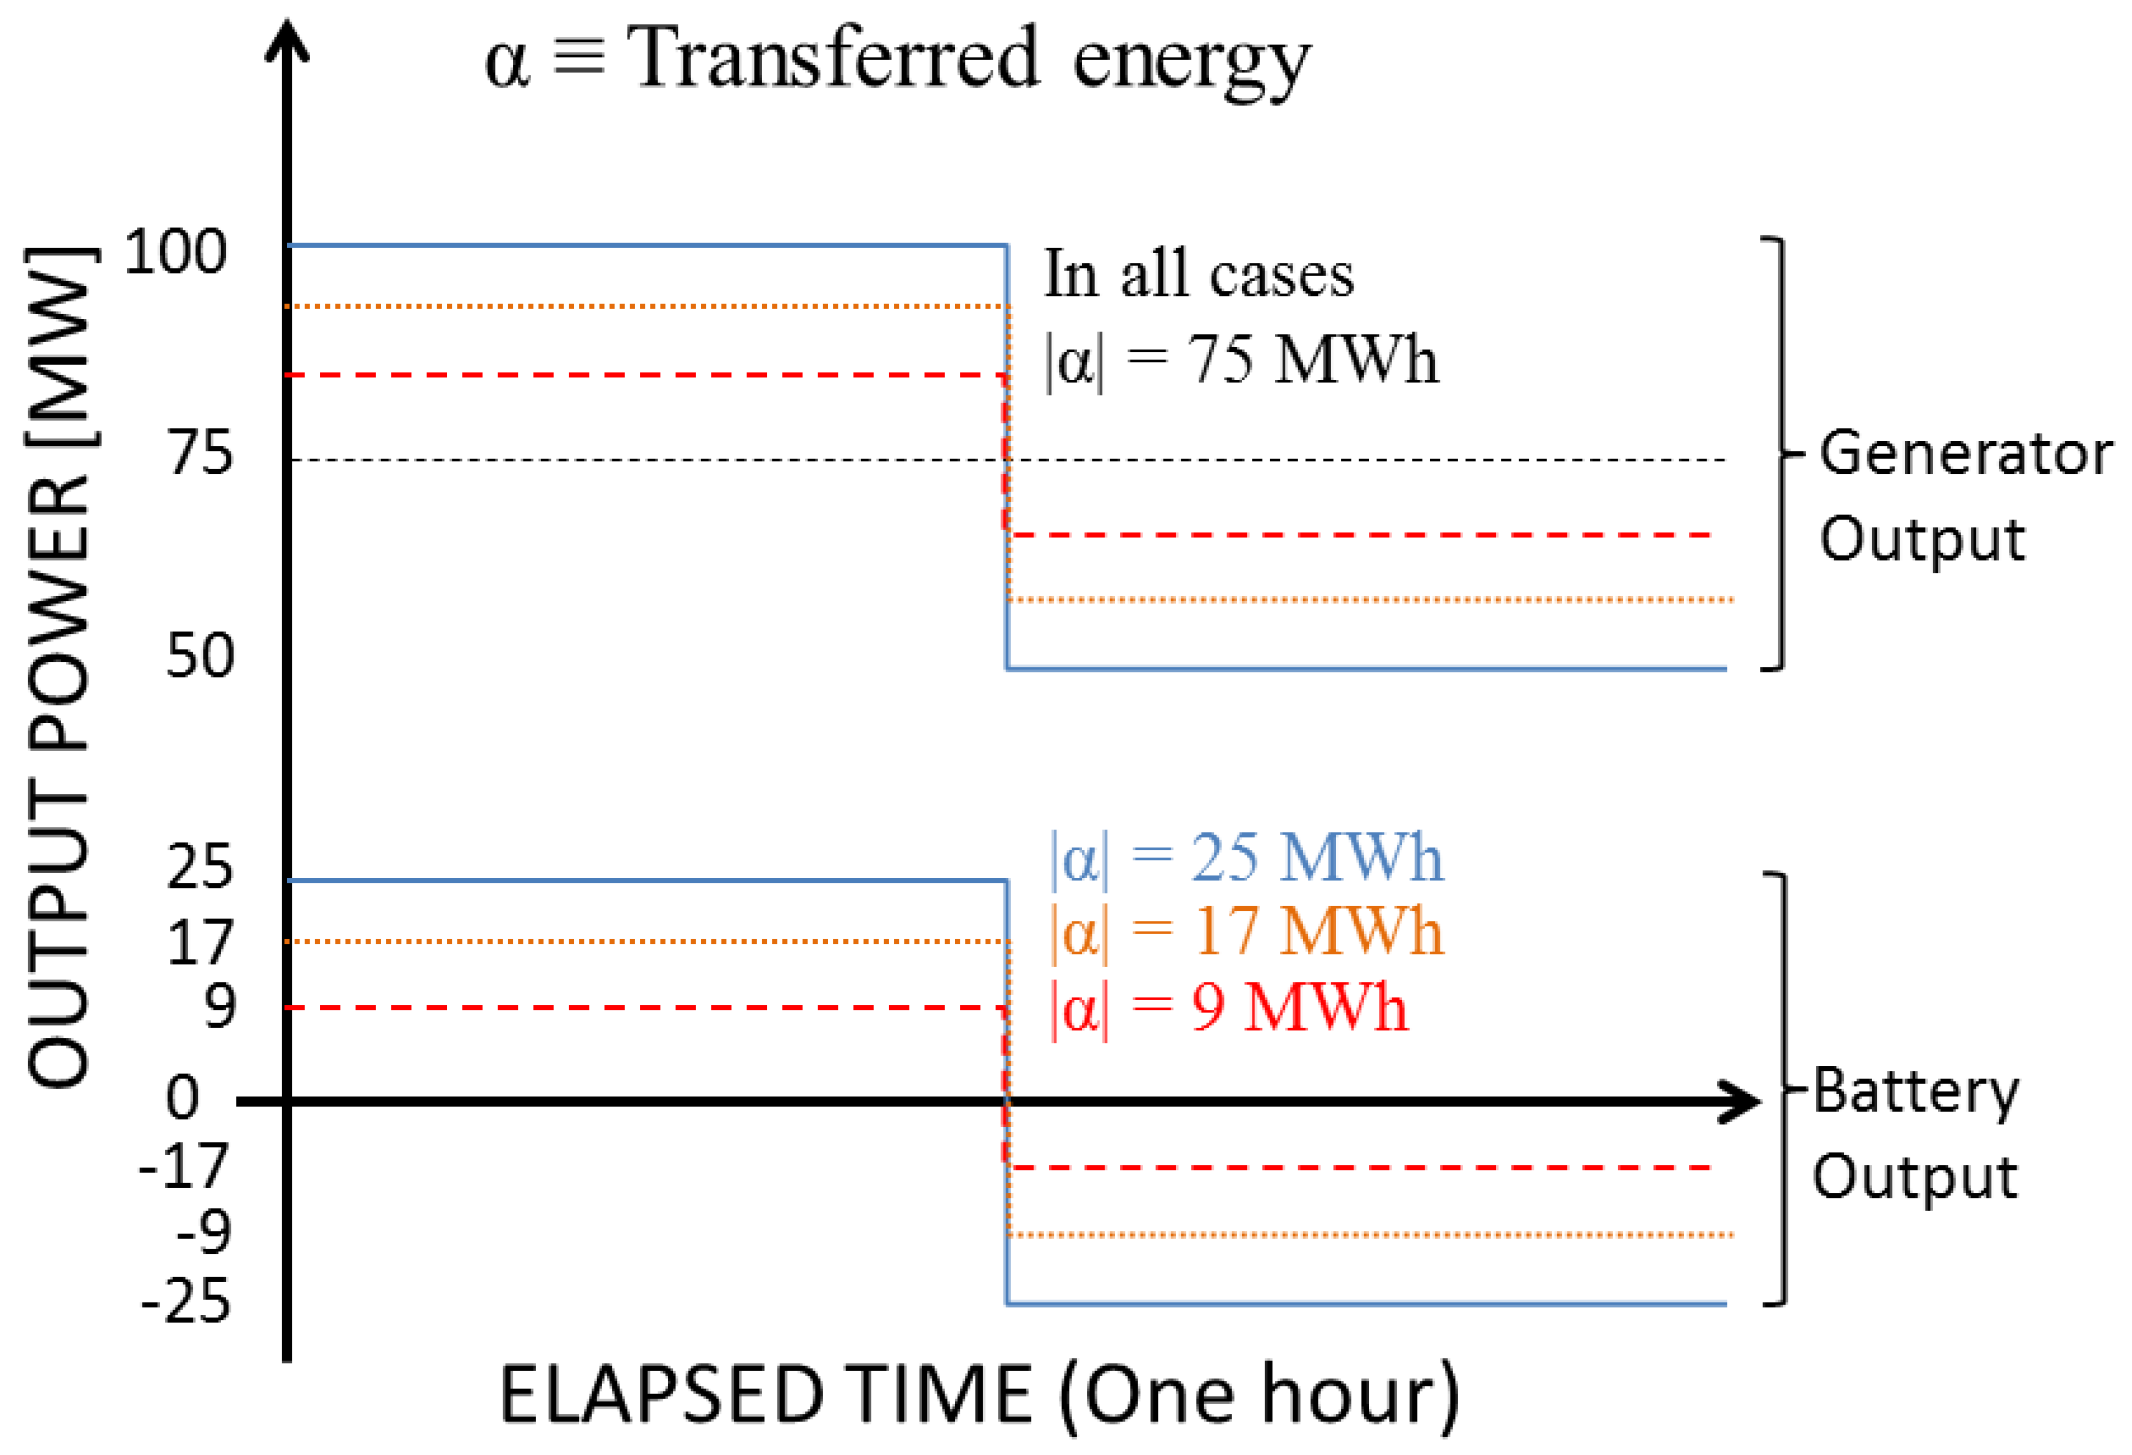
2. Analysis on the Regulation Signals

For conventional generators, down regulation can be performed only by decreasing the output from the nominal level. Therefore, a separated generation contract should be made between the generators and grid operator. On the other hand, a battery does not require nominal generation and performs the down regulation by actually absorbing the energy from the grid. Due to such a characteristic, the output power of the battery involved in the regulation fluctuates around the zero point. Consequently, as long as the regulation up and down are balanced, the sum of dispatched energy would be zero. However, the absolute amount of transferred energy, which has a direct relationship to the battery wear, varies depending on the size of the power fluctuation. This concept is illustrated in Figure 1. As in the upper side of the figure, the transferred energy for a generator performing the regulation around nominal generation power, say 75 MWh, is constant, regardless of the size of power fluctuation. On the other hand, the power fluctuation directly affects the amount of transferred energy for a battery as depicted in the lower side of the figure. Since the battery wear is directly related to the absolute amount of energy transferred, it is necessary to analyze the regulation signal that affects the output fluctuation of the battery.
Figure 1. Conceptual diagram to show different amounts of transferred energy.
Energies 06 00748 g001
In a traditional power market, regulation providers are paid for power capacity rather than the amount of dispatched energy [10,11,12]. The battery wear is, however, in a direct relationship to the absolute amount of transferred energy, and thus the regulation payment should be represented in the same manner to yield the net profit of the V2G regulation.
To this end, we first investigated the market price for the regulation capacity from the data provided by PJM [13,14] and estimated the average regulation market clearing price (RMCP) at around $40 for providing one megawatt of the power capacity in an hour (MW-h). Note that the regulation provider is paid for the readily available power and liable for adjusting the output within the contracted capacity. Therefore, the amount of actually dispatched power may not be the same as the contracted power capacity. To investigate the relationship between the contracted power capacity and the dispatch power, we investigated the regulation signal from PJM over a year in 2010 [15]. Figure 2 illustrates the distribution of dispatched power in terms of ratio to the contracted power capacity.
Figure 2. Distribution of dispatched power in 2010 from PJM.
Energies 06 00748 g002
The x-axis represents the ratio of dispatched power to the contracted (procured) power capacity, while the y-axis indicates the dispatch frequency in percentage. Apparently, the most frequent request is almost close to idle (less than 10% of the contracted power capacity) implying that the contracted generator (or a battery) would be operating at a much lower rate than the contracted power for a significant portion of the service time. Our calculation yielded that the dispatch power is just around 40% of the contracted power capacity. In practice, the regulation signals for the limited energy storage (LES) such as battery are designed be balanced between up and down to maintain the energy level. Thus, the dispatch power in each direction would be equally around 20% of the contracted power capacity. For example, a regulation unit contracted at 5 MW of the power capacity will be requested to dispatch around 1 MW on average. Recall that we are dealing with the transferred energy, not the dispatched energy. Although the net value of the dispatched energy will be zero for the battery storages, the transferred energy, which directly causes the battery wear, will be 1 MWh for each hour. Applying the average RMCP ($40/MW-h), thus, the battery owner will be paid around $200/hour and the battery wear will correspond to 1 MWh of the energy flow.

3. Considerations on Battery Wear Parameters

Generally, vehicle batteries are designed for a 10 year/150,000 mile vehicle service life and expected to have 80% of its rated amp-hour capacity at retirement [16]. From the technical point of view, battery wear proceeds as current (energy) flows through the battery. At the same time, there are many other actors affecting the wear directly and/or indirectly. In a battery aging model, those parameters vary depending on the modeling scheme. An analytic model based on chemical structure incorporates material level parameters while an empirical model is built with operational parameters. Since our assessment is based on the empirical method, we discuss several important parameters that affect the battery wear such as cell temperature, charge rate (power), and the depth-of-discharge (DOD) [9,17].

3.1. Temperature and Charge Rate

Temperature and charge rate have different impacts on the charging control applications. In many cases, the benefits of those applications are proportional to, and/or can be represented in terms of the amount of energy transferred through the battery. For instance, an energy-arbitrage application that stores the cheap electricity during the night time and utilizes it at the peaking hours yields profits exactly in proportion to the energy transferred through the battery. For this reason, a large portion of the battery wear due to the increased charge current is canceled since the energy amount, and hence the profit, increases as well. Although extremely high charge rates may accelerate the battery wear drastically, the actual current rate for the EV charging is limited to a few kilowatts due to the facility limitations. Considering that the battery size range around a few dozens of kilowatts-hour (kWh), the current rate would be less than 0.1–0.2 C [C-rate is a standard unit for battery charge and discharge, representing the ratio of the applied current (in Amp) to the rated capacity of battery (in Amph)]. As will be seen in Table 1 in Section 4.1, this rate is far less than the value used in our assessment. From the model proposed in [18], it can be also figured that the impact of charge rate is trivial below 1 C.
On the other hand, the variation of temperature has a direct impact on the battery wear while not affecting the amount of the energy flow. Nevertheless, as discussed previously, the charge current in the EV application is small, and hence causes only a negligible temperature variation. Under this circumstance, the ambient condition rules the cell temperature dominantly, which is not of our concern.

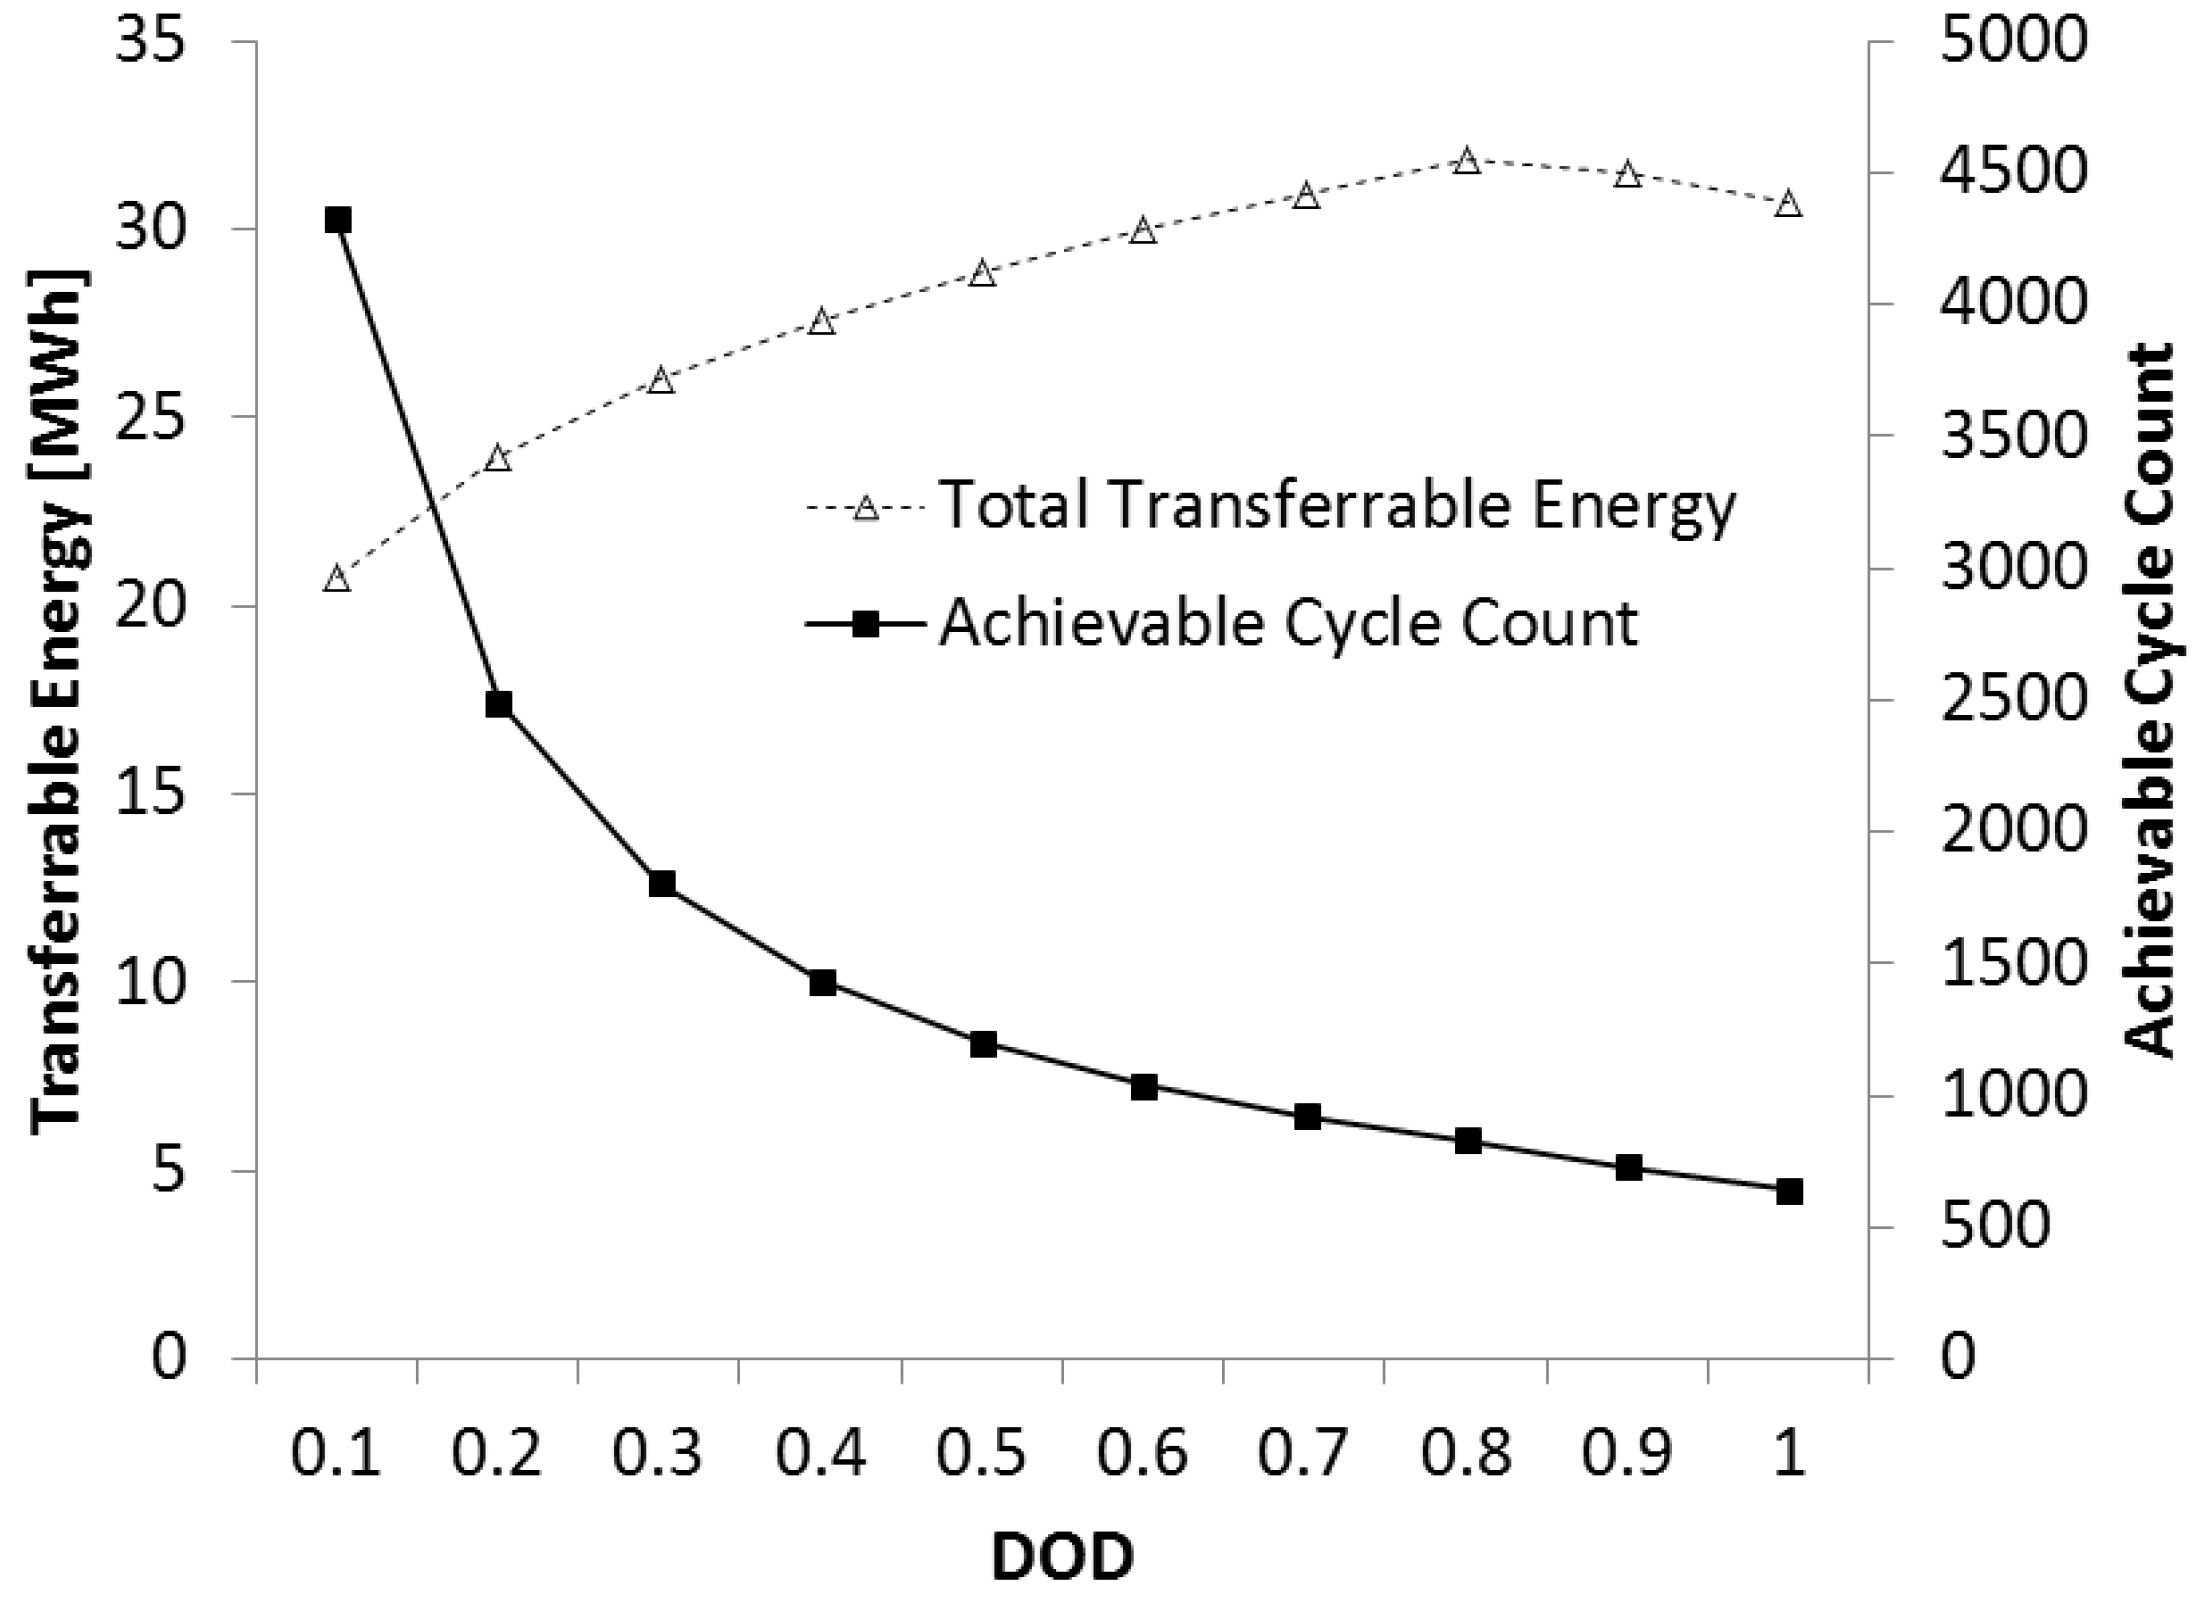
3.2. Depth-of-Discharge

It is well known that depth-of-discharge (DOD) has a strong relationship to the achievable cycle count (ACC). For example, the DOD-ACC data for a lithium-ion battery in [9] shows that the battery life sustains up to 4300 cycles at 10% DOD, while it drops down to 700 cycles at 100% DOD (full cycle). At a glance, the life cycle seems to vary hugely depending on DOD and to be prolonged when cycled at lower DOD. In fact, however, the actual cycle life is different from what it is seen. In practice, the cycle life of a battery should be evaluated by how much energy it can transfer (charge and discharge) during its whole life rather than the cycle count. To this end, we estimated the total transferrable energy during the life cycle of a battery with respect to DOD using Equation (1) and depicted the results along with the ACC curve in Figure 3:
Total Transferrable Energy(DOD)=2 × ACC(DOD) × DOD × Battery Size
It is noted the transferrable energy increases while the ACC decreases, as the DOD deepens. This is because that although ACC itself decreases, the energy for a single cycle increases at a higher rate. The result leads to a meaningful fact that shallower cycle does not necessarily yield better cycle life. For our analysis, the more important fact is that the gap between the best and the worst cycle life performances is not as critical as seen in the ACC curve. The maximum transferrable energy is achieved when cycled at 100% DOD which is just around 50% larger than the minimum case.
Figure 3. Achievable Cycle Count and Total Transferrable Energy with respect to DOD.
Energies 06 00748 g003
Along with the above result, we also calculated the probability of SOC deviation by the V2G regulation for a 16 kWh battery. The maximum power, and hence the bid power, is set to 3 kW considering a home charging scenario. The control period is ten seconds following a typical regulation signal interval. Assuming that the regulation signals come in a stochastic manner following the distribution in Figure 2 and are balanced between up and down, the probability of SOC deviation can be estimated using the random walk theory. The SOC deviation occurs as a result of uneven controls between the regulation up and down. Considering the average power is 20% of the contracted power capacity, which in this case is 3 kW × 0.2 = 0.6 kW, and the signal interval is 10 seconds, the average SOC deviation for each regulation signal yields around 0.01% [= 0.0016 kWh ~= (3 kW × 0.2 × 10)/3600]. For the SOC to be deviated as much as 1%, thus, the amount of biased control should reach to 100 times. Putting all these together, the probability of SOC deviation can be calculated using following equation:
Probability ( Δ SOC = x [ % ]   for  h  hours ) = ( 360 h ( 360 h + 100 x ) / 2 ) 2 360 h  
From Equation (2), the probability of SOC deviating just 0.1% over an hour is calculated as 0.036, which is already very small. Moreover, the probability decreases exponentially for higher SOC deviation, as illustrated in Figure 4. Conversely, the SOC deviation tends to increase as the time span increases. Nevertheless, considering that the SOC is reset regularly between by plug-in and plug-out, the maximum deviation would be limited to a certain level. To validate this, we performed a simulation over 48 hours (two days) assuming the vehicle plugs in at 50% of the SOC and follows the same battery parameters mentioned previously. The resulting SOC trajectory is depicted in Figure 5. As expected, the SOC deviation remains within a very narrow SOC range and the maximum deviation does not exceed a few percent for each trial.
From above discussion, it can be concluded that V2G regulation causes a very small deviation in SOC. In practice, the major SOC deviation is controlled by an aggregator and only small deviation will be appended by regulation. Moreover, even in the worst case which is unlikely to happen, the effective difference of the cycle life is just around 50%. As a result, the impact of the DOD would be very small in performing the V2G regulation, and hence negligible.
Figure 4. Probability distribution of SOC deviation for an hour by V2G regulation.
Energies 06 00748 g004
Figure 5. Simulated SOC trajectory by V2G regulation.
Energies 06 00748 g005

4. Economic Feasibility of V2G Frequency Regulation

In 1992, the United States Council for Automotive Research LLC (USCAR) was founded by three major U.S. automakers—Chrysler, Ford and General Motors—to strengthen the technology base of the U.S. auto industry through cooperative research and development. As an affiliated organization of the USCAR, a technical team called U.S. Advanced Battery Consortium (USABC) LLC has been set up to develop the electrochemical energy storage technology that can expedite commercialization of fuel cell, hybrid, and electric vehicles. USABC has set up several goals for each criterion of energy storage systems that include PHEV and EV [19]. These goals specify various criteria regarding the performance and the life of the energy storage systems. Among those criteria, we are interested in the cycle life of the battery for PHEV and EV that would be used for the typical V2G services. Although the requirements of USABC are not an enforced regulation, it is referred to in practice by the battery manufacturers since it is enacted by the consortium of major automakers and the United Stated Department of Energy (DOE) has issued a battery test procedure manual adopting these goals [20]. More specifically, most battery manufacturers consider the USABC goals as the minimum requirements and set higher standards for their own batteries. Consequently, if the cost analysis based on these USABC criteria indicates that the expected V2G income can compensate the battery wear cost, it will be still valid with actual batteries. This will be further verified through the experiments with actual batteries in Section 5.
Our estimation method is as follows: firstly, the test pattern specified in the USABC test manual is analyzed and the amount of energy during a single cycle is calculated, which we will refer to as single cycle energy (SCE). It should be noted that the SCE is different from the net energy capacity of a battery. Since we are interested in the amount of the energy that causes the battery wear, all the fractions of energy transferred in and out during the cycle pattern are added together regardless of the direction. Then, the total amount of energy that a battery can transfer during its life cycle is calculated by multiplying the cycle life goal specified in the USABC requirements. We will refer this value as life cycle energy (LCE). Finally, the expected income of V2G frequency regulation is calculated by multiplying the unit price per energy estimated in Section 2.
It should be noted that while our estimation method assumes the battery is fully dedicated to the V2G service, an actual battery will be used mainly for driving purposes and the V2G will be rather incidental. Therefore, the estimated result itself does not represent a practical income of the V2G regulation. Rather, the result should be recognized as a measure for assessing the economics of the V2G regulation considering the wear cost, which, in this case, is the battery price.

4.1. Analysis of the USABC Test Profiles

The USABC test manual describes two test profiles for two types of PHEVs. Unlike pure EVs, PHEVs are equipped with an internal combustion engine (ICE) so the vehicles can run on the hybrid mode in which a motor assists the ICE within a narrow SOC range after the SOC reaches a certain level. Thus, the USABC test manual provides two test procedures called a charge depleting (CD) cycle life test for the pure electric driving and a charge sustaining (CS) cycle life test for the hybrid driving. USABC also provides the cycle life targets for each test. Specifically, a PHEV battery should be able to run 300,000 cycles of a CS profile and 5000 cycles of full charge and discharge with a specific CD profile, simultaneously.
These test sets are separately prepared for two different types of PHEV batteries, which are referred to as the minimum PHEV and the maximum PHEV, respectively. The minimum PHEV battery is destined for the high power while the maximum PHEV battery aims for longer distance. Regarding the CS cycle life test, the same profile is commonly used for both types of the batteries. This profile transfers 50 Wh in and out of the device for 90 s, respectively, hence yielding 100 Wh of the SCE for a single CS cycle. Considering the cycle life target is 300,000 cycles, the total amount of energy that can be transferred with the CS profile during the life cycle of the battery is 30,000,000 Wh or 30 MWh [= (50 Wh + 50 Wh) × 300,000 cycles)] (Appendix 1.1). On the other hand, the CD cycle life test is defined separately for each of the minimum and maximum PHEV batteries. In both cases, the cycle life target is 5000 cycles of full discharge and charge at maximum allowable DOD, which is usually 80% of the battery capacity. To be specific, the discharge phase for a minimum PHEV battery consists of five cycles of a CD profile. Since the CD profile is designed to represent not only the motor driving but also the regeneration, both of the charge and discharge phases are included. From the analysis of each fraction of the CD profile, we could estimate that a single CD cycle for the minimum PHEV causes the battery to be charged 142 Wh and to be discharged 687 Wh, respectively. Consequently, the net energy deviation would be 2725 Wh [= (687 Wh − 142 Wh) × 5 times] and the absolute amount of the transferred energy through the device yields 4145 Wh [= (687 Wh + 142 Wh) × 5 times] during a single discharge phase. On the other hand, the charging cycle will have a monotonic curve since it occurs only when the vehicle is plugged in. Therefore, both of the net deviation and the absolute amount are identical as 2725 Wh for the charging phase. As a result, SCE of the CD cycle life test for the minimum PHEV battery is computed to be 6870 Wh (= 4145 Wh + 2725 Wh). In addition, the transferrable energy during the life cycle of the battery can be calculated to be 34 MWh by multiplying the cycle life target, 5000 cycles (≈ 6870 Wh × 5000 cycles) (Appendix 1.2). The quantities discussed above are illustrated in Figure 6.
Figure 6. A single full cycle at 80% DOD with the CD profile for a minimum PHEV battery.
Energies 06 00748 g006
Since the USABC explicitly specifies that a PHEV battery should meet both of the CS and CD cycle life tests simultaneously, the LCE of a battery is the sum of the transferrable energy of CS and CD cycle life tests, which is 64 MWh (= 30 MWh + 34 MWh) for a minimum PHEV battery.
In a similar way, we estimated the CD profile for the maximum PHEV battery at 116 MWh (Appendix 2.2). The specification of the CS cycle life test is the same as with the minimum PHEV battery, and thus the LCE of the maximum PHEV battery is computed to be 146 MWh (= 30 MWh + 116 MWh).
For EV, USABC only specifies a charge depleting goal of 1000 cycles due to the lack of hybrid driving. Unlike for PHEVs, no specific test profile is provided, and thus we employed a 1372-second test profile called Federal Urban Driving Schedule (FUDS) for the assessment [21]. According to this procedure, the FUDS regime is applied to the DOD of 80% or until other manufacturer-specified constraints have been reached. In the latest USABC goals for EV, the target battery size is specified as 40 kWh. Therefore, the effective energy capacity of the EV battery can be considered as 32 kWh at 80% DOD. From the analysis of the FUDS profile, we estimated that the charging and discharging occur 23.2% and 123% of the net available energy, respectively. In other words, while an EV battery is depleting 32 kWh, which is the effective energy capacity, the battery transfers in 7.4 kWh (= 23.2% of 32 kWh) and out 39.4 kWh (123% of 32 kWh), respectively. Then, as in the PHEV case, the battery is monotonically charged back to the full capacity assuming the plug-in charging environment. Consequently, the SCE of an EV battery with the FUDS profile yields 79 kWh [= 32 kWh × (1.23 + 0.232) + 32 kWh] and the LCE of the battery yields around 79 MWh (= 79 kWh × 1000 cycles) (Appendix 3).
From the cycle pattern, we also estimated some other important parameters related to the cycle life of the battery such as power/energy ratio (C-rate) and effective energy capacity of the batteries for the USABC test profiles. The quantities obtained above are summarized in Table 1.
Table 1. USABC goals and Parameters for PHEV and EV.
ParametersMinimum PHEVMaximum PHEVEV
CD cycle life target/Transferrable Energy(MWh)5000/345000/1161000/79
CS cycle life target/Transferrable Energy(MWh)300,000/30300,000/30NA
LCE (MWh)6414679
Effective energy capacity (kWh)2.79.332
Average C-rate for CS profile 1.250.37NA
Average C-rate for CD profile2.430.611.48 *
* Assumed 120 kW and 60 kW for discharge and charge, respectively.
If a battery is fully utilized for the V2G regulation service, the LCE in Table 1 can be directly mapped into the V2G income utilizing the result in Section 2. Then, the economics of the V2G can be judged by comparing the estimated V2G income with the battery prices.
Note that the LCE of EV battery is estimated only with full cycling (CD mode), while that of PHEV is estimated considering both of the CD and CS cycles. In practice, battery wear is far more accelerated with deep cycles than shallow cycles when same amount of energy is transferred [16]. Consequently, it can be inferred that the CD cycle will expedite the degradation of the battery much faster than the CS cycle due to its deep cycling characteristic. In addition, the average C-rate of the CD profile is almost twice larger than that of the CS profile, as depicted in Table 1. Therefore, the battery wear caused by the CS cycle would be less significant.
The significance of the deep cycling can be also inferred from the fact that CS cycle is commonly applied regardless of the battery size, while the CD profiles are prepared separately for each battery size. In an actual V2G frequency regulation, the cycling depth of each PHEV battery can be manipulated to a certain level due to the flexibility of distributing the regulation signal by an aggregator [5,14]. Thus, if an aggregator is designed to minimize the cycling depth of each vehicle battery, the cycle life of the battery can be extended hence enhancing the effective V2G income.

4.2. V2G Economics Considering the Battery Price

Once the LCE is estimated, the expected V2G income can be calculated by multiplying the unit income per MWh derived in Section 2. For example, a battery for the minimum PHEV may earn $12,800 since the LCE is computed to be 64 MWh and the average V2G income per MWh is computed to be $200 (Appendix A1). Likewise, the expected V2G income for maximum PHEV and EV would be $29,200 and $15,800, respectively (Appendix A2 and Appendix A3).
Since the V2G income is estimated regarding the full utilization of the battery, the estimated incomes should, at least, exceed the battery price to ensure the economic feasibility. EV and PHEV markets are in its initial stage and not many vehicles are commercialized yet. Accordingly, the current market price is comparably high. For example, Advanced Automotive Batteries has announced the battery price for very high volumes as $300 to $500/kWh [22]. Better Place, the company currently building car-charging and battery-swapping networks in Israel and Denmark, announced that they purchased batteries for EV at $400/kWh for delivery in early 2012 [23]. Consequently, the current market price of 40 kWh battery would be around $12,000~$20,000. On the other hand, the unit price for a PHEV battery is nearly double the EV battery price. The U.S. Department of Energy and Ford officially announced the current price as $1,000/kWh in 2009 [24,25]. Since the net energy capacity for the minimum and maximum PHEV were computed to be 2.7 kWh and 9.3 kWh, respectively, assuming 80% of the allowable DOD, the actual battery capacities would be 3.4 kWh and 11.6 kWh, respectively. As a result, the minimum PHEV battery would cost around $3,400 while the maximum PHEV would cost around $11,600. In practice, the actual battery pack would be a bit more expensive than these prices due to the bundled system equipment such as the battery management system. Nevertheless, the biggest portion of the price is from the cell cost, and thus for convenience we will consider only the cell price.
The primary goal of an EV battery is set to $150/kWh for 25,000 units per year at 40 kWh by USABC, while the ultimate goal is set to $100/kWh [26]. Thus, the system price for the 40 kWh EV battery would be around $4,000~$6,000 plus the system bundles such as the battery management system. On the other hand, the goal prices for PHEV are described directly in terms of the system price as $1,700 and $3,400 for the minimum and maximum PHEVs, respectively [19]. Using the estimated battery capacities, we can show that the unit price will be around $500 (= $1,700/3.4 kWh) and $293 (= $3,400/11.6 kWh) for the minimum and maximum PHEVs, respectively. These prices are comparably more expensive than that of the EV battery because the cells of the EV batteries are built with larger capacity and a less manufacturing cost per unit kWh.
The computed V2G incomes and prices obtained above are summarized in Table 2 for comparison. For PHEVs, the estimated V2G incomes exceed the goal prices and even the current prices of the batteries. The V2G income of the EV, however, places in the middle range of the current battery price. This is because no CS cycle is considered in estimating the LCE of the EV battery. If the portion of CS cycle is considered as in the PHEV batteries, the V2G income for EV would be much higher.
V2G incomes in this result are calculated assuming the average regulation price as $40/kWh from the investigation in Section 2. Although the market price has been surveyed over a sufficient interval, the price may vary depending on the area and the period of investigation time. To illustrate the effect, we also calculated the break-even regulation price which covers the battery cost exactly. For example, the minimum PHEV battery can provide the V2G regulation in an economically feasible manner as long as the regulation price holds above $10.6/kWh.
As a result, all types of batteries seem to be able to provide sufficient incentive to the vehicle owners with the V2G frequency regulation. Of course, there would be extra cost to facilitate the V2G service, for example, communication infrastructure. Those costs, however, would be accounted only at the initial investigation and the aggregation fee would be just a small portion of the profits. Therefore, as long as the income can provide sufficient profits after deducting the battery wear cost, V2G frequency regulation is highly likely to be economically feasible.
Table 2. Estimated Income of V2G regulation in comparison with battery prices.
TitleMin. PHEVMax. PHEVEV
Battery Size (kWh)3.411.640
Current Price ($)340011,60012,000~20,000
Goal Price ($)170034004000~6000
V2G Income ($)12,80029,20015,800 *
Break-Even Regulation Price ($/kW-h)10.62.540
* The income for EV is only based on the deep cycling.

5. Experiment with a Real Battery: A Case Study

In this section, we provide experimental data to reinforce the results obtained in Section 4. As discussed earlier, the USABC requirements are specified in a general manner and those targets are usually considered as minimal criteria among the manufacturers. For verification, we performed several experiments with actual PHEV and EV cells from SK Innovation as specified in the USABC test manual. The experiment was performed with a pouch type 15 Ah lithium polymer cell with the cathode material of manganese spinel (LiMn2O4). This cell is mainly used for a PHEV battery of more than 10 kWh. The first experiment was performed by following the CD cycle life test of the maximum PHEV as specified in the USABC manual. The cell was cycled at 80% DOD and the reference performance test (RPT) was periodically conducted every 500 cycles to obtain the capacity retention. This result is depicted with extrapolation from the data available in Figure 7. As described in Table 1, the USABC’s cycle life target for CD test is set to be 5000. Unfortunately, our experiment could only run up to 4500 cycles due to the problem of availability of experiment facilities. Nonetheless, the capacity retention after 4,500 cycles is still far above the end-of-life (EOL) criterion, 80% of the original capacity. Moreover, the decrease of the capacity retention shows a definite trend where the extrapolated EOL can be computed as 8000. Apparently, this result is much better than the USABC cycle life target.
After the CD cycle life test, the CS cycle life test was performed with the same cell where the RPT was conducted every 30,000 CS cycles. This experiment also failed to last until the designated EOL due to the lack of the test facility. The capacity retentions obtained for more than one-third of the original CS cycle life target can be seen as in Figure 8. The capacity retention is still 97% at the end of the experiment and the extrapolated EOL is estimated at around 800,000 cycles, which is more than 2.5 times of the USABC target, 300,000 cycles.
As expected, the experiment results show far better performance than the USABC goals, and thus the actual V2G income will be enhanced than the estimated values in Section 4. Specifically, the incomes for minimum and maximum PHEVs with the tested cell would be $27,000 and $53,400, respectively (Appendix A4), and the results are organized in Table 3.
Figure 7. An actual experiment result for the CD cycles with SK Innovation’s commercialized 15 Ah PHEV cell. The dashed line indicates extrapolated cycle count at the end-of-life of the battery.
Energies 06 00748 g007
Figure 8. An actual experiment result for the CS cycles with SK Innovation’s commercialized 15 Ah PHEV cell. The dashed line indicates extrapolated cycle count at the end-of-life of the battery.
Energies 06 00748 g008
A similar test was performed with SK Innovation’s 25 Ah EV cell. As with PHEV cells, this cell is also a lithium polymer pouch type but is mainly used for EVs with bigger than 40 kWh battery packs. The experiment could extend until the actual EOL, 80% retention of the original capacity, is reached. The experimental result is depicted in Figure 9. At 1000 cycles, which is the original cycle life target of USABC, the capacity retention is still above the designated EOL and the actual EOL is reached after 3000 cycles. Consequently, the V2G income with this cell would be around $47,400, which is more than twice of the current battery price.
The updated V2G incomes with the actual test results are illustrated in Table 3 along with previous results for comparison. The break-even prices for the tested cell are illustrated as well. In any case, estimated V2G incomes are far above the current battery prices. Especially, the smaller the size of the battery is, the better the profit is. It is because the same cycle life target is applied for the CS test and the portion of income from the shallow cycles gets bigger for small size batteries. In other words, the V2G income can vary depending on the cycle profiles. Nevertheless, the result of our work is still trustworthy since actual V2G profiles can be manipulated using these profiles by an aggregator as discussed in Section 4.1. In some sense, the actual income can be even better than the estimated ones since a big portion of the estimated V2G income is based on the deep (full) cycles, which is usually not a case for the frequency regulation.
Figure 9. Actual cycle life test result with SK Innovation’s commercialized 25 Ah EV cell.
Energies 06 00748 g009
Table 3. Updated Income of V2G regulation based on the actual experiment results.
TitleMin. PHEVMax. PHEVEV
Battery Size (kWh)3.411.640
Current Price ($)340011,60012,000~20,000
Goal Price ($)1,70034004000~6000
V2G Income ($) with USABC goals12,80029,20015,800 *
V2G Income ($) with SK’s cells27,00053,40047,400 *
Break-Even Regulation Price for SK’s Battery ($/kW-h)58.713.8
* The income for EV is only based on the deep cycling.

6. Conclusions

For the first time, the economic feasibility of V2G frequency regulation is investigated considering the battery wear. The assessment method is based on a general performance specification for PHEV and EV batteries to generalize the result regardless of the battery manufacturer. In addition, the result based on the USABC specifications is further verified through real experiments with commercialized battery cells. Through the general assessment with the USABC goals, the V2G incomes are estimated and compared with current and projected battery prices. The results show that that the V2G regulation can provide sufficient incentives for overcoming the cost of battery wear even under current market situation. In consideration of the characteristic of frequency regulation that the charging and discharging cycle depth would be shallow in most cases, the cycle life of battery will be far more extended together with well-designed aggregators, which makes the V2G service more profitable.

Appendix

A1. For Minimum PHEV

A1.1. Charge Sustaining Mode

Charged energy: 50 Wh
Discharged energy: 50 Wh
Net energy deviation: 0 Wh
Single cycle energy (SCE): 100 Wh
Target cycle count: 300,000
Transferrable Energy during the target life cycle: (50 Wh + 50 Wh ) × 300,000 = 30 MWh

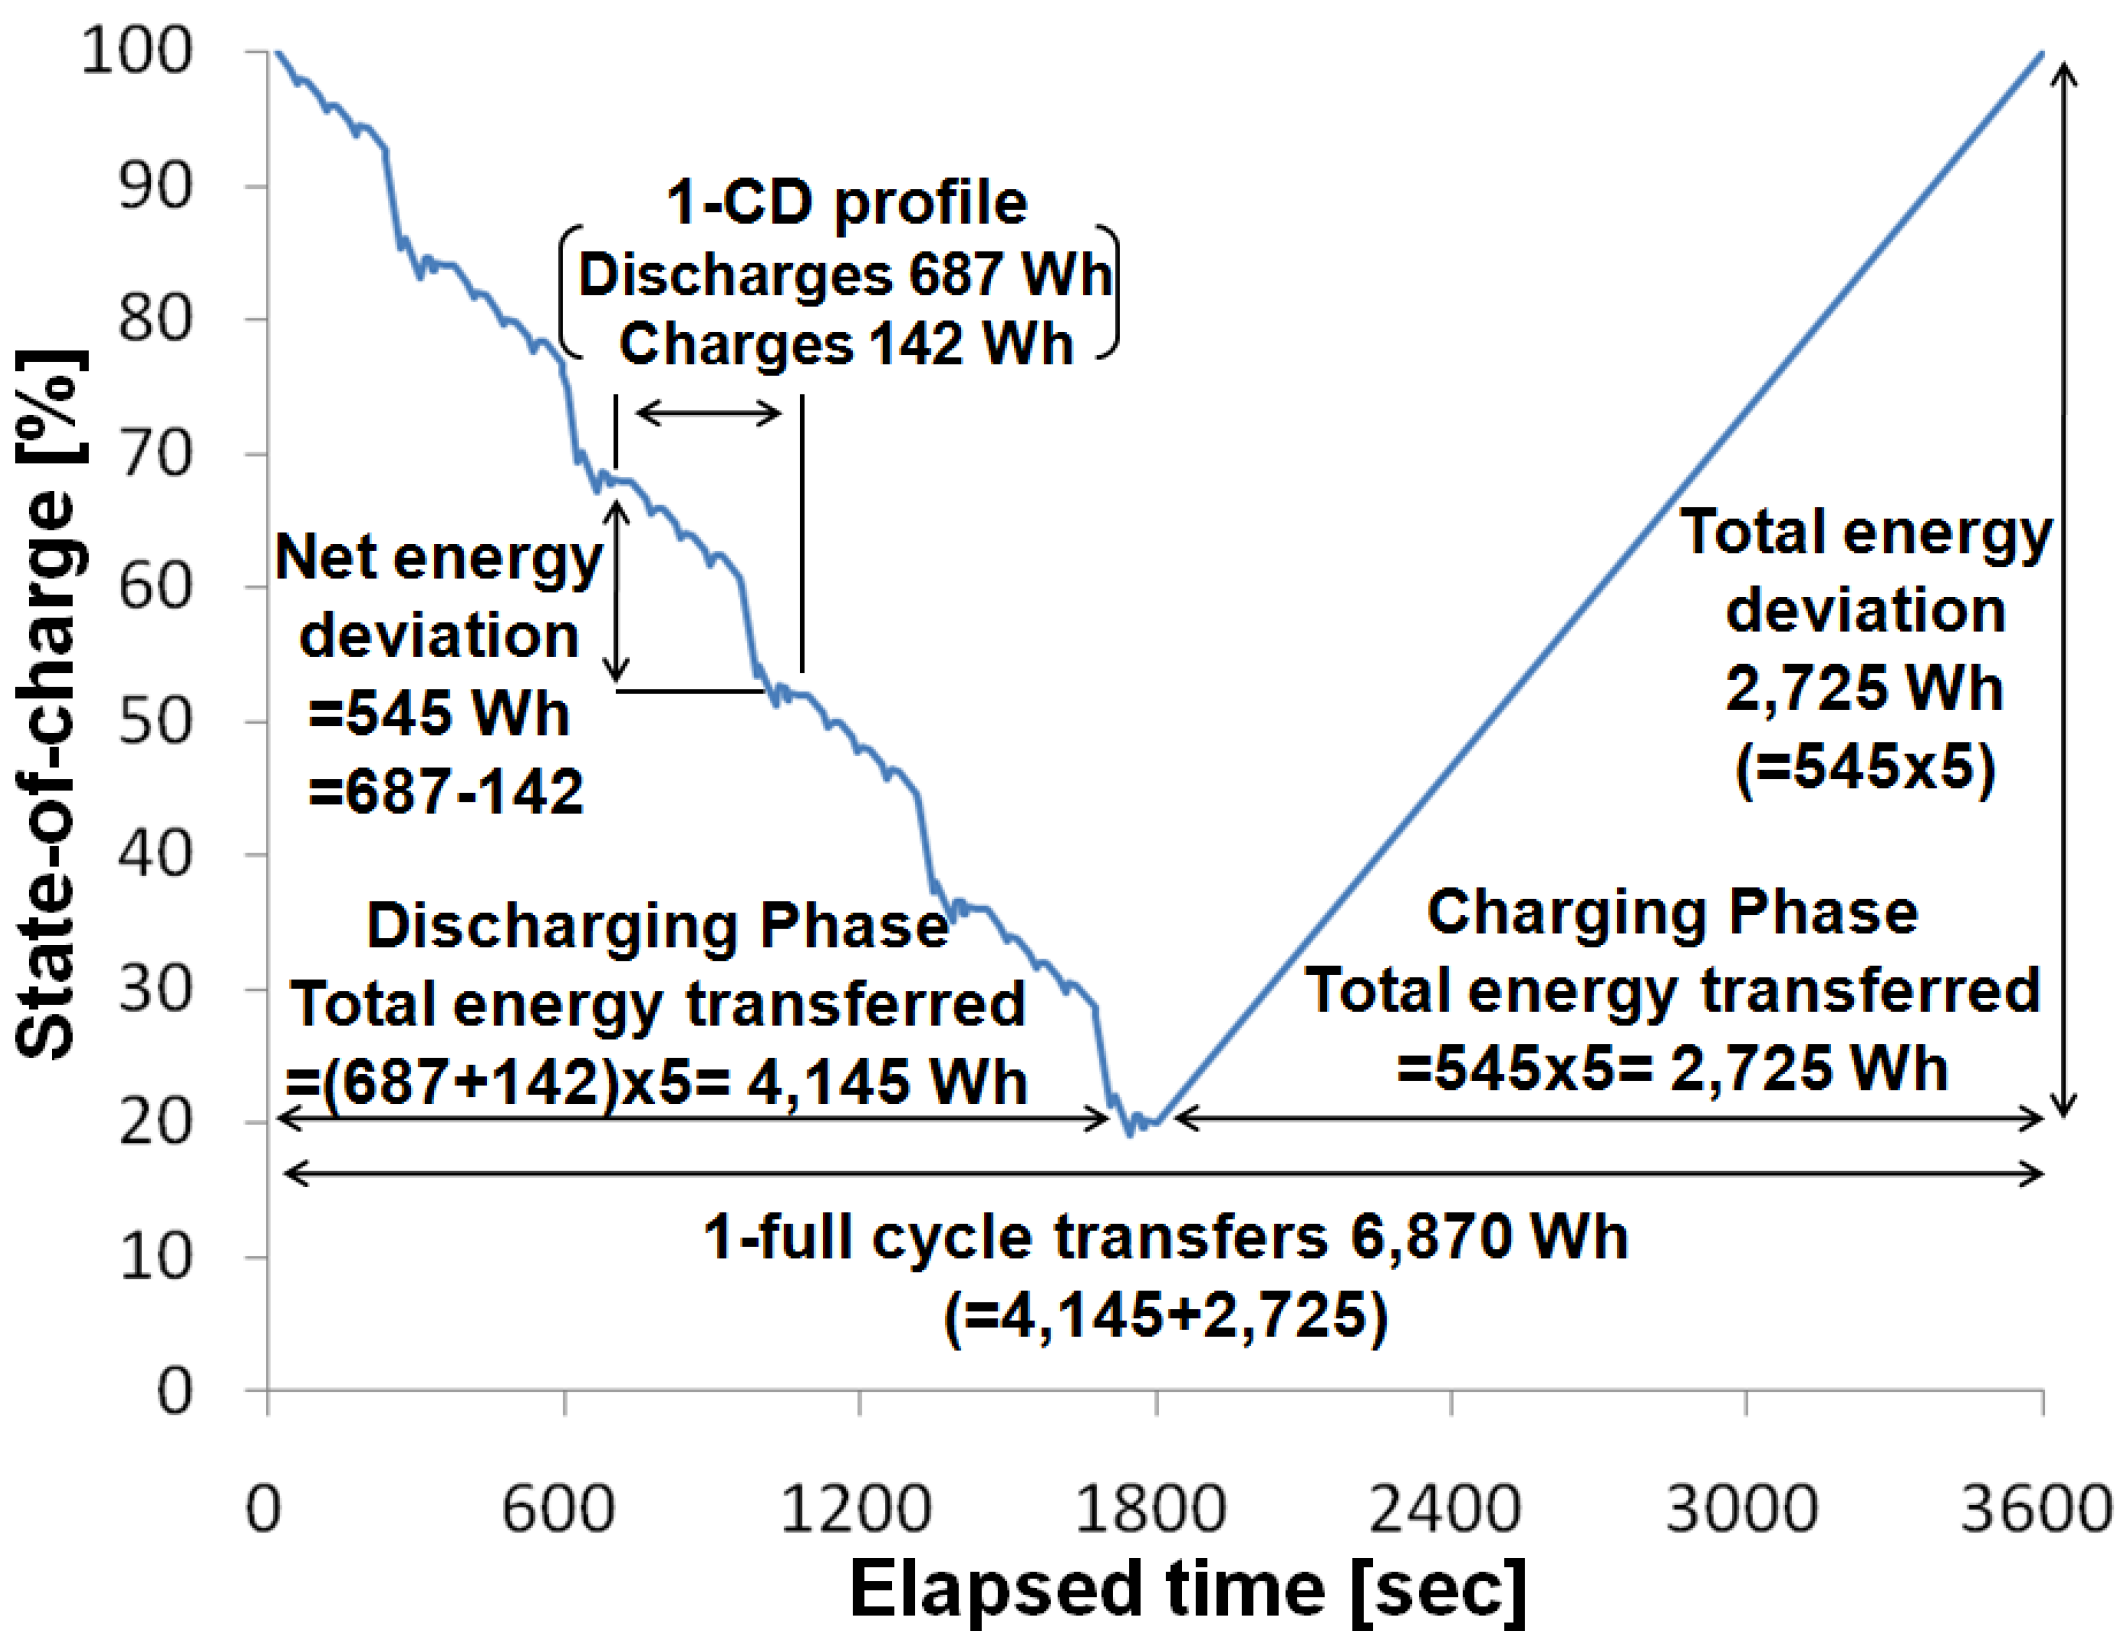
A1.2. Charge Depleting Mode

Charged energy: 142 Wh
Discharged energy: 687 Wh
Net energy deviation: −545 Wh
Transferred energy: 829 Wh
Repeat count for a single discharge cycle: 5
Single cycle energy (SCE): (829 Wh + 545 Wh) × 5 = 6870 Wh
Target cycle count: 5000
Transferrable Energy during the target life cycle: 6870 Wh × 5000 = 34 MWh
-
Life cycle energy (LCE): 30 MWh + 34 MWh = 64 MWh
-
Expected V2G income for minimum PHEV: 64 MWh × $200 = $12,800

A2. For Maximum PHEV

A2.1. Charge Sustaining Mode

Same as minimum PHEV: 30 MWh

A2.2. Charge Depleting Mode

Charged energy: 119 Wh
Discharged energy: 582 Wh
Net energy deviation: −463 Wh
Transferred energy: 701 Wh
Repeat count for a single discharge cycle: 20
Single cycle energy (SCE): (701 Wh + 463 Wh) × 20 = 23,280 Wh
Target cycle count: 5000
Transferrable Energy during the target life cycle: 23,280 MWh × 5000 = 116 MWh
-
Life cycle energy (LCE): 30 MWh + 116 MWh = 146 MWh
-
Expected V2G income for maximum PHEV: 146 MWh × $200 = $29,200

A3. For EV (with FUDS)

-
Target pack size specified by USABC: 40 kWh
-
Net energy deviation (at 80% DOD): −32 kWh
-
Discharging energy/net energy ratio: 123%
-
Charging energy/net energy ratio: 23.2%
-
Discharging energy during the pattern: 40 kWh × 80% × 123% = 39.36 kWh
-
Charging energy during the pattern: 40 kWh × 80% × 23.2% = 7.424 kWh
-
Single cycle energy (SCE): (39.36 kWh + 7.424 kWh + 32 kWh) = 79 kWh
-
Target cycle count: 1000
-
Life cycle energy (LCE): 79 kWh × 1000 = 79 MWh
-
Expected V2G income for EV: 79 MWh × $200 = $15,800

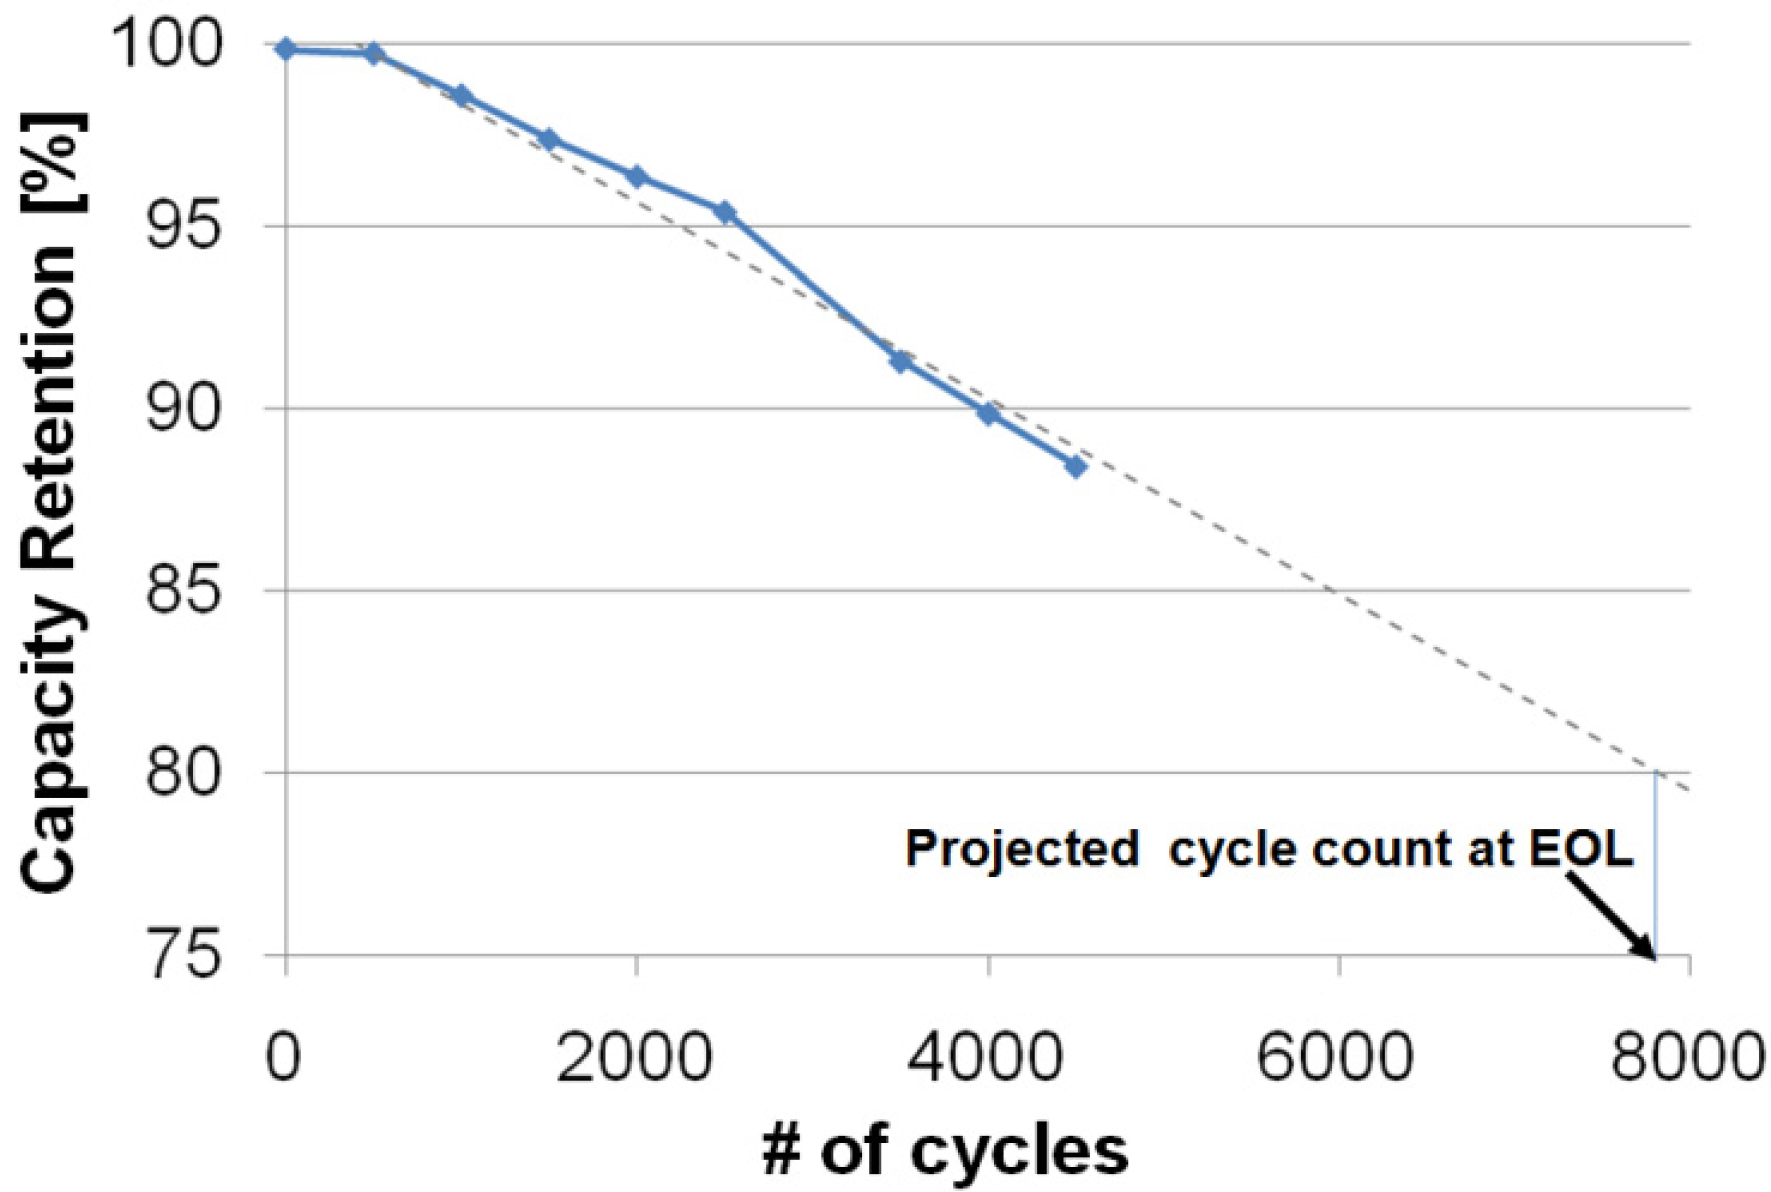
A3.1. SK Innovation’s 15 Ah cell for PHEV

-
Projected CS cycle count: 800,000 = 2.7 times of the target CS cycle count
-
Projected CD cycle count: 8000 = 1.6 times of the target CD cycle count
-
Life cycle energy (LCE) for minimum PHEV: 30 MWh × 2.7 + 34 MWh × 1.6 = 135 MWh
-
Life cycle energy (LCE) for maximum PHEV: 30 MWh × 2.7 + 116 MWh × 1.6 = 267 MWh
-
Expected V2G income for minimum PHEV: 135 MWh × $200 = $27,000
-
Expected V2G income for maximum PHEV: 267 MWh × $200 = $53,400

A3.2. SK Innovation’s 25 Ah cell for EV

-
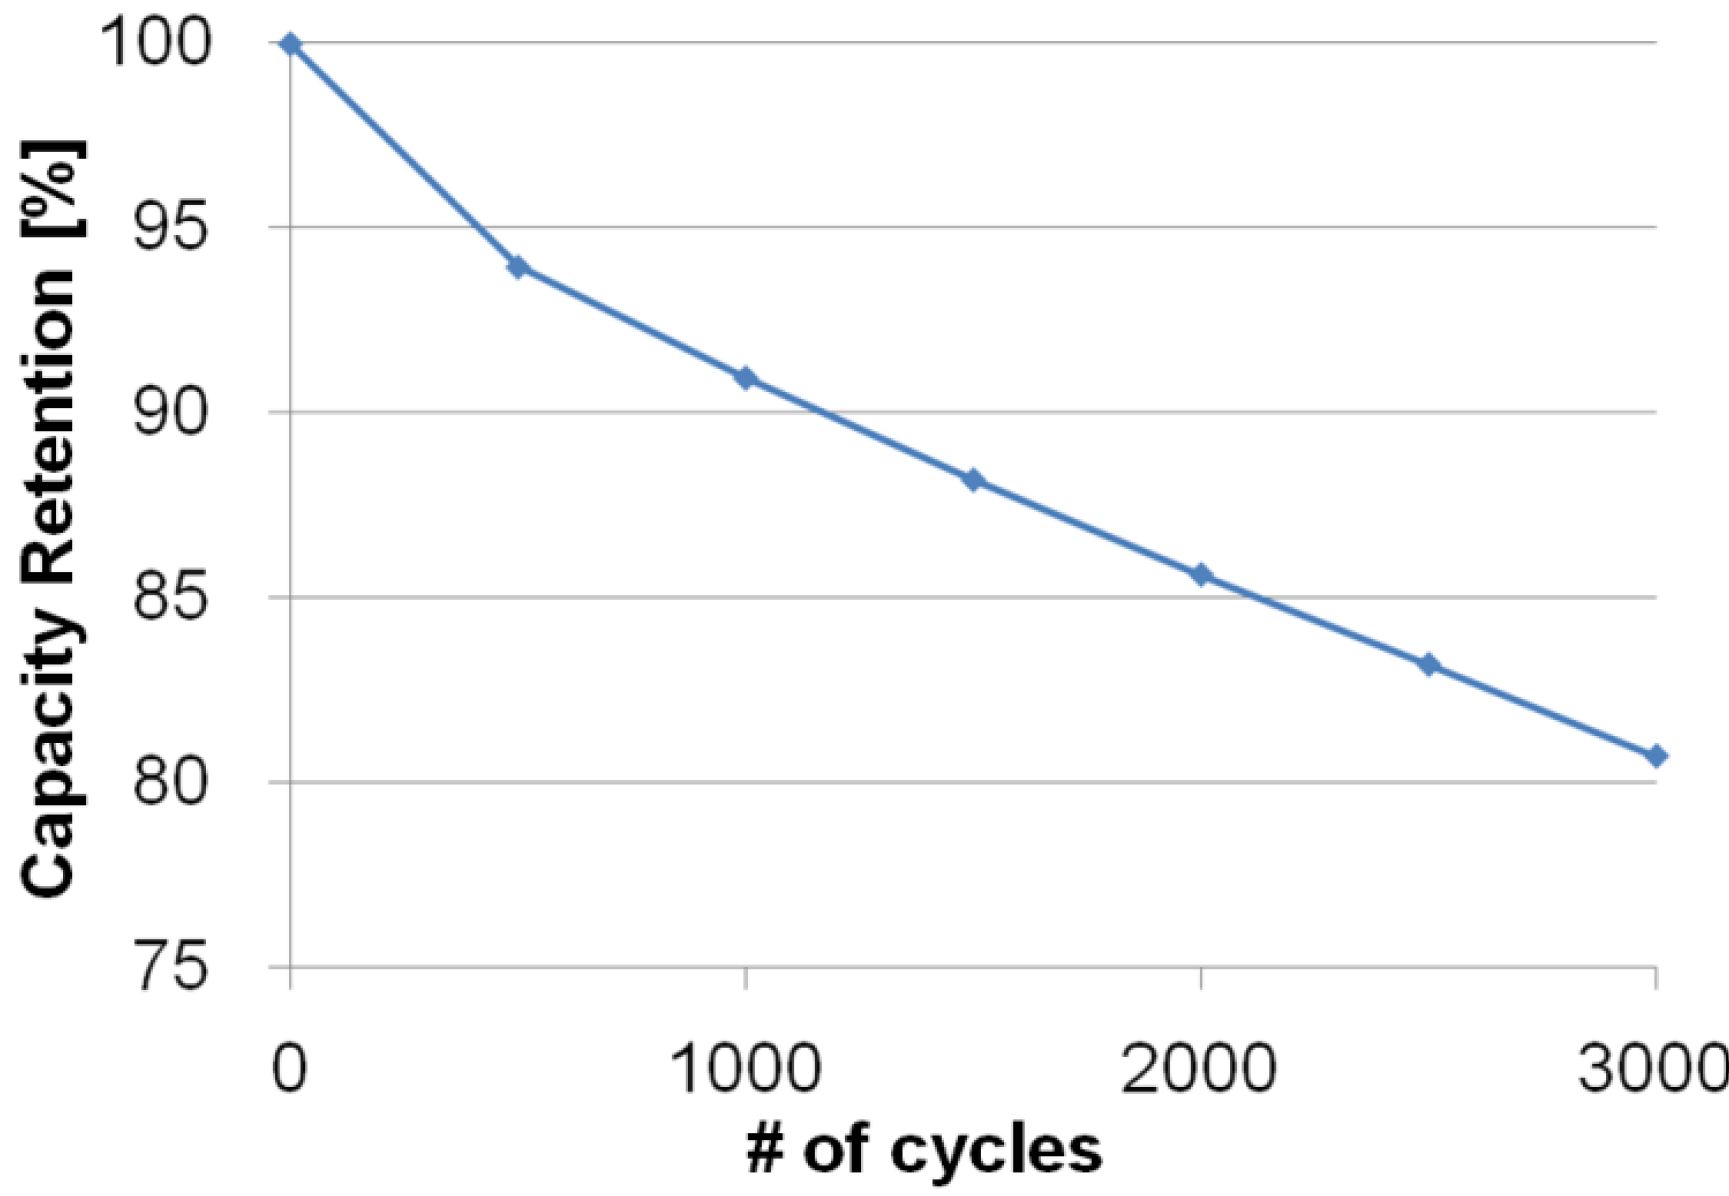
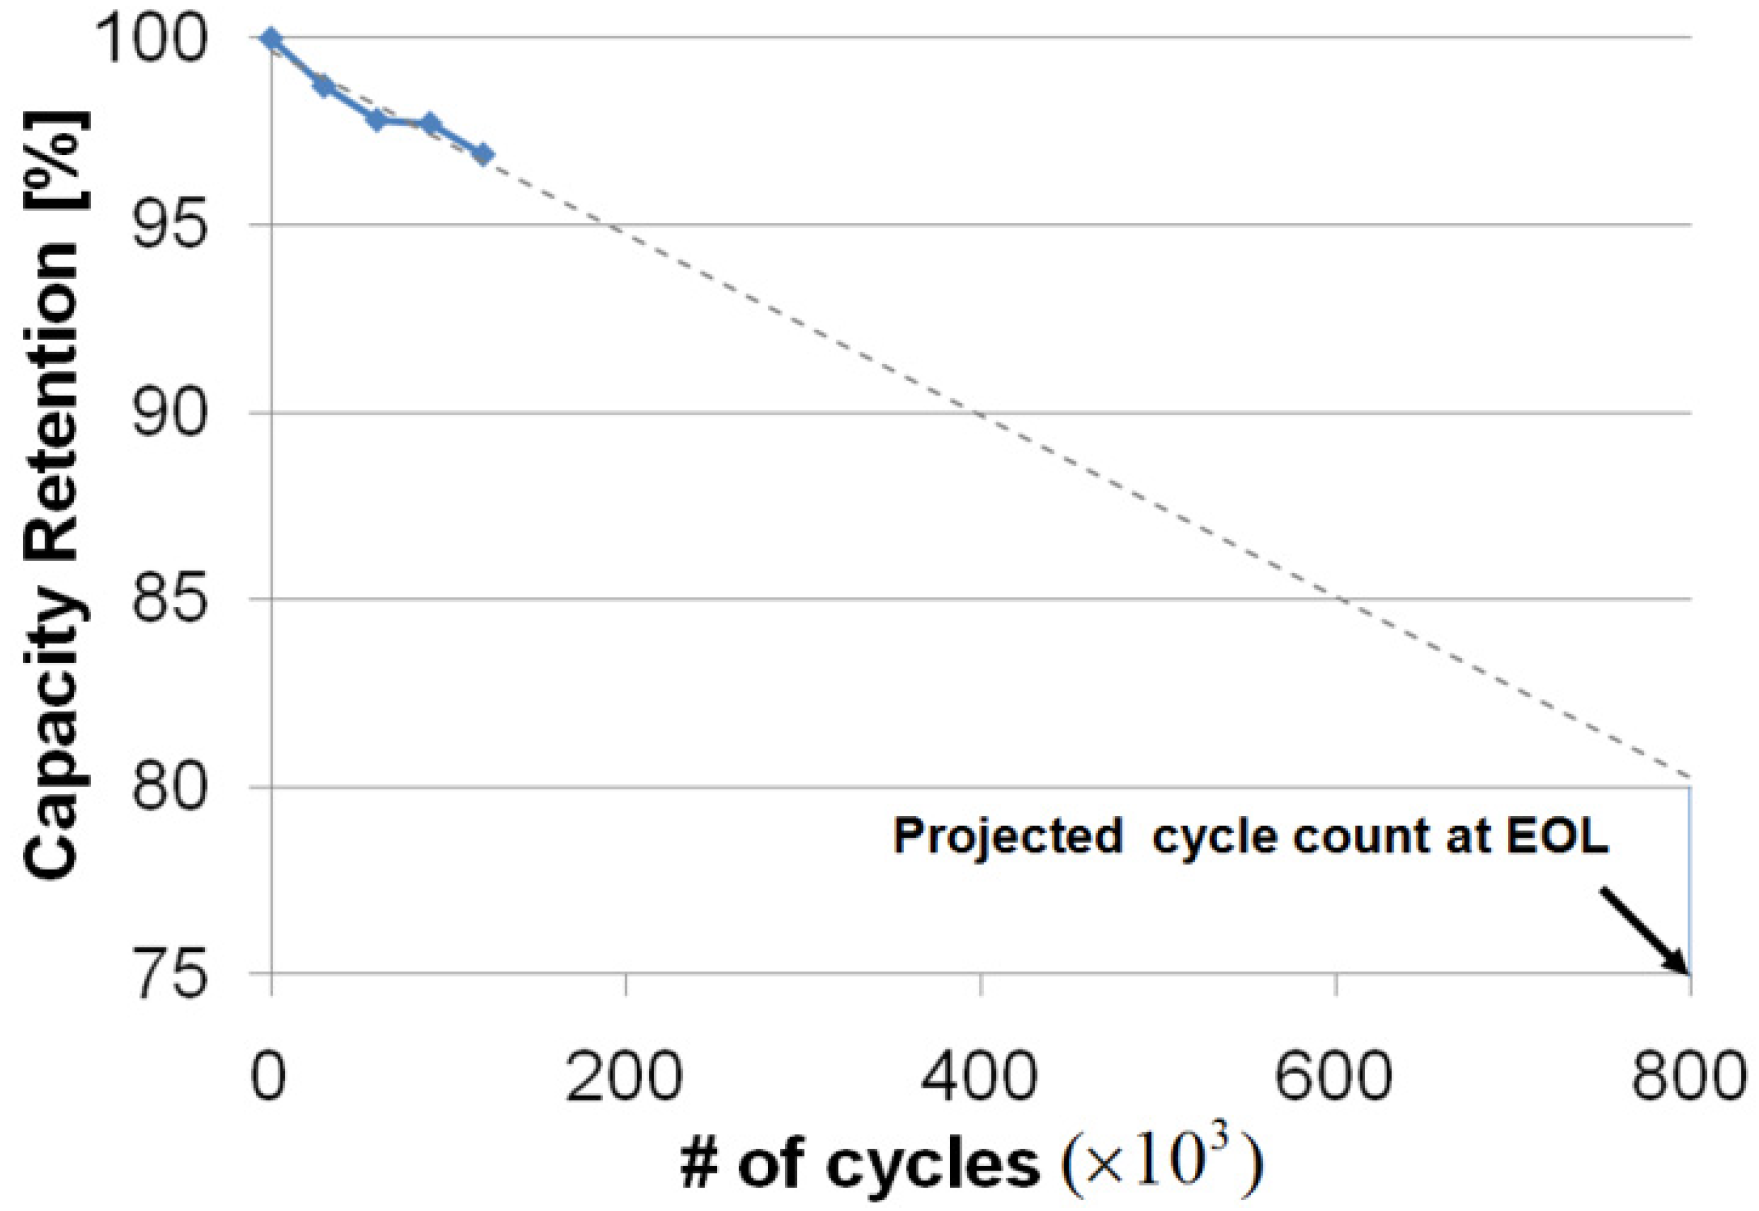
Cycle count at EOL: 3000 = 3 times of the target EV cycle count
-
Life cycle energy (LCE) for EV (40 kWh): 79 MWh × 3 = 237 MWh
-
Expected V2G income for EV: 237 MWh × $200 = $47,400

References

  1. Kempton, W.; Letendre, S.E. Electric vehicles as a new power source for electric utilities. Transp. Res. D 1997, 2, 157–175. [Google Scholar] [CrossRef]
  2. Kempton, W.; Tomic, J. Vehicle-to-grid power fundamentals: Calculating capacity and net revenue. J. Power Sources 2005, 144, 268–279. [Google Scholar] [CrossRef]
  3. Kempton, W.; Kubo, T. Electric-drive vehicles for peak power in Japan. Energy Policy 2000, 28, 9–18. [Google Scholar] [CrossRef]
  4. Tomic, J.; Kempton, W. Using fleets of electric-drive vehicles forgrid support. J. Power Sources 2007, 168, 459–468. [Google Scholar] [CrossRef]
  5. Gage, T.B. Development and Evaluation of a Plug-in HEV with Vehicle-to-Grid Power Flow; Technical Report for AC Propulsion Inc.: San Dimas, CA, USA, 2003. [Google Scholar]
  6. Kempton, W.; Udo, V.; Huber, K.; Komara, K.; Letendre, S.; Baker, S.; Brunner, D.; Pearre, N. A Test of Vehicle-to-Grid (V2G) for Energy Storage and Frequency Regulation in the PJM System. Results from an Industry-University Research Partnership. 2008. Available online: http://www.udel.edu/V2G/resources/test-v2g-in-pjm-jan09.pdf (accessed on 31 January 2013).
  7. Petersona, S.; Whitacrea, J.; Apt, J. The economics of using plug-in hybrid electric vehicle battery packs for gridstorage. J. Power Sources 2010, 195, 2377–2384. [Google Scholar] [CrossRef]
  8. Petersona, S.; Apt, J.; Whitacrea, J. Lithium-ion battery cell degradation resulting from realistic vehicle andvehicle-to-grid utilization. J. Power Sources 2010, 195, 2385–2392. [Google Scholar] [CrossRef]
  9. Zhou, C.; Qian, K.; Zhou, W. Modeling of the cost of EV battery wear due to V2G application in power systems. IEEE Trans. Power Syst. 2011, 26, 1041–1050. [Google Scholar]
  10. Electric Vehicles Participating in the PJM Ancillary Services Market. Available online: http://www.pjm.com/about-pjm/exploring-tomorrows-grid/phev/evp-ancillary-serv-market.aspx (accessed on 20 December 2012).
  11. Hawkins, D. Power storage R&D—What do the next five years look like? In Proceedings of 2nd Annual Power Storage Conference, Houston, TX, USA, 8 February 2010.
  12. Cost Development Guideline from PJM. Available online: http://www.pjm.com/~/media/committees-groups/subcommittees/cds/20120409/20120409-item-06b-m15-unit-types-not-in-m15-solar-batteries-flywheels.ashx (accessed on 20 December 2012).
  13. PJM Regulation Zone Preliminary Billing Data. Available online: http://www.pjm.com/markets-and-operations/market-settlements/preliminary-billing-reports/pjm-reg-data.aspx (accessed on 20 December 2012).
  14. Han, S.; Han, S.H.; Sezaki, K. Development of an optimal Vehicle-to-Grid aggregator for frequency regulation. IEEE Trans. Smart Grid 2010, 1, 65–72. [Google Scholar] [CrossRef]
  15. PJM Regulation Make Whole Percentages-2010. Available online: http://www.pjm.com/~/media/markets-ops/ancillary/regulation-make-whole-mw.ashx (accessed on 20 December 2012).
  16. Marano, V.; Onori, S.; Guezennec, Y.; Rizzoni, G.; Madella, N. Lithium-ion batteries life estimation for plug-in hybrid electric vehicles. In Proceedings of IEEE Vehicle and Propulsion Conference, Dearborn, MI, USA, 7–10 September 2009; pp. 536–543.
  17. Drouilhet, S.; Johnson, B.L. A battery life prediction method for hybrid power application. In Presented at 35th AIAA Aerospace Sciences Meeting Exhibit, Reno, NV, USA, 6–9 January 1997.
  18. Bashash, S.; Moura, S.J.; Forman, J.C.; Fathy, H.K. Plug-in hybrid electric vehicle charge pattern optimization for energy cost and battery longevity. J. Power Sources 2011, 196, 541–549. [Google Scholar] [CrossRef]
  19. USABC Requirements of End of Life Energy Storage Systems for PHEVs. Available online: http://batt.lbl.gov/files/USABC-Goals-for-PHEVs-EVs-2-pg.pdf (accessed on 31 January 2013).
  20. Idaho National Laboratory. Battery Test Manual for Plug-in Hybrid Electric Vehicles; U.S. Department of Energy: Washington, DC, USA, 2010. Available online: http://batt.lbl.gov/files/USABC-Goals-for-PHEVs-EVs-2-pg.pdf (accessed on 31 January 2013).
  21. Kruse, R.; Huls, T. Development of the Federal Urban Driving Schedule; SAE Technical Paper 730553; SAE International: Warrendale, PA, USA, 7305. [Google Scholar] [CrossRef]
  22. Anderman, M. Electric, plug-in, and hybrid vehicles: Demonstration, niche markets, and mass markets. In Proceedings of 9th International Advanced Automotive Battery & EC Capacitor Conference, Long Beach, CA, USA, 10–12 June 2009.
  23. EV Batteries Plummet in Price: Down to $400 per kWh. Available online: http://www.greentechmedia.com/articles/read/ev-batteries-dropping-rapidly-in-price (accessed on 20 December 2012).
  24. Miller, T. Lithium, lithium everywhere, but who can make it economical? In Proceedings of 9th International Advanced Automotive Battery & EC Capacitor Conference, Long Beach, CA, USA, 10–12 June 2009.
  25. Howell, D. Electric drive vehicle battery R&D and manufacturing initiatives at the US Department of Energy. In Proceedings of 9th International Advanced Automotive Battery & EC Capacitor Conference, Long Beach, CA, USA, 10–12 June 2009.
  26. USABC Goals for Advanced Batteries for EV. Available online: http://www.uscar.org/commands/files_download.php?files_id=27 (accessed on 20 December 2012).

