Article

Dynamic Modeling of Anode Function in Enzyme-Based Biofuel Cells Using High Mediator Concentration

1
Department of Chemical and Materials Engineering, Lee-Ming Institute of Technology, Tai-Sham 24305, Taiwan
2
Department of Chemical Engineering and Materials Science, Yuan Ze University, Chung-Li 32003, Taiwan
*
Author to whom correspondence should be addressed.
Energies 2012, 5(7), 2524-2544; https://doi.org/10.3390/en5072524
Submission received: 21 March 2012 / Revised: 5 June 2012 / Accepted: 27 June 2012 / Published: 17 July 2012
(This article belongs to the Special Issue Hydrogen Energy and Fuel Cells)

Abstract

:
The working principle of enzyme-based biofuel cells (EBFCs) is the same as that of conventional fuel cells. In an EBFC system, the electricity-production process is very intricate. Analysis requires a mathematical model that can adequately describe the EBFC and predict its performance. This paper develops a dynamic model simulating the discharge performance of the anode for which supported glucose oxidase and mediator immobilize in the EBFC. The dynamic transport behavior of substrate, redox state (ROS) of enzyme, enzyme-substrate complex, and the mediator creates different potential changes inside the anode. The potential-step method illustrates the dynamic phenomena of substrate diffusion, ROS of enzyme, production of enzyme-substrate complex, and reduction of the mediator with different potential changes.

1. Introduction

The operating principle of biofuel cells (BFCs) (also called biological fuel cells) is similar to that of conventional fuel cells, regarded as potential substitutes for fossil fuels. BFCs can reduce greenhouse gas emissions and increase energy security. Enzyme-based biofuel cells (EBFCs) are one type of BFC that convert chemical energy into electrical energy. EBFCs are distinguishable from conventional fuel cells by the use of biomass (such as carbohydrates, cellobiose, ethanol, fructose, glucose, glycerol, hydrogen, lactose, methanol, pyruvate, sugars) and specific enzymes known as biocatalysts [1,2,3,4,5,6]. Enzymes immobilized on bio-electrodes facilitate reuse of biocatalysts. In general, the substrate is the biomass oxidized at the anode to produce hydrogen protons and electrons. At the cathode, the oxidant (usually oxygen) reacts with electrons and hydrogen protons to generate water. Three critical challenges in developing direct EBFCs are short lifetime, lower current density, and poor power density. These are related to enzyme stability, electron transfer rate, enzyme loading, and inefficient electron conduction between biocatalysts and bio-electrodes [6,7]. Also, some literature reports electron transfer from enzymes to electrodes as an important factor [2,8,9,10,11,12,13,14,15], but mediators generally shuttle electrons from enzymes to electrodes [16,17].
Nanobiocatalysts overcome the disadvantages in EBFCs, improving electron transfer in the electrode. Many nano-structured materials, such as mesoporous media, nanoparticles, nanofibers, and nanotubes, have been proven to be efficient hosts for the immobilization of enzymes. It is evident that when nanostructures of conductive materials are used, the large surface area of these nanomaterials can increase enzyme loading and facilitate reaction kinetics, thus improving EBFC power density. Nanocarbon materials, such as carbon black, carbon nanotubes, carbon nanoballs and carbon aero-gel particles, form three-dimensional electrodes [14,17,18,19,20,21,22,23,24,25]. In these electrodes, mediators or redox polymers are not chemically immobilized to the nanocarbon materials [14].
Figure 1 shows the schematic structure of the simulated bio-electrode in this study. Small biomolecules such as flavin, mediator, and quinone compounds can transfer electrons directly to an electrode, allowing the study of the electrochemical compounds’ redox behavior [25]. As mediators, various organic, inorganic compounds and some redox proteins have been used [26]. Benzoquinone, hydroquinone, and pyrroloquinoline quinone also may function as mediators for glucose oxidase [27]. Ferri/ferrocyanide [Fe(CN)63−] is highly diffusible and can be easily reduced to its ferrous counterpart by the well-defined reversible reaction simultaneous to increase the redox potential of the solution [16,28], one of the most commonly used inorganic mediators. Large biomolecules, conducting polymers (CPs), proteins, and enzymes are usually sluggish in the electron transfer reaction at an ordinary electrode. Relatively small redox proteins, such as cytochrome c, can exchange electrons rapidly with a promoter-modified electrode or an ordinary electrode under appropriate conditions. The enzymatic reaction for the oxidation or reduction of the substrate (S) is linked to the electrochemical reduction or oxidation of the mediator (Mred/Mox) using the electrode as a final electron acceptor or a donor. Enzyme-catalyzed electrochemical oxidation or reduction of the substrate is called bioelectrocatalysis [29].
Figure 1. Schematic configuration and function of the anode electrode in contact with an EBFC System. S: substrate which bulk concentration is constant; P: product; e: electron; X: biocatalysis thin-film [25].
Energies 05 02524 g001
Figure 2 shows a typical electron and proton kinetic in mediated bioelectrocatalysis of an EBFC system. This reaction is very useful for constructing BFCs, biosensors, bioreactors and for amplified detection of mediators as analytes and enzyme kinetic measurements [26]. To determine kinetic parameters for the bioelectrocatalytic reaction in the film, the system was modeled as described in detail elsewhere [30,31]. The total reactions occurring within the anode can be written as follows:
S enzyme P + n H + + n e
The reaction mechanism is given as follows [2,15,17,18,26,31,32,33,34,35,36,37,38,39]:
S + E ox k 1f k 1b ES k 2f E red + P + H +
E red + M ox k 3 f k 3b E ox + M red
M red i ox i red M ox + e
where (Eox, Ered, ES, Mox, and Mred) are the oxidized and reduced forms of enzymes, enzyme-substrate complexes; and oxidized and reduced forms of mediator molecules, and (S) and (P) are the substrates (reactants) and products of enzymatic reaction. k1b and k1f are backward and forward rate constants, respectively (Equation 2); k2f is the product formation rate constant; and k3b and k3f are back and forward rate constants, respectively (Equation 3). The simplest description of steady-state enzyme kinetics is based on the reports of previous works. This treatment based on the assumption that the substrate forms a complex (the enzyme-substrate complex) (ES) with the enzyme in a reversible step, that is maintained at equilibrium between the enzyme (E), substrate (S), and enzyme-substrate complex (ES). Irreversible breakdown of the enzyme-substrate complex yields the product (P) [32]. For an oxidase such as glucose oxidase, the most studied redox enzyme, (Eox) is active towards the substrate (S) and produces the inactive form (Ered) which can be reactivated by oxidation with the cosubstrate (Mox) to form the reduced mediator (Mred), which subsequently is reoxidized at the electrode surface. For a glucose oxidase, the active enzyme is the reduced form and the oxidized form of mediator which is recycled at the cathode. The general mechanism for a mediated enzyme electrode is displayed in Equations (2–4) where the oxidized (reduced) form of the enzyme (Eox) reacts in response to the substrate (S) to form an enzyme–substrate complex (ES), with further decomposition that yields the reduced (oxidized) form of the enzyme (Ered) and the product (P). The oxidized (reduced) form of the mediator (Mox) reoxidizes Ered (Eox) to the active form of the enzyme Eox (Ered) and the reduced (oxidized) mediator (Mred). At the electrode surface, (Mred) is converted to (Mox) Equation (4), which diffuses out from the electrode and reacts with the enzyme [3,21,26,30,32,35].
Figure 2. Dynamic scheme configuration and function on bioelectrodes in EBFC. Eox and Ered: oxidized and reduced forms of enzyme, Mox and Mred: oxidized and reduced forms of mediator, E: enzyme, M: mediator, A: anode electrode, C: cathode electrode [25].
Energies 05 02524 g002
A summary of recent key electrode models in EFCs is presented in Table 1. They are discussed in detail in the following sections. More information can be obtained by sweeping the potential with different scan rates from 0.001 V/s to 1000 V/s [36]. To investigate the discharge performance of biofuel cells, the rate of linear scan voltammogram (LSV) recording the steady state of the enzyme reaction was very slow (1–5 mV/s) [37,38]. Bartlett et al. [37] also used cyclic voltammetry to extract the kinetics parameters with a scan rate of 5 mV/s by steady-state modeling for substrate-enzyme reaction. LSV was used to study the kinetic parameters of enzyme and mediator reactions with a high scan rate 20 mV/s [37]. In this region, the discharge performance and the electrode kinetics are transient transport phenomena. However the transient transport phenomena of enzyme-mediator reactions in the biofuel cell have not received enough attention regarding their relation to mediator dispersion. The function of a mediator is to enhance the electronic properties of electrode and reduce the path of electronic migration. The mediator dispersion depends on the concentration of the mediator.
Table 1. Summary of enzyme electrode models.
ElectrodeSpecies kinetic modelSystemImmobilizationElectronic conductivityDescriptionRef.
AnodeS/E/M M-MS-S/diffusion/-E-bound/M-free-Redox mediator entrapped with a hydrogen film[30]
AnodeS/E/M M-MS-S/diffusion/-E-bound/M-free-Practical application of the biosensors, bioreactors and biofuel cell[26]
AnodeS/E/M M-MS-S/diffusion/-E-bound/M-free-Current is function of mediator concentration and electrode potential[39]
CathodeS/E/M  M-MS-S/diffusion/flowE-bound/M-free-Oxygen transport in CME with macrohomogenous/thin-film model[31]
AnodeS/E/- -S-S/diffusion/-E-free /--Electroenzymes at the electrode/solution interface[40]
AnodeS/E/- -S-S/-/-E-free/--Amperometric bioanalytical system for lipase activity assay[41]
AnodeS/E/- -U-S/-/-E-bound/--Electrochemical system of lipase activity detection[42]
CathodeS/E/M M-MS-S/diffusion/-E-bound/M-free-Redox polymer-mediated enzyme electrode[35]
AnodeS/E/M M-MS-S/diffusion/-E-bound/M-free-High-surface-area electrode of redox polymer-grafted carbon[17]
AnodeS/E/M M-MS-S/diffusion/-E-bound/M-free-Redox enzyme CME biosensor[43]
AnodeS/E/- M-MU-S/diffusion/-U-E-bound/--Action of biosensor possessing pH and temperature parameters[44]
AnodeS/E/- M-MS/diffusion/-E-bound/--Conducting polymer modified electrode[45]
AnodeS/E/MU-S/diffusion/-E-bound/M-boundkl/ksEnzyme-based biofuel cell using high mediator concentrationThis study
S/E/M: Substrate/Enzyme/Mediator; M-M: Michaels-Menten kinetics; S-S: steady state; U-S: unsteady state; CME: composite mediated electrode; E-bound: enzyme is bound; E-free: enzyme is free; M-free: mediator is free; M-bound: mediator is bound; kl/ks: conductivity of liquid phase/ conductivity of solid phase.
The literature contains several modeling strategies for enzymatic electrodes [46,47,48,49] and enzymatic biosensors [32], but modeling of enzymatic electrodes has been researched more thoroughly. Mathematical models of enzymatic electrodes in the literature usually consider the enzymatic reaction and the material balance of species which are participating in the enzymatic reaction. Recent literature on bioelectroanalytical systems of kinetic models rarely discusses the diffusion [42] and potential [44] of solution in the system. Enhancing the redox reaction of mediator is most effective in upgrading the performance for EBFCs. It is very important to understand the effects of mediators on the performance by a model to evaluate various electrode conditions. The composite model has been demonstrated to realistic for cathode [31,35], and is applied to the mediated oxygen biocathode based on macrohomogeneous and thin-film viewpoint. However, reactions that dominate degrees of redox state (ROS) of enzyme and then determine the discharge of EBFC are unknown. Hence, this study investigates the process of operating anodes to evaluate the rate determining process, a dynamic model to diagnose EBFC systems based on diffusion, solid and liquid potential supported glucose substrate, glucose oxidase, potassium ferricyanide, and pH 7.0 phosphate buffer (0.1 M), (all anode interactions in EBFC systems).

2. Experimental and Modeling

2.1. Chemicals and Materials

GOx, type VII, from Aspergillus niger protein 60%, laccase (LAc) from Trametes versicolor, ABTS, 2,2'-Azino-bis(3-ethylbenzothiazoline-6-sulfonic acid) purity ≥ 98%, Polyaniline (emeraldine salt) Mw > 15,000, Sodium phosphate (monobasic) purity ≥ 99%, and β-D-(+)-glucose were obtained from Sigma (St. Louis, MO, USA). Ferri/ferrocyanide [Fe(CN)63−] purity 99.9%, Sodium phosphate (dibasic, anhydrous) purity 100% and sodium citrate (dehydrate granular) purity 99.5% were purchased from Mallinckrodt Baker (St. Phillipsburg, NJ, USA). Citric acid (monohydrate) purity 99.5% was purchased from Showa (Tokyo, Japan). Carbon paper GDL 10 AA, was obtained from SGL group (Meitingen, Germany). Nafion® 117 proton-exchange membrane (PEM) was obtained from DuPont (Wilmington, DE, USA).

2.2. Enzyme Electrode Preparation

The enzyme composite electrodes were prepared as previously report [25]. Commercial carbon paper cut into 10 mm × 10 mm squares was used in both the cathode and the anode. The anodic solution and cathodic solution were made as follows: 20 U/mL GOx, 20 mM and 40 mM of [Fe(CN)63−], and 20 mM polyaniline. The above materials were mixed with 0.1 M phosphate buffer solution (PBS) pH 7 for the anode electrode. 20 U/mL LAc, 20 mM and 40 mM of 2,2'-azino-bis (3-ethylbenzothiazoline-6-sulfonic acid), and 20 mM polyaniline, were mixed with 0.1 M citric buffer solution (CBS) pH 5 for athode electrode. Two mixture solutions, anode and cathode, were pipetted onto the hydrophilic carbon paper 30 s in air at ambient temperature prior to immobilization of the carbon paper.

2.3. Electrochemical Measurements

The power output performance of the tested EBFCs was characterized by two-electrode electrochemical measurements containing 10 mM glucose, used 0.1 M PBS pH 7, and 0.1 M CBS pH 5 as the electrolyte solution at working volume of 15 mL, respectively. A Nafion 117 membrane was inserted to separate the two half cells. The resistance of circuit was 200 ohmic (Ω). The distance between the anode and cathode was 10 mm. The 24-bit differential analogy module received the voltage signal from the two-electrodes. The signal was send to a computer and analyzes using the Laboratory Virtual Instrument Engineering Workbench (LabVIEW) evaluation software. All electrochemical experiments were carried out at temperature 310 K [25].

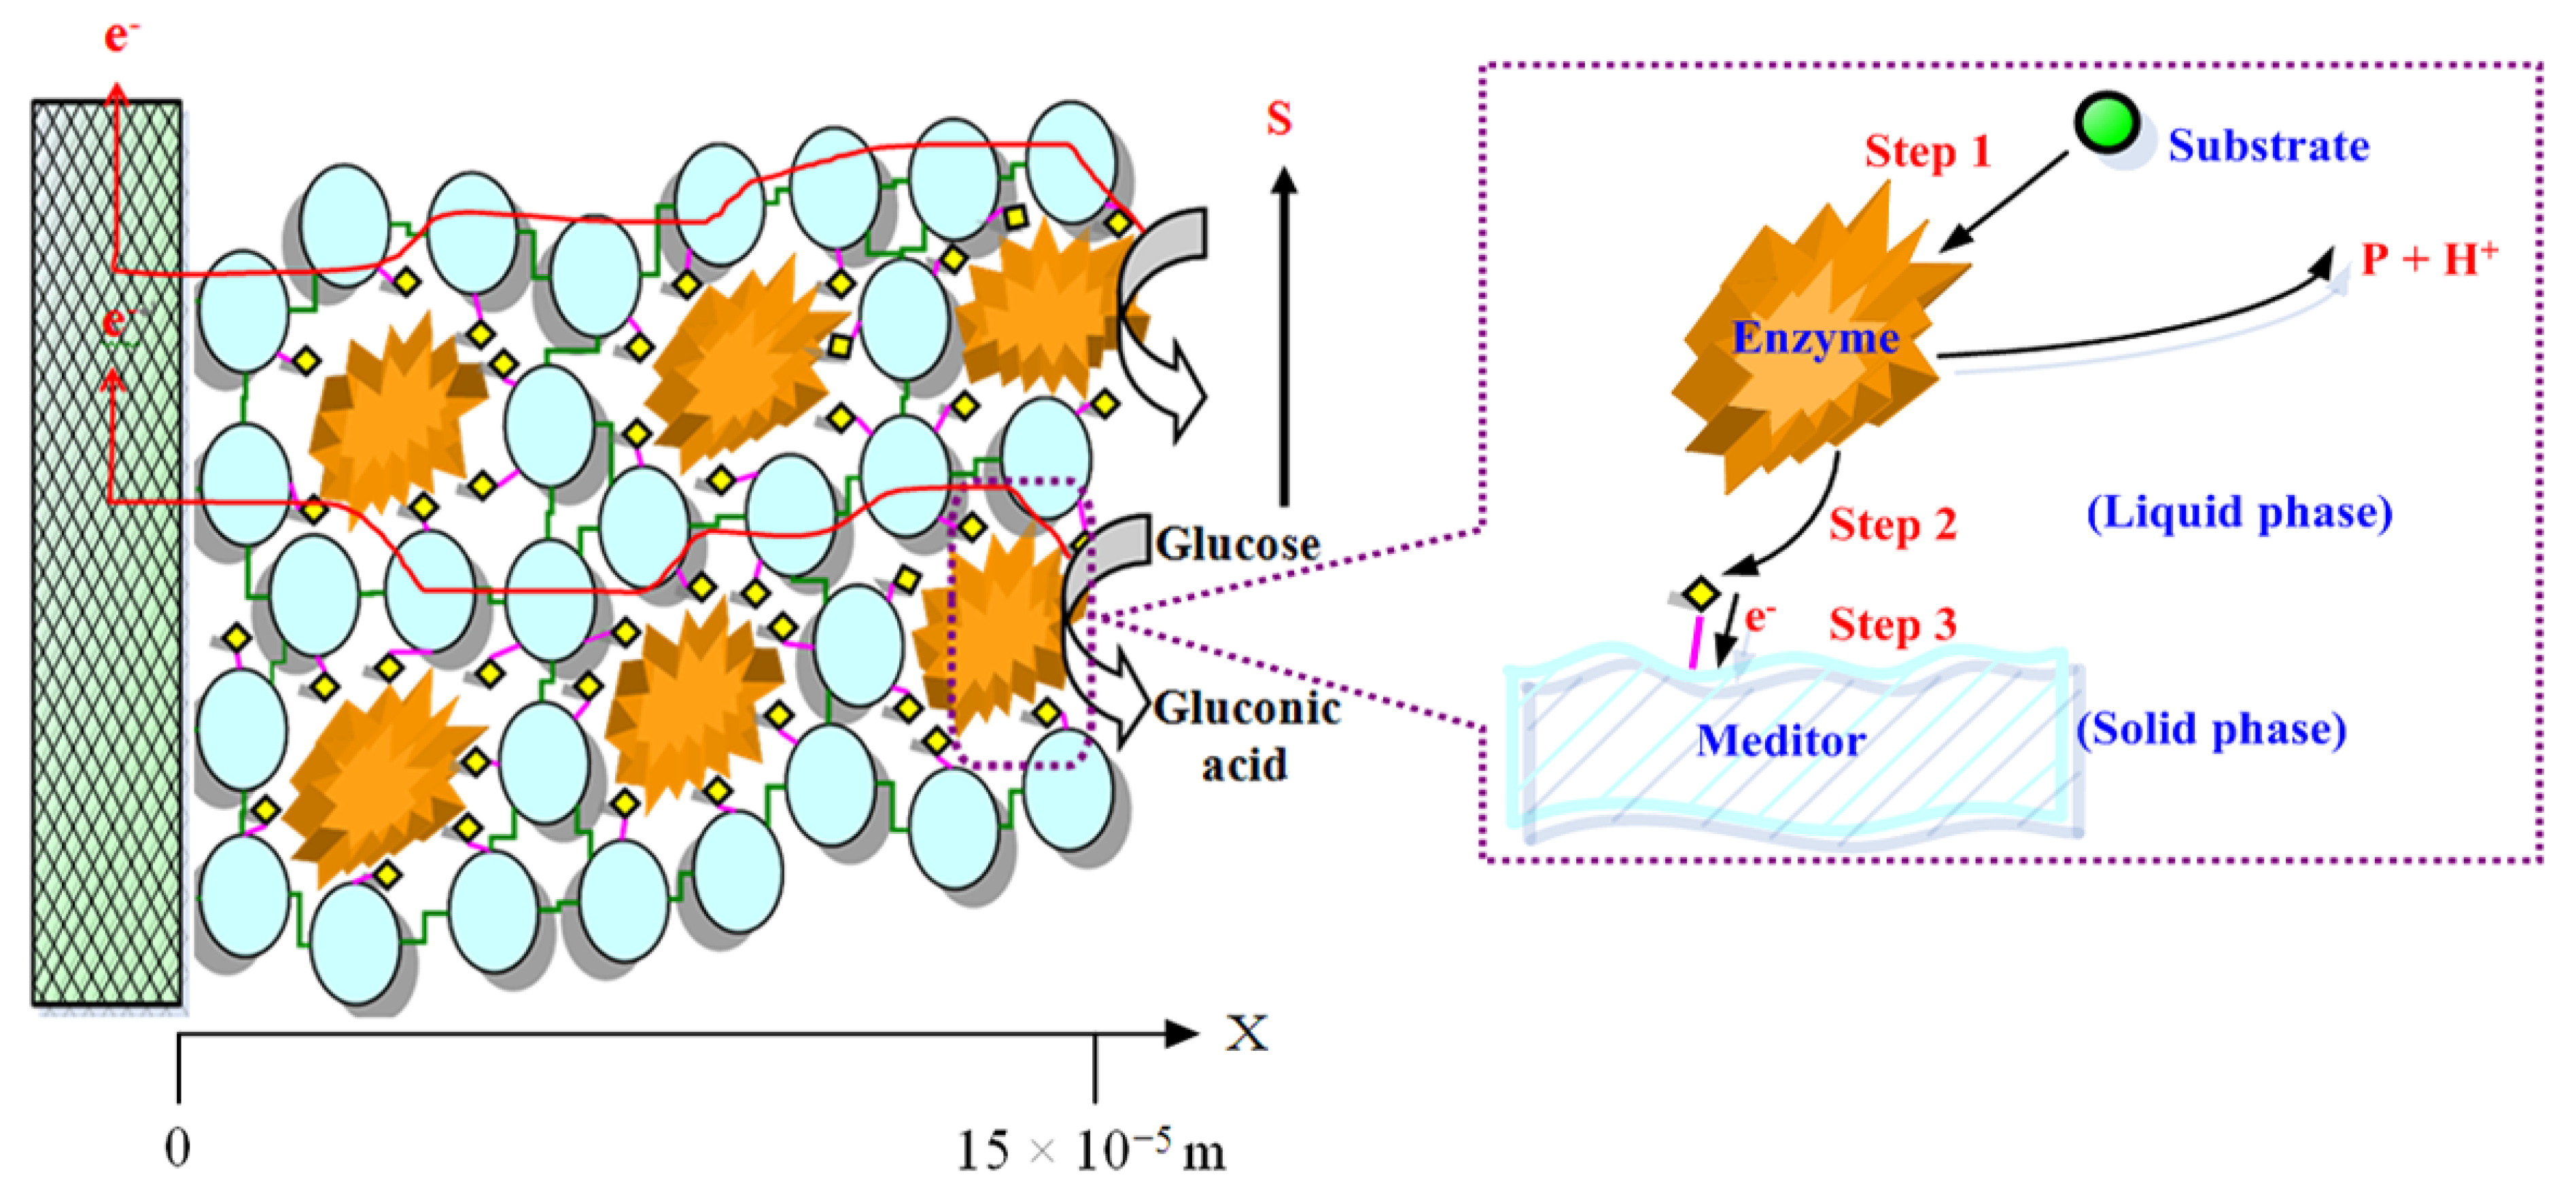
2.4. Mathematical Formulation

Consider the EBFC in a square area of length L filled with enzyme-substrate-mediator complex solution (Figure 1), where coordinate x is the distance measured along the left vertical wall. The length L dimension is 15 × 10−5 m. According to Equations (2) to (4), the model considers eight species: substrate (S), oxidized enzyme (Eox), reduced enzyme (Ered), enzyme-substrate complex (ES), oxidized mediator (Mox), reduced mediator (Mred), hydrogen ions (H+) and product (P). This study also considers the effect of the solid conductivity of mediators on electrode performance. Table 1 shows the comparision of the model in the study and those in the literature. The mass balance equation for the substrate, hydrogen ions, and product is given by:
[ j ] t = D j 2 [ j ] x 2 + R j
where Dj and Rj denote the diffusion coefficient for species and the source term for reaction, and j denotes the chemical species j, as listed in Table 2. The initial condition (I.C.) and boundary condition (B.C.) for Equation 5 are as follows:
I.C.         [j]= [j] i at t=0 B.C.1       [j] x  = BC 1 j at x= 0 B.C.2 [j] =BC 2 j   for   S,   −D j [j] x =BC 2 j  for H +  and P at x=L
where the values of BC1j and BC2j are as listed in Table 2. The rate expression for oxidized enzyme (Eox), reduced enzyme (Ered), enzyme-substrate complex (ES), oxidized mediator (Mox), or reduced mediator (Mred) is given as:
[ j ] t = R j
The initial values for Equation 6 ([j] = [j]i) are listed in Table 3. The local current density inside electrode (it) can be expressed as:
i t = i ox i red
i ox = a i o [ [ M red ] M t exp ( β n F ( E E e ) RT ) ]
i red = a i o [ [ M ox ] M t exp ( ( 1 β ) n F ( E E e ) RT ) ]
in which a is the surface area of the electrode per electrode volume, io denotes exchange current density, and β denotes the anode transfer coefficient.
Applied potential can be written as follows:
E = φ s φ l
in which φ l and φ s denote potential in the liquid phase and the solid phase, respectively.
The charge conservation can be expressed as:
x [ ( 1 θ ) k s φ s x ] = i t
in which θ and ks are the porosity and conductivity of the solid phase, respectively. The boundary conditions are:
B.C.1         φ s = E A         at x= 0    B.C.2             φ s x =0         at x= L
where EA is the applied potential. The liquid potential related to the electronic current is given by:
x [ θ k l φ l x ] = i t
where kl is the conductivity of the liquid phase. The boundary conditions are:
B.C.1        φ l x =0        at x= 0    B.C.2             φ l =0         at x= L
The total current density calculated can be expressed as follows:
I t = 0 L i t d x
Table 2. Source terms for species and charge conservation equations.
Species jSource terms
RjICj BC1jBC2j
S k 1 b [ ES ] k 1 f [ S ] [ E ] ox [S]b0[S]b
H+ k 2 f [ ES ] 00 I t n F
P k 2 f [ ES ] 00 I t n F
ES k 1 f [ S ] [ E ox ] ( k 1b + k 2f ) [ ES ] 0aa
Eox k 1 b [ ES ] k 1 f [ S ] [ E ] ox + k 3 f [ M ox ] [ E red ] k 3 b [ M red ] [ E ox ] [ E ox ] i aa
Ered k 2f [ E ] [ S ] k 3 f [ M ox ] [ E red ] + k 3 b [ M red ] [ E ox ] [ E red ] i aa
Mox k 3 b [ M red ] [ E ox ] k 3 f [ M ox ] [ E red ] + ( i ox i red ) / n F [ M ox ] i aa
Mred k 3 f [ M ox ] [ E red ] k 3b [M red ][E ox ] ( i ox i red ) / n F [ M red ] i aa
a These compounds are immobilized on the electrode.
Table 3. Simulation parameters.
SymbolSimulated parameterRef. valueReferences
θ0.5 given
a2.3 × 104 [L/m] Measured
F96,500 [C/mol]96,485 to 96,487 [C/mol][17,33]
DH1.0 × 109 [m2/s]0.9 × 10−10[mol·m−3][44]
Dp5.0 × 10−10 [m2/s]
Ds5.0 × 10−10 [m2/s]4.9 × 10−6[cm2·s−1][17]
EA−0.15 ~ 0.4 [V]
[Eox]i0.05 [mM]0.05 [mM][25]
[Ered]i0 [mM] Initial value
[ES]i0 [mM] Initial value
[H+]i0 [mM] Initial value
i01.5 × 10,4 [mA/cm2] given
k1b1.0 [1/s]0.41 to 1.17 × 10⁻⁶[mol·cm−2·s−1][42]
k1f1.0 × 103 [m3/(mol.s)]10 [s−1][42]
k2f1.0 × 102 [1/s]75 [s−1][42]
k3b1.0 [m3/(mol.s)]0.025 [s−1][42]
k3f1.0 × 102 [m3/(mol.s)]100 [cm·s−1][42]
kl5.5 × 10−1 [S/m] Measured
ks3.99 × 10−1 [S/m] Measured
L15 × 105 [m] Measured
Mt10 [mM]10 [mM][25]
[Mox]i5 [mM ] Initial value
[Mred]i5 [mM ] Initial value
n11[17,26]
[P]i0 [mM] Initial value
R8.314 [J/(mol.K)]8.314 [J/(mol.K)][17,33]
[S]i2.0 [mM]2.4 to 0.6 [mM]Initial value
T310 [K]310 [K][5,25]

3. Results and Discussion

The application of the low and high mediators of anode and cathode bioelectrodes for the EBFC system has been demonstrated during GOx and LAc bioelectrode testing under a galvanostatic regime. Figure 3 shows a plot of power density vs. cell voltage using different concentration of mediators (20 mM and 40 mM). After 9 h, the high mediator analysis has shown that the cell electro-oxidation current of glucose appears at 0.09 V with a power density of 45.46 μW/cm2; for the low mediator, results were 0.06 V with a power density of 20.18 μW/cm2. Experimental results can be obtained high concentration of mediator better than the low concentration of mediator. Therefore, a model was developed and evaluated through computational simulation series by comparing them to experimental data. The results of simulation demonstrate that a good fitting might be learned the relationship between mediator and EBFC.
Figure 3. Plot of power density and cell voltage at different mediators on bioelectrode.
Energies 05 02524 g003
According to the enzymatic reaction in the BFC in Equations (2)–(4), eight compounds (Eox, Ered, ES, Mox, Mred, H+, S, and P) must be considered to describe the enzymatic reaction. Figure 1 shows the reactive schematic in EBFC. This is a solid reaction, and the diffusion problem during the reaction should be considered. The mass balance and rate equation were expressed in Equations (5)–(13). Table 3 lists simulated parameters. The COMSOL Multiphysics® package software, which is based on the finite-element method, calculated the simulated results. Solutions converge when the relative error tolerance is less than 1.0 × 10⁻⁶.

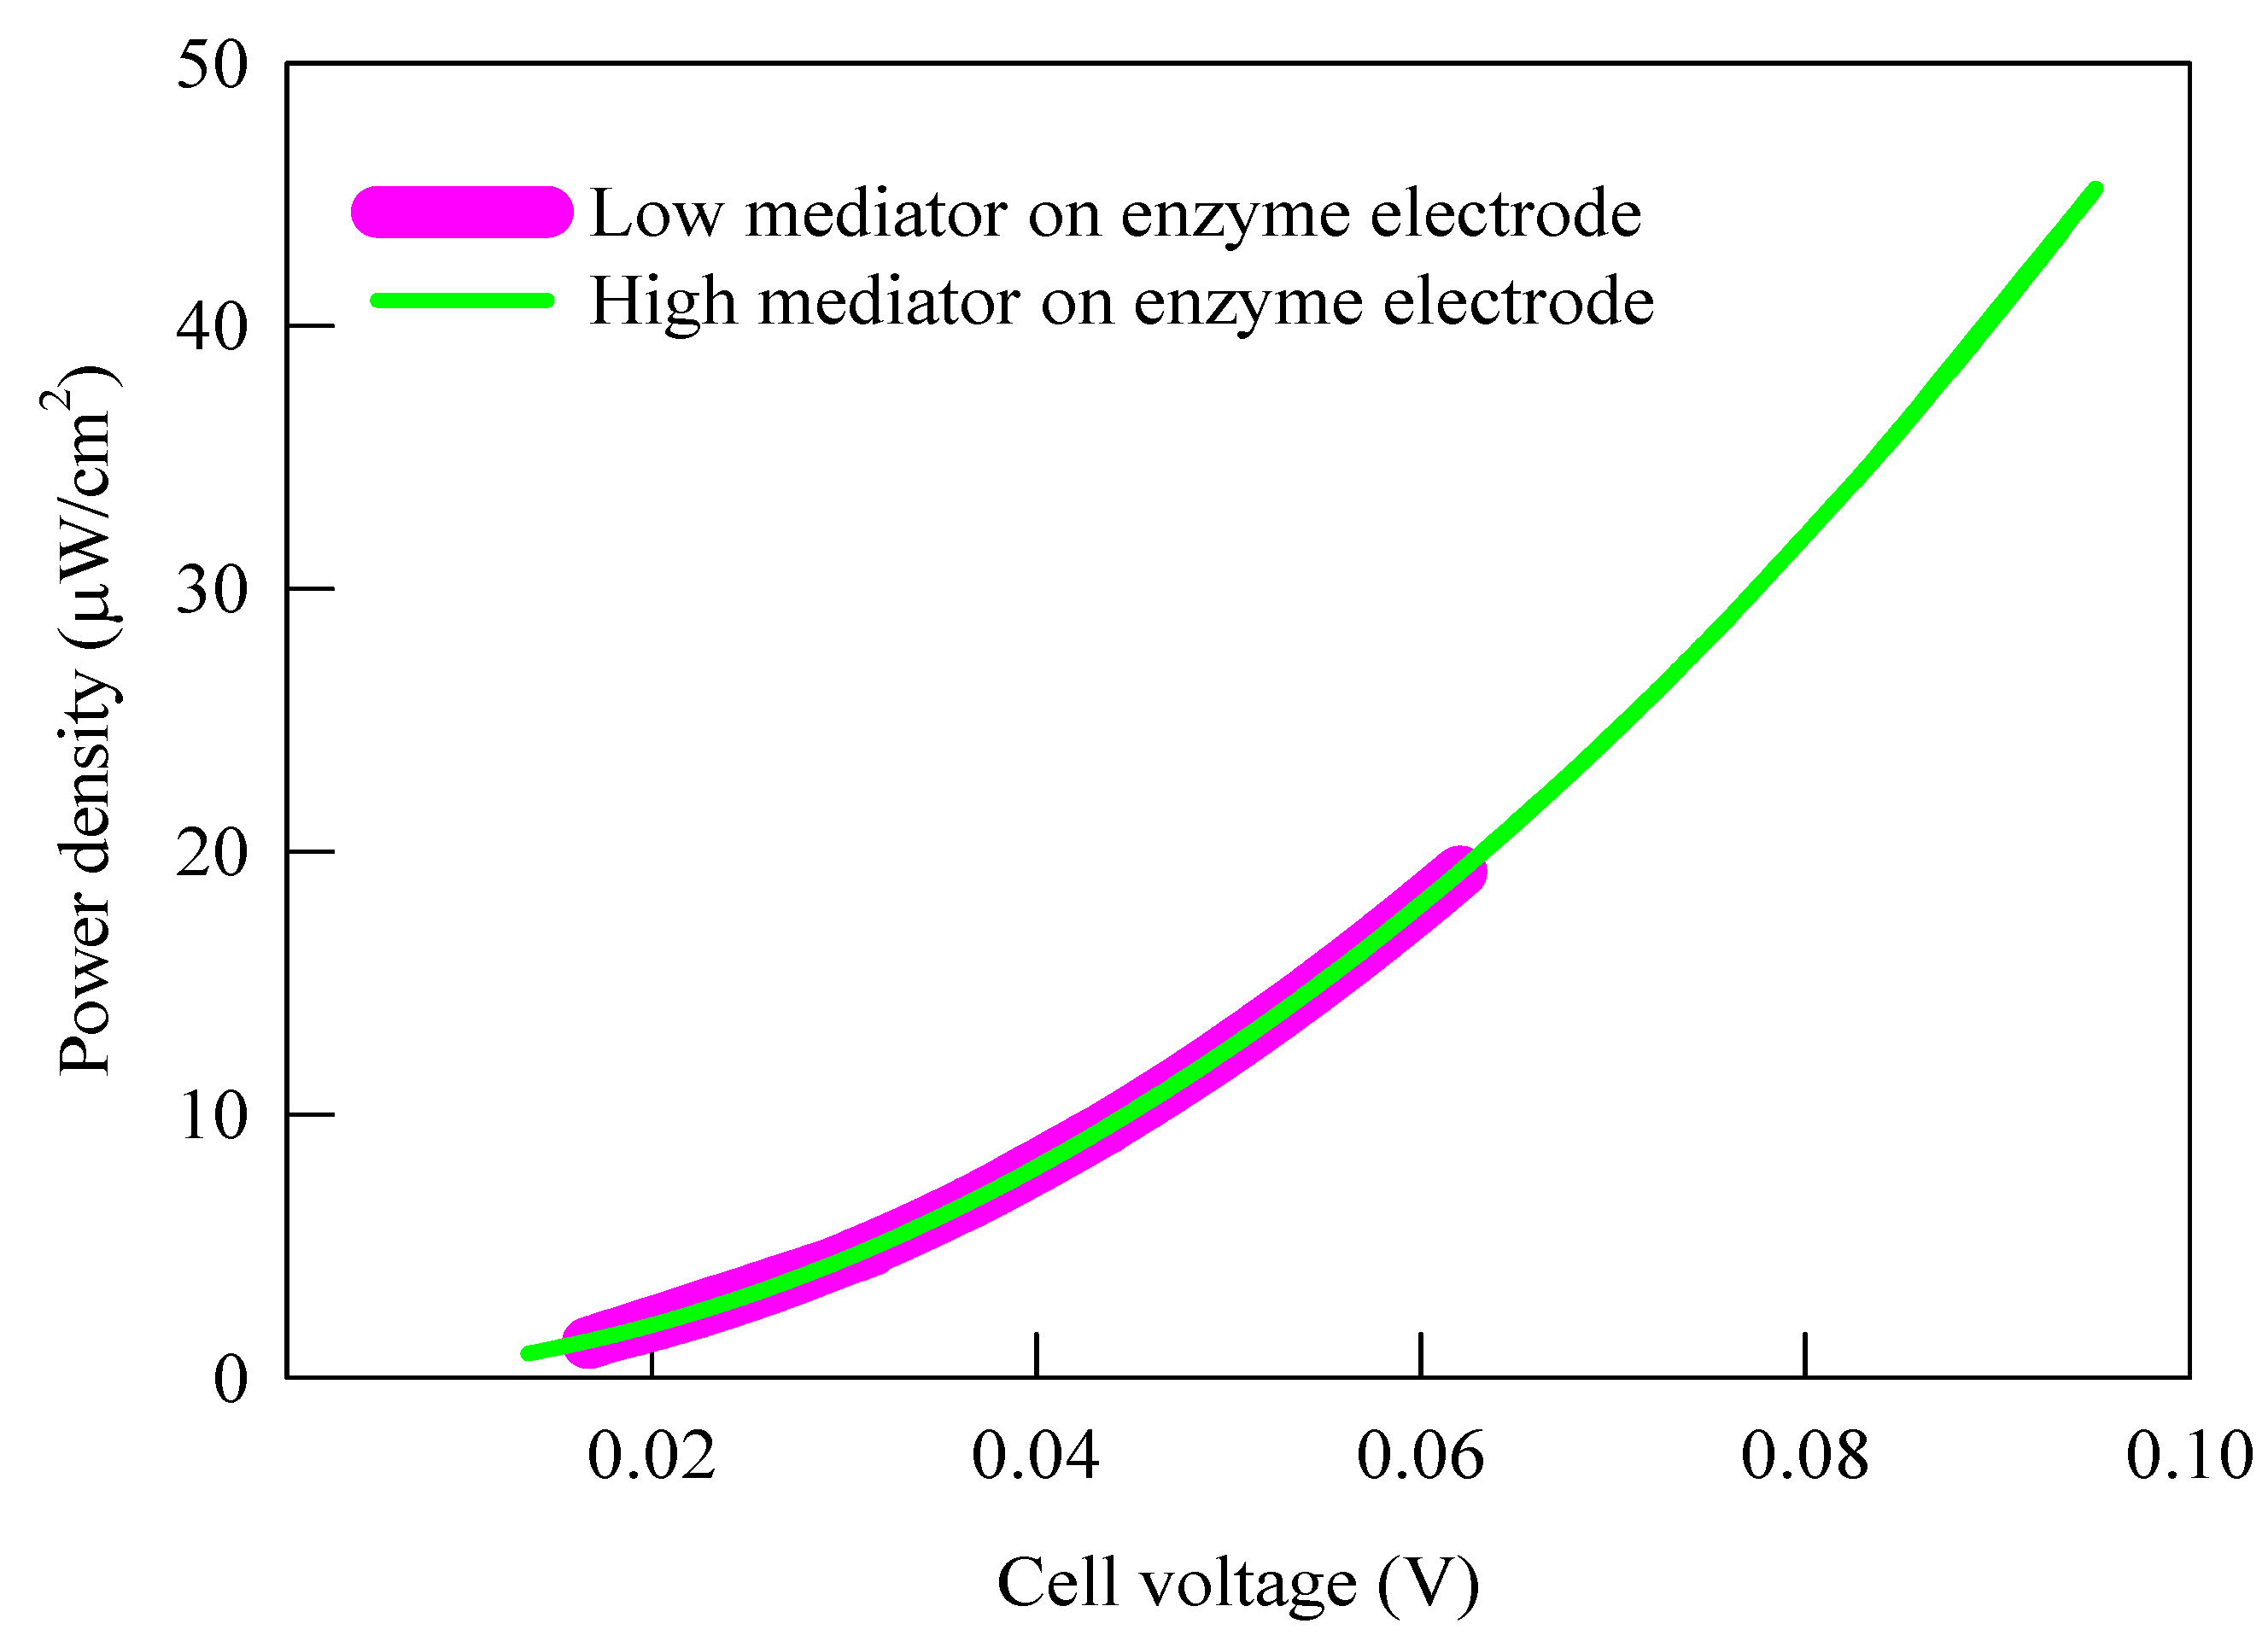
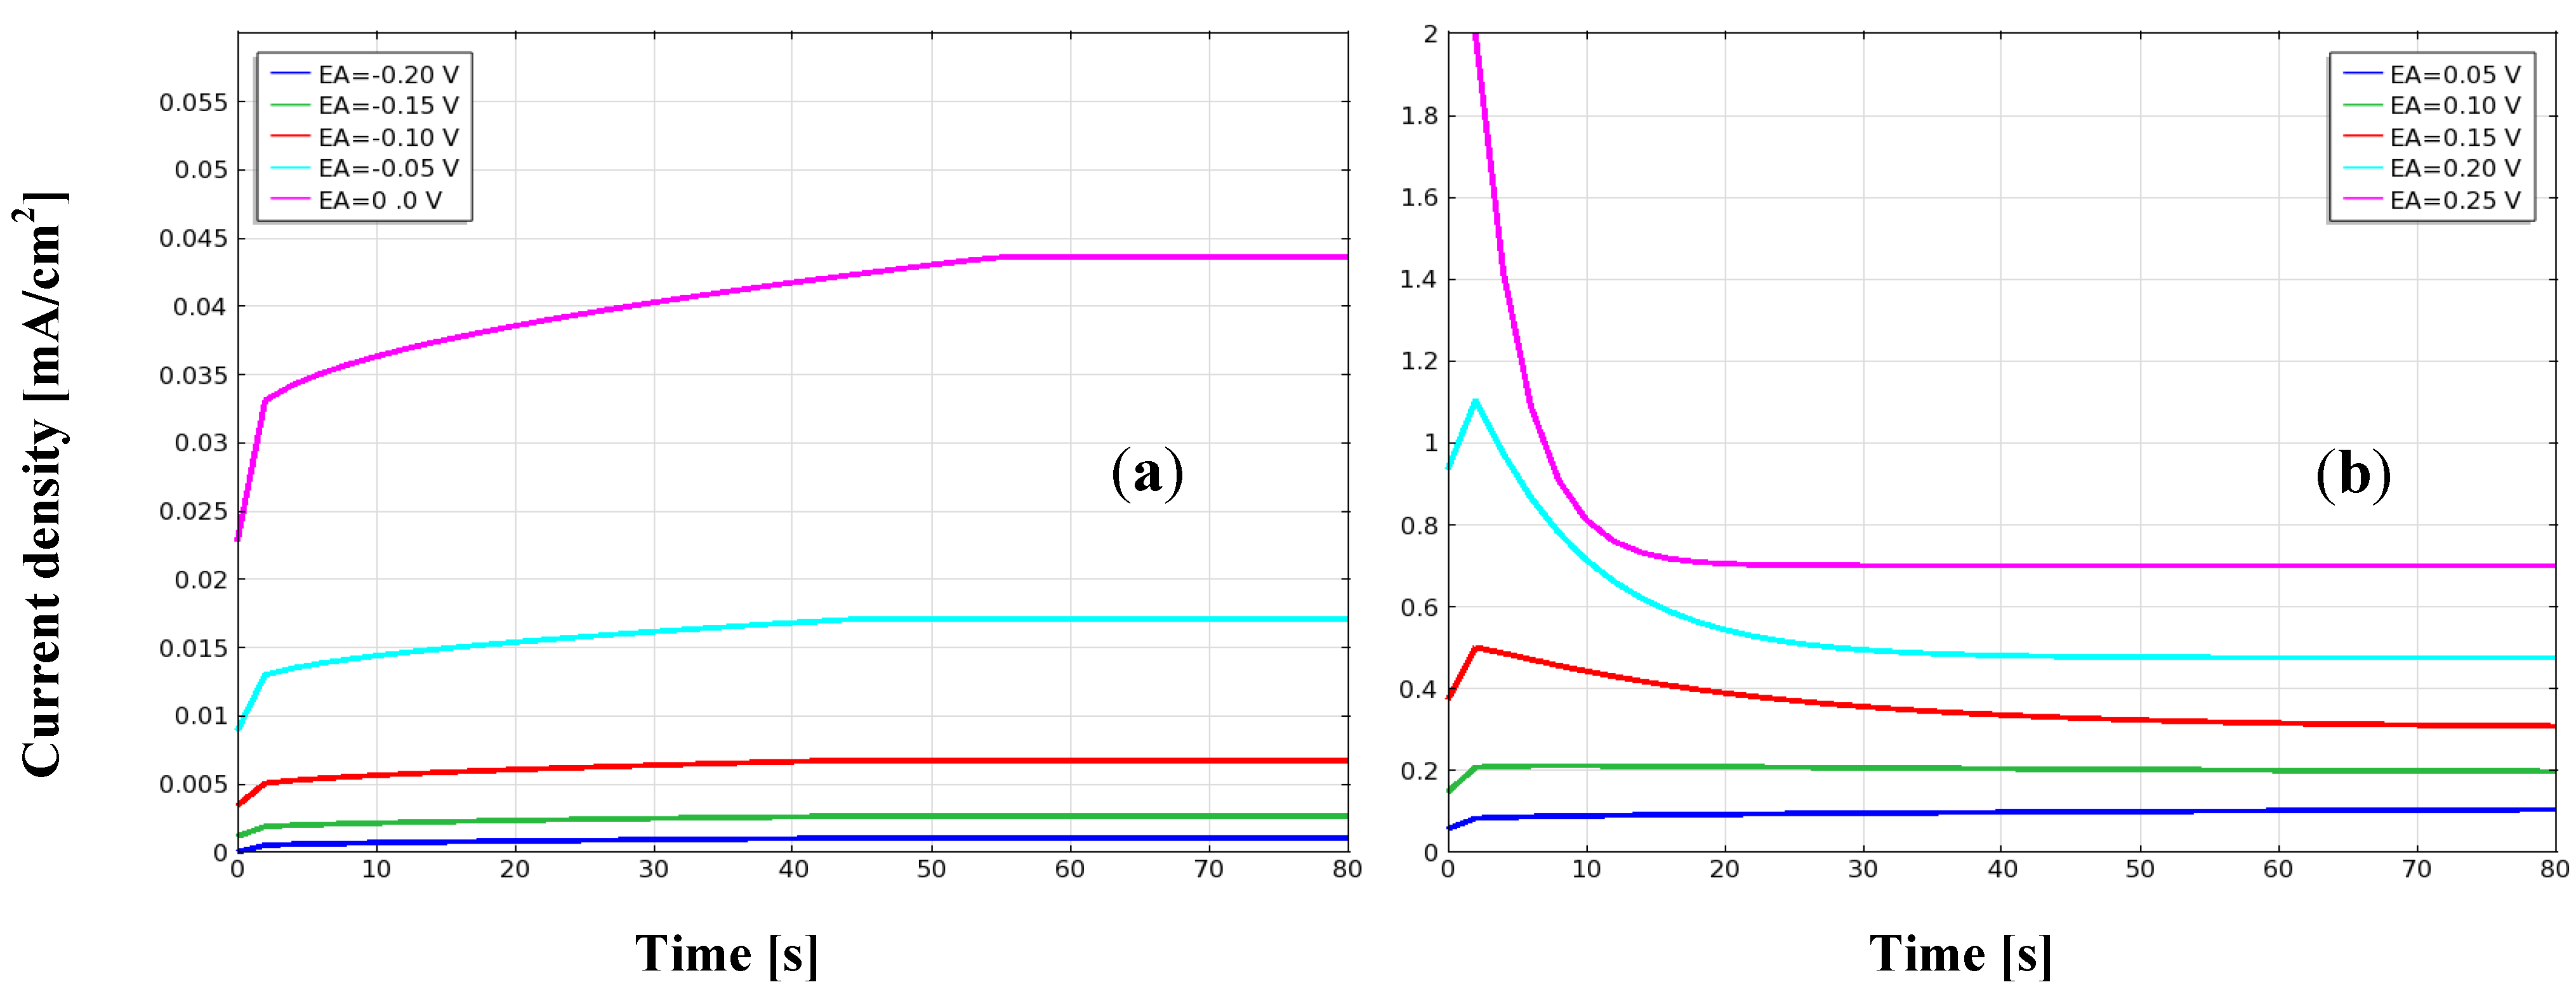
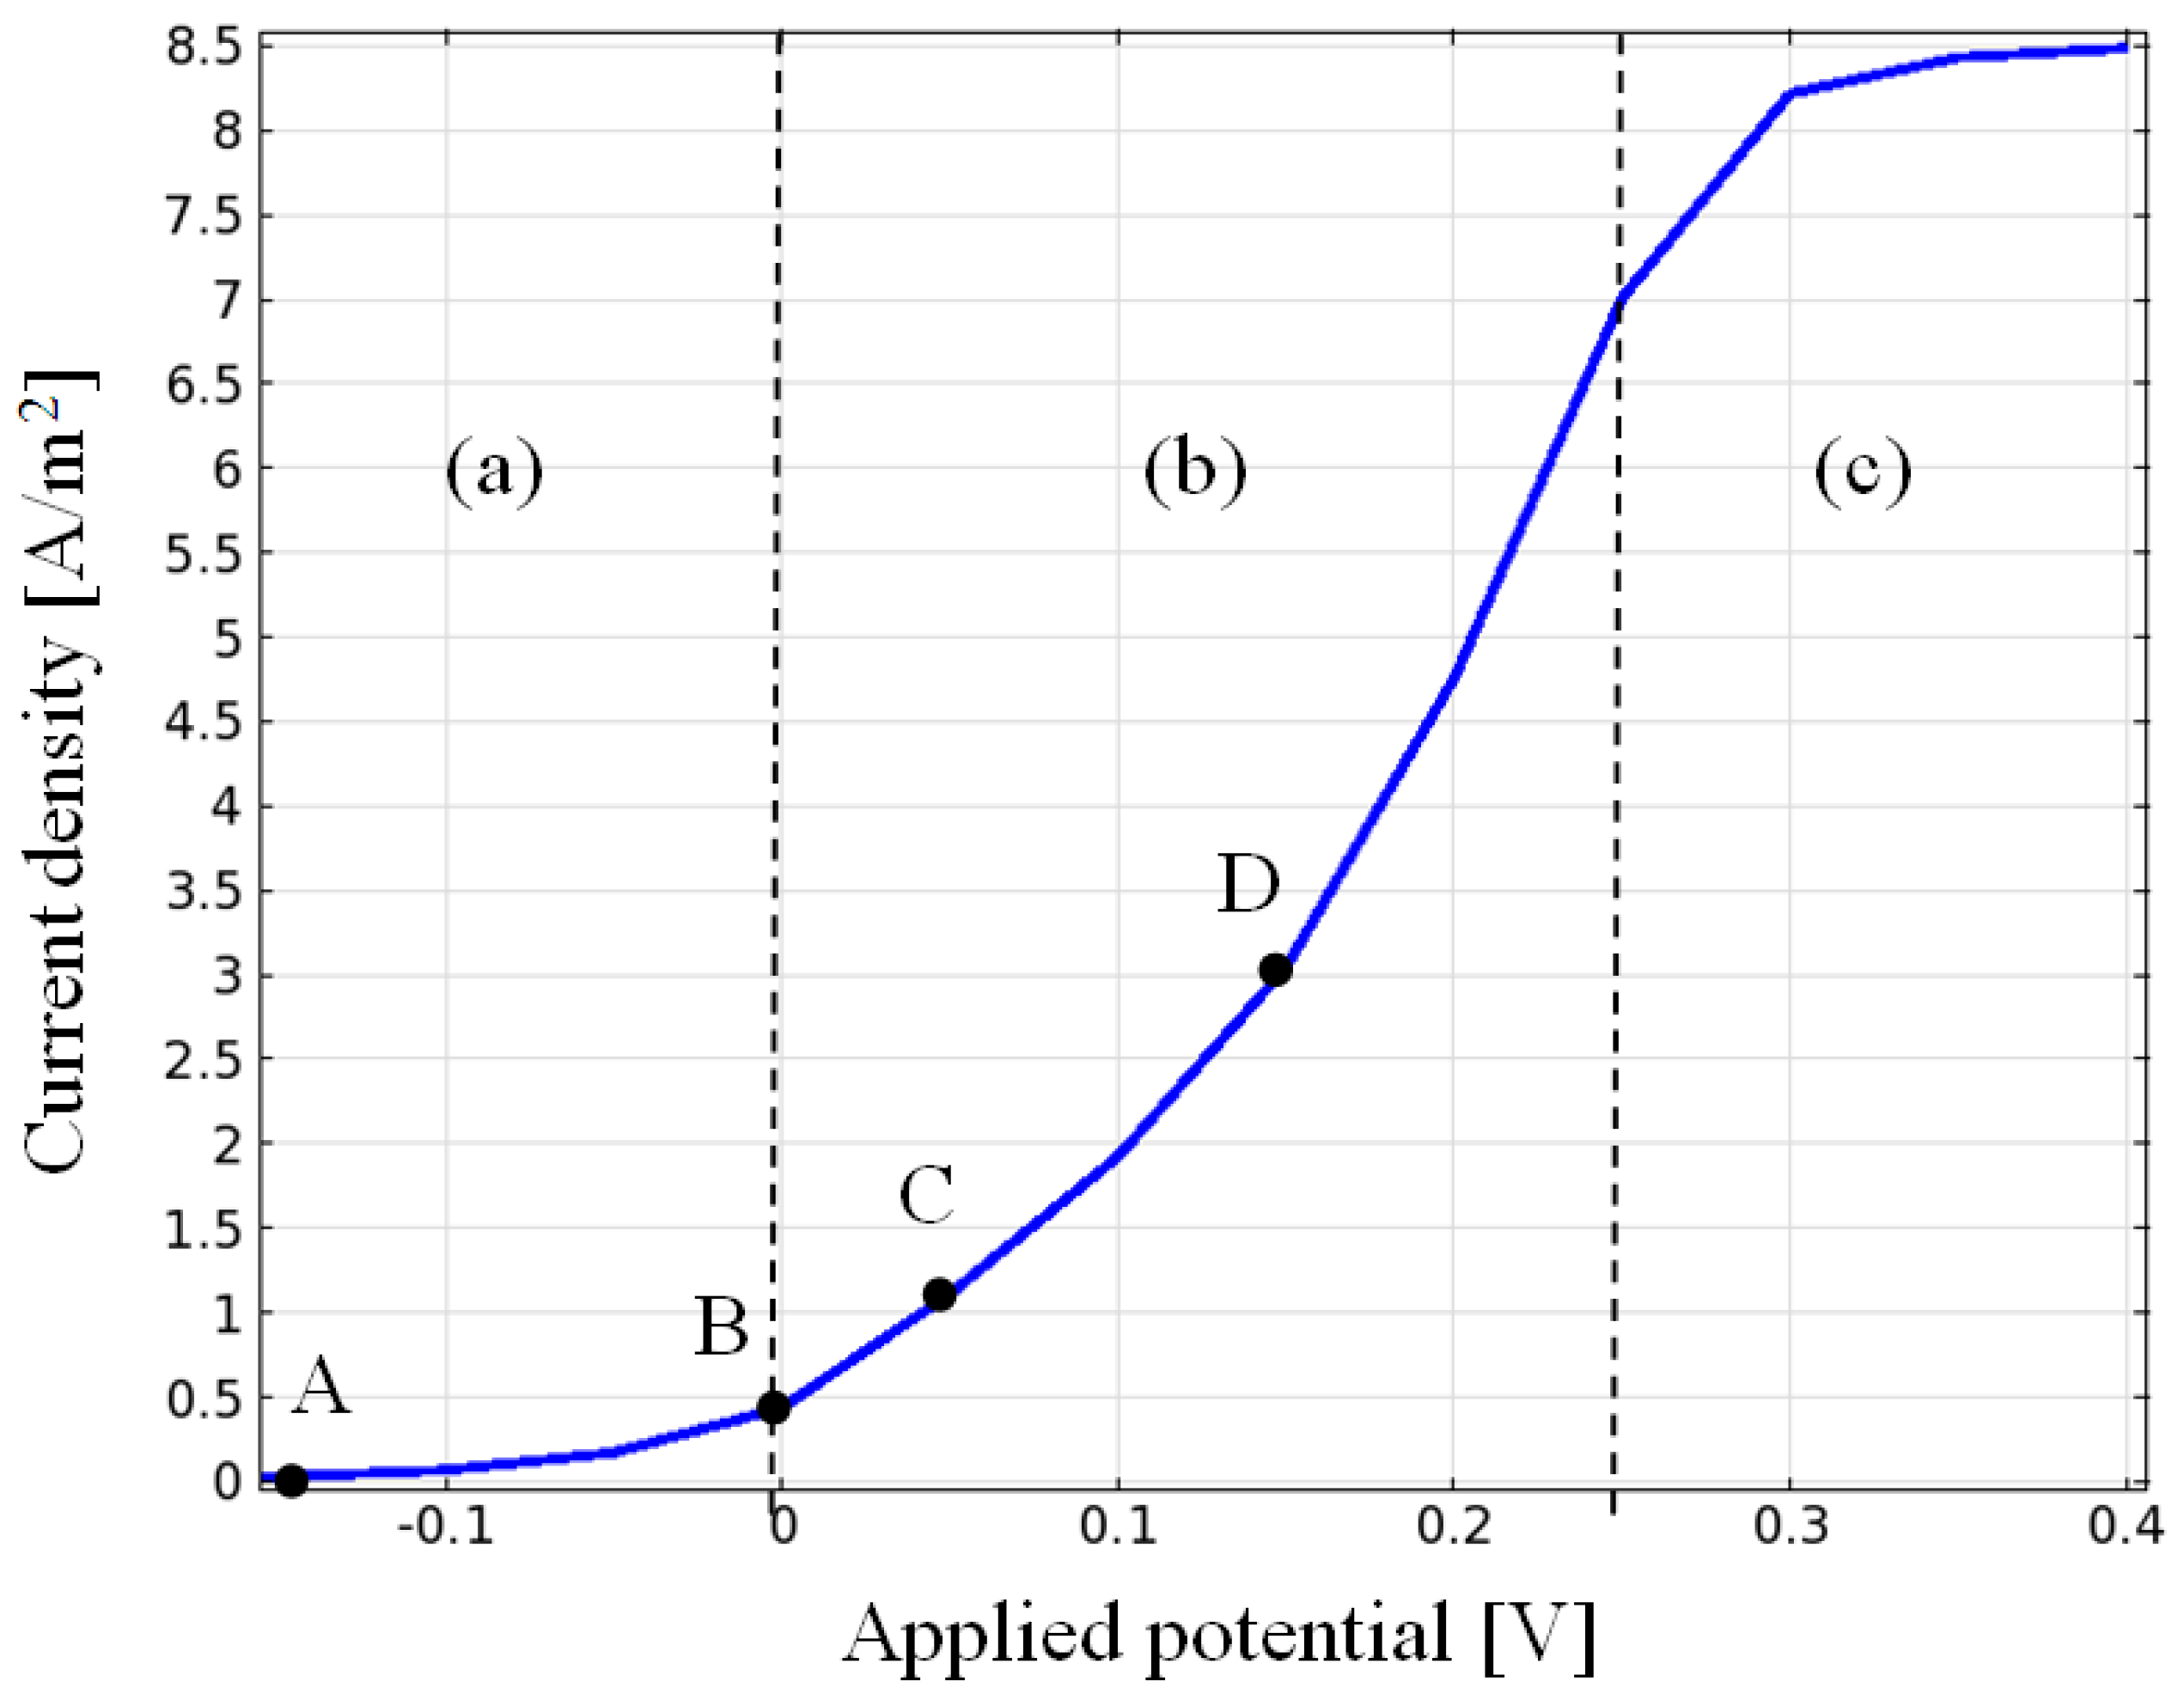
3.1. Current Density, Potential and Polarization Loss

When the applied potential deviates from the equilibrium potential (Ee = −0.2 V in this study), the electrode creates voltage losses. The voltage losses include activation loss, ohmic loss, and concentration loss. Figure 4 illustrates the relationship between current density and voltage (IV curves) using typical anode efficiency. The calculation was carried out with a slow linear sweep of potential (0.1 mV/s). A low potential sweep ensures a steady state result. If only one source of voltage loss is attributable to kinetics (activation loss), the relationship between current density and potential is shown in region (a). Activation voltage loss is related to the intrinsic activity of enzymes. If the applied potential increases to region (b), it experiences voltage losses owing to activation loss and ohmic loss. In this region, the main controlling factor is the conductivity of mediators and electrolytes. If the applied potential is set at a higher potential in region (c), activation loss, ohmic loss, and concentration loss occur, and mass transfer and ohmic resistance dominate electrochemical behavior. Relevant literature has not explored the reaction, diffusion, and ROS of enzymes, the generation of enzyme-substrate complexes, and the electrochemical behavior of mediator-associated micro-nature.
Figure 4. IV curve for typical anodes in EBFC at 310 K.
Energies 05 02524 g004
The dynamic response of the current density for a step anode potential change from −0.15 V to 0.25 V is plotted as a function of time [Figure 5(a,b)].
Figure 5. Current density response of EBFC: (a) High potential state; (b) Low potential state.
Energies 05 02524 g005
Figure 5(a) shows the current density with time at low applied potential. The applied potential is set at 0.0 V; the current density rapidly rises, and with a slow rate when the time is approximately 50 s. The current density, which tends to be a constant value such as 0.0 V, is approximately 0.043 mA/cm2. When the applied potential is far from the equilibrium potential (−0.2 V), current density responses occur [Figure 5(b)]. When the potential is 0.1 V, the initial current density is still in an upward trend, but the current density first increases and then decreases slowly. The response behavior of the current density declines at high values of approximately 0.5 mA/cm2 to 0.36 mA/cm2, and after 70 s, it stabilizes at a constant value. When the applied potential increases to 0.15 V to 0.2 V, the trends are similar (first an increase and then a decrease behavior). When the applied potential is 0.25 V, the current density first increases rapidly and then dramatically decreases. The operation time for steady state is approximately 30 s. When the current density decreases from 1.1 mA/cm2 to 0.48 mA/cm2, the maximum value decreases by 25%. When the applied potential increases to 0.25 V, current density jumps to 2.1 mA/cm2, then quickly drops to 0.7 mA/cm2, and the maximum value declines 35%. Researchers chose −0.15 V, 0 V, 0.05 V, 0.15 V as examples to study the variation of current density in EBFC.

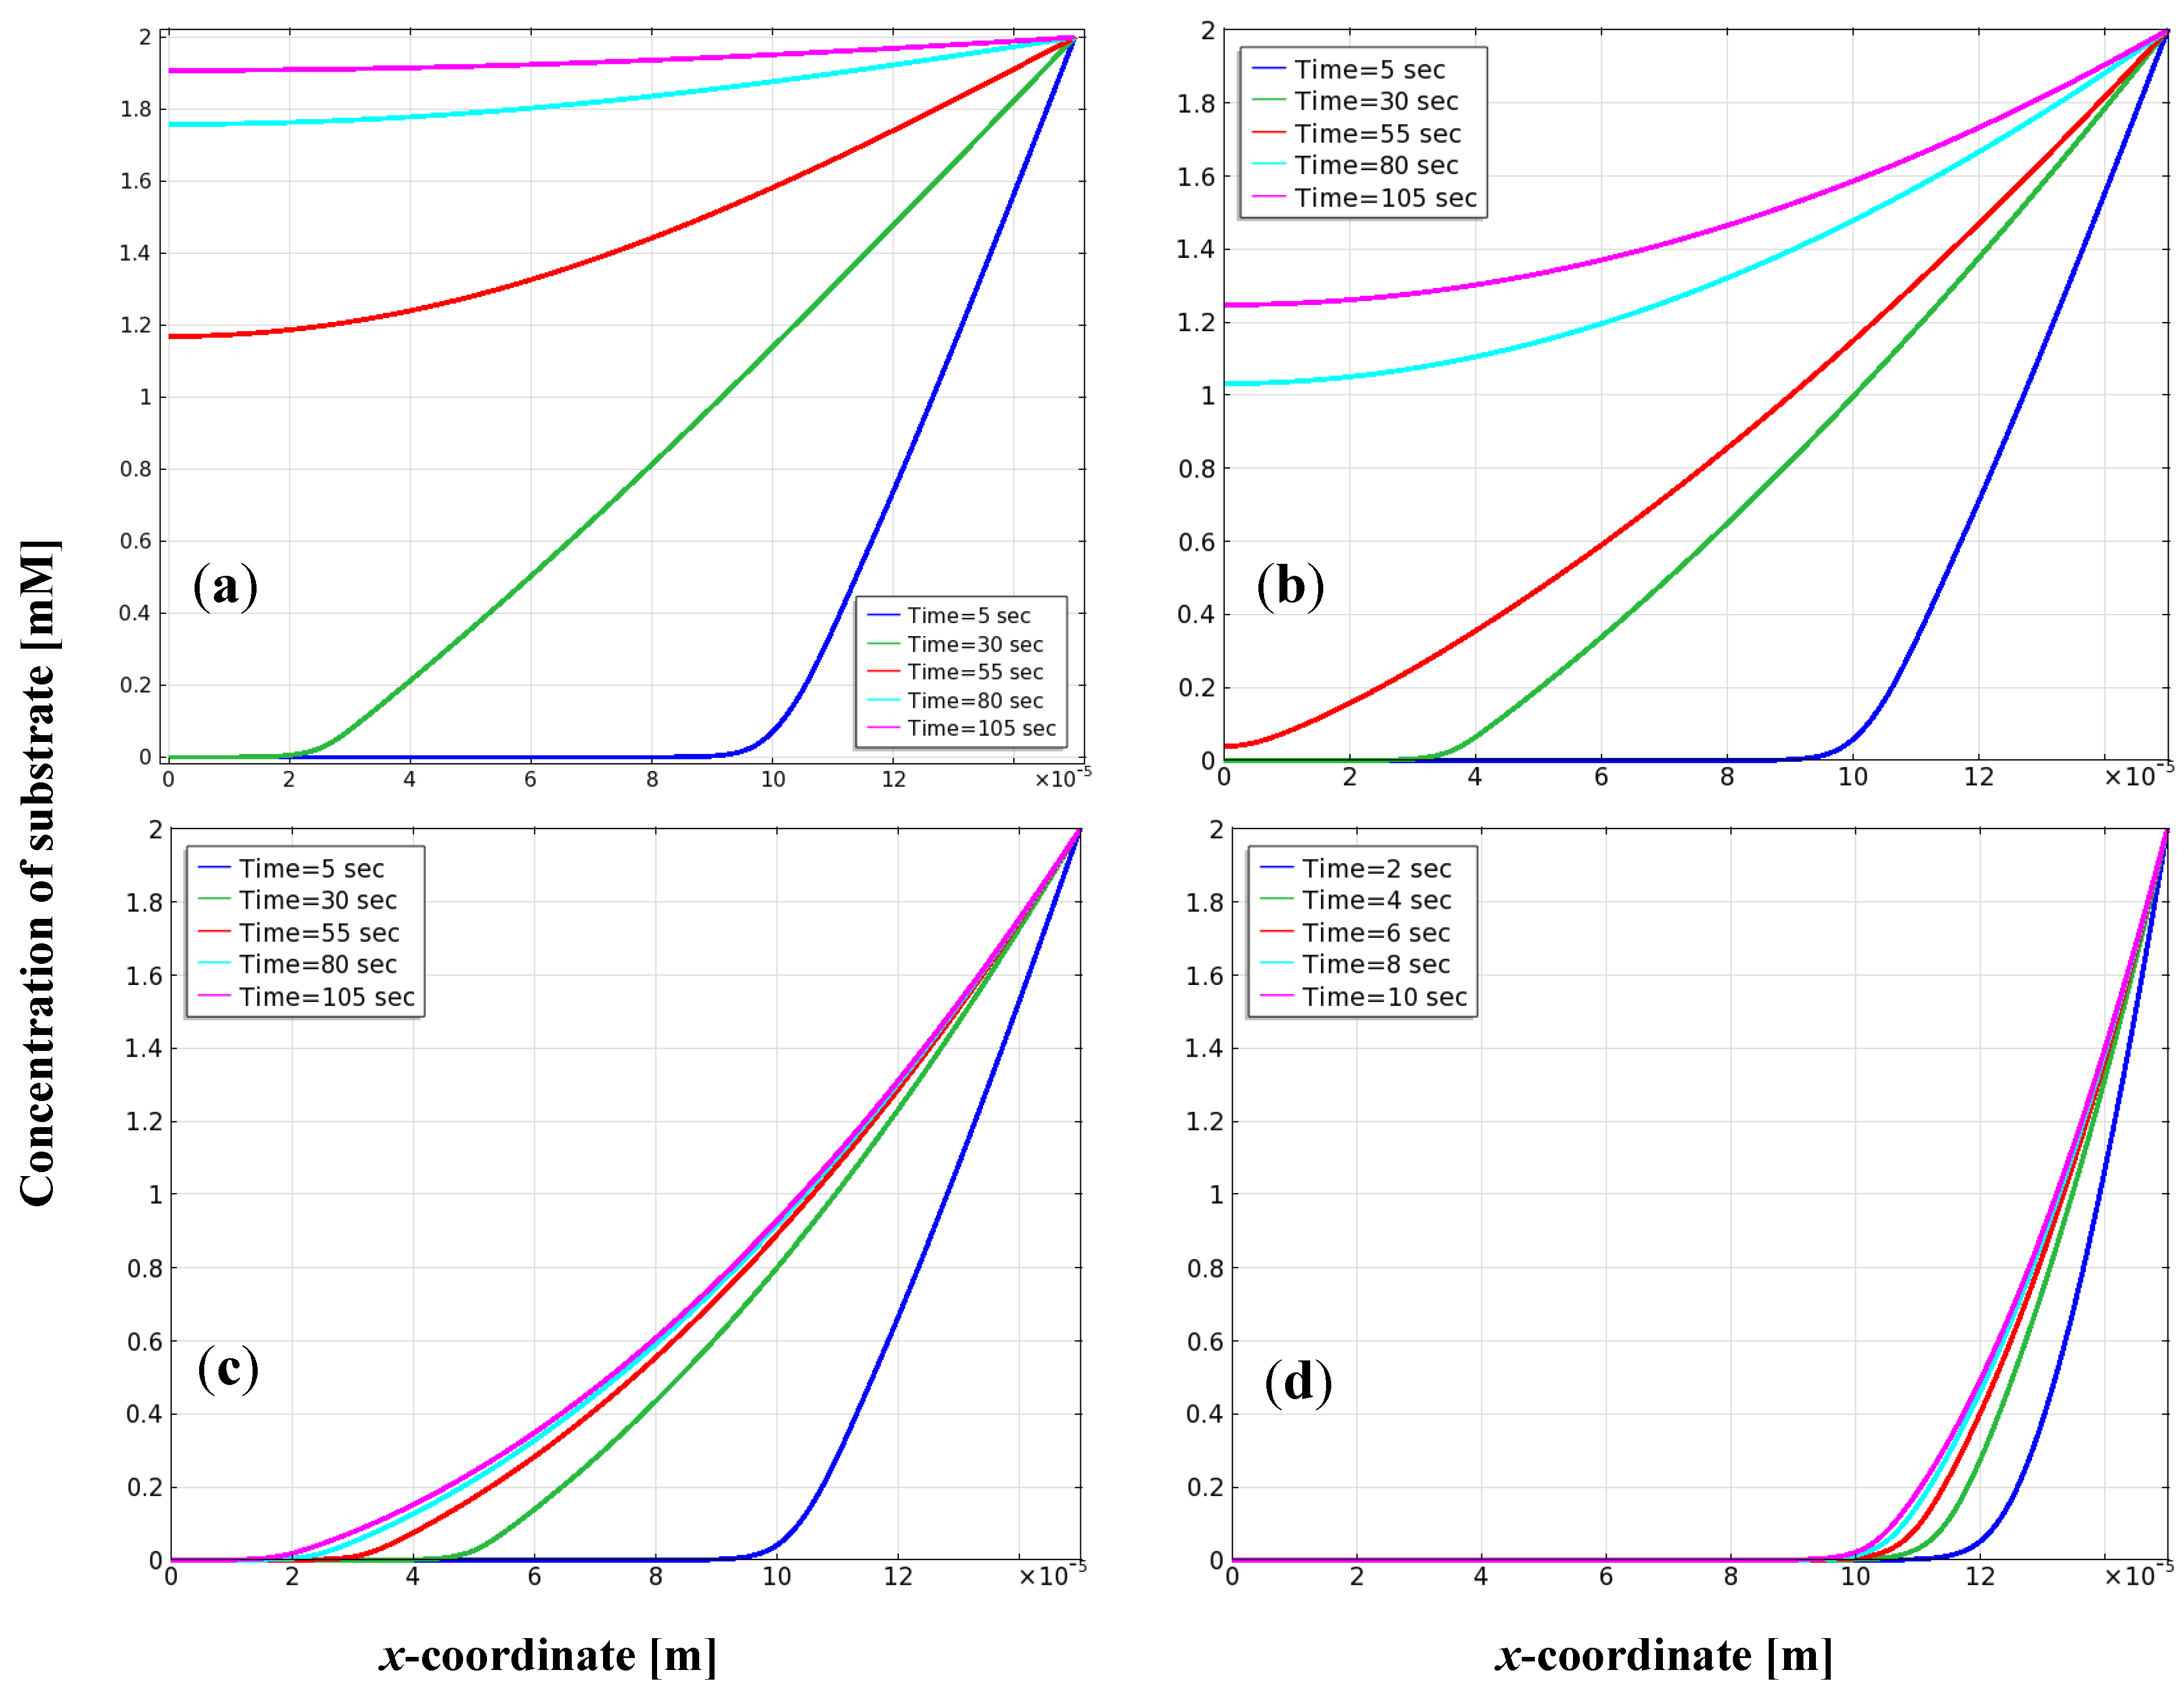
3.2. Distribution of Substrate on the Electrode

In the EBFC reaction system, the substrate must first diffuse from the bulk solution to the active site, and then react with the enzyme. Figure 6(a–d) simulate the substrate distribution across the entire anode with different applied potentials, step by step.
Figure 6(a) illustrates substrate distribution after a potential step from equilibrium potential (−0.2 V) to −0.15 V at time points of 5 s, 30 s, 55 s, 80 s, and 105 s. Substrate concentration increases to about 1.9 mM at a time of 105 s. That is, it takes almost 105 s to establish a steady-state substrate distribution. The substrate is consumed through electrochemical oxidation, and its concentration drops minutely from 2.0 to 1.9 mM. Figure 6(b) shows the substrate concentration profile as the potential moves toward 0.0 V. The maximum substrate value is approximately 1.23 mM at 105 s. This value is about 60% of the substrate in the bulk solution. Substrate consumption increases with electrochemical oxidation when the applied potential is held at a higher value. Figure 6(c) shows the substrate concentration profile at various time levels for a potential set at 0.05 V. The substrate slowly and steadily increases, and reaches a steady state after 105 s. The substrate concentration drops quickly from 2.0 mM to about 0.0 mM at the surface of the current collector (x = 0) after 105 s. Figure 6(d) shows the substrate concentration profile when the potential is held at 0.15 V. The substrate reaches a steady condition in a very short time (about 10 s), and the variation of the concentration gradient of substrate diminishes. There is no substrate in the region of 0 m to 9.0 × 10⁻⁵ m inside the anode.
Figure 6. Plot of substrate concentration on x-coordinate at different operation times for applied potentials: (a) −0.15 V; (b) 0.0 V; (c) 0.05 V; (d) 0.15 V in EBFC.
Energies 05 02524 g006

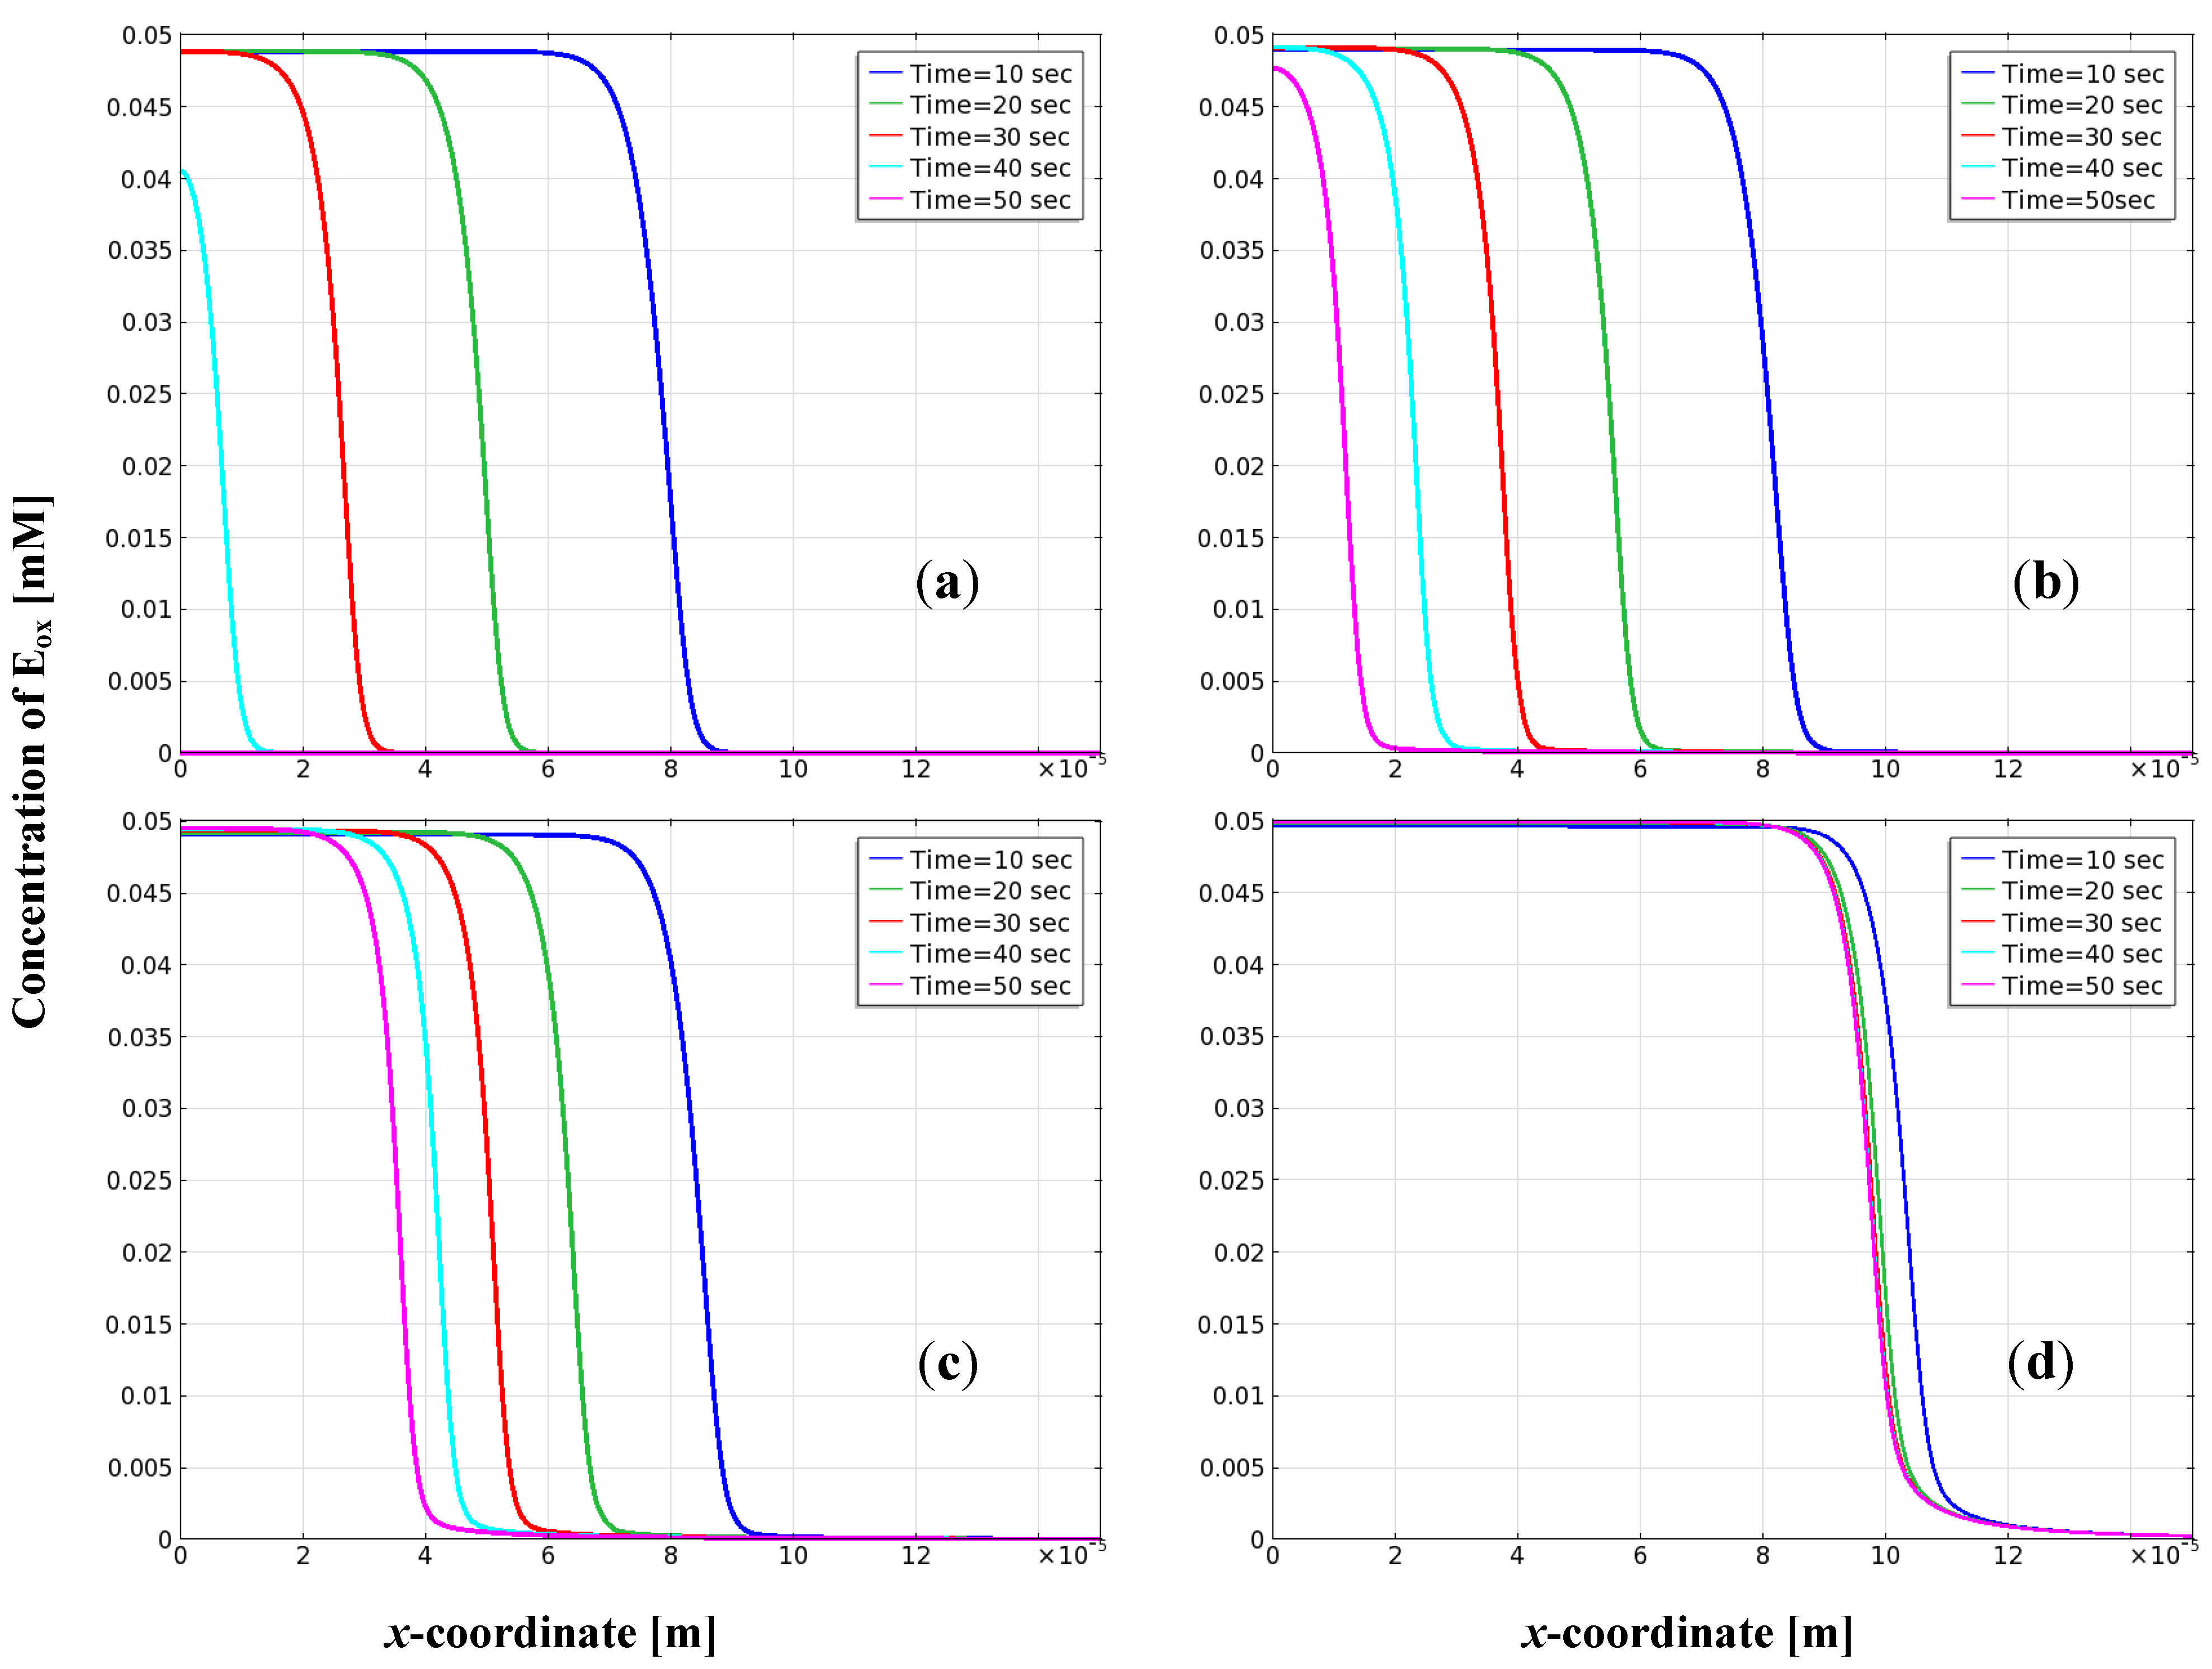
3.3. Distribution of Oxidized Enzyme on the Electrode

Efficient capacity of immobilized enzymes relates to the Eox concentration, the degree of reaction, and operation of potential or current density. Figure 7 shows the simulation results of enzyme concentration at different operation times and different applied potentials.
The applied potentials used were −0.15 V, 0.0 V, 0.05 V, and 0.15 V, corresponding to points (A) to (D) in Figure 4. The initial concentration of the oxidized enzyme Eox used was 0.05 mM. Figure 7(a) shows that the enzyme concentration mainly distributes in the thickness range of 0 m to 11 × 10−5 m with theapplied potential of −0.15 V; time was 5 s. The Eox concentration decreased with increasing operation time, and the concentration profile shifted to the left. Eox concentration approximated to 0 at t = 50 s. This occurs because when the applied potential operated at the active polarization area, the Eox concentration’s degree of ROS of enzyme was influenced by the reactivity of bimolecular Mox and Ered in Equation 3. When the applied potential operated in the active polarization region, mediator Mox concentration was low, resulting in decreasing ROS of enzyme of Eox concentration. Figure 7(b) shows simulation results for Eox concentration when the applied potential was controlled in the coexistence of active polarization and ohmic polarization regions (i.e., applied potential at 0.0 V). When the time was 10 s, the Eox concentration was similar to that in Figure 7(a). Similarly, the curve of Eox concentration shifted to left. The Eox concentration range for 50 s was between 0 μm and 20 μm. After 70 s, the concentration approached 0. Figure 7(c,d) show the curve of Eox concentration shifting to a stable value. The applied potential operates at the ohmic polarization control region as the electrochemical oxidation of the supplied Mox reaches a sufficient amount. Mox and Ered bimolecular reactions are reversible. This shows that Mred concentration increases with decreasing oxidation potential, and that Mox concentration increases with increasing oxidation potential. For the EBFC with a mediator, the efficiency of EBFC depends on the diffusion of reactants and the oxidation rate of the mediator.
Figure 7. Plot of oxidation enzyme concentration on x-coordinate at different operation times for applied potentials: (a) −0.15V; (b) 0.0 V; (c) 0.05 V; (d) 0.15 V in EBFC.
Energies 05 02524 g007

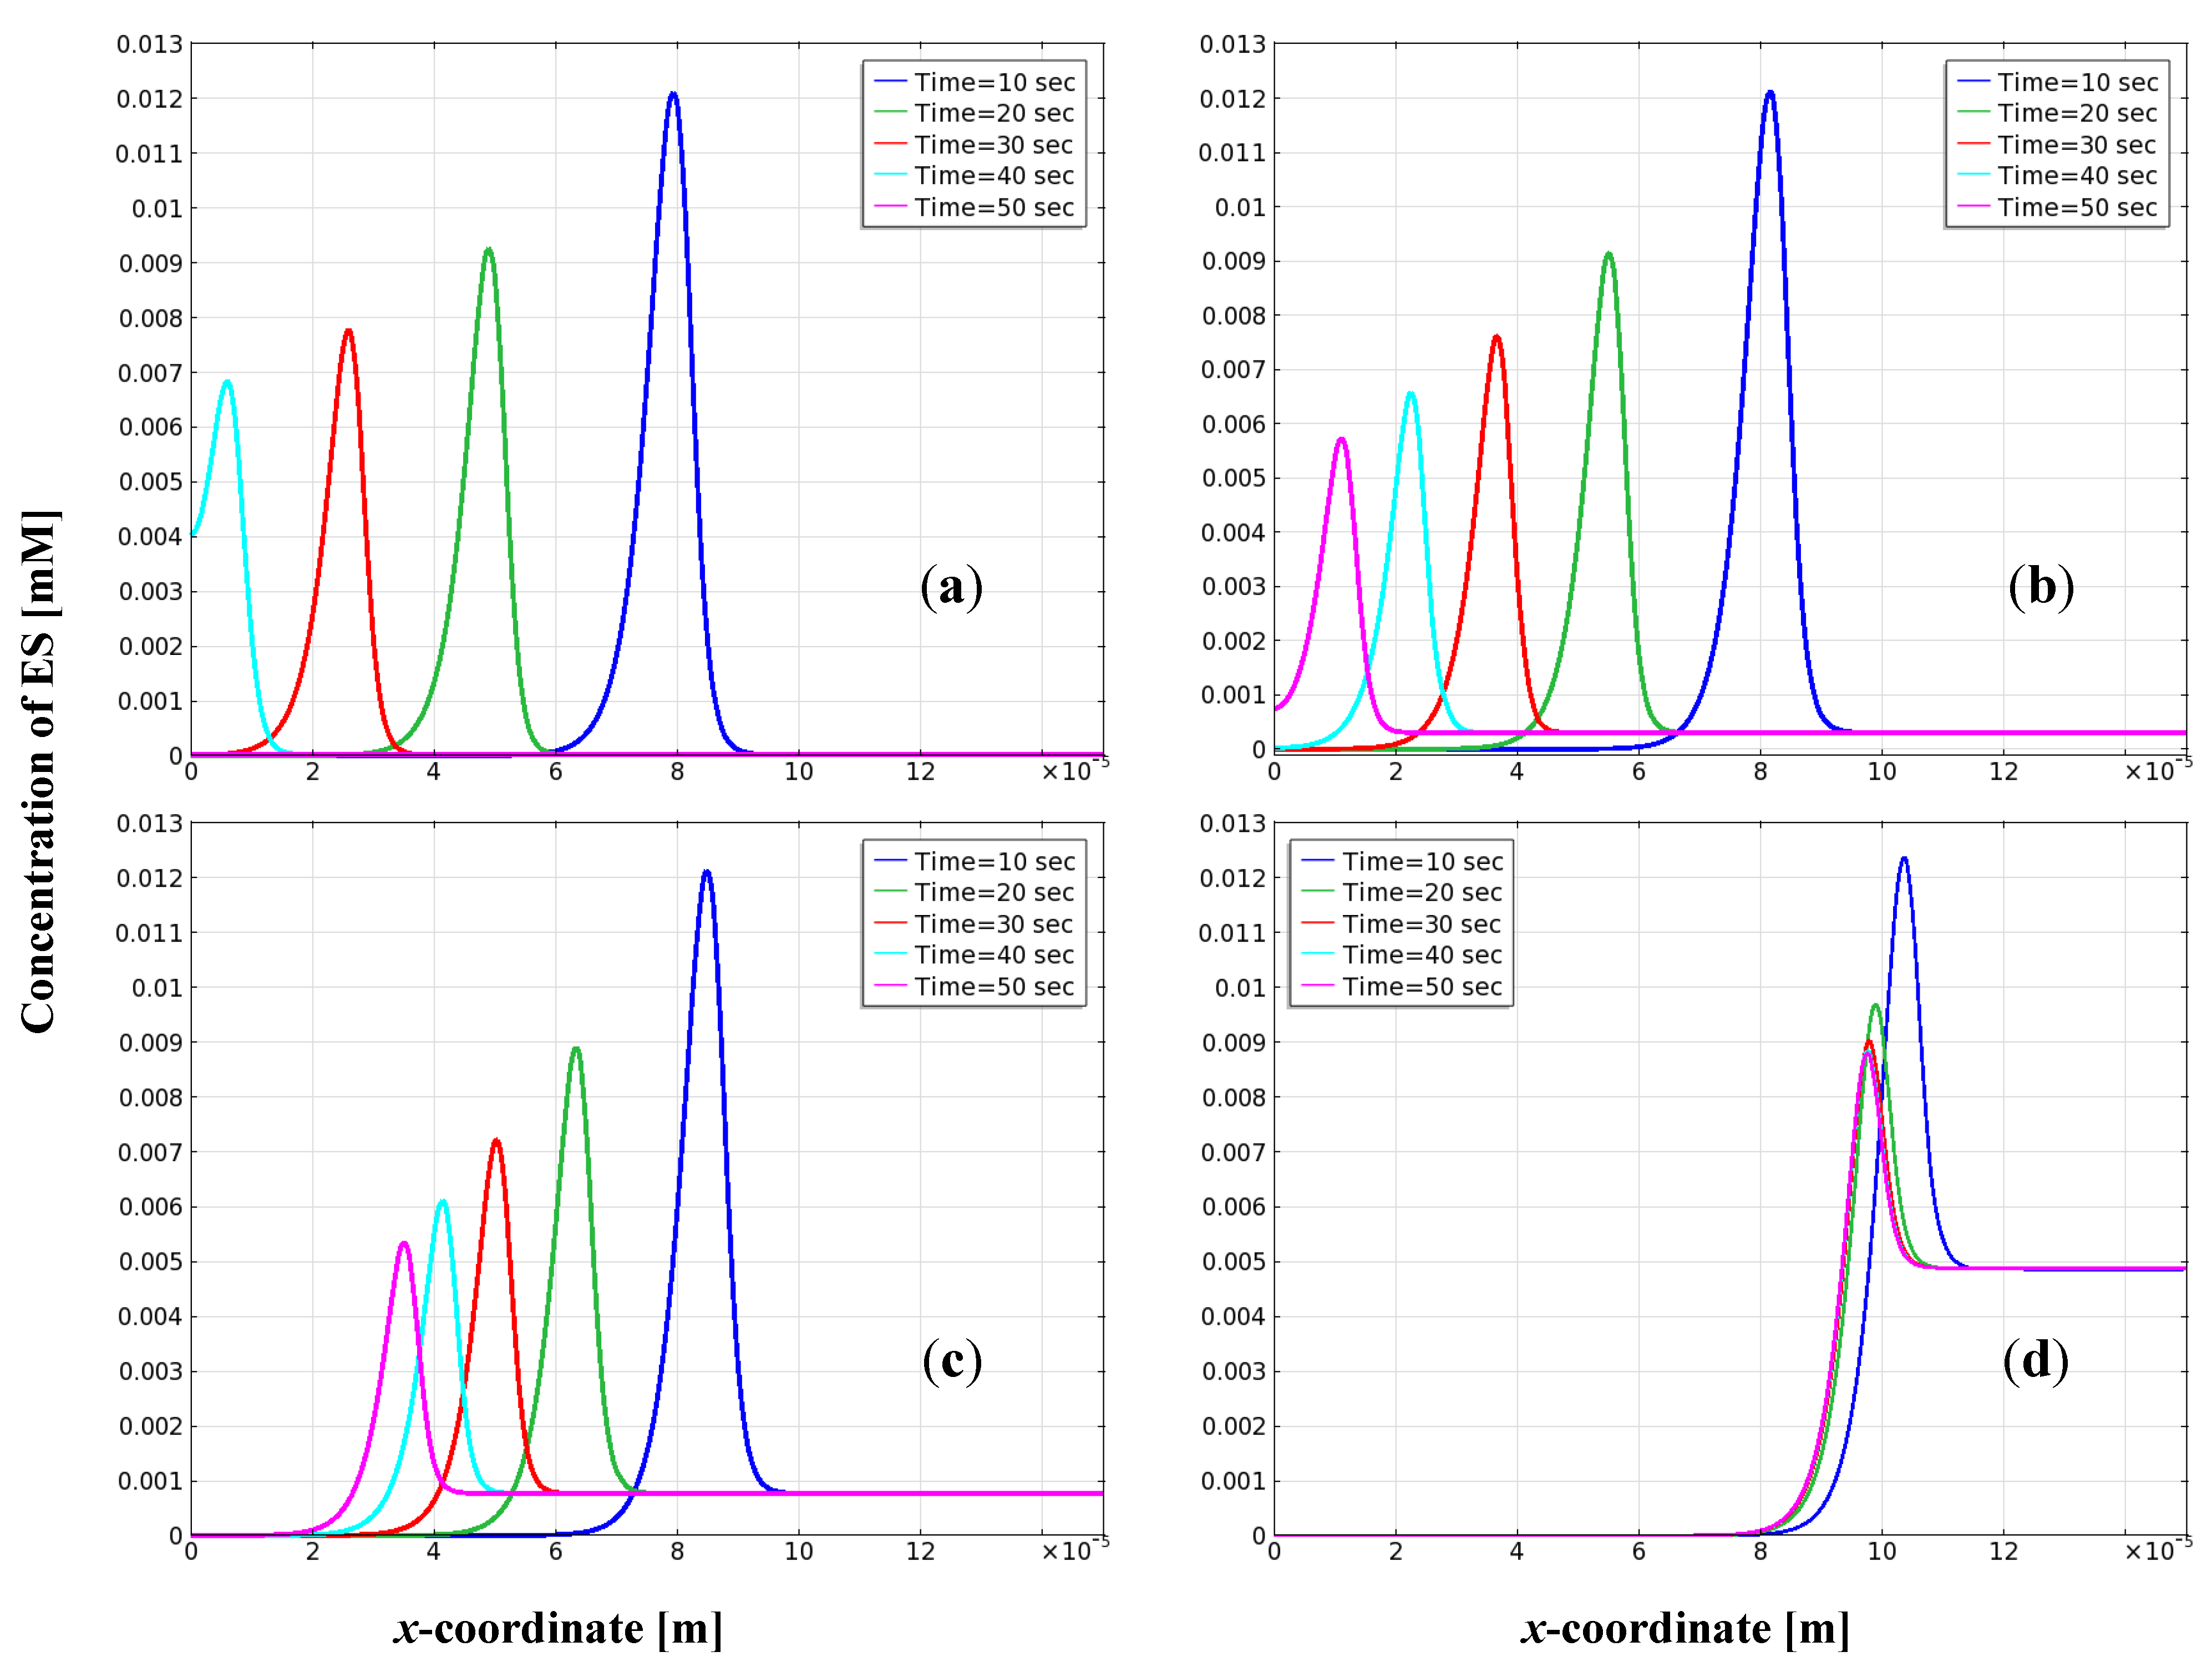
3.4. Distribution of Enzyme-Substrate Complex on the Electrode

ES level can affect battery discharge efficiency, the amount of product, and hydrogen ion migration. Figure 8 shows the plot of ES concentration on the x-coordinate at different operation times and applied voltages. The concentration profile of the ES is a peak-type distribution that relevant literature never discusses. In Figure 8(a), when the applied potential is at −0.15 V and the time is 10 s, the concentration of ES exists mainly between approximately 6 × 10⁻⁵ m and 9 × 10⁻⁵ m, and the maximum value is approximately 0.012 mM. As the operation time increases, ES concentration also shifts to the left. After 40 s, the main peak of ES appears between 0 m and 1.5 × 10⁻⁵ m, and the maximum of ES concentration is 0.0068 mM. When time exceeds 50 s, the ES concentration is 0.0 mM. Figure 8(b) shows the simulated results of ES concentration at the applied potential of 0.0 V. The simulated results in Figure 8(b) are similar to those in Figure 8(a) except that the plate concentration at steady state is approximately 3.0 × 10⁻⁴ mM. Figure 8(c) shows the simulated results of ES concentration when the applied potential increases to 0.05 V. The ES concentration profile combines a peak shape and a platform of 7.7 × 10⁻⁴ mM. When the applied potential increases to 0.15 V, the platform concentration of ES in Figure 8(d) increases to 4.9 × 10⁻³ mM. This value is far higher (approximately six-fold = 4.9 × 10⁻³/7.7 × 10−4) than that for 0.05 V.
Figure 8. Plot of enzyme-substrate complex concentration ES on x-coordinate at different operation times for applied potentials: (a) −0.15V; (b) 0.0 V; (c) 0.05 V; (d) 0.15 V in EBFC.
Energies 05 02524 g008

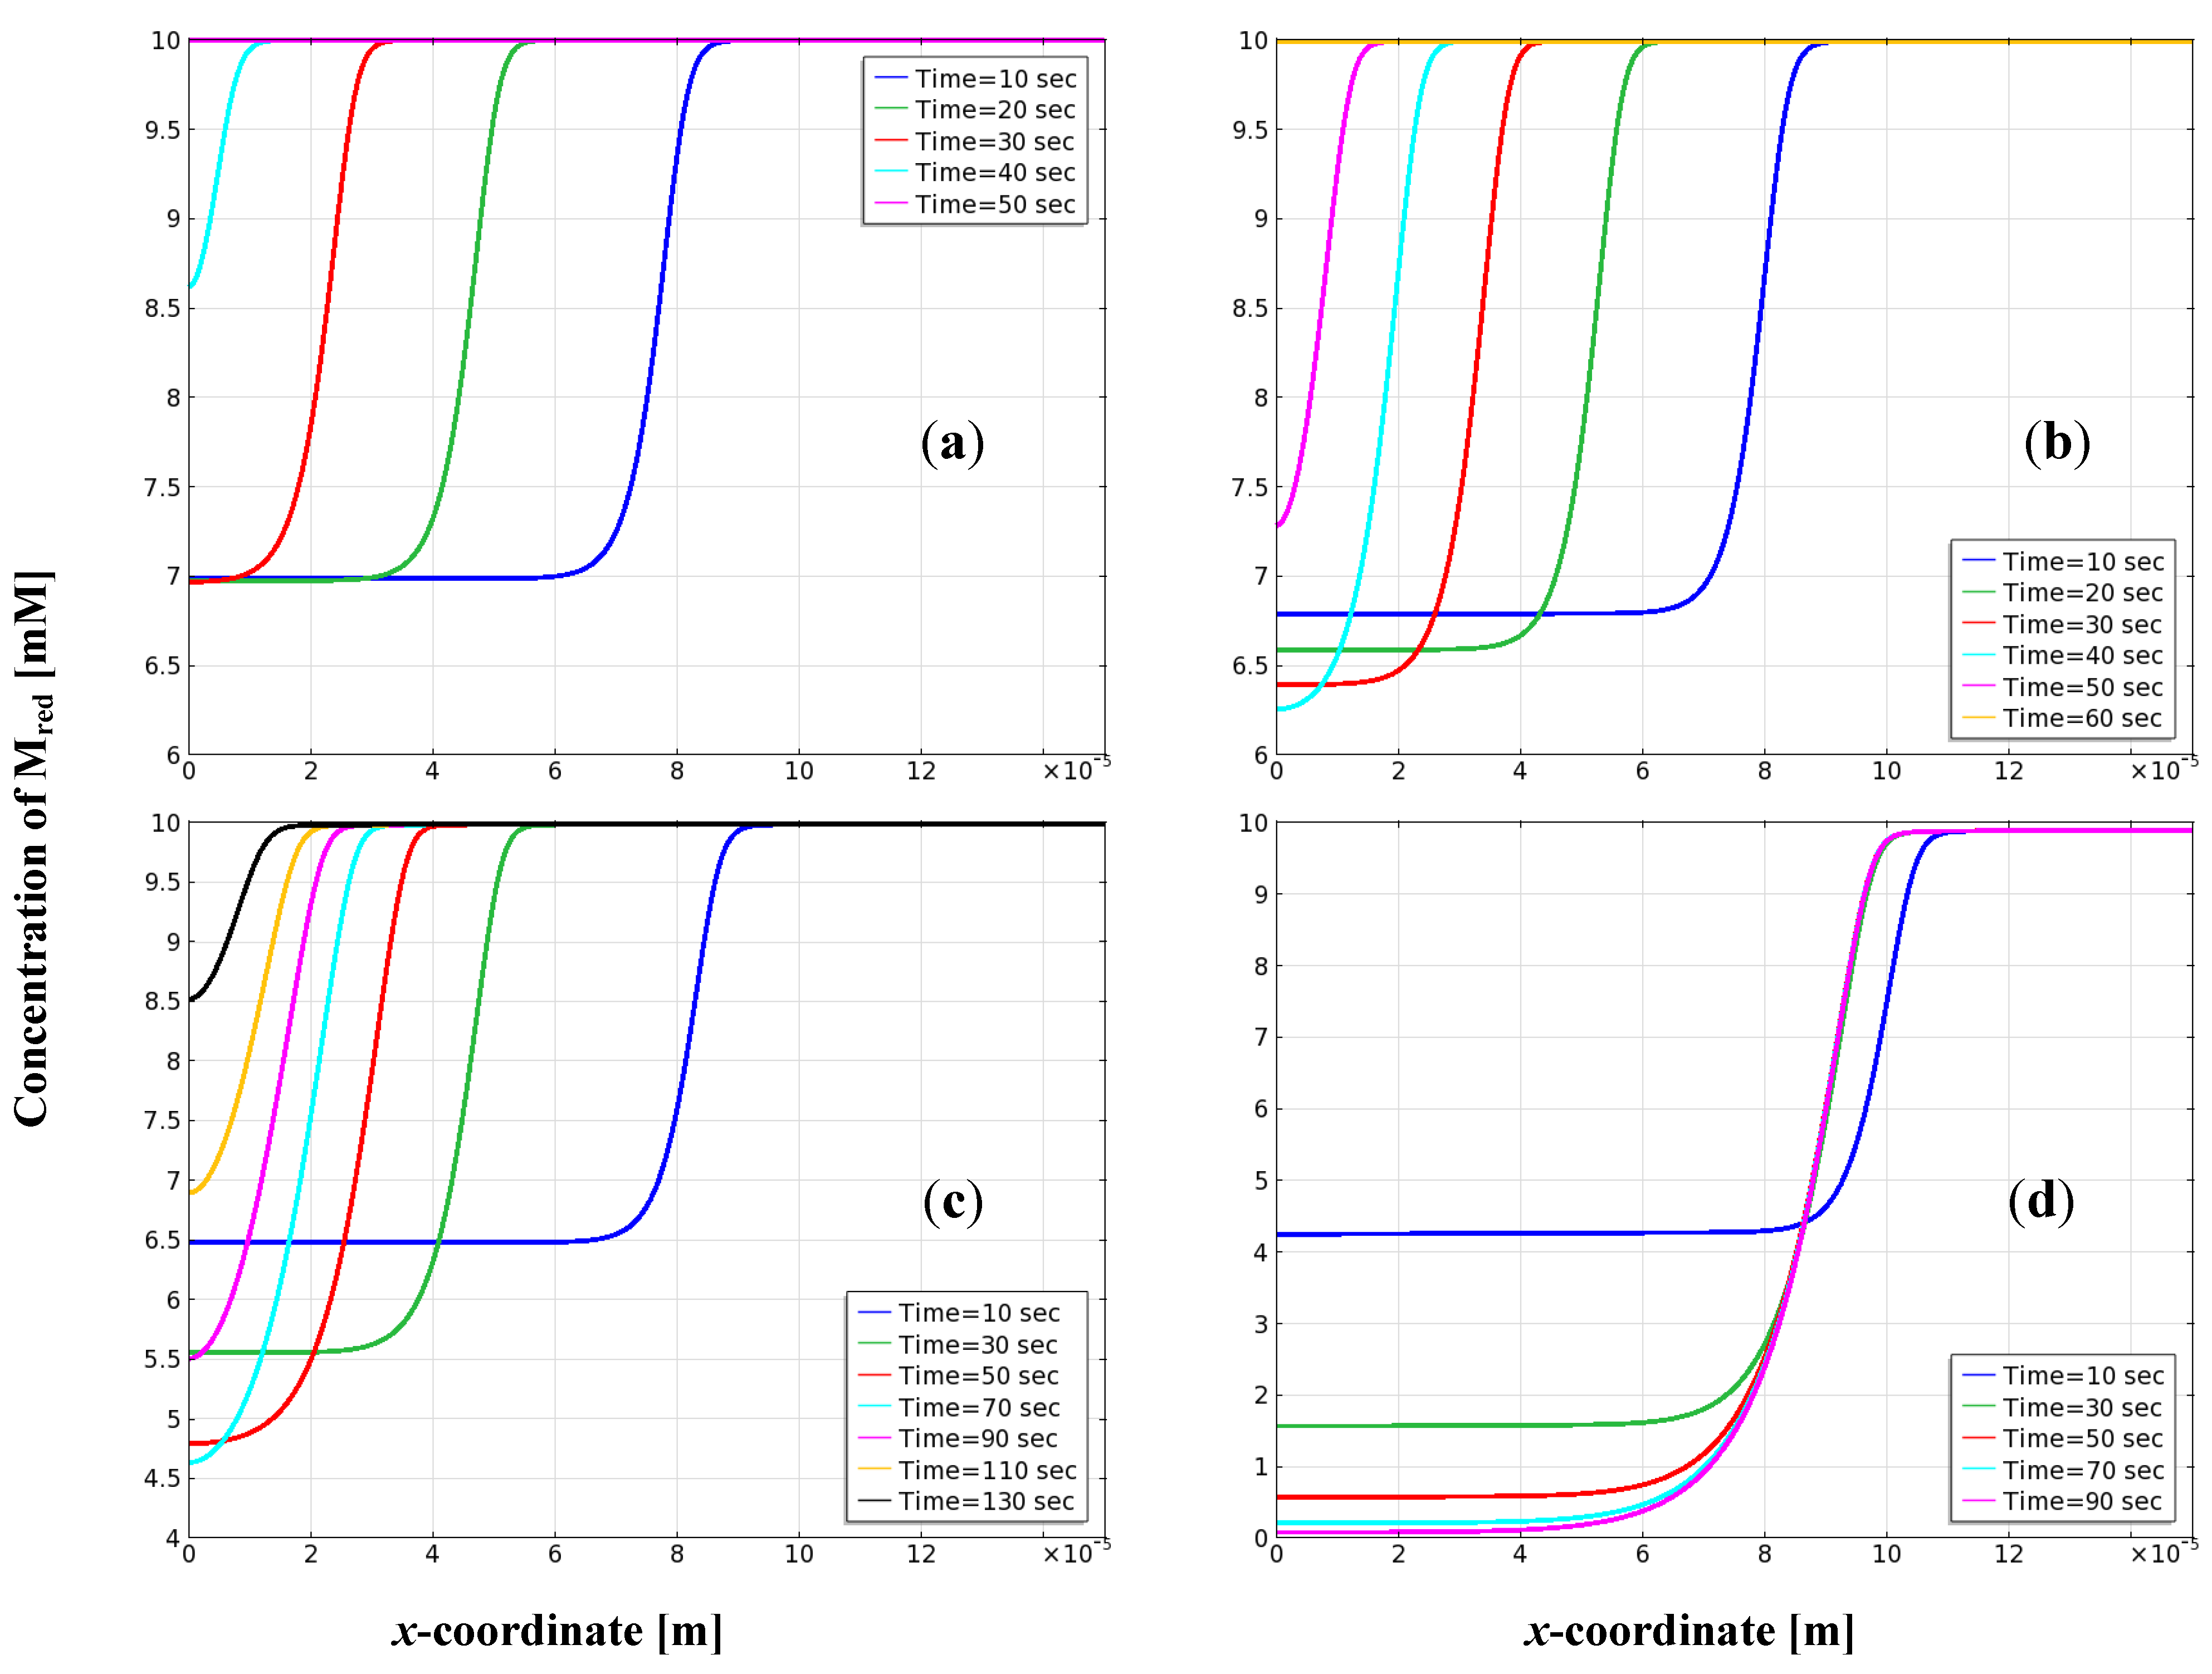
3.5. Distribution of Mediator on the Electrode

The oxidation degree of Mred correlates directly with the applied potential in BFC. Mred concentration changes with the oxidation potential of the electrode. The increment of oxidation potential increases the oxidation degree of Mox. In other words, Mred concentration decreases with increasing applied potential. The increment of Mox concentration helps increase the ROS of Eox concentration to enhance the enzyme reaction. Figure 9(a,b) shows the relationship between Mred concentration and the x-coordinate at different operation times and applied potentials. The initial Mred concentration is 10 mM. In Figure 9(a), when the applied potential is at −0.05 V and the operation time is 10 s, the concentration profile for Mred resides between 6 × 10⁻⁵ m and 15 × 10−5 m. The mediator Mred concentration drops from 10 mM to 7 mM, declining approximately 30%. When the time increase exceeds 50 s, Mred concentration is recovered to the initial value because Mox concentration is low. That is, the oxidation rate of Mred is slow. The applied potential changes from the active polarization control region to the coexistence of active polarization and ohmic polarization regions are shown in Figure 9(b). When the time increases from 10 s to 40 s, the variation of Mred concentration moves from the initial region of 6 × 10⁻⁵ m–9 × 10⁻⁵ m to the region of 0 m–2.2 × 10⁻⁵ m. When time has exceeded 50 s, and there is movement to the 0 m–1.6 × 10⁻⁵ m region, the Mred concentration drops to 6.3 mM. When the applied potential is set at 0.05 V, the simulation results of the Mred concentration are obtained in Figure 9(c). The applied potential is set in the ohmic polarization control region, and Mred concentration decreases with increased operation time (e.g., 50 s), dropping from 10 mM to 4.7 mM. When the time was increased to 130 s, the change of the Mred concentration gradient was in the region of 0 m–2 × 10⁻⁵ m μm. Mred concentration drops from 10 mM to 8.5 mM in Figure 9(c), and Figure 9(d) shows the simulated result of Mred concentration at an applied potential of 0.15 V. When the time is 10 s, the Mred concentration changes dramatically in the region of 9 × 10⁻⁵ m–15 × 10−5 m and decreased to 4.2 mM. This low value is different from those obtained for −0.15 V and 0.0 V (lower limit of 7 mM). When the time increases to 30 s, Mred concentration continues to decline in the 6 × 10⁻⁵ m to 15 × 10−5 m region. The lower limit changes from 4.2 mM at t = 10 s to 1.5 mM, decreasing by 15% from the initial value.
Figure 9. Plot of reduced mediator concentration Mred on x-coordinate at different operation times for applied potentials: (a) −0.15V; (b) 0.0 V; (c) 0.05 V; (d) 0.15 V in EBFC.
Energies 05 02524 g009
When time increase exceeds 50 s, Mred concentration continues to decline to the lower limit of 0.58 mM at 50 s and 0.2 mM at 70 s, repectively. This decline is mainly caused by increased oxidation potential, which reduces the concentration of mediator Mred. The enzymes must be recovered with the reaction of Mox and Ered. At 0.15 V potential, Eox and Mred concentrations change and decline in the same area; the major changes in the concentration of Eox are in the region of 8 × 10⁻⁵ m–12 × 10−5 m, and the concentration of Mred changes in the region of 7 × 10⁻⁵ m–11 × 10−5 m, as shown in Figure 7(d) and Figure 9(d). The applied potential is higher, which causes Mred to react to Mox in a mass transport controlled situation; consequently, considering the electron-transfer kinetics in theoretical treatment is unnecessary. At the same time, no Mred exists in the bulk solution. This problem is then a special case of the more general problem of coupled diffusion and reaction in an immobilized enzyme layer [50].

4. Conclusions

This work studies the concentration profile of enzymes, mediators, and substrates in EBCS for high mediator concentration. At low potentials (e.g., 0.0 V), the current density increases with increasing operation time and reaches a stable value. The reactant at low potentials (e.g., −0.15 V or 0.0 V) easily diffuses in the interior of the reaction region. Hence, the substrate concentration in the electrode film approached that in the exterior of the film. The oxidized enzyme concentration approaches zero in the electrode film when the operation time is greater than 50 s. The ES concentration profile is a peak-type. Mred concentration always remains at approximately 10 mM, so the Eox generation rate is small. However, at higher potentials (e.g., 0.25 V), current density decreases dramatically with increasing operation time. At higher potentials, the reaction rate of electrochemistry is larger than the diffusion rate of the substrate. No substrate is evident in the region of 0 × 10−5 m–9 × 10⁻⁵ m. The enzyme Eox concentration can be maintained at approximately 15% of initial values in the region of 0 × 10−5 m–13 × 10−5 m. The ES concentration profile includes a peak-platform type. The ES concentration at the platform increased when the applied potential increased. Mred concentration changed in the region of mainly 10 × 10−5 m–15 × 10−5 m, and the lower limit was at 3.5 mM when the applied potential was 0.05 V. Mred concentration decreased with increasing applied potential and even declined to 0.15 mM. From the model’s prediction, it is recommended that the applied potential should be controlled between 0.05 and 0.15 V when the equilibrium potential is −0.2 V by using high mediator concentration.

Notations

[ ]concentration in the system [mM]
asurface area of the electrode per electrode volume [L/m]
DHdiffusion coefficient for free hydrogen [m2/s]
Dpdiffusion coefficient for free product [m2/s]
Dsdiffusion coefficient for free substrate [m2/s]
eelectron
Eenzyme [mM]
EAapplied potential [V]
Eeequilibrium potential
ESenzyme-substrate complex [mM]
FFaraday’s constant [C/mol]
H+hydrogen ion [mM]
i0 exchange current density [mA/cm2]
itlocal current density [mA/cm2]
Ittotal current density [mA/cm2]
k1b back rate constant [1/s]
k1f forward rate constant [mol.s]
k2f product formation rate constant [1/s]
k3bbackward rate constant [1/(mM.s)]
k3fforward rate constant [1/(mM.s)]
klconductivity of liquid phase [S/m]
ks conductivity of solid phase [S/m]
Llength of the electrode film [m]
Mttotal concentration of mediator [mM]
Mmediator [mM]
nnumber of electrons (in this case, n = 1)
Pproduct of enzyme reaction [mM]
Rgas constant [J/(mol.K)]
Ssubstrate [mM]
Ttemperature [K]
Greek Letters
βanode transfer coefficient
ϕ l potential in liquid phase
ϕ S potential in solid phase
θvolume fraction of liquid in the bioelectrode
Subscripts
iinitial value
lliquid phase
oxoxidized state
redreduced state
ssolid phase
ttime

Acknowledgments

We would like to thank the National Science Council of Taiwan for financial support in this research under grant No NSC 98-2221-E-155-028.

References

  1. Katz, E.; Shipway, A.N.; Willner, I. Handbook of Fuel Cells—Fundamentals, Technology and Applications; Vielstich, W., Lamm, A., Gasteiger, H.A., Eds.; Wiley: London, UK, 2003; pp. 355–381. [Google Scholar]
  2. Ikeda, T.; Kano, K. Bioelectrocatalysis-based application of quinoproteins and quinoprotein-containing bacterial cells in biosensors and biofuel cells. Biochim. Biophys. Acta 2003, 1647, 121–126. [Google Scholar] [CrossRef]
  3. Barton, S.C.; Gallaway, J.; Atanassov, P. Enzymatic biofuel cells for implantable and microscale devices. Chem. Rev. 2004, 104, 4867–4886. [Google Scholar] [CrossRef] [PubMed]
  4. Heller, A. Miniature biofuel cells. Phys. Chem. Chem. Phys. 2004, 6, 209–216. [Google Scholar] [CrossRef]
  5. Bullen, R.A.; Arnot, T.C.; Lakeman, J.B.; Walsh, F.C. Biofuel cells and their development. Biosens. Bioelectron. 2006, 21, 2015–2045. [Google Scholar] [CrossRef] [PubMed]
  6. Kim, J.; Jia, H.F.; Wang, P. Challenges in biocatalysis for enzyme-based biofuel cells. Biotechnol. Adv. 2006, 24, 296–308. [Google Scholar] [CrossRef] [PubMed]
  7. Minteer, S.D.; Liaw, B.Y.; Cooney, M.J. Enzyme-based biofuel cells. Curr. Opin. Biotechnol. 2007, 18, 228–234. [Google Scholar] [CrossRef] [PubMed]
  8. Ghindilis, A.L.; Atanassov, P.; Wilkins, E. Enzyme-catalyzed direct electron transfer: Fundamentals and analytical applications. Electroanalysis 1997, 9, 661–674. [Google Scholar] [CrossRef]
  9. Gorton, L.; Lindgren, A.; Larsson, T.; Munteanu, F.D.; Ruzgas, T.; Gazaryan, I. Direct electron transfer between heme-containing enzymes and electrodes as basis for third generation biosensors. Anal. Chim. Acta 1999, 400, 91–108. [Google Scholar] [CrossRef]
  10. Vincent, K.A.; Cracknell, J.A.; Lenz, O.; Zebger, I.; Friedrich, B.; Armstrong, F.A. Electrocatalytic hydrogen oxidation by an enzyme at high carbon monoxide or oxygen levels. Proc. Natl. Acad. Sci. USA 2005, 102, 16951–16954. [Google Scholar] [CrossRef] [PubMed]
  11. Tsujimura, S.; Nakagawa, T.; Kano, K.; Ikeda, T. Kinetic study of direct bioelectrocatalysis of dioxygen reduction with bilirubin oxidase at carbon electrodes. Electrochemistry 2004, 72, 437–439. [Google Scholar]
  12. Kamitaka, Y.; Tsujimura, S.; Setoyama, N.; Kajino, T.; Kano, K. Fructose/dioxygen biofuel cell based on direct electron transfer-type bioelectrocatalysis. Phys. Chem. Chem. Phys. 2007, 9, 1793–1801. [Google Scholar] [CrossRef] [PubMed]
  13. Tarasevich, M.R.; Bogdanovskaya, V.A.; Kapustin, A.V. Nanocomposite material laccase/dispersed carbon carrier for oxygen electrode. Electrochem. Commun. 2003, 5, 491–496. [Google Scholar] [CrossRef]
  14. Tominaga, M.; Otani, M.; Kishikawa, M.; Taniguchi, I. UV-ozone treatments improved carbon black surface for direct electron-transfer reactions with bilirubin oxidase under aerobic conditions. Chem. Lett. 2006, 35, 1174–1175. [Google Scholar] [CrossRef]
  15. Ivanov, I.; Vidaković-Koch, T.; Sundmacher, K. Recent advances in enzymatic fuel cells: Experiments and modeling. Energies 2010, 3, 803–846. [Google Scholar] [CrossRef]
  16. Chaubey, A.; Malhotra, B.D. Mediated biosensors. Biosens. Bioelectron. 2002, 17, 441–456. [Google Scholar] [CrossRef]
  17. Tamaki, T.; Ito, T.; Yamaguchi, T. Modelling of reaction and diffusion processes in a high-surface-area biofuel cell electrode made of redox polymer-grafted carbon. Fuel Cells 2009, 9, 37–43. [Google Scholar] [CrossRef]
  18. Sato, F.; Togo, M.; Islam, M.K.; Matsue, T.; Kosuge, J.; Fukasaku, N.; Kurosawa, S.; Nishizawa, M. Enzyme-based glucose fuel cell using vitamin K3-immobilized polymer as an electron mediator. Electrochem. Commun. 2005, 7, 643–647. [Google Scholar] [CrossRef]
  19. Togo, M.; Takamura, A.; Asai, T.; Kaji, H.; Nishizawa, M. An enzyme-based microfluidic biofuel cell using vitamin K3-mediated glucose oxidation. Electrochim. Acta 2007, 52, 4669–4674. [Google Scholar] [CrossRef]
  20. Fischback, M.B.; Youn, J.K.; Zhao, X.Y.; Wang, P.; Park, H.G.; Chang, H.N.; Kim, J.; Ha, S. Miniature biofuel cells with improved stability under continuous operation. Electroanalysis 2006, 18, 2016–2022. [Google Scholar] [CrossRef]
  21. Barton, S.C.; Sun, Y.H.; Chandra, B.; White, S.; Hone, J. Mediated enzyme electrodes with combined micro-and nanoscale supports. Electrochem. Solid-State Lett. 2007, 10, B96–B100. [Google Scholar] [CrossRef]
  22. Yan, Y.; Zheng, W.; Su, L.; Mao, L. Carbon-nanotube-based glucose-O2 biofuel cells. Adv. Mater. 2006, 18, 2639–2643. [Google Scholar] [CrossRef]
  23. Komaba, S.; Mitsuhashi, T.; Shiraishi, S. Polyion complex nanocomposite electrode incorporating enzyme and carbon nanotube for biofuel cells. Electrochemistry 2008, 76, 55–58. [Google Scholar] [CrossRef]
  24. Narushima, K.; Yamashita, N.; Fukuoka, M.; Inagaki, N.; Isono, Y.; Islam, M.R. Surface modification of polymer films by pulsed oxygen plasma. Jpn. J. Appl. Phys. 2007, 46, 4238–4245. [Google Scholar] [CrossRef]
  25. Dai, D.J.; Chan, D.S.; Wu, H.S. Modified carbon nanoball on electrode surface using plasma in enzyme-based biofuel cells. Energy Procedia 2012, 14, 1804–1810. [Google Scholar] [CrossRef]
  26. Kano, K.; Ikeda, T. Fundamentals and practices of mediated bioelectrocatalysis. Anal. Sci. 2000, 16, 1013–1021. [Google Scholar] [CrossRef]
  27. Yu, E.H.; Scott, K. Enzymatic biofuel cells-fabrication of enzyme electrodes. Energies 2010, 3, 23–42. [Google Scholar] [CrossRef]
  28. Svoboda, V.; Cooney, M.; Bor, Y.L.; Minteer, S.; Piles, E.; Lehnert, D.; Barton, S.C.; Atanassov, P. Standardized characterization of electrocatalytic electrodes. Electroanalysis 2008, 10, 1099–1109. [Google Scholar] [CrossRef]
  29. Ikeda, T.; Kano, K. An electrochemical approach to the studies of biological redox reactions and their applications to biosensors, bioreactors, and biofuel cells. J. Biosci. Bioeng. 2001, 92, 9–18. [Google Scholar] [CrossRef]
  30. Bartlett, P.N.; Pratt, K.F.E. Theoretical treatment of diffusion and kinetics in amperometric immobilized enzyme electrodes Part I: Redox mediator entrapped within the film. J. Electroanal. Chem. Interfacial Electrochem. 1995, 397, 61–78. [Google Scholar] [CrossRef]
  31. Barton, S.C. Oxygen transport in composite mediated biocathodes. Electrochim. Acta 2005, 50, 2145–2153. [Google Scholar] [CrossRef]
  32. Bartlett, P.N.; Toh, C.S.; Calvo, E.J.; Flexer, V. Modelling biosensor responses. In Bioelectrochemistry: Fundamentals, Experimental Techniques and Applications; Bartlett, P.N., Ed.; Wiley: Chichester, UK, 2008; pp. 267–325. [Google Scholar]
  33. Weber, A.Z.; Newman, J. Modeling transport in polymer-electrolyte fuel cells. Chem. Rev. 2004, 104, 4679–4726. [Google Scholar] [CrossRef] [PubMed]
  34. Verger, R.; Mieras, M.C.E.; Haas, G.H.D. Action of phospholipase A at interfase. J. Biol. Chem. 1973, 248, 4023–4034. [Google Scholar] [PubMed]
  35. Gallaway, J.W.; Barton, S.C. Kinetics of redox polymer-mediated enzyme electrodes. J. Am. Chem. Soc. 2008, 130, 8527–8536. [Google Scholar] [CrossRef] [PubMed]
  36. Bard, A.J.; Faulkner, L.R. Electrochemical methods. In Fundamentals and Applications, 2nd ed.; Wiley: New York, NY, USA, 2001. [Google Scholar]
  37. Flexer, V.; Ielmini, M.V.; Calvo, E.J.; Bartlett, P.N. Extracting kinetic parameters for homogeneous [Os(bpy)2ClPyCOOH]+ mediated enzyme reactions from cyclic voltammetry and simulations. Bioelectrochemistry 2008, 74, 201–209. [Google Scholar] [CrossRef] [PubMed]
  38. Deng, L.; Wang, F.; Chen, H.; Shang, L.; Wang, L.; Wang, T.; Dong, S. A biofuel cell with enhanced performance by multilayer biocatalyst immobilized on highly ordered macroporous electrode. Biosens. Bioelectron. 2008, 24, 329–333. [Google Scholar] [CrossRef] [PubMed]
  39. Matsumoto, R.; Kano, K.; Ikeda, T. Theory of steady-state catalytic current of mediated bioelectrocatalysis. J. Electroanal. Chem. 2002, 535, 37–40. [Google Scholar] [CrossRef]
  40. Lyons, M.E.G. Modelling the transport and kinetics of electroenzymes at the electrode/solution interface. Sensors 2006, 6, 1765–1790. [Google Scholar] [CrossRef]
  41. Puida, M.; Ivanauskas, F.; Ignatjev, I.; Valinčius, G.; Razumas, V. Computational modeling of the amperomet bioanalytical system for lipase activity assay: A time-dependent response. Nonlinear Anal. Model. Control 2007, 12, 245–251. [Google Scholar]
  42. Puida, M.; Ivanauskas, F.; Ignatjev, I.; Valinčius, G.; Razumas, V. Computational modeling of the electrochemical system of lipase activity detection. Sensors 2008, 8, 3873–3879. [Google Scholar] [CrossRef]
  43. Lyons, M.E.G. Transport and kinetics at carbon nanotube-redox enzyme composite modified electrode biosensors part 2: Redox enzyme dispersed in nanotube mesh of finite thickness. Int. J. Electrochem. Sci. 2009, 4, 1196–1236. [Google Scholar]
  44. Puida, M.; Ivanauskas, F. Mathematical modeling of the action of biosensor possessing variable parameters. J. Math. Chem. 2010, 47, 191–200. [Google Scholar] [CrossRef]
  45. Puida, M.; Malinauskas, A.; Ivanauskas, F. Modeling of electrocatalysis at conducting polymer modified electrodes: Nonlinear current-concentration profiles. J. Math. Chem. 2011, 49, 1151–1162. [Google Scholar] [CrossRef]
  46. Bedekar, A.S.; Feng, J.J.; Krishnamoorthy, S.; Lim, K.G.; Palmore, G.T.R.; Sundaram, S. Oxygen limitation in microfluidic biofuel cells. Chem. Eng. Commun. 2008, 195, 256–266. [Google Scholar] [CrossRef]
  47. Glykys, D.J.; Banta, S. Metabolic control analysis of an enzymatic biofuel cell. Biotechnol. Bioeng. 2009, 102, 1624–1635. [Google Scholar] [CrossRef] [PubMed]
  48. Jeon, S.W.; Lee, J.Y.; Lee, J.H.; Kang, S.W.; Park, C.H.; Kim, S.W. Optimization of cell conditions for enzymatic fuel cell using statistical analysis. J. Ind. Eng. Chem. 2008, 14, 338–343. [Google Scholar] [CrossRef]
  49. Kjeang, E.; Sinton, D.; Harrington, D.A. Strategic enzyme patterning for microfluidic biofuel cells. J. Power Sources 2006, 158, 1–12. [Google Scholar] [CrossRef]
  50. Albery, W.J.; Kalia, Y.N.; Magner, E. Amperometric enzyme electrodes part VI: Enzyme electrodes for sucrose and lactose. J. Electroanal. Chem. Interfacial Electrochem. 1992, 325, 83–93. [Google Scholar] [CrossRef]

